Old Appleton, MO Map & Demographics
Old Appleton Map
Old Appleton Overview
$26,565
PER CAPITA INCOME
$68,125
AVG FAMILY INCOME
$52,273
AVG HOUSEHOLD INCOME
0.18
INEQUALITY / GINI INDEX
85
TOTAL POPULATION
58
MALE POPULATION
27
FEMALE POPULATION
214.81
MALES / 100 FEMALES
46.55
FEMALES / 100 MALES
37.3
MEDIAN AGE
3.7
AVG FAMILY SIZE
2.5
AVG HOUSEHOLD SIZE
51
LABOR FORCE [ PEOPLE ]
77.3%
PERCENT IN LABOR FORCE
Old Appleton Zip Codes
Old Appleton Area Codes
Income in Old Appleton
Income Overview in Old Appleton
Per Capita Income in Old Appleton is $26,565, while median incomes of families and households are $68,125 and $52,273 respectively.
| Characteristic | Number | Measure |
| Per Capita Income | 85 | $26,565 |
| Median Family Income | 17 | $68,125 |
| Mean Family Income | 17 | $65,276 |
| Median Household Income | 34 | $52,273 |
| Mean Household Income | 34 | $65,182 |
| Income Deficit | 17 | $0 |
| Wage / Income Gap (%) | 85 | 0.00% |
| Wage / Income Gap ($) | 85 | 100.00¢ per $1 |
| Gini / Inequality Index | 85 | 0.18 |
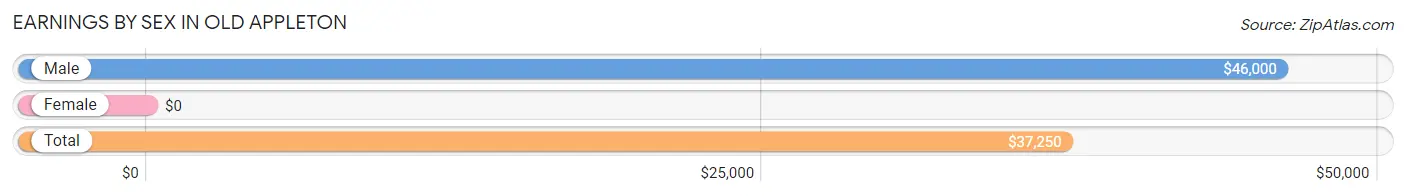
Earnings by Sex in Old Appleton
| Sex | Number | Average Earnings |
| Male | 40 (78.4%) | $46,000 |
| Female | 11 (21.6%) | $0 |
| Total | 51 (100.0%) | $37,250 |
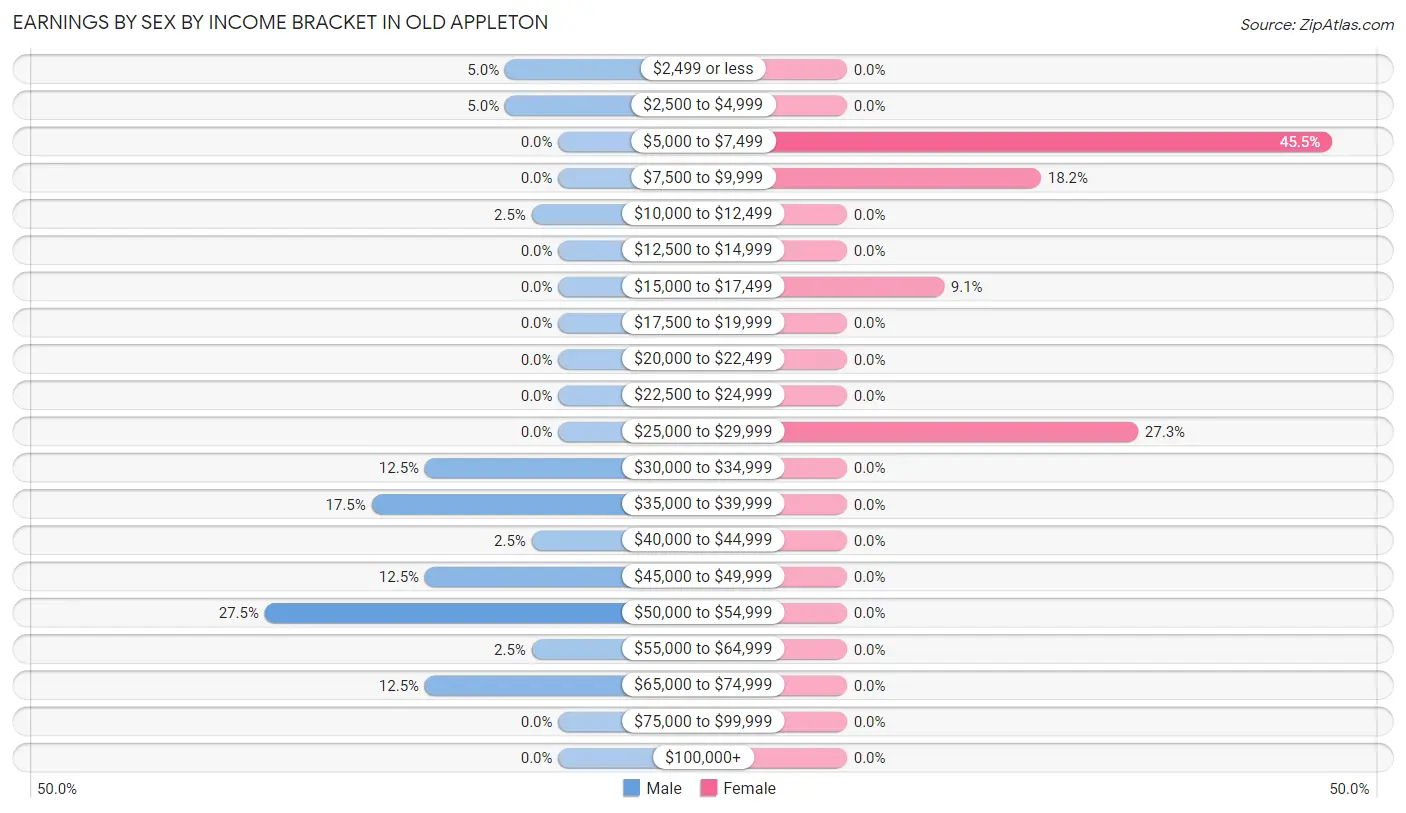
Earnings by Sex by Income Bracket in Old Appleton
The most common earnings brackets in Old Appleton are $50,000 to $54,999 for men (11 | 27.5%) and $5,000 to $7,499 for women (5 | 45.5%).
| Income | Male | Female |
| $2,499 or less | 2 (5.0%) | 0 (0.0%) |
| $2,500 to $4,999 | 2 (5.0%) | 0 (0.0%) |
| $5,000 to $7,499 | 0 (0.0%) | 5 (45.5%) |
| $7,500 to $9,999 | 0 (0.0%) | 2 (18.2%) |
| $10,000 to $12,499 | 1 (2.5%) | 0 (0.0%) |
| $12,500 to $14,999 | 0 (0.0%) | 0 (0.0%) |
| $15,000 to $17,499 | 0 (0.0%) | 1 (9.1%) |
| $17,500 to $19,999 | 0 (0.0%) | 0 (0.0%) |
| $20,000 to $22,499 | 0 (0.0%) | 0 (0.0%) |
| $22,500 to $24,999 | 0 (0.0%) | 0 (0.0%) |
| $25,000 to $29,999 | 0 (0.0%) | 3 (27.3%) |
| $30,000 to $34,999 | 5 (12.5%) | 0 (0.0%) |
| $35,000 to $39,999 | 7 (17.5%) | 0 (0.0%) |
| $40,000 to $44,999 | 1 (2.5%) | 0 (0.0%) |
| $45,000 to $49,999 | 5 (12.5%) | 0 (0.0%) |
| $50,000 to $54,999 | 11 (27.5%) | 0 (0.0%) |
| $55,000 to $64,999 | 1 (2.5%) | 0 (0.0%) |
| $65,000 to $74,999 | 5 (12.5%) | 0 (0.0%) |
| $75,000 to $99,999 | 0 (0.0%) | 0 (0.0%) |
| $100,000+ | 0 (0.0%) | 0 (0.0%) |
| Total | 40 (100.0%) | 11 (100.0%) |
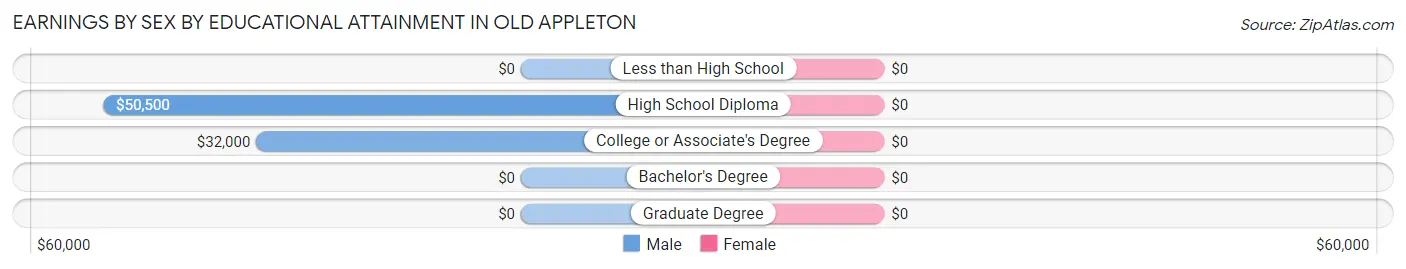
Earnings by Sex by Educational Attainment in Old Appleton
| Educational Attainment | Male Income | Female Income |
| Less than High School | - | - |
| High School Diploma | $50,500 | $0 |
| College or Associate's Degree | $32,000 | $0 |
| Bachelor's Degree | - | - |
| Graduate Degree | - | - |
| Total | $47,250 | $0 |
Family Income in Old Appleton
Family Income Brackets in Old Appleton
According to the Old Appleton family income data, there are 5 families falling into the $35,000 to $49,999 income range, which is the most common income bracket and makes up 29.4% of all families.
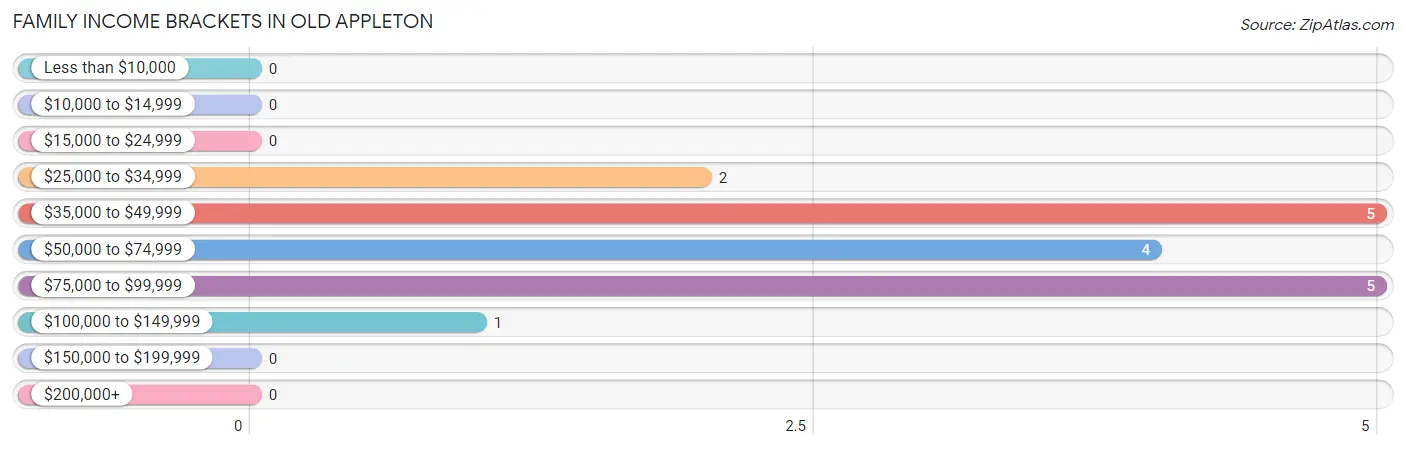
| Income Bracket | # Families | % Families |
| Less than $10,000 | 0 | 0.0% |
| $10,000 to $14,999 | 0 | 0.0% |
| $15,000 to $24,999 | 0 | 0.0% |
| $25,000 to $34,999 | 2 | 11.8% |
| $35,000 to $49,999 | 5 | 29.4% |
| $50,000 to $74,999 | 4 | 23.5% |
| $75,000 to $99,999 | 5 | 29.4% |
| $100,000 to $149,999 | 1 | 5.9% |
| $150,000 to $199,999 | 0 | 0.0% |
| $200,000+ | 0 | 0.0% |
Family Income by Famaliy Size in Old Appleton
| Income Bracket | # Families | Median Income |
| 2-Person Families | 7 (41.2%) | $0 |
| 3-Person Families | 2 (11.8%) | $0 |
| 4-Person Families | 2 (11.8%) | $0 |
| 5-Person Families | 6 (35.3%) | $0 |
| 6-Person Families | 0 (0.0%) | $0 |
| 7+ Person Families | 0 (0.0%) | $0 |
| Total | 17 (100.0%) | $68,125 |
Family Income by Number of Earners in Old Appleton
| Number of Earners | # Families | Median Income |
| No Earners | 2 (11.8%) | $0 |
| 1 Earner | 6 (35.3%) | $0 |
| 2 Earners | 6 (35.3%) | $0 |
| 3+ Earners | 3 (17.6%) | $0 |
| Total | 17 (100.0%) | $68,125 |
Household Income in Old Appleton
Household Income Brackets in Old Appleton
With 14 households falling in the category, the $50,000 to $74,999 income range is the most frequent in Old Appleton, accounting for 41.2% of all households.
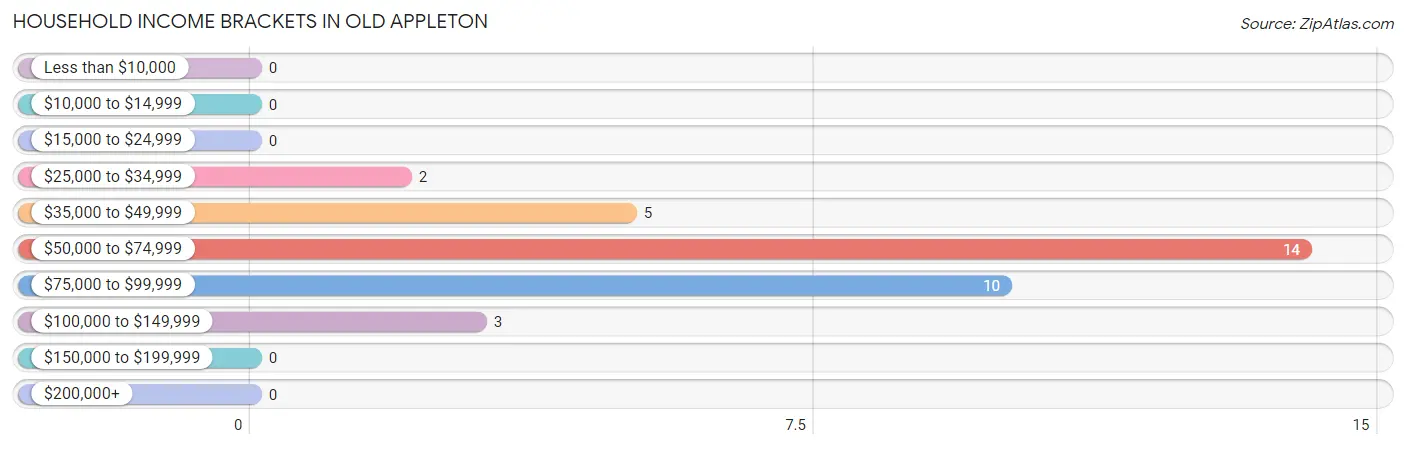
| Income Bracket | # Households | % Households |
| Less than $10,000 | 0 | 0.0% |
| $10,000 to $14,999 | 0 | 0.0% |
| $15,000 to $24,999 | 0 | 0.0% |
| $25,000 to $34,999 | 2 | 5.9% |
| $35,000 to $49,999 | 5 | 14.7% |
| $50,000 to $74,999 | 14 | 41.2% |
| $75,000 to $99,999 | 10 | 29.4% |
| $100,000 to $149,999 | 3 | 8.8% |
| $150,000 to $199,999 | 0 | 0.0% |
| $200,000+ | 0 | 0.0% |
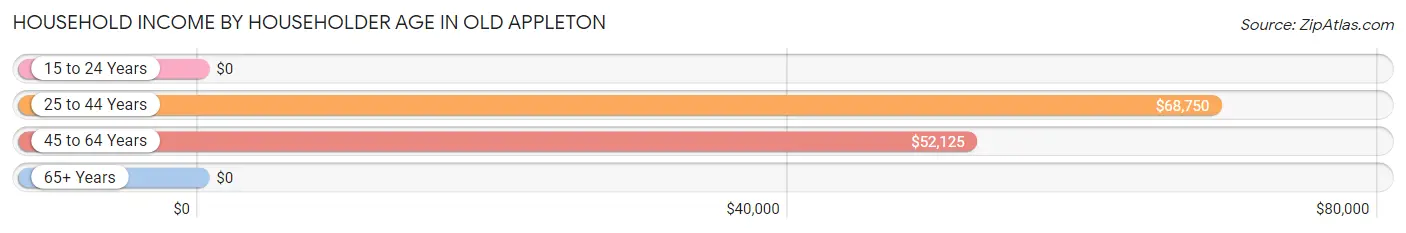
Household Income by Householder Age in Old Appleton
The median household income in Old Appleton is $52,273, with the highest median household income of $68,750 found in the 25 to 44 years age bracket for the primary householder. A total of 12 households (35.3%) fall into this category. Meanwhile, the 15 to 24 years age bracket for the primary householder has the lowest median household income of $0, with 1 households (2.9%) in this group.
| Income Bracket | # Households | Median Income |
| 15 to 24 Years | 1 (2.9%) | $0 |
| 25 to 44 Years | 12 (35.3%) | $68,750 |
| 45 to 64 Years | 17 (50.0%) | $52,125 |
| 65+ Years | 4 (11.8%) | $0 |
| Total | 34 (100.0%) | $52,273 |
Poverty in Old Appleton
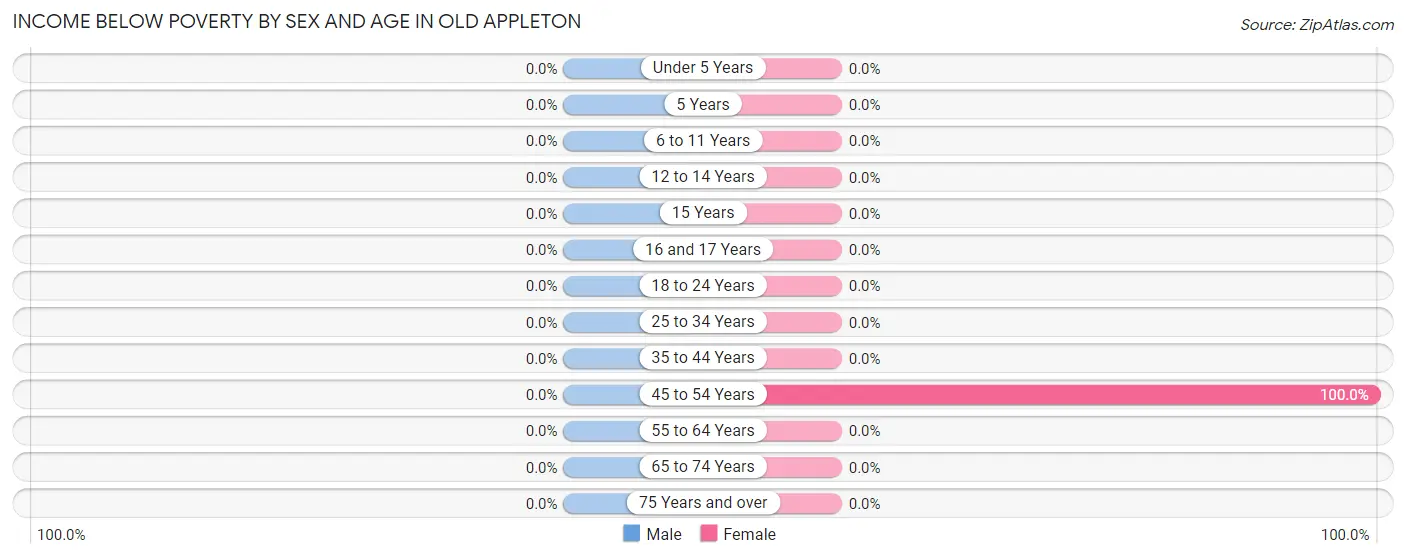
Income Below Poverty by Sex and Age in Old Appleton
| Age Bracket | Male | Female |
| Under 5 Years | 0 (0.0%) | 0 (0.0%) |
| 5 Years | 0 (0.0%) | 0 (0.0%) |
| 6 to 11 Years | 0 (0.0%) | 0 (0.0%) |
| 12 to 14 Years | 0 (0.0%) | 0 (0.0%) |
| 15 Years | 0 (0.0%) | 0 (0.0%) |
| 16 and 17 Years | 0 (0.0%) | 0 (0.0%) |
| 18 to 24 Years | 0 (0.0%) | 0 (0.0%) |
| 25 to 34 Years | 0 (0.0%) | 0 (0.0%) |
| 35 to 44 Years | 0 (0.0%) | 0 (0.0%) |
| 45 to 54 Years | 0 (0.0%) | 5 (100.0%) |
| 55 to 64 Years | 0 (0.0%) | 0 (0.0%) |
| 65 to 74 Years | 0 (0.0%) | 0 (0.0%) |
| 75 Years and over | 0 (0.0%) | 0 (0.0%) |
| Total | 0 (0.0%) | 5 (18.5%) |
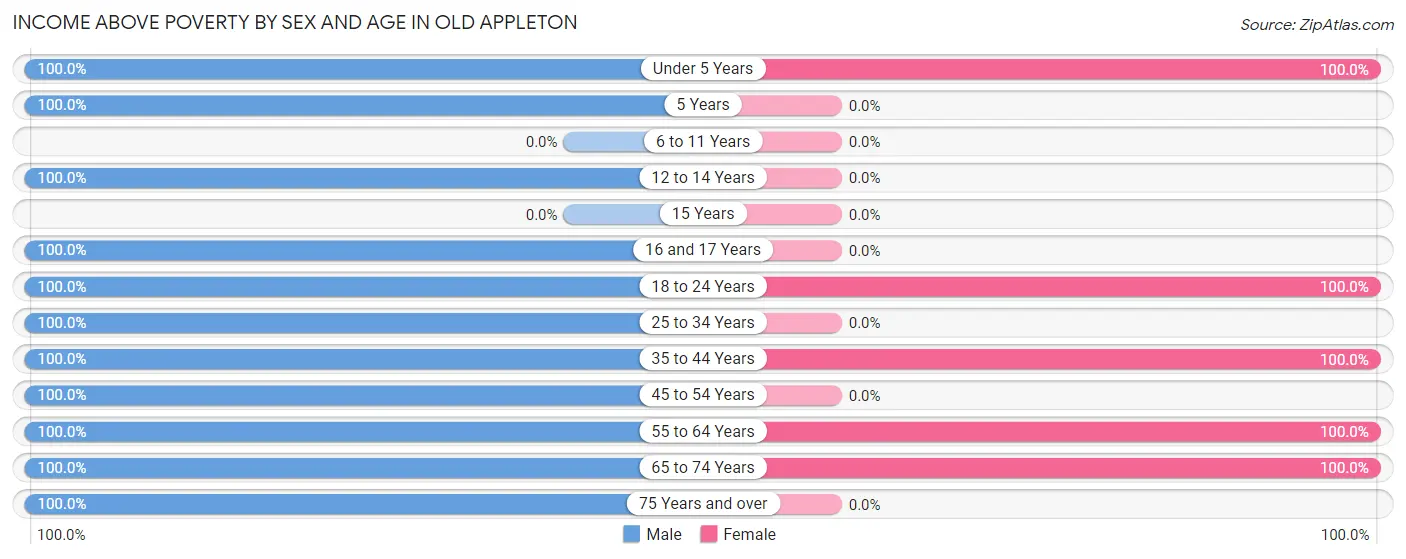
Income Above Poverty by Sex and Age in Old Appleton
According to the poverty statistics in Old Appleton, males aged under 5 years and females aged under 5 years are the age groups that are most secure financially, with 100.0% of males and 100.0% of females in these age groups living above the poverty line.
| Age Bracket | Male | Female |
| Under 5 Years | 2 (100.0%) | 6 (100.0%) |
| 5 Years | 4 (100.0%) | 0 (0.0%) |
| 6 to 11 Years | 0 (0.0%) | 0 (0.0%) |
| 12 to 14 Years | 7 (100.0%) | 0 (0.0%) |
| 15 Years | 0 (0.0%) | 0 (0.0%) |
| 16 and 17 Years | 2 (100.0%) | 0 (0.0%) |
| 18 to 24 Years | 3 (100.0%) | 4 (100.0%) |
| 25 to 34 Years | 6 (100.0%) | 0 (0.0%) |
| 35 to 44 Years | 12 (100.0%) | 9 (100.0%) |
| 45 to 54 Years | 1 (100.0%) | 0 (0.0%) |
| 55 to 64 Years | 17 (100.0%) | 1 (100.0%) |
| 65 to 74 Years | 2 (100.0%) | 2 (100.0%) |
| 75 Years and over | 2 (100.0%) | 0 (0.0%) |
| Total | 58 (100.0%) | 22 (81.5%) |
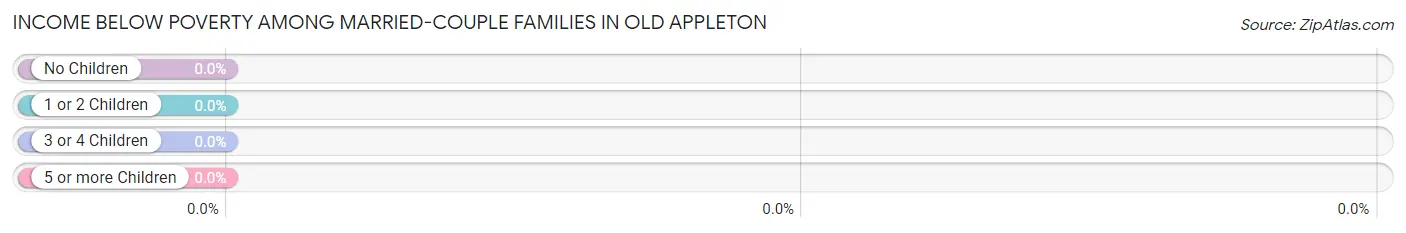
Income Below Poverty Among Married-Couple Families in Old Appleton
| Children | Above Poverty | Below Poverty |
| No Children | 3 (100.0%) | 0 (0.0%) |
| 1 or 2 Children | 3 (100.0%) | 0 (0.0%) |
| 3 or 4 Children | 5 (100.0%) | 0 (0.0%) |
| 5 or more Children | 0 (0.0%) | 0 (0.0%) |
| Total | 11 (100.0%) | 0 (0.0%) |
Income Below Poverty Among Single-Parent Households in Old Appleton
| Children | Single Father | Single Mother |
| No Children | 0 (0.0%) | 0 (0.0%) |
| 1 or 2 Children | 0 (0.0%) | 0 (0.0%) |
| 3 or 4 Children | 0 (0.0%) | 0 (0.0%) |
| 5 or more Children | 0 (0.0%) | 0 (0.0%) |
| Total | 0 (0.0%) | 0 (0.0%) |
Income Below Poverty Among Married-Couple vs Single-Parent Households in Old Appleton
| Children | Married-Couple Families | Single-Parent Households |
| No Children | 0 (0.0%) | 0 (0.0%) |
| 1 or 2 Children | 0 (0.0%) | 0 (0.0%) |
| 3 or 4 Children | 0 (0.0%) | 0 (0.0%) |
| 5 or more Children | 0 (0.0%) | 0 (0.0%) |
| Total | 0 (0.0%) | 0 (0.0%) |
Race in Old Appleton
The most populous races in Old Appleton are White / Caucasian (77 | 90.6%), and Two or more Races (8 | 9.4%).
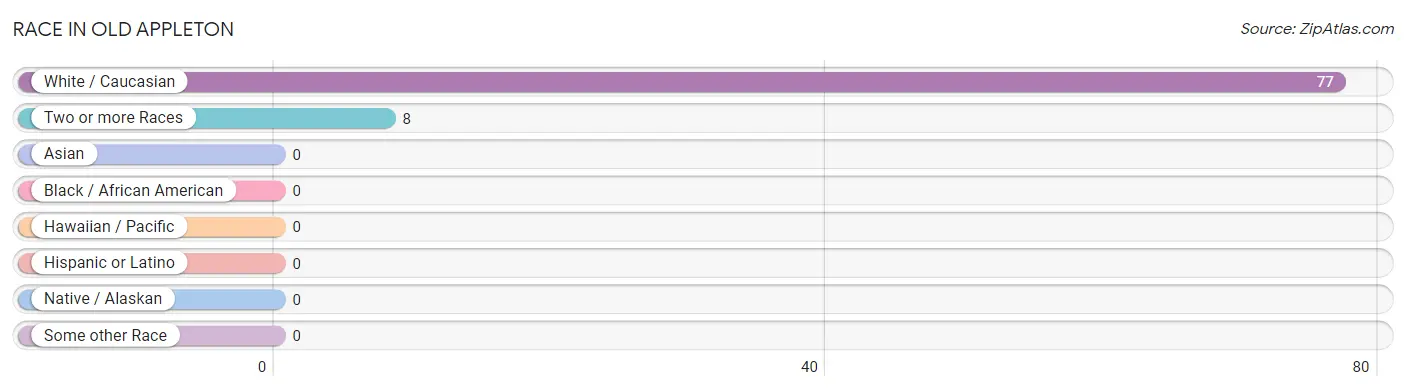
| Race | # Population | % Population |
| Asian | 0 | 0.0% |
| Black / African American | 0 | 0.0% |
| Hawaiian / Pacific | 0 | 0.0% |
| Hispanic or Latino | 0 | 0.0% |
| Native / Alaskan | 0 | 0.0% |
| White / Caucasian | 77 | 90.6% |
| Two or more Races | 8 | 9.4% |
| Some other Race | 0 | 0.0% |
| Total | 85 | 100.0% |
Ancestry in Old Appleton
The most populous ancestries reported in Old Appleton are German (33 | 38.8%), Cherokee (8 | 9.4%), and Irish (7 | 8.2%), together accounting for 56.5% of all Old Appleton residents.
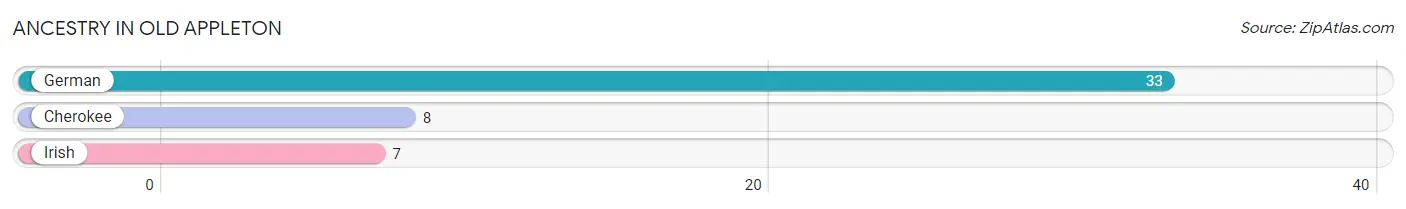
| Ancestry | # Population | % Population |
| Cherokee | 8 | 9.4% |
| German | 33 | 38.8% |
| Irish | 7 | 8.2% | View All 3 Rows |
Immigrants in Old Appleton

| Immigration Origin | # Population | % Population | View All 0 Rows |
Sex and Age in Old Appleton
Sex and Age in Old Appleton
The most populous age groups in Old Appleton are 55 to 59 Years (17 | 29.3%) for men and 35 to 39 Years (7 | 25.9%) for women.
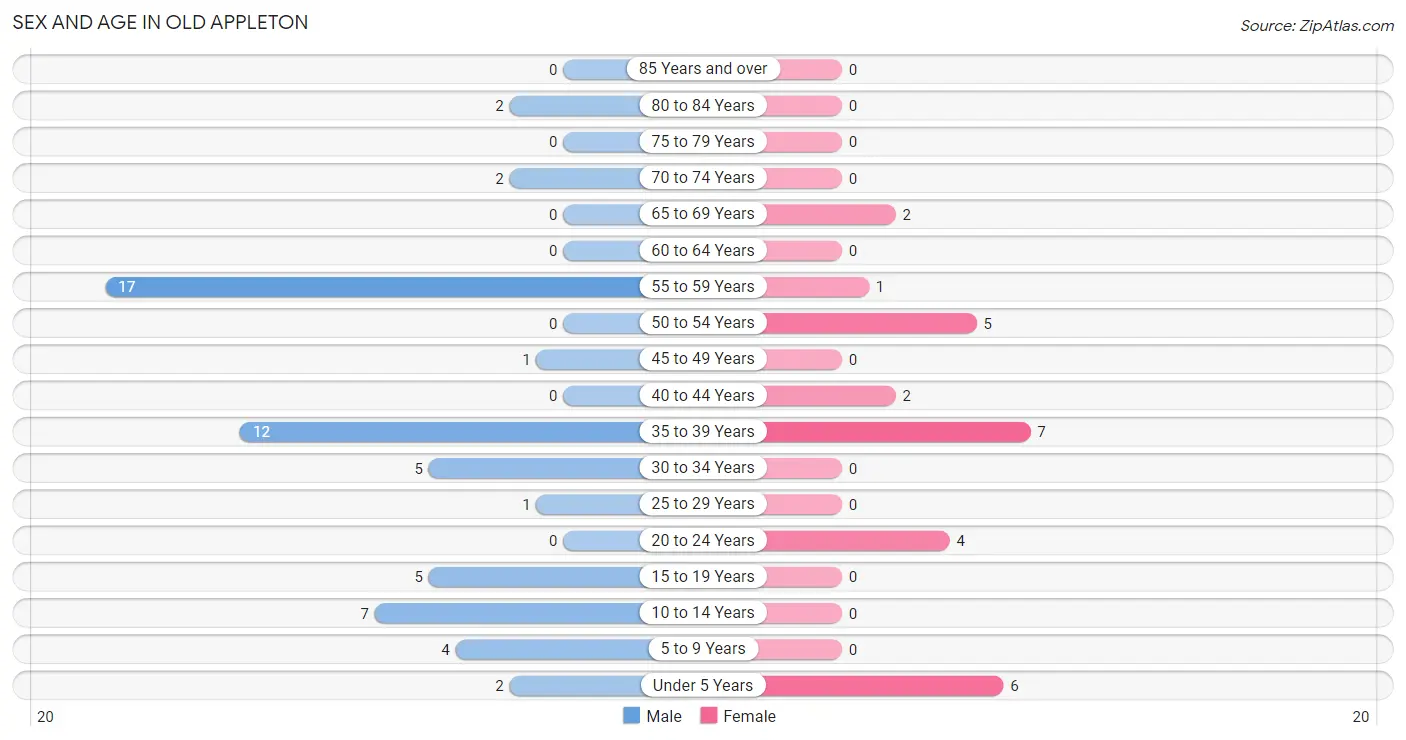
| Age Bracket | Male | Female |
| Under 5 Years | 2 (3.5%) | 6 (22.2%) |
| 5 to 9 Years | 4 (6.9%) | 0 (0.0%) |
| 10 to 14 Years | 7 (12.1%) | 0 (0.0%) |
| 15 to 19 Years | 5 (8.6%) | 0 (0.0%) |
| 20 to 24 Years | 0 (0.0%) | 4 (14.8%) |
| 25 to 29 Years | 1 (1.7%) | 0 (0.0%) |
| 30 to 34 Years | 5 (8.6%) | 0 (0.0%) |
| 35 to 39 Years | 12 (20.7%) | 7 (25.9%) |
| 40 to 44 Years | 0 (0.0%) | 2 (7.4%) |
| 45 to 49 Years | 1 (1.7%) | 0 (0.0%) |
| 50 to 54 Years | 0 (0.0%) | 5 (18.5%) |
| 55 to 59 Years | 17 (29.3%) | 1 (3.7%) |
| 60 to 64 Years | 0 (0.0%) | 0 (0.0%) |
| 65 to 69 Years | 0 (0.0%) | 2 (7.4%) |
| 70 to 74 Years | 2 (3.5%) | 0 (0.0%) |
| 75 to 79 Years | 0 (0.0%) | 0 (0.0%) |
| 80 to 84 Years | 2 (3.5%) | 0 (0.0%) |
| 85 Years and over | 0 (0.0%) | 0 (0.0%) |
| Total | 58 (100.0%) | 27 (100.0%) |
Families and Households in Old Appleton
Median Family Size in Old Appleton
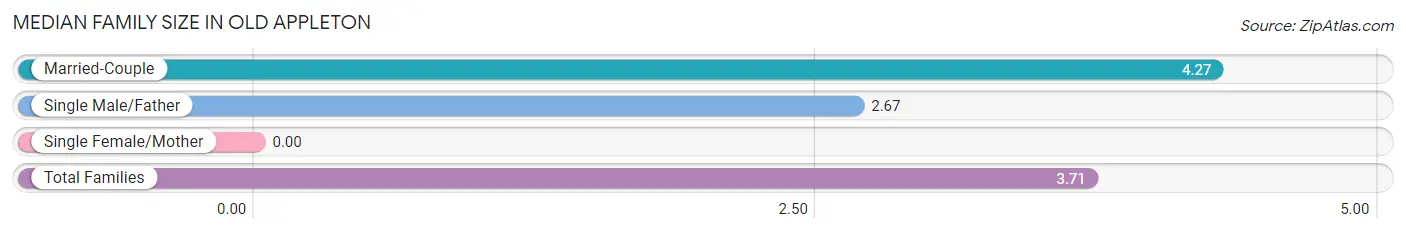
| Family Type | # Families | Family Size |
| Married-Couple | 11 (64.7%) | 4.27 |
| Single Male/Father | 6 (35.3%) | 2.67 |
| Single Female/Mother | 0 (0.0%) | - |
| Total Families | 17 (100.0%) | 3.71 |
Median Household Size in Old Appleton
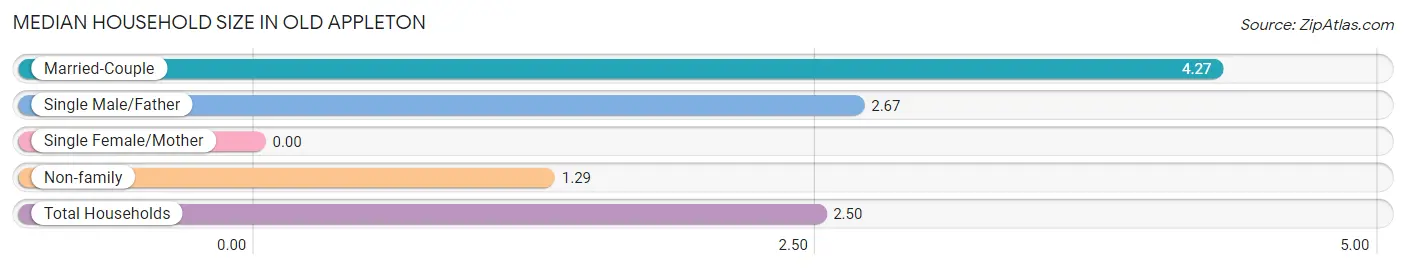
| Household Type | # Households | Household Size |
| Married-Couple | 11 (32.4%) | 4.27 |
| Single Male/Father | 6 (17.6%) | 2.67 |
| Single Female/Mother | 0 (0.0%) | - |
| Non-family | 17 (50.0%) | 1.29 |
| Total Households | 34 (100.0%) | 2.50 |
Household Size by Marriage Status in Old Appleton
Out of a total of 34 households in Old Appleton, 17 (50.0%) are family households, while 17 (50.0%) are nonfamily households. The most numerous type of family households are 2-person households, comprising 7, and the most common type of nonfamily households are 1-person households, comprising 12.
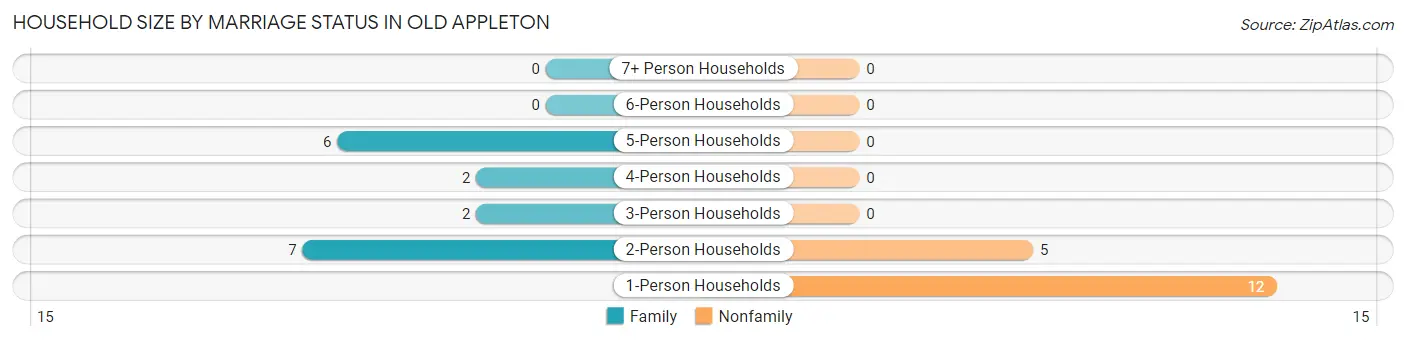
| Household Size | Family Households | Nonfamily Households |
| 1-Person Households | - | 12 (35.3%) |
| 2-Person Households | 7 (20.6%) | 5 (14.7%) |
| 3-Person Households | 2 (5.9%) | 0 (0.0%) |
| 4-Person Households | 2 (5.9%) | 0 (0.0%) |
| 5-Person Households | 6 (17.6%) | 0 (0.0%) |
| 6-Person Households | 0 (0.0%) | 0 (0.0%) |
| 7+ Person Households | 0 (0.0%) | 0 (0.0%) |
| Total | 17 (50.0%) | 17 (50.0%) |
Female Fertility in Old Appleton
Fertility by Age in Old Appleton
| Age Bracket | Women with Births | Births / 1,000 Women |
| 15 to 19 years | 0 (0.0%) | 0.0 |
| 20 to 34 years | 0 (0.0%) | 0.0 |
| 35 to 50 years | 0 (0.0%) | 0.0 |
| Total | 0 (0.0%) | 0.0 |
Fertility by Age by Marriage Status in Old Appleton
| Age Bracket | Married | Unmarried |
| 15 to 19 years | 0 (0.0%) | 0 (0.0%) |
| 20 to 34 years | 0 (0.0%) | 0 (0.0%) |
| 35 to 50 years | 0 (0.0%) | 0 (0.0%) |
| Total | 0 (0.0%) | 0 (0.0%) |
Fertility by Education in Old Appleton
| Educational Attainment | Women with Births | Births / 1,000 Women |
| Less than High School | 0 (0.0%) | 0.0 |
| High School Diploma | 0 (0.0%) | 0.0 |
| College or Associate's Degree | 0 (0.0%) | 0.0 |
| Bachelor's Degree | 0 (0.0%) | 0.0 |
| Graduate Degree | 0 (0.0%) | 0.0 |
| Total | 0 (0.0%) | 0.0 |
Fertility by Education by Marriage Status in Old Appleton
| Educational Attainment | Married | Unmarried |
| Less than High School | 0 (0.0%) | 0 (0.0%) |
| High School Diploma | 0 (0.0%) | 0 (0.0%) |
| College or Associate's Degree | 0 (0.0%) | 0 (0.0%) |
| Bachelor's Degree | 0 (0.0%) | 0 (0.0%) |
| Graduate Degree | 0 (0.0%) | 0 (0.0%) |
| Total | 0 (0.0%) | 0 (0.0%) |
Employment Characteristics in Old Appleton
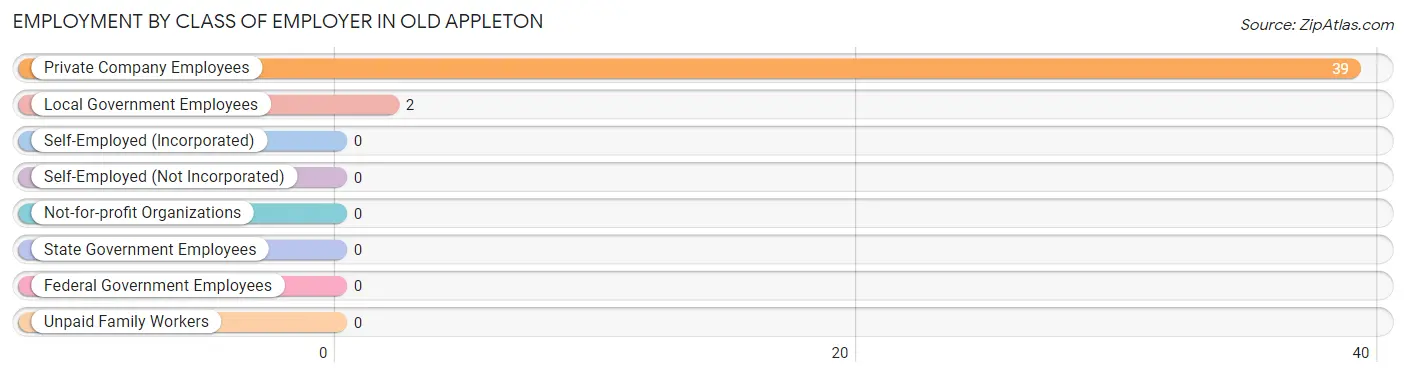
Employment by Class of Employer in Old Appleton
Among the 41 employed individuals in Old Appleton, private company employees (39 | 95.1%), and local government employees (2 | 4.9%) make up the most common classes of employment.
| Employer Class | # Employees | % Employees |
| Private Company Employees | 39 | 95.1% |
| Self-Employed (Incorporated) | 0 | 0.0% |
| Self-Employed (Not Incorporated) | 0 | 0.0% |
| Not-for-profit Organizations | 0 | 0.0% |
| Local Government Employees | 2 | 4.9% |
| State Government Employees | 0 | 0.0% |
| Federal Government Employees | 0 | 0.0% |
| Unpaid Family Workers | 0 | 0.0% |
| Total | 41 | 100.0% |
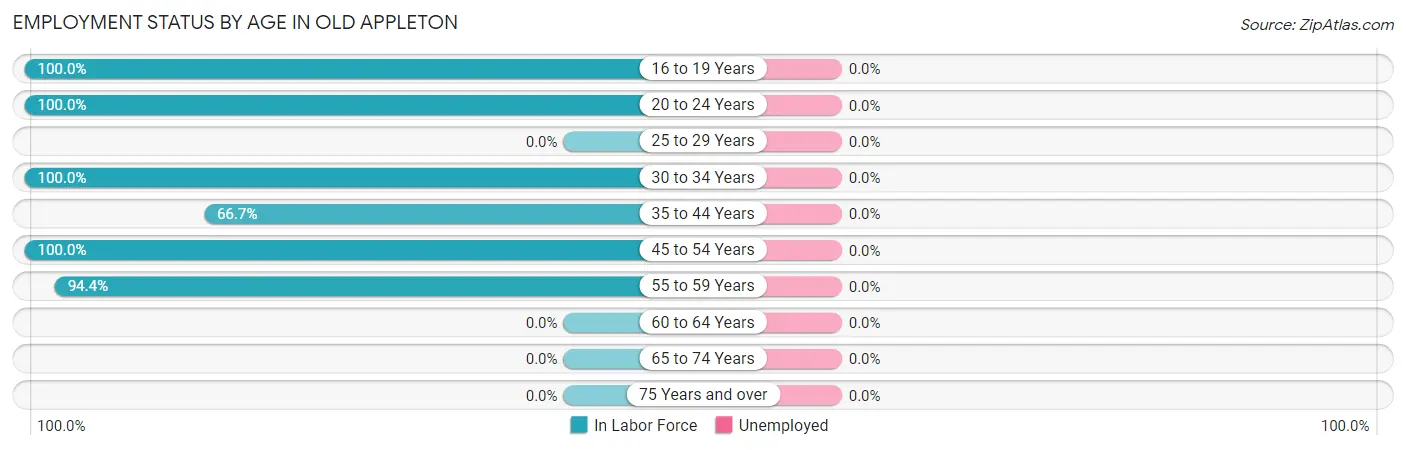
Employment Status by Age in Old Appleton
| Age Bracket | In Labor Force | Unemployed |
| 16 to 19 Years | 5 (100.0%) | 0 (0.0%) |
| 20 to 24 Years | 4 (100.0%) | 0 (0.0%) |
| 25 to 29 Years | 0 (0.0%) | 0 (0.0%) |
| 30 to 34 Years | 5 (100.0%) | 0 (0.0%) |
| 35 to 44 Years | 14 (66.7%) | 0 (0.0%) |
| 45 to 54 Years | 6 (100.0%) | 0 (0.0%) |
| 55 to 59 Years | 17 (94.4%) | 0 (0.0%) |
| 60 to 64 Years | 0 (0.0%) | 0 (0.0%) |
| 65 to 74 Years | 0 (0.0%) | 0 (0.0%) |
| 75 Years and over | 0 (0.0%) | 0 (0.0%) |
| Total | 51 (77.3%) | 0 (0.0%) |
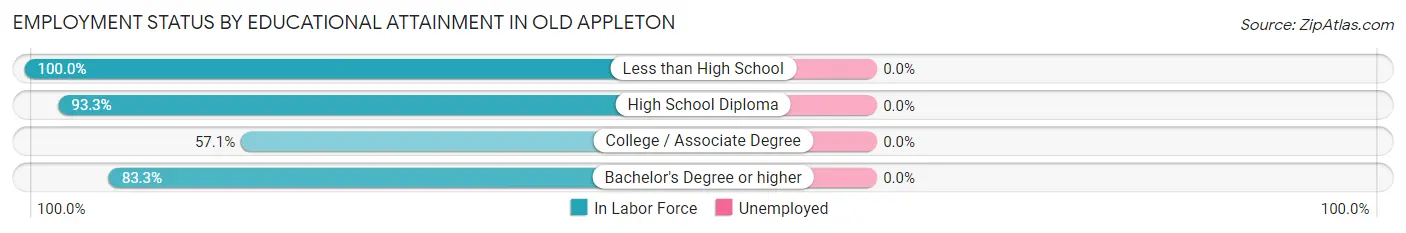
Employment Status by Educational Attainment in Old Appleton
| Educational Attainment | In Labor Force | Unemployed |
| Less than High School | 1 (100.0%) | 0 (0.0%) |
| High School Diploma | 28 (93.3%) | 0 (0.0%) |
| College / Associate Degree | 8 (57.1%) | 0 (0.0%) |
| Bachelor's Degree or higher | 5 (83.3%) | 0 (0.0%) |
| Total | 42 (82.4%) | 0 (0.0%) |
Employment Occupations by Sex in Old Appleton
Management, Business, Science and Arts Occupations
The most common Management, Business, Science and Arts occupations in Old Appleton are Computers, Engineering & Science (5 | 9.8%), Computers & Mathematics (5 | 9.8%), Health Diagnosing & Treating (3 | 5.9%), and Health Technologists (3 | 5.9%).
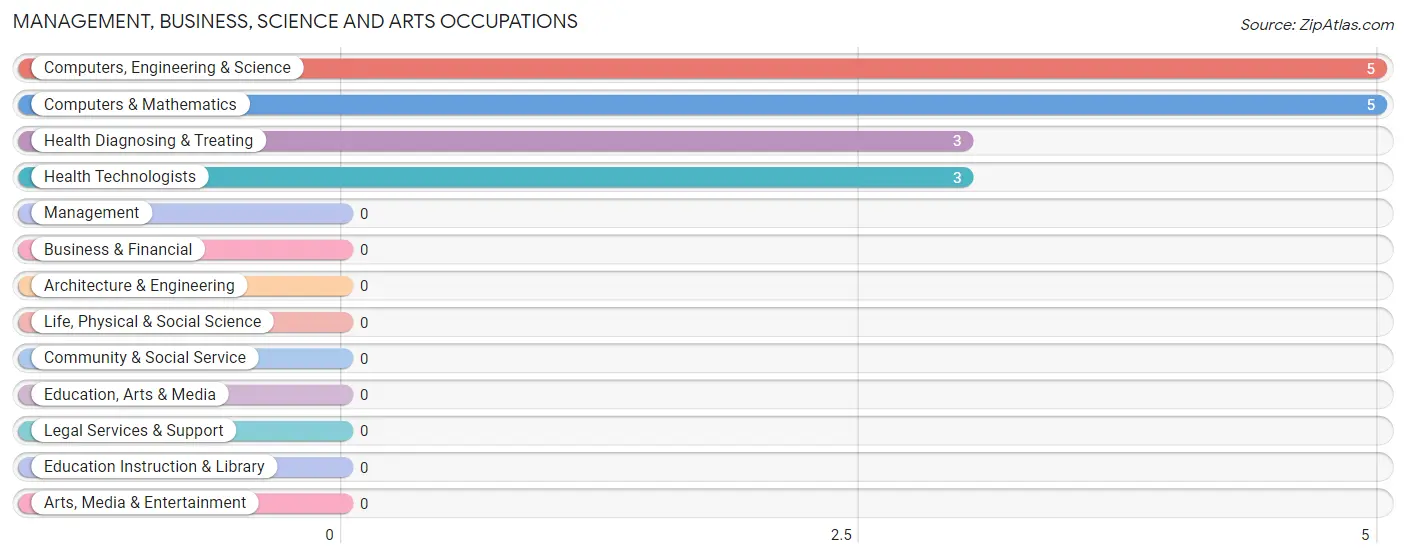
Management, Business, Science and Arts Occupations by Sex
Within the Management, Business, Science and Arts occupations in Old Appleton, the most male-oriented occupations are Computers, Engineering & Science (100.0%), and Computers & Mathematics (100.0%), while the most female-oriented occupations are Health Diagnosing & Treating (100.0%), and Health Technologists (100.0%).
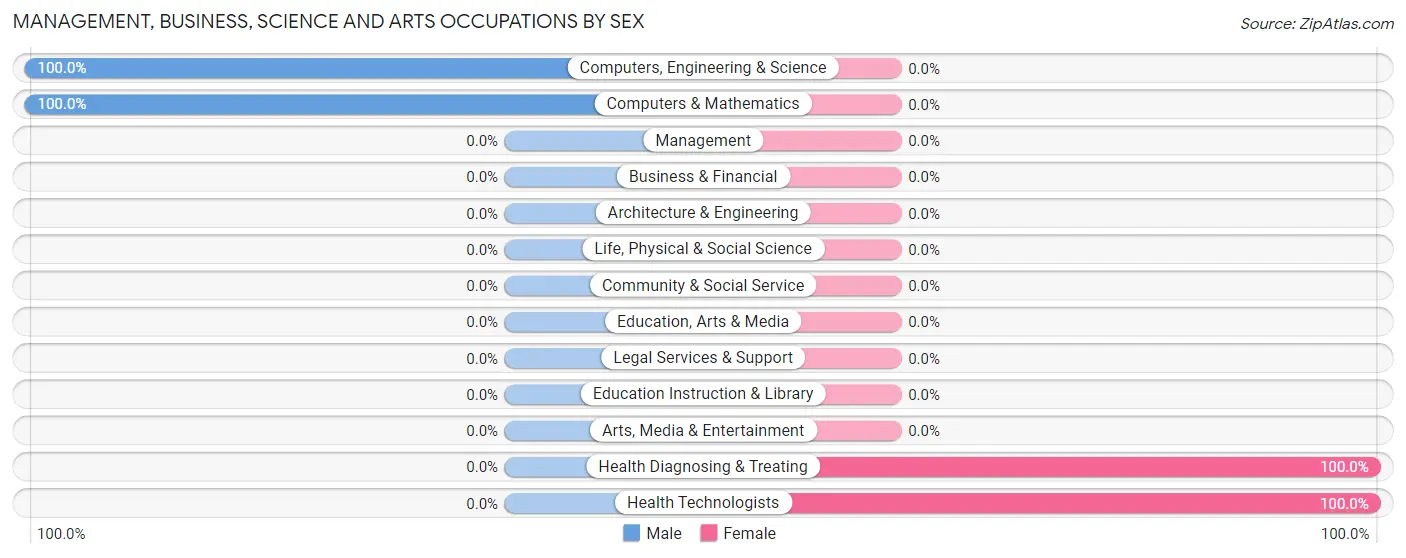
| Occupation | Male | Female |
| Management | 0 (0.0%) | 0 (0.0%) |
| Business & Financial | 0 (0.0%) | 0 (0.0%) |
| Computers, Engineering & Science | 5 (100.0%) | 0 (0.0%) |
| Computers & Mathematics | 5 (100.0%) | 0 (0.0%) |
| Architecture & Engineering | 0 (0.0%) | 0 (0.0%) |
| Life, Physical & Social Science | 0 (0.0%) | 0 (0.0%) |
| Community & Social Service | 0 (0.0%) | 0 (0.0%) |
| Education, Arts & Media | 0 (0.0%) | 0 (0.0%) |
| Legal Services & Support | 0 (0.0%) | 0 (0.0%) |
| Education Instruction & Library | 0 (0.0%) | 0 (0.0%) |
| Arts, Media & Entertainment | 0 (0.0%) | 0 (0.0%) |
| Health Diagnosing & Treating | 0 (0.0%) | 3 (100.0%) |
| Health Technologists | 0 (0.0%) | 3 (100.0%) |
| Total (Category) | 5 (62.5%) | 3 (37.5%) |
| Total (Overall) | 40 (78.4%) | 11 (21.6%) |
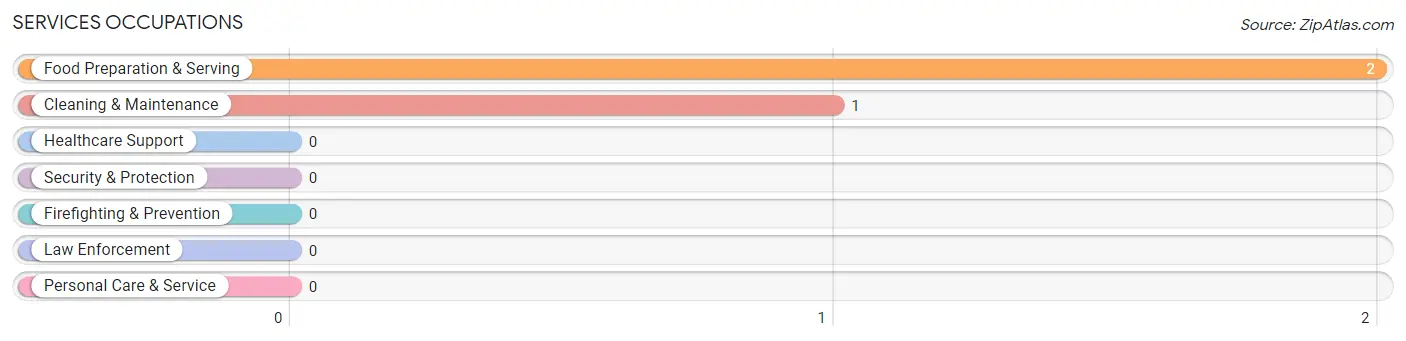
Services Occupations
The most common Services occupations in Old Appleton are Food Preparation & Serving (2 | 3.9%), and Cleaning & Maintenance (1 | 2.0%).
Services Occupations by Sex
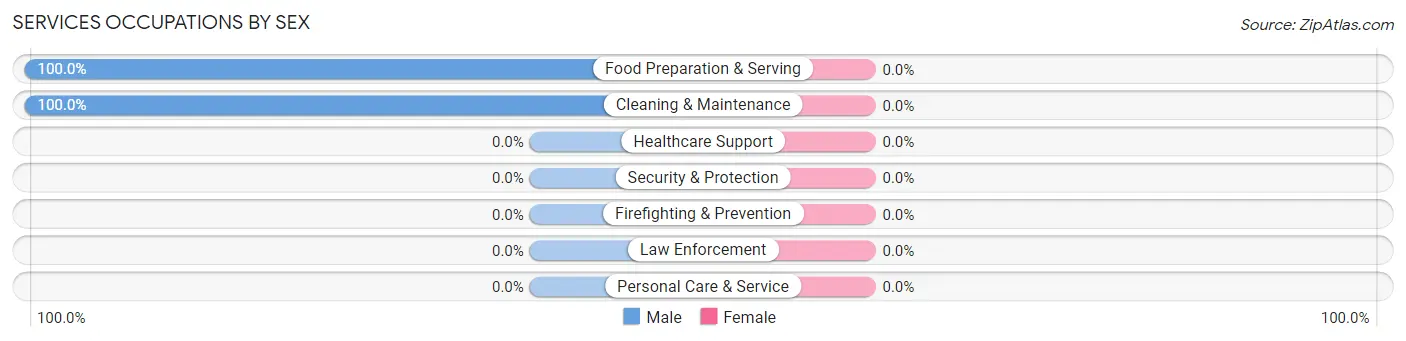
| Occupation | Male | Female |
| Healthcare Support | 0 (0.0%) | 0 (0.0%) |
| Security & Protection | 0 (0.0%) | 0 (0.0%) |
| Firefighting & Prevention | 0 (0.0%) | 0 (0.0%) |
| Law Enforcement | 0 (0.0%) | 0 (0.0%) |
| Food Preparation & Serving | 2 (100.0%) | 0 (0.0%) |
| Cleaning & Maintenance | 1 (100.0%) | 0 (0.0%) |
| Personal Care & Service | 0 (0.0%) | 0 (0.0%) |
| Total (Category) | 3 (100.0%) | 0 (0.0%) |
| Total (Overall) | 40 (78.4%) | 11 (21.6%) |
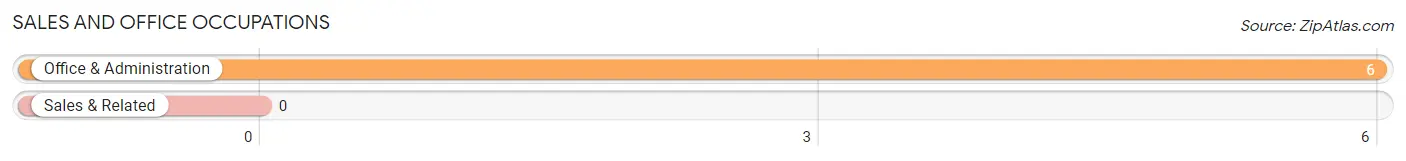
Sales and Office Occupations
The most common Sales and Office occupations in Old Appleton are , and Office & Administration (6 | 11.8%).
Sales and Office Occupations by Sex
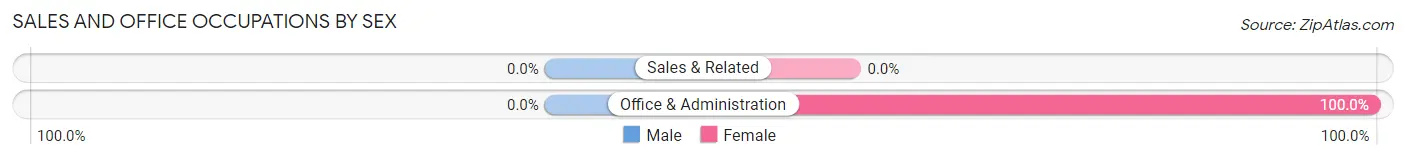
| Occupation | Male | Female |
| Sales & Related | 0 (0.0%) | 0 (0.0%) |
| Office & Administration | 0 (0.0%) | 6 (100.0%) |
| Total (Category) | 0 (0.0%) | 6 (100.0%) |
| Total (Overall) | 40 (78.4%) | 11 (21.6%) |
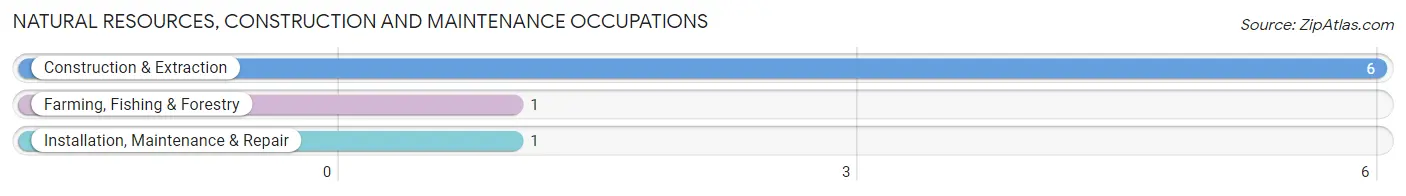
Natural Resources, Construction and Maintenance Occupations
The most common Natural Resources, Construction and Maintenance occupations in Old Appleton are Construction & Extraction (6 | 11.8%), Farming, Fishing & Forestry (1 | 2.0%), and Installation, Maintenance & Repair (1 | 2.0%).
Natural Resources, Construction and Maintenance Occupations by Sex
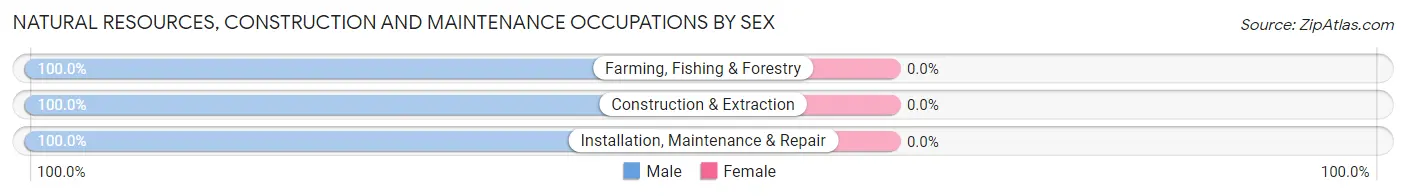
| Occupation | Male | Female |
| Farming, Fishing & Forestry | 1 (100.0%) | 0 (0.0%) |
| Construction & Extraction | 6 (100.0%) | 0 (0.0%) |
| Installation, Maintenance & Repair | 1 (100.0%) | 0 (0.0%) |
| Total (Category) | 8 (100.0%) | 0 (0.0%) |
| Total (Overall) | 40 (78.4%) | 11 (21.6%) |
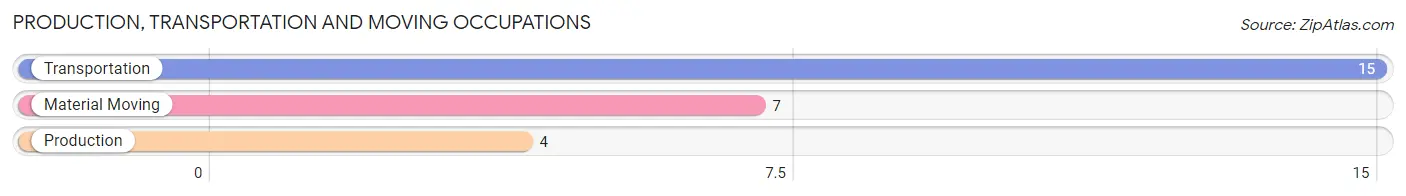
Production, Transportation and Moving Occupations
The most common Production, Transportation and Moving occupations in Old Appleton are Transportation (15 | 29.4%), Material Moving (7 | 13.7%), and Production (4 | 7.8%).
Production, Transportation and Moving Occupations by Sex
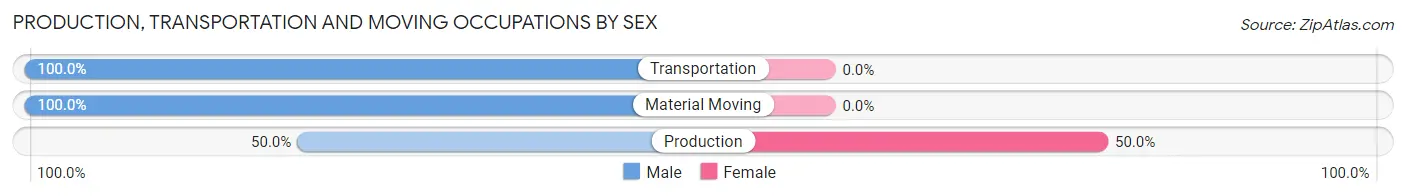
| Occupation | Male | Female |
| Production | 2 (50.0%) | 2 (50.0%) |
| Transportation | 15 (100.0%) | 0 (0.0%) |
| Material Moving | 7 (100.0%) | 0 (0.0%) |
| Total (Category) | 24 (92.3%) | 2 (7.7%) |
| Total (Overall) | 40 (78.4%) | 11 (21.6%) |
Employment Industries by Sex in Old Appleton
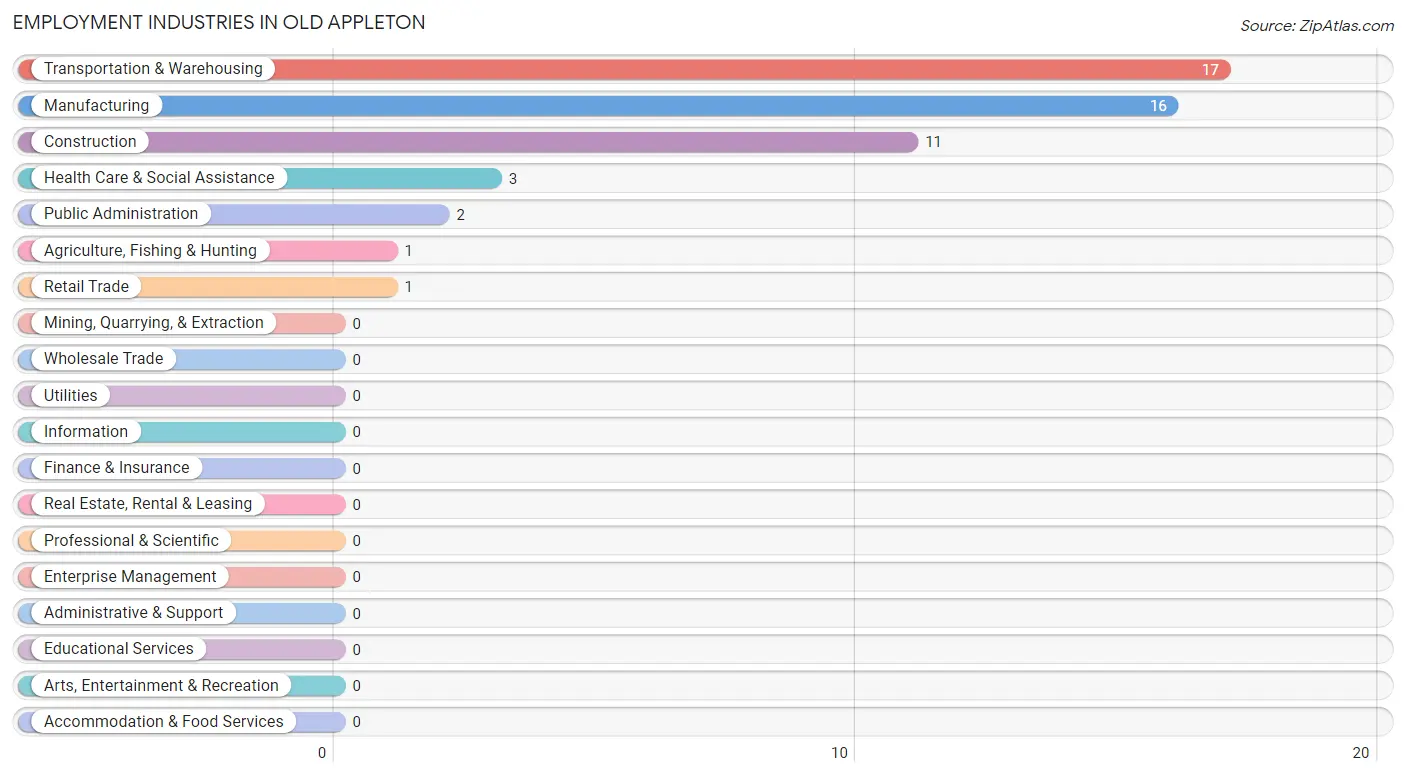
Employment Industries in Old Appleton
The major employment industries in Old Appleton include Transportation & Warehousing (17 | 33.3%), Manufacturing (16 | 31.4%), Construction (11 | 21.6%), Health Care & Social Assistance (3 | 5.9%), and Public Administration (2 | 3.9%).
Employment Industries by Sex in Old Appleton
The Old Appleton industries that see more men than women are Agriculture, Fishing & Hunting (100.0%), Transportation & Warehousing (100.0%), and Public Administration (100.0%), whereas the industries that tend to have a higher number of women are Retail Trade (100.0%), Health Care & Social Assistance (100.0%), and Construction (45.5%).
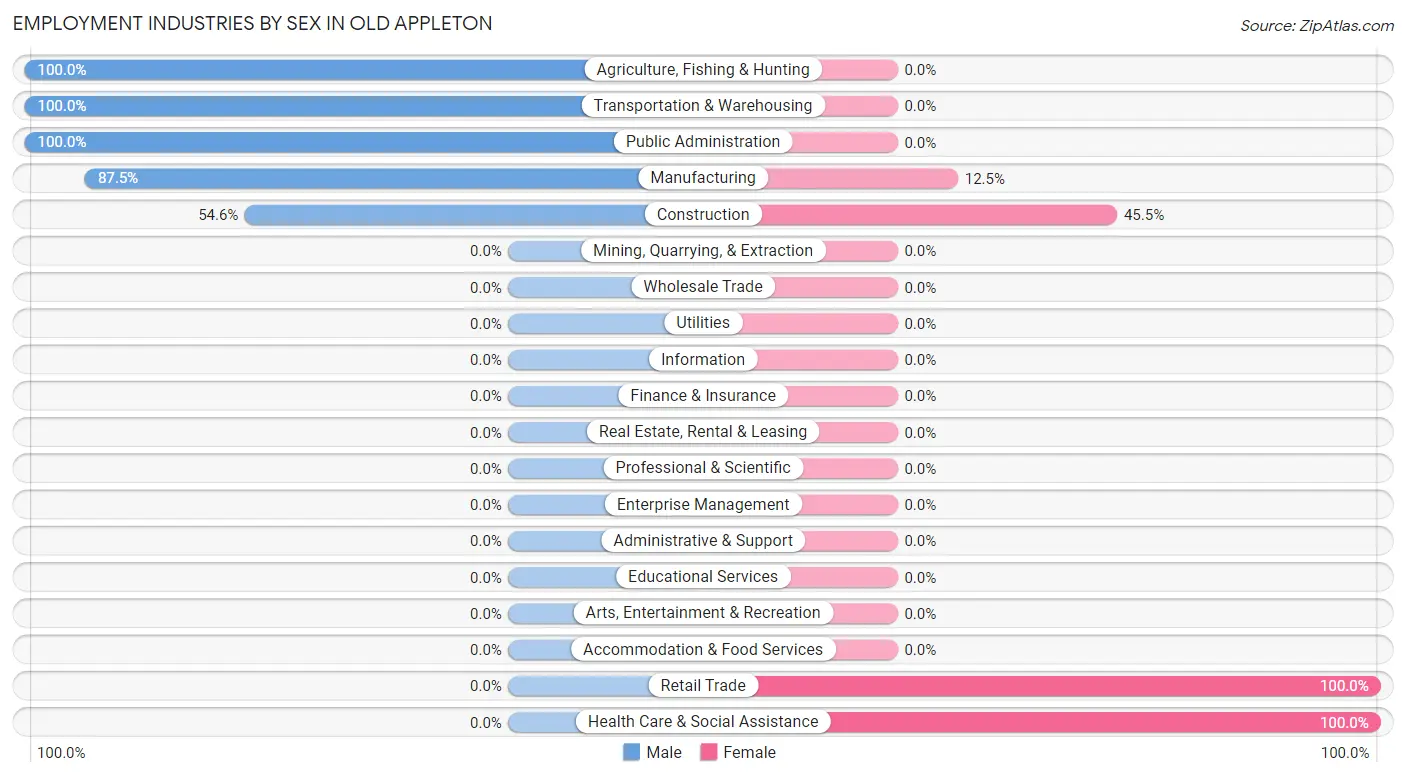
| Industry | Male | Female |
| Agriculture, Fishing & Hunting | 1 (100.0%) | 0 (0.0%) |
| Mining, Quarrying, & Extraction | 0 (0.0%) | 0 (0.0%) |
| Construction | 6 (54.5%) | 5 (45.5%) |
| Manufacturing | 14 (87.5%) | 2 (12.5%) |
| Wholesale Trade | 0 (0.0%) | 0 (0.0%) |
| Retail Trade | 0 (0.0%) | 1 (100.0%) |
| Transportation & Warehousing | 17 (100.0%) | 0 (0.0%) |
| Utilities | 0 (0.0%) | 0 (0.0%) |
| Information | 0 (0.0%) | 0 (0.0%) |
| Finance & Insurance | 0 (0.0%) | 0 (0.0%) |
| Real Estate, Rental & Leasing | 0 (0.0%) | 0 (0.0%) |
| Professional & Scientific | 0 (0.0%) | 0 (0.0%) |
| Enterprise Management | 0 (0.0%) | 0 (0.0%) |
| Administrative & Support | 0 (0.0%) | 0 (0.0%) |
| Educational Services | 0 (0.0%) | 0 (0.0%) |
| Health Care & Social Assistance | 0 (0.0%) | 3 (100.0%) |
| Arts, Entertainment & Recreation | 0 (0.0%) | 0 (0.0%) |
| Accommodation & Food Services | 0 (0.0%) | 0 (0.0%) |
| Public Administration | 2 (100.0%) | 0 (0.0%) |
| Total | 40 (78.4%) | 11 (21.6%) |
Education in Old Appleton
School Enrollment in Old Appleton
The most common levels of schooling among the 16 students in Old Appleton are middle school (7 | 43.8%), kindergarten (4 | 25.0%), and graduate / professional (3 | 18.8%).
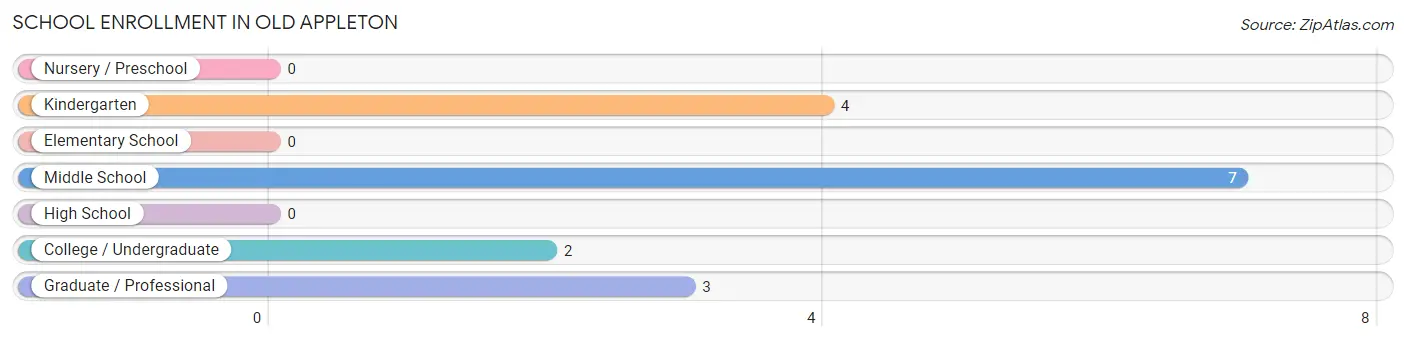
| School Level | # Students | % Students |
| Nursery / Preschool | 0 | 0.0% |
| Kindergarten | 4 | 25.0% |
| Elementary School | 0 | 0.0% |
| Middle School | 7 | 43.8% |
| High School | 0 | 0.0% |
| College / Undergraduate | 2 | 12.5% |
| Graduate / Professional | 3 | 18.8% |
| Total | 16 | 100.0% |
School Enrollment by Age by Funding Source in Old Appleton
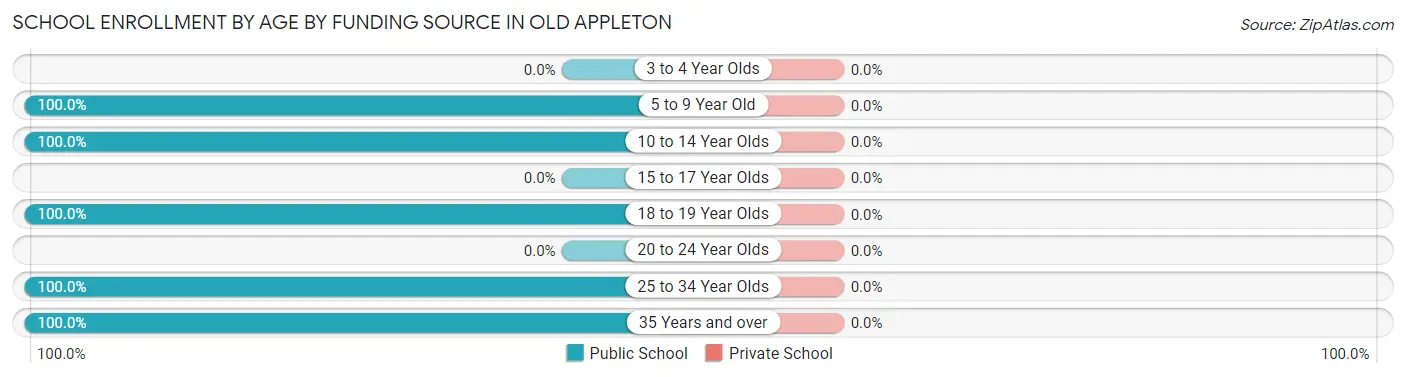
| Age Bracket | Public School | Private School |
| 3 to 4 Year Olds | 0 (0.0%) | 0 (0.0%) |
| 5 to 9 Year Old | 4 (100.0%) | 0 (0.0%) |
| 10 to 14 Year Olds | 7 (100.0%) | 0 (0.0%) |
| 15 to 17 Year Olds | 0 (0.0%) | 0 (0.0%) |
| 18 to 19 Year Olds | 2 (100.0%) | 0 (0.0%) |
| 20 to 24 Year Olds | 0 (0.0%) | 0 (0.0%) |
| 25 to 34 Year Olds | 1 (100.0%) | 0 (0.0%) |
| 35 Years and over | 2 (100.0%) | 0 (0.0%) |
| Total | 16 (100.0%) | 0 (0.0%) |
Educational Attainment by Field of Study in Old Appleton
Social sciences (5 | 62.5%), physical & health sciences (2 | 25.0%), and bio, nature & agricultural (1 | 12.5%) are the most common fields of study among 8 individuals in Old Appleton who have obtained a bachelor's degree or higher.
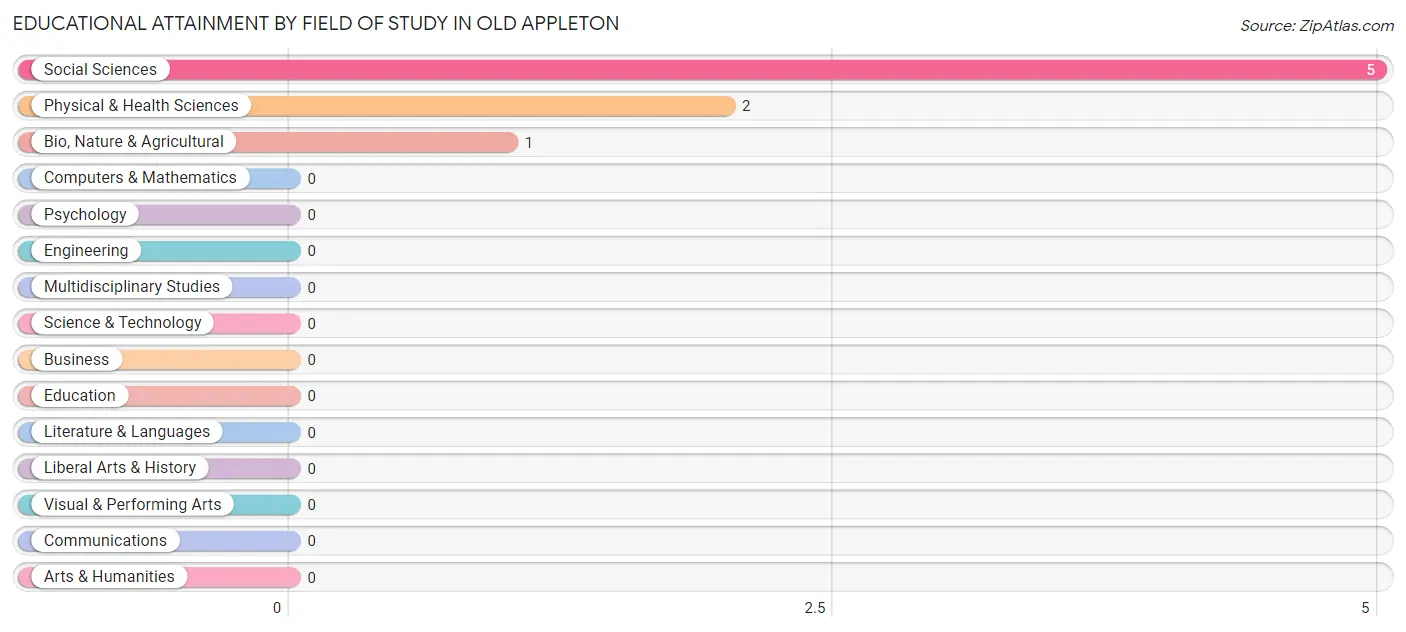
| Field of Study | # Graduates | % Graduates |
| Computers & Mathematics | 0 | 0.0% |
| Bio, Nature & Agricultural | 1 | 12.5% |
| Physical & Health Sciences | 2 | 25.0% |
| Psychology | 0 | 0.0% |
| Social Sciences | 5 | 62.5% |
| Engineering | 0 | 0.0% |
| Multidisciplinary Studies | 0 | 0.0% |
| Science & Technology | 0 | 0.0% |
| Business | 0 | 0.0% |
| Education | 0 | 0.0% |
| Literature & Languages | 0 | 0.0% |
| Liberal Arts & History | 0 | 0.0% |
| Visual & Performing Arts | 0 | 0.0% |
| Communications | 0 | 0.0% |
| Arts & Humanities | 0 | 0.0% |
| Total | 8 | 100.0% |
Transportation & Commute in Old Appleton
Vehicle Availability by Sex in Old Appleton
The most prevalent vehicle ownership categories in Old Appleton are males with 3 vehicles (11, accounting for 36.7%) and females with 3 vehicles (3, making up 100.0%).
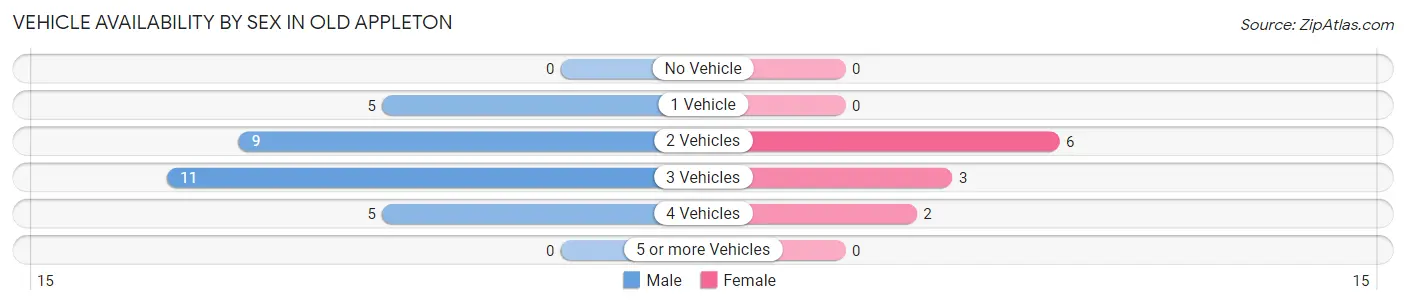
| Vehicles Available | Male | Female |
| No Vehicle | 0 (0.0%) | 0 (0.0%) |
| 1 Vehicle | 5 (16.7%) | 0 (0.0%) |
| 2 Vehicles | 9 (30.0%) | 6 (54.5%) |
| 3 Vehicles | 11 (36.7%) | 3 (27.3%) |
| 4 Vehicles | 5 (16.7%) | 2 (18.2%) |
| 5 or more Vehicles | 0 (0.0%) | 0 (0.0%) |
| Total | 30 (100.0%) | 11 (100.0%) |
Commute Time in Old Appleton
The most frequently occuring commute durations in Old Appleton are 15 to 19 minutes (13 commuters, 33.3%), 30 to 34 minutes (8 commuters, 20.5%), and 10 to 14 minutes (7 commuters, 17.9%).
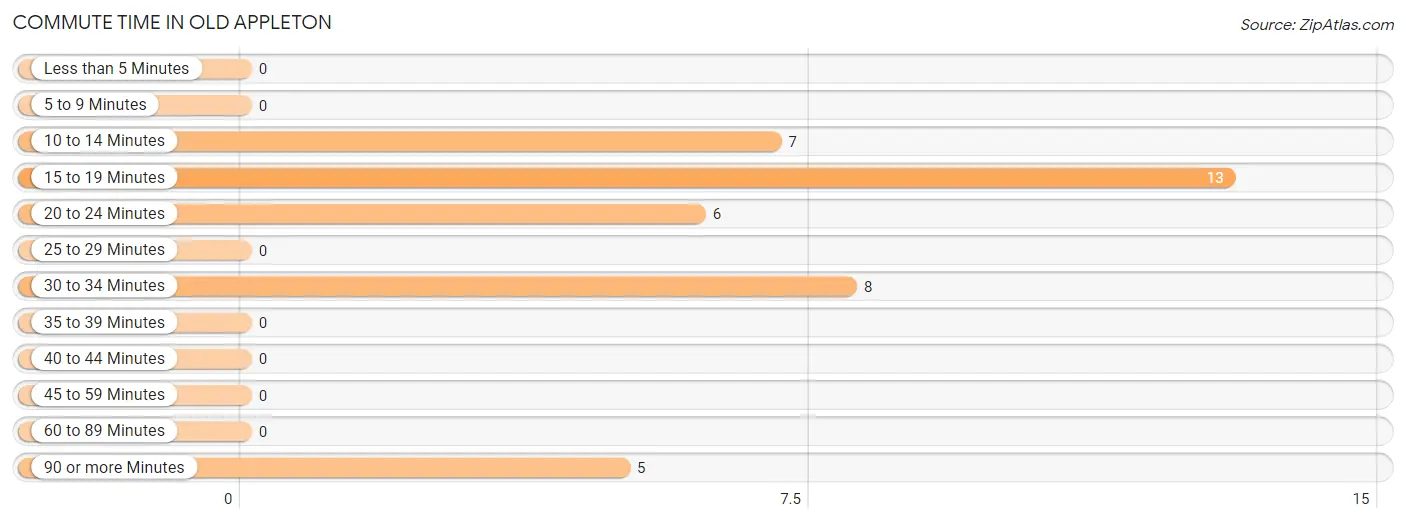
| Commute Time | # Commuters | % Commuters |
| Less than 5 Minutes | 0 | 0.0% |
| 5 to 9 Minutes | 0 | 0.0% |
| 10 to 14 Minutes | 7 | 17.9% |
| 15 to 19 Minutes | 13 | 33.3% |
| 20 to 24 Minutes | 6 | 15.4% |
| 25 to 29 Minutes | 0 | 0.0% |
| 30 to 34 Minutes | 8 | 20.5% |
| 35 to 39 Minutes | 0 | 0.0% |
| 40 to 44 Minutes | 0 | 0.0% |
| 45 to 59 Minutes | 0 | 0.0% |
| 60 to 89 Minutes | 0 | 0.0% |
| 90 or more Minutes | 5 | 12.8% |
Commute Time by Sex in Old Appleton
The most common commute times in Old Appleton are 30 to 34 minutes (8 commuters, 28.6%) for males and 15 to 19 minutes (10 commuters, 90.9%) for females.
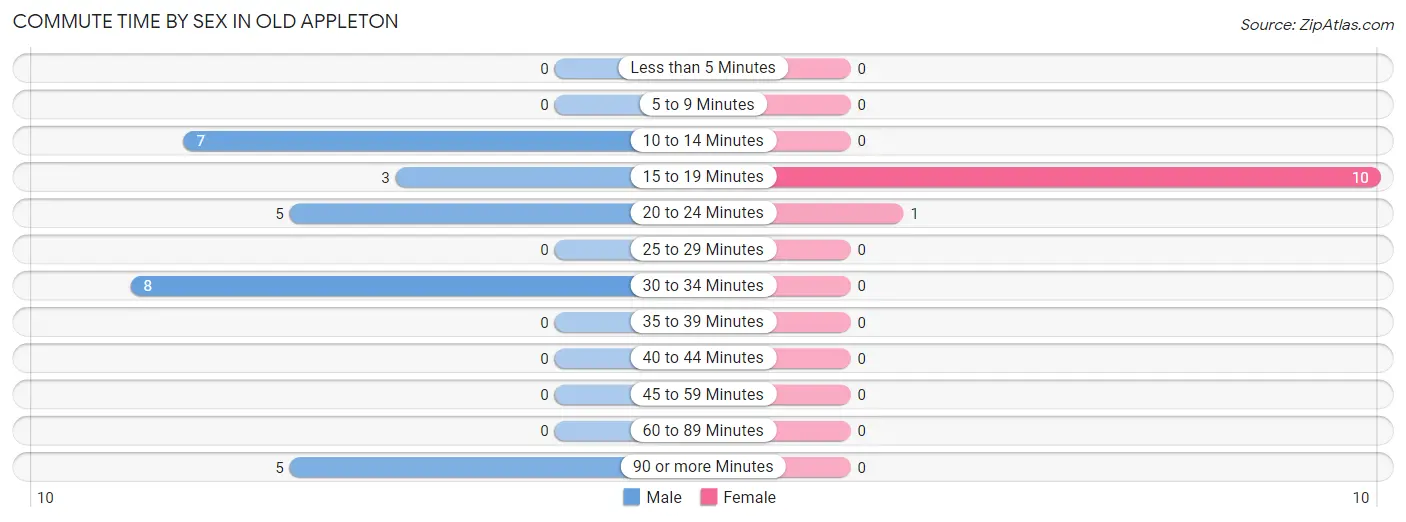
| Commute Time | Male | Female |
| Less than 5 Minutes | 0 (0.0%) | 0 (0.0%) |
| 5 to 9 Minutes | 0 (0.0%) | 0 (0.0%) |
| 10 to 14 Minutes | 7 (25.0%) | 0 (0.0%) |
| 15 to 19 Minutes | 3 (10.7%) | 10 (90.9%) |
| 20 to 24 Minutes | 5 (17.9%) | 1 (9.1%) |
| 25 to 29 Minutes | 0 (0.0%) | 0 (0.0%) |
| 30 to 34 Minutes | 8 (28.6%) | 0 (0.0%) |
| 35 to 39 Minutes | 0 (0.0%) | 0 (0.0%) |
| 40 to 44 Minutes | 0 (0.0%) | 0 (0.0%) |
| 45 to 59 Minutes | 0 (0.0%) | 0 (0.0%) |
| 60 to 89 Minutes | 0 (0.0%) | 0 (0.0%) |
| 90 or more Minutes | 5 (17.9%) | 0 (0.0%) |
Time of Departure to Work by Sex in Old Appleton
The most frequent times of departure to work in Old Appleton are 10:00 AM to 10:59 AM (10, 35.7%) for males and 6:30 AM to 6:59 AM (5, 45.5%) for females.
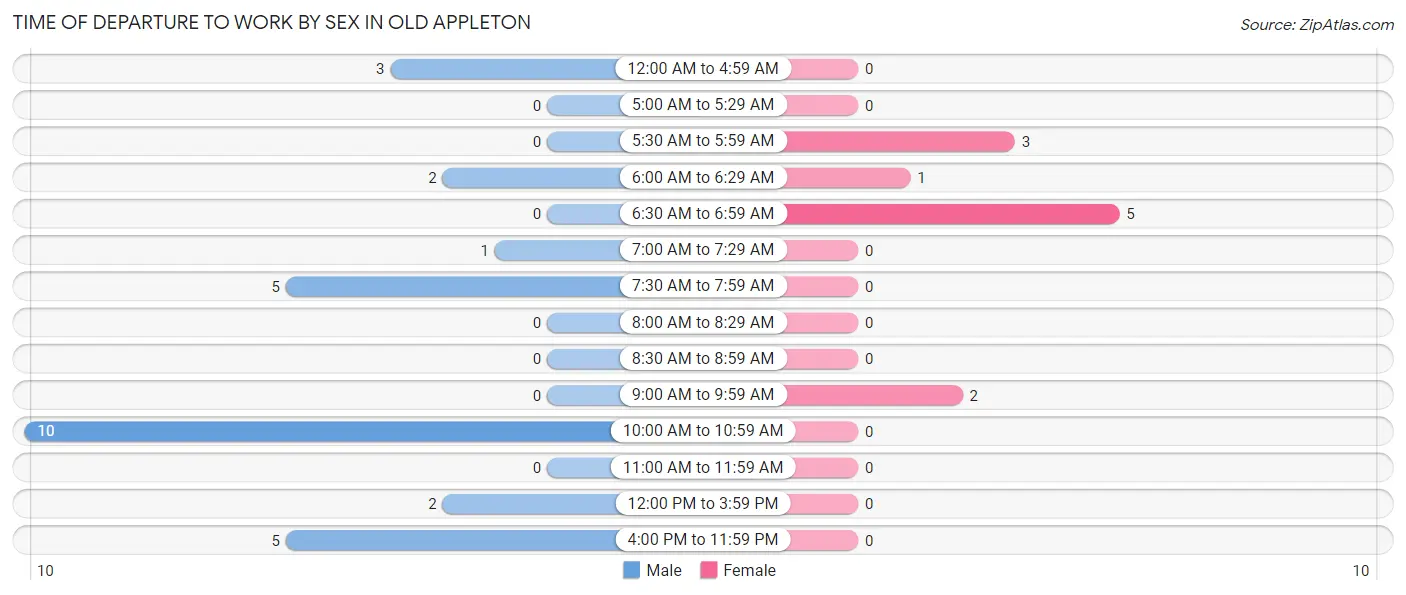
| Time of Departure | Male | Female |
| 12:00 AM to 4:59 AM | 3 (10.7%) | 0 (0.0%) |
| 5:00 AM to 5:29 AM | 0 (0.0%) | 0 (0.0%) |
| 5:30 AM to 5:59 AM | 0 (0.0%) | 3 (27.3%) |
| 6:00 AM to 6:29 AM | 2 (7.1%) | 1 (9.1%) |
| 6:30 AM to 6:59 AM | 0 (0.0%) | 5 (45.5%) |
| 7:00 AM to 7:29 AM | 1 (3.6%) | 0 (0.0%) |
| 7:30 AM to 7:59 AM | 5 (17.9%) | 0 (0.0%) |
| 8:00 AM to 8:29 AM | 0 (0.0%) | 0 (0.0%) |
| 8:30 AM to 8:59 AM | 0 (0.0%) | 0 (0.0%) |
| 9:00 AM to 9:59 AM | 0 (0.0%) | 2 (18.2%) |
| 10:00 AM to 10:59 AM | 10 (35.7%) | 0 (0.0%) |
| 11:00 AM to 11:59 AM | 0 (0.0%) | 0 (0.0%) |
| 12:00 PM to 3:59 PM | 2 (7.1%) | 0 (0.0%) |
| 4:00 PM to 11:59 PM | 5 (17.9%) | 0 (0.0%) |
| Total | 28 (100.0%) | 11 (100.0%) |
Housing Occupancy in Old Appleton
Occupancy by Ownership in Old Appleton
Of the total 34 dwellings in Old Appleton, owner-occupied units account for 22 (64.7%), while renter-occupied units make up 12 (35.3%).
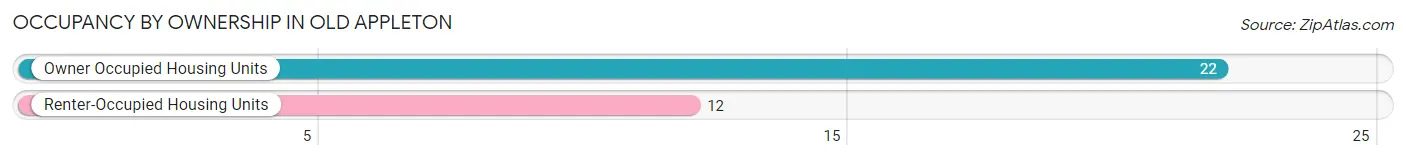
| Occupancy | # Housing Units | % Housing Units |
| Owner Occupied Housing Units | 22 | 64.7% |
| Renter-Occupied Housing Units | 12 | 35.3% |
| Total Occupied Housing Units | 34 | 100.0% |
Occupancy by Household Size in Old Appleton
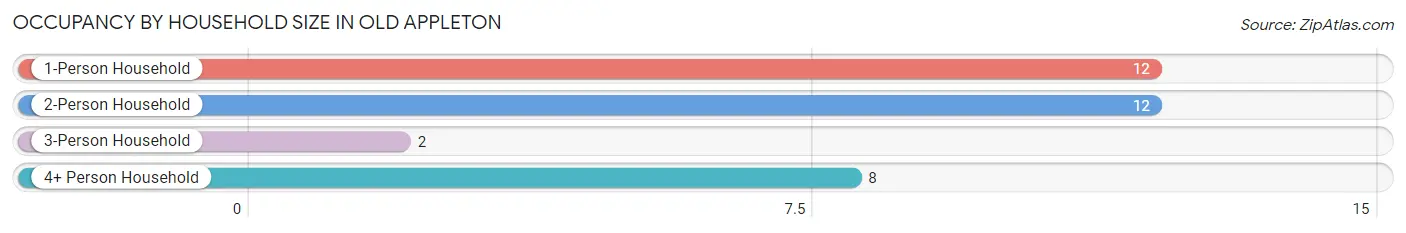
| Household Size | # Housing Units | % Housing Units |
| 1-Person Household | 12 | 35.3% |
| 2-Person Household | 12 | 35.3% |
| 3-Person Household | 2 | 5.9% |
| 4+ Person Household | 8 | 23.5% |
| Total Housing Units | 34 | 100.0% |
Occupancy by Ownership by Household Size in Old Appleton
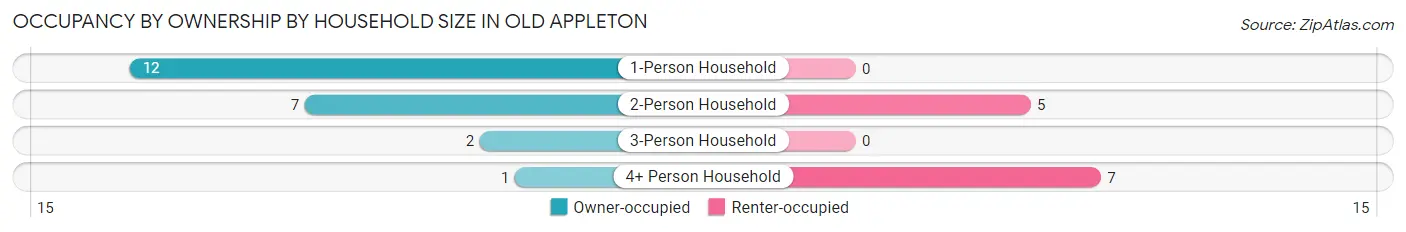
| Household Size | Owner-occupied | Renter-occupied |
| 1-Person Household | 12 (100.0%) | 0 (0.0%) |
| 2-Person Household | 7 (58.3%) | 5 (41.7%) |
| 3-Person Household | 2 (100.0%) | 0 (0.0%) |
| 4+ Person Household | 1 (12.5%) | 7 (87.5%) |
| Total Housing Units | 22 (64.7%) | 12 (35.3%) |
Occupancy by Educational Attainment in Old Appleton
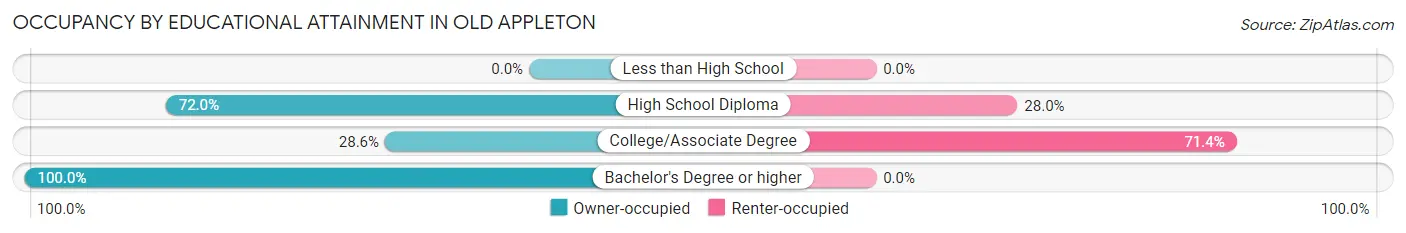
| Household Size | Owner-occupied | Renter-occupied |
| Less than High School | 0 (0.0%) | 0 (0.0%) |
| High School Diploma | 18 (72.0%) | 7 (28.0%) |
| College/Associate Degree | 2 (28.6%) | 5 (71.4%) |
| Bachelor's Degree or higher | 2 (100.0%) | 0 (0.0%) |
Occupancy by Age of Householder in Old Appleton
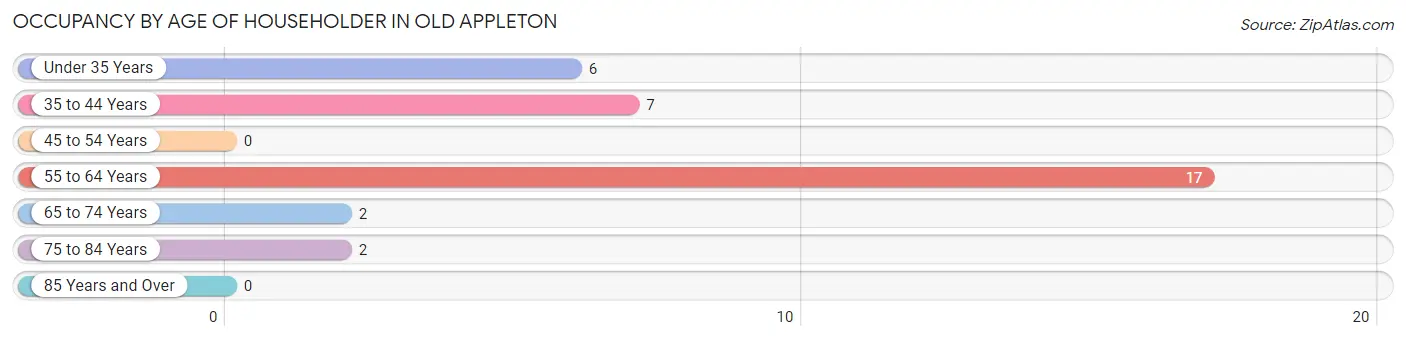
| Age Bracket | # Households | % Households |
| Under 35 Years | 6 | 17.6% |
| 35 to 44 Years | 7 | 20.6% |
| 45 to 54 Years | 0 | 0.0% |
| 55 to 64 Years | 17 | 50.0% |
| 65 to 74 Years | 2 | 5.9% |
| 75 to 84 Years | 2 | 5.9% |
| 85 Years and Over | 0 | 0.0% |
| Total | 34 | 100.0% |
Housing Finances in Old Appleton
Median Income by Occupancy in Old Appleton
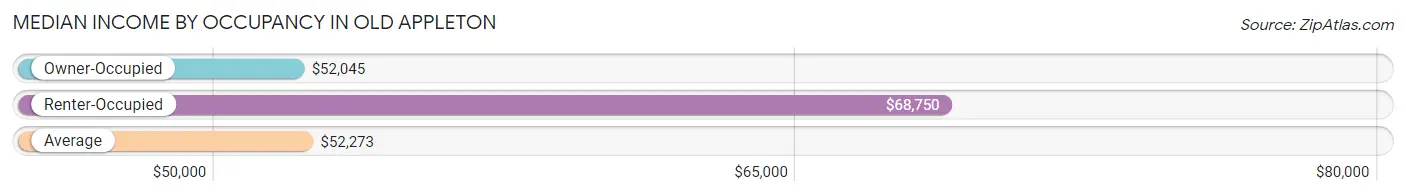
| Occupancy Type | # Households | Median Income |
| Owner-Occupied | 22 (64.7%) | $52,045 |
| Renter-Occupied | 12 (35.3%) | $68,750 |
| Average | 34 (100.0%) | $52,273 |
Occupancy by Householder Income Bracket in Old Appleton
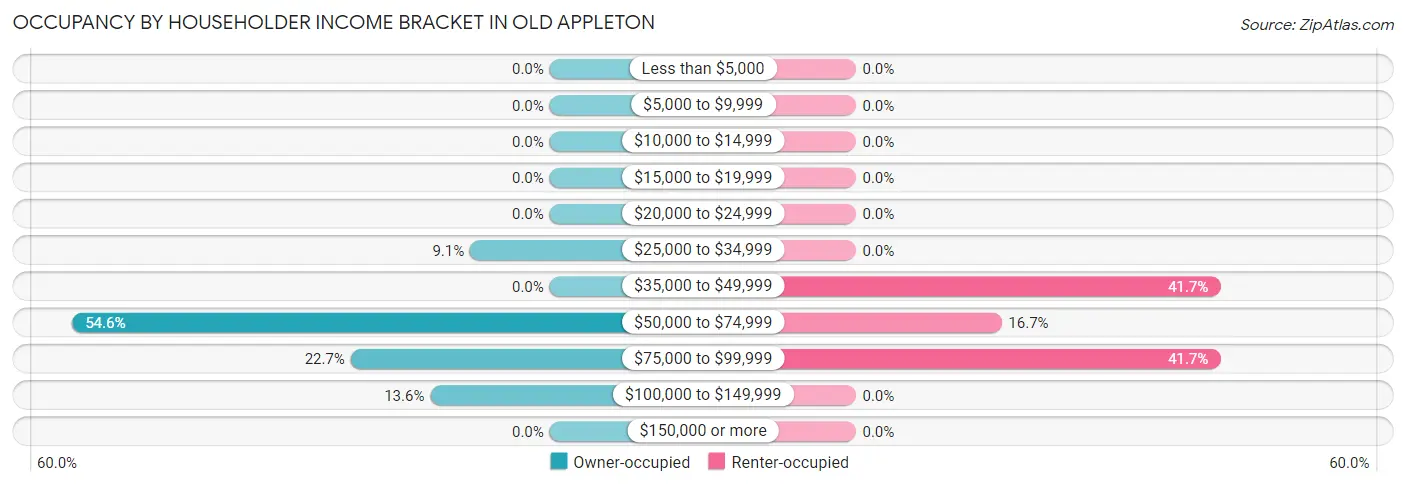
| Income Bracket | Owner-occupied | Renter-occupied |
| Less than $5,000 | 0 (0.0%) | 0 (0.0%) |
| $5,000 to $9,999 | 0 (0.0%) | 0 (0.0%) |
| $10,000 to $14,999 | 0 (0.0%) | 0 (0.0%) |
| $15,000 to $19,999 | 0 (0.0%) | 0 (0.0%) |
| $20,000 to $24,999 | 0 (0.0%) | 0 (0.0%) |
| $25,000 to $34,999 | 2 (9.1%) | 0 (0.0%) |
| $35,000 to $49,999 | 0 (0.0%) | 5 (41.7%) |
| $50,000 to $74,999 | 12 (54.5%) | 2 (16.7%) |
| $75,000 to $99,999 | 5 (22.7%) | 5 (41.7%) |
| $100,000 to $149,999 | 3 (13.6%) | 0 (0.0%) |
| $150,000 or more | 0 (0.0%) | 0 (0.0%) |
| Total | 22 (100.0%) | 12 (100.0%) |
Monthly Housing Cost Tiers in Old Appleton
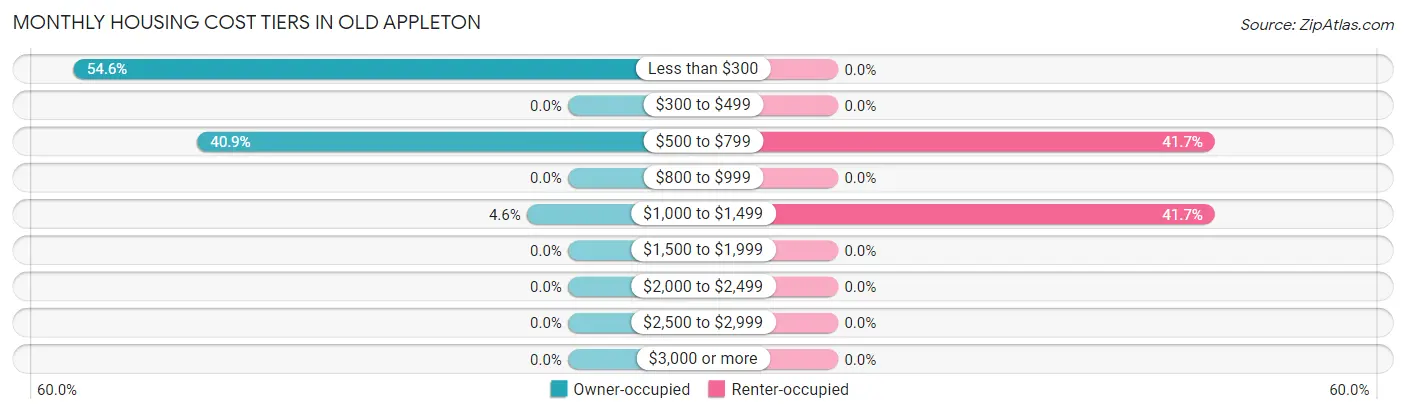
| Monthly Cost | Owner-occupied | Renter-occupied |
| Less than $300 | 12 (54.5%) | 0 (0.0%) |
| $300 to $499 | 0 (0.0%) | 0 (0.0%) |
| $500 to $799 | 9 (40.9%) | 5 (41.7%) |
| $800 to $999 | 0 (0.0%) | 0 (0.0%) |
| $1,000 to $1,499 | 1 (4.5%) | 5 (41.7%) |
| $1,500 to $1,999 | 0 (0.0%) | 0 (0.0%) |
| $2,000 to $2,499 | 0 (0.0%) | 0 (0.0%) |
| $2,500 to $2,999 | 0 (0.0%) | 0 (0.0%) |
| $3,000 or more | 0 (0.0%) | 0 (0.0%) |
| Total | 22 (100.0%) | 12 (100.0%) |
Physical Housing Characteristics in Old Appleton
Housing Structures in Old Appleton
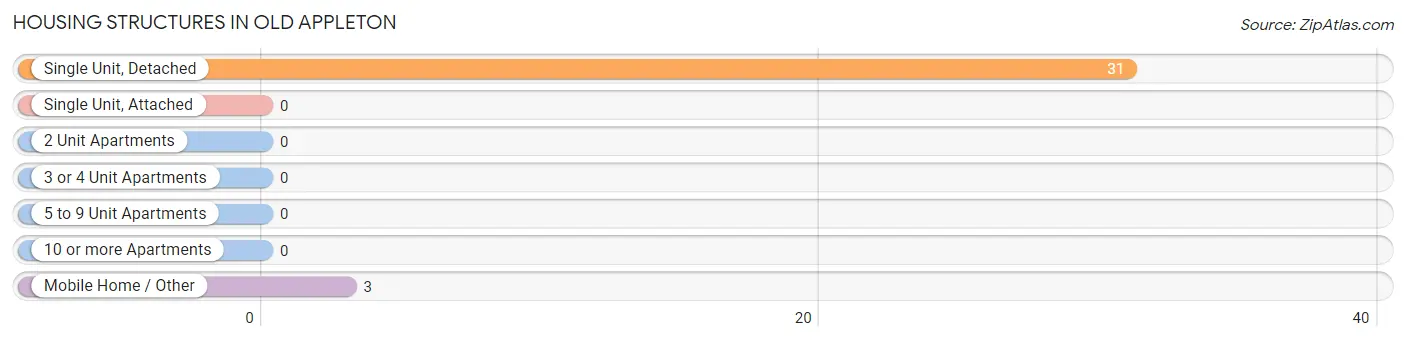
| Structure Type | # Housing Units | % Housing Units |
| Single Unit, Detached | 31 | 91.2% |
| Single Unit, Attached | 0 | 0.0% |
| 2 Unit Apartments | 0 | 0.0% |
| 3 or 4 Unit Apartments | 0 | 0.0% |
| 5 to 9 Unit Apartments | 0 | 0.0% |
| 10 or more Apartments | 0 | 0.0% |
| Mobile Home / Other | 3 | 8.8% |
| Total | 34 | 100.0% |
Housing Structures by Occupancy in Old Appleton
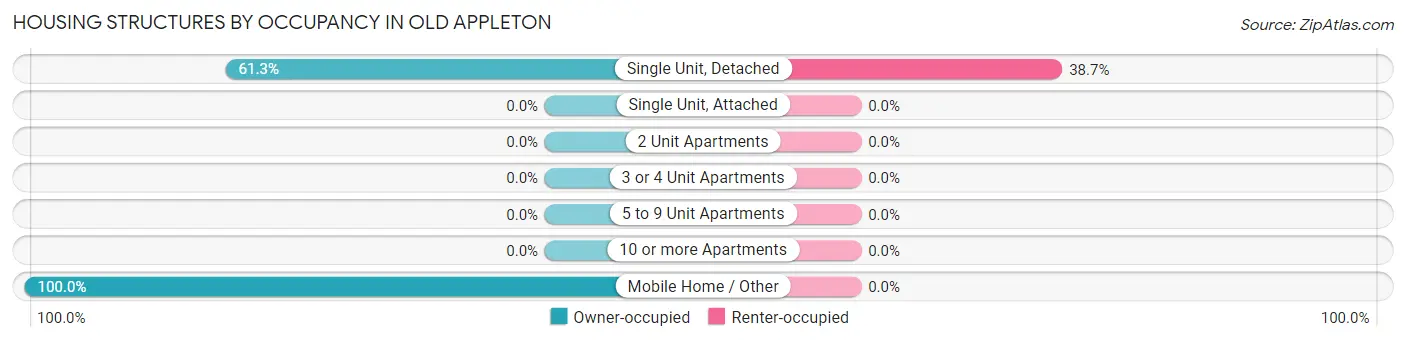
| Structure Type | Owner-occupied | Renter-occupied |
| Single Unit, Detached | 19 (61.3%) | 12 (38.7%) |
| Single Unit, Attached | 0 (0.0%) | 0 (0.0%) |
| 2 Unit Apartments | 0 (0.0%) | 0 (0.0%) |
| 3 or 4 Unit Apartments | 0 (0.0%) | 0 (0.0%) |
| 5 to 9 Unit Apartments | 0 (0.0%) | 0 (0.0%) |
| 10 or more Apartments | 0 (0.0%) | 0 (0.0%) |
| Mobile Home / Other | 3 (100.0%) | 0 (0.0%) |
| Total | 22 (64.7%) | 12 (35.3%) |
Housing Structures by Number of Rooms in Old Appleton
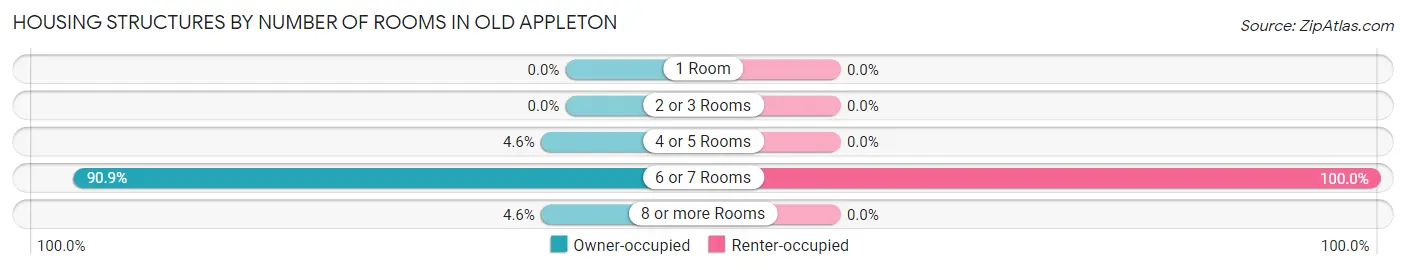
| Number of Rooms | Owner-occupied | Renter-occupied |
| 1 Room | 0 (0.0%) | 0 (0.0%) |
| 2 or 3 Rooms | 0 (0.0%) | 0 (0.0%) |
| 4 or 5 Rooms | 1 (4.5%) | 0 (0.0%) |
| 6 or 7 Rooms | 20 (90.9%) | 12 (100.0%) |
| 8 or more Rooms | 1 (4.5%) | 0 (0.0%) |
| Total | 22 (100.0%) | 12 (100.0%) |
Housing Structure by Heating Type in Old Appleton
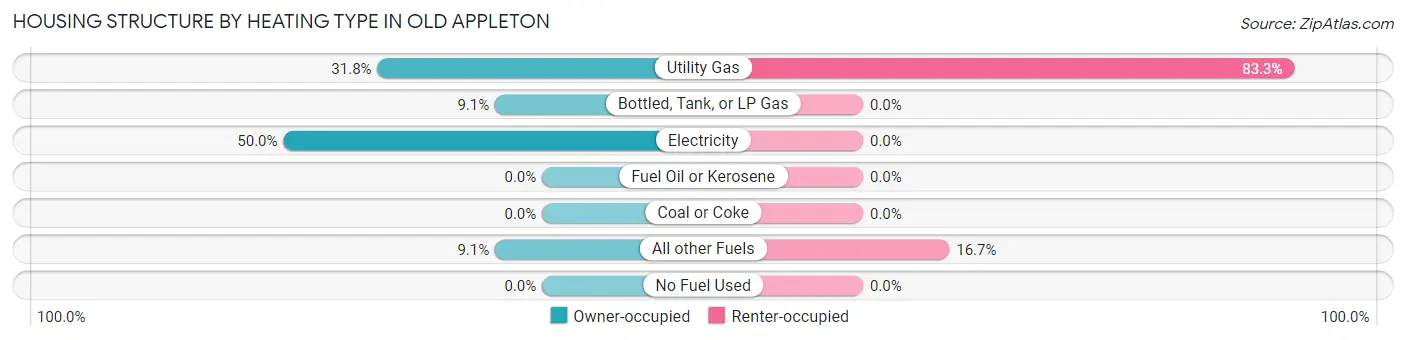
| Heating Type | Owner-occupied | Renter-occupied |
| Utility Gas | 7 (31.8%) | 10 (83.3%) |
| Bottled, Tank, or LP Gas | 2 (9.1%) | 0 (0.0%) |
| Electricity | 11 (50.0%) | 0 (0.0%) |
| Fuel Oil or Kerosene | 0 (0.0%) | 0 (0.0%) |
| Coal or Coke | 0 (0.0%) | 0 (0.0%) |
| All other Fuels | 2 (9.1%) | 2 (16.7%) |
| No Fuel Used | 0 (0.0%) | 0 (0.0%) |
| Total | 22 (100.0%) | 12 (100.0%) |
Household Vehicle Usage in Old Appleton
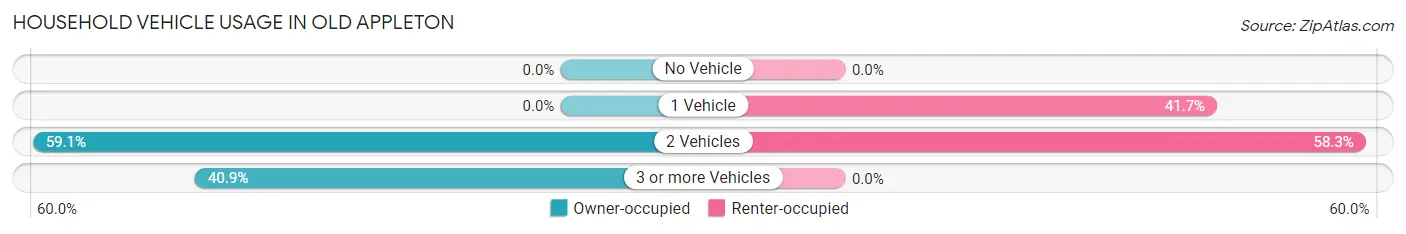
| Vehicles per Household | Owner-occupied | Renter-occupied |
| No Vehicle | 0 (0.0%) | 0 (0.0%) |
| 1 Vehicle | 0 (0.0%) | 5 (41.7%) |
| 2 Vehicles | 13 (59.1%) | 7 (58.3%) |
| 3 or more Vehicles | 9 (40.9%) | 0 (0.0%) |
| Total | 22 (100.0%) | 12 (100.0%) |
Real Estate & Mortgages in Old Appleton
Real Estate and Mortgage Overview in Old Appleton
| Characteristic | Without Mortgage | With Mortgage |
| Housing Units | 14 | 8 |
| Median Property Value | $77,000 | $108,300 |
| Median Household Income | $51,250 | $0 |
| Monthly Housing Costs | - | - |
| Real Estate Taxes | $517 | $1 |
Property Value by Mortgage Status in Old Appleton
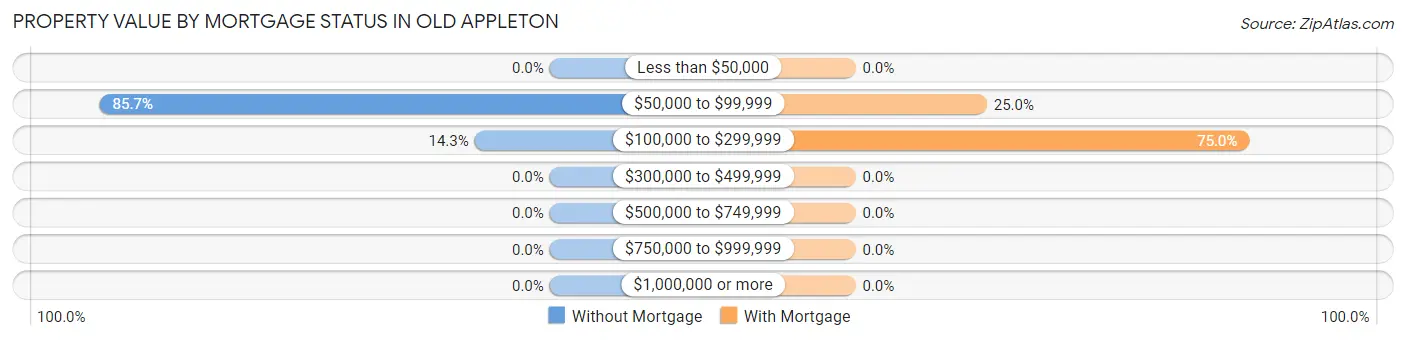
| Property Value | Without Mortgage | With Mortgage |
| Less than $50,000 | 0 (0.0%) | 0 (0.0%) |
| $50,000 to $99,999 | 12 (85.7%) | 2 (25.0%) |
| $100,000 to $299,999 | 2 (14.3%) | 6 (75.0%) |
| $300,000 to $499,999 | 0 (0.0%) | 0 (0.0%) |
| $500,000 to $749,999 | 0 (0.0%) | 0 (0.0%) |
| $750,000 to $999,999 | 0 (0.0%) | 0 (0.0%) |
| $1,000,000 or more | 0 (0.0%) | 0 (0.0%) |
| Total | 14 (100.0%) | 8 (100.0%) |
Household Income by Mortgage Status in Old Appleton
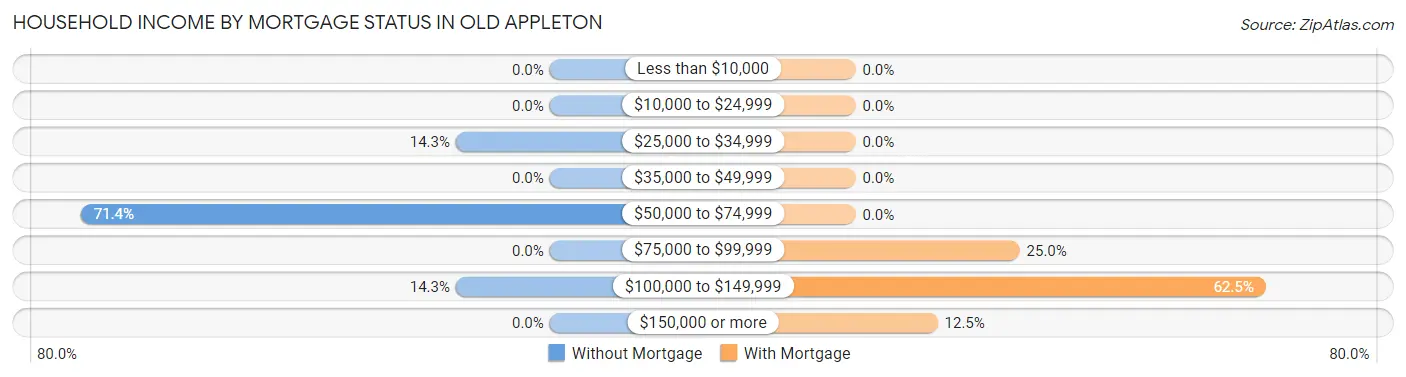
| Household Income | Without Mortgage | With Mortgage |
| Less than $10,000 | 0 (0.0%) | 0 (0.0%) |
| $10,000 to $24,999 | 0 (0.0%) | 0 (0.0%) |
| $25,000 to $34,999 | 2 (14.3%) | 0 (0.0%) |
| $35,000 to $49,999 | 0 (0.0%) | 0 (0.0%) |
| $50,000 to $74,999 | 10 (71.4%) | 0 (0.0%) |
| $75,000 to $99,999 | 0 (0.0%) | 2 (25.0%) |
| $100,000 to $149,999 | 2 (14.3%) | 5 (62.5%) |
| $150,000 or more | 0 (0.0%) | 1 (12.5%) |
| Total | 14 (100.0%) | 8 (100.0%) |
Property Value to Household Income Ratio in Old Appleton
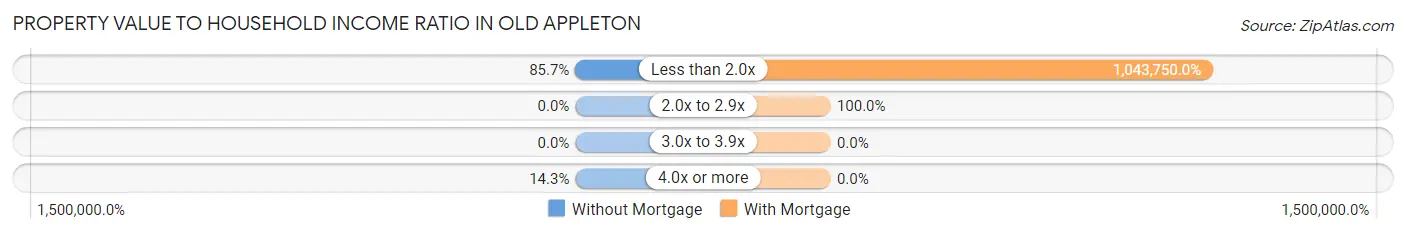
| Value-to-Income Ratio | Without Mortgage | With Mortgage |
| Less than 2.0x | 12 (85.7%) | 83,500 (1,043,750.0%) |
| 2.0x to 2.9x | 0 (0.0%) | 8 (100.0%) |
| 3.0x to 3.9x | 0 (0.0%) | 0 (0.0%) |
| 4.0x or more | 2 (14.3%) | 0 (0.0%) |
| Total | 14 (100.0%) | 8 (100.0%) |
Real Estate Taxes by Mortgage Status in Old Appleton
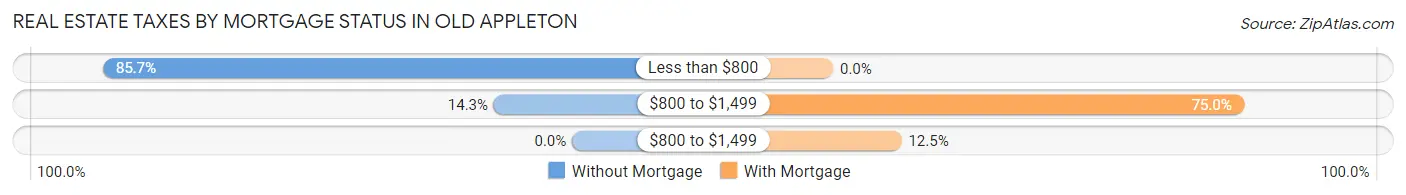
| Property Taxes | Without Mortgage | With Mortgage |
| Less than $800 | 12 (85.7%) | 0 (0.0%) |
| $800 to $1,499 | 2 (14.3%) | 6 (75.0%) |
| $800 to $1,499 | 0 (0.0%) | 1 (12.5%) |
| Total | 14 (100.0%) | 8 (100.0%) |
Health & Disability in Old Appleton
Health Insurance Coverage by Age in Old Appleton
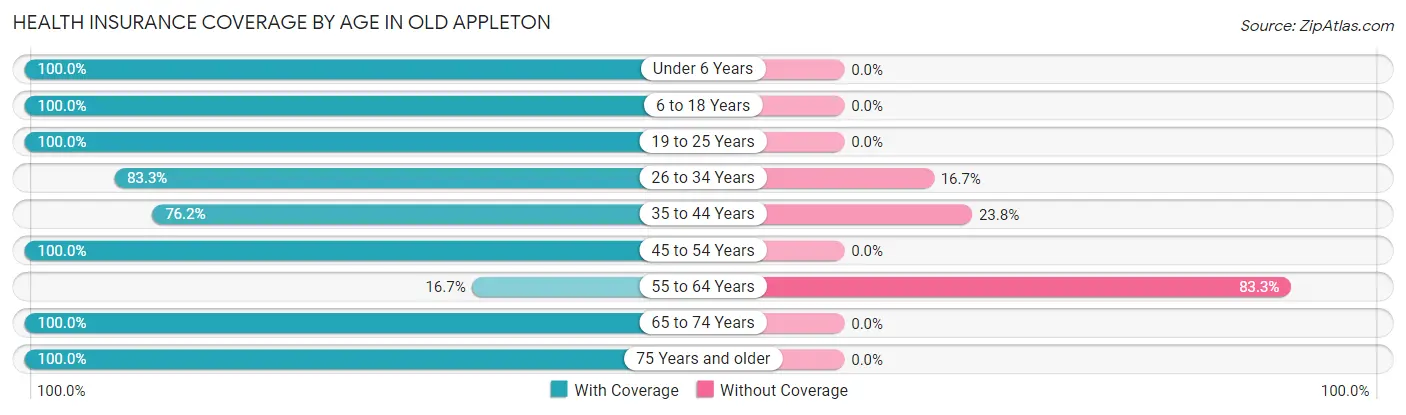
| Age Bracket | With Coverage | Without Coverage |
| Under 6 Years | 12 (100.0%) | 0 (0.0%) |
| 6 to 18 Years | 11 (100.0%) | 0 (0.0%) |
| 19 to 25 Years | 5 (100.0%) | 0 (0.0%) |
| 26 to 34 Years | 5 (83.3%) | 1 (16.7%) |
| 35 to 44 Years | 16 (76.2%) | 5 (23.8%) |
| 45 to 54 Years | 6 (100.0%) | 0 (0.0%) |
| 55 to 64 Years | 3 (16.7%) | 15 (83.3%) |
| 65 to 74 Years | 4 (100.0%) | 0 (0.0%) |
| 75 Years and older | 2 (100.0%) | 0 (0.0%) |
| Total | 64 (75.3%) | 21 (24.7%) |
Health Insurance Coverage by Citizenship Status in Old Appleton
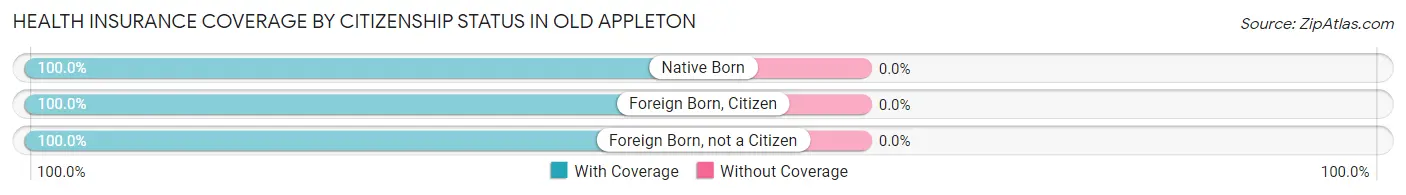
| Citizenship Status | With Coverage | Without Coverage |
| Native Born | 12 (100.0%) | 0 (0.0%) |
| Foreign Born, Citizen | 11 (100.0%) | 0 (0.0%) |
| Foreign Born, not a Citizen | 5 (100.0%) | 0 (0.0%) |
Health Insurance Coverage by Household Income in Old Appleton
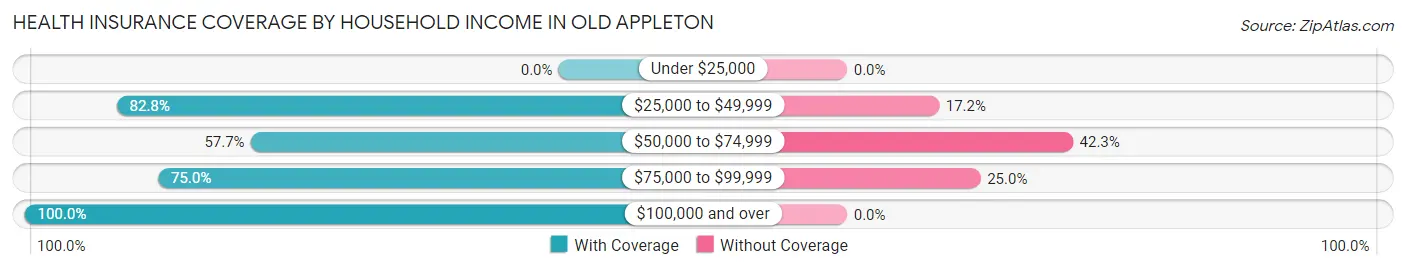
| Household Income | With Coverage | Without Coverage |
| Under $25,000 | 0 (0.0%) | 0 (0.0%) |
| $25,000 to $49,999 | 24 (82.8%) | 5 (17.2%) |
| $50,000 to $74,999 | 15 (57.7%) | 11 (42.3%) |
| $75,000 to $99,999 | 15 (75.0%) | 5 (25.0%) |
| $100,000 and over | 10 (100.0%) | 0 (0.0%) |
Public vs Private Health Insurance Coverage by Age in Old Appleton
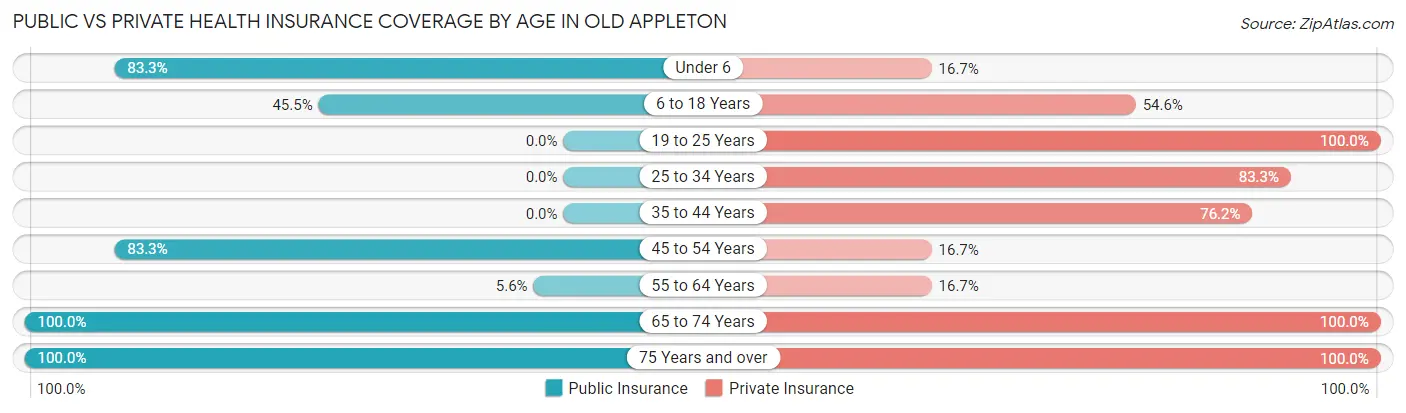
| Age Bracket | Public Insurance | Private Insurance |
| Under 6 | 10 (83.3%) | 2 (16.7%) |
| 6 to 18 Years | 5 (45.5%) | 6 (54.5%) |
| 19 to 25 Years | 0 (0.0%) | 5 (100.0%) |
| 25 to 34 Years | 0 (0.0%) | 5 (83.3%) |
| 35 to 44 Years | 0 (0.0%) | 16 (76.2%) |
| 45 to 54 Years | 5 (83.3%) | 1 (16.7%) |
| 55 to 64 Years | 1 (5.6%) | 3 (16.7%) |
| 65 to 74 Years | 4 (100.0%) | 4 (100.0%) |
| 75 Years and over | 2 (100.0%) | 2 (100.0%) |
| Total | 27 (31.8%) | 44 (51.8%) |
Disability Status by Sex by Age in Old Appleton
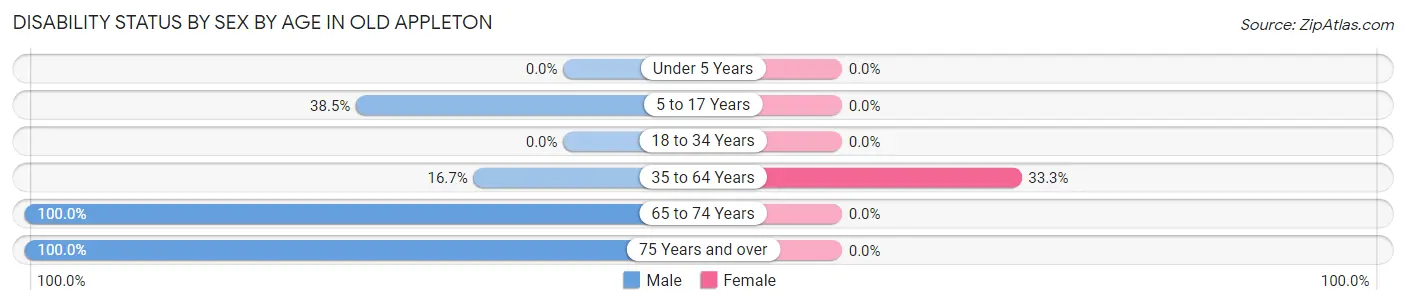
| Age Bracket | Male | Female |
| Under 5 Years | 0 (0.0%) | 0 (0.0%) |
| 5 to 17 Years | 5 (38.5%) | 0 (0.0%) |
| 18 to 34 Years | 0 (0.0%) | 0 (0.0%) |
| 35 to 64 Years | 5 (16.7%) | 5 (33.3%) |
| 65 to 74 Years | 2 (100.0%) | 0 (0.0%) |
| 75 Years and over | 2 (100.0%) | 0 (0.0%) |
Disability Class by Sex by Age in Old Appleton
Disability Class: Hearing Difficulty
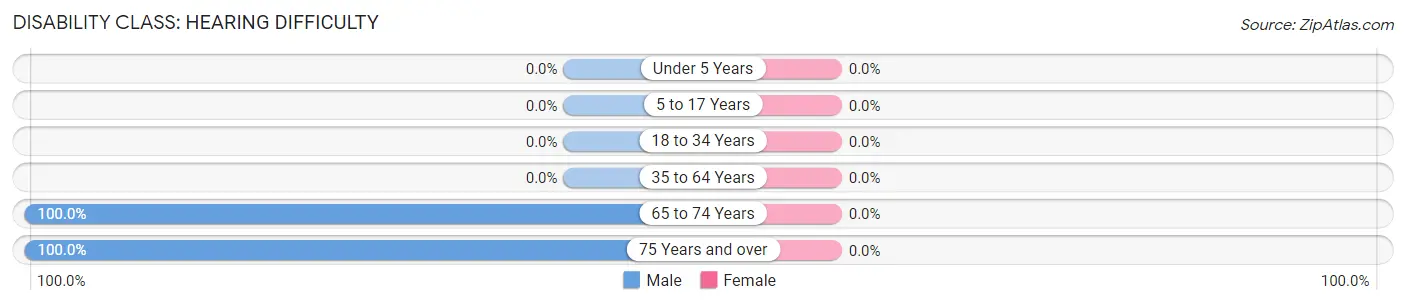
| Age Bracket | Male | Female |
| Under 5 Years | 0 (0.0%) | 0 (0.0%) |
| 5 to 17 Years | 0 (0.0%) | 0 (0.0%) |
| 18 to 34 Years | 0 (0.0%) | 0 (0.0%) |
| 35 to 64 Years | 0 (0.0%) | 0 (0.0%) |
| 65 to 74 Years | 2 (100.0%) | 0 (0.0%) |
| 75 Years and over | 2 (100.0%) | 0 (0.0%) |
Disability Class: Vision Difficulty
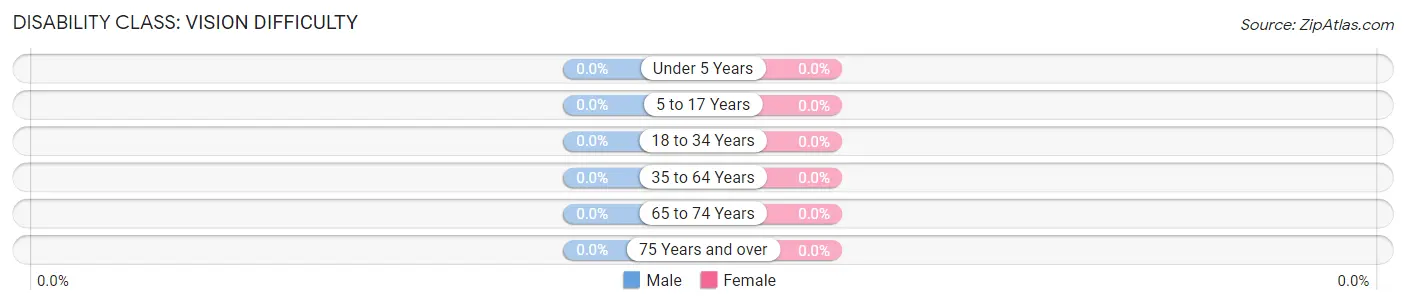
| Age Bracket | Male | Female |
| Under 5 Years | 0 (0.0%) | 0 (0.0%) |
| 5 to 17 Years | 0 (0.0%) | 0 (0.0%) |
| 18 to 34 Years | 0 (0.0%) | 0 (0.0%) |
| 35 to 64 Years | 0 (0.0%) | 0 (0.0%) |
| 65 to 74 Years | 0 (0.0%) | 0 (0.0%) |
| 75 Years and over | 0 (0.0%) | 0 (0.0%) |
Disability Class: Cognitive Difficulty
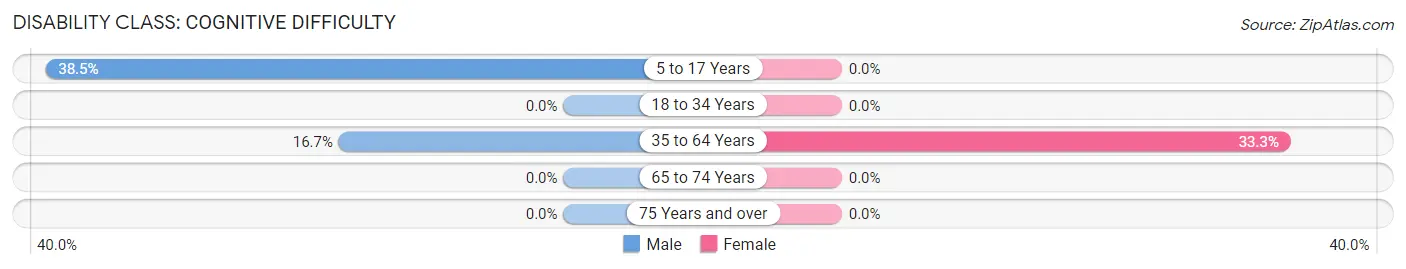
| Age Bracket | Male | Female |
| 5 to 17 Years | 5 (38.5%) | 0 (0.0%) |
| 18 to 34 Years | 0 (0.0%) | 0 (0.0%) |
| 35 to 64 Years | 5 (16.7%) | 5 (33.3%) |
| 65 to 74 Years | 0 (0.0%) | 0 (0.0%) |
| 75 Years and over | 0 (0.0%) | 0 (0.0%) |
Disability Class: Ambulatory Difficulty
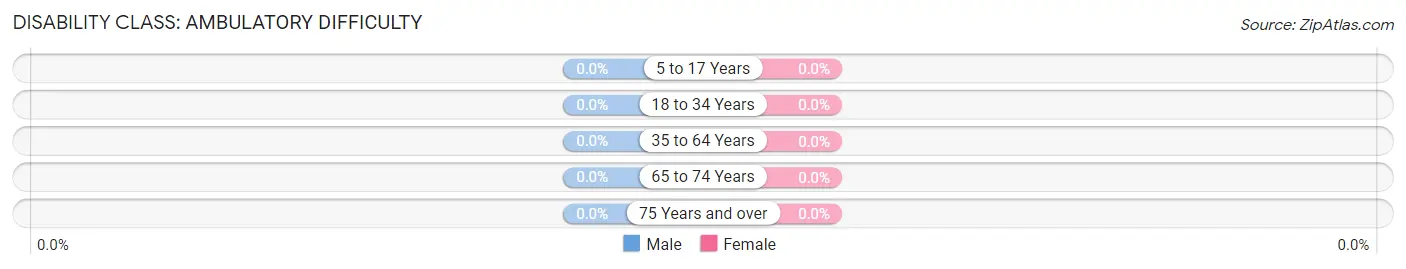
| Age Bracket | Male | Female |
| 5 to 17 Years | 0 (0.0%) | 0 (0.0%) |
| 18 to 34 Years | 0 (0.0%) | 0 (0.0%) |
| 35 to 64 Years | 0 (0.0%) | 0 (0.0%) |
| 65 to 74 Years | 0 (0.0%) | 0 (0.0%) |
| 75 Years and over | 0 (0.0%) | 0 (0.0%) |
Disability Class: Self-Care Difficulty
| Age Bracket | Male | Female |
| 5 to 17 Years | 0 (0.0%) | 0 (0.0%) |
| 18 to 34 Years | 0 (0.0%) | 0 (0.0%) |
| 35 to 64 Years | 0 (0.0%) | 0 (0.0%) |
| 65 to 74 Years | 0 (0.0%) | 0 (0.0%) |
| 75 Years and over | 0 (0.0%) | 0 (0.0%) |
Technology Access in Old Appleton
Computing Device Access in Old Appleton
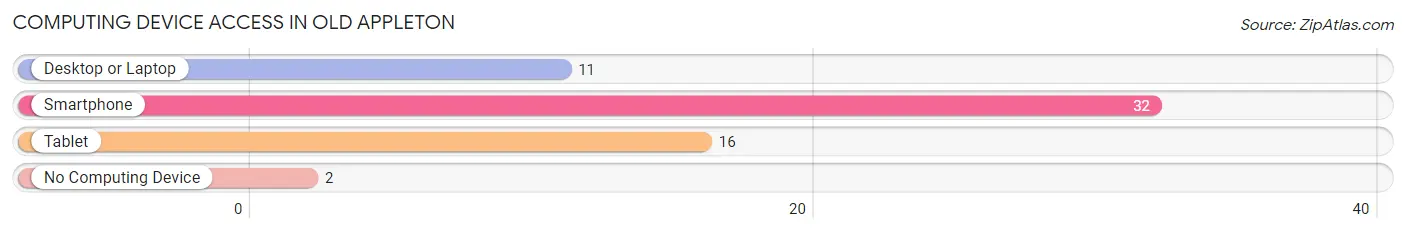
| Device Type | # Households | % Households |
| Desktop or Laptop | 11 | 32.4% |
| Smartphone | 32 | 94.1% |
| Tablet | 16 | 47.1% |
| No Computing Device | 2 | 5.9% |
| Total | 34 | 100.0% |
Internet Access in Old Appleton
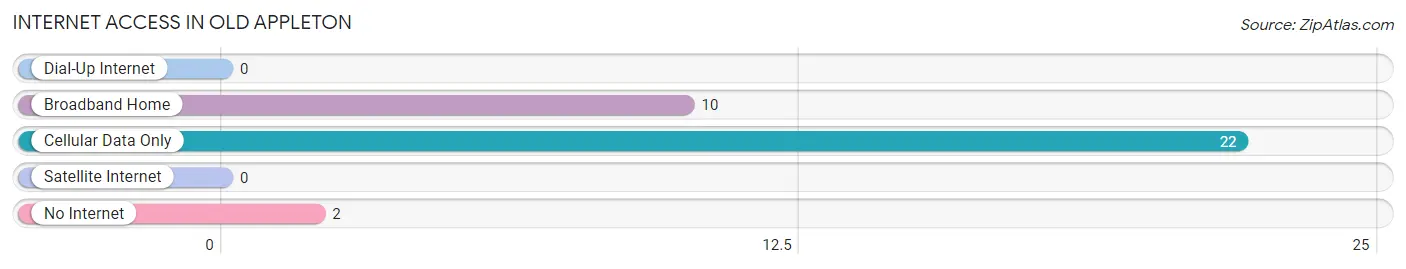
| Internet Type | # Households | % Households |
| Dial-Up Internet | 0 | 0.0% |
| Broadband Home | 10 | 29.4% |
| Cellular Data Only | 22 | 64.7% |
| Satellite Internet | 0 | 0.0% |
| No Internet | 2 | 5.9% |
| Total | 34 | 100.0% |
Old Appleton Summary
Appleton, Missouri is a small town located in Cape Girardeau County, in the southeastern corner of the state. It is situated on the banks of the Mississippi River, just south of the city of Cape Girardeau. The town was founded in 1837 and has a population of just over 1,000 people.
History
The town of Appleton was founded in 1837 by a group of settlers from the nearby town of Jackson. The settlers were looking for a place to settle and start a new life, and they chose the area around Appleton because of its proximity to the Mississippi River. The town was named after the Appleton family, who were among the first settlers.
The town quickly grew and prospered, and by the late 1800s it had become a thriving river port. The town was home to several businesses, including a sawmill, a grist mill, a blacksmith shop, and a general store. The town also had a school, a post office, and a church.
In the early 1900s, the town began to decline as the river trade shifted to larger cities. The town's population began to dwindle, and by the 1950s it had become a small, quiet community.
Geography
Appleton is located in the southeastern corner of Missouri, on the banks of the Mississippi River. The town is situated on the western edge of the Ozark Plateau, and is surrounded by rolling hills and forests. The town is located about 20 miles south of the city of Cape Girardeau, and is about an hour and a half drive from St. Louis.
The town is located in a humid subtropical climate zone, and experiences hot, humid summers and mild winters. The average annual temperature is around 60 degrees Fahrenheit, and the average annual precipitation is around 40 inches.
Economy
The economy of Appleton is largely based on agriculture and tourism. The town is home to several farms, which produce a variety of crops, including corn, soybeans, wheat, and hay. The town is also home to several wineries, which produce a variety of wines.
The town is also a popular tourist destination, and is home to several attractions, including the Appleton Museum of History, the Appleton Riverwalk, and the Appleton Wildlife Refuge. The town is also home to several restaurants, shops, and other businesses.
Demographics
As of the 2010 census, the population of Appleton was 1,072. The town is predominantly white, with a small African American population. The median household income is around $35,000, and the median home value is around $90,000. The town has a high rate of poverty, with around 25% of the population living below the poverty line.
Appleton is a small, quiet town with a rich history and a strong sense of community. The town is home to a variety of businesses and attractions, and is a popular tourist destination. The town is also home to a diverse population, and is a great place to live and work.
Common Questions
What is Per Capita Income in Old Appleton?
Per Capita income in Old Appleton is $26,565.
What is the Median Family Income in Old Appleton?
Median Family Income in Old Appleton is $68,125.
What is the Median Household income in Old Appleton?
Median Household Income in Old Appleton is $52,273.
What is Inequality or Gini Index in Old Appleton?
Inequality or Gini Index in Old Appleton is 0.18.
What is the Total Population of Old Appleton?
Total Population of Old Appleton is 85.
What is the Total Male Population of Old Appleton?
Total Male Population of Old Appleton is 58.
What is the Total Female Population of Old Appleton?
Total Female Population of Old Appleton is 27.
What is the Ratio of Males per 100 Females in Old Appleton?
There are 214.81 Males per 100 Females in Old Appleton.
What is the Ratio of Females per 100 Males in Old Appleton?
There are 46.55 Females per 100 Males in Old Appleton.
What is the Median Population Age in Old Appleton?
Median Population Age in Old Appleton is 37.3 Years.
What is the Average Family Size in Old Appleton
Average Family Size in Old Appleton is 3.7 People.
What is the Average Household Size in Old Appleton
Average Household Size in Old Appleton is 2.5 People.
How Large is the Labor Force in Old Appleton?
There are 51 People in the Labor Forcein in Old Appleton.
What is the Percentage of People in the Labor Force in Old Appleton?
77.3% of People are in the Labor Force in Old Appleton.