Parkway, MO Map & Demographics
Parkway Map
Parkway Overview
$23,675
PER CAPITA INCOME
$62,344
AVG FAMILY INCOME
$45,227
AVG HOUSEHOLD INCOME
31.0%
WAGE / INCOME GAP [ % ]
69.0¢/ $1
WAGE / INCOME GAP [ $ ]
0.43
INEQUALITY / GINI INDEX
766
TOTAL POPULATION
347
MALE POPULATION
419
FEMALE POPULATION
82.82
MALES / 100 FEMALES
120.75
FEMALES / 100 MALES
34.2
MEDIAN AGE
3.2
AVG FAMILY SIZE
2.4
AVG HOUSEHOLD SIZE
359
LABOR FORCE [ PEOPLE ]
60.7%
PERCENT IN LABOR FORCE
8.1%
UNEMPLOYMENT RATE
Income in Parkway
Income Overview in Parkway
Per Capita Income in Parkway is $23,675, while median incomes of families and households are $62,344 and $45,227 respectively.
| Characteristic | Number | Measure |
| Per Capita Income | 766 | $23,675 |
| Median Family Income | 167 | $62,344 |
| Mean Family Income | 167 | $72,817 |
| Median Household Income | 294 | $45,227 |
| Mean Household Income | 294 | $58,011 |
| Income Deficit | 167 | $0 |
| Wage / Income Gap (%) | 766 | 31.02% |
| Wage / Income Gap ($) | 766 | 68.98¢ per $1 |
| Gini / Inequality Index | 766 | 0.43 |
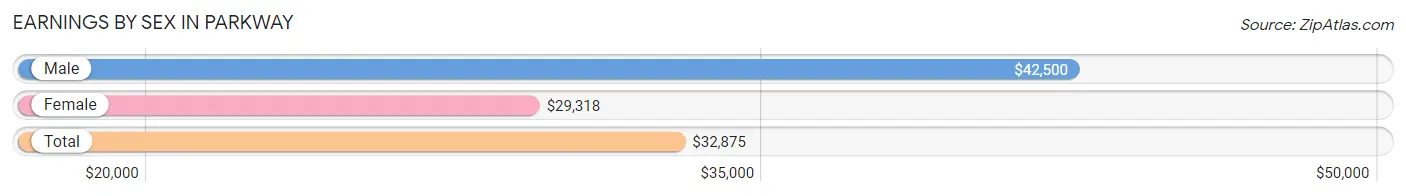
Earnings by Sex in Parkway
Average Earnings in Parkway are $32,875, $42,500 for men and $29,318 for women, a difference of 31.0%.
| Sex | Number | Average Earnings |
| Male | 180 (51.4%) | $42,500 |
| Female | 170 (48.6%) | $29,318 |
| Total | 350 (100.0%) | $32,875 |
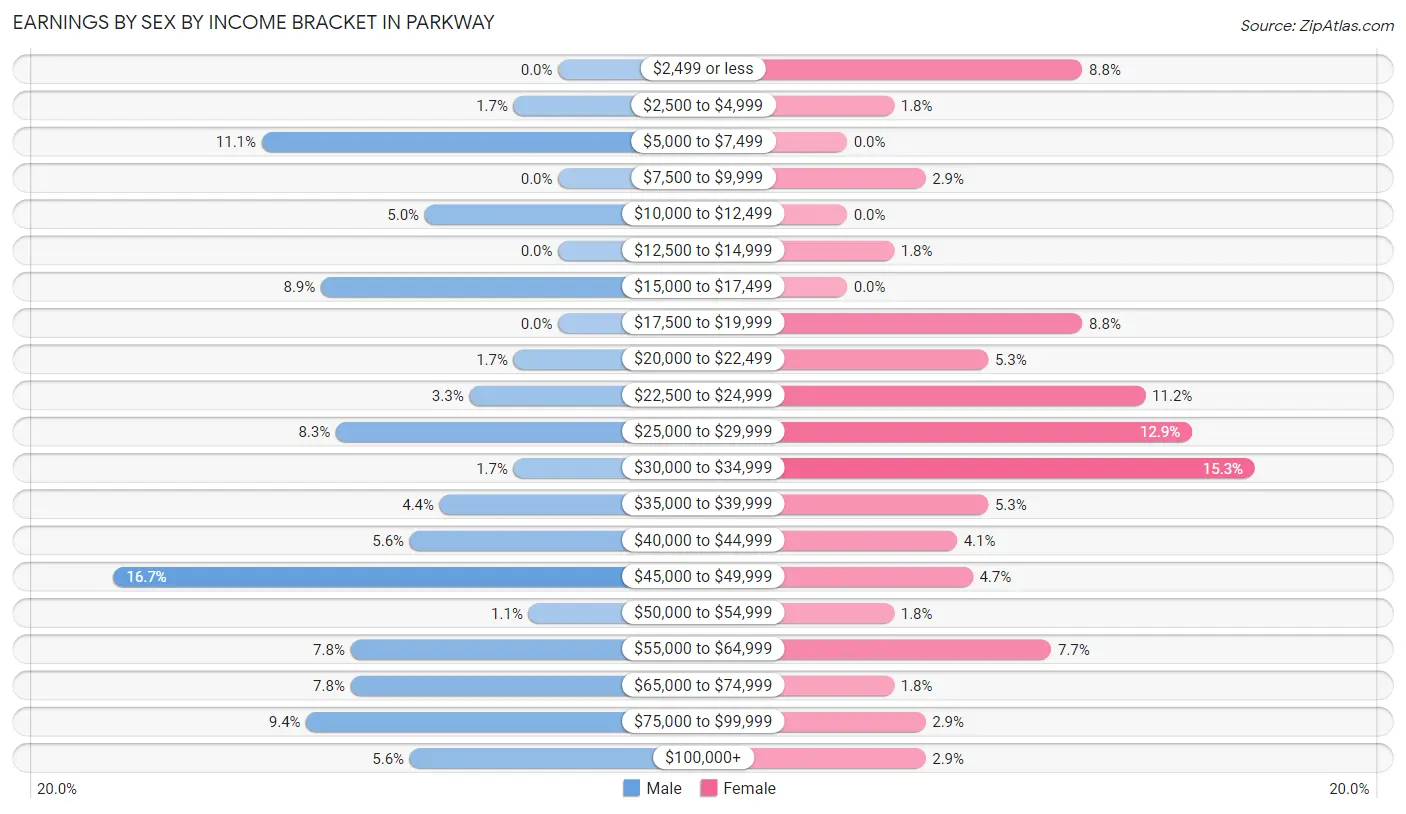
Earnings by Sex by Income Bracket in Parkway
The most common earnings brackets in Parkway are $45,000 to $49,999 for men (30 | 16.7%) and $30,000 to $34,999 for women (26 | 15.3%).
| Income | Male | Female |
| $2,499 or less | 0 (0.0%) | 15 (8.8%) |
| $2,500 to $4,999 | 3 (1.7%) | 3 (1.8%) |
| $5,000 to $7,499 | 20 (11.1%) | 0 (0.0%) |
| $7,500 to $9,999 | 0 (0.0%) | 5 (2.9%) |
| $10,000 to $12,499 | 9 (5.0%) | 0 (0.0%) |
| $12,500 to $14,999 | 0 (0.0%) | 3 (1.8%) |
| $15,000 to $17,499 | 16 (8.9%) | 0 (0.0%) |
| $17,500 to $19,999 | 0 (0.0%) | 15 (8.8%) |
| $20,000 to $22,499 | 3 (1.7%) | 9 (5.3%) |
| $22,500 to $24,999 | 6 (3.3%) | 19 (11.2%) |
| $25,000 to $29,999 | 15 (8.3%) | 22 (12.9%) |
| $30,000 to $34,999 | 3 (1.7%) | 26 (15.3%) |
| $35,000 to $39,999 | 8 (4.4%) | 9 (5.3%) |
| $40,000 to $44,999 | 10 (5.6%) | 7 (4.1%) |
| $45,000 to $49,999 | 30 (16.7%) | 8 (4.7%) |
| $50,000 to $54,999 | 2 (1.1%) | 3 (1.8%) |
| $55,000 to $64,999 | 14 (7.8%) | 13 (7.6%) |
| $65,000 to $74,999 | 14 (7.8%) | 3 (1.8%) |
| $75,000 to $99,999 | 17 (9.4%) | 5 (2.9%) |
| $100,000+ | 10 (5.6%) | 5 (2.9%) |
| Total | 180 (100.0%) | 170 (100.0%) |
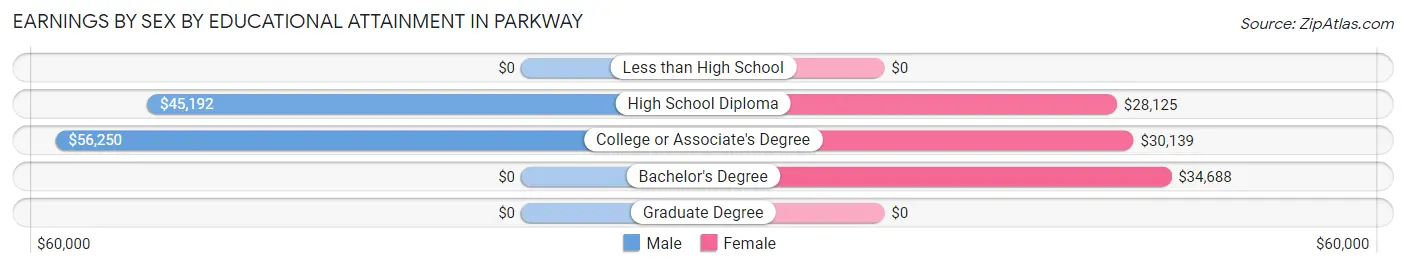
Earnings by Sex by Educational Attainment in Parkway
Average earnings in Parkway are $46,016 for men and $31,111 for women, a difference of 32.4%. Men with an educational attainment of college or associate's degree enjoy the highest average annual earnings of $56,250, while those with high school diploma education earn the least with $45,192. Women with an educational attainment of bachelor's degree earn the most with the average annual earnings of $34,688, while those with high school diploma education have the smallest earnings of $28,125.
| Educational Attainment | Male Income | Female Income |
| Less than High School | - | - |
| High School Diploma | $45,192 | $28,125 |
| College or Associate's Degree | $56,250 | $30,139 |
| Bachelor's Degree | - | - |
| Graduate Degree | - | - |
| Total | $46,016 | $31,111 |
Family Income in Parkway
Family Income Brackets in Parkway
According to the Parkway family income data, there are 36 families falling into the $50,000 to $74,999 income range, which is the most common income bracket and makes up 21.6% of all families. Conversely, the less than $10,000 income bracket is the least frequent group with only 3 families (1.8%) belonging to this category.
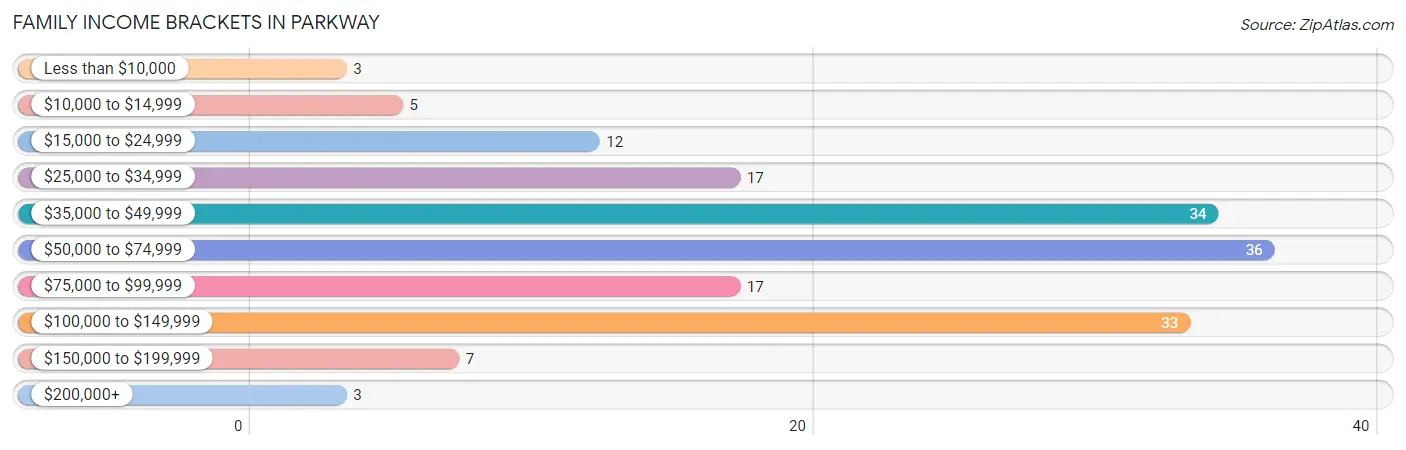
| Income Bracket | # Families | % Families |
| Less than $10,000 | 3 | 1.8% |
| $10,000 to $14,999 | 5 | 3.0% |
| $15,000 to $24,999 | 12 | 7.2% |
| $25,000 to $34,999 | 17 | 10.2% |
| $35,000 to $49,999 | 34 | 20.4% |
| $50,000 to $74,999 | 36 | 21.6% |
| $75,000 to $99,999 | 17 | 10.2% |
| $100,000 to $149,999 | 33 | 19.8% |
| $150,000 to $199,999 | 7 | 4.2% |
| $200,000+ | 3 | 1.8% |
Family Income by Famaliy Size in Parkway
5-person families (19 | 11.4%) account for the highest median family income in Parkway with $111,875 per family, while 2-person families (83 | 49.7%) have the highest median income of $23,021 per family member.
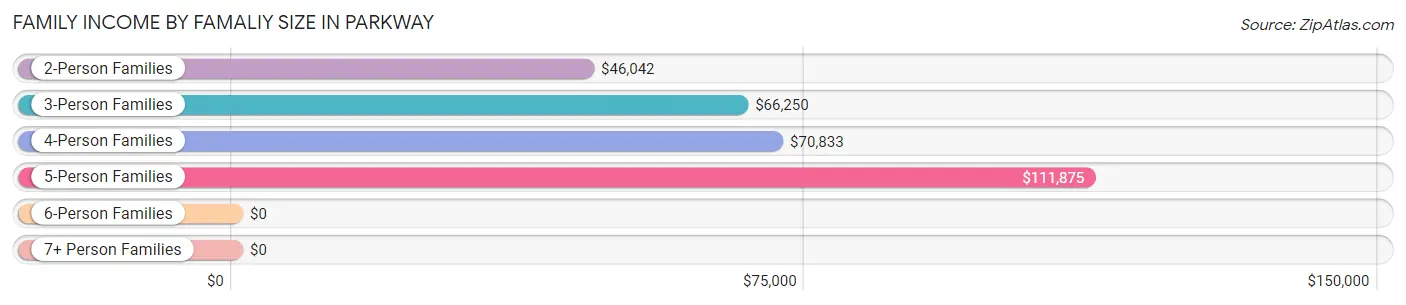
| Income Bracket | # Families | Median Income |
| 2-Person Families | 83 (49.7%) | $46,042 |
| 3-Person Families | 40 (23.9%) | $66,250 |
| 4-Person Families | 14 (8.4%) | $70,833 |
| 5-Person Families | 19 (11.4%) | $111,875 |
| 6-Person Families | 9 (5.4%) | $0 |
| 7+ Person Families | 2 (1.2%) | $0 |
| Total | 167 (100.0%) | $62,344 |
Family Income by Number of Earners in Parkway
The median family income in Parkway is $62,344, with families comprising 3+ earners (12) having the highest median family income of $130,000, while families with no earners (16) have the lowest median family income of $38,750, accounting for 7.2% and 9.6% of families, respectively.
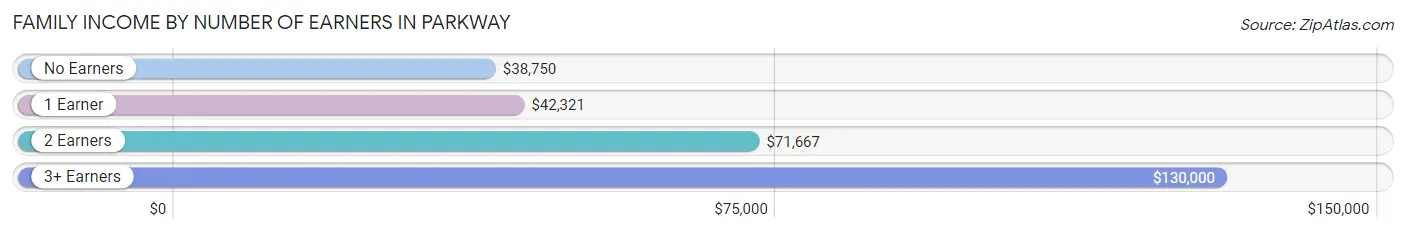
| Number of Earners | # Families | Median Income |
| No Earners | 16 (9.6%) | $38,750 |
| 1 Earner | 59 (35.3%) | $42,321 |
| 2 Earners | 80 (47.9%) | $71,667 |
| 3+ Earners | 12 (7.2%) | $130,000 |
| Total | 167 (100.0%) | $62,344 |
Household Income in Parkway
Household Income Brackets in Parkway
With 57 households falling in the category, the $50,000 to $74,999 income range is the most frequent in Parkway, accounting for 19.4% of all households. In contrast, only 3 households (1.0%) fall into the $10,000 to $14,999 income bracket, making it the least populous group.
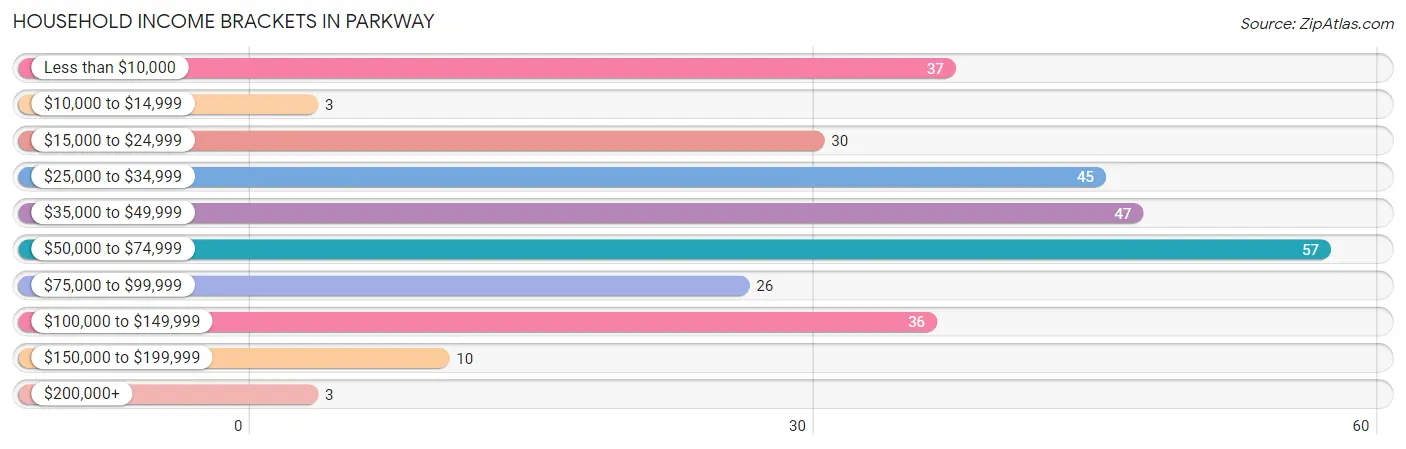
| Income Bracket | # Households | % Households |
| Less than $10,000 | 37 | 12.6% |
| $10,000 to $14,999 | 3 | 1.0% |
| $15,000 to $24,999 | 30 | 10.2% |
| $25,000 to $34,999 | 45 | 15.3% |
| $35,000 to $49,999 | 47 | 16.0% |
| $50,000 to $74,999 | 57 | 19.4% |
| $75,000 to $99,999 | 26 | 8.8% |
| $100,000 to $149,999 | 36 | 12.2% |
| $150,000 to $199,999 | 10 | 3.4% |
| $200,000+ | 3 | 1.0% |
Household Income by Householder Age in Parkway
The median household income in Parkway is $45,227, with the highest median household income of $66,417 found in the 15 to 24 years age bracket for the primary householder. A total of 17 households (5.8%) fall into this category. Meanwhile, the 45 to 64 years age bracket for the primary householder has the lowest median household income of $0, with 65 households (22.1%) in this group.
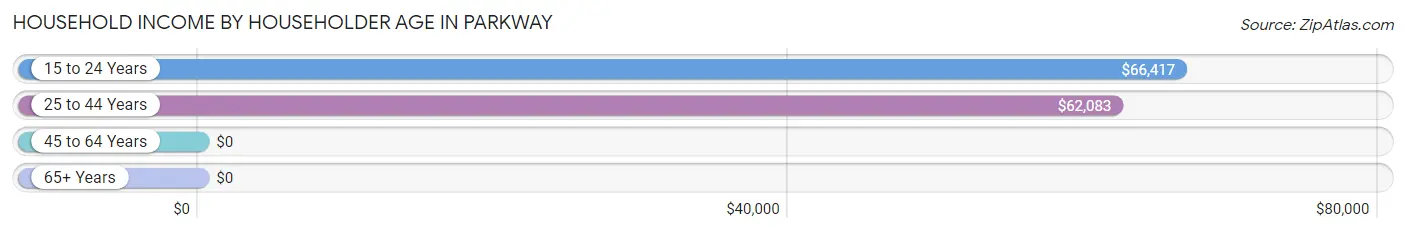
| Income Bracket | # Households | Median Income |
| 15 to 24 Years | 17 (5.8%) | $66,417 |
| 25 to 44 Years | 117 (39.8%) | $62,083 |
| 45 to 64 Years | 65 (22.1%) | $0 |
| 65+ Years | 95 (32.3%) | $0 |
| Total | 294 (100.0%) | $45,227 |
Poverty in Parkway
Income Below Poverty by Sex and Age in Parkway
With 7.4% poverty level for males and 16.4% for females among the residents of Parkway, under 5 year old males and 5 year old females are the most vulnerable to poverty, with 6 males (28.6%) and 3 females (100.0%) in their respective age groups living below the poverty level.
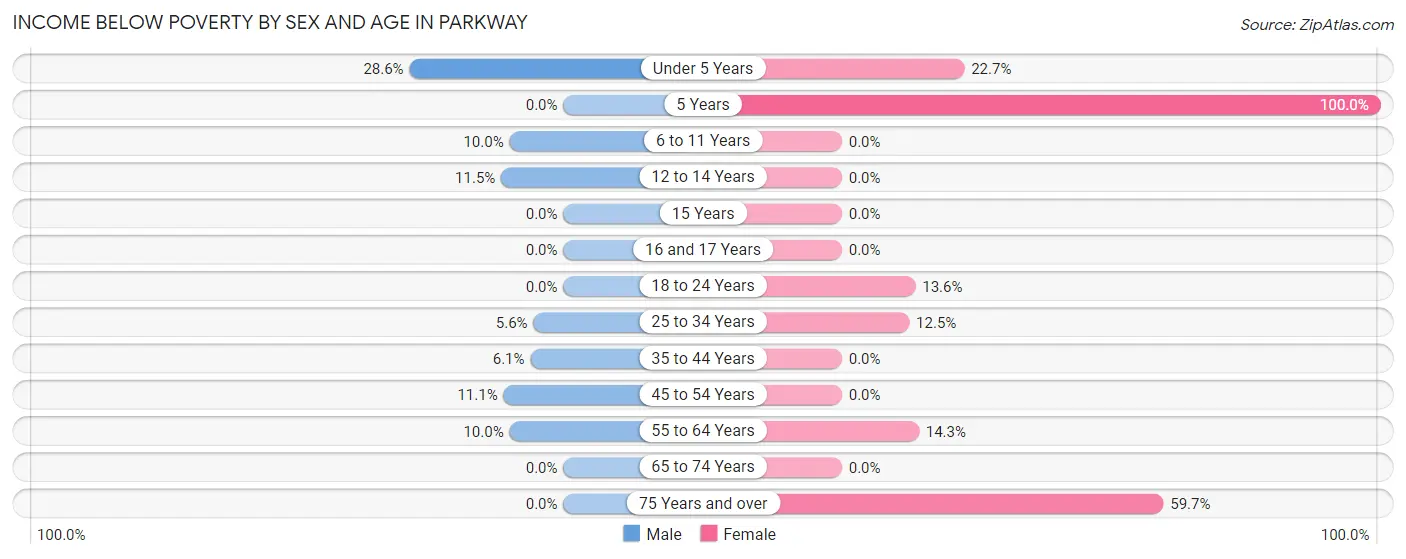
| Age Bracket | Male | Female |
| Under 5 Years | 6 (28.6%) | 5 (22.7%) |
| 5 Years | 0 (0.0%) | 3 (100.0%) |
| 6 to 11 Years | 3 (10.0%) | 0 (0.0%) |
| 12 to 14 Years | 3 (11.5%) | 0 (0.0%) |
| 15 Years | 0 (0.0%) | 0 (0.0%) |
| 16 and 17 Years | 0 (0.0%) | 0 (0.0%) |
| 18 to 24 Years | 0 (0.0%) | 6 (13.6%) |
| 25 to 34 Years | 3 (5.6%) | 8 (12.5%) |
| 35 to 44 Years | 3 (6.1%) | 0 (0.0%) |
| 45 to 54 Years | 3 (11.1%) | 0 (0.0%) |
| 55 to 64 Years | 3 (10.0%) | 2 (14.3%) |
| 65 to 74 Years | 0 (0.0%) | 0 (0.0%) |
| 75 Years and over | 0 (0.0%) | 37 (59.7%) |
| Total | 24 (7.4%) | 61 (16.4%) |
Income Above Poverty by Sex and Age in Parkway
According to the poverty statistics in Parkway, males aged 5 years and females aged 6 to 11 years are the age groups that are most secure financially, with 100.0% of males and 100.0% of females in these age groups living above the poverty line.
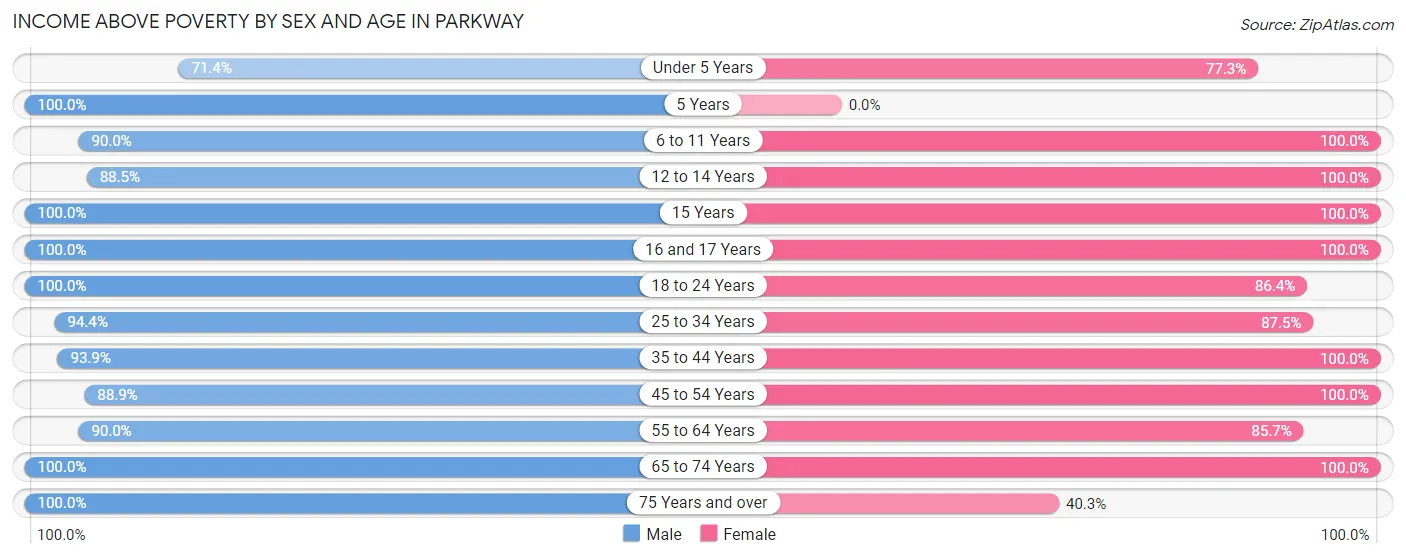
| Age Bracket | Male | Female |
| Under 5 Years | 15 (71.4%) | 17 (77.3%) |
| 5 Years | 5 (100.0%) | 0 (0.0%) |
| 6 to 11 Years | 27 (90.0%) | 24 (100.0%) |
| 12 to 14 Years | 23 (88.5%) | 24 (100.0%) |
| 15 Years | 3 (100.0%) | 3 (100.0%) |
| 16 and 17 Years | 17 (100.0%) | 5 (100.0%) |
| 18 to 24 Years | 34 (100.0%) | 38 (86.4%) |
| 25 to 34 Years | 51 (94.4%) | 56 (87.5%) |
| 35 to 44 Years | 46 (93.9%) | 42 (100.0%) |
| 45 to 54 Years | 24 (88.9%) | 33 (100.0%) |
| 55 to 64 Years | 27 (90.0%) | 12 (85.7%) |
| 65 to 74 Years | 22 (100.0%) | 32 (100.0%) |
| 75 Years and over | 6 (100.0%) | 25 (40.3%) |
| Total | 300 (92.6%) | 311 (83.6%) |
Income Below Poverty Among Married-Couple Families in Parkway
The poverty statistics for married-couple families in Parkway show that 5.2% or 6 of the total 115 families live below the poverty line. Families with 3 or 4 children have the highest poverty rate of 27.3%, comprising of 3 families. On the other hand, families with 1 or 2 children have the lowest poverty rate of 0.0%, which includes 0 families.
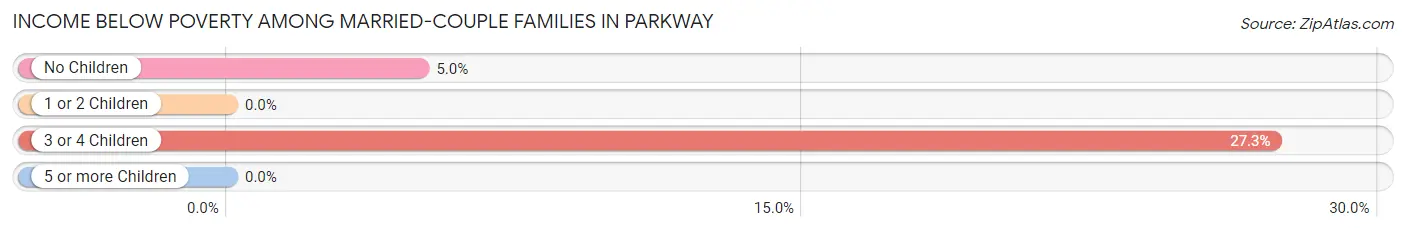
| Children | Above Poverty | Below Poverty |
| No Children | 57 (95.0%) | 3 (5.0%) |
| 1 or 2 Children | 42 (100.0%) | 0 (0.0%) |
| 3 or 4 Children | 8 (72.7%) | 3 (27.3%) |
| 5 or more Children | 2 (100.0%) | 0 (0.0%) |
| Total | 109 (94.8%) | 6 (5.2%) |
Income Below Poverty Among Single-Parent Households in Parkway
According to the poverty data in Parkway, 21.4% or 3 single-father households and 13.2% or 5 single-mother households are living below the poverty line. Among single-father households, those with 1 or 2 children have the highest poverty rate, with 3 households (50.0%) experiencing poverty. Likewise, among single-mother households, those with 1 or 2 children have the highest poverty rate, with 5 households (31.2%) falling below the poverty line.
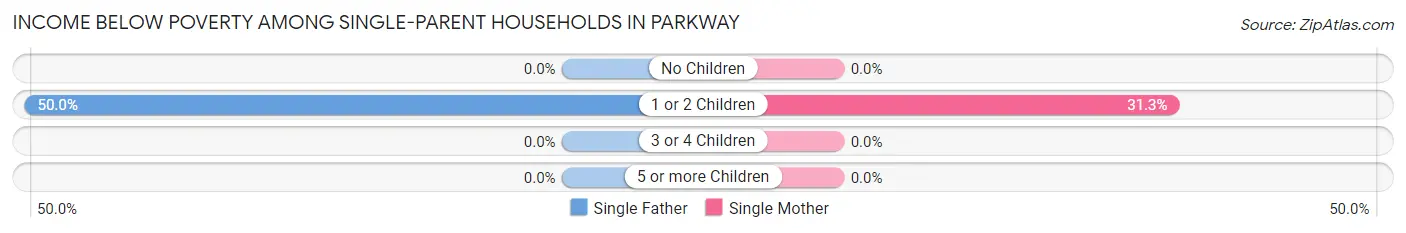
| Children | Single Father | Single Mother |
| No Children | 0 (0.0%) | 0 (0.0%) |
| 1 or 2 Children | 3 (50.0%) | 5 (31.2%) |
| 3 or 4 Children | 0 (0.0%) | 0 (0.0%) |
| 5 or more Children | 0 (0.0%) | 0 (0.0%) |
| Total | 3 (21.4%) | 5 (13.2%) |
Income Below Poverty Among Married-Couple vs Single-Parent Households in Parkway
The poverty data for Parkway shows that 6 of the married-couple family households (5.2%) and 8 of the single-parent households (15.4%) are living below the poverty level. Within the married-couple family households, those with 3 or 4 children have the highest poverty rate, with 3 households (27.3%) falling below the poverty line. Among the single-parent households, those with 1 or 2 children have the highest poverty rate, with 8 household (36.4%) living below poverty.
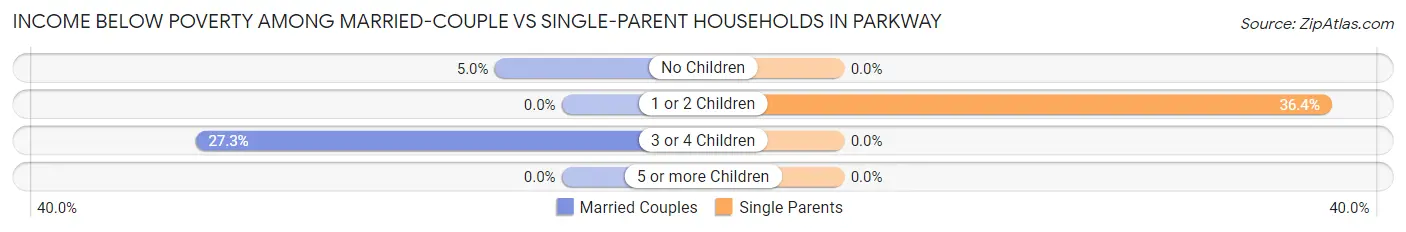
| Children | Married-Couple Families | Single-Parent Households |
| No Children | 3 (5.0%) | 0 (0.0%) |
| 1 or 2 Children | 0 (0.0%) | 8 (36.4%) |
| 3 or 4 Children | 3 (27.3%) | 0 (0.0%) |
| 5 or more Children | 0 (0.0%) | 0 (0.0%) |
| Total | 6 (5.2%) | 8 (15.4%) |
Race in Parkway
The most populous races in Parkway are White / Caucasian (710 | 92.7%), Two or more Races (33 | 4.3%), and Some other Race (16 | 2.1%).
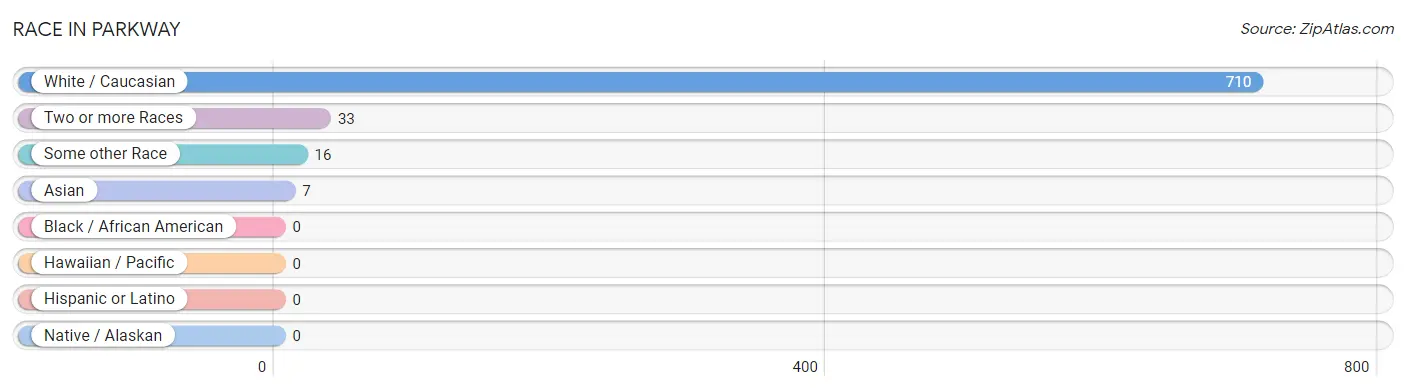
| Race | # Population | % Population |
| Asian | 7 | 0.9% |
| Black / African American | 0 | 0.0% |
| Hawaiian / Pacific | 0 | 0.0% |
| Hispanic or Latino | 0 | 0.0% |
| Native / Alaskan | 0 | 0.0% |
| White / Caucasian | 710 | 92.7% |
| Two or more Races | 33 | 4.3% |
| Some other Race | 16 | 2.1% |
| Total | 766 | 100.0% |
Ancestry in Parkway
The most populous ancestries reported in Parkway are German (201 | 26.2%), Irish (124 | 16.2%), American (88 | 11.5%), English (37 | 4.8%), and European (20 | 2.6%), together accounting for 61.4% of all Parkway residents.
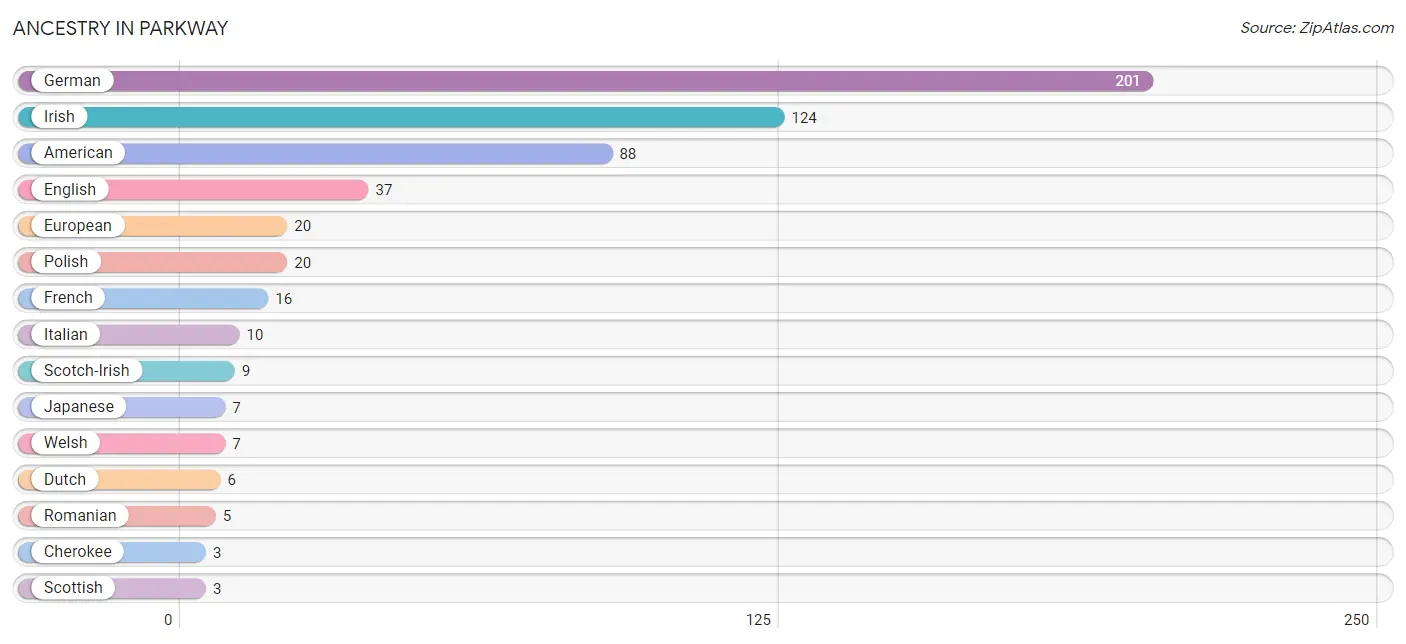
| Ancestry | # Population | % Population |
| American | 88 | 11.5% |
| Cherokee | 3 | 0.4% |
| Dutch | 6 | 0.8% |
| English | 37 | 4.8% |
| European | 20 | 2.6% |
| French | 16 | 2.1% |
| German | 201 | 26.2% |
| Irish | 124 | 16.2% |
| Italian | 10 | 1.3% |
| Japanese | 7 | 0.9% |
| Polish | 20 | 2.6% |
| Romanian | 5 | 0.6% |
| Scotch-Irish | 9 | 1.2% |
| Scottish | 3 | 0.4% |
| Welsh | 7 | 0.9% | View All 15 Rows |
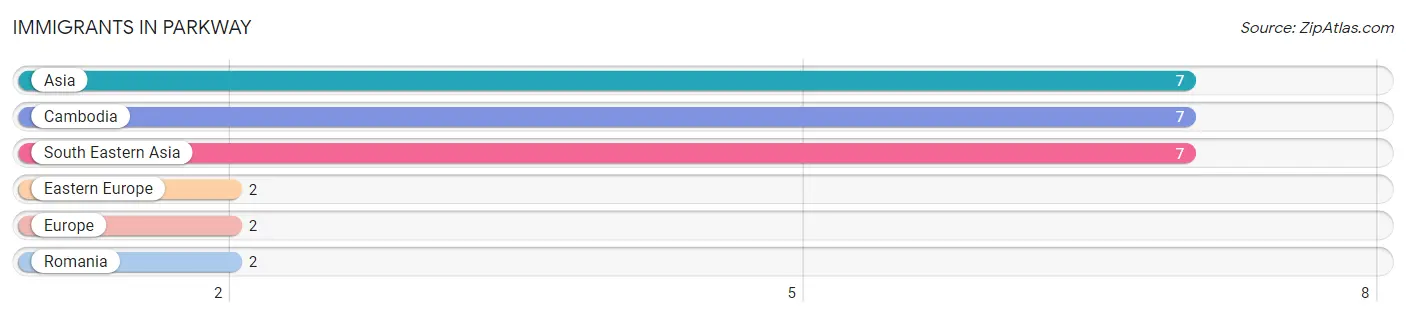
Immigrants in Parkway
The most numerous immigrant groups reported in Parkway came from Asia (7 | 0.9%), Cambodia (7 | 0.9%), South Eastern Asia (7 | 0.9%), Eastern Europe (2 | 0.3%), and Europe (2 | 0.3%), together accounting for 3.3% of all Parkway residents.
| Immigration Origin | # Population | % Population |
| Asia | 7 | 0.9% |
| Cambodia | 7 | 0.9% |
| Eastern Europe | 2 | 0.3% |
| Europe | 2 | 0.3% |
| Romania | 2 | 0.3% |
| South Eastern Asia | 7 | 0.9% | View All 6 Rows |
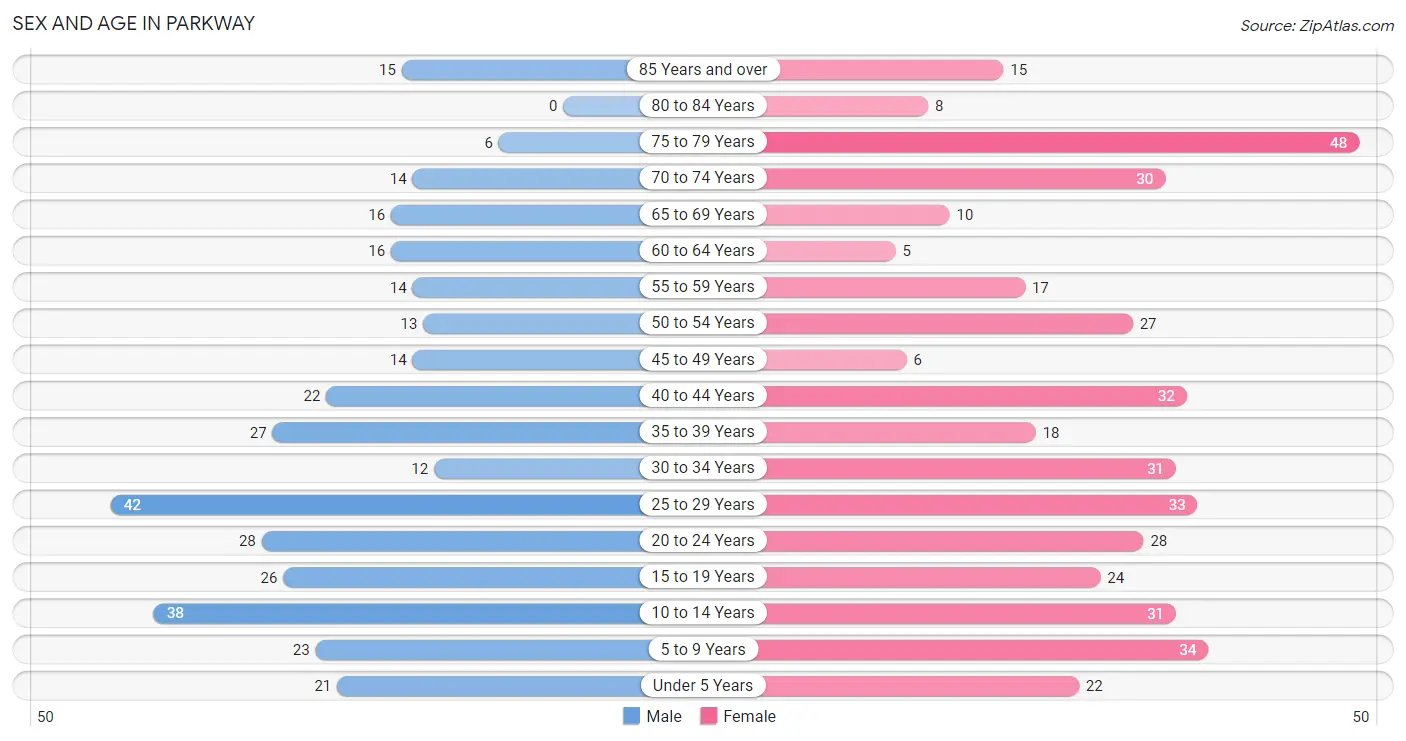
Sex and Age in Parkway
Sex and Age in Parkway
The most populous age groups in Parkway are 25 to 29 Years (42 | 12.1%) for men and 75 to 79 Years (48 | 11.5%) for women.
| Age Bracket | Male | Female |
| Under 5 Years | 21 (6.0%) | 22 (5.2%) |
| 5 to 9 Years | 23 (6.6%) | 34 (8.1%) |
| 10 to 14 Years | 38 (11.0%) | 31 (7.4%) |
| 15 to 19 Years | 26 (7.5%) | 24 (5.7%) |
| 20 to 24 Years | 28 (8.1%) | 28 (6.7%) |
| 25 to 29 Years | 42 (12.1%) | 33 (7.9%) |
| 30 to 34 Years | 12 (3.5%) | 31 (7.4%) |
| 35 to 39 Years | 27 (7.8%) | 18 (4.3%) |
| 40 to 44 Years | 22 (6.3%) | 32 (7.6%) |
| 45 to 49 Years | 14 (4.0%) | 6 (1.4%) |
| 50 to 54 Years | 13 (3.7%) | 27 (6.4%) |
| 55 to 59 Years | 14 (4.0%) | 17 (4.1%) |
| 60 to 64 Years | 16 (4.6%) | 5 (1.2%) |
| 65 to 69 Years | 16 (4.6%) | 10 (2.4%) |
| 70 to 74 Years | 14 (4.0%) | 30 (7.2%) |
| 75 to 79 Years | 6 (1.7%) | 48 (11.5%) |
| 80 to 84 Years | 0 (0.0%) | 8 (1.9%) |
| 85 Years and over | 15 (4.3%) | 15 (3.6%) |
| Total | 347 (100.0%) | 419 (100.0%) |
Families and Households in Parkway
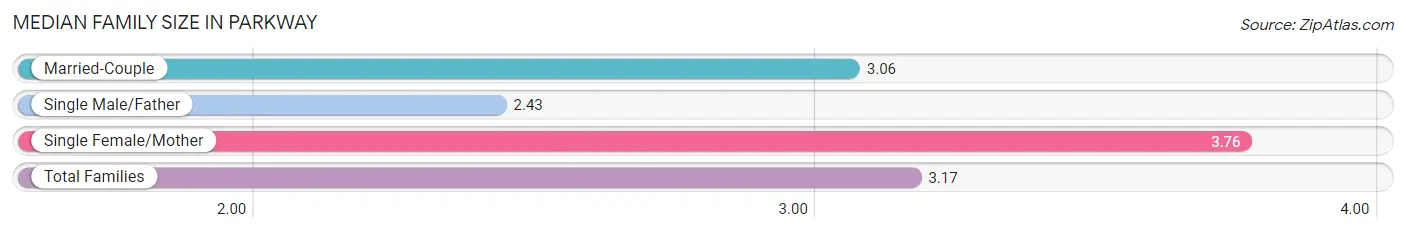
Median Family Size in Parkway
The median family size in Parkway is 3.17 persons per family, with single female/mother families (38 | 22.8%) accounting for the largest median family size of 3.76 persons per family. On the other hand, single male/father families (14 | 8.4%) represent the smallest median family size with 2.43 persons per family.
| Family Type | # Families | Family Size |
| Married-Couple | 115 (68.9%) | 3.06 |
| Single Male/Father | 14 (8.4%) | 2.43 |
| Single Female/Mother | 38 (22.8%) | 3.76 |
| Total Families | 167 (100.0%) | 3.17 |
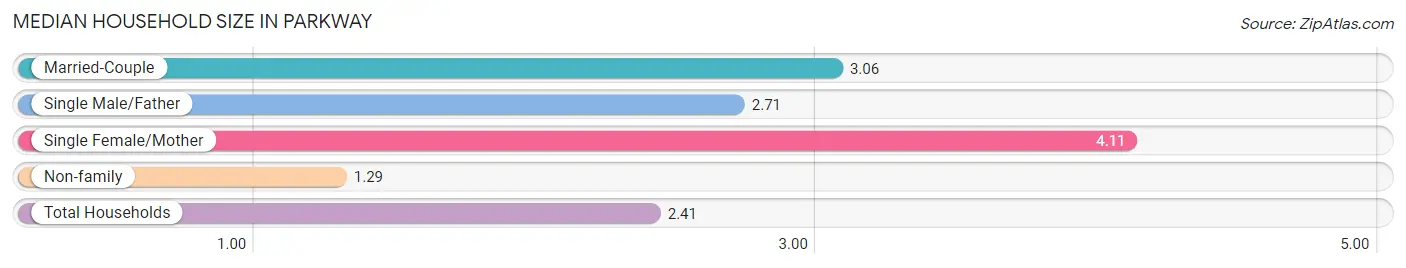
Median Household Size in Parkway
The median household size in Parkway is 2.41 persons per household, with single female/mother households (38 | 12.9%) accounting for the largest median household size of 4.11 persons per household. non-family households (127 | 43.2%) represent the smallest median household size with 1.29 persons per household.
| Household Type | # Households | Household Size |
| Married-Couple | 115 (39.1%) | 3.06 |
| Single Male/Father | 14 (4.8%) | 2.71 |
| Single Female/Mother | 38 (12.9%) | 4.11 |
| Non-family | 127 (43.2%) | 1.29 |
| Total Households | 294 (100.0%) | 2.41 |
Household Size by Marriage Status in Parkway
Out of a total of 294 households in Parkway, 167 (56.8%) are family households, while 127 (43.2%) are nonfamily households. The most numerous type of family households are 2-person households, comprising 74, and the most common type of nonfamily households are 1-person households, comprising 103.
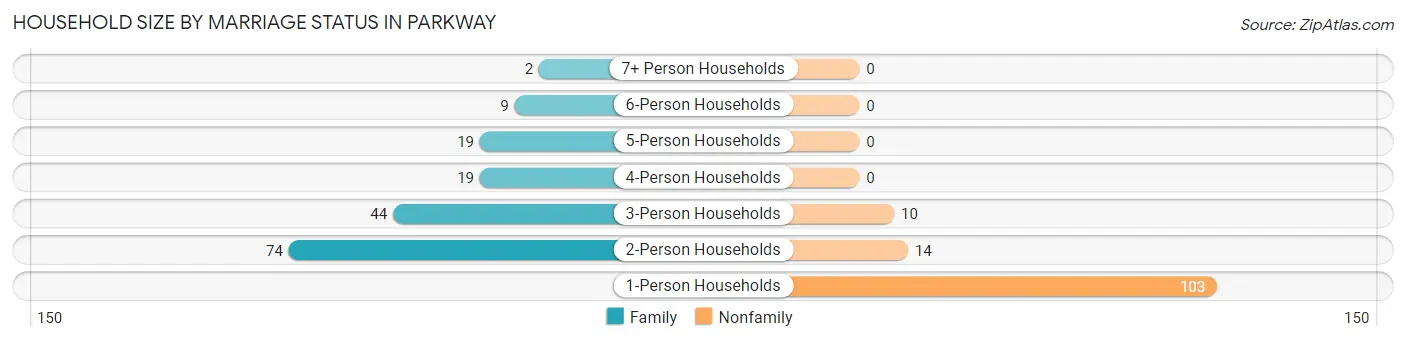
| Household Size | Family Households | Nonfamily Households |
| 1-Person Households | - | 103 (35.0%) |
| 2-Person Households | 74 (25.2%) | 14 (4.8%) |
| 3-Person Households | 44 (15.0%) | 10 (3.4%) |
| 4-Person Households | 19 (6.5%) | 0 (0.0%) |
| 5-Person Households | 19 (6.5%) | 0 (0.0%) |
| 6-Person Households | 9 (3.1%) | 0 (0.0%) |
| 7+ Person Households | 2 (0.7%) | 0 (0.0%) |
| Total | 167 (56.8%) | 127 (43.2%) |
Female Fertility in Parkway
Fertility by Age in Parkway
Average fertility rate in Parkway is 93.0 births per 1,000 women. Women in the age bracket of 20 to 34 years have the highest fertility rate with 174.0 births per 1,000 women. Women in the age bracket of 20 to 34 years acount for 100.0% of all women with births.
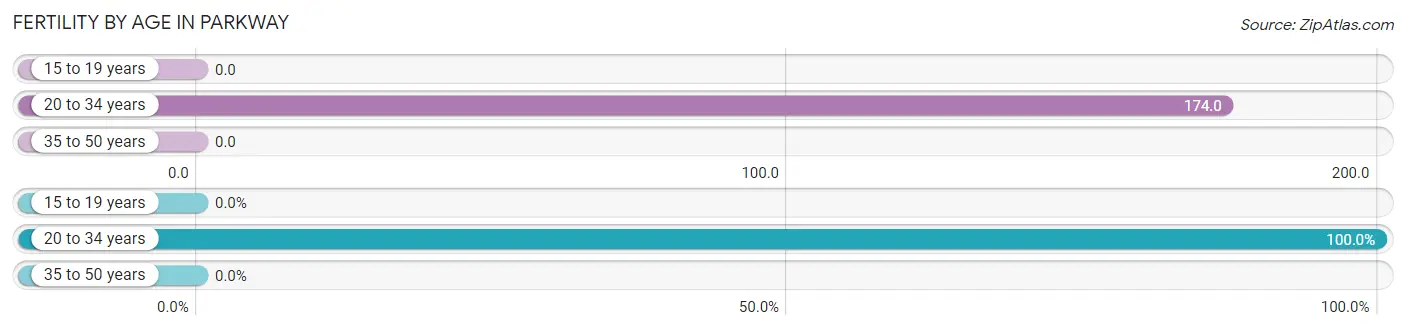
| Age Bracket | Women with Births | Births / 1,000 Women |
| 15 to 19 years | 0 (0.0%) | 0.0 |
| 20 to 34 years | 16 (100.0%) | 174.0 |
| 35 to 50 years | 0 (0.0%) | 0.0 |
| Total | 16 (100.0%) | 93.0 |
Fertility by Age by Marriage Status in Parkway
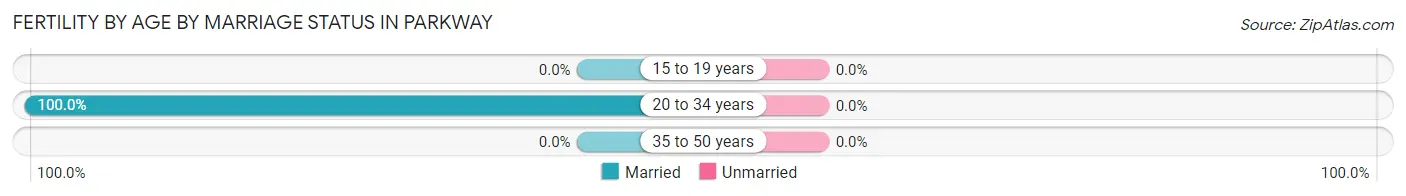
| Age Bracket | Married | Unmarried |
| 15 to 19 years | 0 (0.0%) | 0 (0.0%) |
| 20 to 34 years | 16 (100.0%) | 0 (0.0%) |
| 35 to 50 years | 0 (0.0%) | 0 (0.0%) |
| Total | 16 (100.0%) | 0 (0.0%) |
Fertility by Education in Parkway
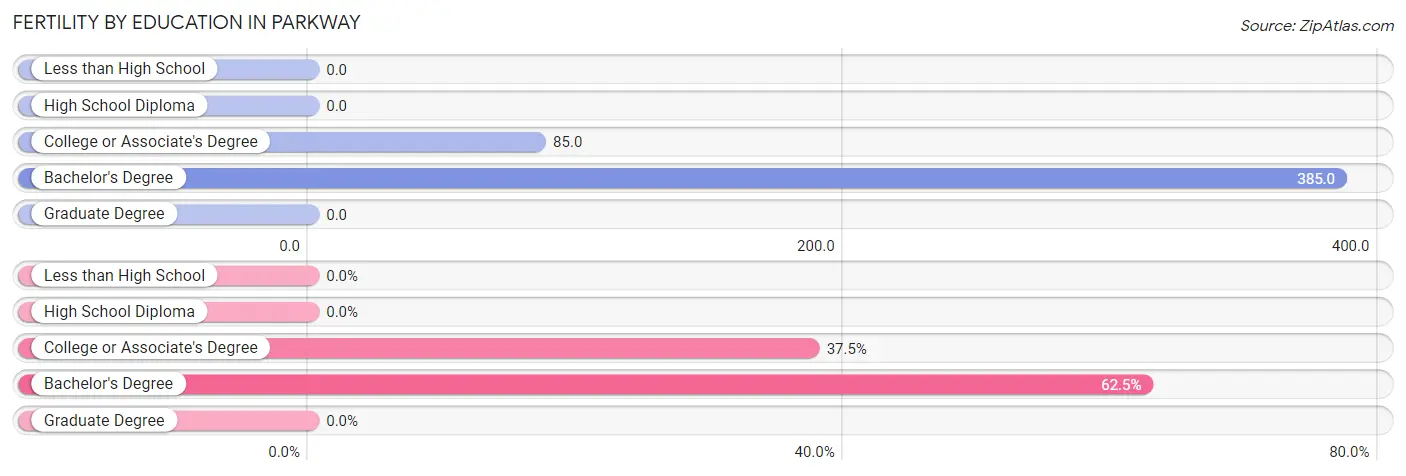
| Educational Attainment | Women with Births | Births / 1,000 Women |
| Less than High School | 0 (0.0%) | 0.0 |
| High School Diploma | 0 (0.0%) | 0.0 |
| College or Associate's Degree | 6 (37.5%) | 85.0 |
| Bachelor's Degree | 10 (62.5%) | 385.0 |
| Graduate Degree | 0 (0.0%) | 0.0 |
| Total | 16 (100.0%) | 93.0 |
Fertility by Education by Marriage Status in Parkway
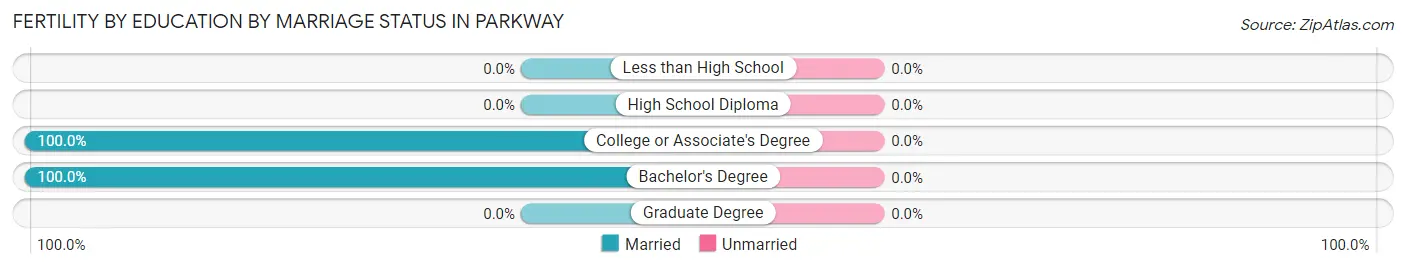
| Educational Attainment | Married | Unmarried |
| Less than High School | 0 (0.0%) | 0 (0.0%) |
| High School Diploma | 0 (0.0%) | 0 (0.0%) |
| College or Associate's Degree | 6 (100.0%) | 0 (0.0%) |
| Bachelor's Degree | 10 (100.0%) | 0 (0.0%) |
| Graduate Degree | 0 (0.0%) | 0 (0.0%) |
| Total | 16 (100.0%) | 0 (0.0%) |
Employment Characteristics in Parkway
Employment by Class of Employer in Parkway
Among the 328 employed individuals in Parkway, private company employees (269 | 82.0%), local government employees (16 | 4.9%), and self-employed (incorporated) (10 | 3.0%) make up the most common classes of employment.
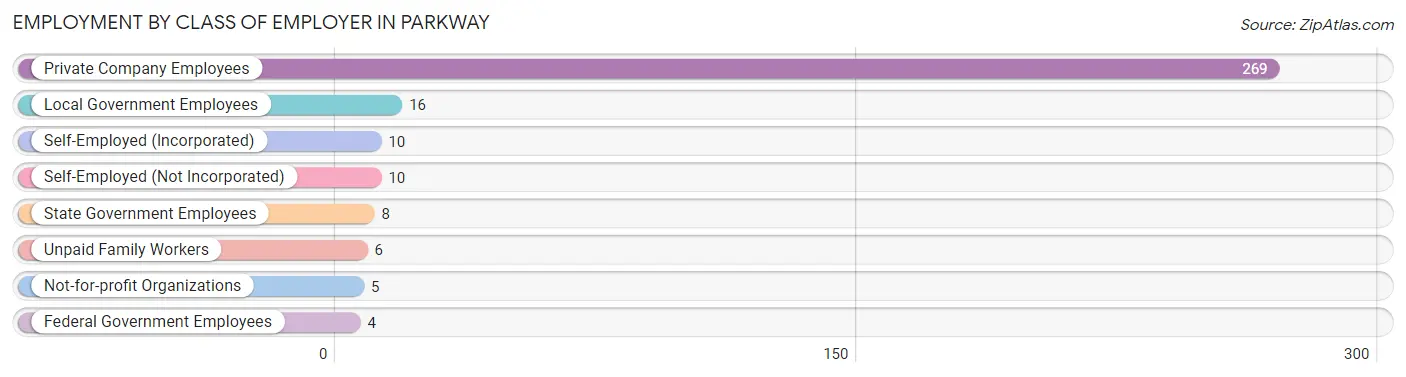
| Employer Class | # Employees | % Employees |
| Private Company Employees | 269 | 82.0% |
| Self-Employed (Incorporated) | 10 | 3.0% |
| Self-Employed (Not Incorporated) | 10 | 3.0% |
| Not-for-profit Organizations | 5 | 1.5% |
| Local Government Employees | 16 | 4.9% |
| State Government Employees | 8 | 2.4% |
| Federal Government Employees | 4 | 1.2% |
| Unpaid Family Workers | 6 | 1.8% |
| Total | 328 | 100.0% |
Employment Status by Age in Parkway
According to the labor force statistics for Parkway, out of the total population over 16 years of age (591), 60.7% or 359 individuals are in the labor force, with 8.1% or 29 of them unemployed. The age group with the highest labor force participation rate is 25 to 29 years, with 100.0% or 75 individuals in the labor force. Within the labor force, the 16 to 19 years age range has the highest percentage of unemployed individuals, with 51.7% or 15 of them being unemployed.
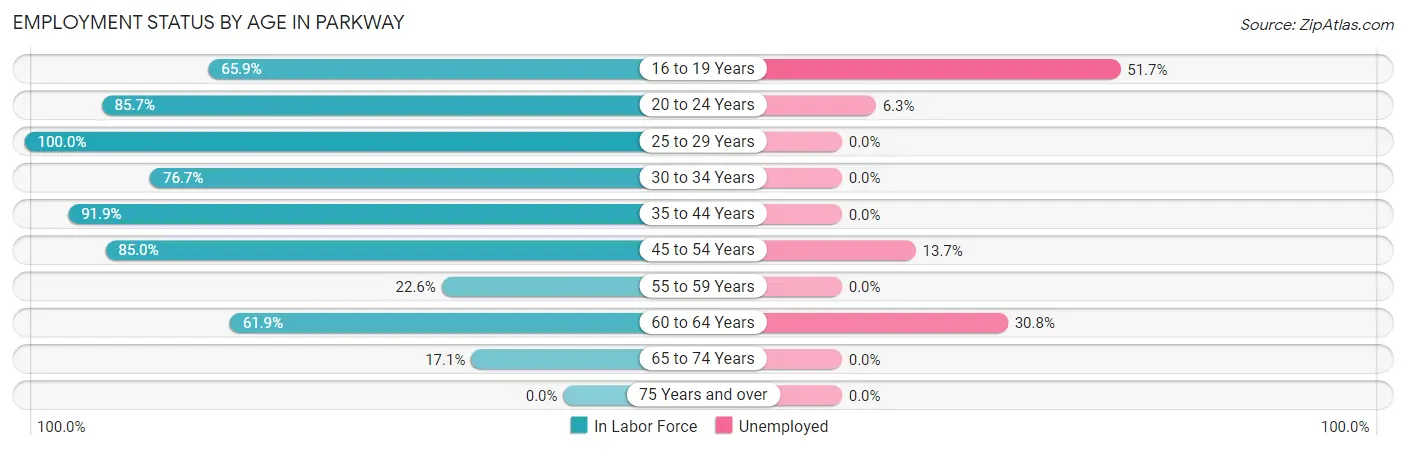
| Age Bracket | In Labor Force | Unemployed |
| 16 to 19 Years | 29 (65.9%) | 15 (51.7%) |
| 20 to 24 Years | 48 (85.7%) | 3 (6.3%) |
| 25 to 29 Years | 75 (100.0%) | 0 (0.0%) |
| 30 to 34 Years | 33 (76.7%) | 0 (0.0%) |
| 35 to 44 Years | 91 (91.9%) | 0 (0.0%) |
| 45 to 54 Years | 51 (85.0%) | 7 (13.7%) |
| 55 to 59 Years | 7 (22.6%) | 0 (0.0%) |
| 60 to 64 Years | 13 (61.9%) | 4 (30.8%) |
| 65 to 74 Years | 12 (17.1%) | 0 (0.0%) |
| 75 Years and over | 0 (0.0%) | 0 (0.0%) |
| Total | 359 (60.7%) | 29 (8.1%) |
Employment Status by Educational Attainment in Parkway
According to labor force statistics for Parkway, 82.1% of individuals (270) out of the total population between 25 and 64 years of age (329) are in the labor force, with 4.1% or 11 of them being unemployed. The group with the highest labor force participation rate are those with the educational attainment of college / associate degree, with 89.9% or 133 individuals in the labor force. Within the labor force, individuals with college / associate degree education have the highest percentage of unemployment, with 8.3% or 11 of them being unemployed.
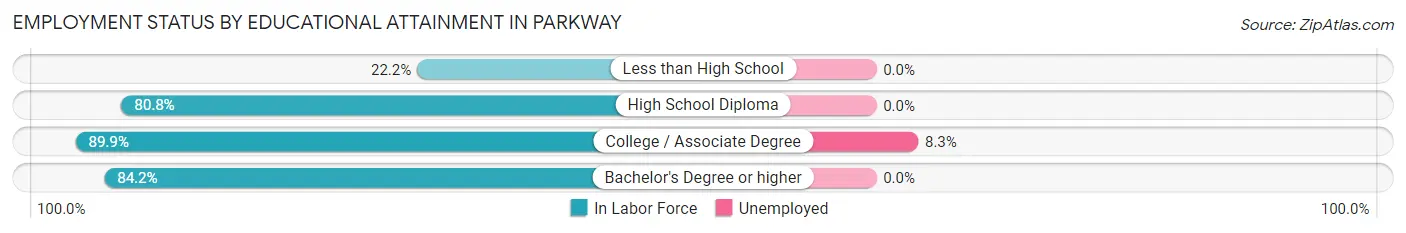
| Educational Attainment | In Labor Force | Unemployed |
| Less than High School | 4 (22.2%) | 0 (0.0%) |
| High School Diploma | 101 (80.8%) | 0 (0.0%) |
| College / Associate Degree | 133 (89.9%) | 12 (8.3%) |
| Bachelor's Degree or higher | 32 (84.2%) | 0 (0.0%) |
| Total | 270 (82.1%) | 13 (4.1%) |
Employment Occupations by Sex in Parkway
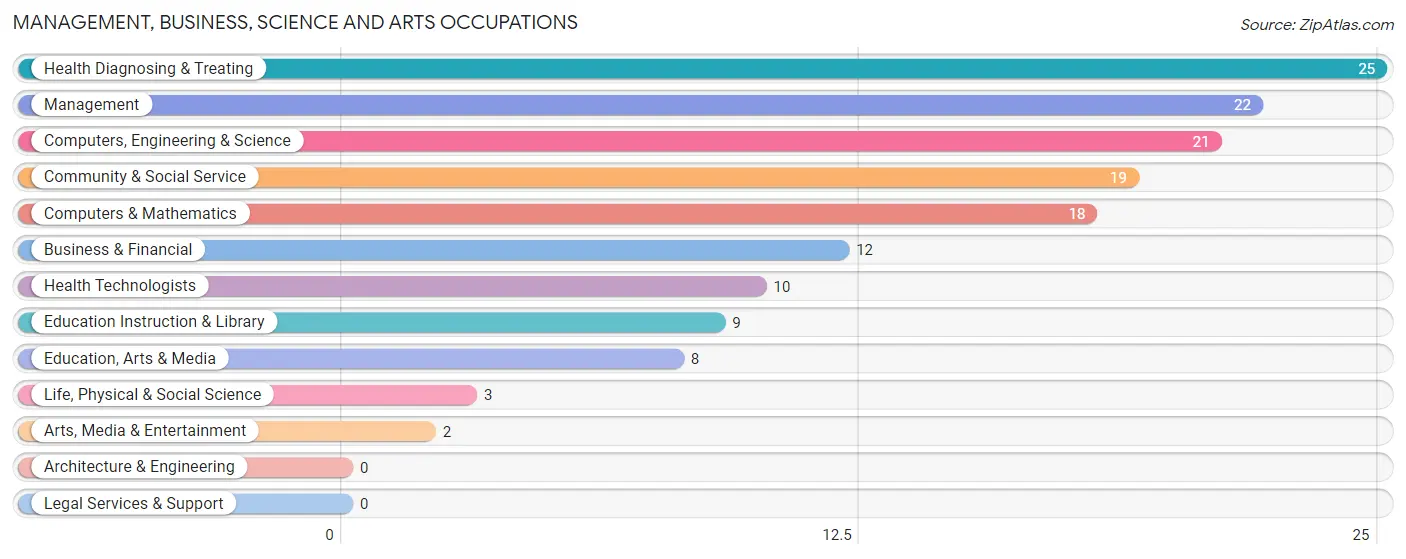
Management, Business, Science and Arts Occupations
The most common Management, Business, Science and Arts occupations in Parkway are Health Diagnosing & Treating (25 | 7.6%), Management (22 | 6.7%), Computers, Engineering & Science (21 | 6.4%), Community & Social Service (19 | 5.8%), and Computers & Mathematics (18 | 5.4%).
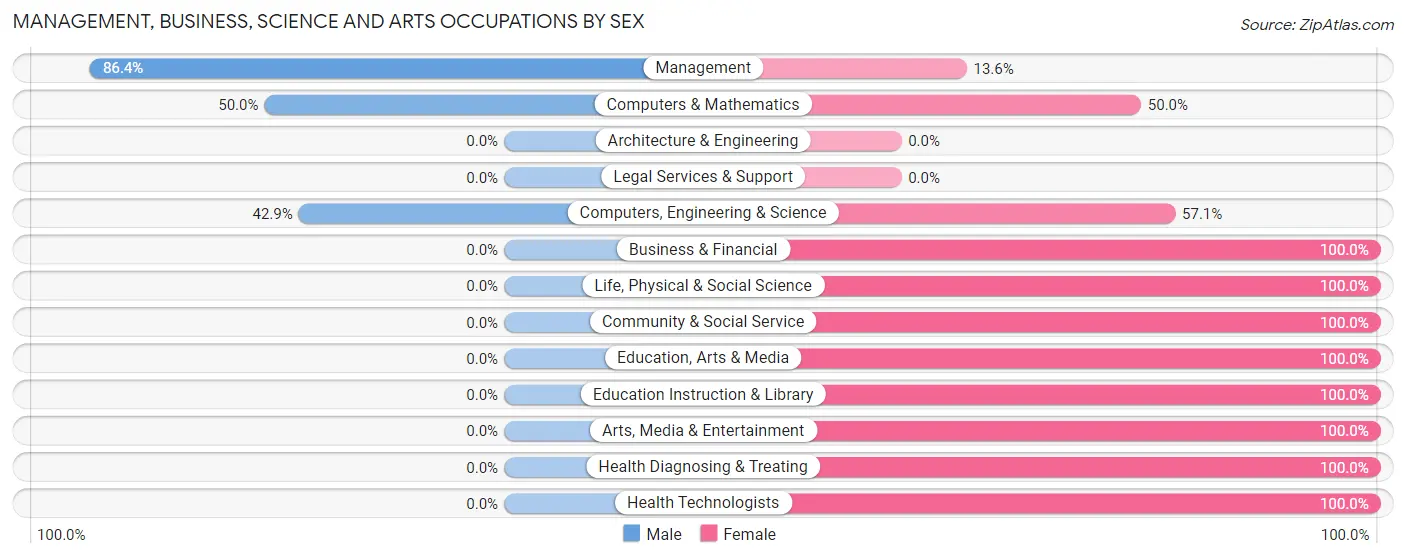
Management, Business, Science and Arts Occupations by Sex
Within the Management, Business, Science and Arts occupations in Parkway, the most male-oriented occupations are Management (86.4%), Computers & Mathematics (50.0%), and Computers, Engineering & Science (42.9%), while the most female-oriented occupations are Business & Financial (100.0%), Life, Physical & Social Science (100.0%), and Community & Social Service (100.0%).
| Occupation | Male | Female |
| Management | 19 (86.4%) | 3 (13.6%) |
| Business & Financial | 0 (0.0%) | 12 (100.0%) |
| Computers, Engineering & Science | 9 (42.9%) | 12 (57.1%) |
| Computers & Mathematics | 9 (50.0%) | 9 (50.0%) |
| Architecture & Engineering | 0 (0.0%) | 0 (0.0%) |
| Life, Physical & Social Science | 0 (0.0%) | 3 (100.0%) |
| Community & Social Service | 0 (0.0%) | 19 (100.0%) |
| Education, Arts & Media | 0 (0.0%) | 8 (100.0%) |
| Legal Services & Support | 0 (0.0%) | 0 (0.0%) |
| Education Instruction & Library | 0 (0.0%) | 9 (100.0%) |
| Arts, Media & Entertainment | 0 (0.0%) | 2 (100.0%) |
| Health Diagnosing & Treating | 0 (0.0%) | 25 (100.0%) |
| Health Technologists | 0 (0.0%) | 10 (100.0%) |
| Total (Category) | 28 (28.3%) | 71 (71.7%) |
| Total (Overall) | 173 (52.4%) | 157 (47.6%) |
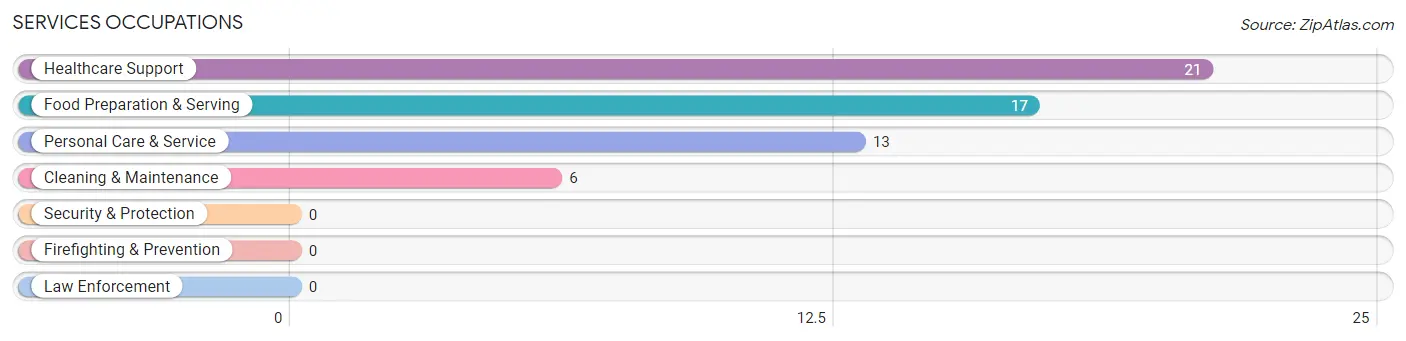
Services Occupations
The most common Services occupations in Parkway are Healthcare Support (21 | 6.4%), Food Preparation & Serving (17 | 5.1%), Personal Care & Service (13 | 3.9%), and Cleaning & Maintenance (6 | 1.8%).
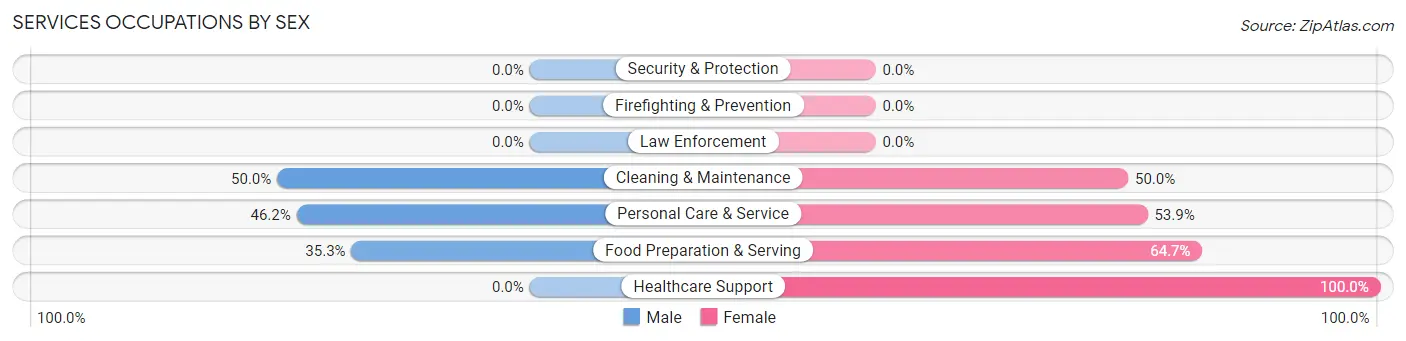
Services Occupations by Sex
Within the Services occupations in Parkway, the most male-oriented occupations are Cleaning & Maintenance (50.0%), Personal Care & Service (46.2%), and Food Preparation & Serving (35.3%), while the most female-oriented occupations are Healthcare Support (100.0%), Food Preparation & Serving (64.7%), and Personal Care & Service (53.8%).
| Occupation | Male | Female |
| Healthcare Support | 0 (0.0%) | 21 (100.0%) |
| Security & Protection | 0 (0.0%) | 0 (0.0%) |
| Firefighting & Prevention | 0 (0.0%) | 0 (0.0%) |
| Law Enforcement | 0 (0.0%) | 0 (0.0%) |
| Food Preparation & Serving | 6 (35.3%) | 11 (64.7%) |
| Cleaning & Maintenance | 3 (50.0%) | 3 (50.0%) |
| Personal Care & Service | 6 (46.2%) | 7 (53.8%) |
| Total (Category) | 15 (26.3%) | 42 (73.7%) |
| Total (Overall) | 173 (52.4%) | 157 (47.6%) |
Sales and Office Occupations
The most common Sales and Office occupations in Parkway are Office & Administration (26 | 7.9%), and Sales & Related (20 | 6.1%).
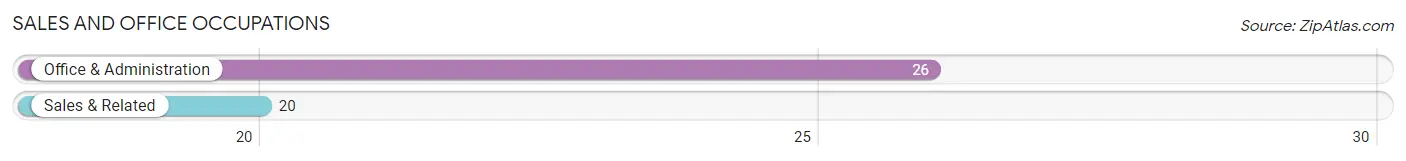
Sales and Office Occupations by Sex
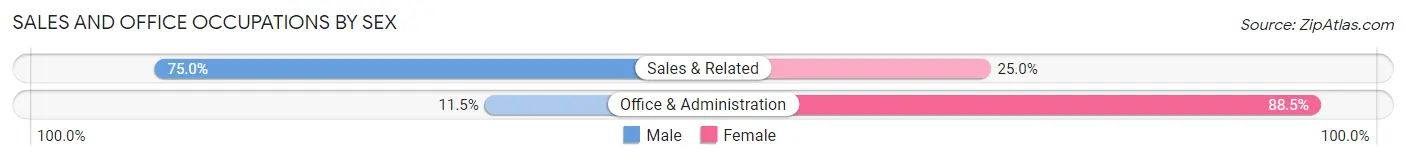
| Occupation | Male | Female |
| Sales & Related | 15 (75.0%) | 5 (25.0%) |
| Office & Administration | 3 (11.5%) | 23 (88.5%) |
| Total (Category) | 18 (39.1%) | 28 (60.9%) |
| Total (Overall) | 173 (52.4%) | 157 (47.6%) |
Natural Resources, Construction and Maintenance Occupations
The most common Natural Resources, Construction and Maintenance occupations in Parkway are Construction & Extraction (29 | 8.8%), and Installation, Maintenance & Repair (20 | 6.1%).
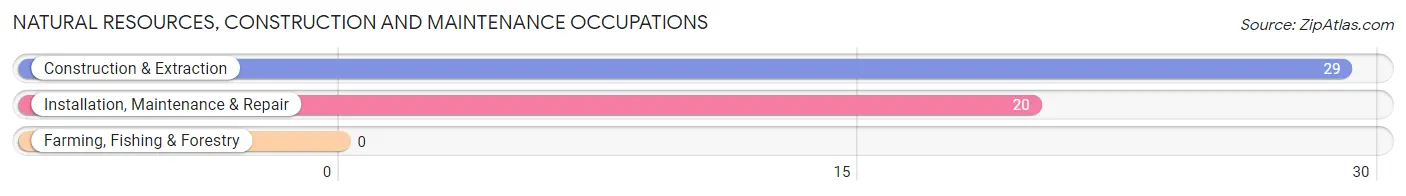
Natural Resources, Construction and Maintenance Occupations by Sex
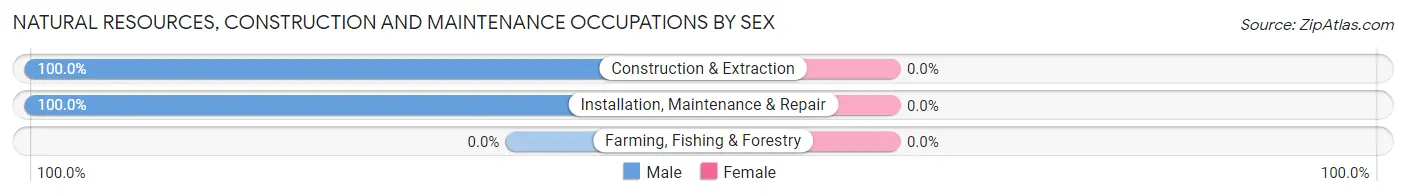
| Occupation | Male | Female |
| Farming, Fishing & Forestry | 0 (0.0%) | 0 (0.0%) |
| Construction & Extraction | 29 (100.0%) | 0 (0.0%) |
| Installation, Maintenance & Repair | 20 (100.0%) | 0 (0.0%) |
| Total (Category) | 49 (100.0%) | 0 (0.0%) |
| Total (Overall) | 173 (52.4%) | 157 (47.6%) |
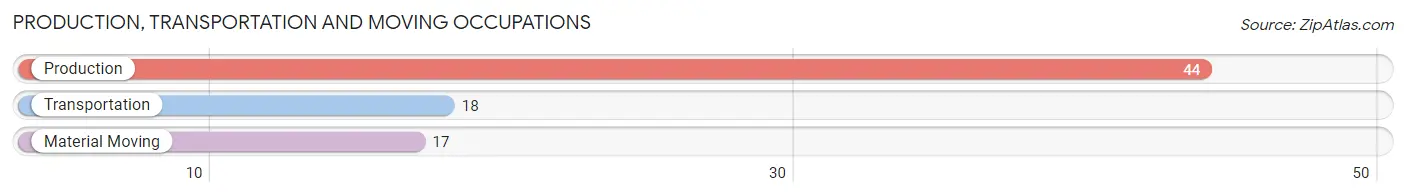
Production, Transportation and Moving Occupations
The most common Production, Transportation and Moving occupations in Parkway are Production (44 | 13.3%), Transportation (18 | 5.4%), and Material Moving (17 | 5.1%).
Production, Transportation and Moving Occupations by Sex
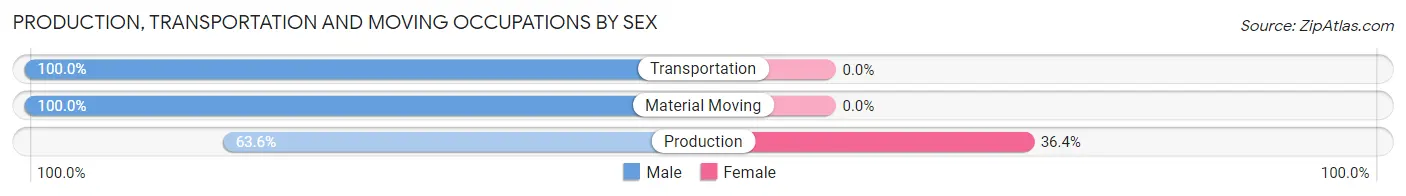
| Occupation | Male | Female |
| Production | 28 (63.6%) | 16 (36.4%) |
| Transportation | 18 (100.0%) | 0 (0.0%) |
| Material Moving | 17 (100.0%) | 0 (0.0%) |
| Total (Category) | 63 (79.7%) | 16 (20.3%) |
| Total (Overall) | 173 (52.4%) | 157 (47.6%) |
Employment Industries by Sex in Parkway
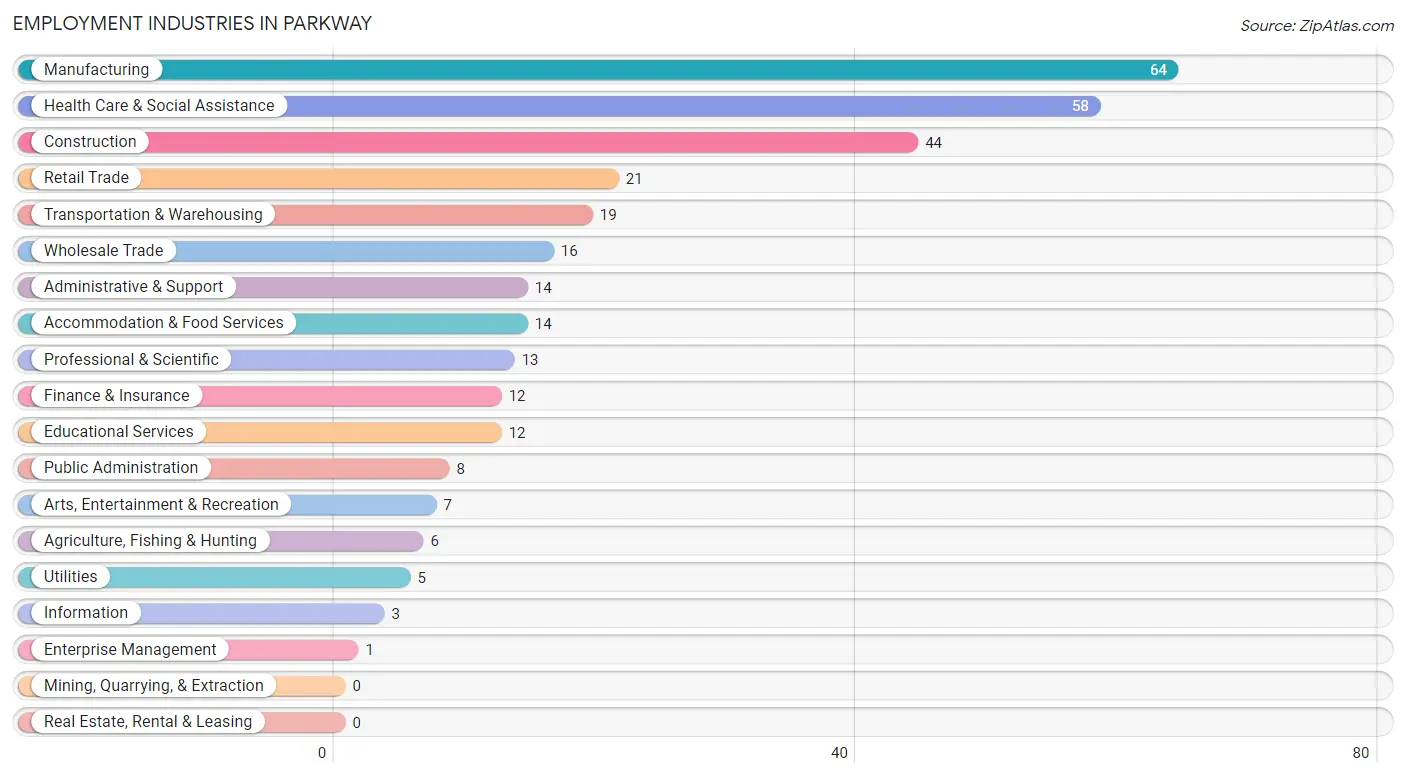
Employment Industries in Parkway
The major employment industries in Parkway include Manufacturing (64 | 19.4%), Health Care & Social Assistance (58 | 17.6%), Construction (44 | 13.3%), Retail Trade (21 | 6.4%), and Transportation & Warehousing (19 | 5.8%).
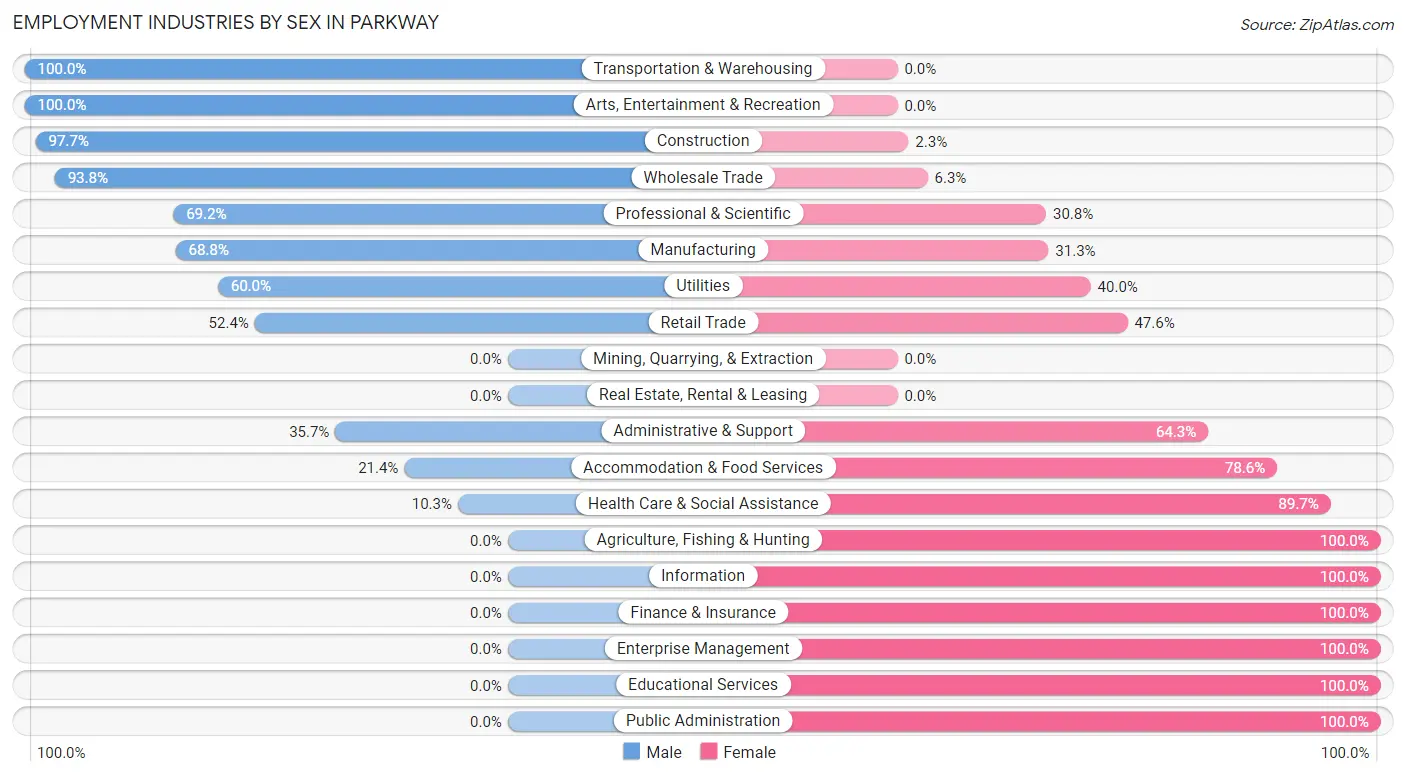
Employment Industries by Sex in Parkway
The Parkway industries that see more men than women are Transportation & Warehousing (100.0%), Arts, Entertainment & Recreation (100.0%), and Construction (97.7%), whereas the industries that tend to have a higher number of women are Agriculture, Fishing & Hunting (100.0%), Information (100.0%), and Finance & Insurance (100.0%).
| Industry | Male | Female |
| Agriculture, Fishing & Hunting | 0 (0.0%) | 6 (100.0%) |
| Mining, Quarrying, & Extraction | 0 (0.0%) | 0 (0.0%) |
| Construction | 43 (97.7%) | 1 (2.3%) |
| Manufacturing | 44 (68.8%) | 20 (31.2%) |
| Wholesale Trade | 15 (93.8%) | 1 (6.2%) |
| Retail Trade | 11 (52.4%) | 10 (47.6%) |
| Transportation & Warehousing | 19 (100.0%) | 0 (0.0%) |
| Utilities | 3 (60.0%) | 2 (40.0%) |
| Information | 0 (0.0%) | 3 (100.0%) |
| Finance & Insurance | 0 (0.0%) | 12 (100.0%) |
| Real Estate, Rental & Leasing | 0 (0.0%) | 0 (0.0%) |
| Professional & Scientific | 9 (69.2%) | 4 (30.8%) |
| Enterprise Management | 0 (0.0%) | 1 (100.0%) |
| Administrative & Support | 5 (35.7%) | 9 (64.3%) |
| Educational Services | 0 (0.0%) | 12 (100.0%) |
| Health Care & Social Assistance | 6 (10.3%) | 52 (89.7%) |
| Arts, Entertainment & Recreation | 7 (100.0%) | 0 (0.0%) |
| Accommodation & Food Services | 3 (21.4%) | 11 (78.6%) |
| Public Administration | 0 (0.0%) | 8 (100.0%) |
| Total | 173 (52.4%) | 157 (47.6%) |
Education in Parkway
School Enrollment in Parkway
The most common levels of schooling among the 187 students in Parkway are middle school (66 | 35.3%), elementary school (49 | 26.2%), and high school (34 | 18.2%).
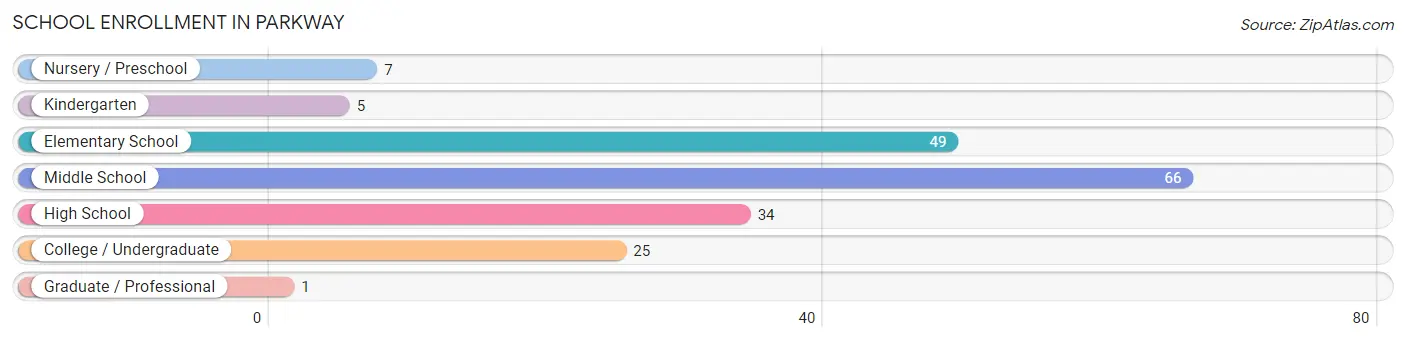
| School Level | # Students | % Students |
| Nursery / Preschool | 7 | 3.7% |
| Kindergarten | 5 | 2.7% |
| Elementary School | 49 | 26.2% |
| Middle School | 66 | 35.3% |
| High School | 34 | 18.2% |
| College / Undergraduate | 25 | 13.4% |
| Graduate / Professional | 1 | 0.5% |
| Total | 187 | 100.0% |
School Enrollment by Age by Funding Source in Parkway
Out of a total of 187 students who are enrolled in schools in Parkway, 11 (5.9%) attend a private institution, while the remaining 176 (94.1%) are enrolled in public schools. The age group of 20 to 24 year olds has the highest likelihood of being enrolled in private schools, with 3 (27.3% in the age bracket) enrolled. Conversely, the age group of 3 to 4 year olds has the lowest likelihood of being enrolled in a private school, with 4 (100.0% in the age bracket) attending a public institution.
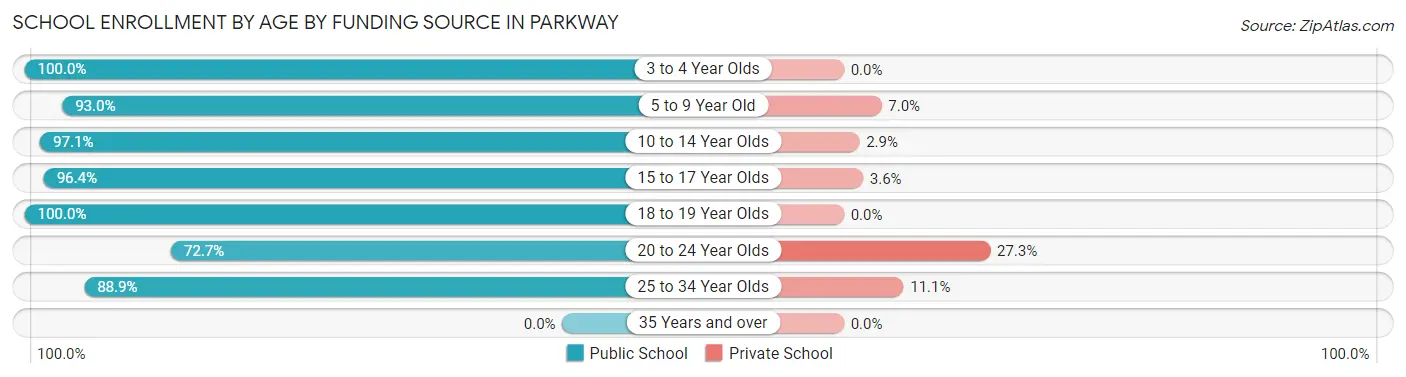
| Age Bracket | Public School | Private School |
| 3 to 4 Year Olds | 4 (100.0%) | 0 (0.0%) |
| 5 to 9 Year Old | 53 (93.0%) | 4 (7.0%) |
| 10 to 14 Year Olds | 67 (97.1%) | 2 (2.9%) |
| 15 to 17 Year Olds | 27 (96.4%) | 1 (3.6%) |
| 18 to 19 Year Olds | 9 (100.0%) | 0 (0.0%) |
| 20 to 24 Year Olds | 8 (72.7%) | 3 (27.3%) |
| 25 to 34 Year Olds | 8 (88.9%) | 1 (11.1%) |
| 35 Years and over | 0 (0.0%) | 0 (0.0%) |
| Total | 176 (94.1%) | 11 (5.9%) |
Educational Attainment by Field of Study in Parkway
Education (22 | 36.1%), engineering (14 | 23.0%), business (7 | 11.5%), bio, nature & agricultural (3 | 4.9%), and psychology (3 | 4.9%) are the most common fields of study among 61 individuals in Parkway who have obtained a bachelor's degree or higher.
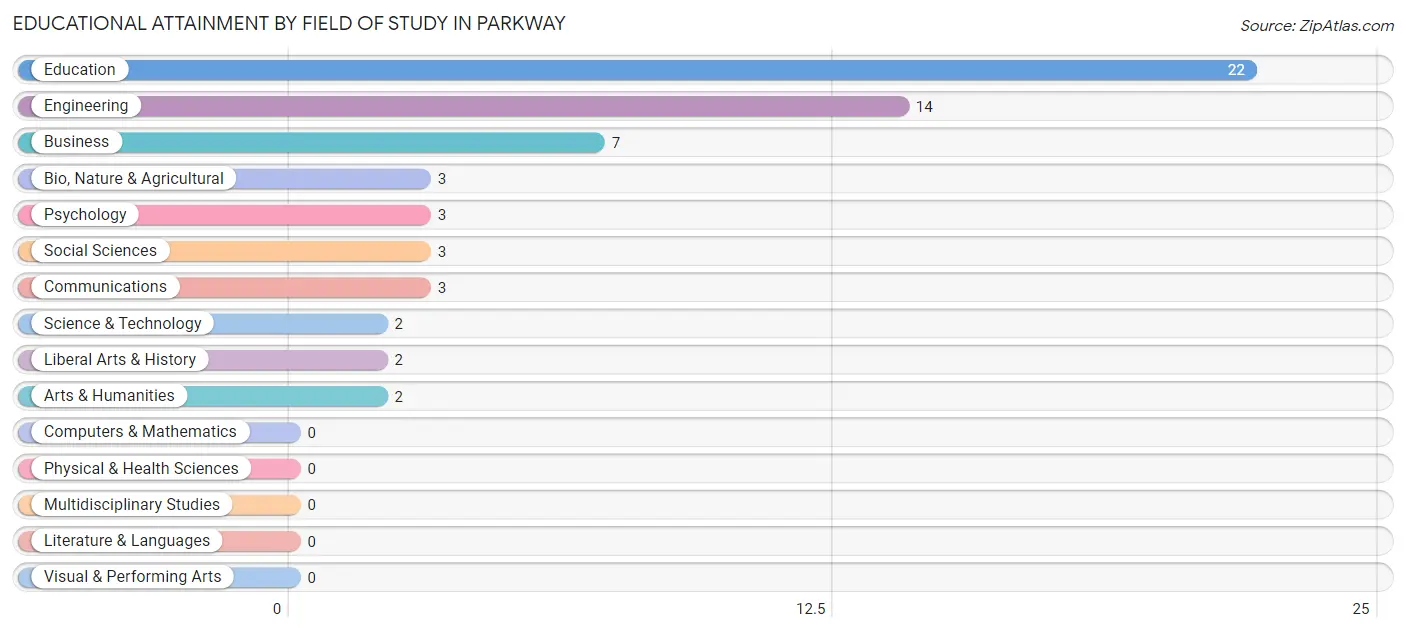
| Field of Study | # Graduates | % Graduates |
| Computers & Mathematics | 0 | 0.0% |
| Bio, Nature & Agricultural | 3 | 4.9% |
| Physical & Health Sciences | 0 | 0.0% |
| Psychology | 3 | 4.9% |
| Social Sciences | 3 | 4.9% |
| Engineering | 14 | 23.0% |
| Multidisciplinary Studies | 0 | 0.0% |
| Science & Technology | 2 | 3.3% |
| Business | 7 | 11.5% |
| Education | 22 | 36.1% |
| Literature & Languages | 0 | 0.0% |
| Liberal Arts & History | 2 | 3.3% |
| Visual & Performing Arts | 0 | 0.0% |
| Communications | 3 | 4.9% |
| Arts & Humanities | 2 | 3.3% |
| Total | 61 | 100.0% |
Transportation & Commute in Parkway
Vehicle Availability by Sex in Parkway
The most prevalent vehicle ownership categories in Parkway are males with 2 vehicles (76, accounting for 43.9%) and females with 2 vehicles (70, making up 49.0%).
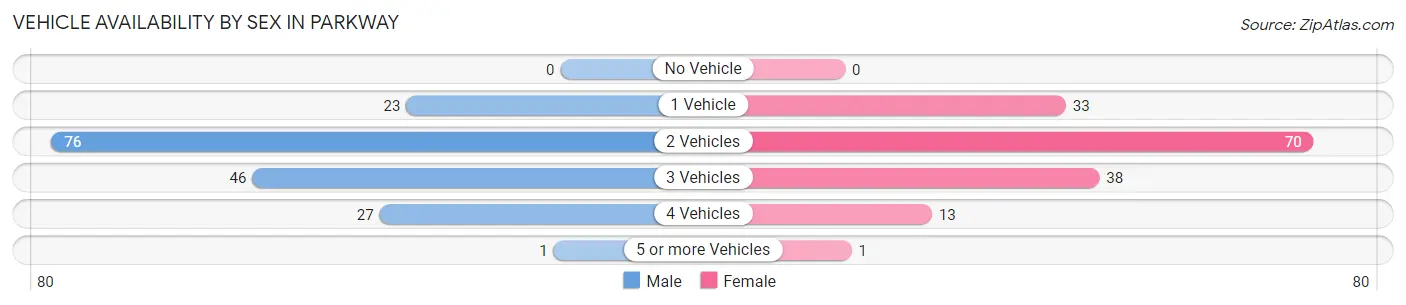
| Vehicles Available | Male | Female |
| No Vehicle | 0 (0.0%) | 0 (0.0%) |
| 1 Vehicle | 23 (13.3%) | 33 (21.3%) |
| 2 Vehicles | 76 (43.9%) | 70 (45.2%) |
| 3 Vehicles | 46 (26.6%) | 38 (24.5%) |
| 4 Vehicles | 27 (15.6%) | 13 (8.4%) |
| 5 or more Vehicles | 1 (0.6%) | 1 (0.6%) |
| Total | 173 (100.0%) | 155 (100.0%) |
Commute Time in Parkway
The most frequently occuring commute durations in Parkway are 60 to 89 minutes (64 commuters, 19.8%), 20 to 24 minutes (61 commuters, 18.9%), and 15 to 19 minutes (36 commuters, 11.2%).
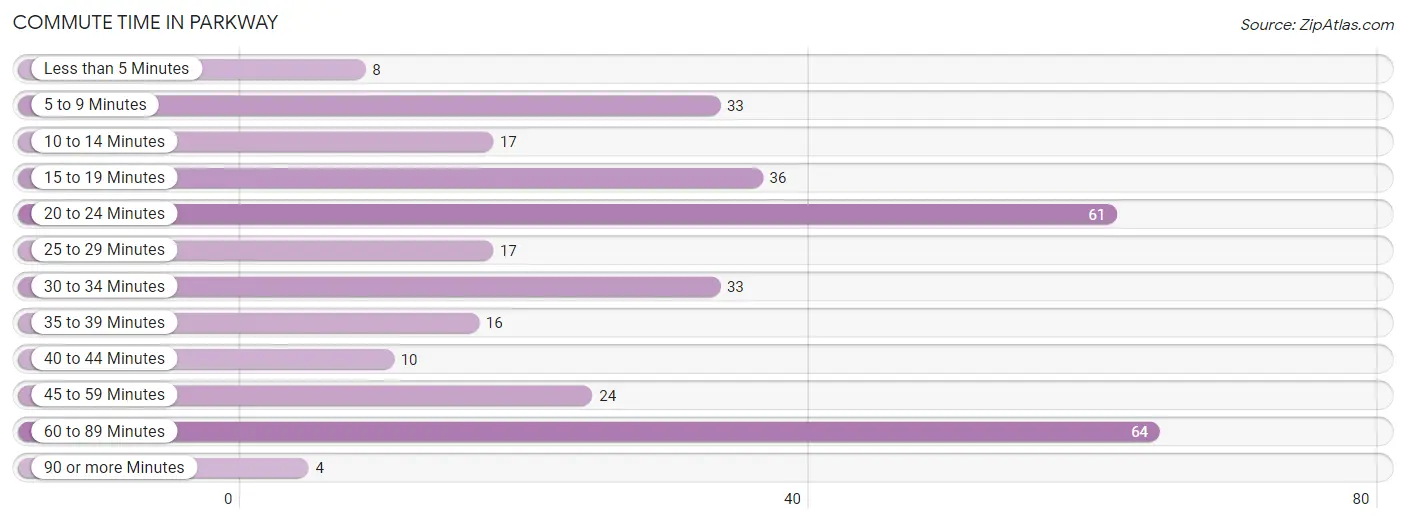
| Commute Time | # Commuters | % Commuters |
| Less than 5 Minutes | 8 | 2.5% |
| 5 to 9 Minutes | 33 | 10.2% |
| 10 to 14 Minutes | 17 | 5.3% |
| 15 to 19 Minutes | 36 | 11.2% |
| 20 to 24 Minutes | 61 | 18.9% |
| 25 to 29 Minutes | 17 | 5.3% |
| 30 to 34 Minutes | 33 | 10.2% |
| 35 to 39 Minutes | 16 | 5.0% |
| 40 to 44 Minutes | 10 | 3.1% |
| 45 to 59 Minutes | 24 | 7.4% |
| 60 to 89 Minutes | 64 | 19.8% |
| 90 or more Minutes | 4 | 1.2% |
Commute Time by Sex in Parkway
The most common commute times in Parkway are 60 to 89 minutes (44 commuters, 25.4%) for males and 20 to 24 minutes (48 commuters, 32.0%) for females.
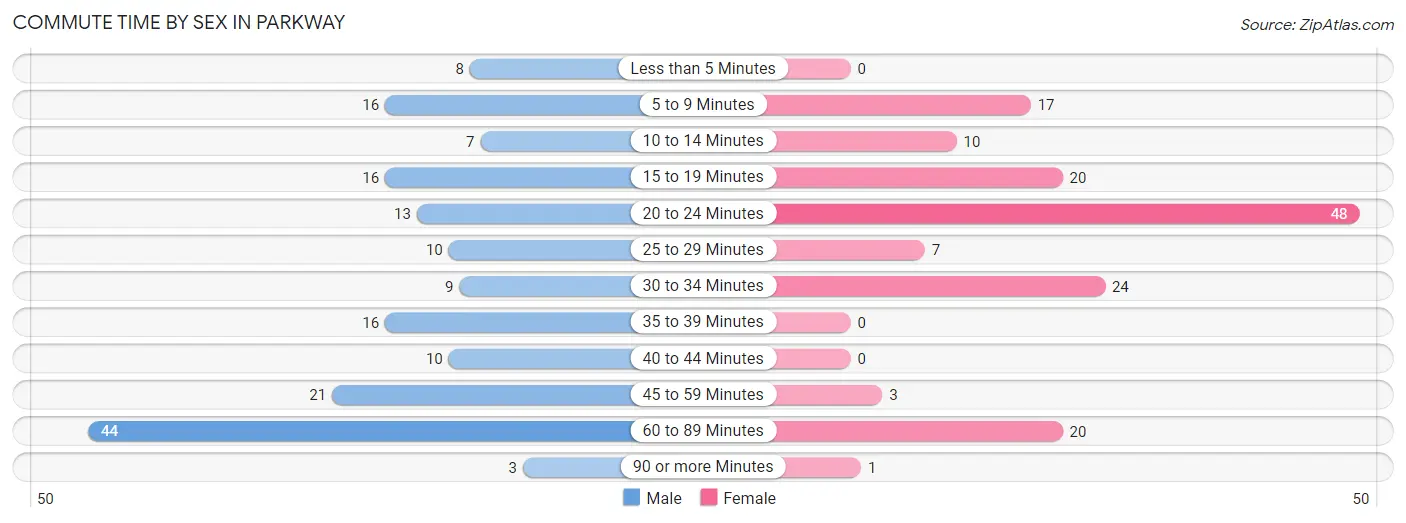
| Commute Time | Male | Female |
| Less than 5 Minutes | 8 (4.6%) | 0 (0.0%) |
| 5 to 9 Minutes | 16 (9.2%) | 17 (11.3%) |
| 10 to 14 Minutes | 7 (4.1%) | 10 (6.7%) |
| 15 to 19 Minutes | 16 (9.2%) | 20 (13.3%) |
| 20 to 24 Minutes | 13 (7.5%) | 48 (32.0%) |
| 25 to 29 Minutes | 10 (5.8%) | 7 (4.7%) |
| 30 to 34 Minutes | 9 (5.2%) | 24 (16.0%) |
| 35 to 39 Minutes | 16 (9.2%) | 0 (0.0%) |
| 40 to 44 Minutes | 10 (5.8%) | 0 (0.0%) |
| 45 to 59 Minutes | 21 (12.1%) | 3 (2.0%) |
| 60 to 89 Minutes | 44 (25.4%) | 20 (13.3%) |
| 90 or more Minutes | 3 (1.7%) | 1 (0.7%) |
Time of Departure to Work by Sex in Parkway
The most frequent times of departure to work in Parkway are 6:00 AM to 6:29 AM (40, 23.1%) for males and 7:00 AM to 7:29 AM (35, 23.3%) for females.
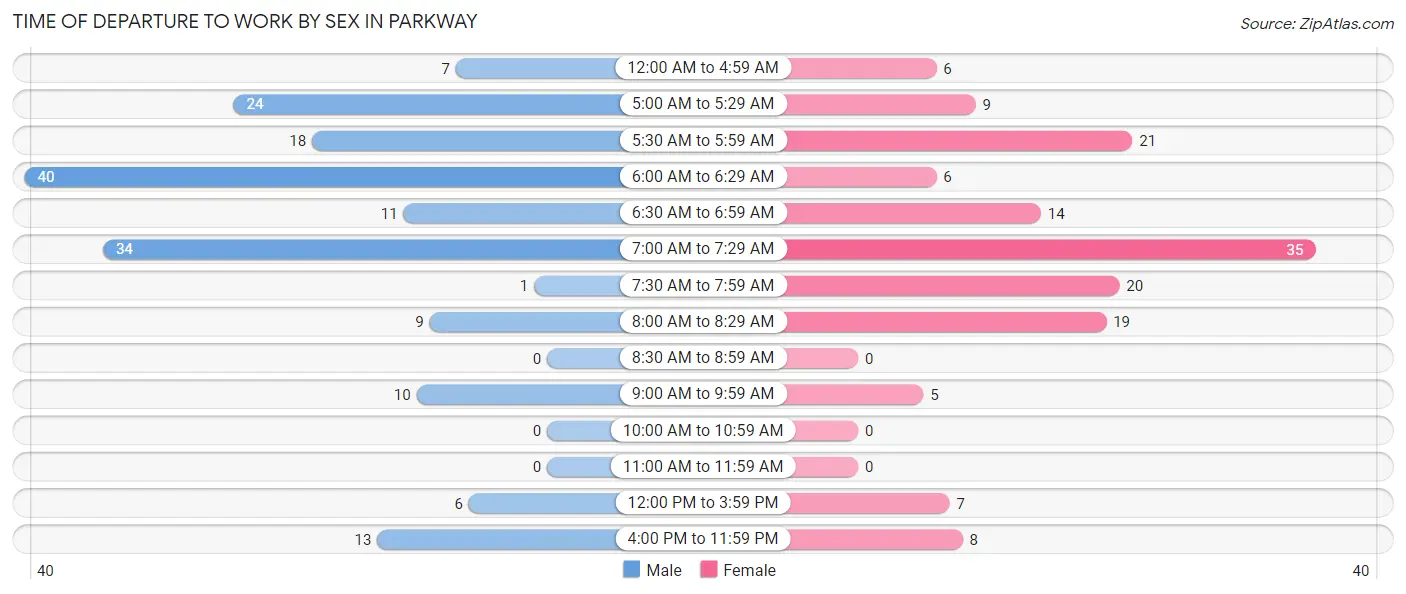
| Time of Departure | Male | Female |
| 12:00 AM to 4:59 AM | 7 (4.1%) | 6 (4.0%) |
| 5:00 AM to 5:29 AM | 24 (13.9%) | 9 (6.0%) |
| 5:30 AM to 5:59 AM | 18 (10.4%) | 21 (14.0%) |
| 6:00 AM to 6:29 AM | 40 (23.1%) | 6 (4.0%) |
| 6:30 AM to 6:59 AM | 11 (6.4%) | 14 (9.3%) |
| 7:00 AM to 7:29 AM | 34 (19.7%) | 35 (23.3%) |
| 7:30 AM to 7:59 AM | 1 (0.6%) | 20 (13.3%) |
| 8:00 AM to 8:29 AM | 9 (5.2%) | 19 (12.7%) |
| 8:30 AM to 8:59 AM | 0 (0.0%) | 0 (0.0%) |
| 9:00 AM to 9:59 AM | 10 (5.8%) | 5 (3.3%) |
| 10:00 AM to 10:59 AM | 0 (0.0%) | 0 (0.0%) |
| 11:00 AM to 11:59 AM | 0 (0.0%) | 0 (0.0%) |
| 12:00 PM to 3:59 PM | 6 (3.5%) | 7 (4.7%) |
| 4:00 PM to 11:59 PM | 13 (7.5%) | 8 (5.3%) |
| Total | 173 (100.0%) | 150 (100.0%) |
Housing Occupancy in Parkway
Occupancy by Ownership in Parkway
Of the total 294 dwellings in Parkway, owner-occupied units account for 158 (53.7%), while renter-occupied units make up 136 (46.3%).
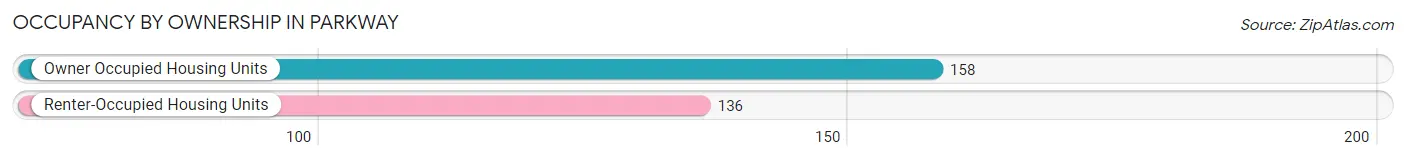
| Occupancy | # Housing Units | % Housing Units |
| Owner Occupied Housing Units | 158 | 53.7% |
| Renter-Occupied Housing Units | 136 | 46.3% |
| Total Occupied Housing Units | 294 | 100.0% |
Occupancy by Household Size in Parkway
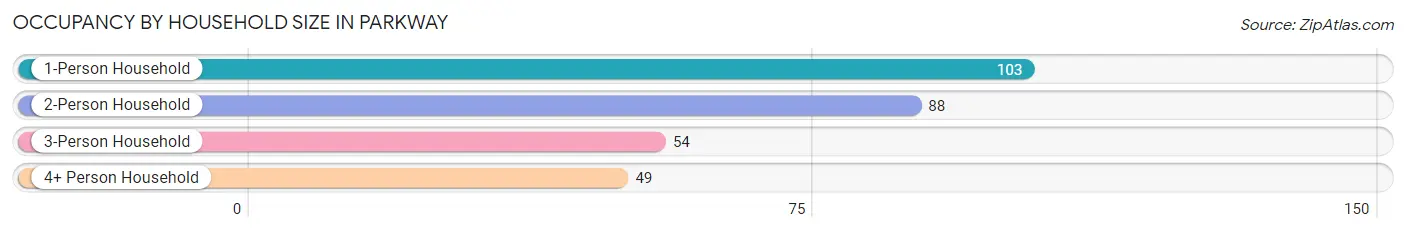
| Household Size | # Housing Units | % Housing Units |
| 1-Person Household | 103 | 35.0% |
| 2-Person Household | 88 | 29.9% |
| 3-Person Household | 54 | 18.4% |
| 4+ Person Household | 49 | 16.7% |
| Total Housing Units | 294 | 100.0% |
Occupancy by Ownership by Household Size in Parkway
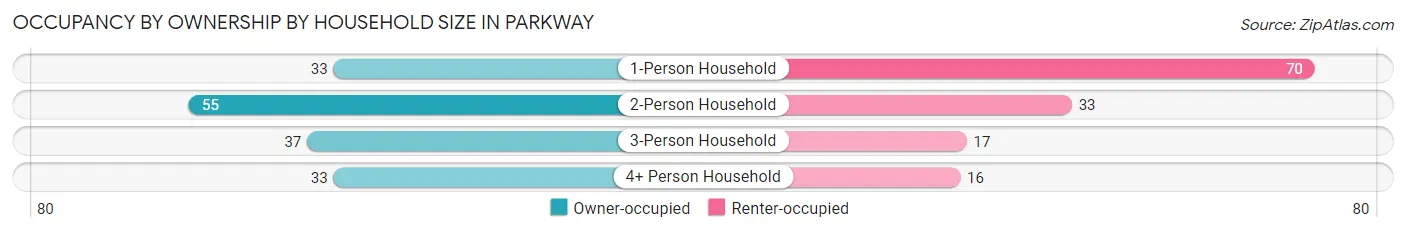
| Household Size | Owner-occupied | Renter-occupied |
| 1-Person Household | 33 (32.0%) | 70 (68.0%) |
| 2-Person Household | 55 (62.5%) | 33 (37.5%) |
| 3-Person Household | 37 (68.5%) | 17 (31.5%) |
| 4+ Person Household | 33 (67.3%) | 16 (32.7%) |
| Total Housing Units | 158 (53.7%) | 136 (46.3%) |
Occupancy by Educational Attainment in Parkway
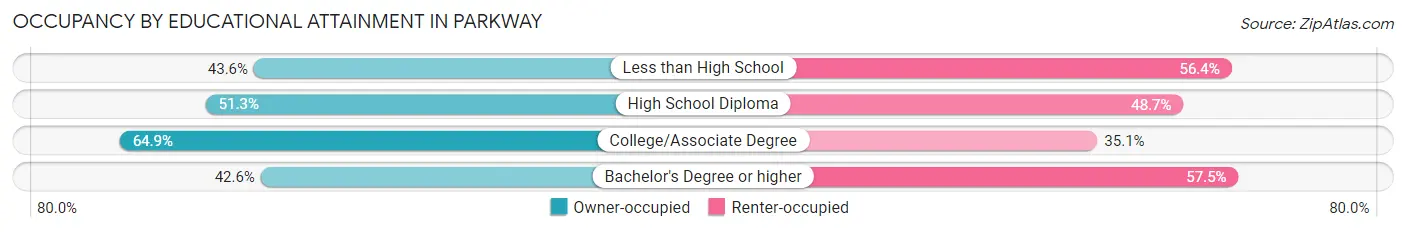
| Household Size | Owner-occupied | Renter-occupied |
| Less than High School | 24 (43.6%) | 31 (56.4%) |
| High School Diploma | 40 (51.3%) | 38 (48.7%) |
| College/Associate Degree | 74 (64.9%) | 40 (35.1%) |
| Bachelor's Degree or higher | 20 (42.5%) | 27 (57.5%) |
Occupancy by Age of Householder in Parkway
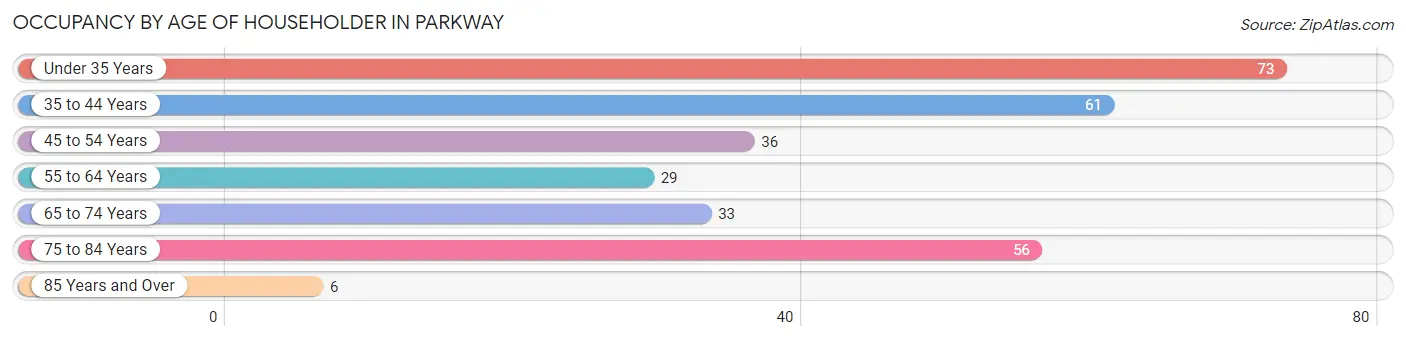
| Age Bracket | # Households | % Households |
| Under 35 Years | 73 | 24.8% |
| 35 to 44 Years | 61 | 20.7% |
| 45 to 54 Years | 36 | 12.2% |
| 55 to 64 Years | 29 | 9.9% |
| 65 to 74 Years | 33 | 11.2% |
| 75 to 84 Years | 56 | 19.1% |
| 85 Years and Over | 6 | 2.0% |
| Total | 294 | 100.0% |
Housing Finances in Parkway
Median Income by Occupancy in Parkway
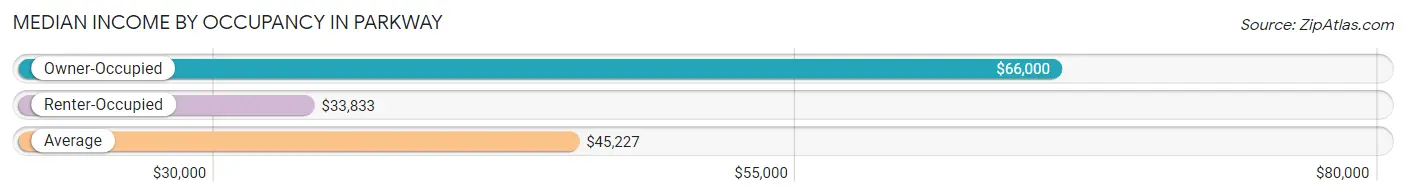
| Occupancy Type | # Households | Median Income |
| Owner-Occupied | 158 (53.7%) | $66,000 |
| Renter-Occupied | 136 (46.3%) | $33,833 |
| Average | 294 (100.0%) | $45,227 |
Occupancy by Householder Income Bracket in Parkway
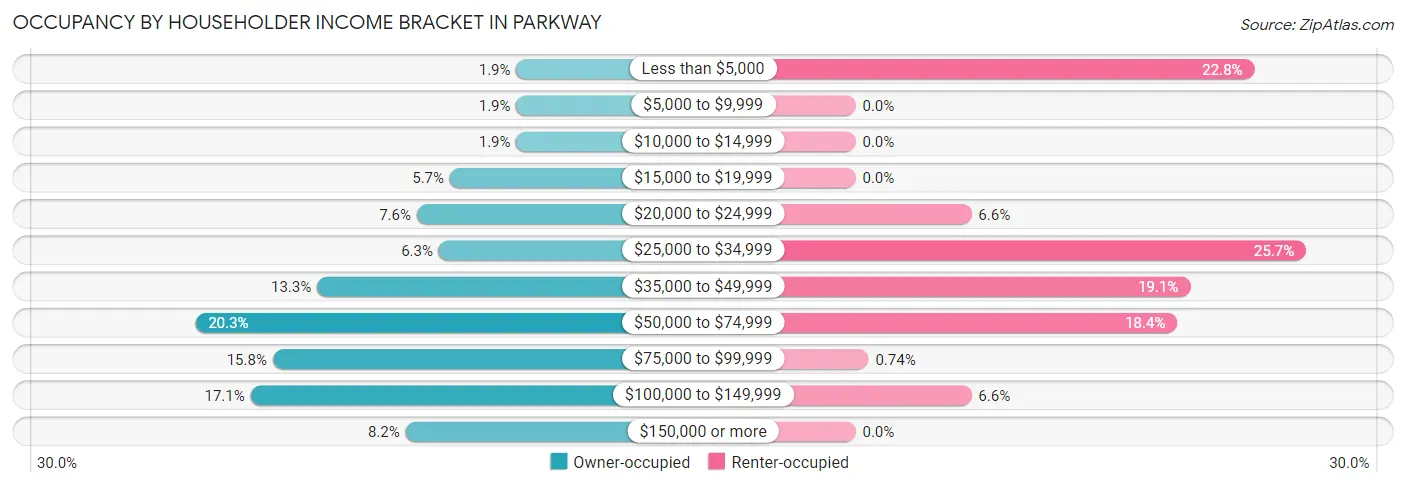
| Income Bracket | Owner-occupied | Renter-occupied |
| Less than $5,000 | 3 (1.9%) | 31 (22.8%) |
| $5,000 to $9,999 | 3 (1.9%) | 0 (0.0%) |
| $10,000 to $14,999 | 3 (1.9%) | 0 (0.0%) |
| $15,000 to $19,999 | 9 (5.7%) | 0 (0.0%) |
| $20,000 to $24,999 | 12 (7.6%) | 9 (6.6%) |
| $25,000 to $34,999 | 10 (6.3%) | 35 (25.7%) |
| $35,000 to $49,999 | 21 (13.3%) | 26 (19.1%) |
| $50,000 to $74,999 | 32 (20.3%) | 25 (18.4%) |
| $75,000 to $99,999 | 25 (15.8%) | 1 (0.7%) |
| $100,000 to $149,999 | 27 (17.1%) | 9 (6.6%) |
| $150,000 or more | 13 (8.2%) | 0 (0.0%) |
| Total | 158 (100.0%) | 136 (100.0%) |
Monthly Housing Cost Tiers in Parkway
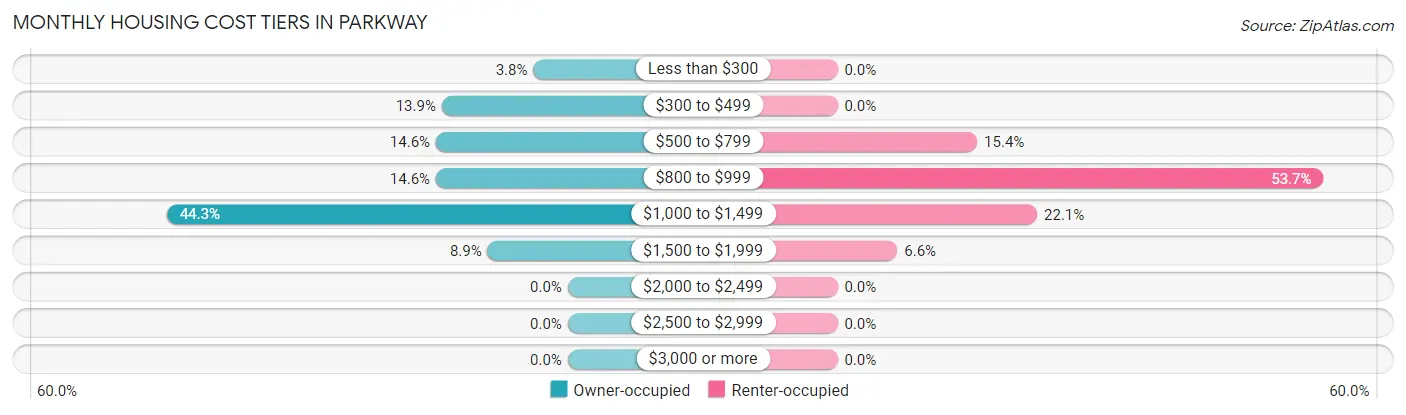
| Monthly Cost | Owner-occupied | Renter-occupied |
| Less than $300 | 6 (3.8%) | 0 (0.0%) |
| $300 to $499 | 22 (13.9%) | 0 (0.0%) |
| $500 to $799 | 23 (14.6%) | 21 (15.4%) |
| $800 to $999 | 23 (14.6%) | 73 (53.7%) |
| $1,000 to $1,499 | 70 (44.3%) | 30 (22.1%) |
| $1,500 to $1,999 | 14 (8.9%) | 9 (6.6%) |
| $2,000 to $2,499 | 0 (0.0%) | 0 (0.0%) |
| $2,500 to $2,999 | 0 (0.0%) | 0 (0.0%) |
| $3,000 or more | 0 (0.0%) | 0 (0.0%) |
| Total | 158 (100.0%) | 136 (100.0%) |
Physical Housing Characteristics in Parkway
Housing Structures in Parkway
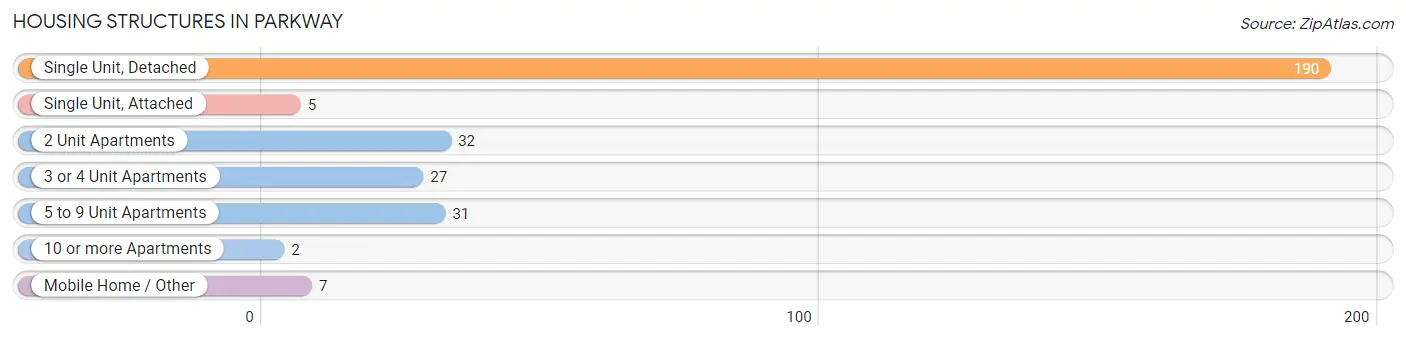
| Structure Type | # Housing Units | % Housing Units |
| Single Unit, Detached | 190 | 64.6% |
| Single Unit, Attached | 5 | 1.7% |
| 2 Unit Apartments | 32 | 10.9% |
| 3 or 4 Unit Apartments | 27 | 9.2% |
| 5 to 9 Unit Apartments | 31 | 10.5% |
| 10 or more Apartments | 2 | 0.7% |
| Mobile Home / Other | 7 | 2.4% |
| Total | 294 | 100.0% |
Housing Structures by Occupancy in Parkway
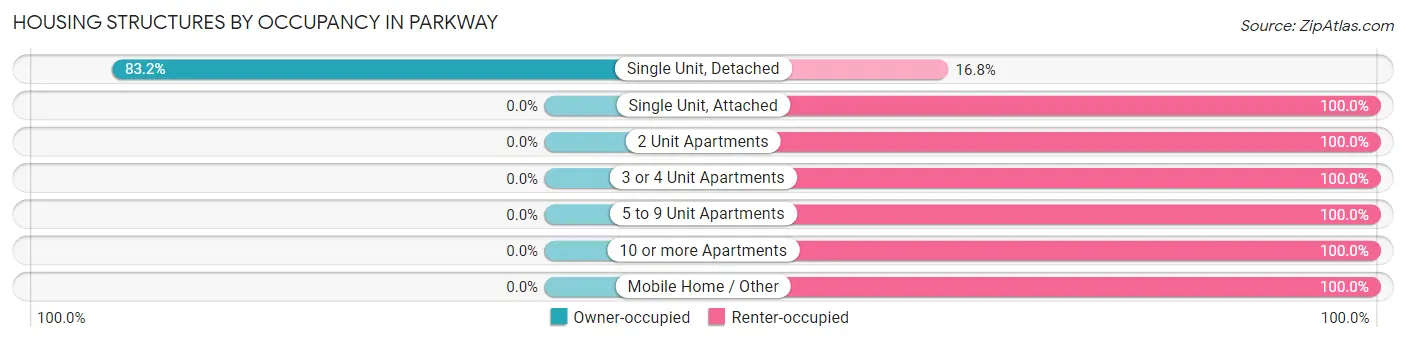
| Structure Type | Owner-occupied | Renter-occupied |
| Single Unit, Detached | 158 (83.2%) | 32 (16.8%) |
| Single Unit, Attached | 0 (0.0%) | 5 (100.0%) |
| 2 Unit Apartments | 0 (0.0%) | 32 (100.0%) |
| 3 or 4 Unit Apartments | 0 (0.0%) | 27 (100.0%) |
| 5 to 9 Unit Apartments | 0 (0.0%) | 31 (100.0%) |
| 10 or more Apartments | 0 (0.0%) | 2 (100.0%) |
| Mobile Home / Other | 0 (0.0%) | 7 (100.0%) |
| Total | 158 (53.7%) | 136 (46.3%) |
Housing Structures by Number of Rooms in Parkway
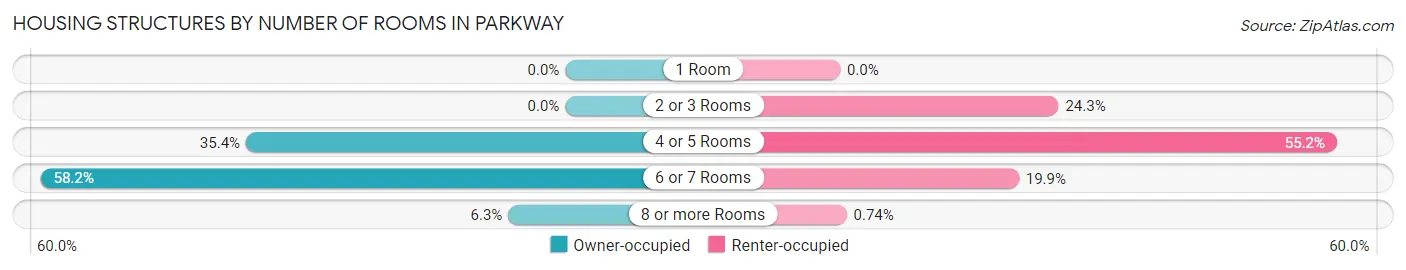
| Number of Rooms | Owner-occupied | Renter-occupied |
| 1 Room | 0 (0.0%) | 0 (0.0%) |
| 2 or 3 Rooms | 0 (0.0%) | 33 (24.3%) |
| 4 or 5 Rooms | 56 (35.4%) | 75 (55.1%) |
| 6 or 7 Rooms | 92 (58.2%) | 27 (19.9%) |
| 8 or more Rooms | 10 (6.3%) | 1 (0.7%) |
| Total | 158 (100.0%) | 136 (100.0%) |
Housing Structure by Heating Type in Parkway
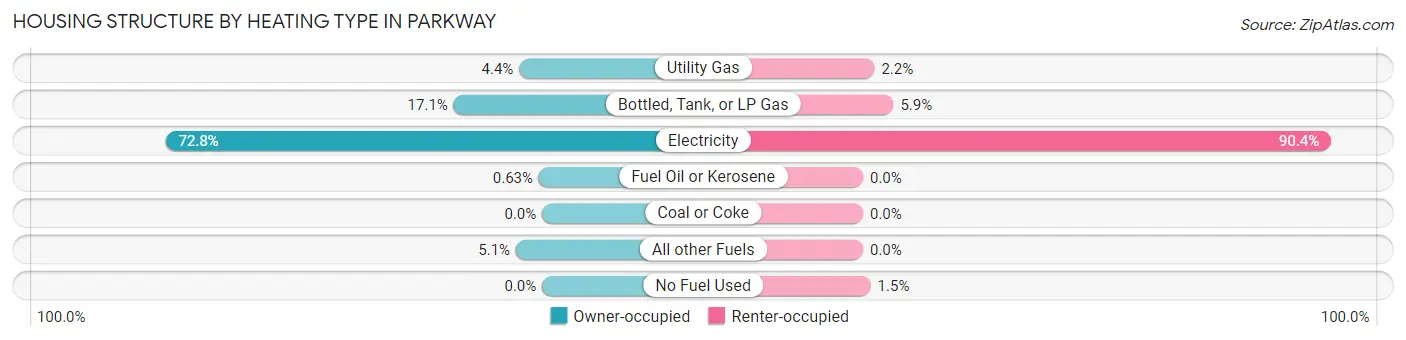
| Heating Type | Owner-occupied | Renter-occupied |
| Utility Gas | 7 (4.4%) | 3 (2.2%) |
| Bottled, Tank, or LP Gas | 27 (17.1%) | 8 (5.9%) |
| Electricity | 115 (72.8%) | 123 (90.4%) |
| Fuel Oil or Kerosene | 1 (0.6%) | 0 (0.0%) |
| Coal or Coke | 0 (0.0%) | 0 (0.0%) |
| All other Fuels | 8 (5.1%) | 0 (0.0%) |
| No Fuel Used | 0 (0.0%) | 2 (1.5%) |
| Total | 158 (100.0%) | 136 (100.0%) |
Household Vehicle Usage in Parkway
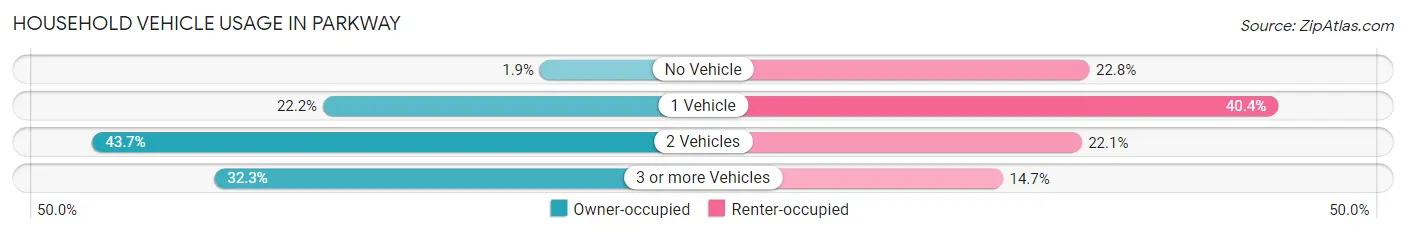
| Vehicles per Household | Owner-occupied | Renter-occupied |
| No Vehicle | 3 (1.9%) | 31 (22.8%) |
| 1 Vehicle | 35 (22.2%) | 55 (40.4%) |
| 2 Vehicles | 69 (43.7%) | 30 (22.1%) |
| 3 or more Vehicles | 51 (32.3%) | 20 (14.7%) |
| Total | 158 (100.0%) | 136 (100.0%) |
Real Estate & Mortgages in Parkway
Real Estate and Mortgage Overview in Parkway
| Characteristic | Without Mortgage | With Mortgage |
| Housing Units | 44 | 114 |
| Median Property Value | $138,900 | $157,400 |
| Median Household Income | $67,500 | $13 |
| Monthly Housing Costs | $473 | $0 |
| Real Estate Taxes | $1,625 | $0 |
Property Value by Mortgage Status in Parkway
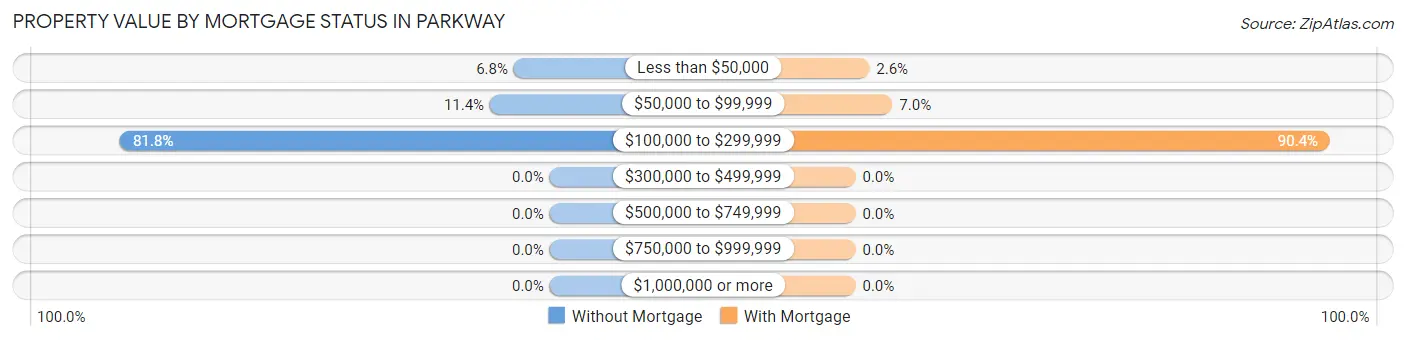
| Property Value | Without Mortgage | With Mortgage |
| Less than $50,000 | 3 (6.8%) | 3 (2.6%) |
| $50,000 to $99,999 | 5 (11.4%) | 8 (7.0%) |
| $100,000 to $299,999 | 36 (81.8%) | 103 (90.3%) |
| $300,000 to $499,999 | 0 (0.0%) | 0 (0.0%) |
| $500,000 to $749,999 | 0 (0.0%) | 0 (0.0%) |
| $750,000 to $999,999 | 0 (0.0%) | 0 (0.0%) |
| $1,000,000 or more | 0 (0.0%) | 0 (0.0%) |
| Total | 44 (100.0%) | 114 (100.0%) |
Household Income by Mortgage Status in Parkway
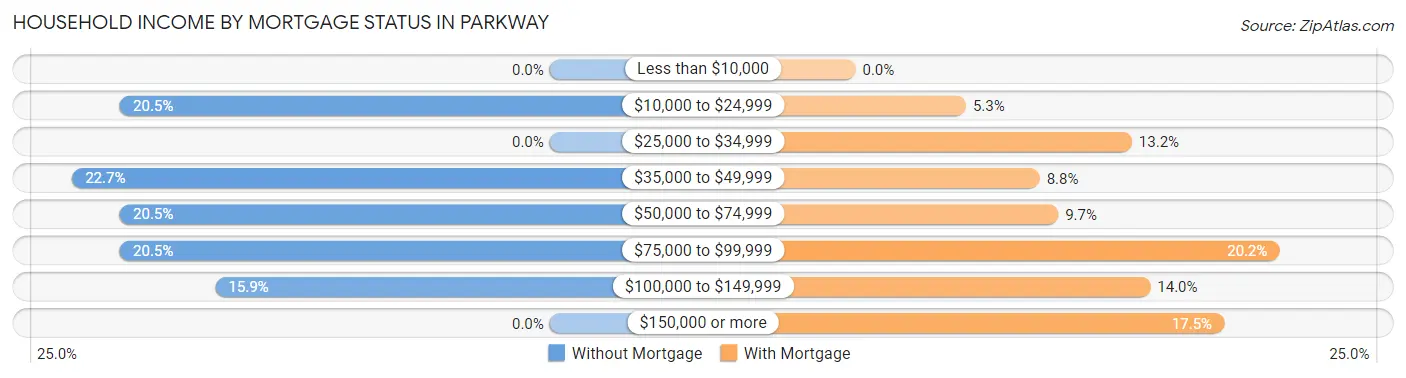
| Household Income | Without Mortgage | With Mortgage |
| Less than $10,000 | 0 (0.0%) | 0 (0.0%) |
| $10,000 to $24,999 | 9 (20.4%) | 6 (5.3%) |
| $25,000 to $34,999 | 0 (0.0%) | 15 (13.2%) |
| $35,000 to $49,999 | 10 (22.7%) | 10 (8.8%) |
| $50,000 to $74,999 | 9 (20.4%) | 11 (9.7%) |
| $75,000 to $99,999 | 9 (20.4%) | 23 (20.2%) |
| $100,000 to $149,999 | 7 (15.9%) | 16 (14.0%) |
| $150,000 or more | 0 (0.0%) | 20 (17.5%) |
| Total | 44 (100.0%) | 114 (100.0%) |
Property Value to Household Income Ratio in Parkway
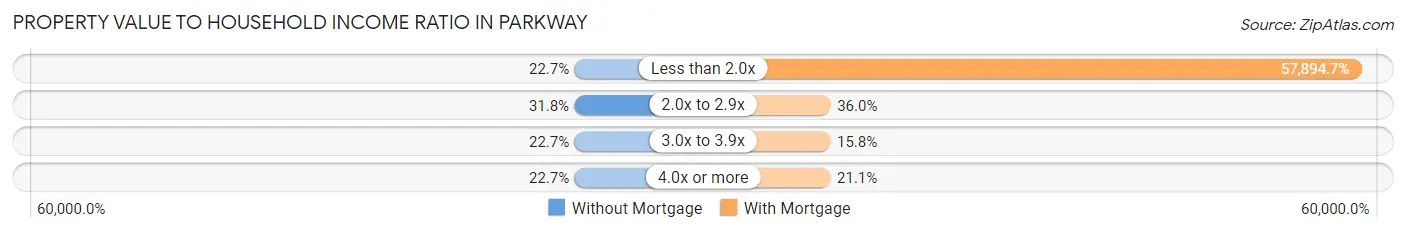
| Value-to-Income Ratio | Without Mortgage | With Mortgage |
| Less than 2.0x | 10 (22.7%) | 66,000 (57,894.7%) |
| 2.0x to 2.9x | 14 (31.8%) | 41 (36.0%) |
| 3.0x to 3.9x | 10 (22.7%) | 18 (15.8%) |
| 4.0x or more | 10 (22.7%) | 24 (21.0%) |
| Total | 44 (100.0%) | 114 (100.0%) |
Real Estate Taxes by Mortgage Status in Parkway
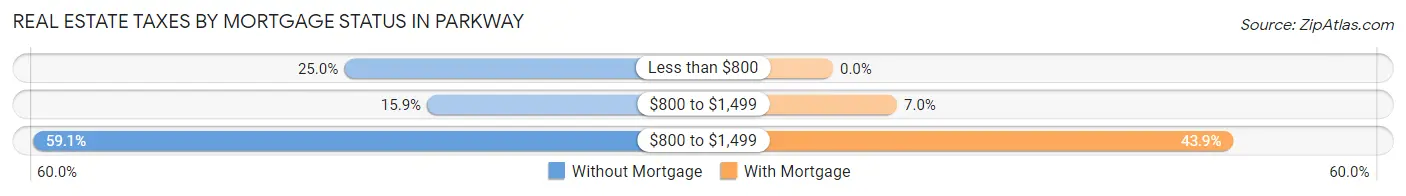
| Property Taxes | Without Mortgage | With Mortgage |
| Less than $800 | 11 (25.0%) | 0 (0.0%) |
| $800 to $1,499 | 7 (15.9%) | 8 (7.0%) |
| $800 to $1,499 | 26 (59.1%) | 50 (43.9%) |
| Total | 44 (100.0%) | 114 (100.0%) |
Health & Disability in Parkway
Health Insurance Coverage by Age in Parkway
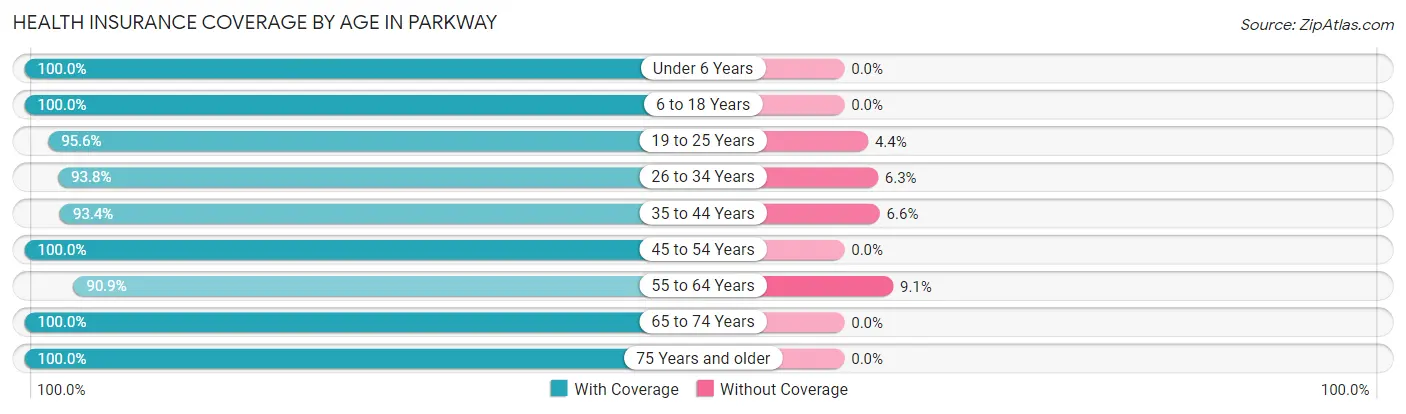
| Age Bracket | With Coverage | Without Coverage |
| Under 6 Years | 51 (100.0%) | 0 (0.0%) |
| 6 to 18 Years | 162 (100.0%) | 0 (0.0%) |
| 19 to 25 Years | 65 (95.6%) | 3 (4.4%) |
| 26 to 34 Years | 105 (93.8%) | 7 (6.2%) |
| 35 to 44 Years | 85 (93.4%) | 6 (6.6%) |
| 45 to 54 Years | 60 (100.0%) | 0 (0.0%) |
| 55 to 64 Years | 40 (90.9%) | 4 (9.1%) |
| 65 to 74 Years | 54 (100.0%) | 0 (0.0%) |
| 75 Years and older | 68 (100.0%) | 0 (0.0%) |
| Total | 690 (97.2%) | 20 (2.8%) |
Health Insurance Coverage by Citizenship Status in Parkway
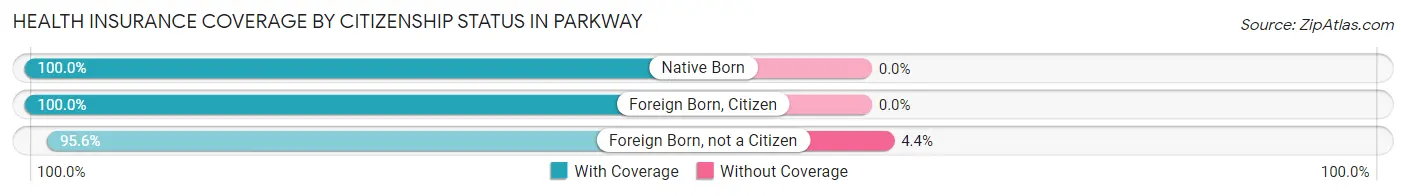
| Citizenship Status | With Coverage | Without Coverage |
| Native Born | 51 (100.0%) | 0 (0.0%) |
| Foreign Born, Citizen | 162 (100.0%) | 0 (0.0%) |
| Foreign Born, not a Citizen | 65 (95.6%) | 3 (4.4%) |
Health Insurance Coverage by Household Income in Parkway
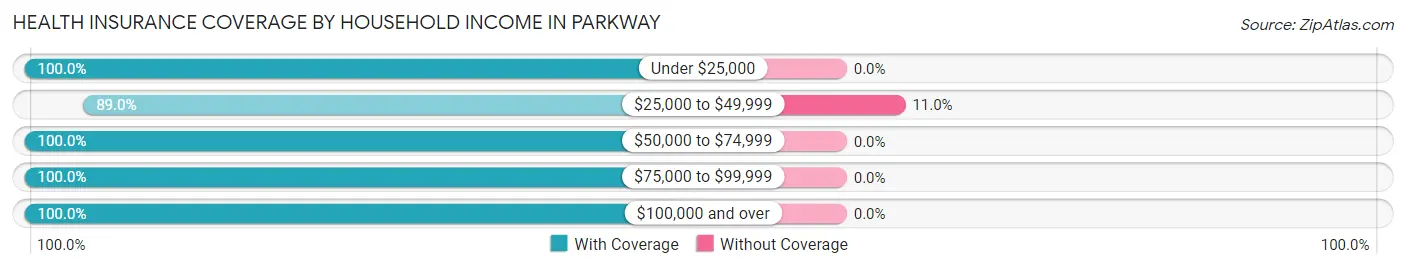
| Household Income | With Coverage | Without Coverage |
| Under $25,000 | 101 (100.0%) | 0 (0.0%) |
| $25,000 to $49,999 | 162 (89.0%) | 20 (11.0%) |
| $50,000 to $74,999 | 198 (100.0%) | 0 (0.0%) |
| $75,000 to $99,999 | 77 (100.0%) | 0 (0.0%) |
| $100,000 and over | 152 (100.0%) | 0 (0.0%) |
Public vs Private Health Insurance Coverage by Age in Parkway
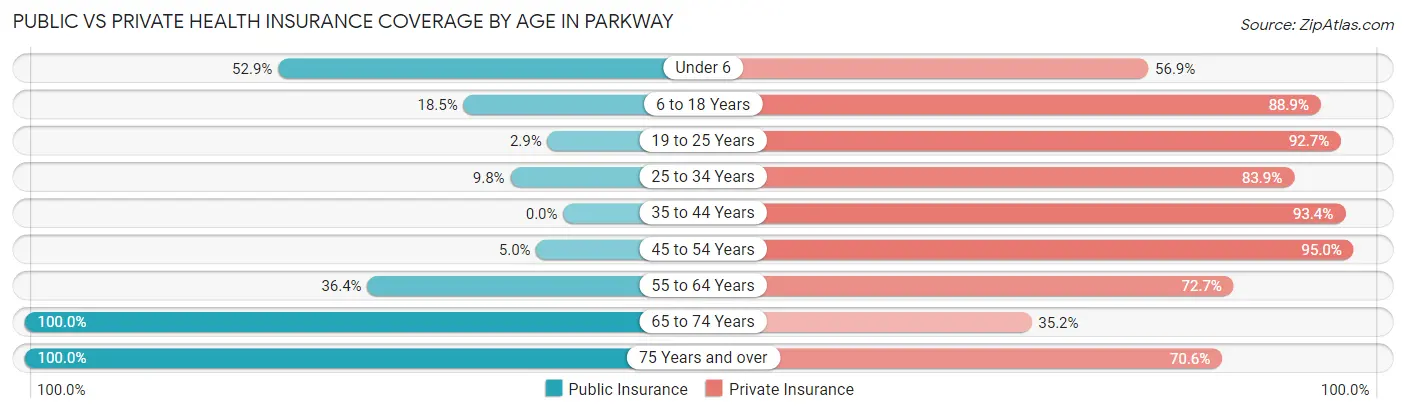
| Age Bracket | Public Insurance | Private Insurance |
| Under 6 | 27 (52.9%) | 29 (56.9%) |
| 6 to 18 Years | 30 (18.5%) | 144 (88.9%) |
| 19 to 25 Years | 2 (2.9%) | 63 (92.6%) |
| 25 to 34 Years | 11 (9.8%) | 94 (83.9%) |
| 35 to 44 Years | 0 (0.0%) | 85 (93.4%) |
| 45 to 54 Years | 3 (5.0%) | 57 (95.0%) |
| 55 to 64 Years | 16 (36.4%) | 32 (72.7%) |
| 65 to 74 Years | 54 (100.0%) | 19 (35.2%) |
| 75 Years and over | 68 (100.0%) | 48 (70.6%) |
| Total | 211 (29.7%) | 571 (80.4%) |
Disability Status by Sex by Age in Parkway
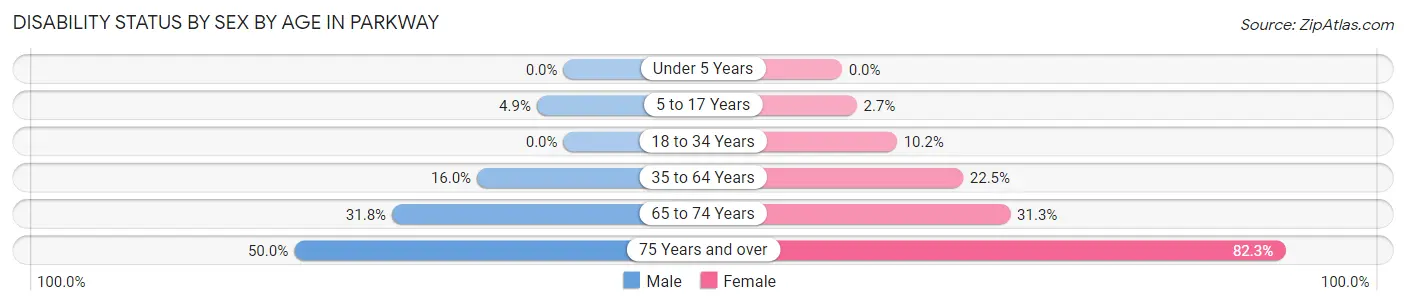
| Age Bracket | Male | Female |
| Under 5 Years | 0 (0.0%) | 0 (0.0%) |
| 5 to 17 Years | 4 (4.9%) | 2 (2.7%) |
| 18 to 34 Years | 0 (0.0%) | 11 (10.2%) |
| 35 to 64 Years | 17 (16.0%) | 20 (22.5%) |
| 65 to 74 Years | 7 (31.8%) | 10 (31.2%) |
| 75 Years and over | 3 (50.0%) | 51 (82.3%) |
Disability Class by Sex by Age in Parkway
Disability Class: Hearing Difficulty
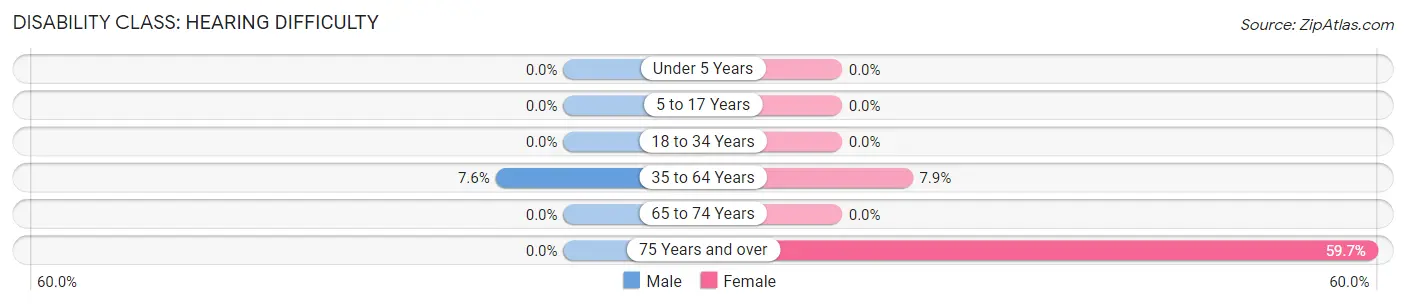
| Age Bracket | Male | Female |
| Under 5 Years | 0 (0.0%) | 0 (0.0%) |
| 5 to 17 Years | 0 (0.0%) | 0 (0.0%) |
| 18 to 34 Years | 0 (0.0%) | 0 (0.0%) |
| 35 to 64 Years | 8 (7.5%) | 7 (7.9%) |
| 65 to 74 Years | 0 (0.0%) | 0 (0.0%) |
| 75 Years and over | 0 (0.0%) | 37 (59.7%) |
Disability Class: Vision Difficulty
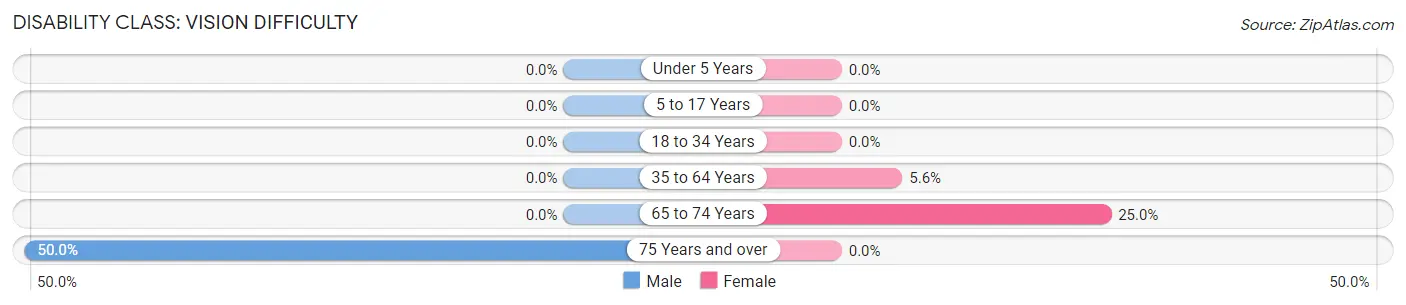
| Age Bracket | Male | Female |
| Under 5 Years | 0 (0.0%) | 0 (0.0%) |
| 5 to 17 Years | 0 (0.0%) | 0 (0.0%) |
| 18 to 34 Years | 0 (0.0%) | 0 (0.0%) |
| 35 to 64 Years | 0 (0.0%) | 5 (5.6%) |
| 65 to 74 Years | 0 (0.0%) | 8 (25.0%) |
| 75 Years and over | 3 (50.0%) | 0 (0.0%) |
Disability Class: Cognitive Difficulty
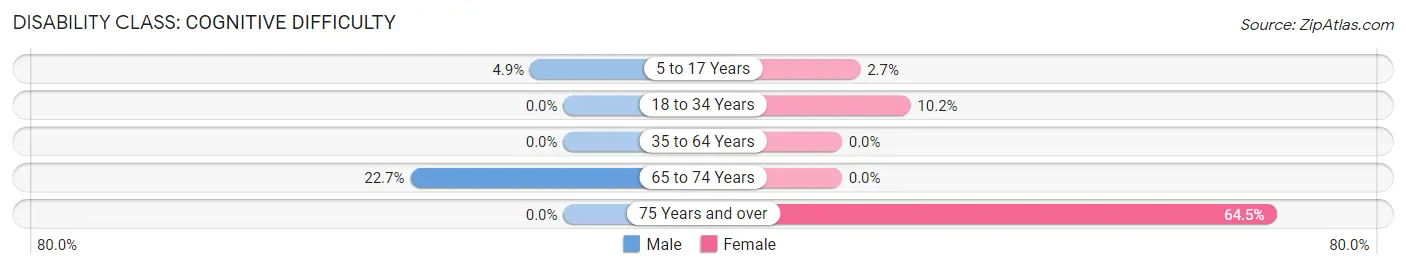
| Age Bracket | Male | Female |
| 5 to 17 Years | 4 (4.9%) | 2 (2.7%) |
| 18 to 34 Years | 0 (0.0%) | 11 (10.2%) |
| 35 to 64 Years | 0 (0.0%) | 0 (0.0%) |
| 65 to 74 Years | 5 (22.7%) | 0 (0.0%) |
| 75 Years and over | 0 (0.0%) | 40 (64.5%) |
Disability Class: Ambulatory Difficulty
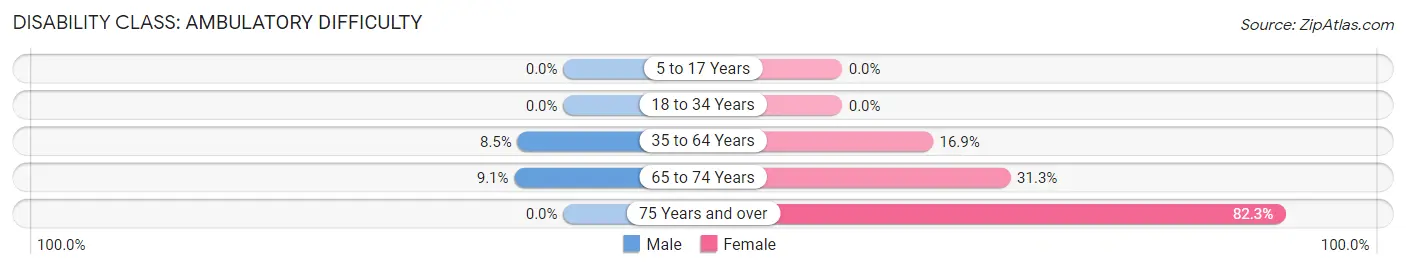
| Age Bracket | Male | Female |
| 5 to 17 Years | 0 (0.0%) | 0 (0.0%) |
| 18 to 34 Years | 0 (0.0%) | 0 (0.0%) |
| 35 to 64 Years | 9 (8.5%) | 15 (16.9%) |
| 65 to 74 Years | 2 (9.1%) | 10 (31.2%) |
| 75 Years and over | 0 (0.0%) | 51 (82.3%) |
Disability Class: Self-Care Difficulty
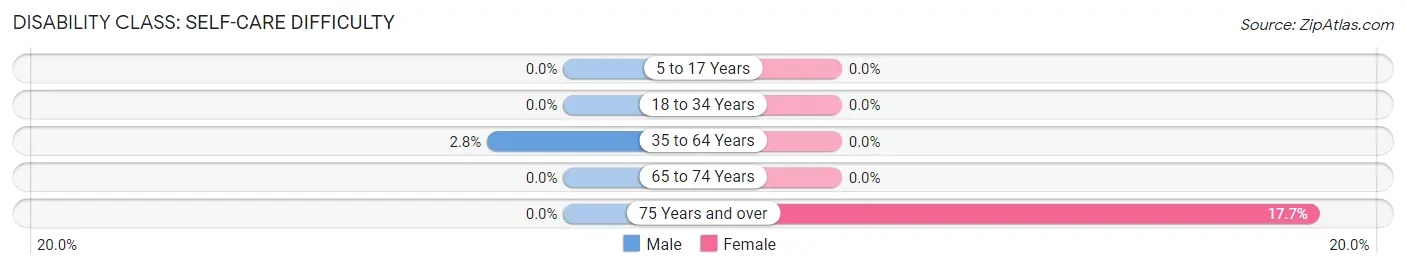
| Age Bracket | Male | Female |
| 5 to 17 Years | 0 (0.0%) | 0 (0.0%) |
| 18 to 34 Years | 0 (0.0%) | 0 (0.0%) |
| 35 to 64 Years | 3 (2.8%) | 0 (0.0%) |
| 65 to 74 Years | 0 (0.0%) | 0 (0.0%) |
| 75 Years and over | 0 (0.0%) | 11 (17.7%) |
Technology Access in Parkway
Computing Device Access in Parkway
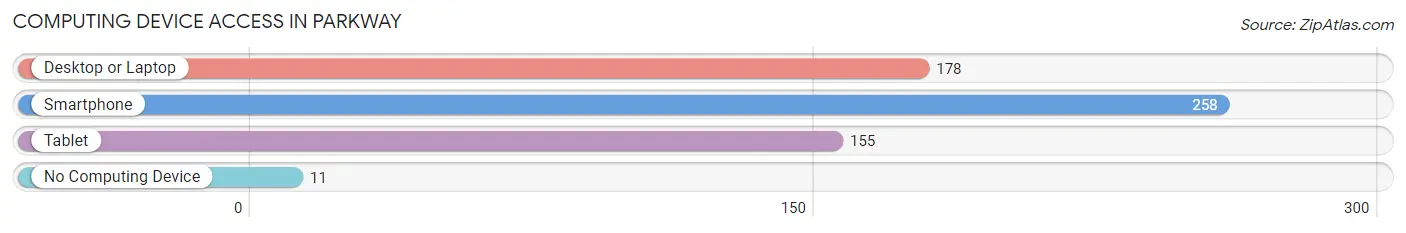
| Device Type | # Households | % Households |
| Desktop or Laptop | 178 | 60.5% |
| Smartphone | 258 | 87.8% |
| Tablet | 155 | 52.7% |
| No Computing Device | 11 | 3.7% |
| Total | 294 | 100.0% |
Internet Access in Parkway
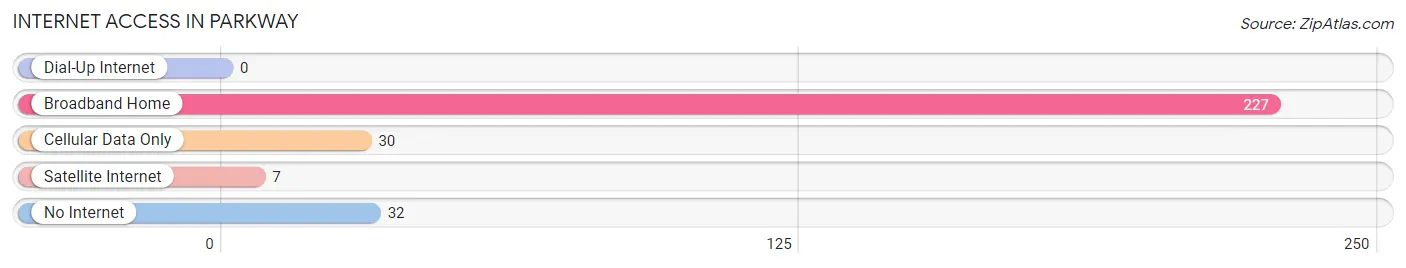
| Internet Type | # Households | % Households |
| Dial-Up Internet | 0 | 0.0% |
| Broadband Home | 227 | 77.2% |
| Cellular Data Only | 30 | 10.2% |
| Satellite Internet | 7 | 2.4% |
| No Internet | 32 | 10.9% |
| Total | 294 | 100.0% |
Parkway Summary
Parkway, Missouri is a small city located in St. Louis County, Missouri. It is a suburb of St. Louis and is located approximately 15 miles west of the city. The city was incorporated in 1949 and has a population of approximately 8,000 people.
Geography
Parkway is located in the western part of St. Louis County, Missouri. It is bordered by the cities of Ballwin, Manchester, and Ellisville. The city is situated on the Meramec River and is surrounded by rolling hills and wooded areas. The city has a total area of 4.2 square miles, all of which is land.
Climate
Parkway has a humid continental climate, with hot, humid summers and cold, snowy winters. The average annual temperature is around 54 degrees Fahrenheit, with an average high of around 78 degrees in the summer and an average low of around 30 degrees in the winter. The average annual precipitation is around 40 inches.
Demographics
As of the 2010 census, the population of Parkway was 8,068. The racial makeup of the city was 87.3% White, 5.3% African American, 0.3% Native American, 2.7% Asian, 0.1% Pacific Islander, 1.7% from other races, and 2.6% from two or more races. Hispanic or Latino of any race were 4.2% of the population.
Economy
Parkway is home to a variety of businesses, including retail stores, restaurants, and professional services. The city is also home to several large employers, including the St. Louis County Government, the St. Louis County Police Department, and the St. Louis County Library.
Education
Parkway is served by the Parkway School District, which consists of seven elementary schools, two middle schools, and one high school. The district also operates a number of alternative education programs, including a virtual school and a home school program.
Transportation
Parkway is served by several major highways, including Interstate 270, Interstate 44, and U.S. Route 67. The city is also served by MetroLink, the light rail system in St. Louis.
Culture
Parkway is home to a variety of cultural attractions, including the Parkway Theater, the Parkway Arts Center, and the Parkway Museum. The city also hosts a number of annual events, including the Parkway Summer Festival and the Parkway Fall Festival.
Conclusion
Parkway, Missouri is a small city located in St. Louis County, Missouri. It is a suburb of St. Louis and is located approximately 15 miles west of the city. The city was incorporated in 1949 and has a population of approximately 8,000 people. Parkway is home to a variety of businesses, including retail stores, restaurants, and professional services. The city is also served by several major highways, including Interstate 270, Interstate 44, and U.S. Route 67. Parkway is also home to a variety of cultural attractions, including the Parkway Theater, the Parkway Arts Center, and the Parkway Museum. The city is served by the Parkway School District, which consists of seven elementary schools, two middle schools, and one high school.
Common Questions
What is Per Capita Income in Parkway?
Per Capita income in Parkway is $23,675.
What is the Median Family Income in Parkway?
Median Family Income in Parkway is $62,344.
What is the Median Household income in Parkway?
Median Household Income in Parkway is $45,227.
What is Income or Wage Gap in Parkway?
Income or Wage Gap in Parkway is 31.0%.
Women in Parkway earn 69.0 cents for every dollar earned by a man.
What is Inequality or Gini Index in Parkway?
Inequality or Gini Index in Parkway is 0.43.
What is the Total Population of Parkway?
Total Population of Parkway is 766.
What is the Total Male Population of Parkway?
Total Male Population of Parkway is 347.
What is the Total Female Population of Parkway?
Total Female Population of Parkway is 419.
What is the Ratio of Males per 100 Females in Parkway?
There are 82.82 Males per 100 Females in Parkway.
What is the Ratio of Females per 100 Males in Parkway?
There are 120.75 Females per 100 Males in Parkway.
What is the Median Population Age in Parkway?
Median Population Age in Parkway is 34.2 Years.
What is the Average Family Size in Parkway
Average Family Size in Parkway is 3.2 People.
What is the Average Household Size in Parkway
Average Household Size in Parkway is 2.4 People.
How Large is the Labor Force in Parkway?
There are 359 People in the Labor Forcein in Parkway.
What is the Percentage of People in the Labor Force in Parkway?
60.7% of People are in the Labor Force in Parkway.
What is the Unemployment Rate in Parkway?
Unemployment Rate in Parkway is 8.1%.