Hurley, MO Map & Demographics
Hurley Map
Hurley Overview
$25,567
PER CAPITA INCOME
$67,083
AVG FAMILY INCOME
$56,250
AVG HOUSEHOLD INCOME
22.2%
WAGE / INCOME GAP [ % ]
77.8¢/ $1
WAGE / INCOME GAP [ $ ]
0.22
INEQUALITY / GINI INDEX
109
TOTAL POPULATION
60
MALE POPULATION
49
FEMALE POPULATION
122.45
MALES / 100 FEMALES
81.67
FEMALES / 100 MALES
35.2
MEDIAN AGE
2.9
AVG FAMILY SIZE
2.5
AVG HOUSEHOLD SIZE
71
LABOR FORCE [ PEOPLE ]
79.8%
PERCENT IN LABOR FORCE
Hurley Zip Codes
Hurley Area Codes
Income in Hurley
Income Overview in Hurley
Per Capita Income in Hurley is $25,567, while median incomes of families and households are $67,083 and $56,250 respectively.
| Characteristic | Number | Measure |
| Per Capita Income | 109 | $25,567 |
| Median Family Income | 29 | $67,083 |
| Mean Family Income | 29 | $63,576 |
| Median Household Income | 44 | $56,250 |
| Mean Household Income | 44 | $57,909 |
| Income Deficit | 29 | $0 |
| Wage / Income Gap (%) | 109 | 22.18% |
| Wage / Income Gap ($) | 109 | 77.82¢ per $1 |
| Gini / Inequality Index | 109 | 0.22 |
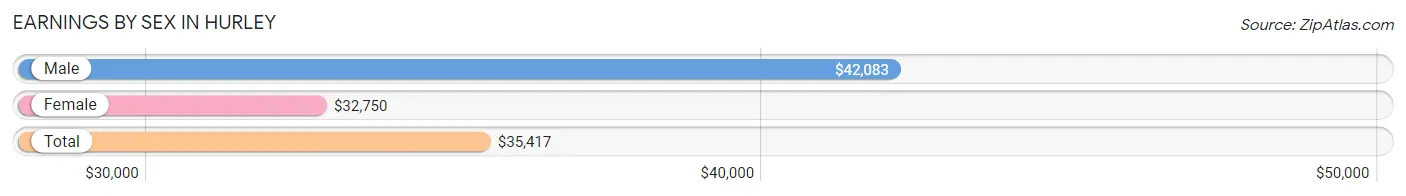
Earnings by Sex in Hurley
Average Earnings in Hurley are $35,417, $42,083 for men and $32,750 for women, a difference of 22.2%.
| Sex | Number | Average Earnings |
| Male | 50 (68.5%) | $42,083 |
| Female | 23 (31.5%) | $32,750 |
| Total | 73 (100.0%) | $35,417 |
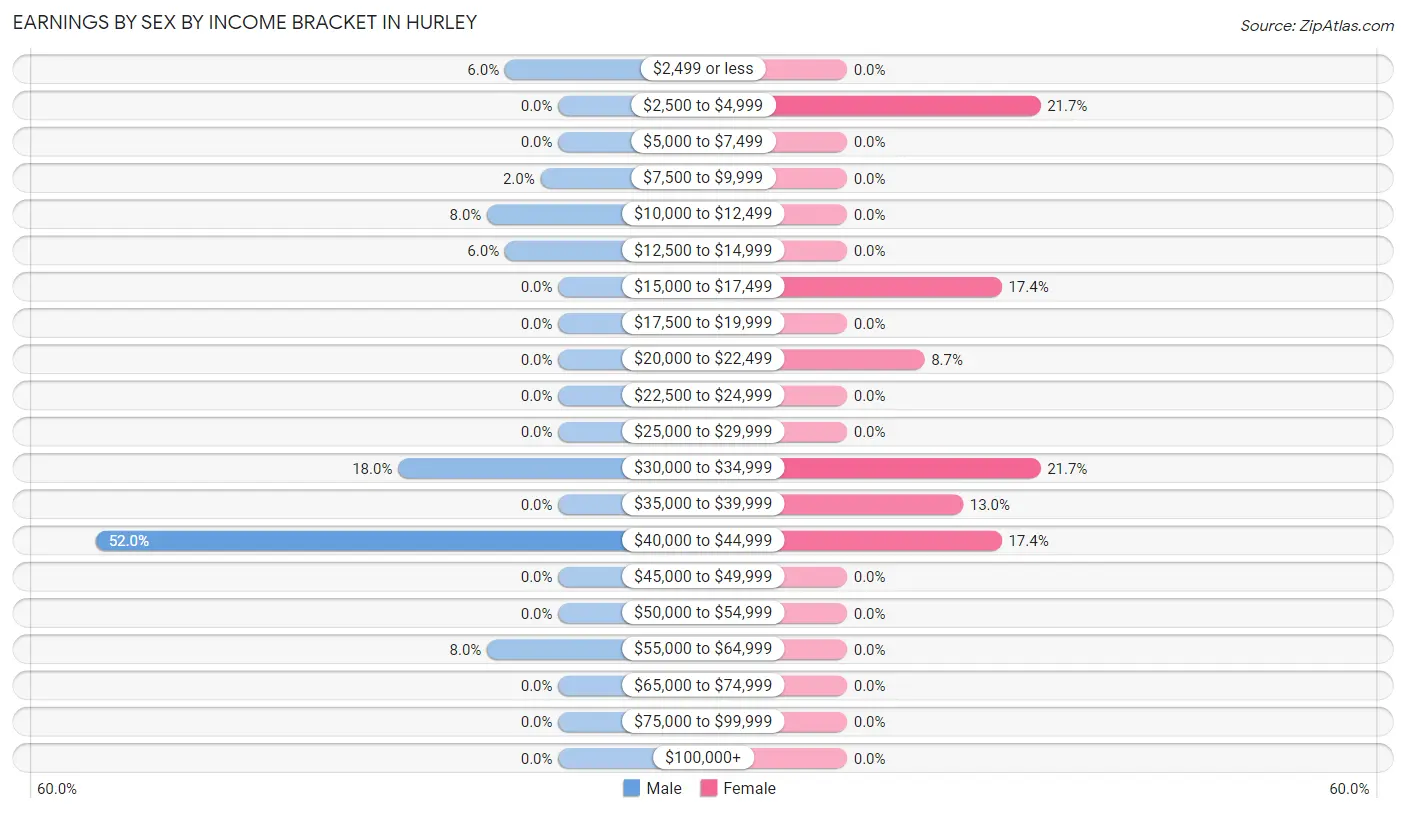
Earnings by Sex by Income Bracket in Hurley
The most common earnings brackets in Hurley are $40,000 to $44,999 for men (26 | 52.0%) and $2,500 to $4,999 for women (5 | 21.7%).
| Income | Male | Female |
| $2,499 or less | 3 (6.0%) | 0 (0.0%) |
| $2,500 to $4,999 | 0 (0.0%) | 5 (21.7%) |
| $5,000 to $7,499 | 0 (0.0%) | 0 (0.0%) |
| $7,500 to $9,999 | 1 (2.0%) | 0 (0.0%) |
| $10,000 to $12,499 | 4 (8.0%) | 0 (0.0%) |
| $12,500 to $14,999 | 3 (6.0%) | 0 (0.0%) |
| $15,000 to $17,499 | 0 (0.0%) | 4 (17.4%) |
| $17,500 to $19,999 | 0 (0.0%) | 0 (0.0%) |
| $20,000 to $22,499 | 0 (0.0%) | 2 (8.7%) |
| $22,500 to $24,999 | 0 (0.0%) | 0 (0.0%) |
| $25,000 to $29,999 | 0 (0.0%) | 0 (0.0%) |
| $30,000 to $34,999 | 9 (18.0%) | 5 (21.7%) |
| $35,000 to $39,999 | 0 (0.0%) | 3 (13.0%) |
| $40,000 to $44,999 | 26 (52.0%) | 4 (17.4%) |
| $45,000 to $49,999 | 0 (0.0%) | 0 (0.0%) |
| $50,000 to $54,999 | 0 (0.0%) | 0 (0.0%) |
| $55,000 to $64,999 | 4 (8.0%) | 0 (0.0%) |
| $65,000 to $74,999 | 0 (0.0%) | 0 (0.0%) |
| $75,000 to $99,999 | 0 (0.0%) | 0 (0.0%) |
| $100,000+ | 0 (0.0%) | 0 (0.0%) |
| Total | 50 (100.0%) | 23 (100.0%) |
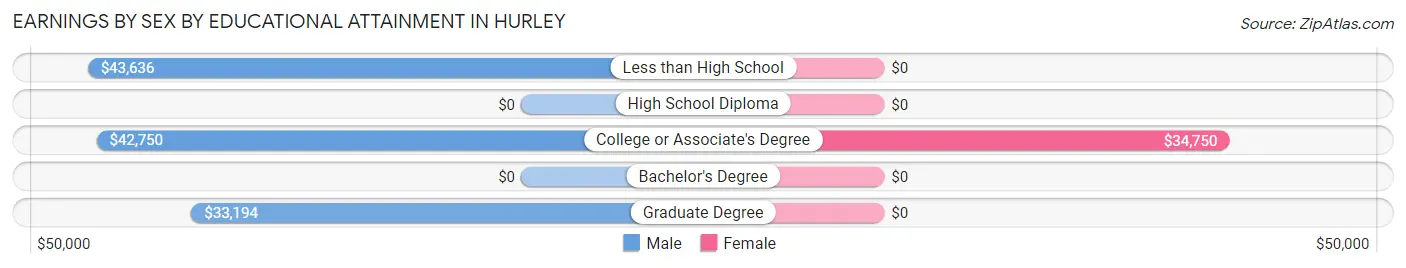
Earnings by Sex by Educational Attainment in Hurley
Average earnings in Hurley are $41,250 for men and $35,000 for women, a difference of 15.1%. Men with an educational attainment of less than high school enjoy the highest average annual earnings of $43,636, while those with graduate degree education earn the least with $33,194. Women with an educational attainment of college or associate's degree earn the most with the average annual earnings of $34,750, while those with college or associate's degree education have the smallest earnings of $34,750.
| Educational Attainment | Male Income | Female Income |
| Less than High School | $43,636 | $0 |
| High School Diploma | - | - |
| College or Associate's Degree | $42,750 | $34,750 |
| Bachelor's Degree | - | - |
| Graduate Degree | $33,194 | $0 |
| Total | $41,250 | $35,000 |
Family Income in Hurley
Family Income Brackets in Hurley
According to the Hurley family income data, there are 13 families falling into the $75,000 to $99,999 income range, which is the most common income bracket and makes up 44.8% of all families.
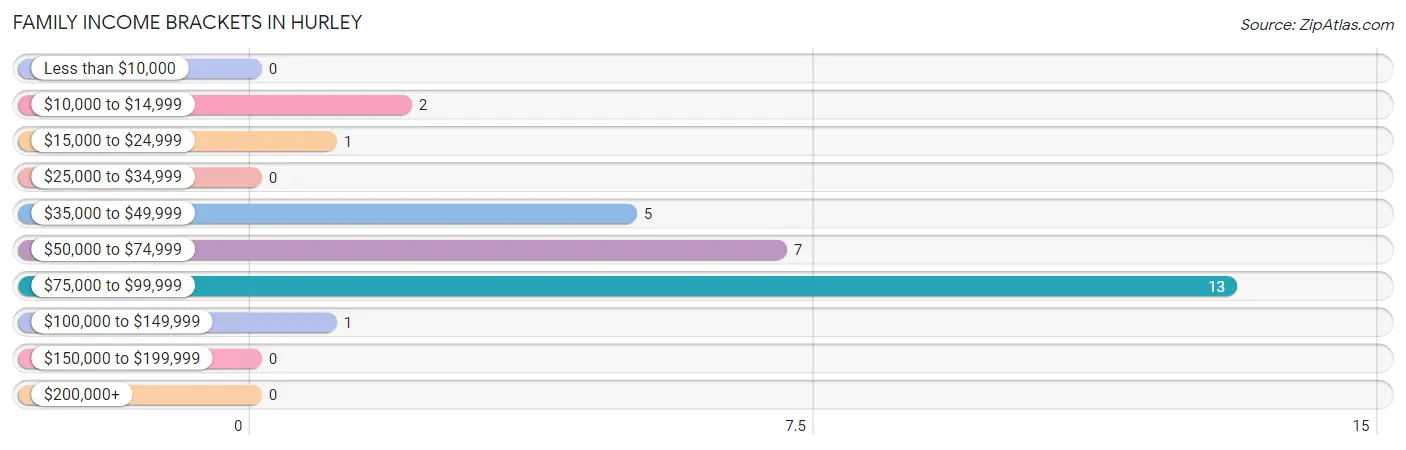
| Income Bracket | # Families | % Families |
| Less than $10,000 | 0 | 0.0% |
| $10,000 to $14,999 | 2 | 6.9% |
| $15,000 to $24,999 | 1 | 3.4% |
| $25,000 to $34,999 | 0 | 0.0% |
| $35,000 to $49,999 | 5 | 17.2% |
| $50,000 to $74,999 | 7 | 24.1% |
| $75,000 to $99,999 | 13 | 44.8% |
| $100,000 to $149,999 | 1 | 3.4% |
| $150,000 to $199,999 | 0 | 0.0% |
| $200,000+ | 0 | 0.0% |
Family Income by Famaliy Size in Hurley
4-person families (8 | 27.6%) account for the highest median family income in Hurley with $66,667 per family, while 2-person families (18 | 62.1%) have the highest median income of $28,125 per family member.
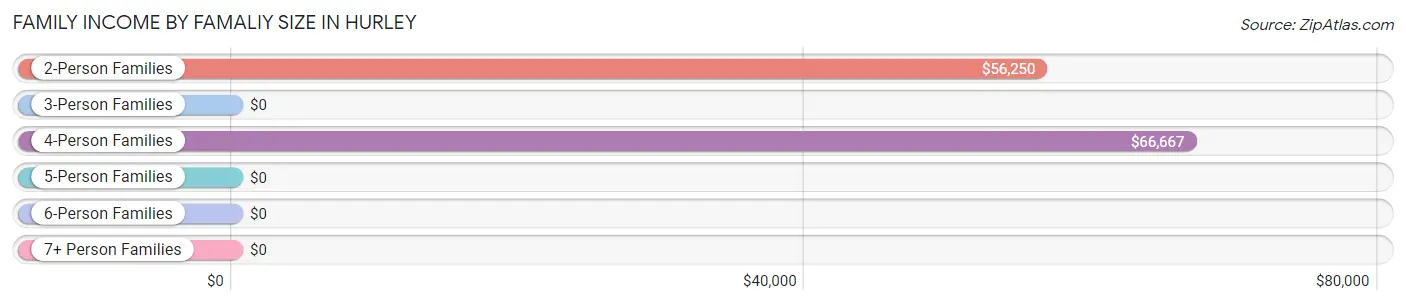
| Income Bracket | # Families | Median Income |
| 2-Person Families | 18 (62.1%) | $56,250 |
| 3-Person Families | 3 (10.3%) | $0 |
| 4-Person Families | 8 (27.6%) | $66,667 |
| 5-Person Families | 0 (0.0%) | $0 |
| 6-Person Families | 0 (0.0%) | $0 |
| 7+ Person Families | 0 (0.0%) | $0 |
| Total | 29 (100.0%) | $67,083 |
Family Income by Number of Earners in Hurley
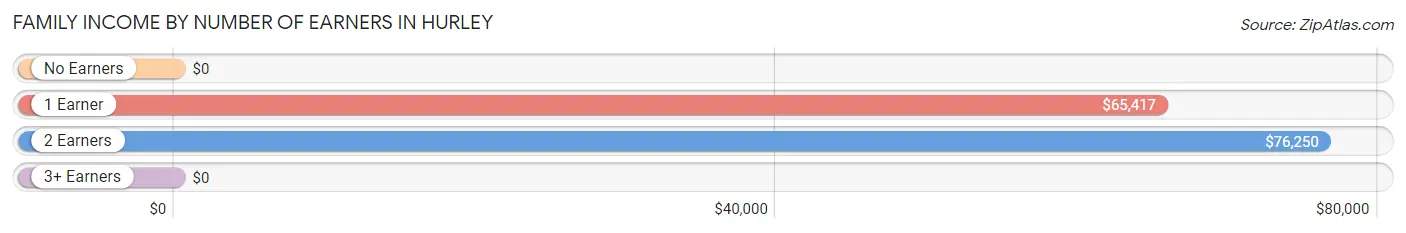
| Number of Earners | # Families | Median Income |
| No Earners | 1 (3.5%) | $0 |
| 1 Earner | 7 (24.1%) | $65,417 |
| 2 Earners | 21 (72.4%) | $76,250 |
| 3+ Earners | 0 (0.0%) | $0 |
| Total | 29 (100.0%) | $67,083 |
Household Income in Hurley
Household Income Brackets in Hurley
With 13 households falling in the category, the $75,000 to $99,999 income range is the most frequent in Hurley, accounting for 29.5% of all households.
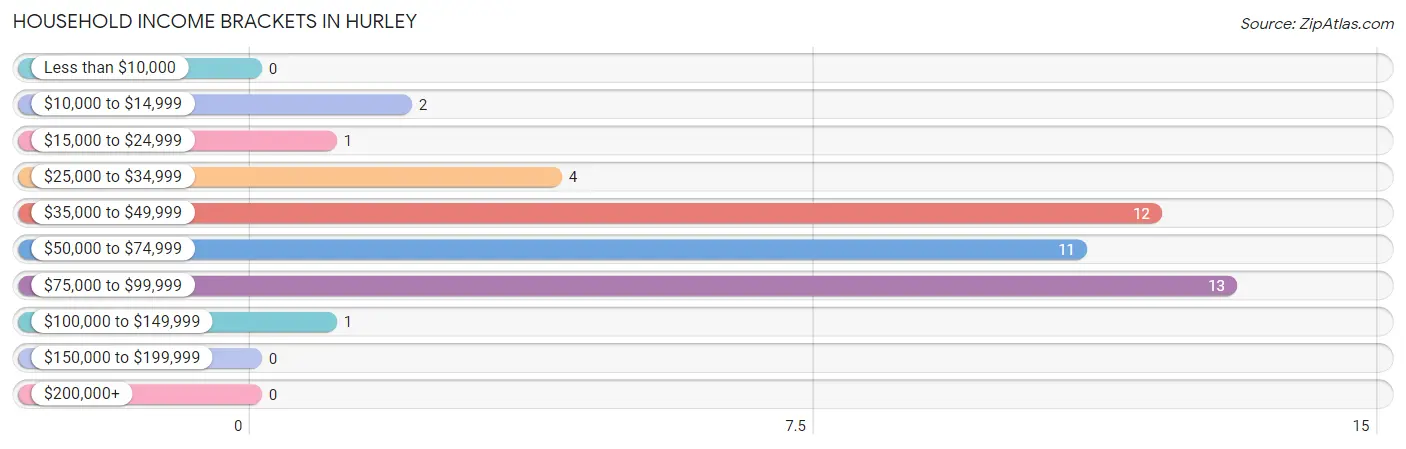
| Income Bracket | # Households | % Households |
| Less than $10,000 | 0 | 0.0% |
| $10,000 to $14,999 | 2 | 4.5% |
| $15,000 to $24,999 | 1 | 2.3% |
| $25,000 to $34,999 | 4 | 9.1% |
| $35,000 to $49,999 | 12 | 27.3% |
| $50,000 to $74,999 | 11 | 25.0% |
| $75,000 to $99,999 | 13 | 29.5% |
| $100,000 to $149,999 | 1 | 2.3% |
| $150,000 to $199,999 | 0 | 0.0% |
| $200,000+ | 0 | 0.0% |
Household Income by Householder Age in Hurley
The median household income in Hurley is $56,250, with the highest median household income of $68,750 found in the 45 to 64 years age bracket for the primary householder. A total of 10 households (22.7%) fall into this category. Meanwhile, the 15 to 24 years age bracket for the primary householder has the lowest median household income of $0, with 4 households (9.1%) in this group.
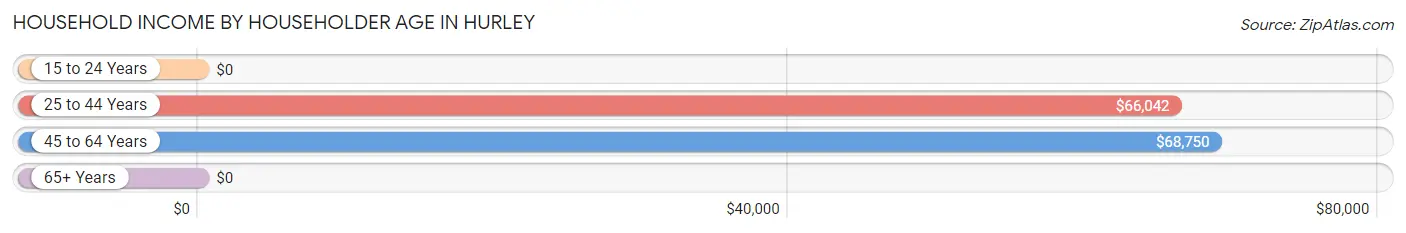
| Income Bracket | # Households | Median Income |
| 15 to 24 Years | 4 (9.1%) | $0 |
| 25 to 44 Years | 23 (52.3%) | $66,042 |
| 45 to 64 Years | 10 (22.7%) | $68,750 |
| 65+ Years | 7 (15.9%) | $0 |
| Total | 44 (100.0%) | $56,250 |
Poverty in Hurley
Income Below Poverty by Sex and Age in Hurley
With 5.0% poverty level for males and 30.6% for females among the residents of Hurley, 55 to 64 year old males and 18 to 24 year old females are the most vulnerable to poverty, with 1 males (16.7%) and 5 females (55.6%) in their respective age groups living below the poverty level.
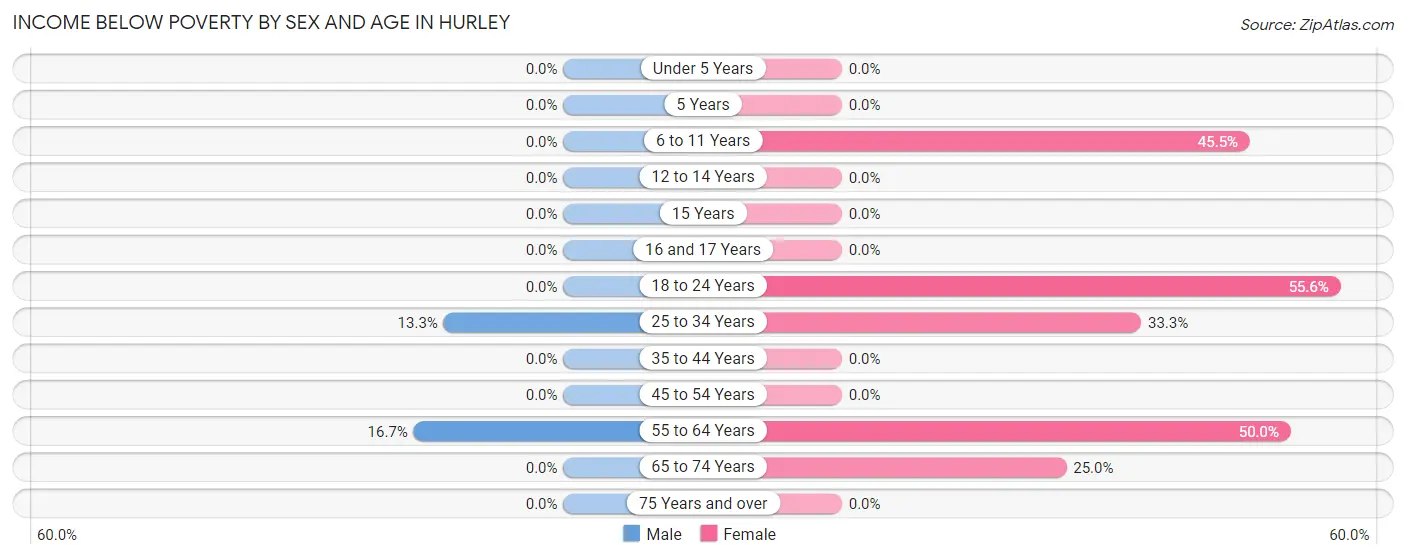
| Age Bracket | Male | Female |
| Under 5 Years | 0 (0.0%) | 0 (0.0%) |
| 5 Years | 0 (0.0%) | 0 (0.0%) |
| 6 to 11 Years | 0 (0.0%) | 5 (45.5%) |
| 12 to 14 Years | 0 (0.0%) | 0 (0.0%) |
| 15 Years | 0 (0.0%) | 0 (0.0%) |
| 16 and 17 Years | 0 (0.0%) | 0 (0.0%) |
| 18 to 24 Years | 0 (0.0%) | 5 (55.6%) |
| 25 to 34 Years | 2 (13.3%) | 2 (33.3%) |
| 35 to 44 Years | 0 (0.0%) | 0 (0.0%) |
| 45 to 54 Years | 0 (0.0%) | 0 (0.0%) |
| 55 to 64 Years | 1 (16.7%) | 2 (50.0%) |
| 65 to 74 Years | 0 (0.0%) | 1 (25.0%) |
| 75 Years and over | 0 (0.0%) | 0 (0.0%) |
| Total | 3 (5.0%) | 15 (30.6%) |
Income Above Poverty by Sex and Age in Hurley
According to the poverty statistics in Hurley, males aged under 5 years and females aged under 5 years are the age groups that are most secure financially, with 100.0% of males and 100.0% of females in these age groups living above the poverty line.
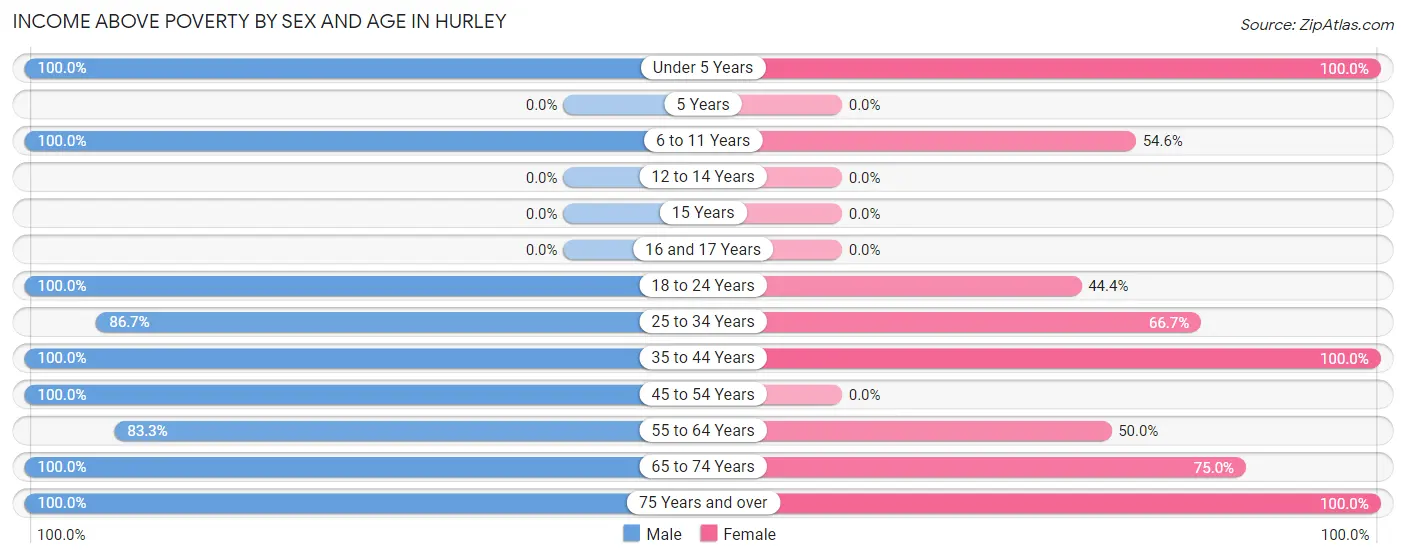
| Age Bracket | Male | Female |
| Under 5 Years | 3 (100.0%) | 3 (100.0%) |
| 5 Years | 0 (0.0%) | 0 (0.0%) |
| 6 to 11 Years | 3 (100.0%) | 6 (54.5%) |
| 12 to 14 Years | 0 (0.0%) | 0 (0.0%) |
| 15 Years | 0 (0.0%) | 0 (0.0%) |
| 16 and 17 Years | 0 (0.0%) | 0 (0.0%) |
| 18 to 24 Years | 4 (100.0%) | 4 (44.4%) |
| 25 to 34 Years | 13 (86.7%) | 4 (66.7%) |
| 35 to 44 Years | 10 (100.0%) | 11 (100.0%) |
| 45 to 54 Years | 14 (100.0%) | 0 (0.0%) |
| 55 to 64 Years | 5 (83.3%) | 2 (50.0%) |
| 65 to 74 Years | 3 (100.0%) | 3 (75.0%) |
| 75 Years and over | 2 (100.0%) | 1 (100.0%) |
| Total | 57 (95.0%) | 34 (69.4%) |
Income Below Poverty Among Married-Couple Families in Hurley
The poverty statistics for married-couple families in Hurley show that 14.3% or 3 of the total 21 families live below the poverty line. Families with 1 or 2 children have the highest poverty rate of 18.2%, comprising of 2 families. On the other hand, families with no children have the lowest poverty rate of 10.0%, which includes 1 families.
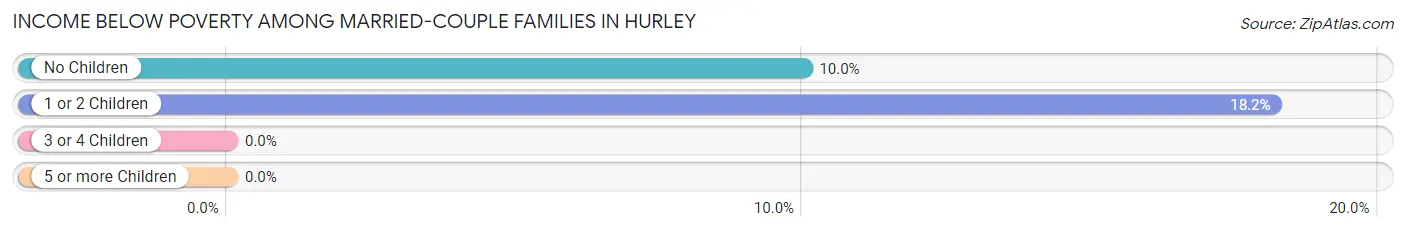
| Children | Above Poverty | Below Poverty |
| No Children | 9 (90.0%) | 1 (10.0%) |
| 1 or 2 Children | 9 (81.8%) | 2 (18.2%) |
| 3 or 4 Children | 0 (0.0%) | 0 (0.0%) |
| 5 or more Children | 0 (0.0%) | 0 (0.0%) |
| Total | 18 (85.7%) | 3 (14.3%) |
Income Below Poverty Among Single-Parent Households in Hurley
| Children | Single Father | Single Mother |
| No Children | 0 (0.0%) | 0 (0.0%) |
| 1 or 2 Children | 0 (0.0%) | 0 (0.0%) |
| 3 or 4 Children | 0 (0.0%) | 0 (0.0%) |
| 5 or more Children | 0 (0.0%) | 0 (0.0%) |
| Total | 0 (0.0%) | 0 (0.0%) |
Income Below Poverty Among Married-Couple vs Single-Parent Households in Hurley
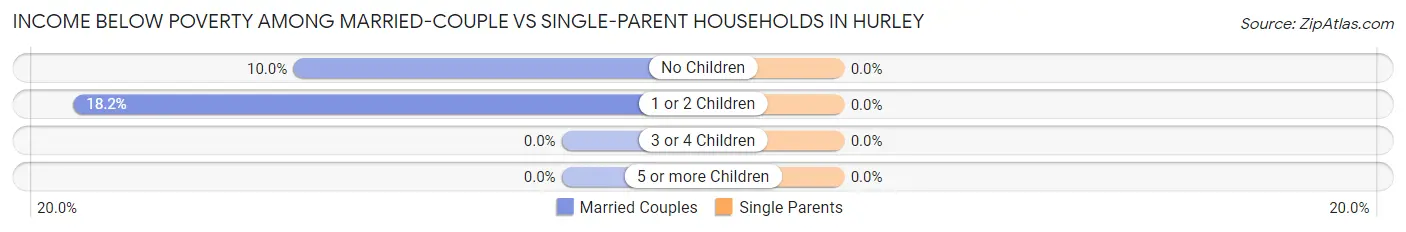
| Children | Married-Couple Families | Single-Parent Households |
| No Children | 1 (10.0%) | 0 (0.0%) |
| 1 or 2 Children | 2 (18.2%) | 0 (0.0%) |
| 3 or 4 Children | 0 (0.0%) | 0 (0.0%) |
| 5 or more Children | 0 (0.0%) | 0 (0.0%) |
| Total | 3 (14.3%) | 0 (0.0%) |
Race in Hurley
The most populous races in Hurley are White / Caucasian (88 | 80.7%), Two or more Races (11 | 10.1%), and Asian (10 | 9.2%).
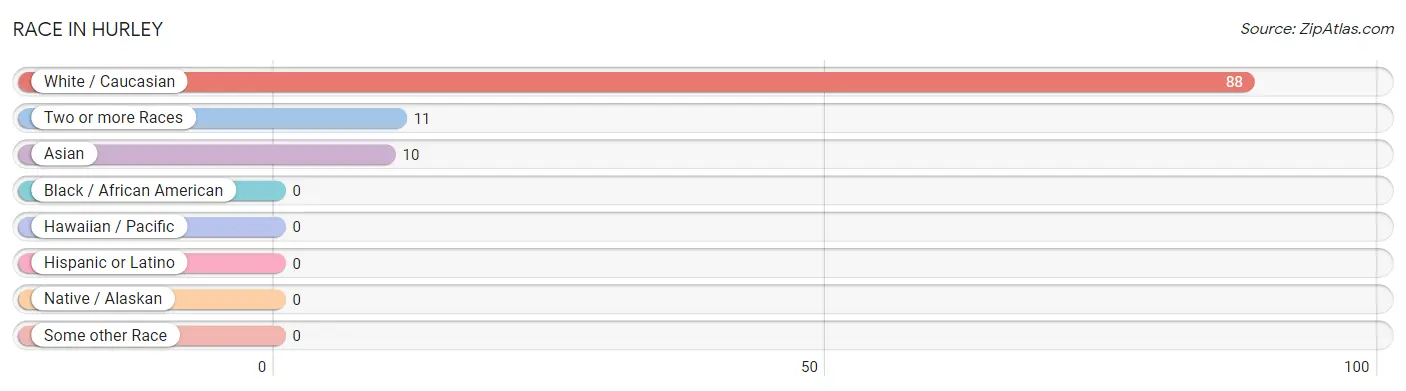
| Race | # Population | % Population |
| Asian | 10 | 9.2% |
| Black / African American | 0 | 0.0% |
| Hawaiian / Pacific | 0 | 0.0% |
| Hispanic or Latino | 0 | 0.0% |
| Native / Alaskan | 0 | 0.0% |
| White / Caucasian | 88 | 80.7% |
| Two or more Races | 11 | 10.1% |
| Some other Race | 0 | 0.0% |
| Total | 109 | 100.0% |
Ancestry in Hurley
The most populous ancestries reported in Hurley are European (11 | 10.1%), German (11 | 10.1%), Thai (10 | 9.2%), Irish (6 | 5.5%), and British (5 | 4.6%), together accounting for 39.4% of all Hurley residents.
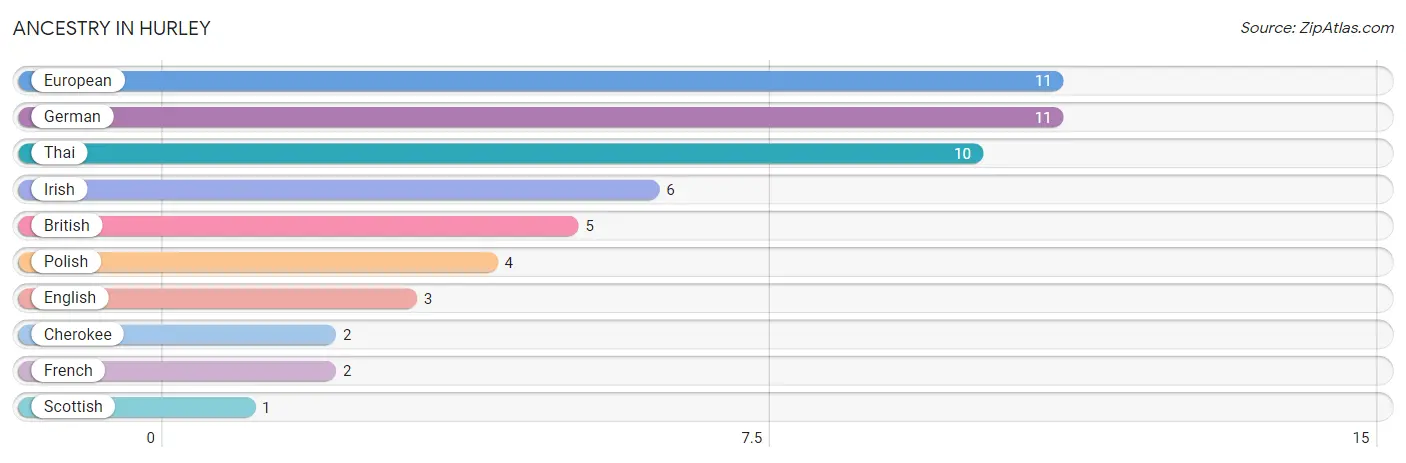
| Ancestry | # Population | % Population |
| British | 5 | 4.6% |
| Cherokee | 2 | 1.8% |
| English | 3 | 2.8% |
| European | 11 | 10.1% |
| French | 2 | 1.8% |
| German | 11 | 10.1% |
| Irish | 6 | 5.5% |
| Polish | 4 | 3.7% |
| Scottish | 1 | 0.9% |
| Thai | 10 | 9.2% | View All 10 Rows |
Immigrants in Hurley
The most numerous immigrant groups reported in Hurley came from Asia (10 | 9.2%), India (10 | 9.2%), and South Central Asia (10 | 9.2%), together accounting for 27.5% of all Hurley residents.
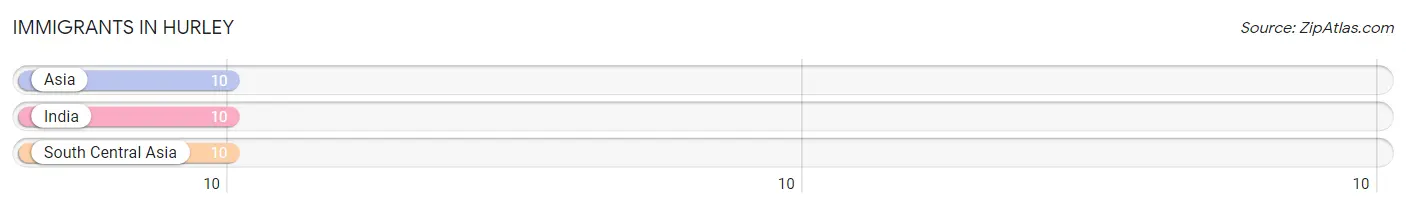
| Immigration Origin | # Population | % Population |
| Asia | 10 | 9.2% |
| India | 10 | 9.2% |
| South Central Asia | 10 | 9.2% | View All 3 Rows |
Sex and Age in Hurley
Sex and Age in Hurley
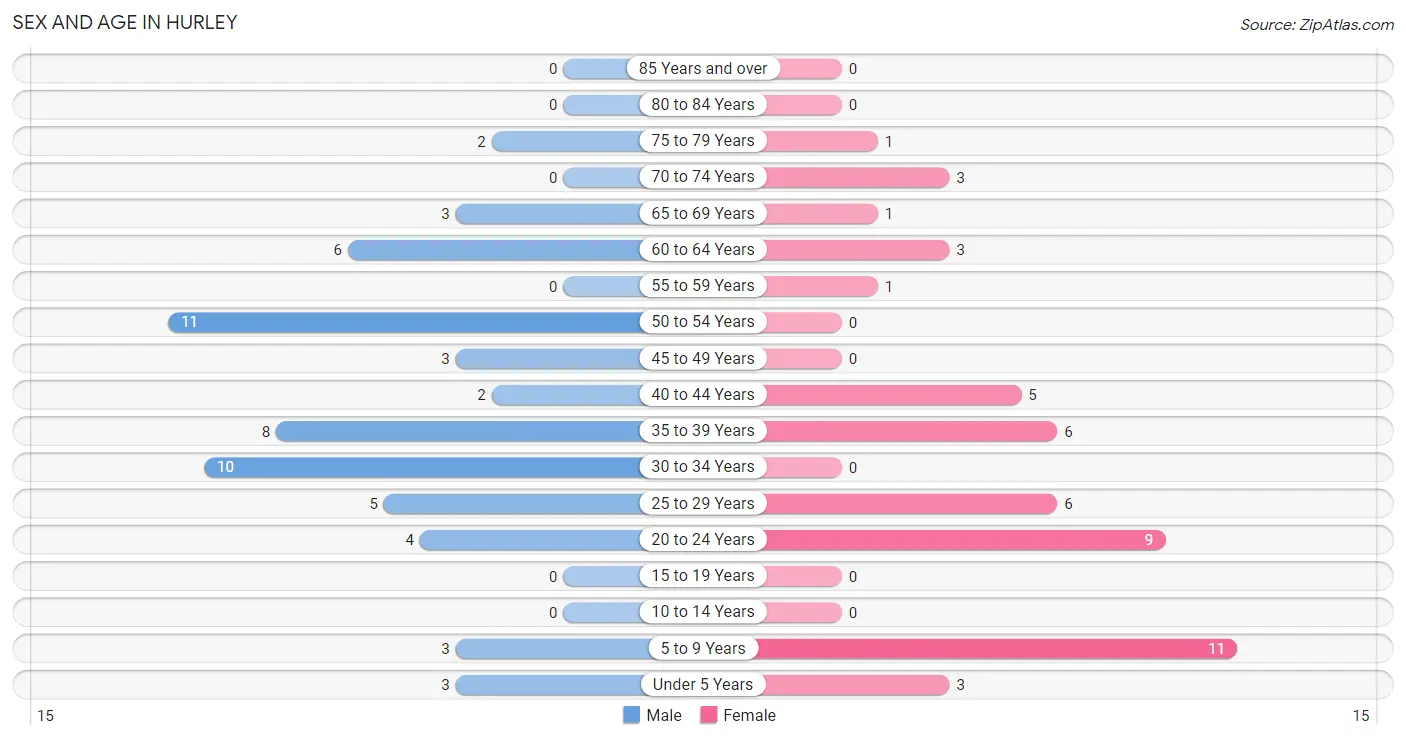
The most populous age groups in Hurley are 50 to 54 Years (11 | 18.3%) for men and 5 to 9 Years (11 | 22.5%) for women.
| Age Bracket | Male | Female |
| Under 5 Years | 3 (5.0%) | 3 (6.1%) |
| 5 to 9 Years | 3 (5.0%) | 11 (22.5%) |
| 10 to 14 Years | 0 (0.0%) | 0 (0.0%) |
| 15 to 19 Years | 0 (0.0%) | 0 (0.0%) |
| 20 to 24 Years | 4 (6.7%) | 9 (18.4%) |
| 25 to 29 Years | 5 (8.3%) | 6 (12.2%) |
| 30 to 34 Years | 10 (16.7%) | 0 (0.0%) |
| 35 to 39 Years | 8 (13.3%) | 6 (12.2%) |
| 40 to 44 Years | 2 (3.3%) | 5 (10.2%) |
| 45 to 49 Years | 3 (5.0%) | 0 (0.0%) |
| 50 to 54 Years | 11 (18.3%) | 0 (0.0%) |
| 55 to 59 Years | 0 (0.0%) | 1 (2.0%) |
| 60 to 64 Years | 6 (10.0%) | 3 (6.1%) |
| 65 to 69 Years | 3 (5.0%) | 1 (2.0%) |
| 70 to 74 Years | 0 (0.0%) | 3 (6.1%) |
| 75 to 79 Years | 2 (3.3%) | 1 (2.0%) |
| 80 to 84 Years | 0 (0.0%) | 0 (0.0%) |
| 85 Years and over | 0 (0.0%) | 0 (0.0%) |
| Total | 60 (100.0%) | 49 (100.0%) |
Families and Households in Hurley
Median Family Size in Hurley
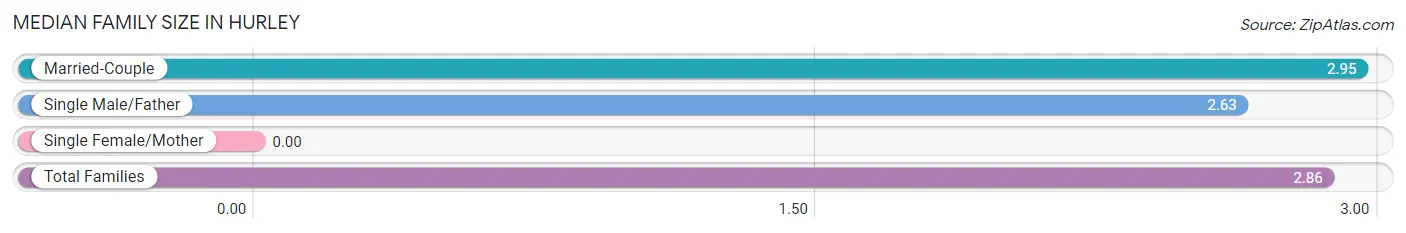
| Family Type | # Families | Family Size |
| Married-Couple | 21 (72.4%) | 2.95 |
| Single Male/Father | 8 (27.6%) | 2.63 |
| Single Female/Mother | 0 (0.0%) | - |
| Total Families | 29 (100.0%) | 2.86 |
Median Household Size in Hurley
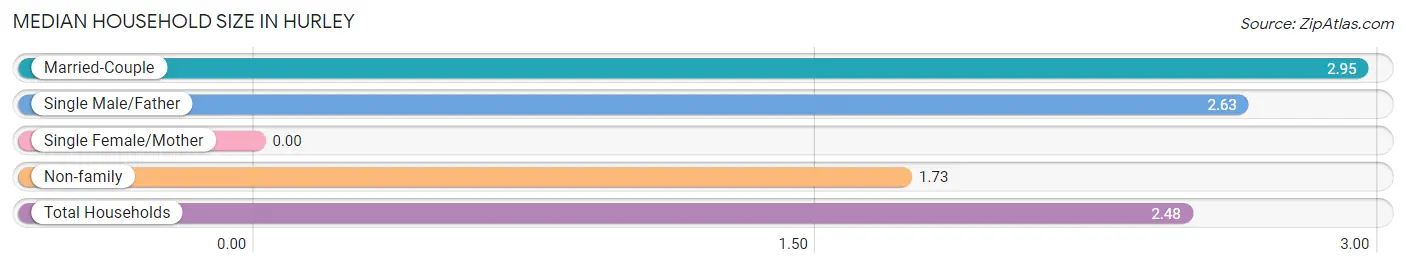
| Household Type | # Households | Household Size |
| Married-Couple | 21 (47.7%) | 2.95 |
| Single Male/Father | 8 (18.2%) | 2.63 |
| Single Female/Mother | 0 (0.0%) | - |
| Non-family | 15 (34.1%) | 1.73 |
| Total Households | 44 (100.0%) | 2.48 |
Household Size by Marriage Status in Hurley
Out of a total of 44 households in Hurley, 29 (65.9%) are family households, while 15 (34.1%) are nonfamily households. The most numerous type of family households are 2-person households, comprising 18, and the most common type of nonfamily households are 2-person households, comprising 10.
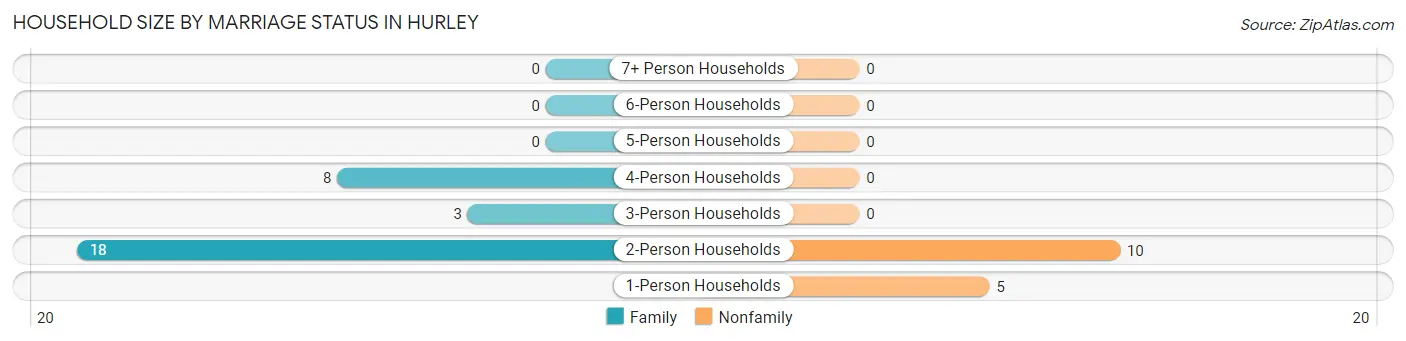
| Household Size | Family Households | Nonfamily Households |
| 1-Person Households | - | 5 (11.4%) |
| 2-Person Households | 18 (40.9%) | 10 (22.7%) |
| 3-Person Households | 3 (6.8%) | 0 (0.0%) |
| 4-Person Households | 8 (18.2%) | 0 (0.0%) |
| 5-Person Households | 0 (0.0%) | 0 (0.0%) |
| 6-Person Households | 0 (0.0%) | 0 (0.0%) |
| 7+ Person Households | 0 (0.0%) | 0 (0.0%) |
| Total | 29 (65.9%) | 15 (34.1%) |
Female Fertility in Hurley
Fertility by Age in Hurley
Average fertility rate in Hurley is 154.0 births per 1,000 women. Women in the age bracket of 20 to 34 years have the highest fertility rate with 267.0 births per 1,000 women. Women in the age bracket of 20 to 34 years acount for 100.0% of all women with births.
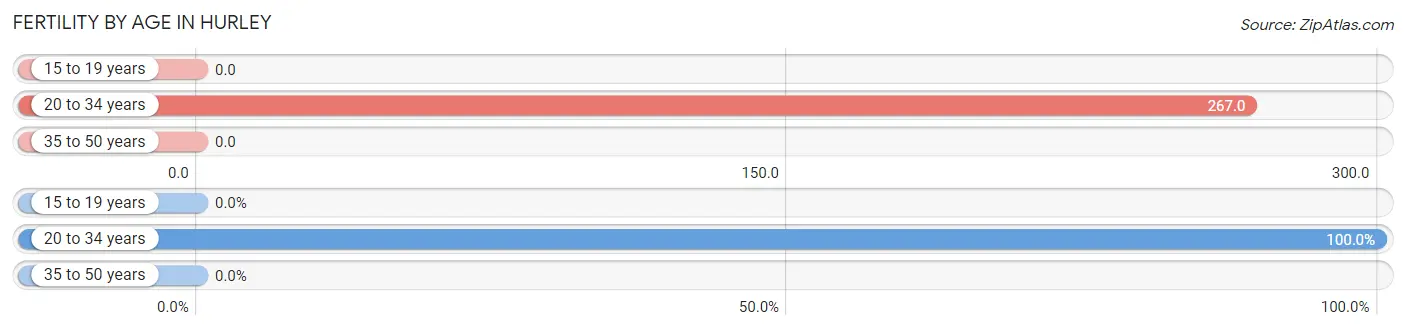
| Age Bracket | Women with Births | Births / 1,000 Women |
| 15 to 19 years | 0 (0.0%) | 0.0 |
| 20 to 34 years | 4 (100.0%) | 267.0 |
| 35 to 50 years | 0 (0.0%) | 0.0 |
| Total | 4 (100.0%) | 154.0 |
Fertility by Age by Marriage Status in Hurley
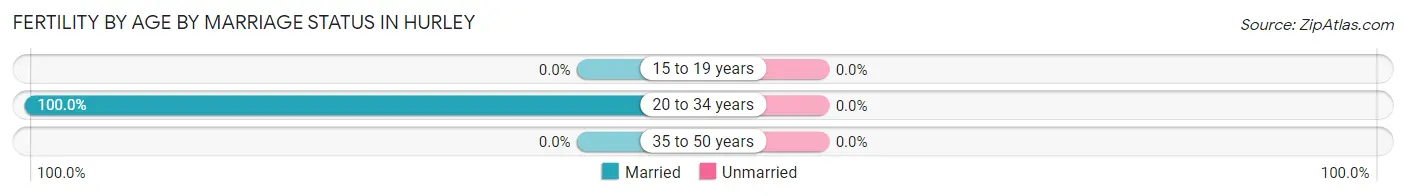
| Age Bracket | Married | Unmarried |
| 15 to 19 years | 0 (0.0%) | 0 (0.0%) |
| 20 to 34 years | 4 (100.0%) | 0 (0.0%) |
| 35 to 50 years | 0 (0.0%) | 0 (0.0%) |
| Total | 4 (100.0%) | 0 (0.0%) |
Fertility by Education in Hurley
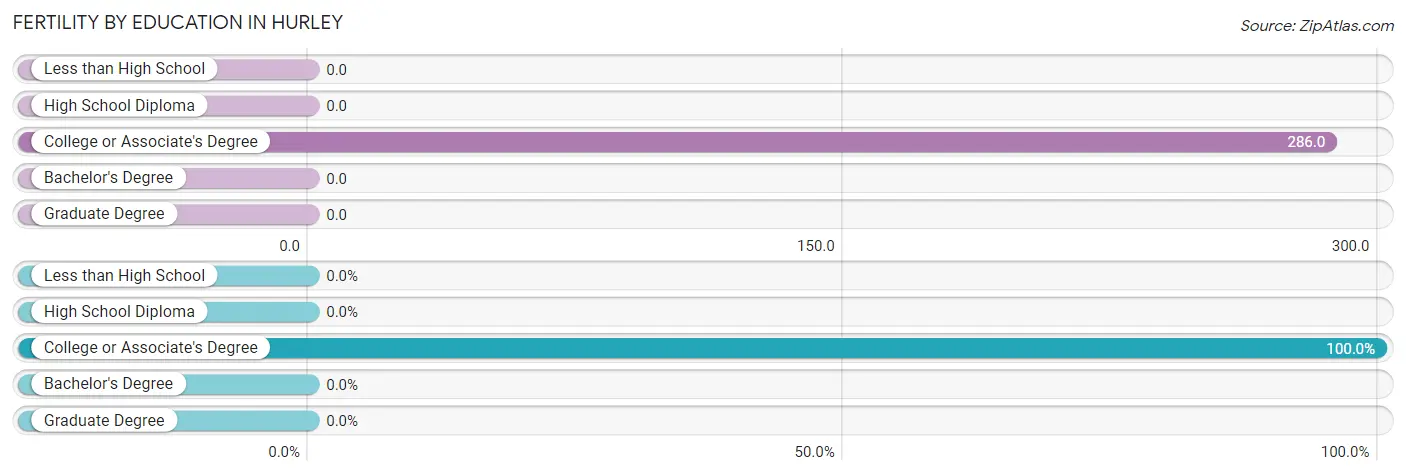
| Educational Attainment | Women with Births | Births / 1,000 Women |
| Less than High School | 0 (0.0%) | 0.0 |
| High School Diploma | 0 (0.0%) | 0.0 |
| College or Associate's Degree | 4 (100.0%) | 286.0 |
| Bachelor's Degree | 0 (0.0%) | 0.0 |
| Graduate Degree | 0 (0.0%) | 0.0 |
| Total | 4 (100.0%) | 154.0 |
Fertility by Education by Marriage Status in Hurley
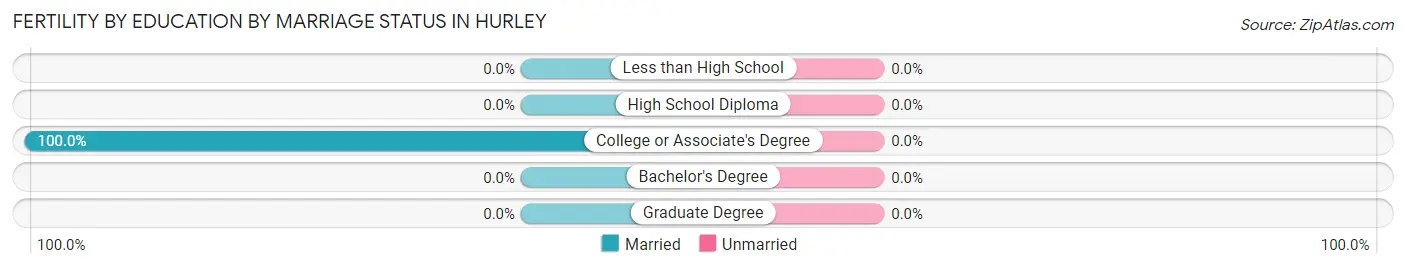
| Educational Attainment | Married | Unmarried |
| Less than High School | 0 (0.0%) | 0 (0.0%) |
| High School Diploma | 0 (0.0%) | 0 (0.0%) |
| College or Associate's Degree | 4 (100.0%) | 0 (0.0%) |
| Bachelor's Degree | 0 (0.0%) | 0 (0.0%) |
| Graduate Degree | 0 (0.0%) | 0 (0.0%) |
| Total | 4 (100.0%) | 0 (0.0%) |
Employment Characteristics in Hurley
Employment by Class of Employer in Hurley
Among the 71 employed individuals in Hurley, private company employees (49 | 69.0%), state government employees (10 | 14.1%), and not-for-profit organizations (8 | 11.3%) make up the most common classes of employment.
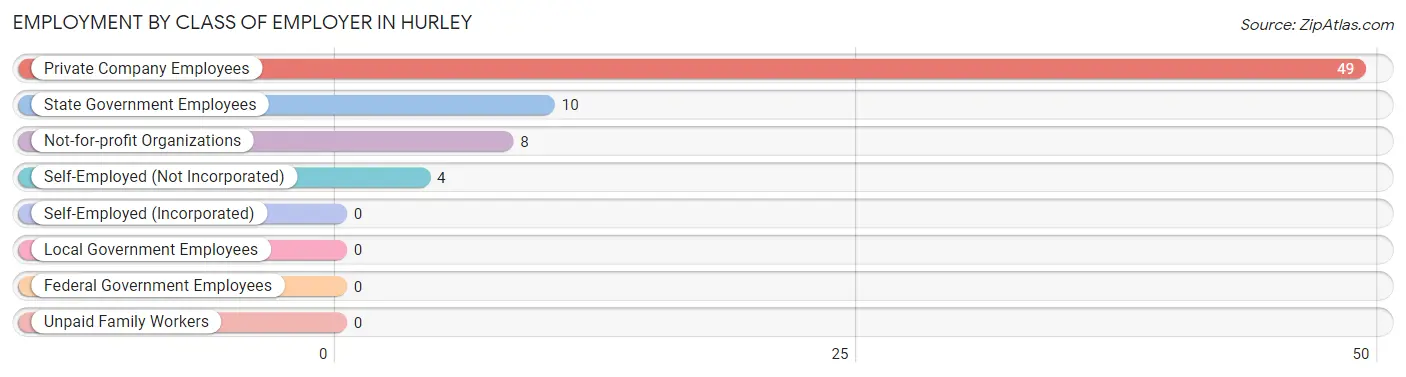
| Employer Class | # Employees | % Employees |
| Private Company Employees | 49 | 69.0% |
| Self-Employed (Incorporated) | 0 | 0.0% |
| Self-Employed (Not Incorporated) | 4 | 5.6% |
| Not-for-profit Organizations | 8 | 11.3% |
| Local Government Employees | 0 | 0.0% |
| State Government Employees | 10 | 14.1% |
| Federal Government Employees | 0 | 0.0% |
| Unpaid Family Workers | 0 | 0.0% |
| Total | 71 | 100.0% |
Employment Status by Age in Hurley
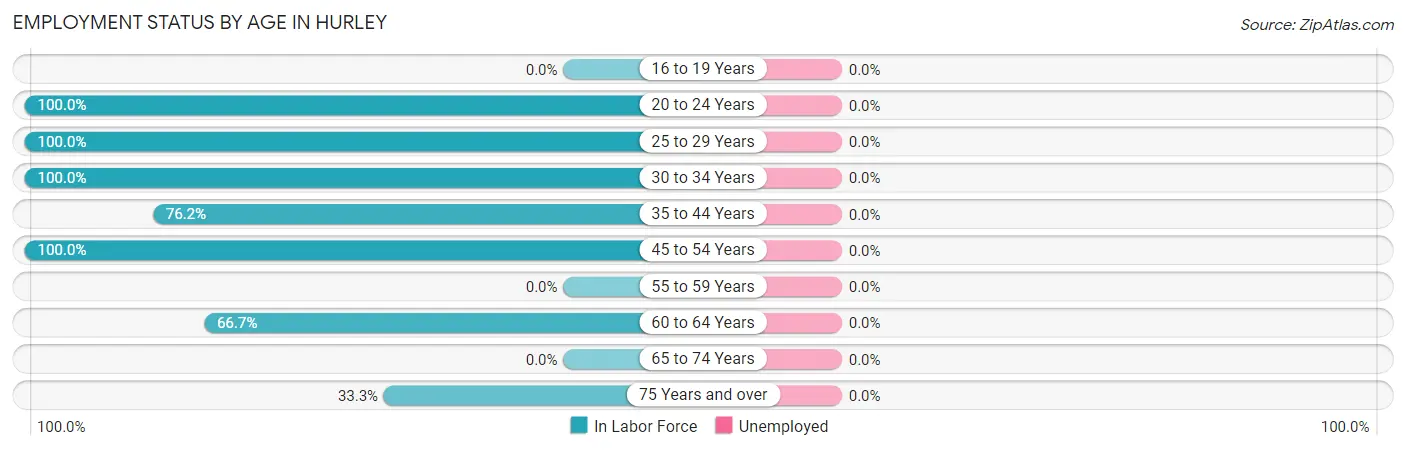
| Age Bracket | In Labor Force | Unemployed |
| 16 to 19 Years | 0 (0.0%) | 0 (0.0%) |
| 20 to 24 Years | 13 (100.0%) | 0 (0.0%) |
| 25 to 29 Years | 11 (100.0%) | 0 (0.0%) |
| 30 to 34 Years | 10 (100.0%) | 0 (0.0%) |
| 35 to 44 Years | 16 (76.2%) | 0 (0.0%) |
| 45 to 54 Years | 14 (100.0%) | 0 (0.0%) |
| 55 to 59 Years | 0 (0.0%) | 0 (0.0%) |
| 60 to 64 Years | 6 (66.7%) | 0 (0.0%) |
| 65 to 74 Years | 0 (0.0%) | 0 (0.0%) |
| 75 Years and over | 1 (33.3%) | 0 (0.0%) |
| Total | 71 (79.8%) | 0 (0.0%) |
Employment Status by Educational Attainment in Hurley
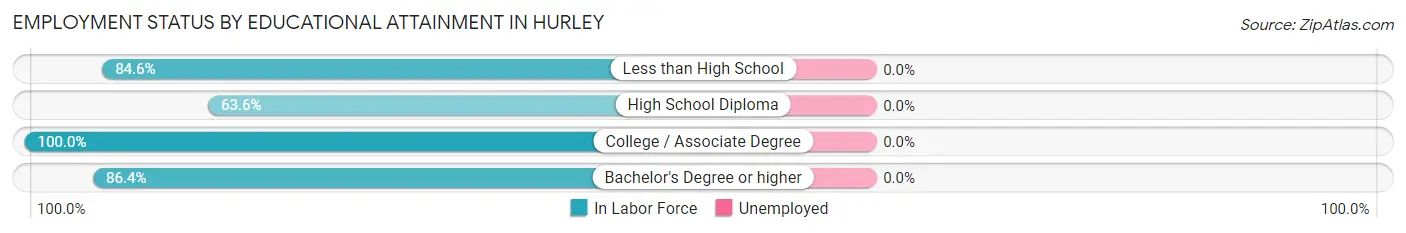
| Educational Attainment | In Labor Force | Unemployed |
| Less than High School | 11 (84.6%) | 0 (0.0%) |
| High School Diploma | 7 (63.6%) | 0 (0.0%) |
| College / Associate Degree | 20 (100.0%) | 0 (0.0%) |
| Bachelor's Degree or higher | 19 (86.4%) | 0 (0.0%) |
| Total | 57 (86.4%) | 0 (0.0%) |
Employment Occupations by Sex in Hurley
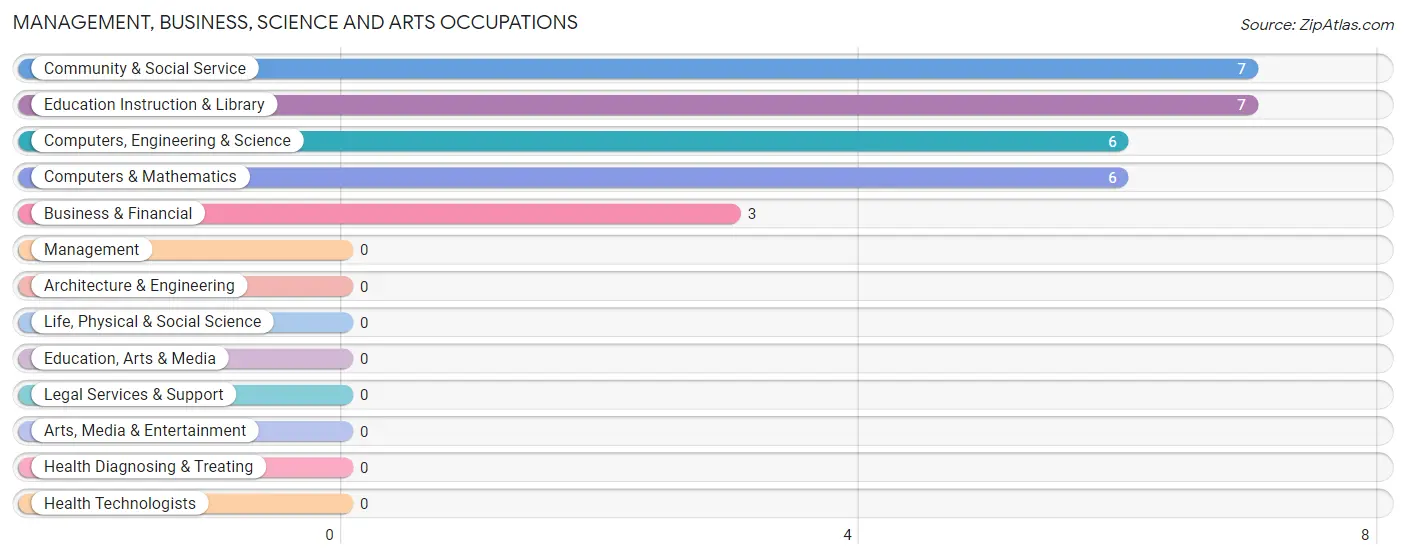
Management, Business, Science and Arts Occupations
The most common Management, Business, Science and Arts occupations in Hurley are Community & Social Service (7 | 9.9%), Education Instruction & Library (7 | 9.9%), Computers, Engineering & Science (6 | 8.5%), Computers & Mathematics (6 | 8.5%), and Business & Financial (3 | 4.2%).
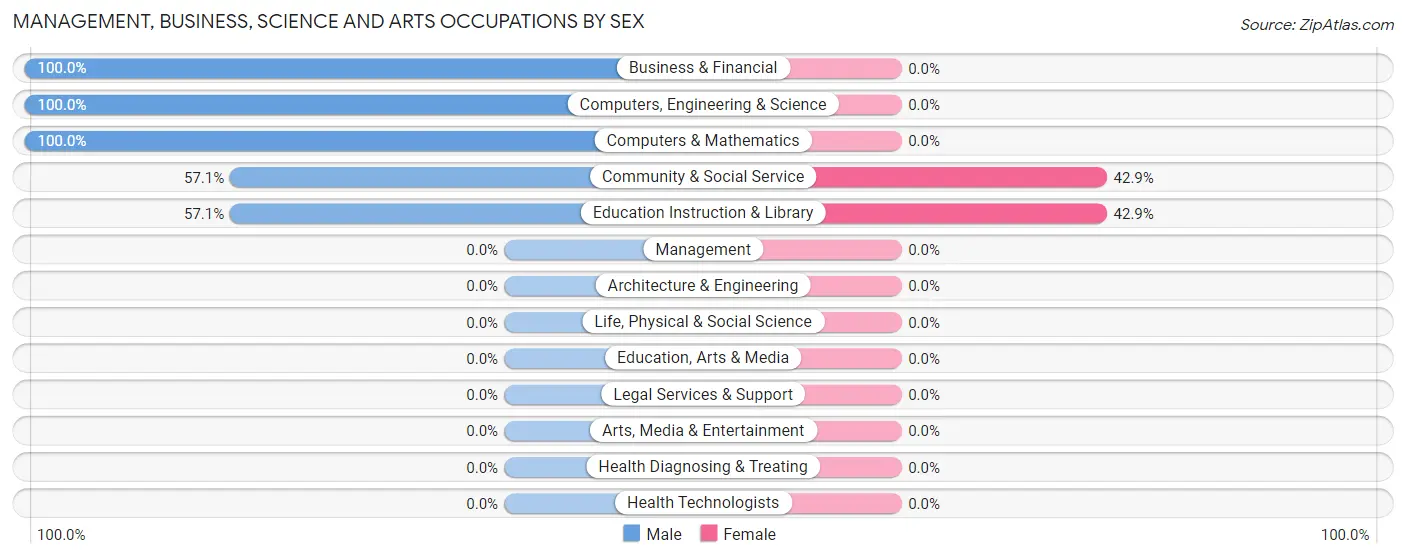
Management, Business, Science and Arts Occupations by Sex
Within the Management, Business, Science and Arts occupations in Hurley, the most male-oriented occupations are Business & Financial (100.0%), Computers, Engineering & Science (100.0%), and Computers & Mathematics (100.0%), while the most female-oriented occupations are Community & Social Service (42.9%), and Education Instruction & Library (42.9%).
| Occupation | Male | Female |
| Management | 0 (0.0%) | 0 (0.0%) |
| Business & Financial | 3 (100.0%) | 0 (0.0%) |
| Computers, Engineering & Science | 6 (100.0%) | 0 (0.0%) |
| Computers & Mathematics | 6 (100.0%) | 0 (0.0%) |
| Architecture & Engineering | 0 (0.0%) | 0 (0.0%) |
| Life, Physical & Social Science | 0 (0.0%) | 0 (0.0%) |
| Community & Social Service | 4 (57.1%) | 3 (42.9%) |
| Education, Arts & Media | 0 (0.0%) | 0 (0.0%) |
| Legal Services & Support | 0 (0.0%) | 0 (0.0%) |
| Education Instruction & Library | 4 (57.1%) | 3 (42.9%) |
| Arts, Media & Entertainment | 0 (0.0%) | 0 (0.0%) |
| Health Diagnosing & Treating | 0 (0.0%) | 0 (0.0%) |
| Health Technologists | 0 (0.0%) | 0 (0.0%) |
| Total (Category) | 13 (81.2%) | 3 (18.8%) |
| Total (Overall) | 48 (67.6%) | 23 (32.4%) |
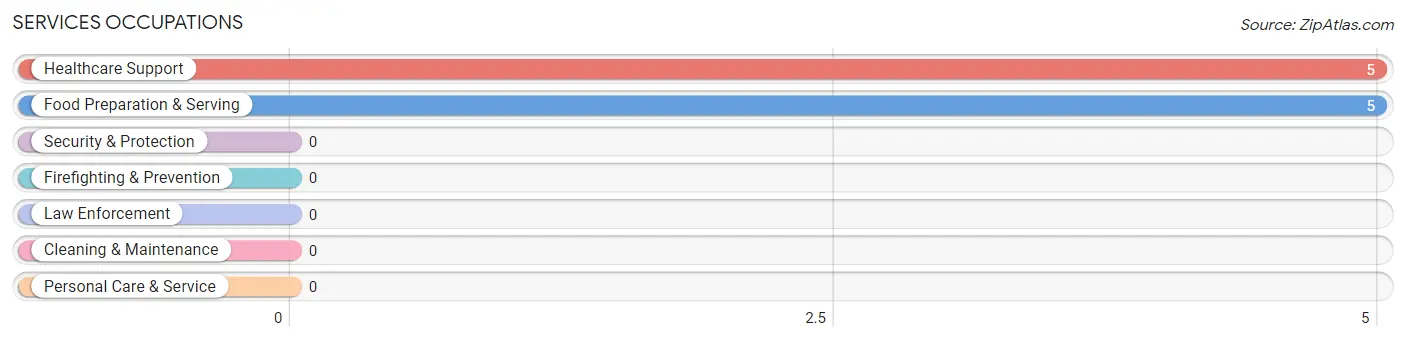
Services Occupations
The most common Services occupations in Hurley are Healthcare Support (5 | 7.0%), and Food Preparation & Serving (5 | 7.0%).
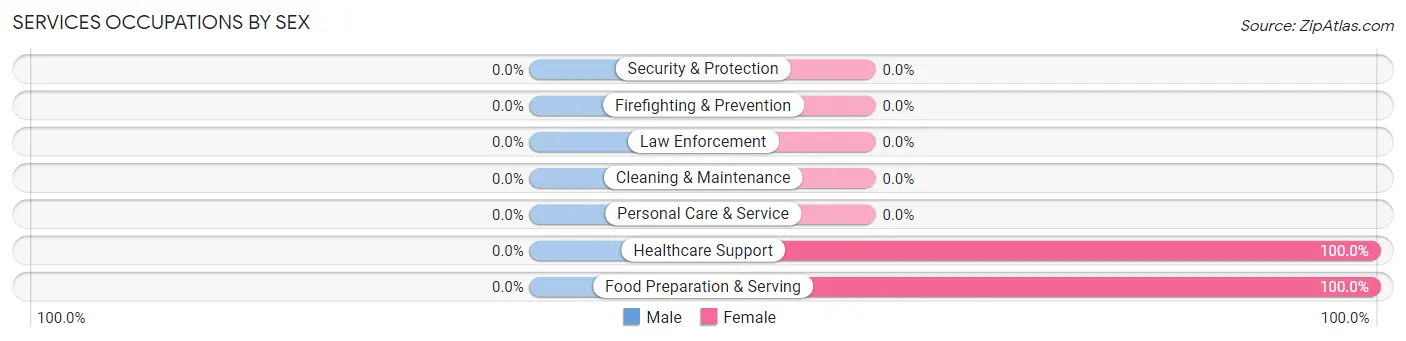
Services Occupations by Sex
| Occupation | Male | Female |
| Healthcare Support | 0 (0.0%) | 5 (100.0%) |
| Security & Protection | 0 (0.0%) | 0 (0.0%) |
| Firefighting & Prevention | 0 (0.0%) | 0 (0.0%) |
| Law Enforcement | 0 (0.0%) | 0 (0.0%) |
| Food Preparation & Serving | 0 (0.0%) | 5 (100.0%) |
| Cleaning & Maintenance | 0 (0.0%) | 0 (0.0%) |
| Personal Care & Service | 0 (0.0%) | 0 (0.0%) |
| Total (Category) | 0 (0.0%) | 10 (100.0%) |
| Total (Overall) | 48 (67.6%) | 23 (32.4%) |
Sales and Office Occupations
The most common Sales and Office occupations in Hurley are Office & Administration (15 | 21.1%), and Sales & Related (4 | 5.6%).
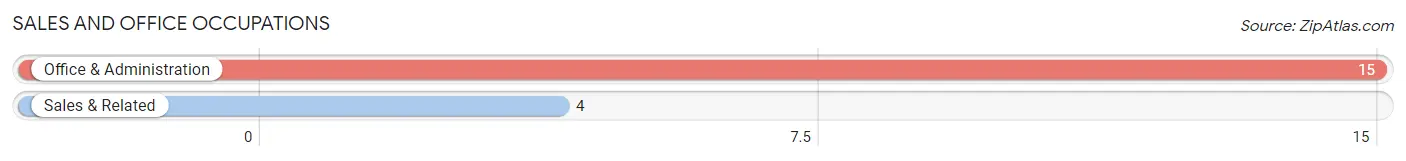
Sales and Office Occupations by Sex
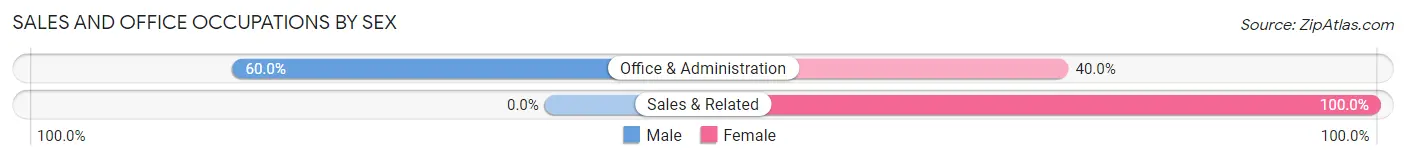
| Occupation | Male | Female |
| Sales & Related | 0 (0.0%) | 4 (100.0%) |
| Office & Administration | 9 (60.0%) | 6 (40.0%) |
| Total (Category) | 9 (47.4%) | 10 (52.6%) |
| Total (Overall) | 48 (67.6%) | 23 (32.4%) |
Natural Resources, Construction and Maintenance Occupations
The most common Natural Resources, Construction and Maintenance occupations in Hurley are Construction & Extraction (13 | 18.3%), and Installation, Maintenance & Repair (1 | 1.4%).
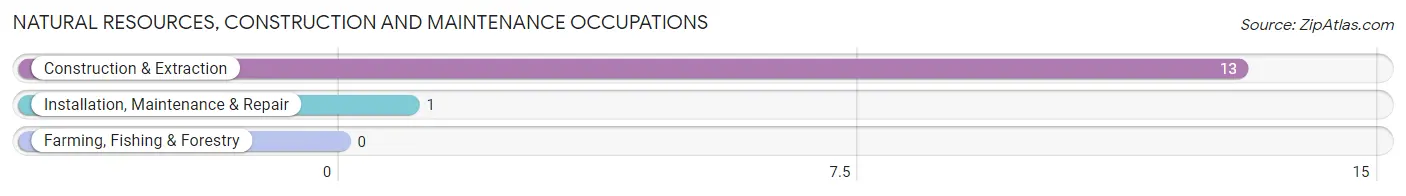
Natural Resources, Construction and Maintenance Occupations by Sex
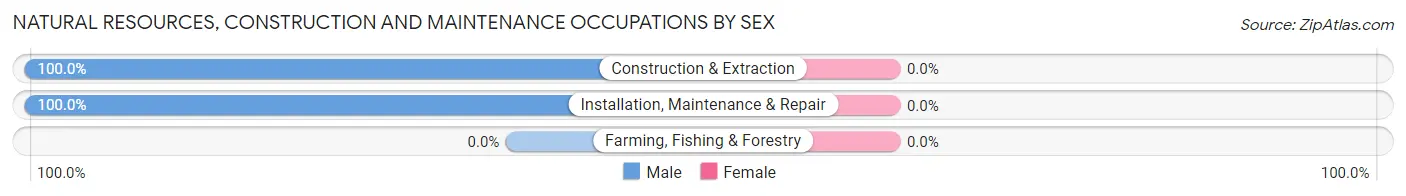
| Occupation | Male | Female |
| Farming, Fishing & Forestry | 0 (0.0%) | 0 (0.0%) |
| Construction & Extraction | 13 (100.0%) | 0 (0.0%) |
| Installation, Maintenance & Repair | 1 (100.0%) | 0 (0.0%) |
| Total (Category) | 14 (100.0%) | 0 (0.0%) |
| Total (Overall) | 48 (67.6%) | 23 (32.4%) |
Production, Transportation and Moving Occupations
The most common Production, Transportation and Moving occupations in Hurley are Production (9 | 12.7%), and Transportation (3 | 4.2%).
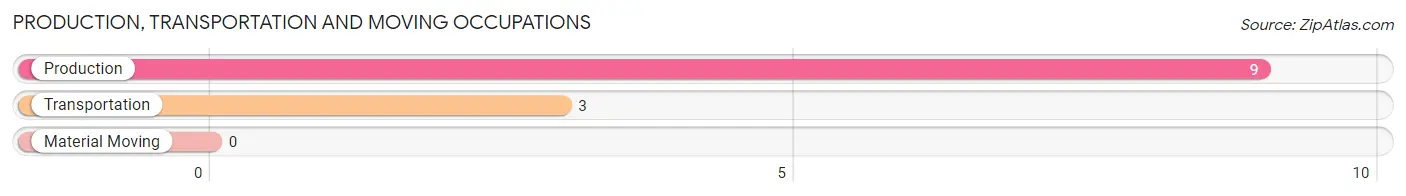
Production, Transportation and Moving Occupations by Sex
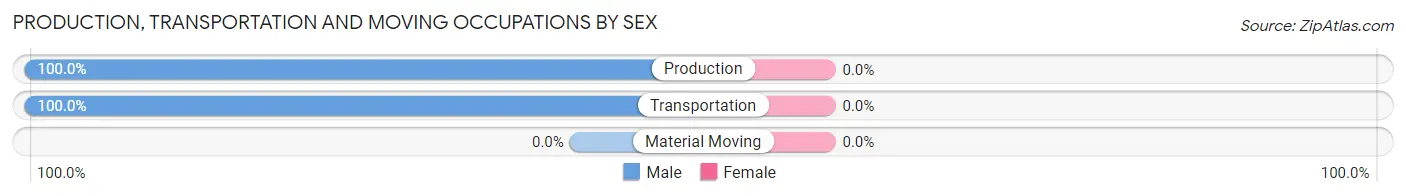
| Occupation | Male | Female |
| Production | 9 (100.0%) | 0 (0.0%) |
| Transportation | 3 (100.0%) | 0 (0.0%) |
| Material Moving | 0 (0.0%) | 0 (0.0%) |
| Total (Category) | 12 (100.0%) | 0 (0.0%) |
| Total (Overall) | 48 (67.6%) | 23 (32.4%) |
Employment Industries by Sex in Hurley
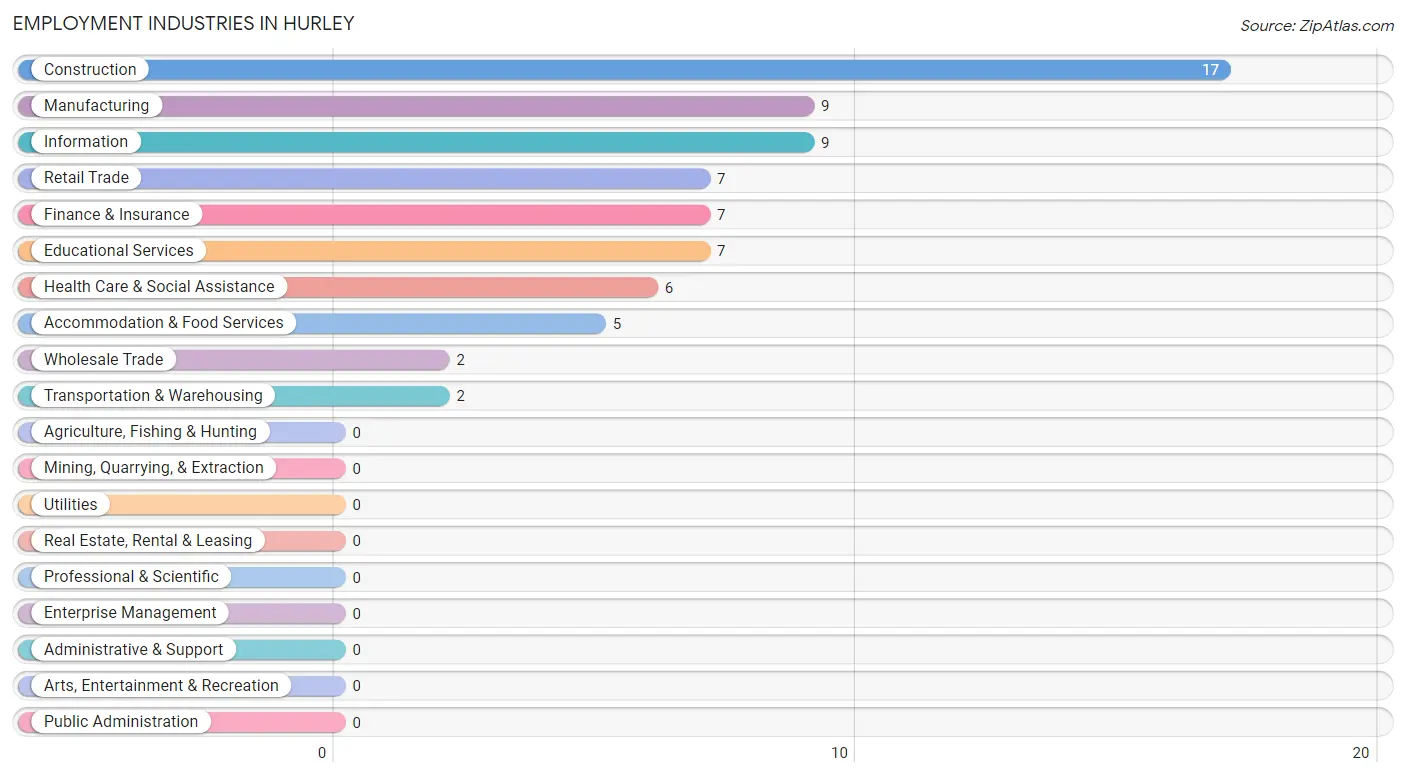
Employment Industries in Hurley
The major employment industries in Hurley include Construction (17 | 23.9%), Manufacturing (9 | 12.7%), Information (9 | 12.7%), Retail Trade (7 | 9.9%), and Finance & Insurance (7 | 9.9%).
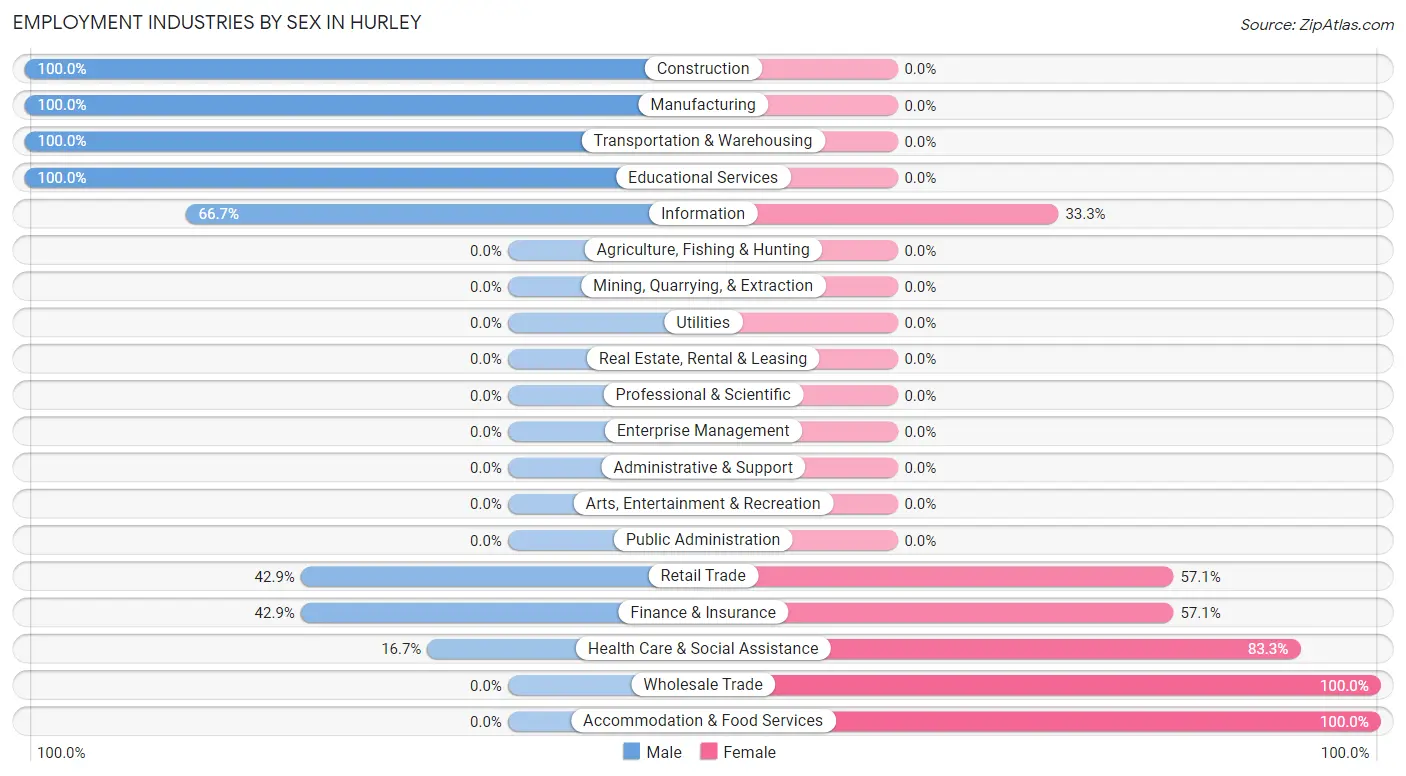
Employment Industries by Sex in Hurley
The Hurley industries that see more men than women are Construction (100.0%), Manufacturing (100.0%), and Transportation & Warehousing (100.0%), whereas the industries that tend to have a higher number of women are Wholesale Trade (100.0%), Accommodation & Food Services (100.0%), and Health Care & Social Assistance (83.3%).
| Industry | Male | Female |
| Agriculture, Fishing & Hunting | 0 (0.0%) | 0 (0.0%) |
| Mining, Quarrying, & Extraction | 0 (0.0%) | 0 (0.0%) |
| Construction | 17 (100.0%) | 0 (0.0%) |
| Manufacturing | 9 (100.0%) | 0 (0.0%) |
| Wholesale Trade | 0 (0.0%) | 2 (100.0%) |
| Retail Trade | 3 (42.9%) | 4 (57.1%) |
| Transportation & Warehousing | 2 (100.0%) | 0 (0.0%) |
| Utilities | 0 (0.0%) | 0 (0.0%) |
| Information | 6 (66.7%) | 3 (33.3%) |
| Finance & Insurance | 3 (42.9%) | 4 (57.1%) |
| Real Estate, Rental & Leasing | 0 (0.0%) | 0 (0.0%) |
| Professional & Scientific | 0 (0.0%) | 0 (0.0%) |
| Enterprise Management | 0 (0.0%) | 0 (0.0%) |
| Administrative & Support | 0 (0.0%) | 0 (0.0%) |
| Educational Services | 7 (100.0%) | 0 (0.0%) |
| Health Care & Social Assistance | 1 (16.7%) | 5 (83.3%) |
| Arts, Entertainment & Recreation | 0 (0.0%) | 0 (0.0%) |
| Accommodation & Food Services | 0 (0.0%) | 5 (100.0%) |
| Public Administration | 0 (0.0%) | 0 (0.0%) |
| Total | 48 (67.6%) | 23 (32.4%) |
Education in Hurley
School Enrollment in Hurley
The most common levels of schooling among the 17 students in Hurley are elementary school (11 | 64.7%), and graduate / professional (6 | 35.3%).
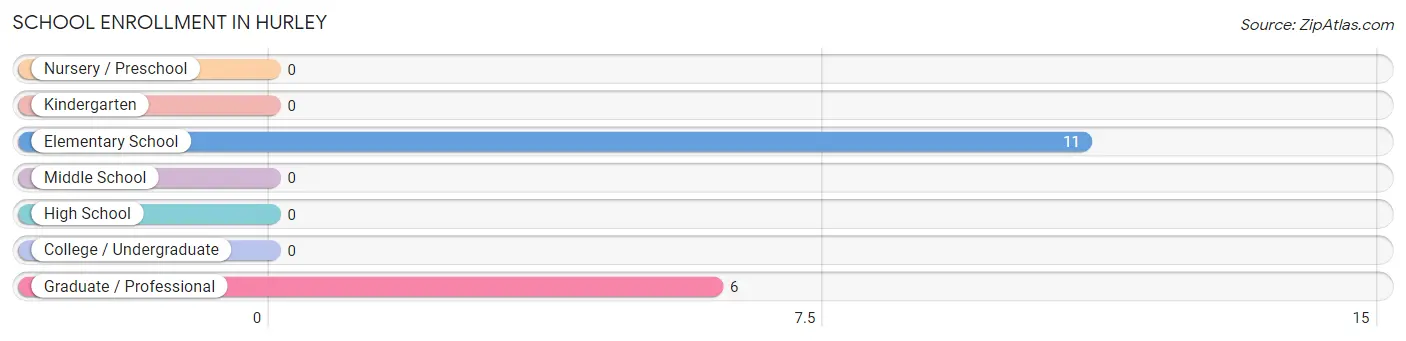
| School Level | # Students | % Students |
| Nursery / Preschool | 0 | 0.0% |
| Kindergarten | 0 | 0.0% |
| Elementary School | 11 | 64.7% |
| Middle School | 0 | 0.0% |
| High School | 0 | 0.0% |
| College / Undergraduate | 0 | 0.0% |
| Graduate / Professional | 6 | 35.3% |
| Total | 17 | 100.0% |
School Enrollment by Age by Funding Source in Hurley
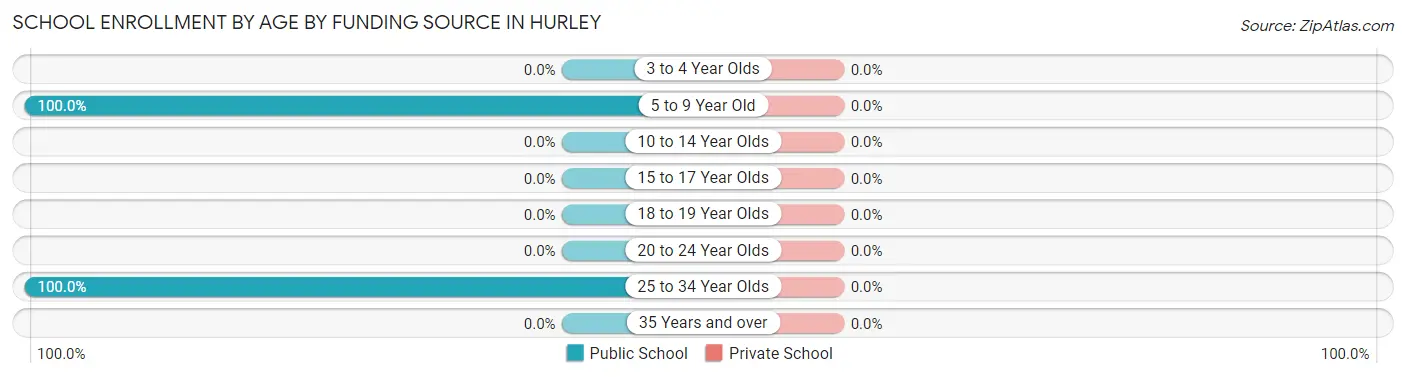
| Age Bracket | Public School | Private School |
| 3 to 4 Year Olds | 0 (0.0%) | 0 (0.0%) |
| 5 to 9 Year Old | 11 (100.0%) | 0 (0.0%) |
| 10 to 14 Year Olds | 0 (0.0%) | 0 (0.0%) |
| 15 to 17 Year Olds | 0 (0.0%) | 0 (0.0%) |
| 18 to 19 Year Olds | 0 (0.0%) | 0 (0.0%) |
| 20 to 24 Year Olds | 0 (0.0%) | 0 (0.0%) |
| 25 to 34 Year Olds | 6 (100.0%) | 0 (0.0%) |
| 35 Years and over | 0 (0.0%) | 0 (0.0%) |
| Total | 17 (100.0%) | 0 (0.0%) |
Educational Attainment by Field of Study in Hurley
Engineering (10 | 34.5%), business (6 | 20.7%), communications (6 | 20.7%), bio, nature & agricultural (4 | 13.8%), and computers & mathematics (3 | 10.3%) are the most common fields of study among 29 individuals in Hurley who have obtained a bachelor's degree or higher.
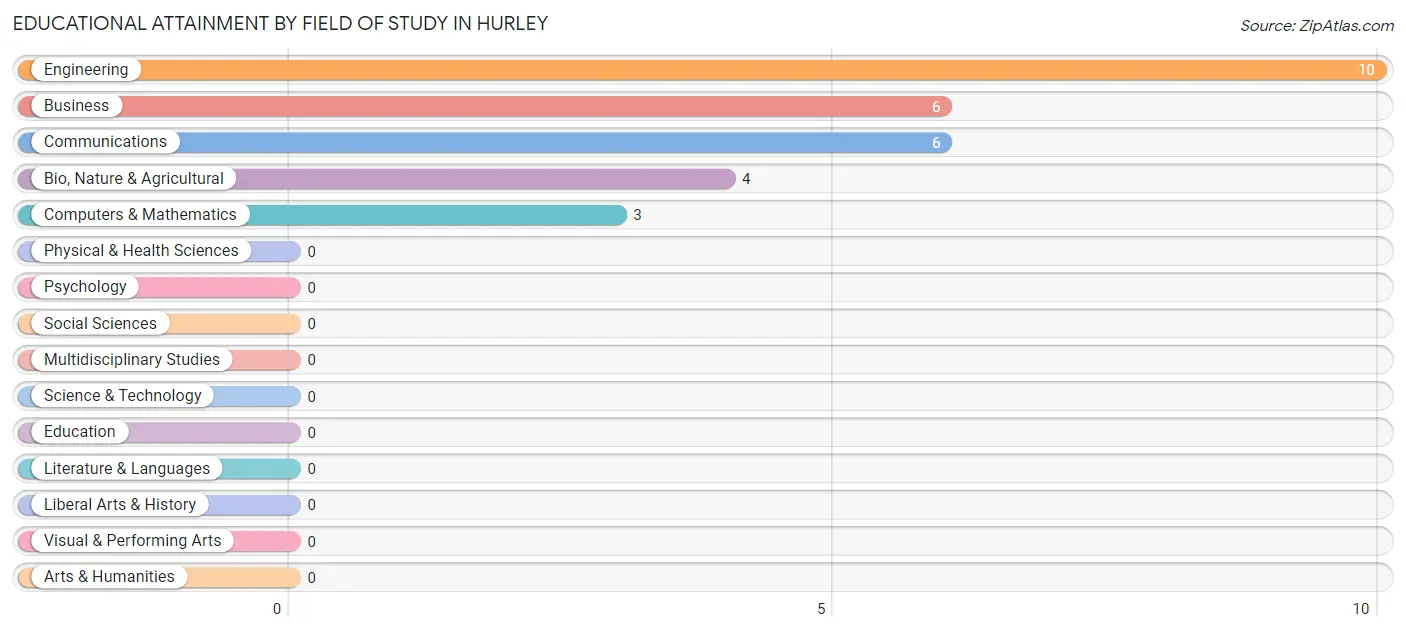
| Field of Study | # Graduates | % Graduates |
| Computers & Mathematics | 3 | 10.3% |
| Bio, Nature & Agricultural | 4 | 13.8% |
| Physical & Health Sciences | 0 | 0.0% |
| Psychology | 0 | 0.0% |
| Social Sciences | 0 | 0.0% |
| Engineering | 10 | 34.5% |
| Multidisciplinary Studies | 0 | 0.0% |
| Science & Technology | 0 | 0.0% |
| Business | 6 | 20.7% |
| Education | 0 | 0.0% |
| Literature & Languages | 0 | 0.0% |
| Liberal Arts & History | 0 | 0.0% |
| Visual & Performing Arts | 0 | 0.0% |
| Communications | 6 | 20.7% |
| Arts & Humanities | 0 | 0.0% |
| Total | 29 | 100.0% |
Transportation & Commute in Hurley
Vehicle Availability by Sex in Hurley
The most prevalent vehicle ownership categories in Hurley are males with 2 vehicles (19, accounting for 39.6%) and females with 2 vehicles (9, making up 82.6%).
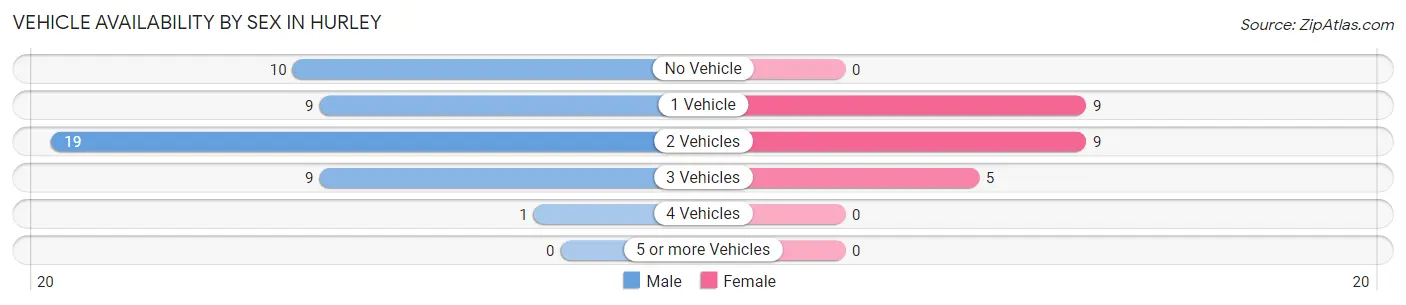
| Vehicles Available | Male | Female |
| No Vehicle | 10 (20.8%) | 0 (0.0%) |
| 1 Vehicle | 9 (18.8%) | 9 (39.1%) |
| 2 Vehicles | 19 (39.6%) | 9 (39.1%) |
| 3 Vehicles | 9 (18.8%) | 5 (21.7%) |
| 4 Vehicles | 1 (2.1%) | 0 (0.0%) |
| 5 or more Vehicles | 0 (0.0%) | 0 (0.0%) |
| Total | 48 (100.0%) | 23 (100.0%) |
Commute Time in Hurley
The most frequently occuring commute durations in Hurley are 45 to 59 minutes (17 commuters, 23.9%), 20 to 24 minutes (9 commuters, 12.7%), and 60 to 89 minutes (9 commuters, 12.7%).
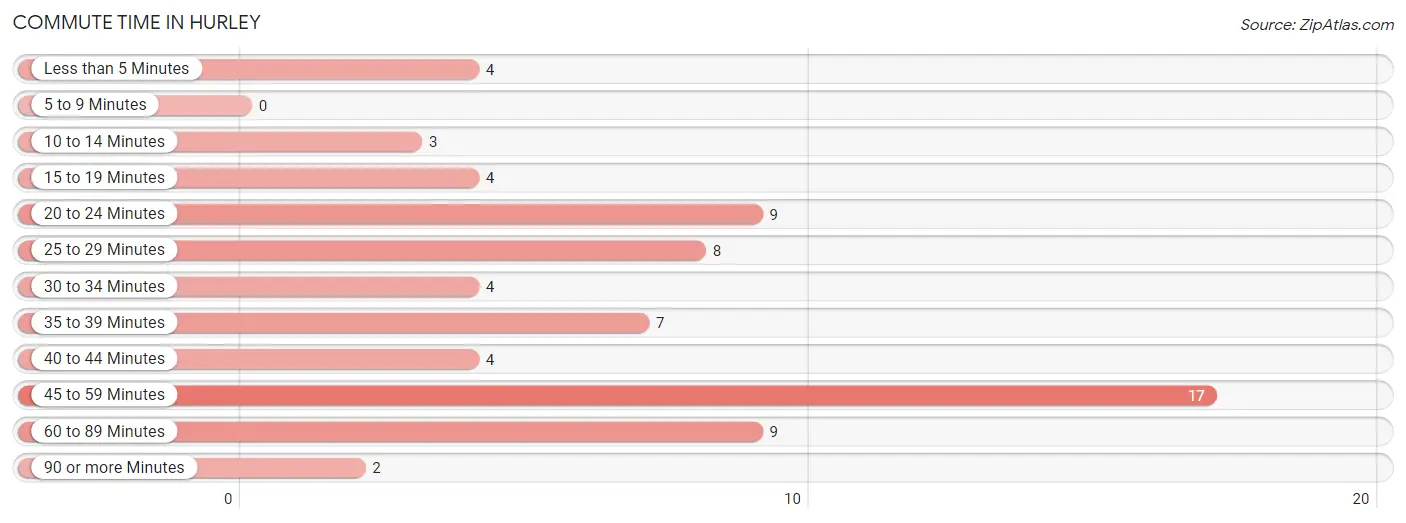
| Commute Time | # Commuters | % Commuters |
| Less than 5 Minutes | 4 | 5.6% |
| 5 to 9 Minutes | 0 | 0.0% |
| 10 to 14 Minutes | 3 | 4.2% |
| 15 to 19 Minutes | 4 | 5.6% |
| 20 to 24 Minutes | 9 | 12.7% |
| 25 to 29 Minutes | 8 | 11.3% |
| 30 to 34 Minutes | 4 | 5.6% |
| 35 to 39 Minutes | 7 | 9.9% |
| 40 to 44 Minutes | 4 | 5.6% |
| 45 to 59 Minutes | 17 | 23.9% |
| 60 to 89 Minutes | 9 | 12.7% |
| 90 or more Minutes | 2 | 2.8% |
Commute Time by Sex in Hurley
The most common commute times in Hurley are 45 to 59 minutes (17 commuters, 35.4%) for males and 20 to 24 minutes (5 commuters, 21.7%) for females.
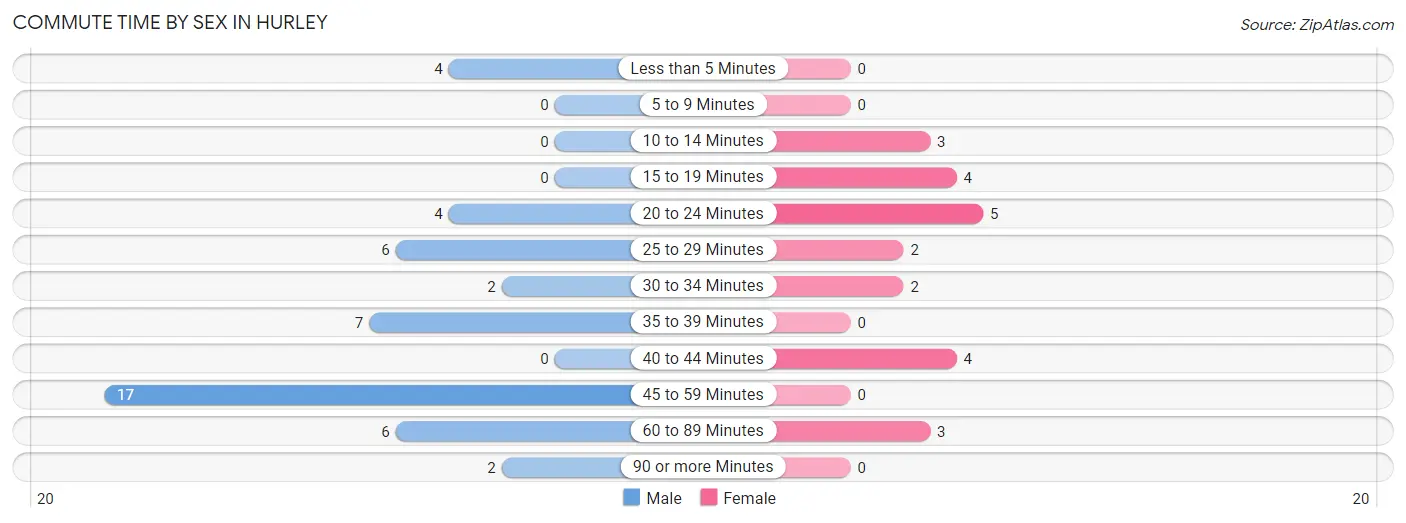
| Commute Time | Male | Female |
| Less than 5 Minutes | 4 (8.3%) | 0 (0.0%) |
| 5 to 9 Minutes | 0 (0.0%) | 0 (0.0%) |
| 10 to 14 Minutes | 0 (0.0%) | 3 (13.0%) |
| 15 to 19 Minutes | 0 (0.0%) | 4 (17.4%) |
| 20 to 24 Minutes | 4 (8.3%) | 5 (21.7%) |
| 25 to 29 Minutes | 6 (12.5%) | 2 (8.7%) |
| 30 to 34 Minutes | 2 (4.2%) | 2 (8.7%) |
| 35 to 39 Minutes | 7 (14.6%) | 0 (0.0%) |
| 40 to 44 Minutes | 0 (0.0%) | 4 (17.4%) |
| 45 to 59 Minutes | 17 (35.4%) | 0 (0.0%) |
| 60 to 89 Minutes | 6 (12.5%) | 3 (13.0%) |
| 90 or more Minutes | 2 (4.2%) | 0 (0.0%) |
Time of Departure to Work by Sex in Hurley
The most frequent times of departure to work in Hurley are 7:00 AM to 7:29 AM (13, 27.1%) for males and 10:00 AM to 10:59 AM (5, 21.7%) for females.
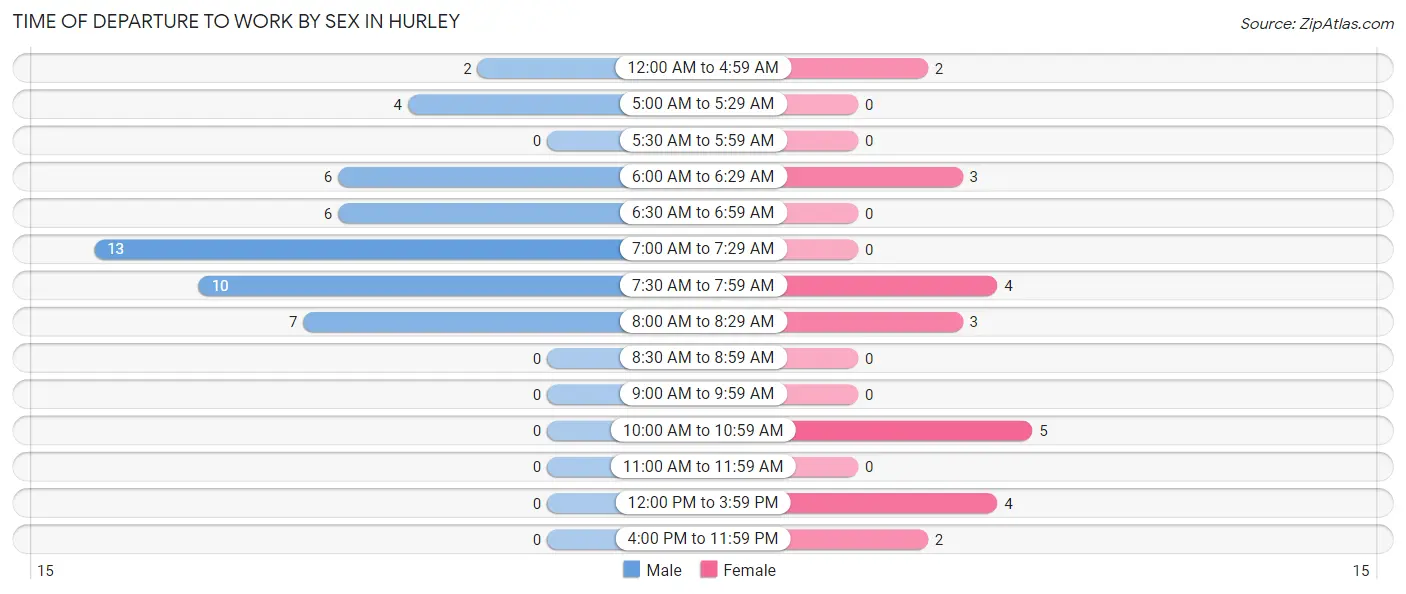
| Time of Departure | Male | Female |
| 12:00 AM to 4:59 AM | 2 (4.2%) | 2 (8.7%) |
| 5:00 AM to 5:29 AM | 4 (8.3%) | 0 (0.0%) |
| 5:30 AM to 5:59 AM | 0 (0.0%) | 0 (0.0%) |
| 6:00 AM to 6:29 AM | 6 (12.5%) | 3 (13.0%) |
| 6:30 AM to 6:59 AM | 6 (12.5%) | 0 (0.0%) |
| 7:00 AM to 7:29 AM | 13 (27.1%) | 0 (0.0%) |
| 7:30 AM to 7:59 AM | 10 (20.8%) | 4 (17.4%) |
| 8:00 AM to 8:29 AM | 7 (14.6%) | 3 (13.0%) |
| 8:30 AM to 8:59 AM | 0 (0.0%) | 0 (0.0%) |
| 9:00 AM to 9:59 AM | 0 (0.0%) | 0 (0.0%) |
| 10:00 AM to 10:59 AM | 0 (0.0%) | 5 (21.7%) |
| 11:00 AM to 11:59 AM | 0 (0.0%) | 0 (0.0%) |
| 12:00 PM to 3:59 PM | 0 (0.0%) | 4 (17.4%) |
| 4:00 PM to 11:59 PM | 0 (0.0%) | 2 (8.7%) |
| Total | 48 (100.0%) | 23 (100.0%) |
Housing Occupancy in Hurley
Occupancy by Ownership in Hurley
Of the total 44 dwellings in Hurley, owner-occupied units account for 33 (75.0%), while renter-occupied units make up 11 (25.0%).
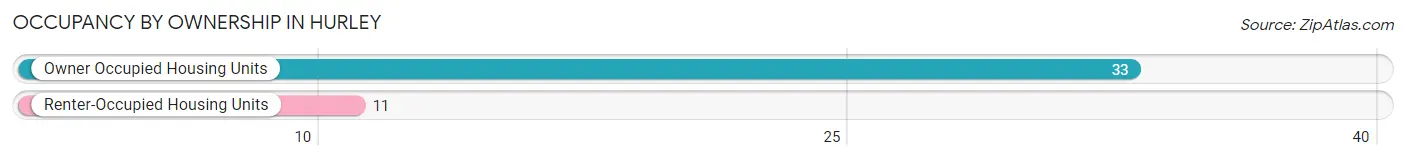
| Occupancy | # Housing Units | % Housing Units |
| Owner Occupied Housing Units | 33 | 75.0% |
| Renter-Occupied Housing Units | 11 | 25.0% |
| Total Occupied Housing Units | 44 | 100.0% |
Occupancy by Household Size in Hurley
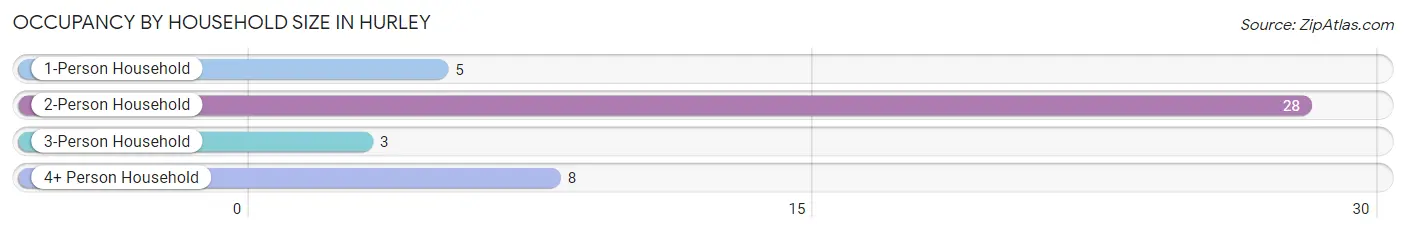
| Household Size | # Housing Units | % Housing Units |
| 1-Person Household | 5 | 11.4% |
| 2-Person Household | 28 | 63.6% |
| 3-Person Household | 3 | 6.8% |
| 4+ Person Household | 8 | 18.2% |
| Total Housing Units | 44 | 100.0% |
Occupancy by Ownership by Household Size in Hurley
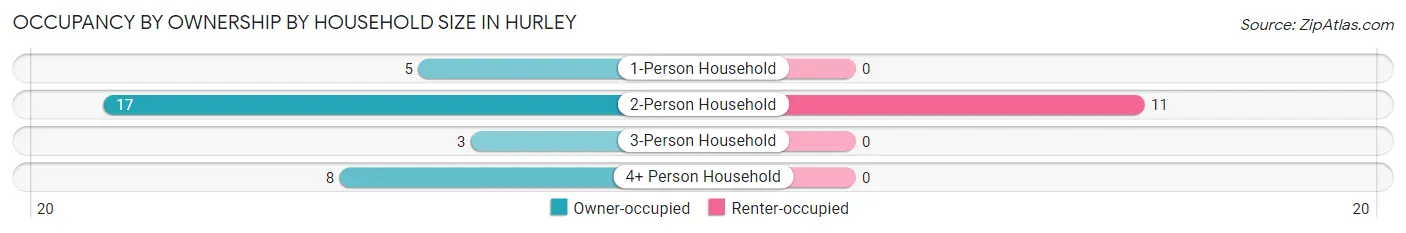
| Household Size | Owner-occupied | Renter-occupied |
| 1-Person Household | 5 (100.0%) | 0 (0.0%) |
| 2-Person Household | 17 (60.7%) | 11 (39.3%) |
| 3-Person Household | 3 (100.0%) | 0 (0.0%) |
| 4+ Person Household | 8 (100.0%) | 0 (0.0%) |
| Total Housing Units | 33 (75.0%) | 11 (25.0%) |
Occupancy by Educational Attainment in Hurley
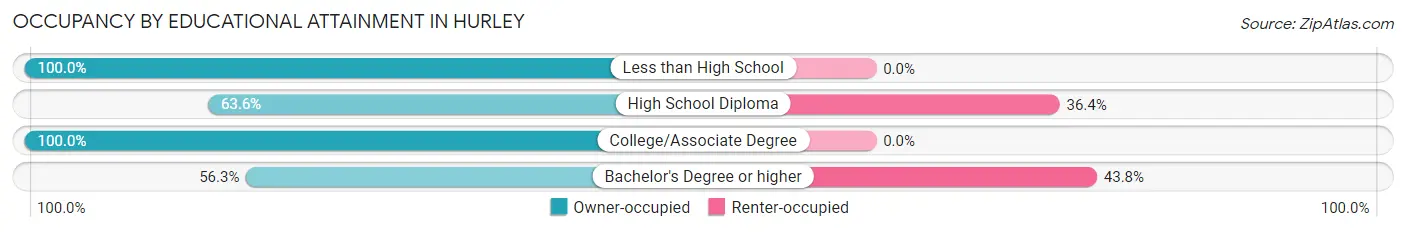
| Household Size | Owner-occupied | Renter-occupied |
| Less than High School | 6 (100.0%) | 0 (0.0%) |
| High School Diploma | 7 (63.6%) | 4 (36.4%) |
| College/Associate Degree | 11 (100.0%) | 0 (0.0%) |
| Bachelor's Degree or higher | 9 (56.2%) | 7 (43.8%) |
Occupancy by Age of Householder in Hurley
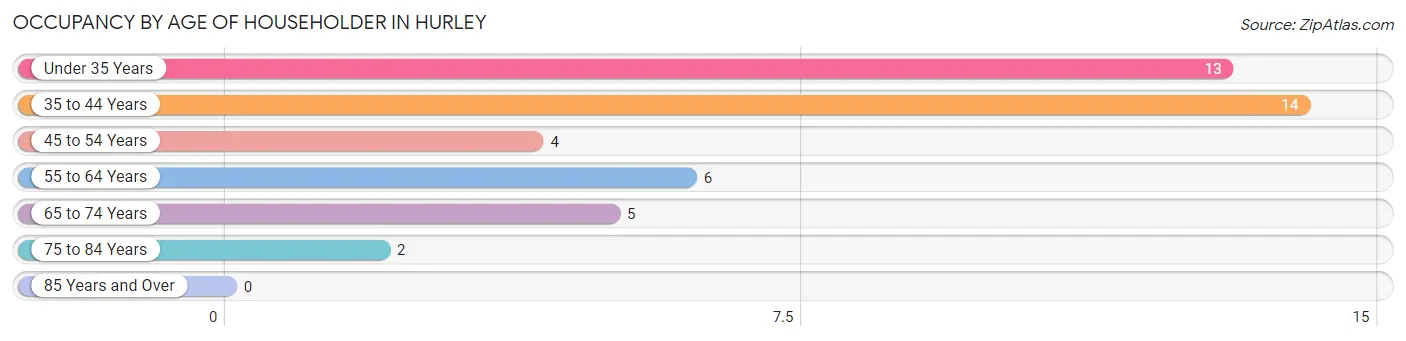
| Age Bracket | # Households | % Households |
| Under 35 Years | 13 | 29.5% |
| 35 to 44 Years | 14 | 31.8% |
| 45 to 54 Years | 4 | 9.1% |
| 55 to 64 Years | 6 | 13.6% |
| 65 to 74 Years | 5 | 11.4% |
| 75 to 84 Years | 2 | 4.5% |
| 85 Years and Over | 0 | 0.0% |
| Total | 44 | 100.0% |
Housing Finances in Hurley
Median Income by Occupancy in Hurley
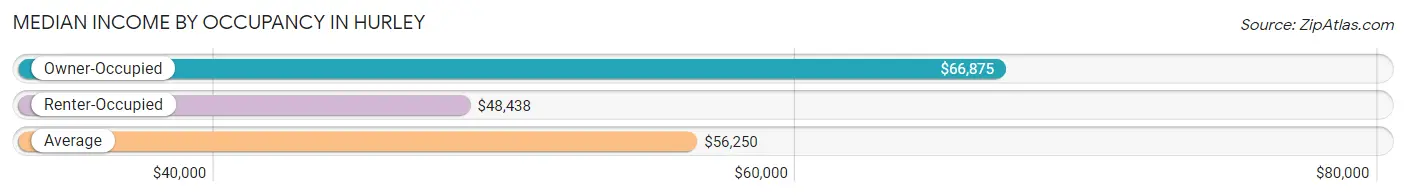
| Occupancy Type | # Households | Median Income |
| Owner-Occupied | 33 (75.0%) | $66,875 |
| Renter-Occupied | 11 (25.0%) | $48,438 |
| Average | 44 (100.0%) | $56,250 |
Occupancy by Householder Income Bracket in Hurley
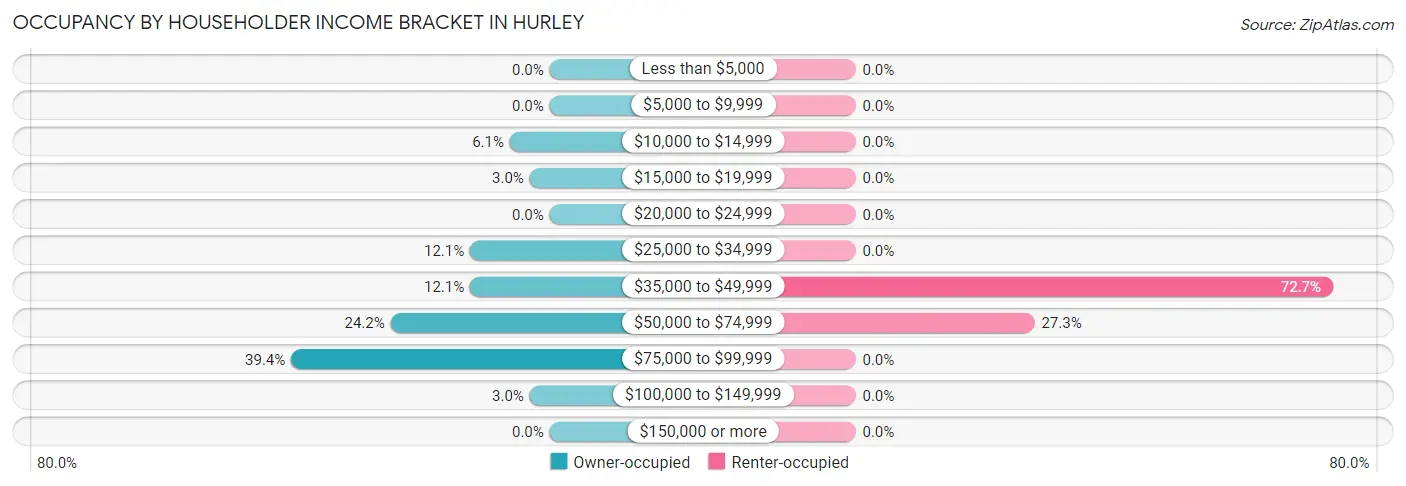
| Income Bracket | Owner-occupied | Renter-occupied |
| Less than $5,000 | 0 (0.0%) | 0 (0.0%) |
| $5,000 to $9,999 | 0 (0.0%) | 0 (0.0%) |
| $10,000 to $14,999 | 2 (6.1%) | 0 (0.0%) |
| $15,000 to $19,999 | 1 (3.0%) | 0 (0.0%) |
| $20,000 to $24,999 | 0 (0.0%) | 0 (0.0%) |
| $25,000 to $34,999 | 4 (12.1%) | 0 (0.0%) |
| $35,000 to $49,999 | 4 (12.1%) | 8 (72.7%) |
| $50,000 to $74,999 | 8 (24.2%) | 3 (27.3%) |
| $75,000 to $99,999 | 13 (39.4%) | 0 (0.0%) |
| $100,000 to $149,999 | 1 (3.0%) | 0 (0.0%) |
| $150,000 or more | 0 (0.0%) | 0 (0.0%) |
| Total | 33 (100.0%) | 11 (100.0%) |
Monthly Housing Cost Tiers in Hurley
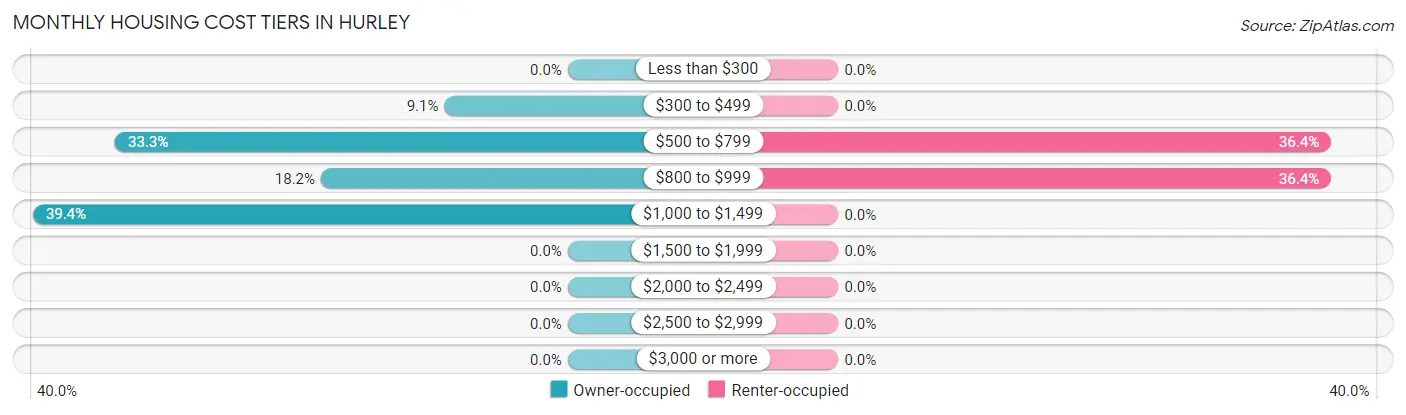
| Monthly Cost | Owner-occupied | Renter-occupied |
| Less than $300 | 0 (0.0%) | 0 (0.0%) |
| $300 to $499 | 3 (9.1%) | 0 (0.0%) |
| $500 to $799 | 11 (33.3%) | 4 (36.4%) |
| $800 to $999 | 6 (18.2%) | 4 (36.4%) |
| $1,000 to $1,499 | 13 (39.4%) | 0 (0.0%) |
| $1,500 to $1,999 | 0 (0.0%) | 0 (0.0%) |
| $2,000 to $2,499 | 0 (0.0%) | 0 (0.0%) |
| $2,500 to $2,999 | 0 (0.0%) | 0 (0.0%) |
| $3,000 or more | 0 (0.0%) | 0 (0.0%) |
| Total | 33 (100.0%) | 11 (100.0%) |
Physical Housing Characteristics in Hurley
Housing Structures in Hurley
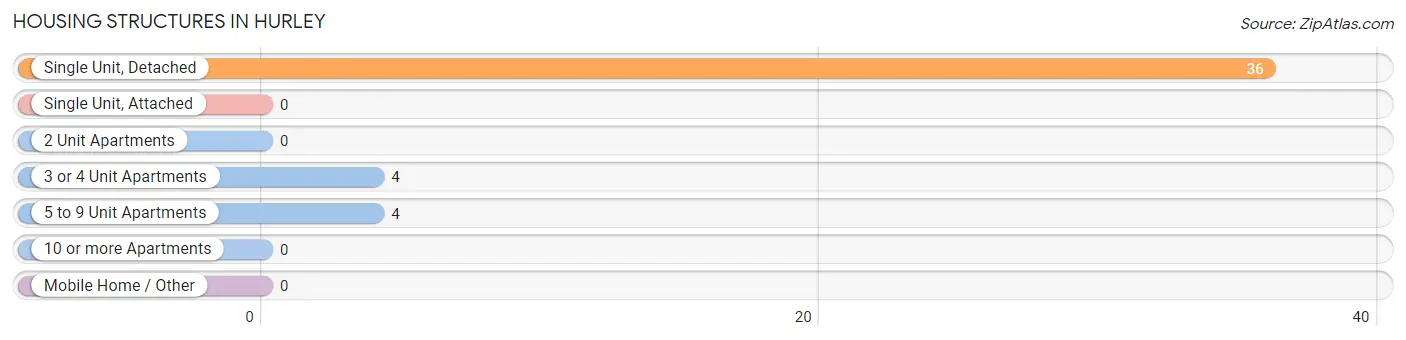
| Structure Type | # Housing Units | % Housing Units |
| Single Unit, Detached | 36 | 81.8% |
| Single Unit, Attached | 0 | 0.0% |
| 2 Unit Apartments | 0 | 0.0% |
| 3 or 4 Unit Apartments | 4 | 9.1% |
| 5 to 9 Unit Apartments | 4 | 9.1% |
| 10 or more Apartments | 0 | 0.0% |
| Mobile Home / Other | 0 | 0.0% |
| Total | 44 | 100.0% |
Housing Structures by Occupancy in Hurley
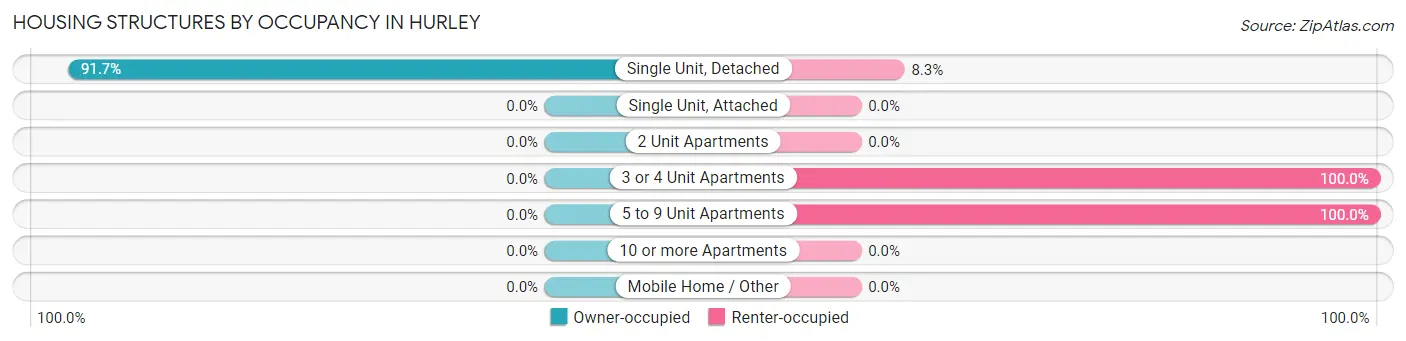
| Structure Type | Owner-occupied | Renter-occupied |
| Single Unit, Detached | 33 (91.7%) | 3 (8.3%) |
| Single Unit, Attached | 0 (0.0%) | 0 (0.0%) |
| 2 Unit Apartments | 0 (0.0%) | 0 (0.0%) |
| 3 or 4 Unit Apartments | 0 (0.0%) | 4 (100.0%) |
| 5 to 9 Unit Apartments | 0 (0.0%) | 4 (100.0%) |
| 10 or more Apartments | 0 (0.0%) | 0 (0.0%) |
| Mobile Home / Other | 0 (0.0%) | 0 (0.0%) |
| Total | 33 (75.0%) | 11 (25.0%) |
Housing Structures by Number of Rooms in Hurley
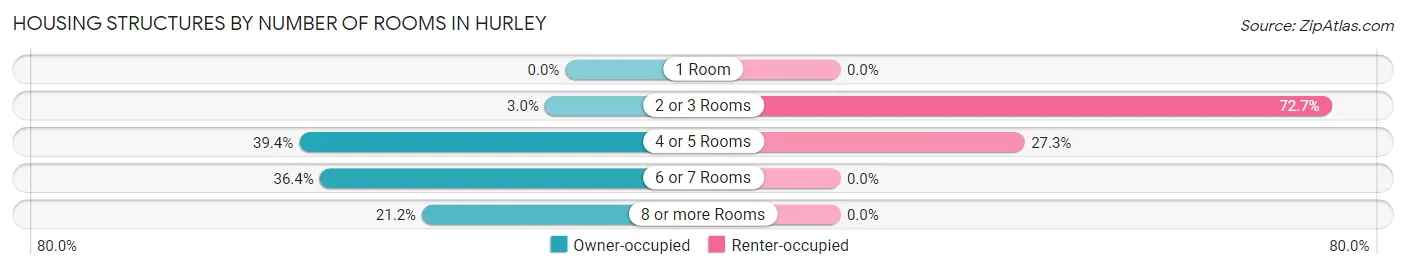
| Number of Rooms | Owner-occupied | Renter-occupied |
| 1 Room | 0 (0.0%) | 0 (0.0%) |
| 2 or 3 Rooms | 1 (3.0%) | 8 (72.7%) |
| 4 or 5 Rooms | 13 (39.4%) | 3 (27.3%) |
| 6 or 7 Rooms | 12 (36.4%) | 0 (0.0%) |
| 8 or more Rooms | 7 (21.2%) | 0 (0.0%) |
| Total | 33 (100.0%) | 11 (100.0%) |
Housing Structure by Heating Type in Hurley
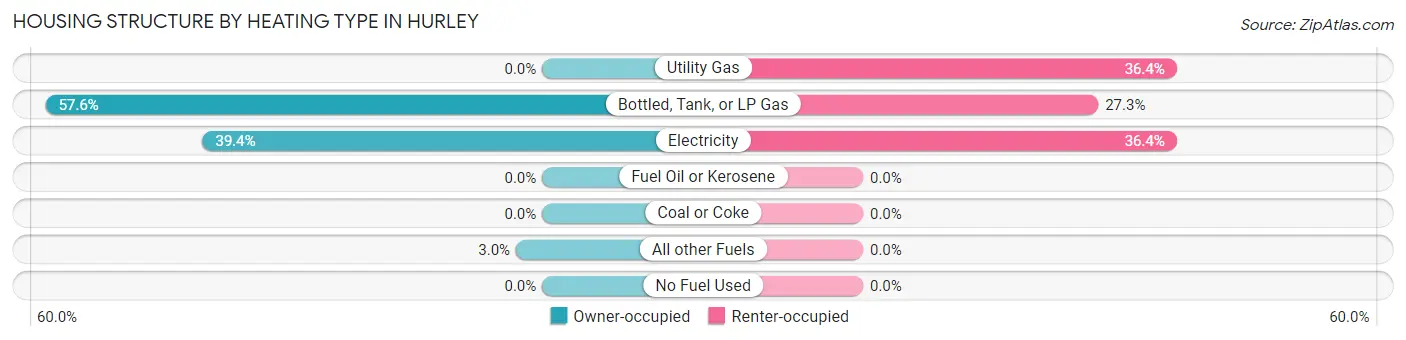
| Heating Type | Owner-occupied | Renter-occupied |
| Utility Gas | 0 (0.0%) | 4 (36.4%) |
| Bottled, Tank, or LP Gas | 19 (57.6%) | 3 (27.3%) |
| Electricity | 13 (39.4%) | 4 (36.4%) |
| Fuel Oil or Kerosene | 0 (0.0%) | 0 (0.0%) |
| Coal or Coke | 0 (0.0%) | 0 (0.0%) |
| All other Fuels | 1 (3.0%) | 0 (0.0%) |
| No Fuel Used | 0 (0.0%) | 0 (0.0%) |
| Total | 33 (100.0%) | 11 (100.0%) |
Household Vehicle Usage in Hurley
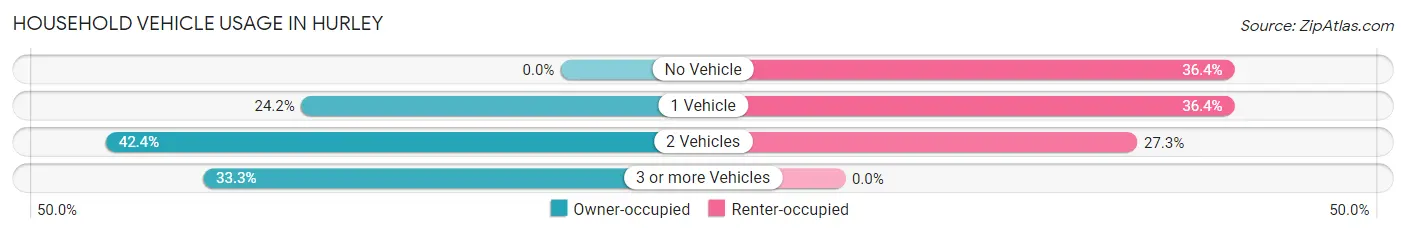
| Vehicles per Household | Owner-occupied | Renter-occupied |
| No Vehicle | 0 (0.0%) | 4 (36.4%) |
| 1 Vehicle | 8 (24.2%) | 4 (36.4%) |
| 2 Vehicles | 14 (42.4%) | 3 (27.3%) |
| 3 or more Vehicles | 11 (33.3%) | 0 (0.0%) |
| Total | 33 (100.0%) | 11 (100.0%) |
Real Estate & Mortgages in Hurley
Real Estate and Mortgage Overview in Hurley
| Characteristic | Without Mortgage | With Mortgage |
| Housing Units | 8 | 25 |
| Median Property Value | $87,500 | $85,000 |
| Median Household Income | $80,000 | $0 |
| Monthly Housing Costs | $600 | $0 |
| Real Estate Taxes | $514 | $0 |
Property Value by Mortgage Status in Hurley
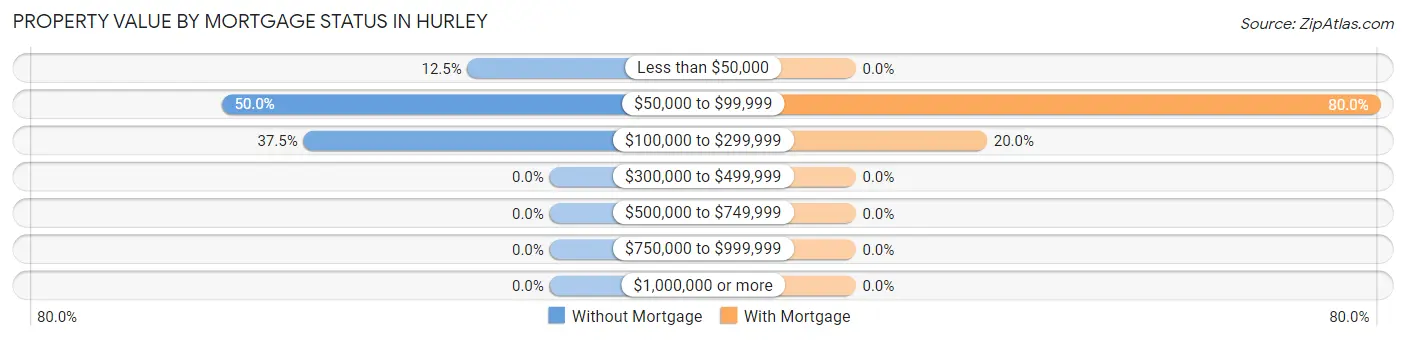
| Property Value | Without Mortgage | With Mortgage |
| Less than $50,000 | 1 (12.5%) | 0 (0.0%) |
| $50,000 to $99,999 | 4 (50.0%) | 20 (80.0%) |
| $100,000 to $299,999 | 3 (37.5%) | 5 (20.0%) |
| $300,000 to $499,999 | 0 (0.0%) | 0 (0.0%) |
| $500,000 to $749,999 | 0 (0.0%) | 0 (0.0%) |
| $750,000 to $999,999 | 0 (0.0%) | 0 (0.0%) |
| $1,000,000 or more | 0 (0.0%) | 0 (0.0%) |
| Total | 8 (100.0%) | 25 (100.0%) |
Household Income by Mortgage Status in Hurley
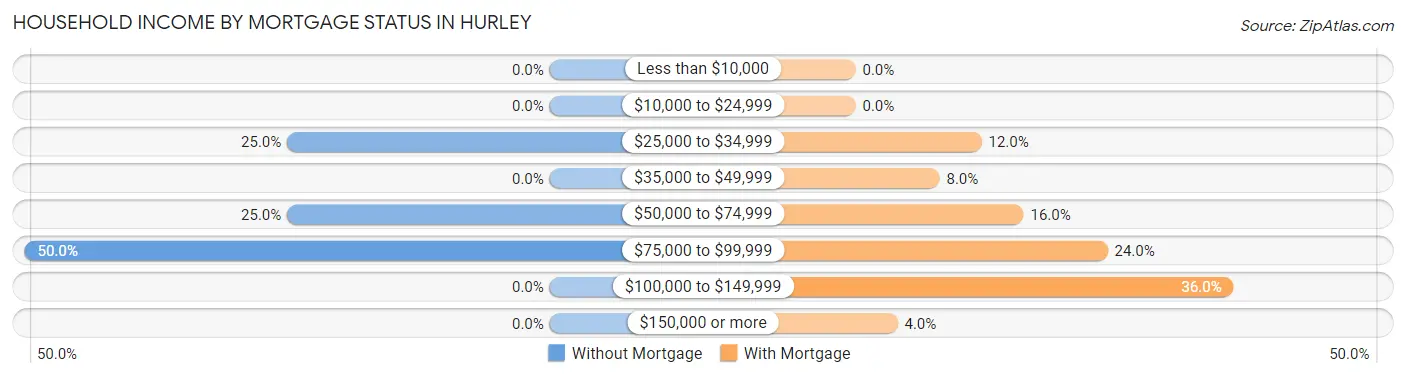
| Household Income | Without Mortgage | With Mortgage |
| Less than $10,000 | 0 (0.0%) | 0 (0.0%) |
| $10,000 to $24,999 | 0 (0.0%) | 0 (0.0%) |
| $25,000 to $34,999 | 2 (25.0%) | 3 (12.0%) |
| $35,000 to $49,999 | 0 (0.0%) | 2 (8.0%) |
| $50,000 to $74,999 | 2 (25.0%) | 4 (16.0%) |
| $75,000 to $99,999 | 4 (50.0%) | 6 (24.0%) |
| $100,000 to $149,999 | 0 (0.0%) | 9 (36.0%) |
| $150,000 or more | 0 (0.0%) | 1 (4.0%) |
| Total | 8 (100.0%) | 25 (100.0%) |
Property Value to Household Income Ratio in Hurley
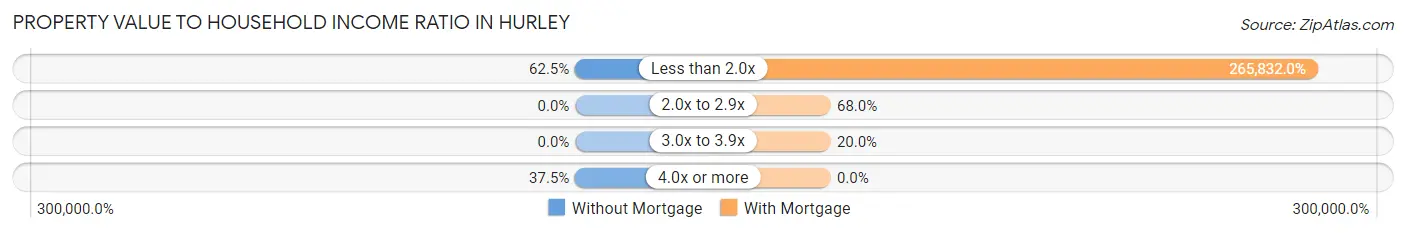
| Value-to-Income Ratio | Without Mortgage | With Mortgage |
| Less than 2.0x | 5 (62.5%) | 66,458 (265,832.0%) |
| 2.0x to 2.9x | 0 (0.0%) | 17 (68.0%) |
| 3.0x to 3.9x | 0 (0.0%) | 5 (20.0%) |
| 4.0x or more | 3 (37.5%) | 0 (0.0%) |
| Total | 8 (100.0%) | 25 (100.0%) |
Real Estate Taxes by Mortgage Status in Hurley
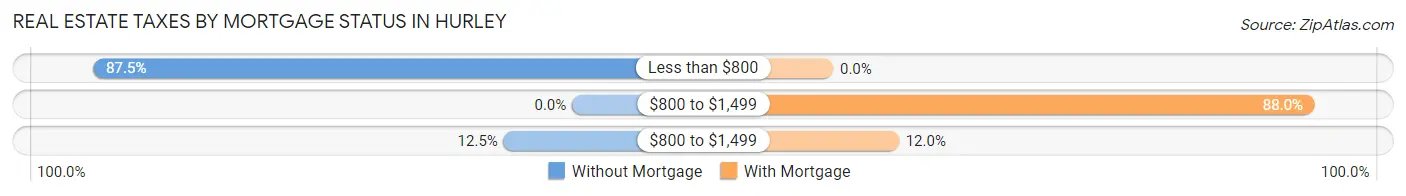
| Property Taxes | Without Mortgage | With Mortgage |
| Less than $800 | 7 (87.5%) | 0 (0.0%) |
| $800 to $1,499 | 0 (0.0%) | 22 (88.0%) |
| $800 to $1,499 | 1 (12.5%) | 3 (12.0%) |
| Total | 8 (100.0%) | 25 (100.0%) |
Health & Disability in Hurley
Health Insurance Coverage by Age in Hurley
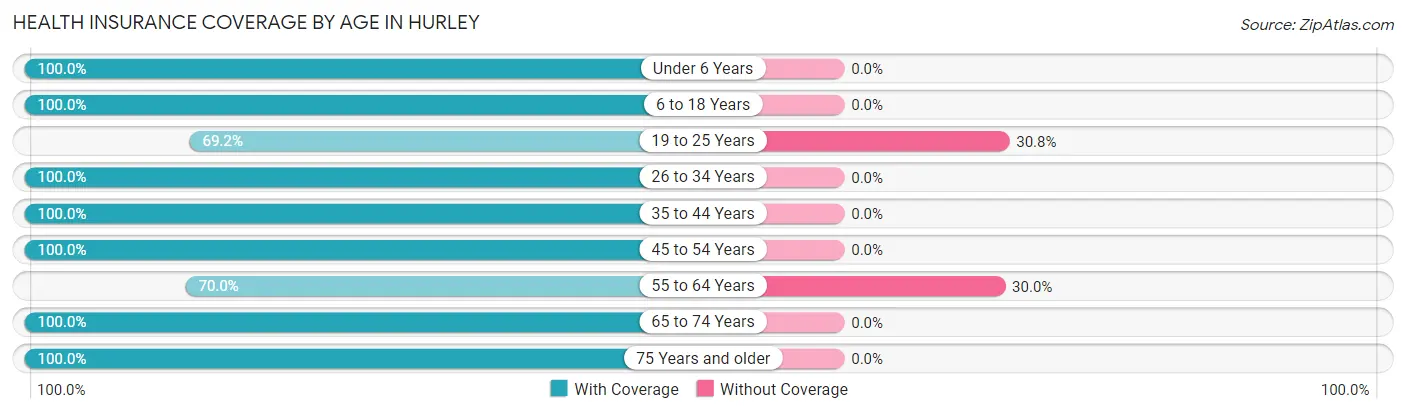
| Age Bracket | With Coverage | Without Coverage |
| Under 6 Years | 6 (100.0%) | 0 (0.0%) |
| 6 to 18 Years | 14 (100.0%) | 0 (0.0%) |
| 19 to 25 Years | 9 (69.2%) | 4 (30.8%) |
| 26 to 34 Years | 21 (100.0%) | 0 (0.0%) |
| 35 to 44 Years | 21 (100.0%) | 0 (0.0%) |
| 45 to 54 Years | 14 (100.0%) | 0 (0.0%) |
| 55 to 64 Years | 7 (70.0%) | 3 (30.0%) |
| 65 to 74 Years | 7 (100.0%) | 0 (0.0%) |
| 75 Years and older | 3 (100.0%) | 0 (0.0%) |
| Total | 102 (93.6%) | 7 (6.4%) |
Health Insurance Coverage by Citizenship Status in Hurley
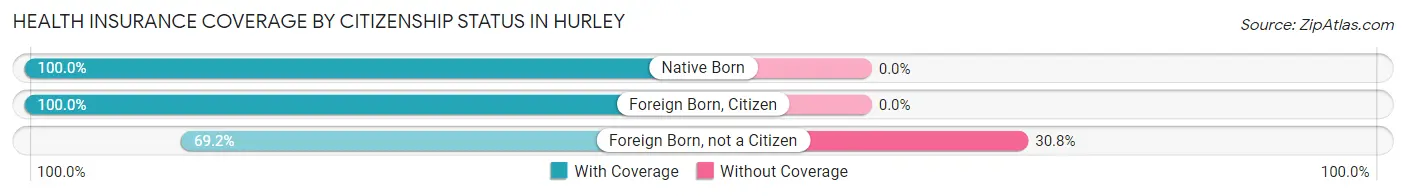
| Citizenship Status | With Coverage | Without Coverage |
| Native Born | 6 (100.0%) | 0 (0.0%) |
| Foreign Born, Citizen | 14 (100.0%) | 0 (0.0%) |
| Foreign Born, not a Citizen | 9 (69.2%) | 4 (30.8%) |
Health Insurance Coverage by Household Income in Hurley
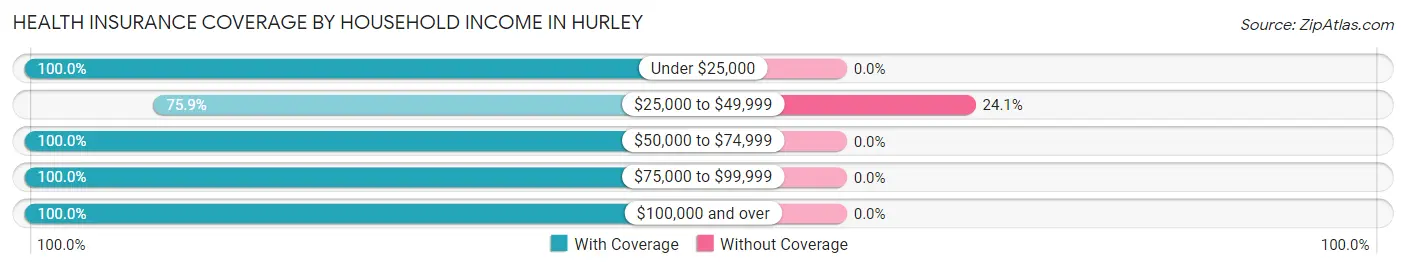
| Household Income | With Coverage | Without Coverage |
| Under $25,000 | 11 (100.0%) | 0 (0.0%) |
| $25,000 to $49,999 | 22 (75.9%) | 7 (24.1%) |
| $50,000 to $74,999 | 28 (100.0%) | 0 (0.0%) |
| $75,000 to $99,999 | 39 (100.0%) | 0 (0.0%) |
| $100,000 and over | 2 (100.0%) | 0 (0.0%) |
Public vs Private Health Insurance Coverage by Age in Hurley
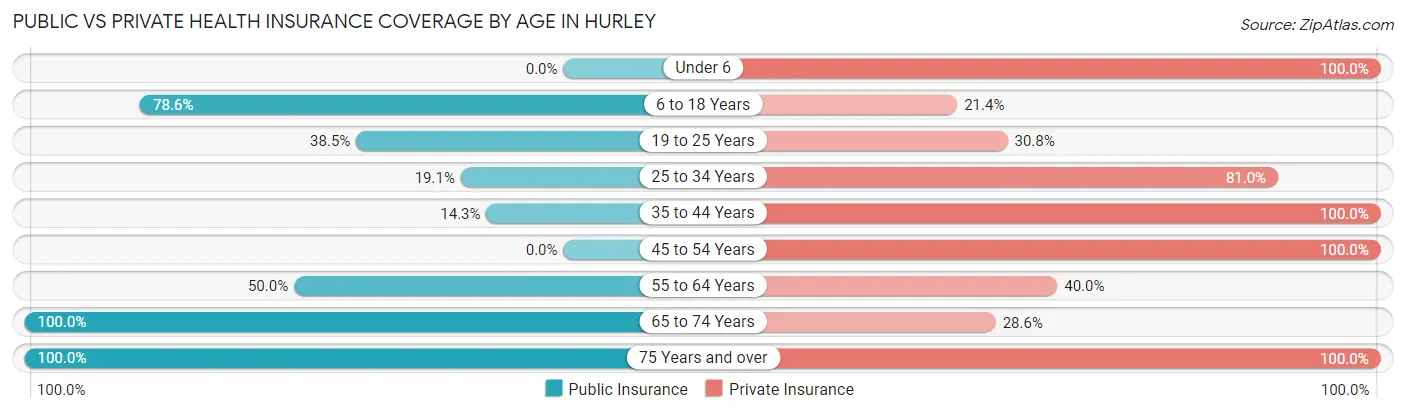
| Age Bracket | Public Insurance | Private Insurance |
| Under 6 | 0 (0.0%) | 6 (100.0%) |
| 6 to 18 Years | 11 (78.6%) | 3 (21.4%) |
| 19 to 25 Years | 5 (38.5%) | 4 (30.8%) |
| 25 to 34 Years | 4 (19.1%) | 17 (80.9%) |
| 35 to 44 Years | 3 (14.3%) | 21 (100.0%) |
| 45 to 54 Years | 0 (0.0%) | 14 (100.0%) |
| 55 to 64 Years | 5 (50.0%) | 4 (40.0%) |
| 65 to 74 Years | 7 (100.0%) | 2 (28.6%) |
| 75 Years and over | 3 (100.0%) | 3 (100.0%) |
| Total | 38 (34.9%) | 74 (67.9%) |
Disability Status by Sex by Age in Hurley
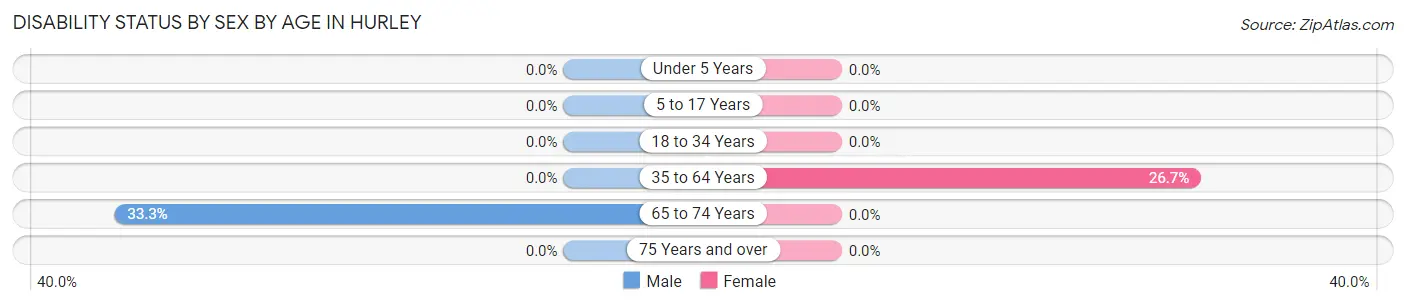
| Age Bracket | Male | Female |
| Under 5 Years | 0 (0.0%) | 0 (0.0%) |
| 5 to 17 Years | 0 (0.0%) | 0 (0.0%) |
| 18 to 34 Years | 0 (0.0%) | 0 (0.0%) |
| 35 to 64 Years | 0 (0.0%) | 4 (26.7%) |
| 65 to 74 Years | 1 (33.3%) | 0 (0.0%) |
| 75 Years and over | 0 (0.0%) | 0 (0.0%) |
Disability Class by Sex by Age in Hurley
Disability Class: Hearing Difficulty
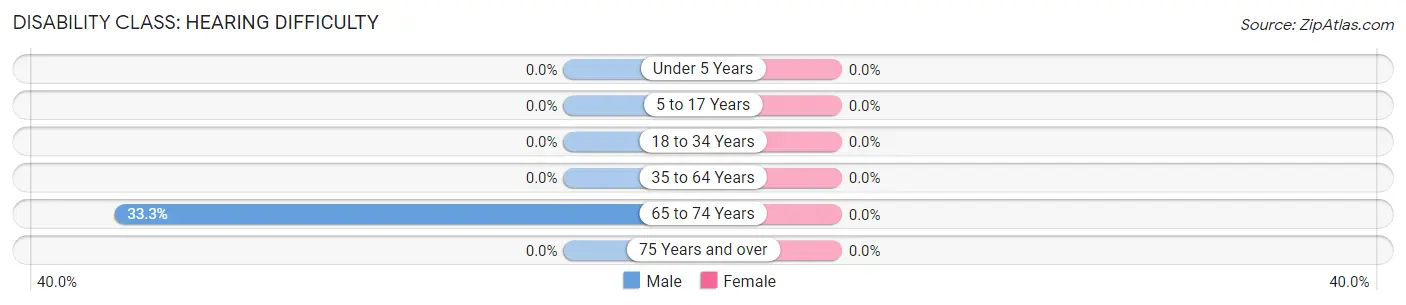
| Age Bracket | Male | Female |
| Under 5 Years | 0 (0.0%) | 0 (0.0%) |
| 5 to 17 Years | 0 (0.0%) | 0 (0.0%) |
| 18 to 34 Years | 0 (0.0%) | 0 (0.0%) |
| 35 to 64 Years | 0 (0.0%) | 0 (0.0%) |
| 65 to 74 Years | 1 (33.3%) | 0 (0.0%) |
| 75 Years and over | 0 (0.0%) | 0 (0.0%) |
Disability Class: Vision Difficulty
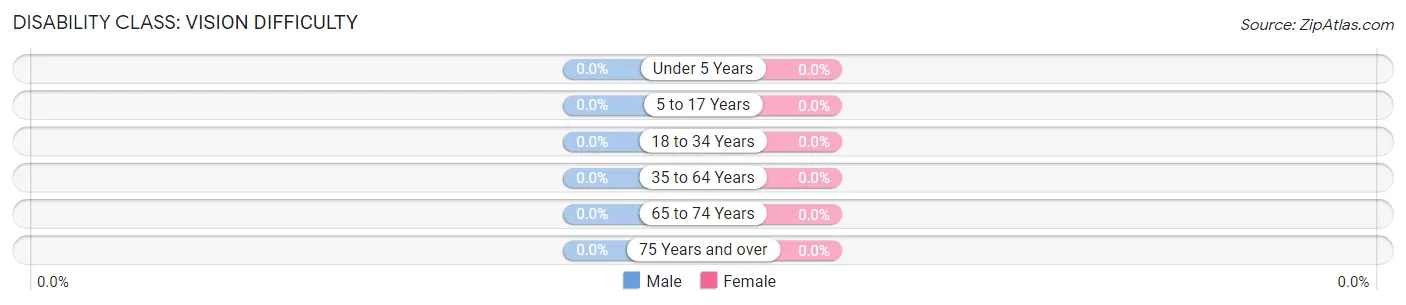
| Age Bracket | Male | Female |
| Under 5 Years | 0 (0.0%) | 0 (0.0%) |
| 5 to 17 Years | 0 (0.0%) | 0 (0.0%) |
| 18 to 34 Years | 0 (0.0%) | 0 (0.0%) |
| 35 to 64 Years | 0 (0.0%) | 0 (0.0%) |
| 65 to 74 Years | 0 (0.0%) | 0 (0.0%) |
| 75 Years and over | 0 (0.0%) | 0 (0.0%) |
Disability Class: Cognitive Difficulty
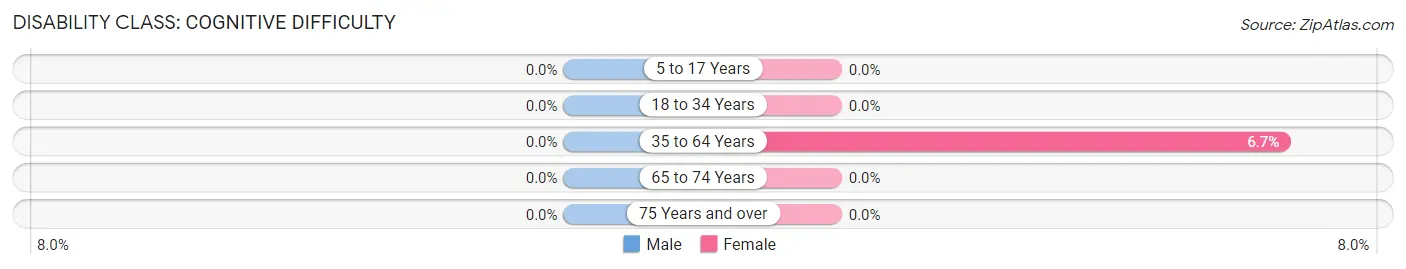
| Age Bracket | Male | Female |
| 5 to 17 Years | 0 (0.0%) | 0 (0.0%) |
| 18 to 34 Years | 0 (0.0%) | 0 (0.0%) |
| 35 to 64 Years | 0 (0.0%) | 1 (6.7%) |
| 65 to 74 Years | 0 (0.0%) | 0 (0.0%) |
| 75 Years and over | 0 (0.0%) | 0 (0.0%) |
Disability Class: Ambulatory Difficulty
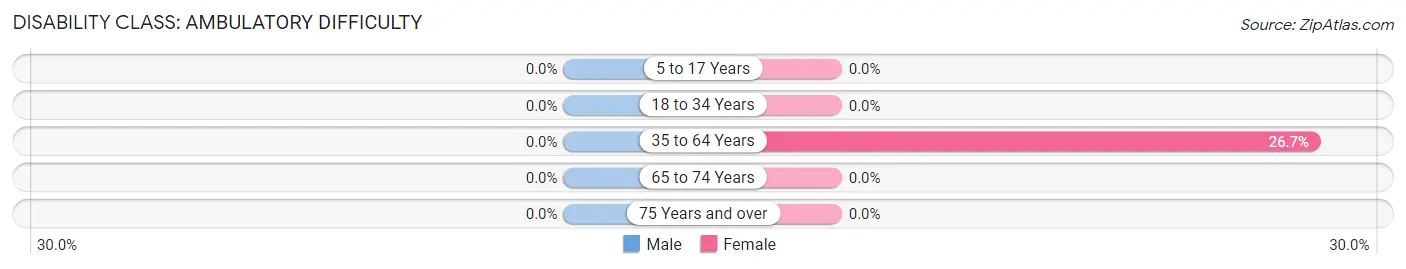
| Age Bracket | Male | Female |
| 5 to 17 Years | 0 (0.0%) | 0 (0.0%) |
| 18 to 34 Years | 0 (0.0%) | 0 (0.0%) |
| 35 to 64 Years | 0 (0.0%) | 4 (26.7%) |
| 65 to 74 Years | 0 (0.0%) | 0 (0.0%) |
| 75 Years and over | 0 (0.0%) | 0 (0.0%) |
Disability Class: Self-Care Difficulty
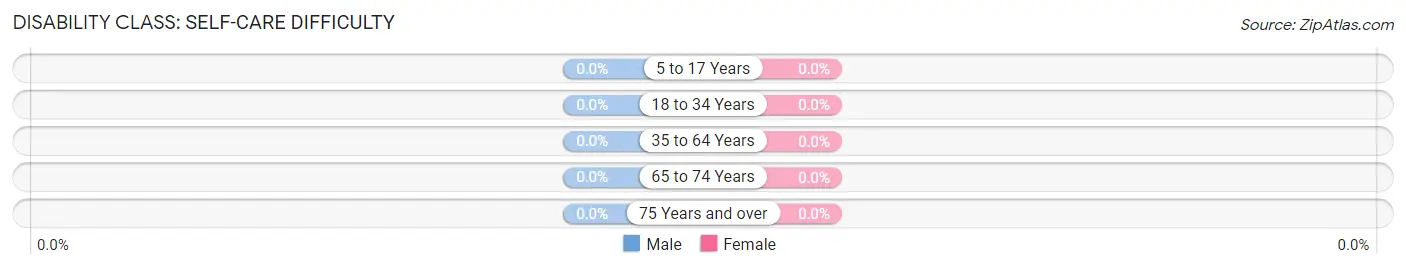
| Age Bracket | Male | Female |
| 5 to 17 Years | 0 (0.0%) | 0 (0.0%) |
| 18 to 34 Years | 0 (0.0%) | 0 (0.0%) |
| 35 to 64 Years | 0 (0.0%) | 0 (0.0%) |
| 65 to 74 Years | 0 (0.0%) | 0 (0.0%) |
| 75 Years and over | 0 (0.0%) | 0 (0.0%) |
Technology Access in Hurley
Computing Device Access in Hurley
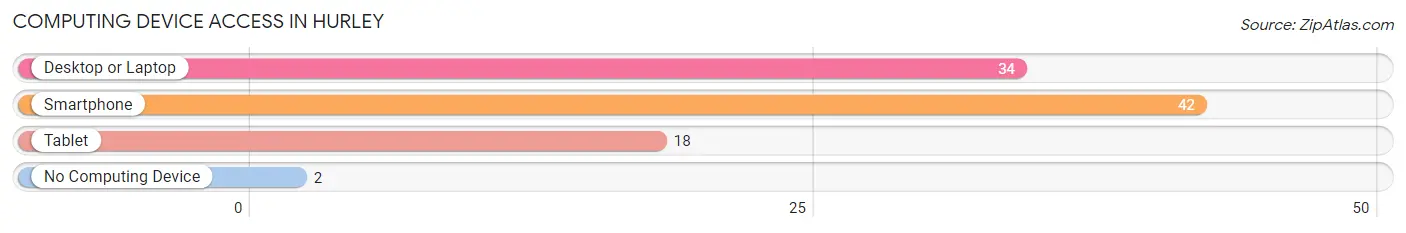
| Device Type | # Households | % Households |
| Desktop or Laptop | 34 | 77.3% |
| Smartphone | 42 | 95.5% |
| Tablet | 18 | 40.9% |
| No Computing Device | 2 | 4.5% |
| Total | 44 | 100.0% |
Internet Access in Hurley
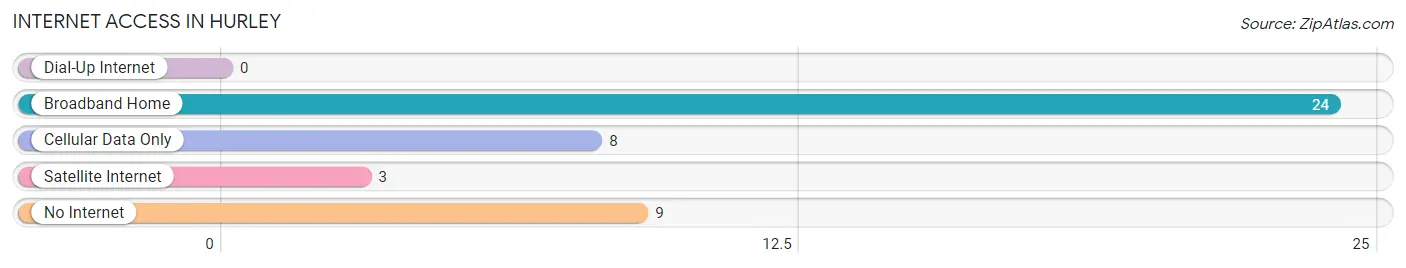
| Internet Type | # Households | % Households |
| Dial-Up Internet | 0 | 0.0% |
| Broadband Home | 24 | 54.5% |
| Cellular Data Only | 8 | 18.2% |
| Satellite Internet | 3 | 6.8% |
| No Internet | 9 | 20.4% |
| Total | 44 | 100.0% |
Hurley Summary
Hurley, Missouri is a small town located in the southeastern corner of the state, in the Ozark Mountains. It is situated in the heart of the Ozark National Scenic Riverways, a protected area of rivers, streams, and forests. The town is home to a population of just over 500 people, and is known for its rural charm and natural beauty.
Geography
Hurley is located in the Ozark Mountains, in the southeastern corner of Missouri. It is situated in the heart of the Ozark National Scenic Riverways, a protected area of rivers, streams, and forests. The town is surrounded by rolling hills and lush forests, and is home to a variety of wildlife. The town is located near the Current and Jacks Fork Rivers, which provide ample opportunities for fishing, swimming, and canoeing.
The town is located in Shannon County, and is bordered by the towns of Eminence, Birch Tree, and Winona. The nearest major city is Springfield, which is located about an hour away.
History
Hurley was founded in 1883 by a group of settlers from Kentucky. The town was named after a local settler, John Hurley, who was a prominent figure in the area. The town quickly grew, and by the early 1900s, it had become a thriving community.
The town was home to a variety of businesses, including a general store, a blacksmith shop, a sawmill, and a gristmill. The town also had a school, a post office, and a church.
In the early 1900s, the town was a popular destination for tourists, who came to enjoy the natural beauty of the area. The town was also home to a variety of outdoor activities, including hunting, fishing, and camping.
Economy
The economy of Hurley is largely based on tourism. The town is home to a variety of outdoor activities, including fishing, hunting, and camping. The town is also home to a variety of restaurants, shops, and other businesses.
The town is also home to a variety of small businesses, including a general store, a blacksmith shop, and a sawmill. The town is also home to a variety of farms, which produce a variety of crops, including corn, soybeans, and hay.
Demographics
As of the 2010 census, the population of Hurley was 514. The town is predominantly white, with a small African American population. The median household income is $30,000, and the median age is 44.
Conclusion
Hurley, Missouri is a small town located in the southeastern corner of the state, in the Ozark Mountains. It is situated in the heart of the Ozark National Scenic Riverways, a protected area of rivers, streams, and forests. The town is home to a population of just over 500 people, and is known for its rural charm and natural beauty. The economy of Hurley is largely based on tourism, and the town is home to a variety of outdoor activities, small businesses, and farms. The town is predominantly white, with a small African American population.
Common Questions
What is Per Capita Income in Hurley?
Per Capita income in Hurley is $25,567.
What is the Median Family Income in Hurley?
Median Family Income in Hurley is $67,083.
What is the Median Household income in Hurley?
Median Household Income in Hurley is $56,250.
What is Income or Wage Gap in Hurley?
Income or Wage Gap in Hurley is 22.2%.
Women in Hurley earn 77.8 cents for every dollar earned by a man.
What is Inequality or Gini Index in Hurley?
Inequality or Gini Index in Hurley is 0.22.
What is the Total Population of Hurley?
Total Population of Hurley is 109.
What is the Total Male Population of Hurley?
Total Male Population of Hurley is 60.
What is the Total Female Population of Hurley?
Total Female Population of Hurley is 49.
What is the Ratio of Males per 100 Females in Hurley?
There are 122.45 Males per 100 Females in Hurley.
What is the Ratio of Females per 100 Males in Hurley?
There are 81.67 Females per 100 Males in Hurley.
What is the Median Population Age in Hurley?
Median Population Age in Hurley is 35.2 Years.
What is the Average Family Size in Hurley
Average Family Size in Hurley is 2.9 People.
What is the Average Household Size in Hurley
Average Household Size in Hurley is 2.5 People.
How Large is the Labor Force in Hurley?
There are 71 People in the Labor Forcein in Hurley.
What is the Percentage of People in the Labor Force in Hurley?
79.8% of People are in the Labor Force in Hurley.