Linn Creek, MO Map & Demographics
Linn Creek Map
Linn Creek Overview
$27,009
PER CAPITA INCOME
$63,646
AVG FAMILY INCOME
$53,750
AVG HOUSEHOLD INCOME
47.2%
WAGE / INCOME GAP [ % ]
52.8¢/ $1
WAGE / INCOME GAP [ $ ]
0.39
INEQUALITY / GINI INDEX
247
TOTAL POPULATION
140
MALE POPULATION
107
FEMALE POPULATION
130.84
MALES / 100 FEMALES
76.43
FEMALES / 100 MALES
48.9
MEDIAN AGE
3.2
AVG FAMILY SIZE
2.1
AVG HOUSEHOLD SIZE
138
LABOR FORCE [ PEOPLE ]
65.4%
PERCENT IN LABOR FORCE
8.0%
UNEMPLOYMENT RATE
Linn Creek Zip Codes
Linn Creek Area Codes
Income in Linn Creek
Income Overview in Linn Creek
Per Capita Income in Linn Creek is $27,009, while median incomes of families and households are $63,646 and $53,750 respectively.
| Characteristic | Number | Measure |
| Per Capita Income | 247 | $27,009 |
| Median Family Income | 53 | $63,646 |
| Mean Family Income | 53 | $58,232 |
| Median Household Income | 116 | $53,750 |
| Mean Household Income | 116 | $52,075 |
| Income Deficit | 53 | $0 |
| Wage / Income Gap (%) | 247 | 47.18% |
| Wage / Income Gap ($) | 247 | 52.82¢ per $1 |
| Gini / Inequality Index | 247 | 0.39 |
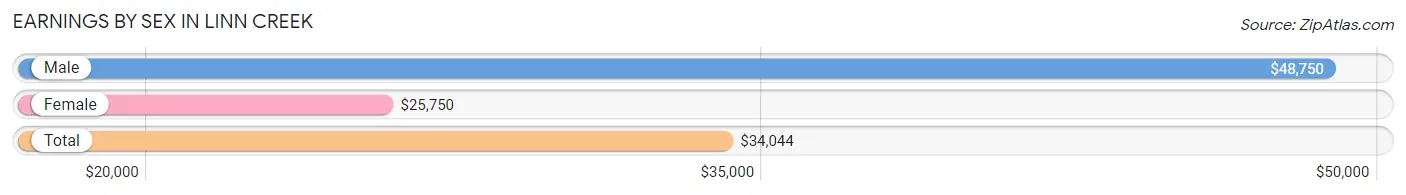
Earnings by Sex in Linn Creek
Average Earnings in Linn Creek are $34,044, $48,750 for men and $25,750 for women, a difference of 47.2%.
| Sex | Number | Average Earnings |
| Male | 74 (54.0%) | $48,750 |
| Female | 63 (46.0%) | $25,750 |
| Total | 137 (100.0%) | $34,044 |
Earnings by Sex by Income Bracket in Linn Creek
The most common earnings brackets in Linn Creek are $30,000 to $34,999 for men (23 | 31.1%) and $5,000 to $7,499 for women (18 | 28.6%).
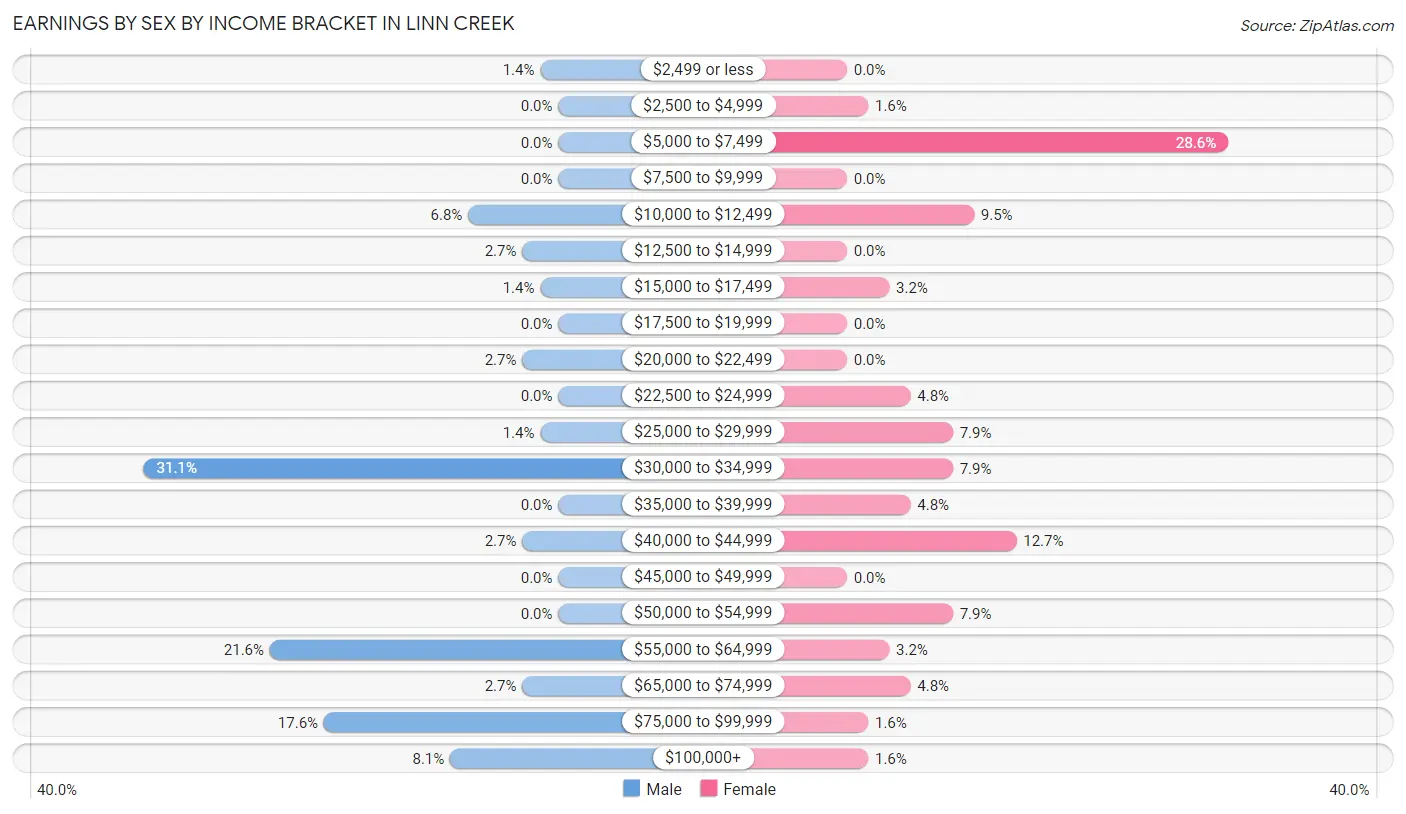
| Income | Male | Female |
| $2,499 or less | 1 (1.3%) | 0 (0.0%) |
| $2,500 to $4,999 | 0 (0.0%) | 1 (1.6%) |
| $5,000 to $7,499 | 0 (0.0%) | 18 (28.6%) |
| $7,500 to $9,999 | 0 (0.0%) | 0 (0.0%) |
| $10,000 to $12,499 | 5 (6.8%) | 6 (9.5%) |
| $12,500 to $14,999 | 2 (2.7%) | 0 (0.0%) |
| $15,000 to $17,499 | 1 (1.3%) | 2 (3.2%) |
| $17,500 to $19,999 | 0 (0.0%) | 0 (0.0%) |
| $20,000 to $22,499 | 2 (2.7%) | 0 (0.0%) |
| $22,500 to $24,999 | 0 (0.0%) | 3 (4.8%) |
| $25,000 to $29,999 | 1 (1.3%) | 5 (7.9%) |
| $30,000 to $34,999 | 23 (31.1%) | 5 (7.9%) |
| $35,000 to $39,999 | 0 (0.0%) | 3 (4.8%) |
| $40,000 to $44,999 | 2 (2.7%) | 8 (12.7%) |
| $45,000 to $49,999 | 0 (0.0%) | 0 (0.0%) |
| $50,000 to $54,999 | 0 (0.0%) | 5 (7.9%) |
| $55,000 to $64,999 | 16 (21.6%) | 2 (3.2%) |
| $65,000 to $74,999 | 2 (2.7%) | 3 (4.8%) |
| $75,000 to $99,999 | 13 (17.6%) | 1 (1.6%) |
| $100,000+ | 6 (8.1%) | 1 (1.6%) |
| Total | 74 (100.0%) | 63 (100.0%) |
Earnings by Sex by Educational Attainment in Linn Creek
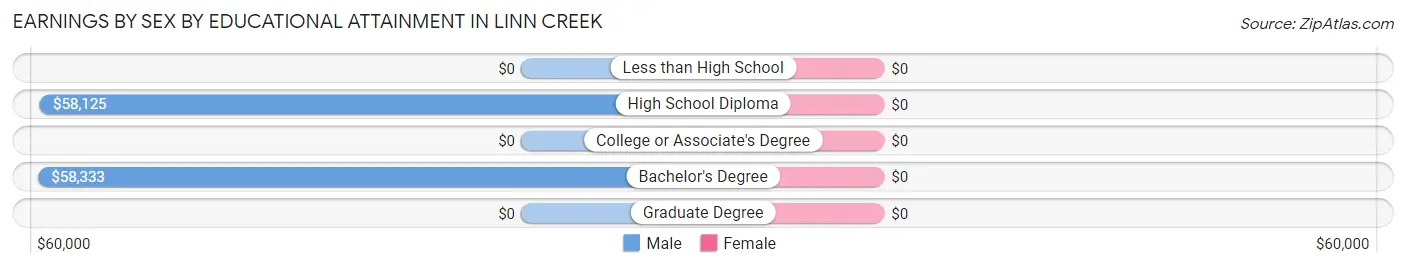
| Educational Attainment | Male Income | Female Income |
| Less than High School | - | - |
| High School Diploma | $58,125 | $0 |
| College or Associate's Degree | - | - |
| Bachelor's Degree | $58,333 | $0 |
| Graduate Degree | - | - |
| Total | $48,750 | $25,750 |
Family Income in Linn Creek
Family Income Brackets in Linn Creek
According to the Linn Creek family income data, there are 23 families falling into the $50,000 to $74,999 income range, which is the most common income bracket and makes up 43.4% of all families.
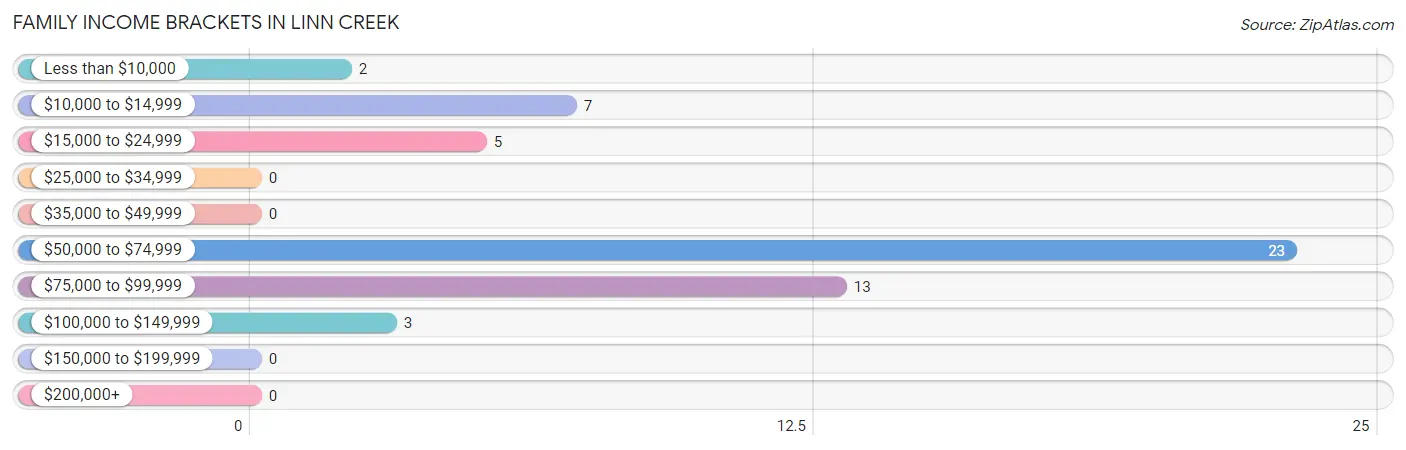
| Income Bracket | # Families | % Families |
| Less than $10,000 | 2 | 3.8% |
| $10,000 to $14,999 | 7 | 13.2% |
| $15,000 to $24,999 | 5 | 9.4% |
| $25,000 to $34,999 | 0 | 0.0% |
| $35,000 to $49,999 | 0 | 0.0% |
| $50,000 to $74,999 | 23 | 43.4% |
| $75,000 to $99,999 | 13 | 24.5% |
| $100,000 to $149,999 | 3 | 5.7% |
| $150,000 to $199,999 | 0 | 0.0% |
| $200,000+ | 0 | 0.0% |
Family Income by Famaliy Size in Linn Creek
3-person families (19 | 35.8%) account for the highest median family income in Linn Creek with $64,821 per family, while 2-person families (29 | 54.7%) have the highest median income of $28,625 per family member.
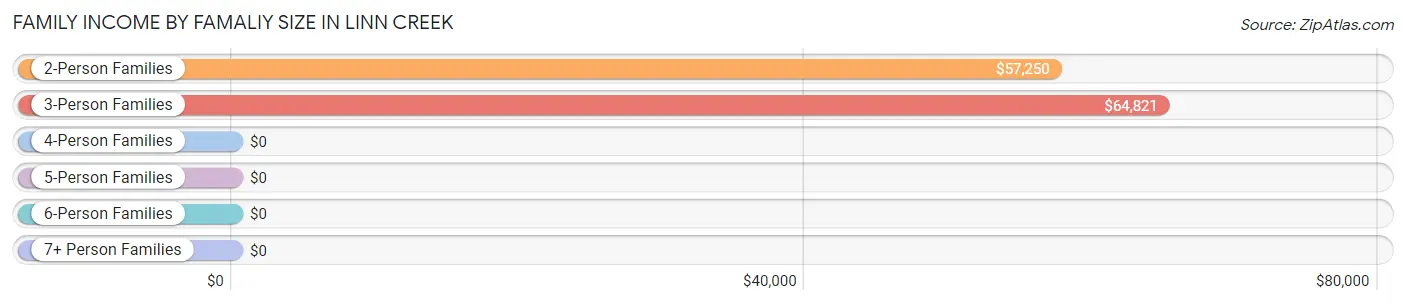
| Income Bracket | # Families | Median Income |
| 2-Person Families | 29 (54.7%) | $57,250 |
| 3-Person Families | 19 (35.8%) | $64,821 |
| 4-Person Families | 3 (5.7%) | $0 |
| 5-Person Families | 2 (3.8%) | $0 |
| 6-Person Families | 0 (0.0%) | $0 |
| 7+ Person Families | 0 (0.0%) | $0 |
| Total | 53 (100.0%) | $63,646 |
Family Income by Number of Earners in Linn Creek
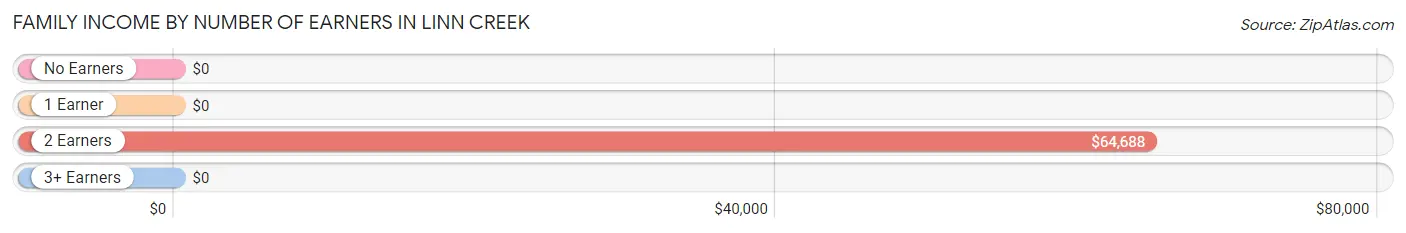
| Number of Earners | # Families | Median Income |
| No Earners | 7 (13.2%) | $0 |
| 1 Earner | 17 (32.1%) | $0 |
| 2 Earners | 29 (54.7%) | $64,688 |
| 3+ Earners | 0 (0.0%) | $0 |
| Total | 53 (100.0%) | $63,646 |
Household Income in Linn Creek
Household Income Brackets in Linn Creek
With 27 households falling in the category, the $50,000 to $74,999 income range is the most frequent in Linn Creek, accounting for 23.3% of all households.
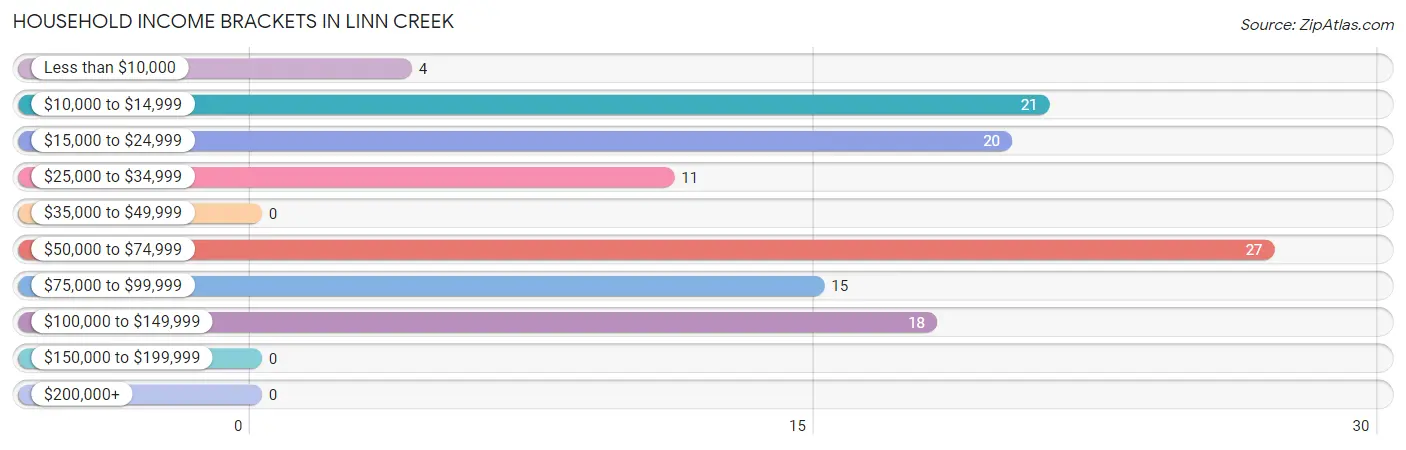
| Income Bracket | # Households | % Households |
| Less than $10,000 | 4 | 3.4% |
| $10,000 to $14,999 | 21 | 18.1% |
| $15,000 to $24,999 | 20 | 17.2% |
| $25,000 to $34,999 | 11 | 9.5% |
| $35,000 to $49,999 | 0 | 0.0% |
| $50,000 to $74,999 | 27 | 23.3% |
| $75,000 to $99,999 | 15 | 12.9% |
| $100,000 to $149,999 | 18 | 15.5% |
| $150,000 to $199,999 | 0 | 0.0% |
| $200,000+ | 0 | 0.0% |
Household Income by Householder Age in Linn Creek
The median household income in Linn Creek is $53,750, with the highest median household income of $64,688 found in the 25 to 44 years age bracket for the primary householder. A total of 47 households (40.5%) fall into this category.
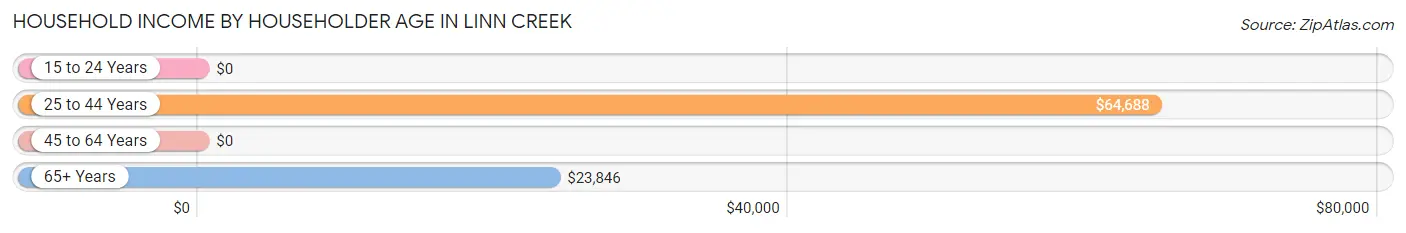
| Income Bracket | # Households | Median Income |
| 15 to 24 Years | 0 (0.0%) | $0 |
| 25 to 44 Years | 47 (40.5%) | $64,688 |
| 45 to 64 Years | 37 (31.9%) | $0 |
| 65+ Years | 32 (27.6%) | $23,846 |
| Total | 116 (100.0%) | $53,750 |
Poverty in Linn Creek
Income Below Poverty by Sex and Age in Linn Creek
With 30.7% poverty level for males and 28.0% for females among the residents of Linn Creek, under 5 year old males and 6 to 11 year old females are the most vulnerable to poverty, with 6 males (75.0%) and 4 females (100.0%) in their respective age groups living below the poverty level.
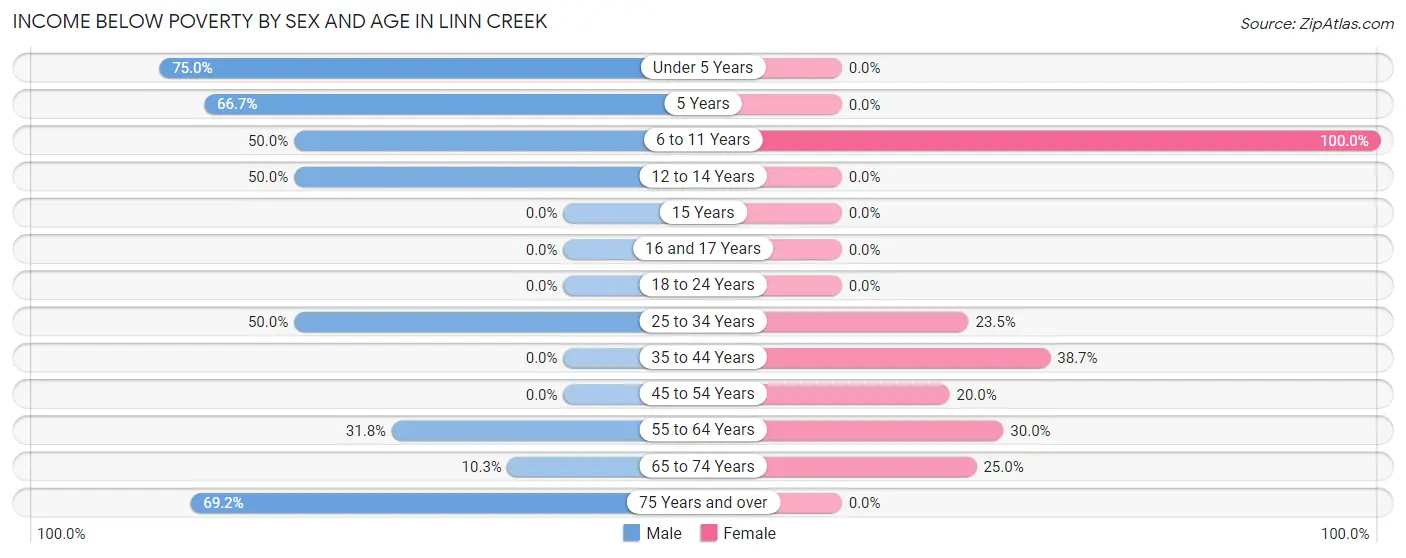
| Age Bracket | Male | Female |
| Under 5 Years | 6 (75.0%) | 0 (0.0%) |
| 5 Years | 2 (66.7%) | 0 (0.0%) |
| 6 to 11 Years | 2 (50.0%) | 4 (100.0%) |
| 12 to 14 Years | 3 (50.0%) | 0 (0.0%) |
| 15 Years | 0 (0.0%) | 0 (0.0%) |
| 16 and 17 Years | 0 (0.0%) | 0 (0.0%) |
| 18 to 24 Years | 0 (0.0%) | 0 (0.0%) |
| 25 to 34 Years | 2 (50.0%) | 4 (23.5%) |
| 35 to 44 Years | 0 (0.0%) | 12 (38.7%) |
| 45 to 54 Years | 0 (0.0%) | 2 (20.0%) |
| 55 to 64 Years | 7 (31.8%) | 6 (30.0%) |
| 65 to 74 Years | 3 (10.3%) | 2 (25.0%) |
| 75 Years and over | 18 (69.2%) | 0 (0.0%) |
| Total | 43 (30.7%) | 30 (28.0%) |
Income Above Poverty by Sex and Age in Linn Creek
According to the poverty statistics in Linn Creek, males aged 18 to 24 years and females aged under 5 years are the age groups that are most secure financially, with 100.0% of males and 100.0% of females in these age groups living above the poverty line.
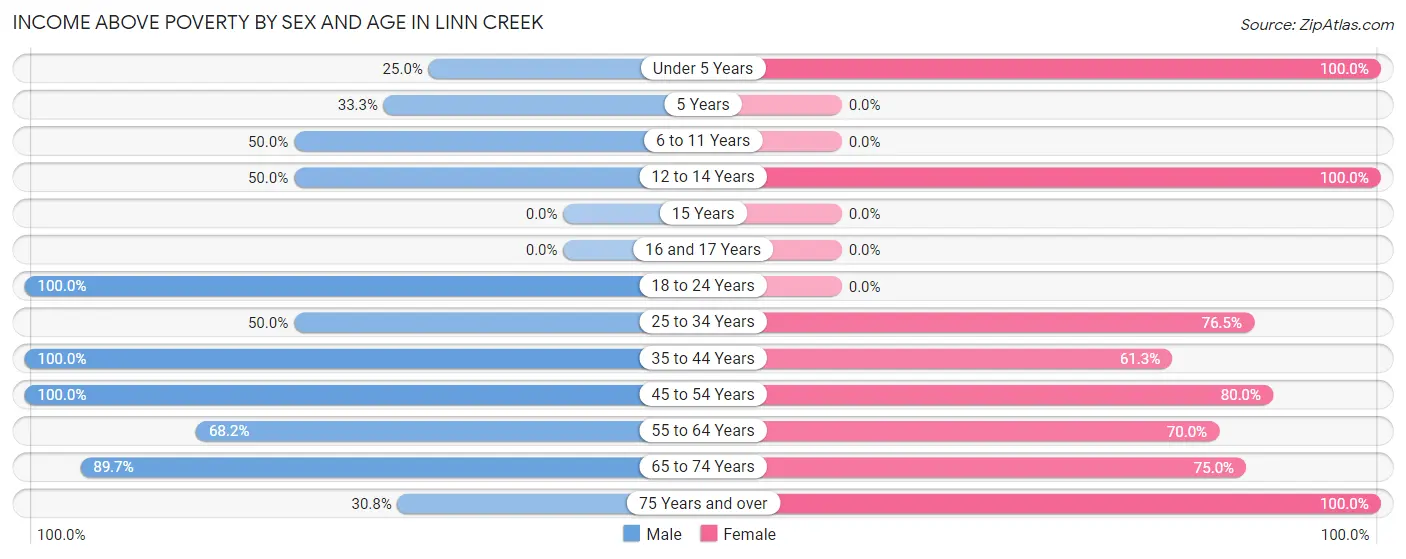
| Age Bracket | Male | Female |
| Under 5 Years | 2 (25.0%) | 8 (100.0%) |
| 5 Years | 1 (33.3%) | 0 (0.0%) |
| 6 to 11 Years | 2 (50.0%) | 0 (0.0%) |
| 12 to 14 Years | 3 (50.0%) | 3 (100.0%) |
| 15 Years | 0 (0.0%) | 0 (0.0%) |
| 16 and 17 Years | 0 (0.0%) | 0 (0.0%) |
| 18 to 24 Years | 3 (100.0%) | 0 (0.0%) |
| 25 to 34 Years | 2 (50.0%) | 13 (76.5%) |
| 35 to 44 Years | 26 (100.0%) | 19 (61.3%) |
| 45 to 54 Years | 9 (100.0%) | 8 (80.0%) |
| 55 to 64 Years | 15 (68.2%) | 14 (70.0%) |
| 65 to 74 Years | 26 (89.7%) | 6 (75.0%) |
| 75 Years and over | 8 (30.8%) | 6 (100.0%) |
| Total | 97 (69.3%) | 77 (72.0%) |
Income Below Poverty Among Married-Couple Families in Linn Creek
The poverty statistics for married-couple families in Linn Creek show that 12.8% or 5 of the total 39 families live below the poverty line. Families with 1 or 2 children have the highest poverty rate of 15.4%, comprising of 2 families. On the other hand, families with 3 or 4 children have the lowest poverty rate of 0.0%, which includes 0 families.
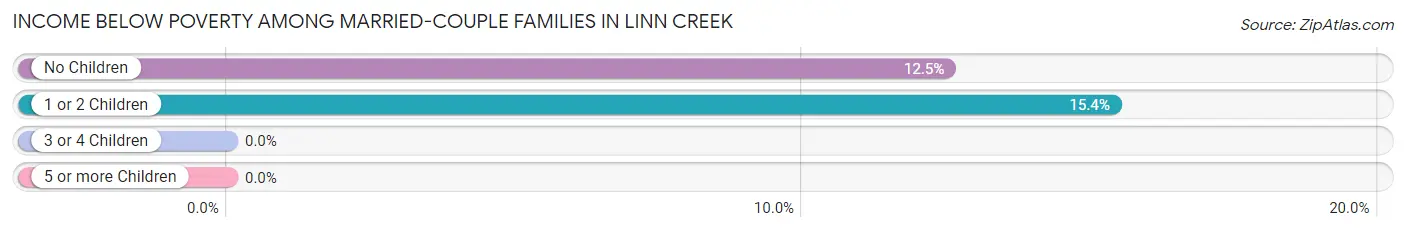
| Children | Above Poverty | Below Poverty |
| No Children | 21 (87.5%) | 3 (12.5%) |
| 1 or 2 Children | 11 (84.6%) | 2 (15.4%) |
| 3 or 4 Children | 2 (100.0%) | 0 (0.0%) |
| 5 or more Children | 0 (0.0%) | 0 (0.0%) |
| Total | 34 (87.2%) | 5 (12.8%) |
Income Below Poverty Among Single-Parent Households in Linn Creek
According to the poverty data in Linn Creek, 20.0% or 1 single-father households and 88.9% or 8 single-mother households are living below the poverty line. Among single-father households, those with 3 or 4 children have the highest poverty rate, with 1 households (100.0%) experiencing poverty. Likewise, among single-mother households, those with 1 or 2 children have the highest poverty rate, with 8 households (100.0%) falling below the poverty line.
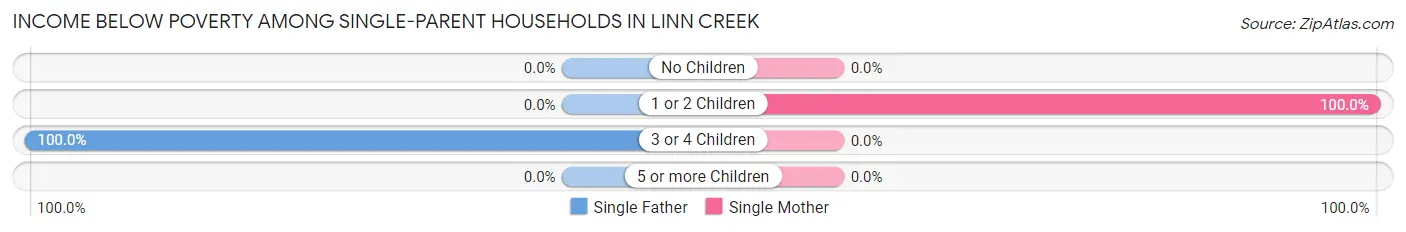
| Children | Single Father | Single Mother |
| No Children | 0 (0.0%) | 0 (0.0%) |
| 1 or 2 Children | 0 (0.0%) | 8 (100.0%) |
| 3 or 4 Children | 1 (100.0%) | 0 (0.0%) |
| 5 or more Children | 0 (0.0%) | 0 (0.0%) |
| Total | 1 (20.0%) | 8 (88.9%) |
Income Below Poverty Among Married-Couple vs Single-Parent Households in Linn Creek
The poverty data for Linn Creek shows that 5 of the married-couple family households (12.8%) and 9 of the single-parent households (64.3%) are living below the poverty level. Within the married-couple family households, those with 1 or 2 children have the highest poverty rate, with 2 households (15.4%) falling below the poverty line. Among the single-parent households, those with 1 or 2 children have the highest poverty rate, with 8 household (100.0%) living below poverty.
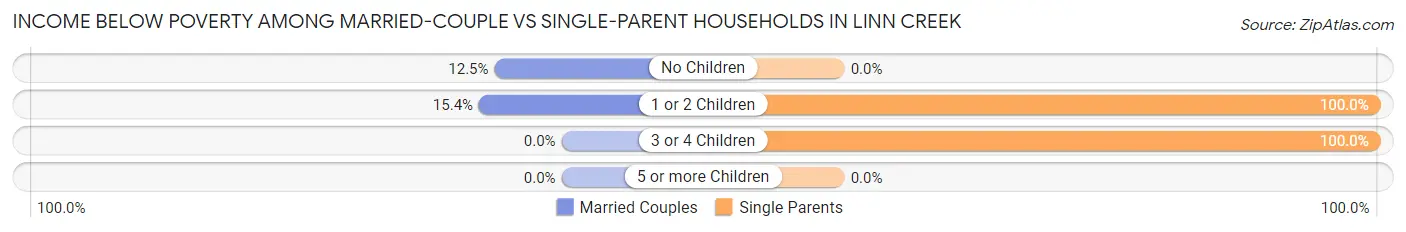
| Children | Married-Couple Families | Single-Parent Households |
| No Children | 3 (12.5%) | 0 (0.0%) |
| 1 or 2 Children | 2 (15.4%) | 8 (100.0%) |
| 3 or 4 Children | 0 (0.0%) | 1 (100.0%) |
| 5 or more Children | 0 (0.0%) | 0 (0.0%) |
| Total | 5 (12.8%) | 9 (64.3%) |
Race in Linn Creek
The most populous races in Linn Creek are White / Caucasian (234 | 94.7%), Two or more Races (11 | 4.4%), and Asian (2 | 0.8%).
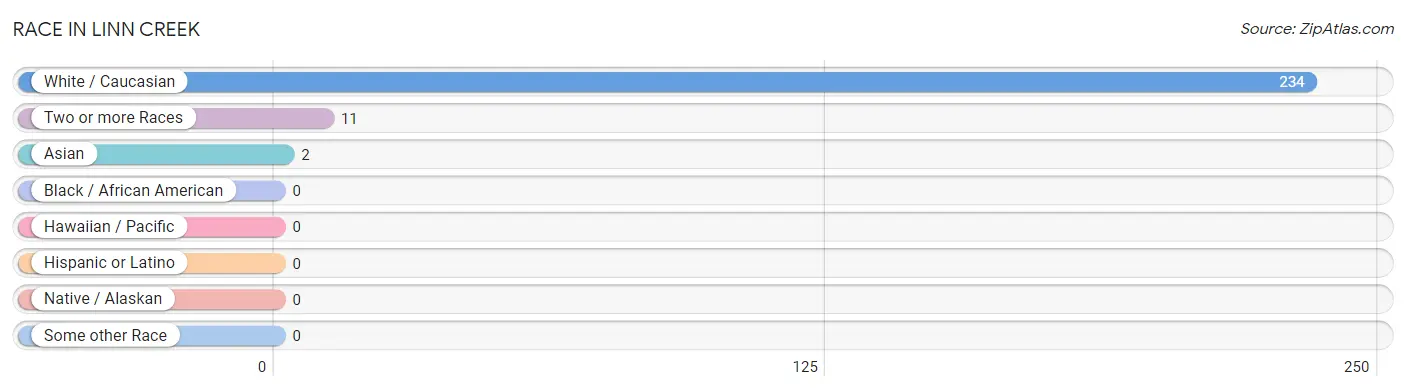
| Race | # Population | % Population |
| Asian | 2 | 0.8% |
| Black / African American | 0 | 0.0% |
| Hawaiian / Pacific | 0 | 0.0% |
| Hispanic or Latino | 0 | 0.0% |
| Native / Alaskan | 0 | 0.0% |
| White / Caucasian | 234 | 94.7% |
| Two or more Races | 11 | 4.4% |
| Some other Race | 0 | 0.0% |
| Total | 247 | 100.0% |
Ancestry in Linn Creek
The most populous ancestries reported in Linn Creek are German (84 | 34.0%), English (35 | 14.2%), American (34 | 13.8%), Irish (15 | 6.1%), and Polish (12 | 4.9%), together accounting for 72.9% of all Linn Creek residents.
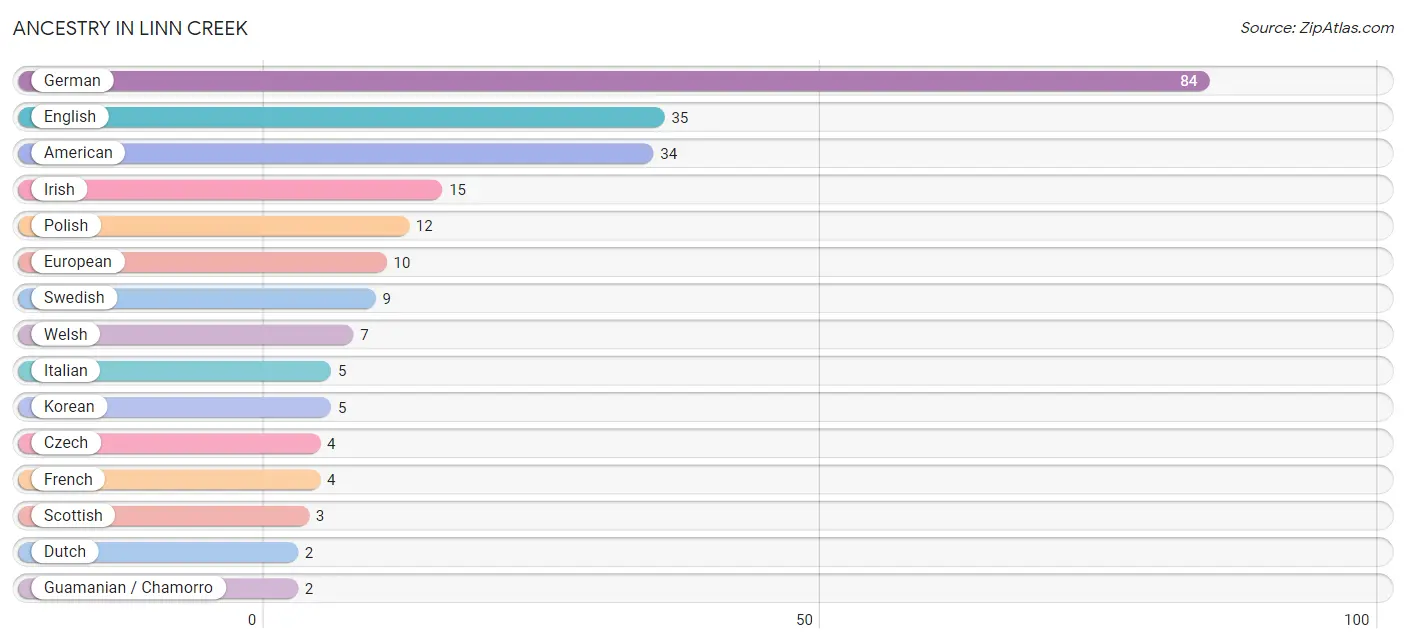
| Ancestry | # Population | % Population |
| American | 34 | 13.8% |
| British | 1 | 0.4% |
| Czech | 4 | 1.6% |
| Dutch | 2 | 0.8% |
| English | 35 | 14.2% |
| European | 10 | 4.1% |
| French | 4 | 1.6% |
| French Canadian | 1 | 0.4% |
| German | 84 | 34.0% |
| Guamanian / Chamorro | 2 | 0.8% |
| Irish | 15 | 6.1% |
| Italian | 5 | 2.0% |
| Korean | 5 | 2.0% |
| Polish | 12 | 4.9% |
| Scottish | 3 | 1.2% |
| Swedish | 9 | 3.6% |
| Thai | 2 | 0.8% |
| Welsh | 7 | 2.8% | View All 18 Rows |
Immigrants in Linn Creek
The most numerous immigrant groups reported in Linn Creek came from Asia (2 | 0.8%), India (2 | 0.8%), and South Central Asia (2 | 0.8%), together accounting for 2.4% of all Linn Creek residents.
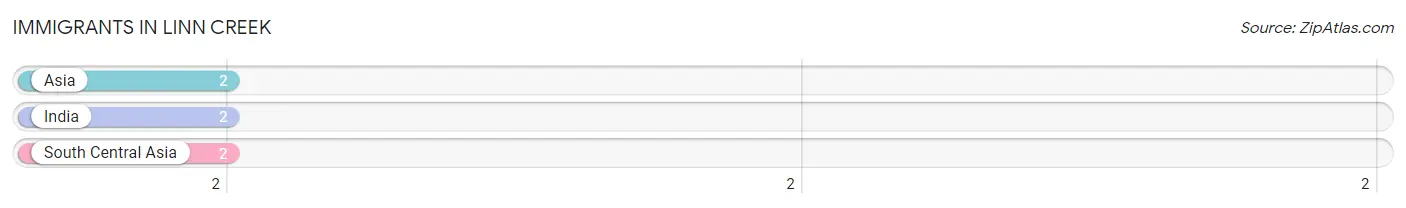
| Immigration Origin | # Population | % Population |
| Asia | 2 | 0.8% |
| India | 2 | 0.8% |
| South Central Asia | 2 | 0.8% | View All 3 Rows |
Sex and Age in Linn Creek
Sex and Age in Linn Creek
The most populous age groups in Linn Creek are 65 to 69 Years (24 | 17.1%) for men and 40 to 44 Years (20 | 18.7%) for women.
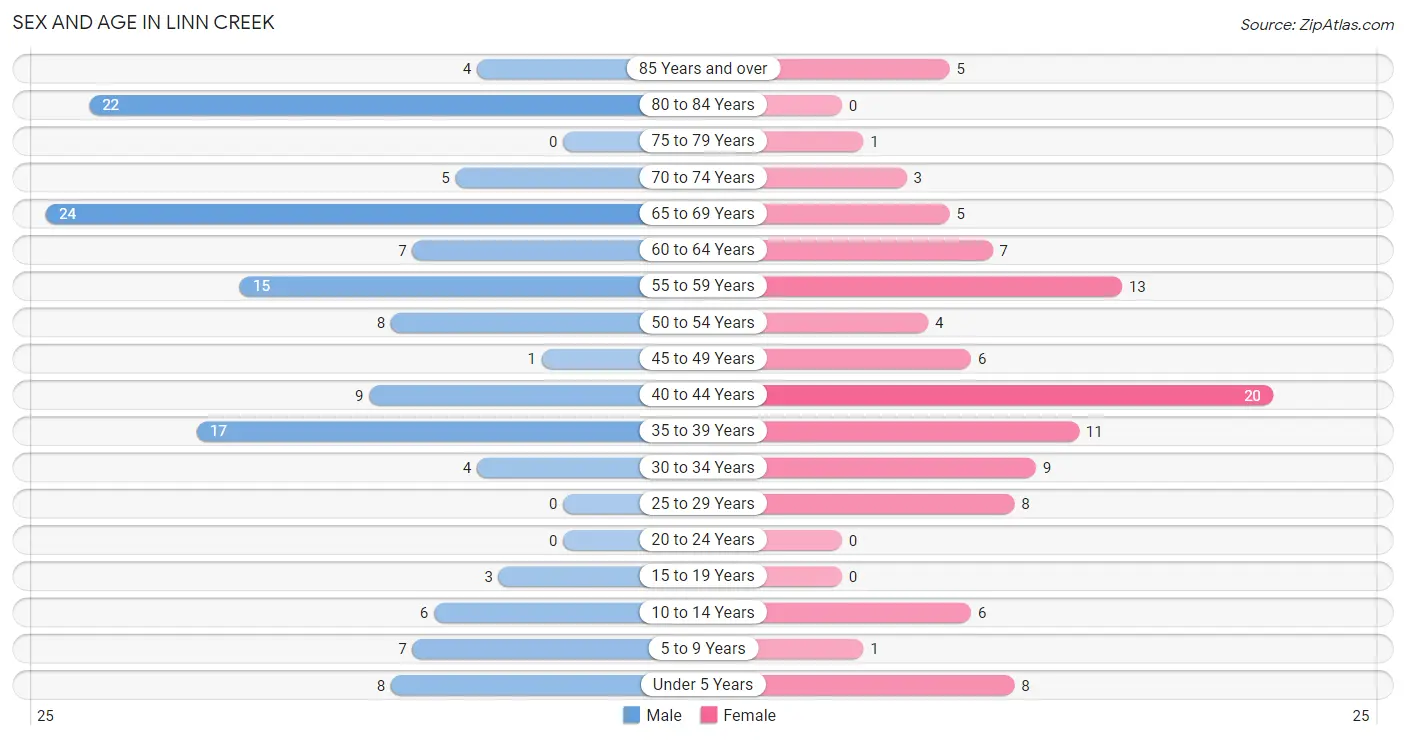
| Age Bracket | Male | Female |
| Under 5 Years | 8 (5.7%) | 8 (7.5%) |
| 5 to 9 Years | 7 (5.0%) | 1 (0.9%) |
| 10 to 14 Years | 6 (4.3%) | 6 (5.6%) |
| 15 to 19 Years | 3 (2.1%) | 0 (0.0%) |
| 20 to 24 Years | 0 (0.0%) | 0 (0.0%) |
| 25 to 29 Years | 0 (0.0%) | 8 (7.5%) |
| 30 to 34 Years | 4 (2.9%) | 9 (8.4%) |
| 35 to 39 Years | 17 (12.1%) | 11 (10.3%) |
| 40 to 44 Years | 9 (6.4%) | 20 (18.7%) |
| 45 to 49 Years | 1 (0.7%) | 6 (5.6%) |
| 50 to 54 Years | 8 (5.7%) | 4 (3.7%) |
| 55 to 59 Years | 15 (10.7%) | 13 (12.1%) |
| 60 to 64 Years | 7 (5.0%) | 7 (6.5%) |
| 65 to 69 Years | 24 (17.1%) | 5 (4.7%) |
| 70 to 74 Years | 5 (3.6%) | 3 (2.8%) |
| 75 to 79 Years | 0 (0.0%) | 1 (0.9%) |
| 80 to 84 Years | 22 (15.7%) | 0 (0.0%) |
| 85 Years and over | 4 (2.9%) | 5 (4.7%) |
| Total | 140 (100.0%) | 107 (100.0%) |
Families and Households in Linn Creek
Median Family Size in Linn Creek
The median family size in Linn Creek is 3.17 persons per family, with single male/father families (5 | 9.4%) accounting for the largest median family size of 5.2 persons per family. On the other hand, single female/mother families (9 | 17.0%) represent the smallest median family size with 2.56 persons per family.
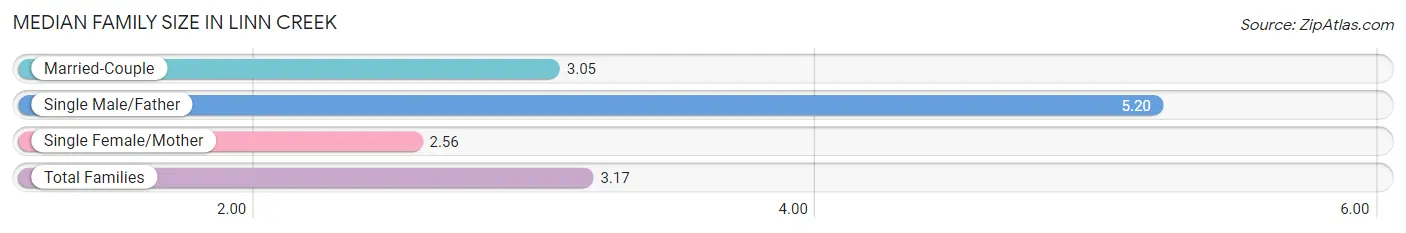
| Family Type | # Families | Family Size |
| Married-Couple | 39 (73.6%) | 3.05 |
| Single Male/Father | 5 (9.4%) | 5.20 |
| Single Female/Mother | 9 (17.0%) | 2.56 |
| Total Families | 53 (100.0%) | 3.17 |
Median Household Size in Linn Creek
The median household size in Linn Creek is 2.13 persons per household, with single male/father households (5 | 4.3%) accounting for the largest median household size of 5.2 persons per household. non-family households (63 | 54.3%) represent the smallest median household size with 1.22 persons per household.
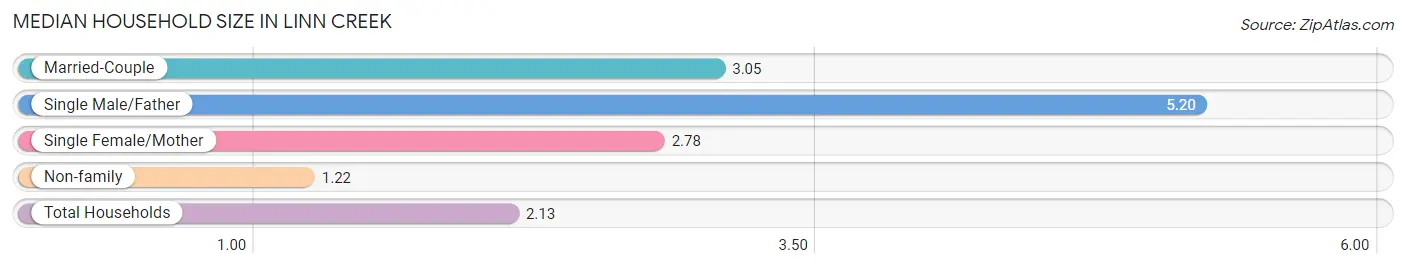
| Household Type | # Households | Household Size |
| Married-Couple | 39 (33.6%) | 3.05 |
| Single Male/Father | 5 (4.3%) | 5.20 |
| Single Female/Mother | 9 (7.8%) | 2.78 |
| Non-family | 63 (54.3%) | 1.22 |
| Total Households | 116 (100.0%) | 2.13 |
Household Size by Marriage Status in Linn Creek
Out of a total of 116 households in Linn Creek, 53 (45.7%) are family households, while 63 (54.3%) are nonfamily households. The most numerous type of family households are 2-person households, comprising 27, and the most common type of nonfamily households are 1-person households, comprising 42.
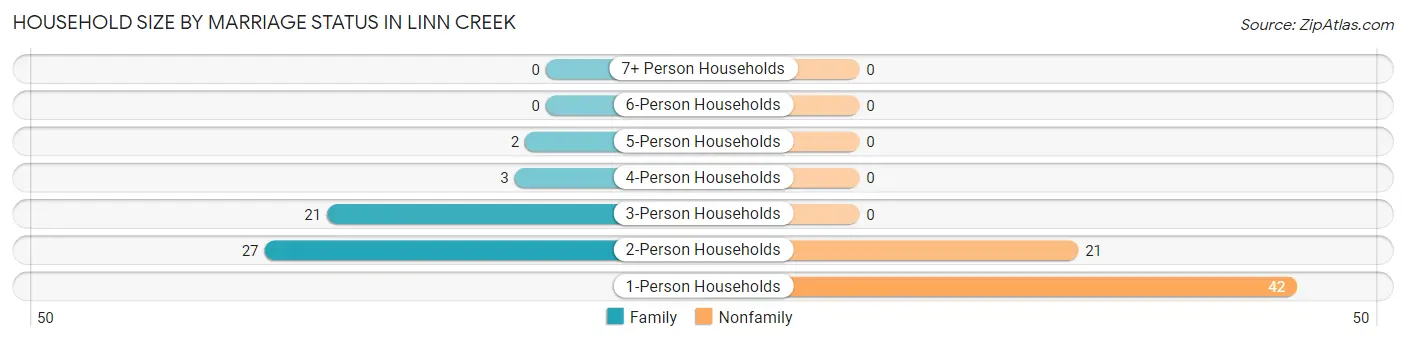
| Household Size | Family Households | Nonfamily Households |
| 1-Person Households | - | 42 (36.2%) |
| 2-Person Households | 27 (23.3%) | 21 (18.1%) |
| 3-Person Households | 21 (18.1%) | 0 (0.0%) |
| 4-Person Households | 3 (2.6%) | 0 (0.0%) |
| 5-Person Households | 2 (1.7%) | 0 (0.0%) |
| 6-Person Households | 0 (0.0%) | 0 (0.0%) |
| 7+ Person Households | 0 (0.0%) | 0 (0.0%) |
| Total | 53 (45.7%) | 63 (54.3%) |
Female Fertility in Linn Creek
Fertility by Age in Linn Creek
| Age Bracket | Women with Births | Births / 1,000 Women |
| 15 to 19 years | 0 (0.0%) | 0.0 |
| 20 to 34 years | 0 (0.0%) | 0.0 |
| 35 to 50 years | 0 (0.0%) | 0.0 |
| Total | 0 (0.0%) | 0.0 |
Fertility by Age by Marriage Status in Linn Creek
| Age Bracket | Married | Unmarried |
| 15 to 19 years | 0 (0.0%) | 0 (0.0%) |
| 20 to 34 years | 0 (0.0%) | 0 (0.0%) |
| 35 to 50 years | 0 (0.0%) | 0 (0.0%) |
| Total | 0 (0.0%) | 0 (0.0%) |
Fertility by Education in Linn Creek
| Educational Attainment | Women with Births | Births / 1,000 Women |
| Less than High School | 0 (0.0%) | 0.0 |
| High School Diploma | 0 (0.0%) | 0.0 |
| College or Associate's Degree | 0 (0.0%) | 0.0 |
| Bachelor's Degree | 0 (0.0%) | 0.0 |
| Graduate Degree | 0 (0.0%) | 0.0 |
| Total | 0 (0.0%) | 0.0 |
Fertility by Education by Marriage Status in Linn Creek
| Educational Attainment | Married | Unmarried |
| Less than High School | 0 (0.0%) | 0 (0.0%) |
| High School Diploma | 0 (0.0%) | 0 (0.0%) |
| College or Associate's Degree | 0 (0.0%) | 0 (0.0%) |
| Bachelor's Degree | 0 (0.0%) | 0 (0.0%) |
| Graduate Degree | 0 (0.0%) | 0 (0.0%) |
| Total | 0 (0.0%) | 0 (0.0%) |
Employment Characteristics in Linn Creek
Employment by Class of Employer in Linn Creek
Among the 127 employed individuals in Linn Creek, private company employees (92 | 72.4%), not-for-profit organizations (15 | 11.8%), and local government employees (8 | 6.3%) make up the most common classes of employment.
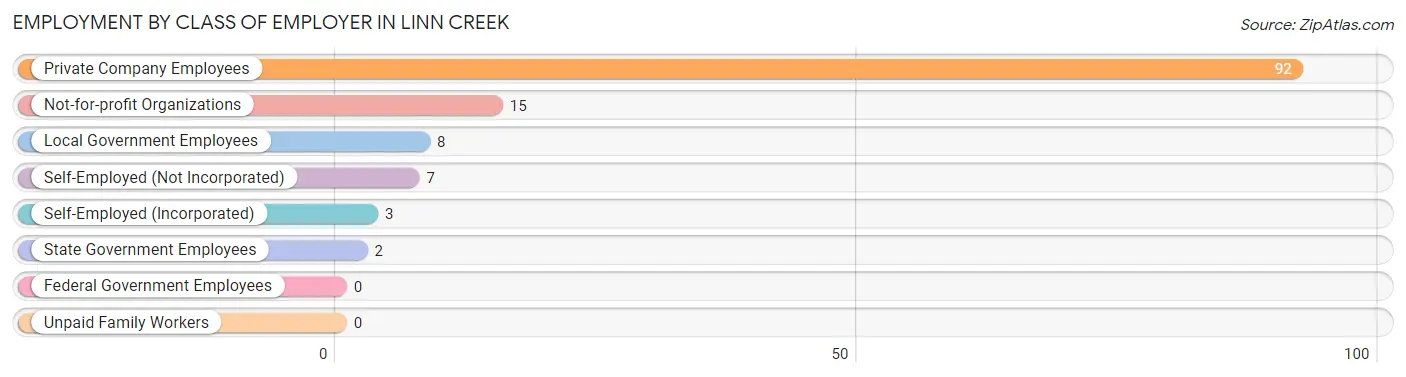
| Employer Class | # Employees | % Employees |
| Private Company Employees | 92 | 72.4% |
| Self-Employed (Incorporated) | 3 | 2.4% |
| Self-Employed (Not Incorporated) | 7 | 5.5% |
| Not-for-profit Organizations | 15 | 11.8% |
| Local Government Employees | 8 | 6.3% |
| State Government Employees | 2 | 1.6% |
| Federal Government Employees | 0 | 0.0% |
| Unpaid Family Workers | 0 | 0.0% |
| Total | 127 | 100.0% |
Employment Status by Age in Linn Creek
According to the labor force statistics for Linn Creek, out of the total population over 16 years of age (211), 65.4% or 138 individuals are in the labor force, with 8.0% or 11 of them unemployed. The age group with the highest labor force participation rate is 30 to 34 years, with 100.0% or 13 individuals in the labor force. Within the labor force, the 55 to 59 years age range has the highest percentage of unemployed individuals, with 26.1% or 6 of them being unemployed.
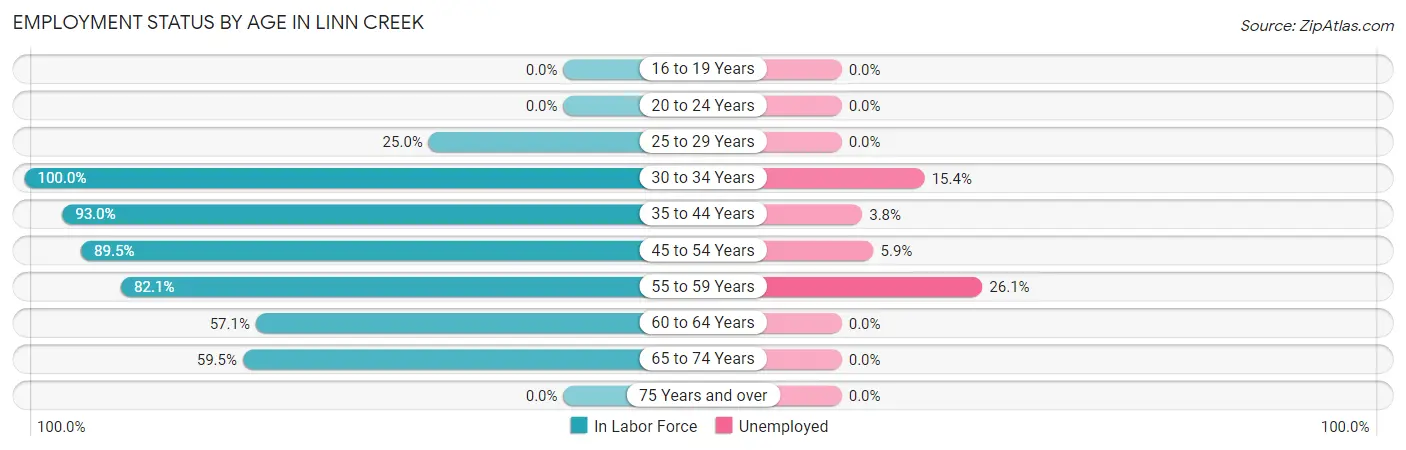
| Age Bracket | In Labor Force | Unemployed |
| 16 to 19 Years | 0 (0.0%) | 0 (0.0%) |
| 20 to 24 Years | 0 (0.0%) | 0 (0.0%) |
| 25 to 29 Years | 2 (25.0%) | 0 (0.0%) |
| 30 to 34 Years | 13 (100.0%) | 2 (15.4%) |
| 35 to 44 Years | 53 (93.0%) | 2 (3.8%) |
| 45 to 54 Years | 17 (89.5%) | 1 (5.9%) |
| 55 to 59 Years | 23 (82.1%) | 6 (26.1%) |
| 60 to 64 Years | 8 (57.1%) | 0 (0.0%) |
| 65 to 74 Years | 22 (59.5%) | 0 (0.0%) |
| 75 Years and over | 0 (0.0%) | 0 (0.0%) |
| Total | 138 (65.4%) | 11 (8.0%) |
Employment Status by Educational Attainment in Linn Creek
According to labor force statistics for Linn Creek, 83.5% of individuals (116) out of the total population between 25 and 64 years of age (139) are in the labor force, with 9.5% or 11 of them being unemployed. The group with the highest labor force participation rate are those with the educational attainment of high school diploma, with 94.6% or 35 individuals in the labor force. Within the labor force, individuals with less than high school education have the highest percentage of unemployment, with 23.1% or 6 of them being unemployed.
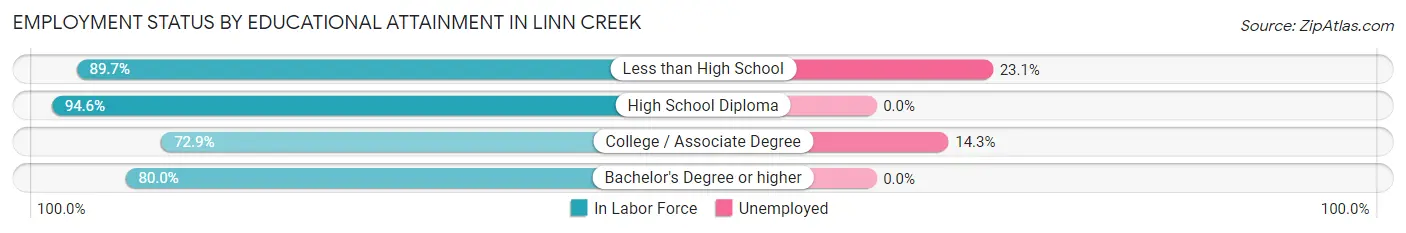
| Educational Attainment | In Labor Force | Unemployed |
| Less than High School | 26 (89.7%) | 7 (23.1%) |
| High School Diploma | 35 (94.6%) | 0 (0.0%) |
| College / Associate Degree | 35 (72.9%) | 7 (14.3%) |
| Bachelor's Degree or higher | 20 (80.0%) | 0 (0.0%) |
| Total | 116 (83.5%) | 13 (9.5%) |
Employment Occupations by Sex in Linn Creek
Management, Business, Science and Arts Occupations
The most common Management, Business, Science and Arts occupations in Linn Creek are Management (10 | 7.9%), Business & Financial (7 | 5.5%), Community & Social Service (7 | 5.5%), Computers, Engineering & Science (6 | 4.7%), and Computers & Mathematics (6 | 4.7%).
Management, Business, Science and Arts Occupations by Sex
Within the Management, Business, Science and Arts occupations in Linn Creek, the most male-oriented occupations are Education, Arts & Media (100.0%), Health Diagnosing & Treating (100.0%), and Health Technologists (100.0%), while the most female-oriented occupations are Business & Financial (100.0%), Education Instruction & Library (100.0%), and Computers, Engineering & Science (83.3%).
| Occupation | Male | Female |
| Management | 2 (20.0%) | 8 (80.0%) |
| Business & Financial | 0 (0.0%) | 7 (100.0%) |
| Computers, Engineering & Science | 1 (16.7%) | 5 (83.3%) |
| Computers & Mathematics | 1 (16.7%) | 5 (83.3%) |
| Architecture & Engineering | 0 (0.0%) | 0 (0.0%) |
| Life, Physical & Social Science | 0 (0.0%) | 0 (0.0%) |
| Community & Social Service | 5 (71.4%) | 2 (28.6%) |
| Education, Arts & Media | 5 (100.0%) | 0 (0.0%) |
| Legal Services & Support | 0 (0.0%) | 0 (0.0%) |
| Education Instruction & Library | 0 (0.0%) | 2 (100.0%) |
| Arts, Media & Entertainment | 0 (0.0%) | 0 (0.0%) |
| Health Diagnosing & Treating | 2 (100.0%) | 0 (0.0%) |
| Health Technologists | 2 (100.0%) | 0 (0.0%) |
| Total (Category) | 10 (31.2%) | 22 (68.8%) |
| Total (Overall) | 64 (50.4%) | 63 (49.6%) |
Services Occupations
The most common Services occupations in Linn Creek are Food Preparation & Serving (26 | 20.5%), Healthcare Support (4 | 3.2%), Personal Care & Service (4 | 3.2%), Security & Protection (2 | 1.6%), and Law Enforcement (2 | 1.6%).
Services Occupations by Sex
Within the Services occupations in Linn Creek, the most male-oriented occupations are Security & Protection (100.0%), Law Enforcement (100.0%), and Food Preparation & Serving (73.1%), while the most female-oriented occupations are Healthcare Support (100.0%), Personal Care & Service (100.0%), and Food Preparation & Serving (26.9%).
| Occupation | Male | Female |
| Healthcare Support | 0 (0.0%) | 4 (100.0%) |
| Security & Protection | 2 (100.0%) | 0 (0.0%) |
| Firefighting & Prevention | 0 (0.0%) | 0 (0.0%) |
| Law Enforcement | 2 (100.0%) | 0 (0.0%) |
| Food Preparation & Serving | 19 (73.1%) | 7 (26.9%) |
| Cleaning & Maintenance | 0 (0.0%) | 0 (0.0%) |
| Personal Care & Service | 0 (0.0%) | 4 (100.0%) |
| Total (Category) | 21 (58.3%) | 15 (41.7%) |
| Total (Overall) | 64 (50.4%) | 63 (49.6%) |
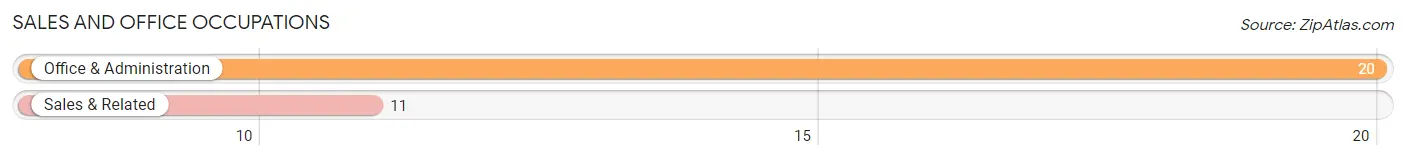
Sales and Office Occupations
The most common Sales and Office occupations in Linn Creek are Office & Administration (20 | 15.8%), and Sales & Related (11 | 8.7%).
Sales and Office Occupations by Sex
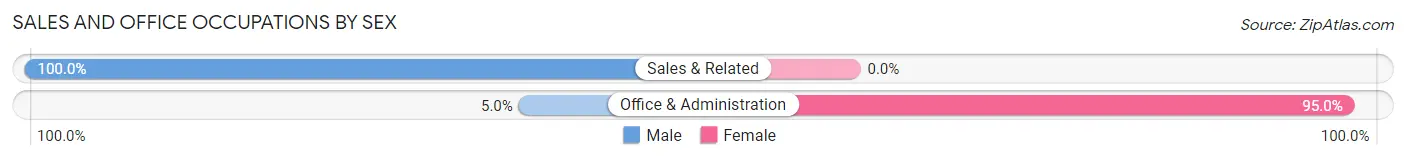
| Occupation | Male | Female |
| Sales & Related | 11 (100.0%) | 0 (0.0%) |
| Office & Administration | 1 (5.0%) | 19 (95.0%) |
| Total (Category) | 12 (38.7%) | 19 (61.3%) |
| Total (Overall) | 64 (50.4%) | 63 (49.6%) |
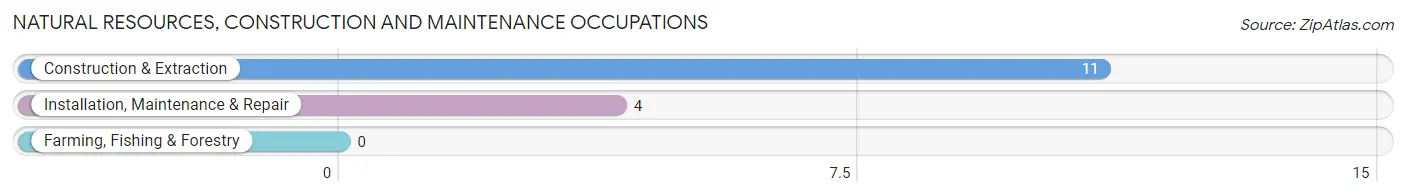
Natural Resources, Construction and Maintenance Occupations
The most common Natural Resources, Construction and Maintenance occupations in Linn Creek are Construction & Extraction (11 | 8.7%), and Installation, Maintenance & Repair (4 | 3.2%).
Natural Resources, Construction and Maintenance Occupations by Sex
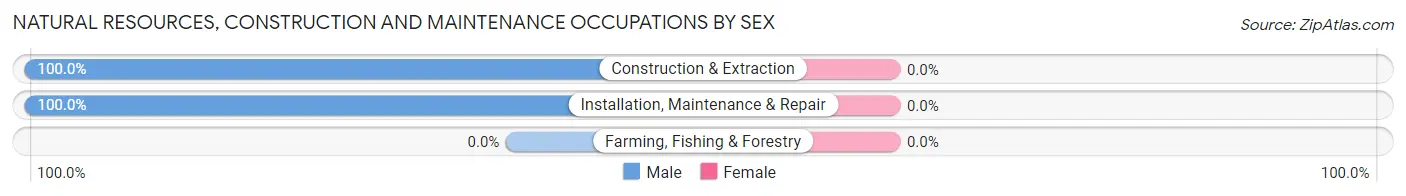
| Occupation | Male | Female |
| Farming, Fishing & Forestry | 0 (0.0%) | 0 (0.0%) |
| Construction & Extraction | 11 (100.0%) | 0 (0.0%) |
| Installation, Maintenance & Repair | 4 (100.0%) | 0 (0.0%) |
| Total (Category) | 15 (100.0%) | 0 (0.0%) |
| Total (Overall) | 64 (50.4%) | 63 (49.6%) |
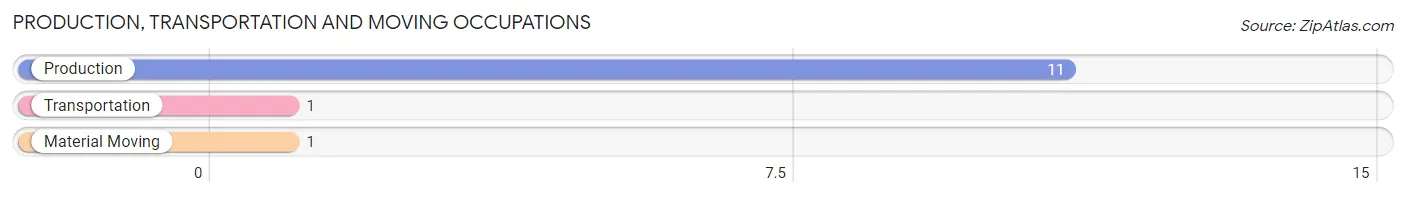
Production, Transportation and Moving Occupations
The most common Production, Transportation and Moving occupations in Linn Creek are Production (11 | 8.7%), Transportation (1 | 0.8%), and Material Moving (1 | 0.8%).
Production, Transportation and Moving Occupations by Sex
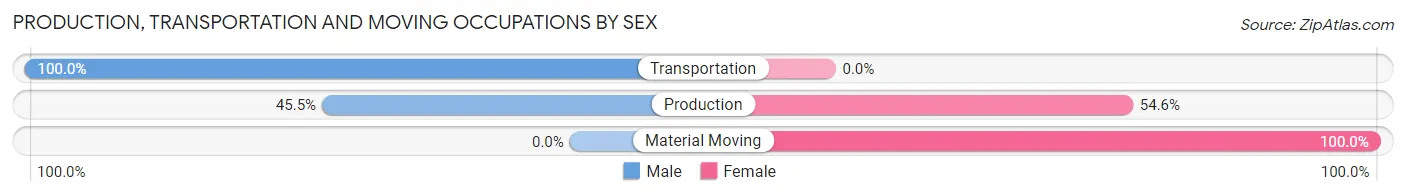
| Occupation | Male | Female |
| Production | 5 (45.5%) | 6 (54.5%) |
| Transportation | 1 (100.0%) | 0 (0.0%) |
| Material Moving | 0 (0.0%) | 1 (100.0%) |
| Total (Category) | 6 (46.2%) | 7 (53.8%) |
| Total (Overall) | 64 (50.4%) | 63 (49.6%) |
Employment Industries by Sex in Linn Creek
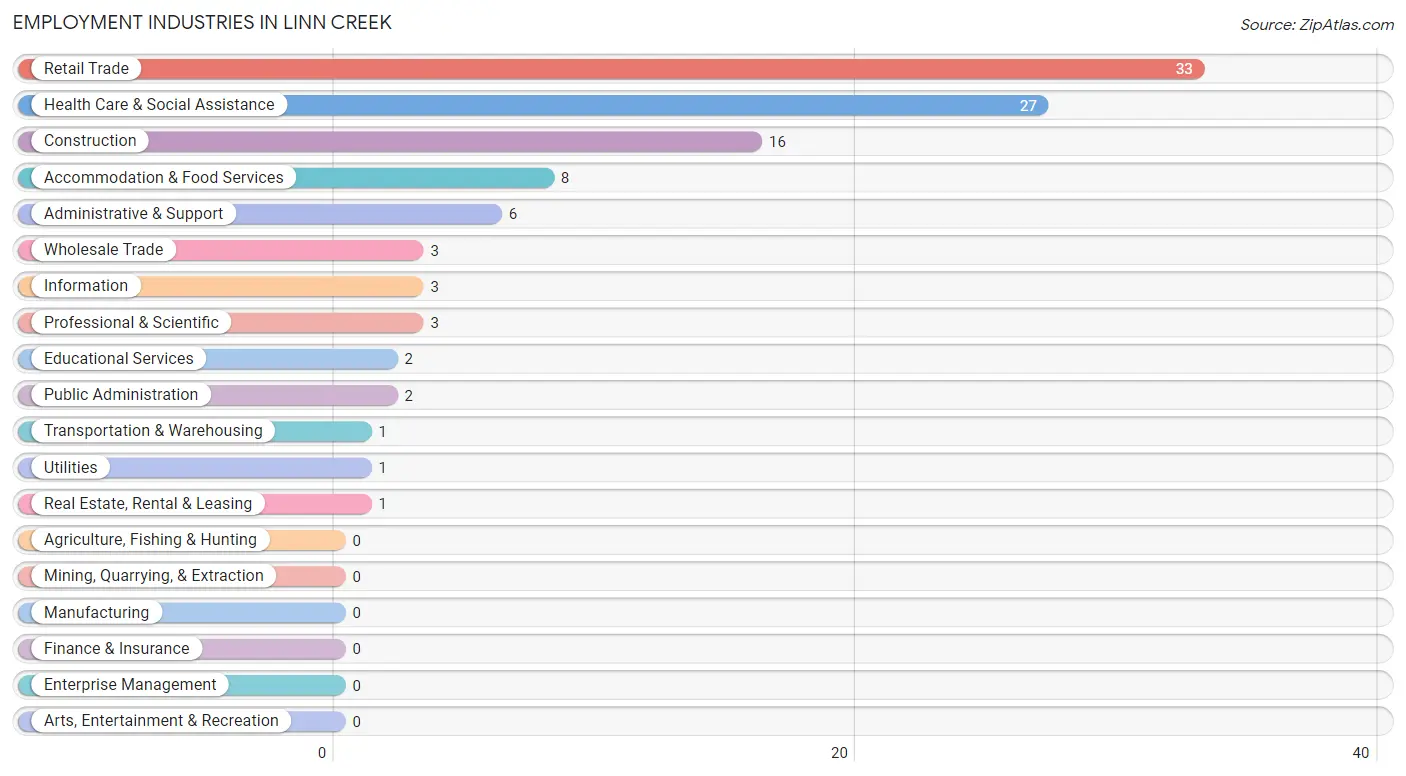
Employment Industries in Linn Creek
The major employment industries in Linn Creek include Retail Trade (33 | 26.0%), Health Care & Social Assistance (27 | 21.3%), Construction (16 | 12.6%), Accommodation & Food Services (8 | 6.3%), and Administrative & Support (6 | 4.7%).
Employment Industries by Sex in Linn Creek
The Linn Creek industries that see more men than women are Wholesale Trade (100.0%), Transportation & Warehousing (100.0%), and Utilities (100.0%), whereas the industries that tend to have a higher number of women are Information (100.0%), Professional & Scientific (100.0%), and Educational Services (100.0%).
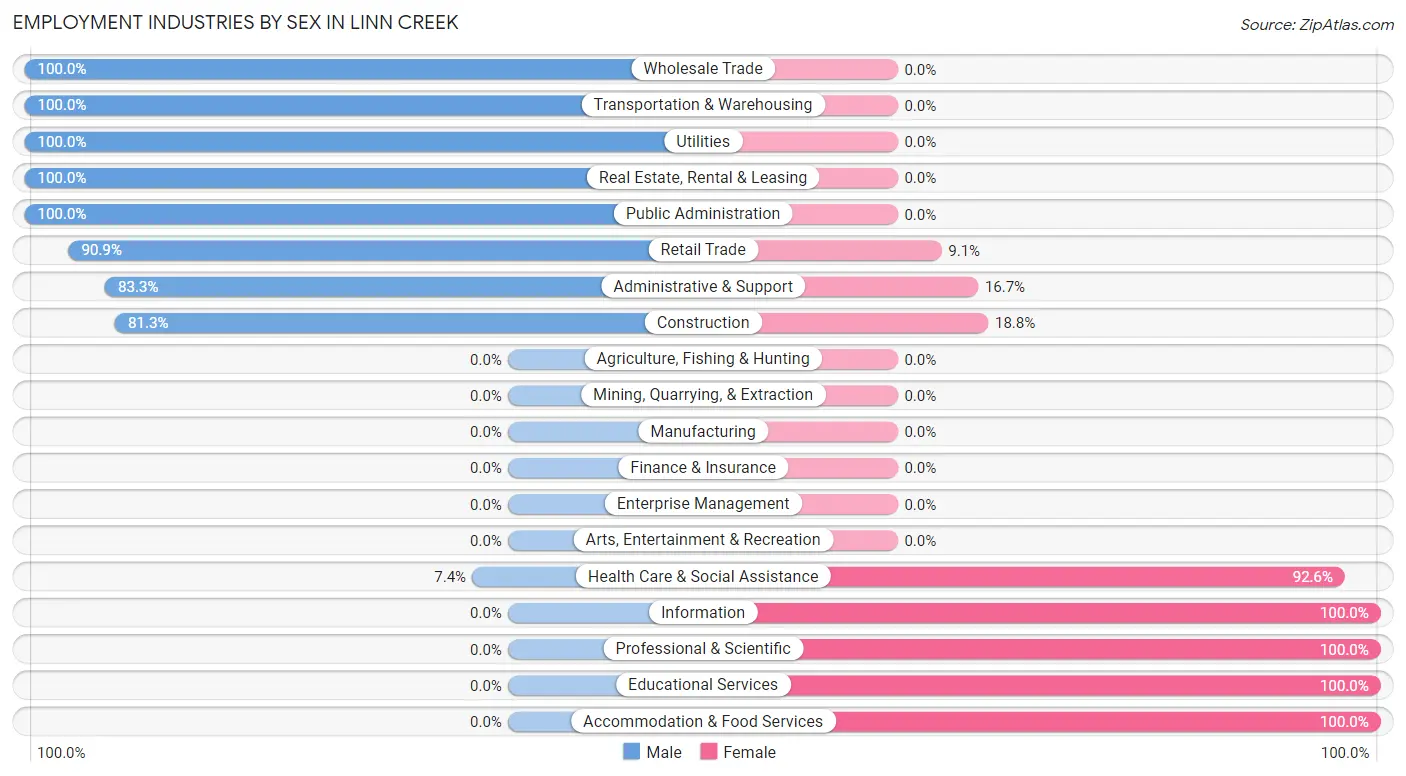
| Industry | Male | Female |
| Agriculture, Fishing & Hunting | 0 (0.0%) | 0 (0.0%) |
| Mining, Quarrying, & Extraction | 0 (0.0%) | 0 (0.0%) |
| Construction | 13 (81.2%) | 3 (18.8%) |
| Manufacturing | 0 (0.0%) | 0 (0.0%) |
| Wholesale Trade | 3 (100.0%) | 0 (0.0%) |
| Retail Trade | 30 (90.9%) | 3 (9.1%) |
| Transportation & Warehousing | 1 (100.0%) | 0 (0.0%) |
| Utilities | 1 (100.0%) | 0 (0.0%) |
| Information | 0 (0.0%) | 3 (100.0%) |
| Finance & Insurance | 0 (0.0%) | 0 (0.0%) |
| Real Estate, Rental & Leasing | 1 (100.0%) | 0 (0.0%) |
| Professional & Scientific | 0 (0.0%) | 3 (100.0%) |
| Enterprise Management | 0 (0.0%) | 0 (0.0%) |
| Administrative & Support | 5 (83.3%) | 1 (16.7%) |
| Educational Services | 0 (0.0%) | 2 (100.0%) |
| Health Care & Social Assistance | 2 (7.4%) | 25 (92.6%) |
| Arts, Entertainment & Recreation | 0 (0.0%) | 0 (0.0%) |
| Accommodation & Food Services | 0 (0.0%) | 8 (100.0%) |
| Public Administration | 2 (100.0%) | 0 (0.0%) |
| Total | 64 (50.4%) | 63 (49.6%) |
Education in Linn Creek
School Enrollment in Linn Creek
The most common levels of schooling among the 31 students in Linn Creek are elementary school (8 | 25.8%), college / undergraduate (8 | 25.8%), and middle school (6 | 19.4%).
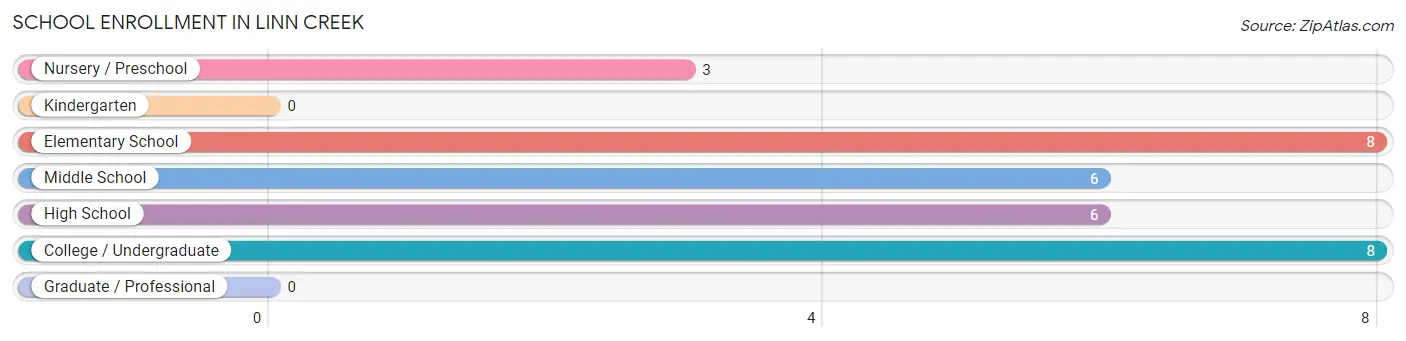
| School Level | # Students | % Students |
| Nursery / Preschool | 3 | 9.7% |
| Kindergarten | 0 | 0.0% |
| Elementary School | 8 | 25.8% |
| Middle School | 6 | 19.4% |
| High School | 6 | 19.4% |
| College / Undergraduate | 8 | 25.8% |
| Graduate / Professional | 0 | 0.0% |
| Total | 31 | 100.0% |
School Enrollment by Age by Funding Source in Linn Creek
Out of a total of 31 students who are enrolled in schools in Linn Creek, 7 (22.6%) attend a private institution, while the remaining 24 (77.4%) are enrolled in public schools. The age group of 35 years and over has the highest likelihood of being enrolled in private schools, with 5 (71.4% in the age bracket) enrolled. Conversely, the age group of 18 to 19 year olds has the lowest likelihood of being enrolled in a private school, with 3 (100.0% in the age bracket) attending a public institution.
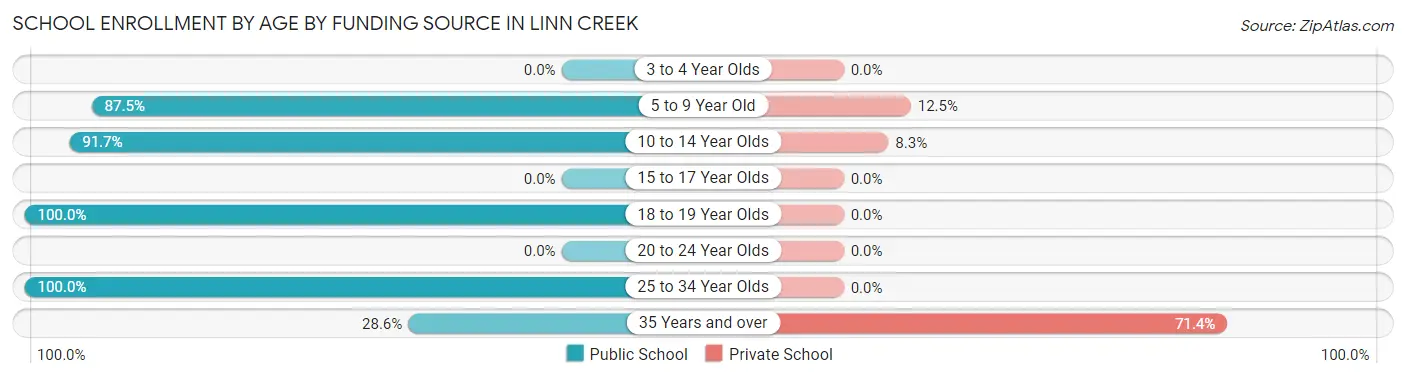
| Age Bracket | Public School | Private School |
| 3 to 4 Year Olds | 0 (0.0%) | 0 (0.0%) |
| 5 to 9 Year Old | 7 (87.5%) | 1 (12.5%) |
| 10 to 14 Year Olds | 11 (91.7%) | 1 (8.3%) |
| 15 to 17 Year Olds | 0 (0.0%) | 0 (0.0%) |
| 18 to 19 Year Olds | 3 (100.0%) | 0 (0.0%) |
| 20 to 24 Year Olds | 0 (0.0%) | 0 (0.0%) |
| 25 to 34 Year Olds | 1 (100.0%) | 0 (0.0%) |
| 35 Years and over | 2 (28.6%) | 5 (71.4%) |
| Total | 24 (77.4%) | 7 (22.6%) |
Educational Attainment by Field of Study in Linn Creek
Liberal arts & history (25 | 55.6%), business (5 | 11.1%), psychology (4 | 8.9%), education (3 | 6.7%), and visual & performing arts (3 | 6.7%) are the most common fields of study among 45 individuals in Linn Creek who have obtained a bachelor's degree or higher.
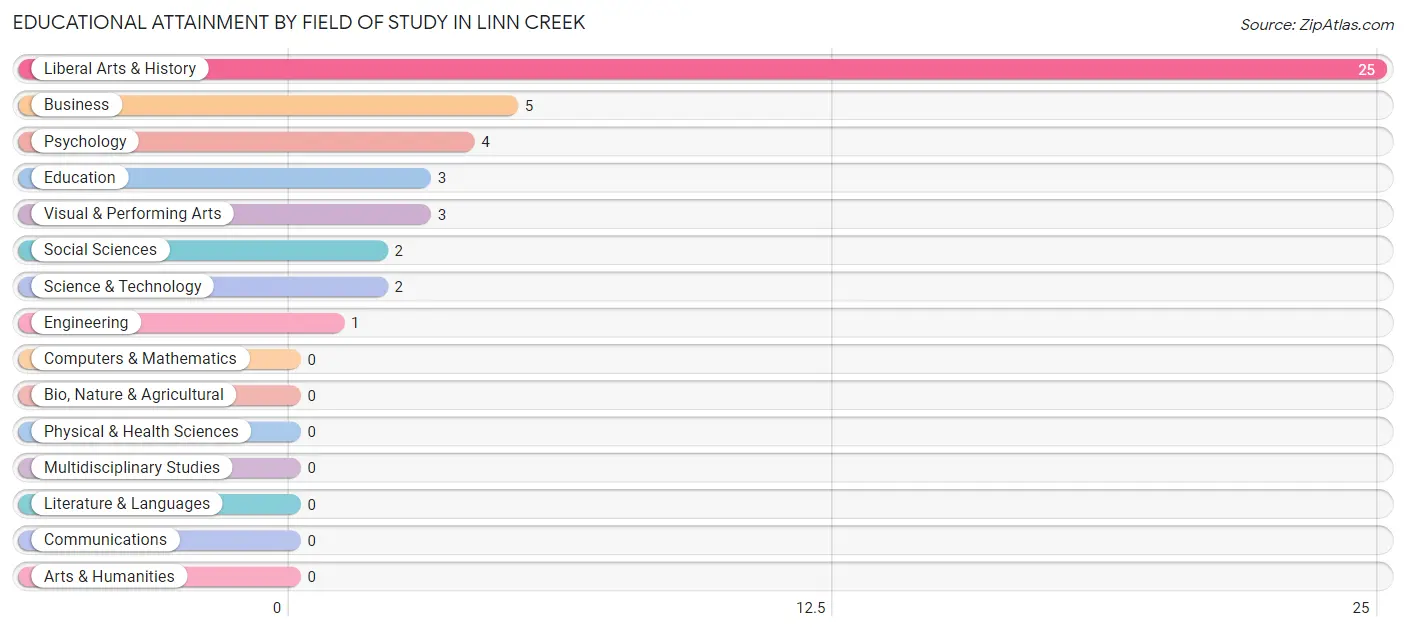
| Field of Study | # Graduates | % Graduates |
| Computers & Mathematics | 0 | 0.0% |
| Bio, Nature & Agricultural | 0 | 0.0% |
| Physical & Health Sciences | 0 | 0.0% |
| Psychology | 4 | 8.9% |
| Social Sciences | 2 | 4.4% |
| Engineering | 1 | 2.2% |
| Multidisciplinary Studies | 0 | 0.0% |
| Science & Technology | 2 | 4.4% |
| Business | 5 | 11.1% |
| Education | 3 | 6.7% |
| Literature & Languages | 0 | 0.0% |
| Liberal Arts & History | 25 | 55.6% |
| Visual & Performing Arts | 3 | 6.7% |
| Communications | 0 | 0.0% |
| Arts & Humanities | 0 | 0.0% |
| Total | 45 | 100.0% |
Transportation & Commute in Linn Creek
Vehicle Availability by Sex in Linn Creek
The most prevalent vehicle ownership categories in Linn Creek are males with 2 vehicles (48, accounting for 75.0%) and females with 2 vehicles (26, making up 76.2%).
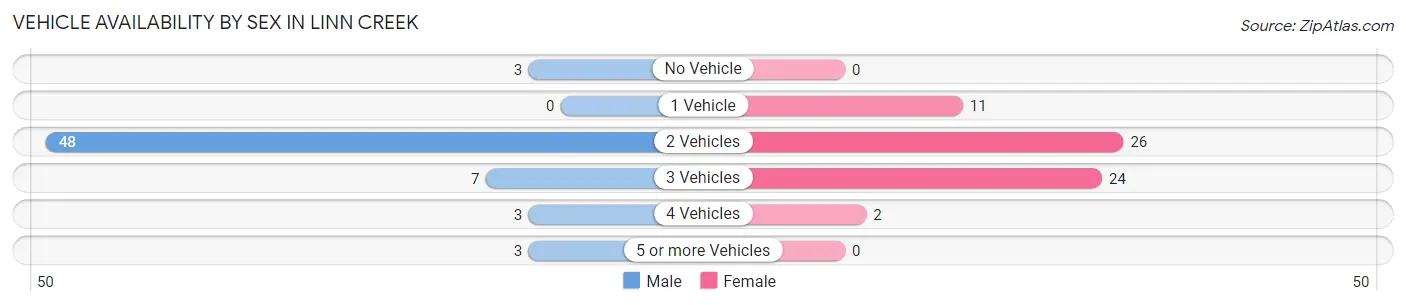
| Vehicles Available | Male | Female |
| No Vehicle | 3 (4.7%) | 0 (0.0%) |
| 1 Vehicle | 0 (0.0%) | 11 (17.5%) |
| 2 Vehicles | 48 (75.0%) | 26 (41.3%) |
| 3 Vehicles | 7 (10.9%) | 24 (38.1%) |
| 4 Vehicles | 3 (4.7%) | 2 (3.2%) |
| 5 or more Vehicles | 3 (4.7%) | 0 (0.0%) |
| Total | 64 (100.0%) | 63 (100.0%) |
Commute Time in Linn Creek
The most frequently occuring commute durations in Linn Creek are 15 to 19 minutes (49 commuters, 39.5%), 10 to 14 minutes (24 commuters, 19.4%), and 5 to 9 minutes (14 commuters, 11.3%).
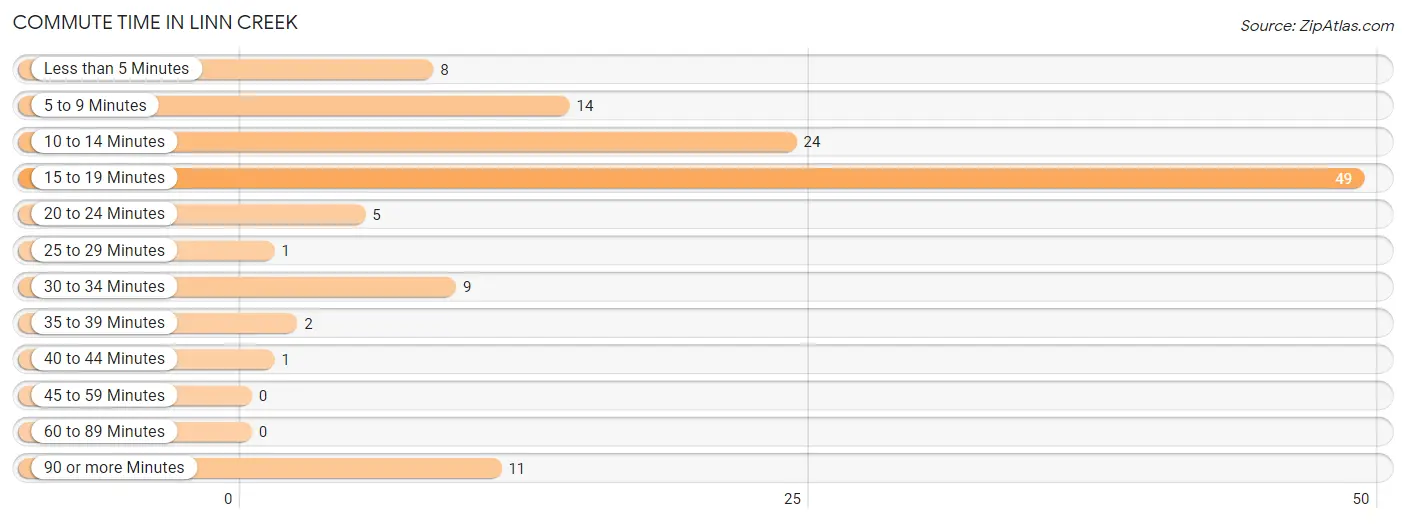
| Commute Time | # Commuters | % Commuters |
| Less than 5 Minutes | 8 | 6.5% |
| 5 to 9 Minutes | 14 | 11.3% |
| 10 to 14 Minutes | 24 | 19.4% |
| 15 to 19 Minutes | 49 | 39.5% |
| 20 to 24 Minutes | 5 | 4.0% |
| 25 to 29 Minutes | 1 | 0.8% |
| 30 to 34 Minutes | 9 | 7.3% |
| 35 to 39 Minutes | 2 | 1.6% |
| 40 to 44 Minutes | 1 | 0.8% |
| 45 to 59 Minutes | 0 | 0.0% |
| 60 to 89 Minutes | 0 | 0.0% |
| 90 or more Minutes | 11 | 8.9% |
Commute Time by Sex in Linn Creek
The most common commute times in Linn Creek are 15 to 19 minutes (28 commuters, 43.8%) for males and 15 to 19 minutes (21 commuters, 35.0%) for females.
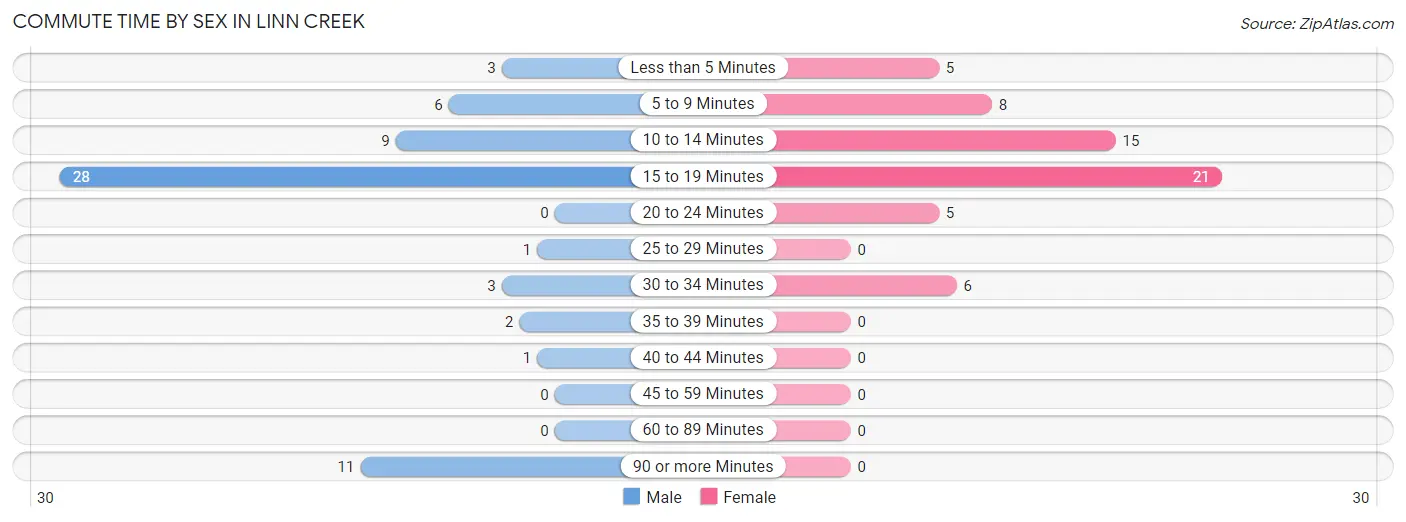
| Commute Time | Male | Female |
| Less than 5 Minutes | 3 (4.7%) | 5 (8.3%) |
| 5 to 9 Minutes | 6 (9.4%) | 8 (13.3%) |
| 10 to 14 Minutes | 9 (14.1%) | 15 (25.0%) |
| 15 to 19 Minutes | 28 (43.8%) | 21 (35.0%) |
| 20 to 24 Minutes | 0 (0.0%) | 5 (8.3%) |
| 25 to 29 Minutes | 1 (1.6%) | 0 (0.0%) |
| 30 to 34 Minutes | 3 (4.7%) | 6 (10.0%) |
| 35 to 39 Minutes | 2 (3.1%) | 0 (0.0%) |
| 40 to 44 Minutes | 1 (1.6%) | 0 (0.0%) |
| 45 to 59 Minutes | 0 (0.0%) | 0 (0.0%) |
| 60 to 89 Minutes | 0 (0.0%) | 0 (0.0%) |
| 90 or more Minutes | 11 (17.2%) | 0 (0.0%) |
Time of Departure to Work by Sex in Linn Creek
The most frequent times of departure to work in Linn Creek are 8:00 AM to 8:29 AM (20, 31.2%) for males and 7:00 AM to 7:29 AM (27, 45.0%) for females.
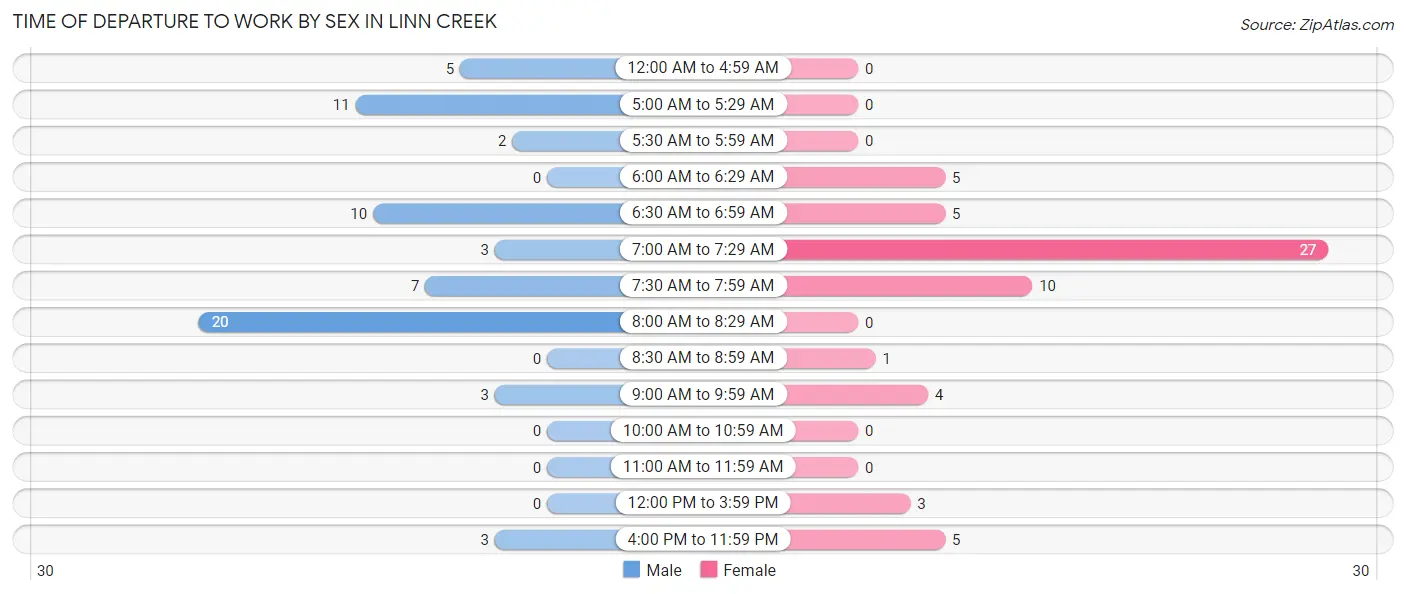
| Time of Departure | Male | Female |
| 12:00 AM to 4:59 AM | 5 (7.8%) | 0 (0.0%) |
| 5:00 AM to 5:29 AM | 11 (17.2%) | 0 (0.0%) |
| 5:30 AM to 5:59 AM | 2 (3.1%) | 0 (0.0%) |
| 6:00 AM to 6:29 AM | 0 (0.0%) | 5 (8.3%) |
| 6:30 AM to 6:59 AM | 10 (15.6%) | 5 (8.3%) |
| 7:00 AM to 7:29 AM | 3 (4.7%) | 27 (45.0%) |
| 7:30 AM to 7:59 AM | 7 (10.9%) | 10 (16.7%) |
| 8:00 AM to 8:29 AM | 20 (31.2%) | 0 (0.0%) |
| 8:30 AM to 8:59 AM | 0 (0.0%) | 1 (1.7%) |
| 9:00 AM to 9:59 AM | 3 (4.7%) | 4 (6.7%) |
| 10:00 AM to 10:59 AM | 0 (0.0%) | 0 (0.0%) |
| 11:00 AM to 11:59 AM | 0 (0.0%) | 0 (0.0%) |
| 12:00 PM to 3:59 PM | 0 (0.0%) | 3 (5.0%) |
| 4:00 PM to 11:59 PM | 3 (4.7%) | 5 (8.3%) |
| Total | 64 (100.0%) | 60 (100.0%) |
Housing Occupancy in Linn Creek
Occupancy by Ownership in Linn Creek
Of the total 116 dwellings in Linn Creek, owner-occupied units account for 85 (73.3%), while renter-occupied units make up 31 (26.7%).
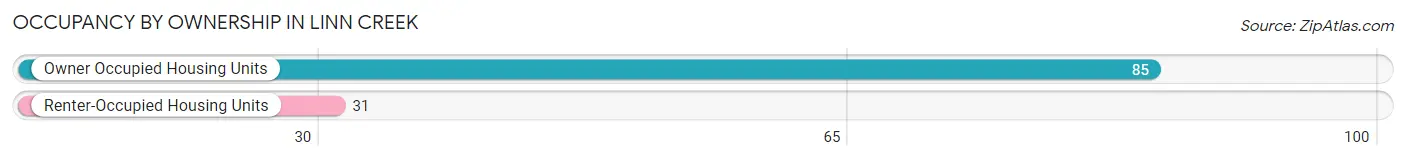
| Occupancy | # Housing Units | % Housing Units |
| Owner Occupied Housing Units | 85 | 73.3% |
| Renter-Occupied Housing Units | 31 | 26.7% |
| Total Occupied Housing Units | 116 | 100.0% |
Occupancy by Household Size in Linn Creek
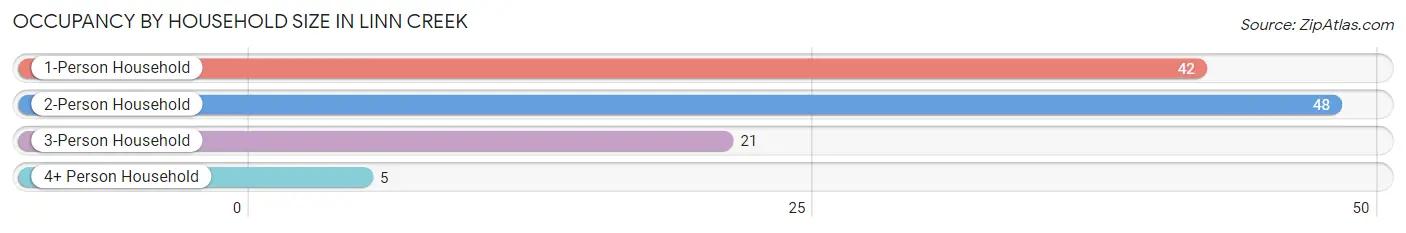
| Household Size | # Housing Units | % Housing Units |
| 1-Person Household | 42 | 36.2% |
| 2-Person Household | 48 | 41.4% |
| 3-Person Household | 21 | 18.1% |
| 4+ Person Household | 5 | 4.3% |
| Total Housing Units | 116 | 100.0% |
Occupancy by Ownership by Household Size in Linn Creek
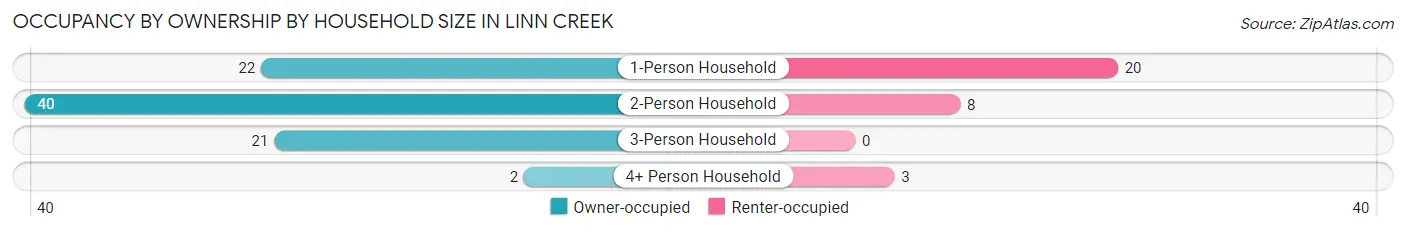
| Household Size | Owner-occupied | Renter-occupied |
| 1-Person Household | 22 (52.4%) | 20 (47.6%) |
| 2-Person Household | 40 (83.3%) | 8 (16.7%) |
| 3-Person Household | 21 (100.0%) | 0 (0.0%) |
| 4+ Person Household | 2 (40.0%) | 3 (60.0%) |
| Total Housing Units | 85 (73.3%) | 31 (26.7%) |
Occupancy by Educational Attainment in Linn Creek
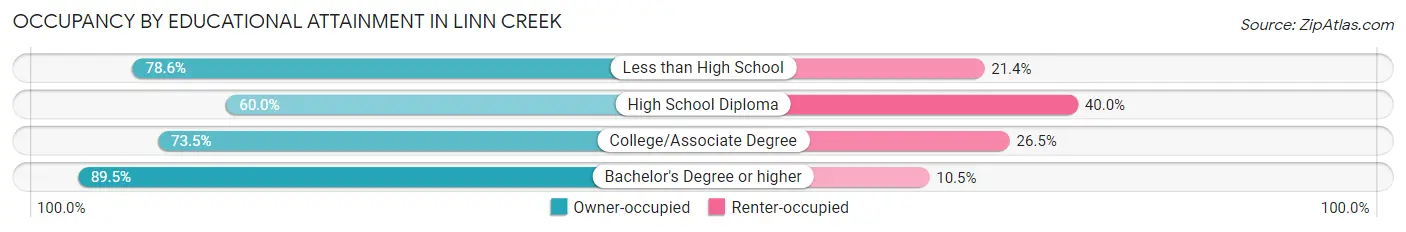
| Household Size | Owner-occupied | Renter-occupied |
| Less than High School | 22 (78.6%) | 6 (21.4%) |
| High School Diploma | 21 (60.0%) | 14 (40.0%) |
| College/Associate Degree | 25 (73.5%) | 9 (26.5%) |
| Bachelor's Degree or higher | 17 (89.5%) | 2 (10.5%) |
Occupancy by Age of Householder in Linn Creek
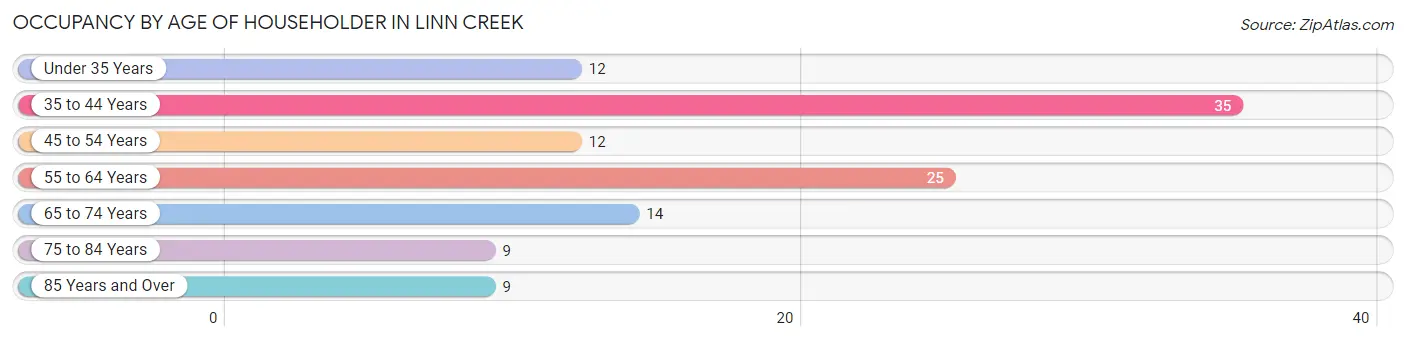
| Age Bracket | # Households | % Households |
| Under 35 Years | 12 | 10.3% |
| 35 to 44 Years | 35 | 30.2% |
| 45 to 54 Years | 12 | 10.3% |
| 55 to 64 Years | 25 | 21.5% |
| 65 to 74 Years | 14 | 12.1% |
| 75 to 84 Years | 9 | 7.8% |
| 85 Years and Over | 9 | 7.8% |
| Total | 116 | 100.0% |
Housing Finances in Linn Creek
Median Income by Occupancy in Linn Creek
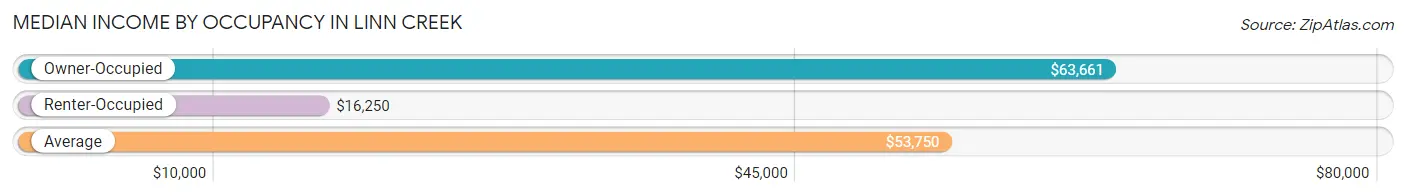
| Occupancy Type | # Households | Median Income |
| Owner-Occupied | 85 (73.3%) | $63,661 |
| Renter-Occupied | 31 (26.7%) | $16,250 |
| Average | 116 (100.0%) | $53,750 |
Occupancy by Householder Income Bracket in Linn Creek
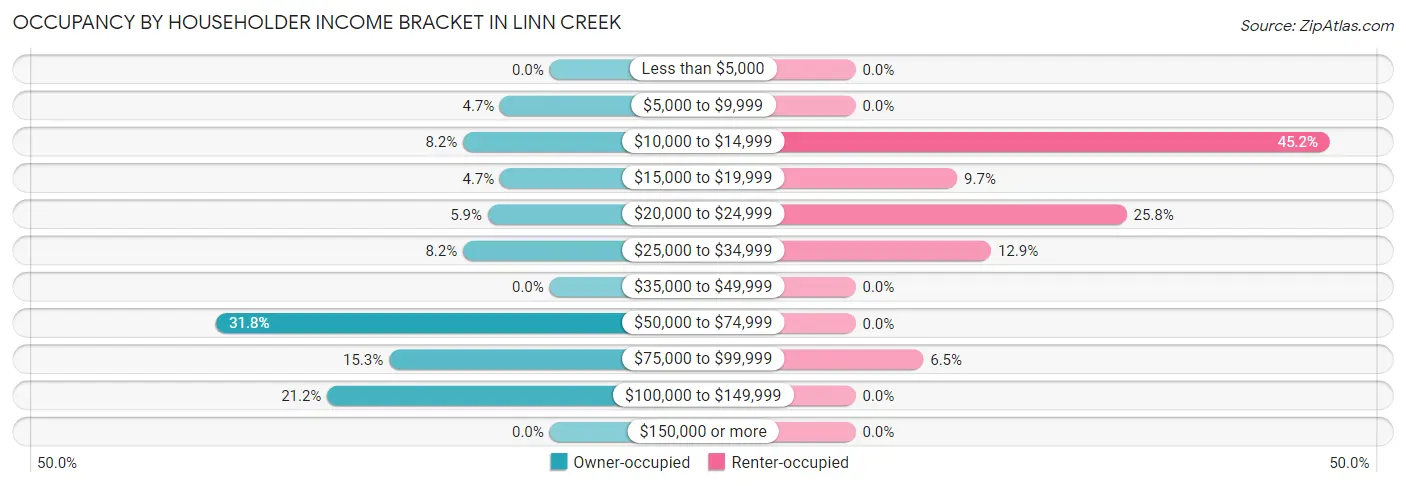
| Income Bracket | Owner-occupied | Renter-occupied |
| Less than $5,000 | 0 (0.0%) | 0 (0.0%) |
| $5,000 to $9,999 | 4 (4.7%) | 0 (0.0%) |
| $10,000 to $14,999 | 7 (8.2%) | 14 (45.2%) |
| $15,000 to $19,999 | 4 (4.7%) | 3 (9.7%) |
| $20,000 to $24,999 | 5 (5.9%) | 8 (25.8%) |
| $25,000 to $34,999 | 7 (8.2%) | 4 (12.9%) |
| $35,000 to $49,999 | 0 (0.0%) | 0 (0.0%) |
| $50,000 to $74,999 | 27 (31.8%) | 0 (0.0%) |
| $75,000 to $99,999 | 13 (15.3%) | 2 (6.5%) |
| $100,000 to $149,999 | 18 (21.2%) | 0 (0.0%) |
| $150,000 or more | 0 (0.0%) | 0 (0.0%) |
| Total | 85 (100.0%) | 31 (100.0%) |
Monthly Housing Cost Tiers in Linn Creek
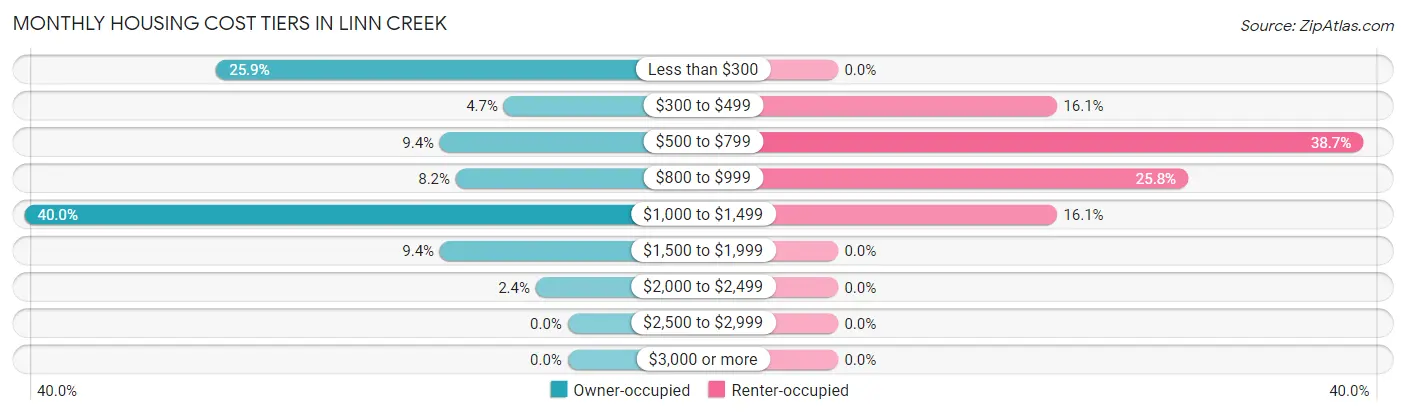
| Monthly Cost | Owner-occupied | Renter-occupied |
| Less than $300 | 22 (25.9%) | 0 (0.0%) |
| $300 to $499 | 4 (4.7%) | 5 (16.1%) |
| $500 to $799 | 8 (9.4%) | 12 (38.7%) |
| $800 to $999 | 7 (8.2%) | 8 (25.8%) |
| $1,000 to $1,499 | 34 (40.0%) | 5 (16.1%) |
| $1,500 to $1,999 | 8 (9.4%) | 0 (0.0%) |
| $2,000 to $2,499 | 2 (2.4%) | 0 (0.0%) |
| $2,500 to $2,999 | 0 (0.0%) | 0 (0.0%) |
| $3,000 or more | 0 (0.0%) | 0 (0.0%) |
| Total | 85 (100.0%) | 31 (100.0%) |
Physical Housing Characteristics in Linn Creek
Housing Structures in Linn Creek
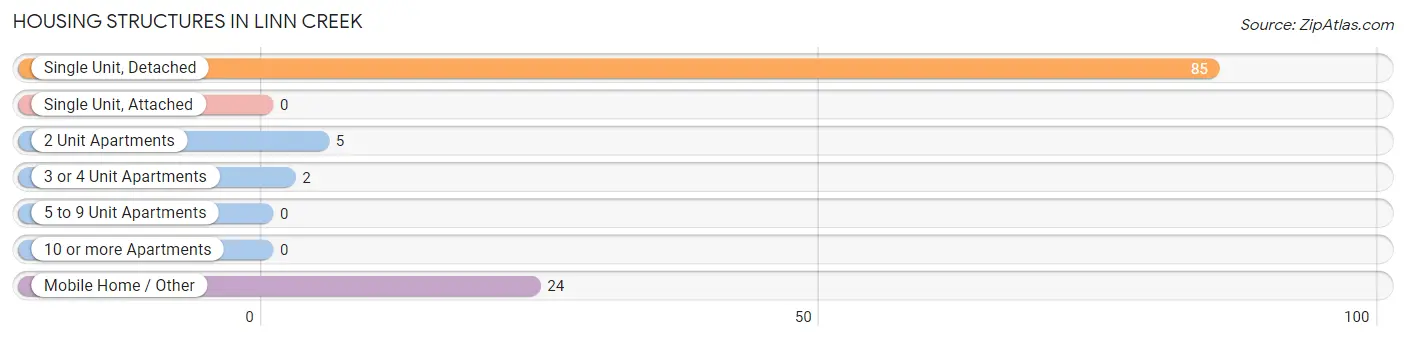
| Structure Type | # Housing Units | % Housing Units |
| Single Unit, Detached | 85 | 73.3% |
| Single Unit, Attached | 0 | 0.0% |
| 2 Unit Apartments | 5 | 4.3% |
| 3 or 4 Unit Apartments | 2 | 1.7% |
| 5 to 9 Unit Apartments | 0 | 0.0% |
| 10 or more Apartments | 0 | 0.0% |
| Mobile Home / Other | 24 | 20.7% |
| Total | 116 | 100.0% |
Housing Structures by Occupancy in Linn Creek
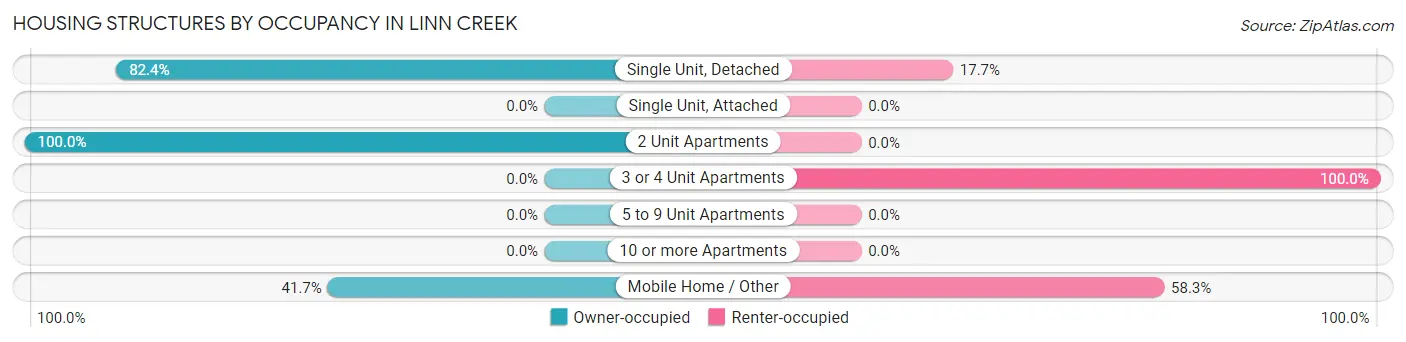
| Structure Type | Owner-occupied | Renter-occupied |
| Single Unit, Detached | 70 (82.4%) | 15 (17.6%) |
| Single Unit, Attached | 0 (0.0%) | 0 (0.0%) |
| 2 Unit Apartments | 5 (100.0%) | 0 (0.0%) |
| 3 or 4 Unit Apartments | 0 (0.0%) | 2 (100.0%) |
| 5 to 9 Unit Apartments | 0 (0.0%) | 0 (0.0%) |
| 10 or more Apartments | 0 (0.0%) | 0 (0.0%) |
| Mobile Home / Other | 10 (41.7%) | 14 (58.3%) |
| Total | 85 (73.3%) | 31 (26.7%) |
Housing Structures by Number of Rooms in Linn Creek
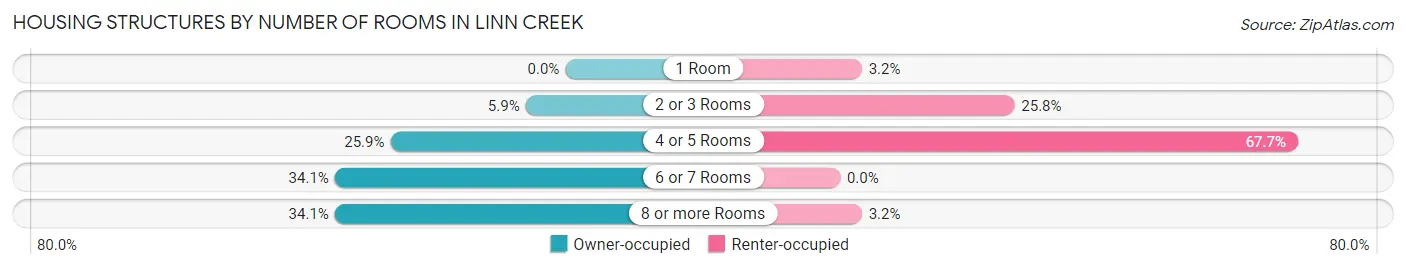
| Number of Rooms | Owner-occupied | Renter-occupied |
| 1 Room | 0 (0.0%) | 1 (3.2%) |
| 2 or 3 Rooms | 5 (5.9%) | 8 (25.8%) |
| 4 or 5 Rooms | 22 (25.9%) | 21 (67.7%) |
| 6 or 7 Rooms | 29 (34.1%) | 0 (0.0%) |
| 8 or more Rooms | 29 (34.1%) | 1 (3.2%) |
| Total | 85 (100.0%) | 31 (100.0%) |
Housing Structure by Heating Type in Linn Creek
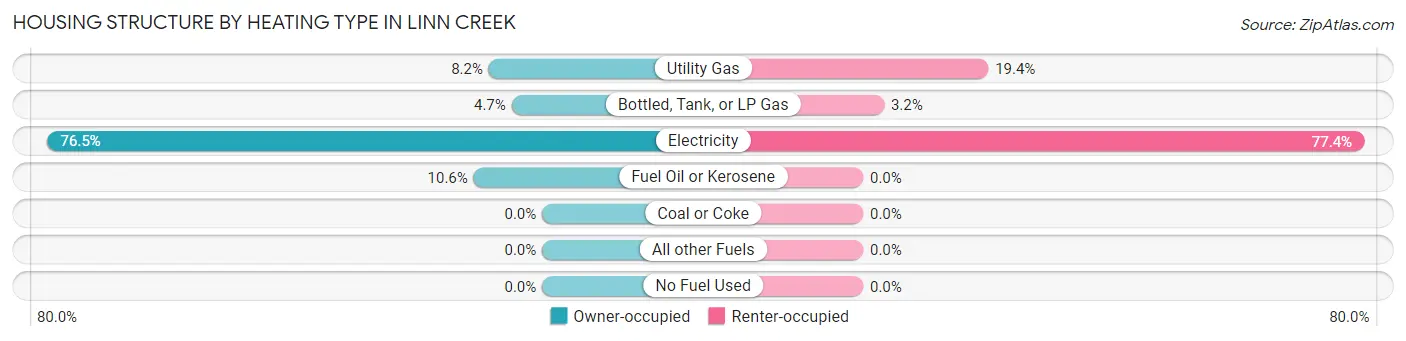
| Heating Type | Owner-occupied | Renter-occupied |
| Utility Gas | 7 (8.2%) | 6 (19.4%) |
| Bottled, Tank, or LP Gas | 4 (4.7%) | 1 (3.2%) |
| Electricity | 65 (76.5%) | 24 (77.4%) |
| Fuel Oil or Kerosene | 9 (10.6%) | 0 (0.0%) |
| Coal or Coke | 0 (0.0%) | 0 (0.0%) |
| All other Fuels | 0 (0.0%) | 0 (0.0%) |
| No Fuel Used | 0 (0.0%) | 0 (0.0%) |
| Total | 85 (100.0%) | 31 (100.0%) |
Household Vehicle Usage in Linn Creek
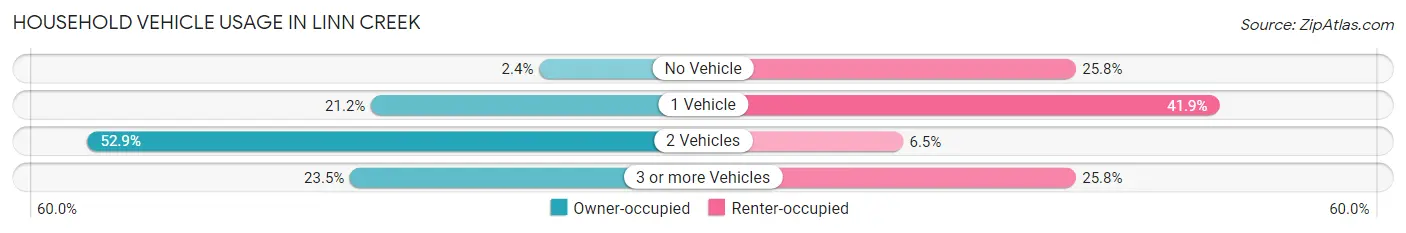
| Vehicles per Household | Owner-occupied | Renter-occupied |
| No Vehicle | 2 (2.4%) | 8 (25.8%) |
| 1 Vehicle | 18 (21.2%) | 13 (41.9%) |
| 2 Vehicles | 45 (52.9%) | 2 (6.5%) |
| 3 or more Vehicles | 20 (23.5%) | 8 (25.8%) |
| Total | 85 (100.0%) | 31 (100.0%) |
Real Estate & Mortgages in Linn Creek
Real Estate and Mortgage Overview in Linn Creek
| Characteristic | Without Mortgage | With Mortgage |
| Housing Units | 26 | 59 |
| Median Property Value | - | - |
| Median Household Income | - | - |
| Monthly Housing Costs | $250 | $0 |
| Real Estate Taxes | $336 | $0 |
Property Value by Mortgage Status in Linn Creek
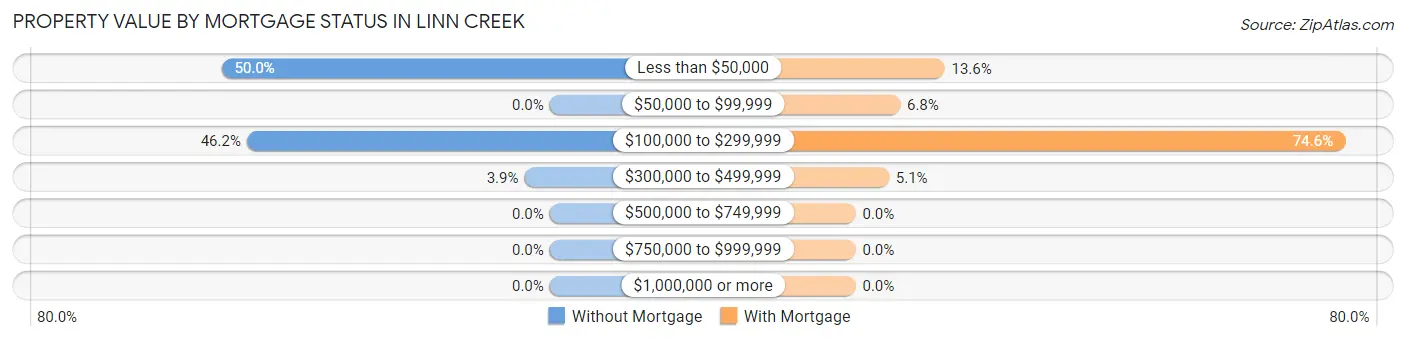
| Property Value | Without Mortgage | With Mortgage |
| Less than $50,000 | 13 (50.0%) | 8 (13.6%) |
| $50,000 to $99,999 | 0 (0.0%) | 4 (6.8%) |
| $100,000 to $299,999 | 12 (46.2%) | 44 (74.6%) |
| $300,000 to $499,999 | 1 (3.8%) | 3 (5.1%) |
| $500,000 to $749,999 | 0 (0.0%) | 0 (0.0%) |
| $750,000 to $999,999 | 0 (0.0%) | 0 (0.0%) |
| $1,000,000 or more | 0 (0.0%) | 0 (0.0%) |
| Total | 26 (100.0%) | 59 (100.0%) |
Household Income by Mortgage Status in Linn Creek
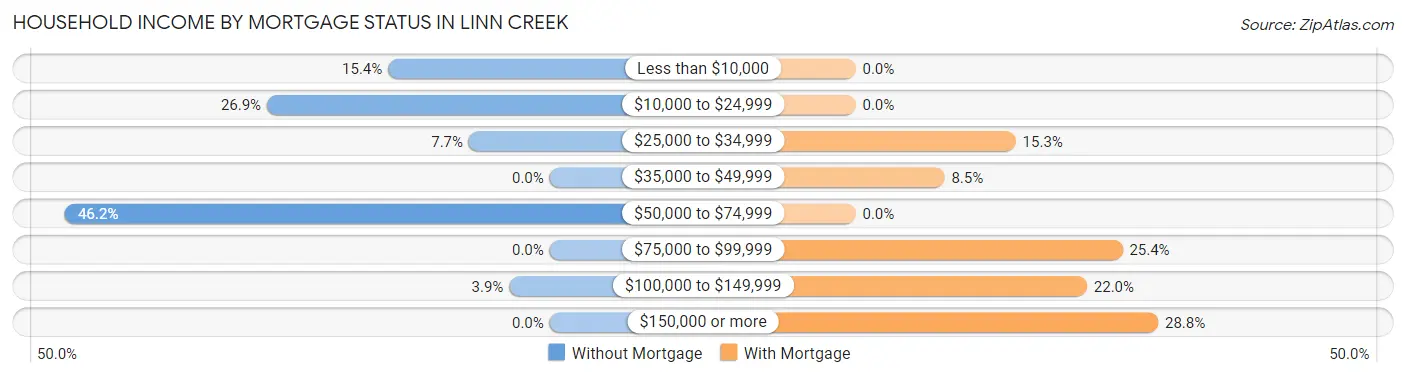
| Household Income | Without Mortgage | With Mortgage |
| Less than $10,000 | 4 (15.4%) | 0 (0.0%) |
| $10,000 to $24,999 | 7 (26.9%) | 0 (0.0%) |
| $25,000 to $34,999 | 2 (7.7%) | 9 (15.2%) |
| $35,000 to $49,999 | 0 (0.0%) | 5 (8.5%) |
| $50,000 to $74,999 | 12 (46.2%) | 0 (0.0%) |
| $75,000 to $99,999 | 0 (0.0%) | 15 (25.4%) |
| $100,000 to $149,999 | 1 (3.8%) | 13 (22.0%) |
| $150,000 or more | 0 (0.0%) | 17 (28.8%) |
| Total | 26 (100.0%) | 59 (100.0%) |
Property Value to Household Income Ratio in Linn Creek
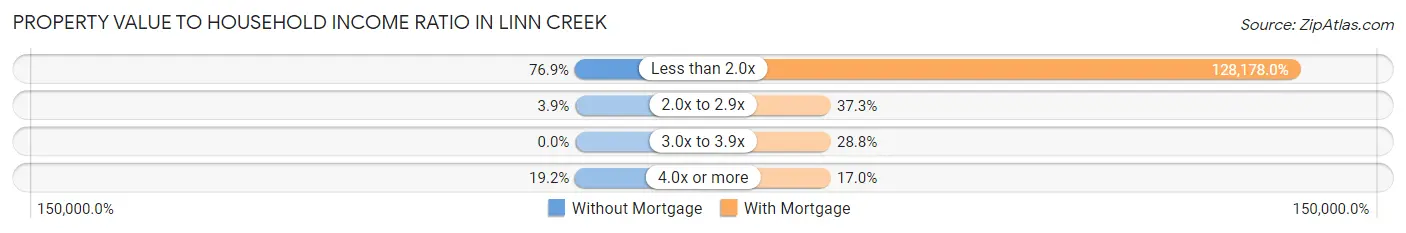
| Value-to-Income Ratio | Without Mortgage | With Mortgage |
| Less than 2.0x | 20 (76.9%) | 75,625 (128,178.0%) |
| 2.0x to 2.9x | 1 (3.8%) | 22 (37.3%) |
| 3.0x to 3.9x | 0 (0.0%) | 17 (28.8%) |
| 4.0x or more | 5 (19.2%) | 10 (17.0%) |
| Total | 26 (100.0%) | 59 (100.0%) |
Real Estate Taxes by Mortgage Status in Linn Creek
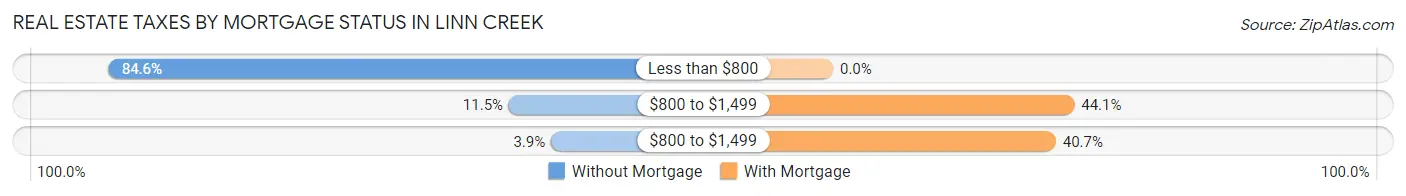
| Property Taxes | Without Mortgage | With Mortgage |
| Less than $800 | 22 (84.6%) | 0 (0.0%) |
| $800 to $1,499 | 3 (11.5%) | 26 (44.1%) |
| $800 to $1,499 | 1 (3.8%) | 24 (40.7%) |
| Total | 26 (100.0%) | 59 (100.0%) |
Health & Disability in Linn Creek
Health Insurance Coverage by Age in Linn Creek
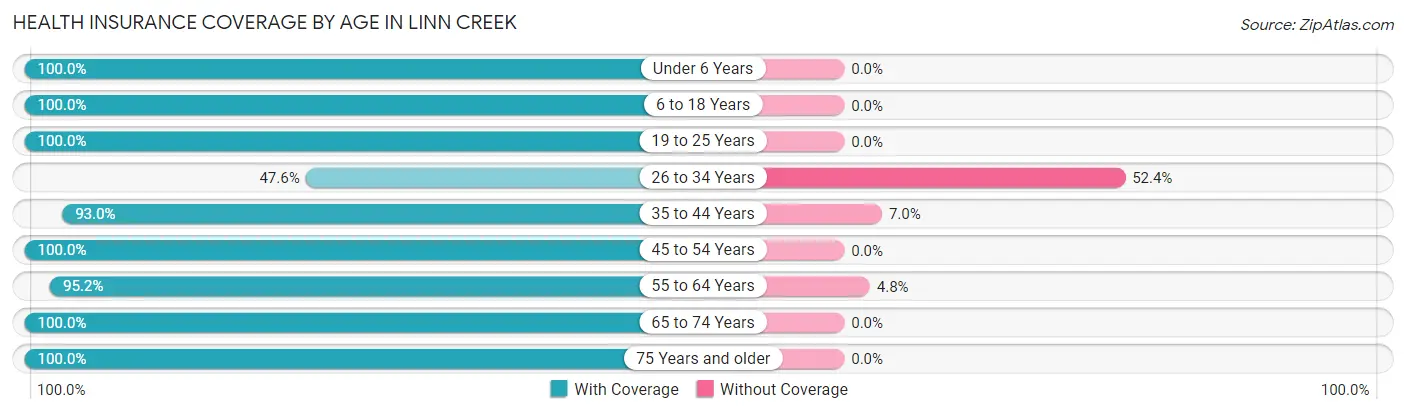
| Age Bracket | With Coverage | Without Coverage |
| Under 6 Years | 19 (100.0%) | 0 (0.0%) |
| 6 to 18 Years | 17 (100.0%) | 0 (0.0%) |
| 19 to 25 Years | 3 (100.0%) | 0 (0.0%) |
| 26 to 34 Years | 10 (47.6%) | 11 (52.4%) |
| 35 to 44 Years | 53 (93.0%) | 4 (7.0%) |
| 45 to 54 Years | 19 (100.0%) | 0 (0.0%) |
| 55 to 64 Years | 40 (95.2%) | 2 (4.8%) |
| 65 to 74 Years | 37 (100.0%) | 0 (0.0%) |
| 75 Years and older | 32 (100.0%) | 0 (0.0%) |
| Total | 230 (93.1%) | 17 (6.9%) |
Health Insurance Coverage by Citizenship Status in Linn Creek
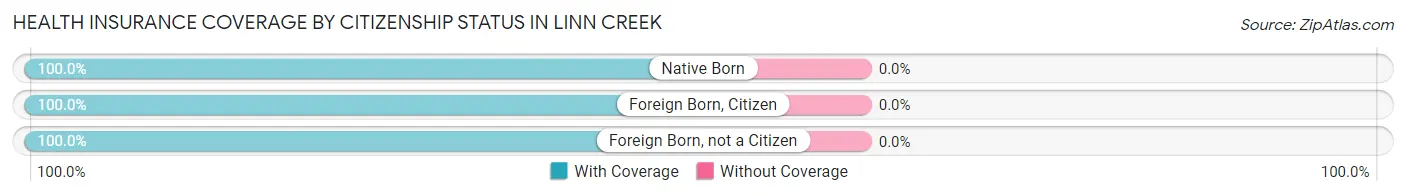
| Citizenship Status | With Coverage | Without Coverage |
| Native Born | 19 (100.0%) | 0 (0.0%) |
| Foreign Born, Citizen | 17 (100.0%) | 0 (0.0%) |
| Foreign Born, not a Citizen | 3 (100.0%) | 0 (0.0%) |
Health Insurance Coverage by Household Income in Linn Creek
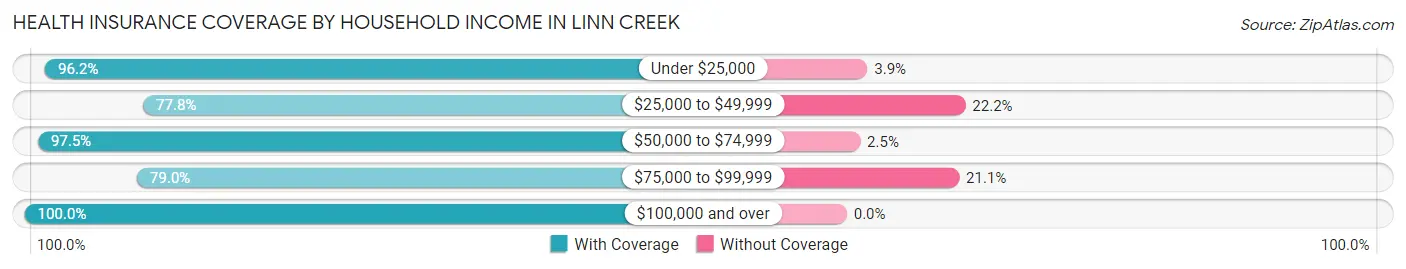
| Household Income | With Coverage | Without Coverage |
| Under $25,000 | 75 (96.2%) | 3 (3.8%) |
| $25,000 to $49,999 | 14 (77.8%) | 4 (22.2%) |
| $50,000 to $74,999 | 78 (97.5%) | 2 (2.5%) |
| $75,000 to $99,999 | 30 (78.9%) | 8 (21.0%) |
| $100,000 and over | 33 (100.0%) | 0 (0.0%) |
Public vs Private Health Insurance Coverage by Age in Linn Creek
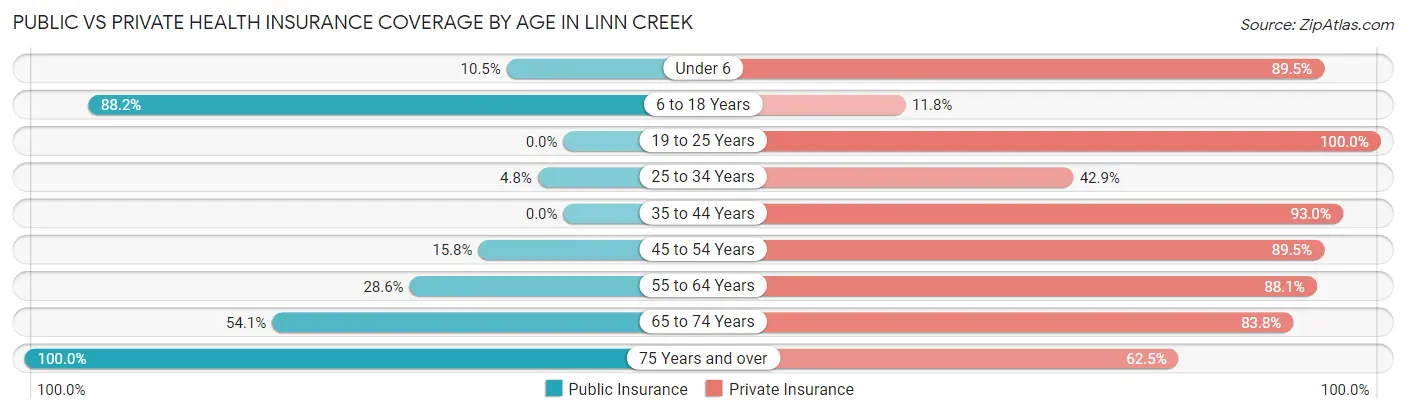
| Age Bracket | Public Insurance | Private Insurance |
| Under 6 | 2 (10.5%) | 17 (89.5%) |
| 6 to 18 Years | 15 (88.2%) | 2 (11.8%) |
| 19 to 25 Years | 0 (0.0%) | 3 (100.0%) |
| 25 to 34 Years | 1 (4.8%) | 9 (42.9%) |
| 35 to 44 Years | 0 (0.0%) | 53 (93.0%) |
| 45 to 54 Years | 3 (15.8%) | 17 (89.5%) |
| 55 to 64 Years | 12 (28.6%) | 37 (88.1%) |
| 65 to 74 Years | 20 (54.0%) | 31 (83.8%) |
| 75 Years and over | 32 (100.0%) | 20 (62.5%) |
| Total | 85 (34.4%) | 189 (76.5%) |
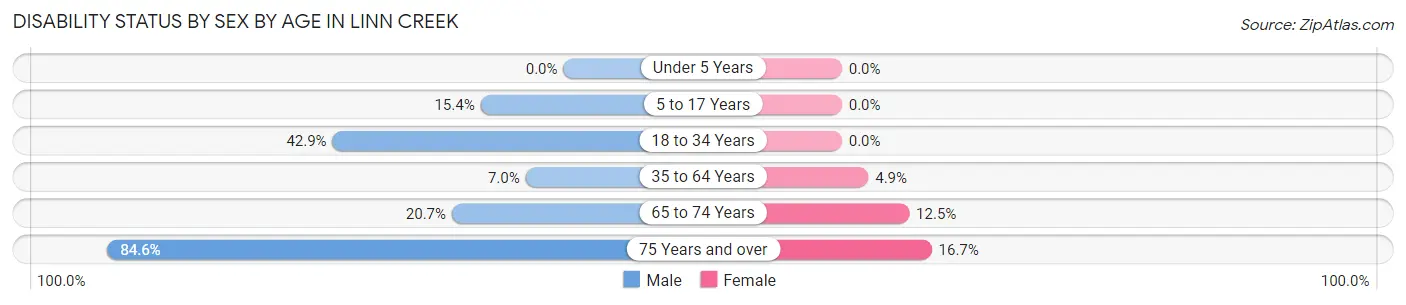
Disability Status by Sex by Age in Linn Creek
| Age Bracket | Male | Female |
| Under 5 Years | 0 (0.0%) | 0 (0.0%) |
| 5 to 17 Years | 2 (15.4%) | 0 (0.0%) |
| 18 to 34 Years | 3 (42.9%) | 0 (0.0%) |
| 35 to 64 Years | 4 (7.0%) | 3 (4.9%) |
| 65 to 74 Years | 6 (20.7%) | 1 (12.5%) |
| 75 Years and over | 22 (84.6%) | 1 (16.7%) |
Disability Class by Sex by Age in Linn Creek
Disability Class: Hearing Difficulty
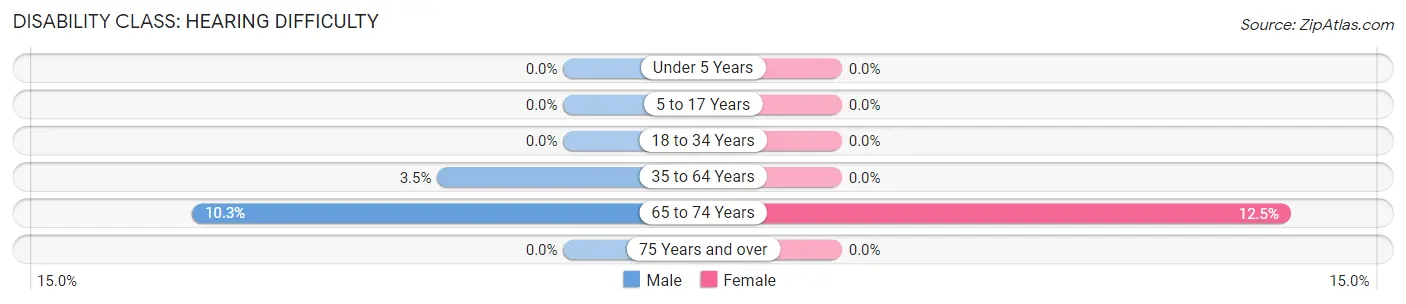
| Age Bracket | Male | Female |
| Under 5 Years | 0 (0.0%) | 0 (0.0%) |
| 5 to 17 Years | 0 (0.0%) | 0 (0.0%) |
| 18 to 34 Years | 0 (0.0%) | 0 (0.0%) |
| 35 to 64 Years | 2 (3.5%) | 0 (0.0%) |
| 65 to 74 Years | 3 (10.3%) | 1 (12.5%) |
| 75 Years and over | 0 (0.0%) | 0 (0.0%) |
Disability Class: Vision Difficulty
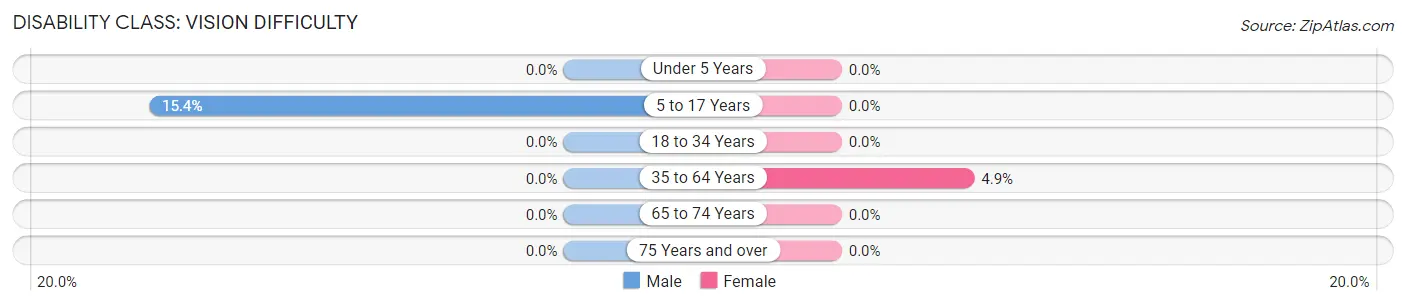
| Age Bracket | Male | Female |
| Under 5 Years | 0 (0.0%) | 0 (0.0%) |
| 5 to 17 Years | 2 (15.4%) | 0 (0.0%) |
| 18 to 34 Years | 0 (0.0%) | 0 (0.0%) |
| 35 to 64 Years | 0 (0.0%) | 3 (4.9%) |
| 65 to 74 Years | 0 (0.0%) | 0 (0.0%) |
| 75 Years and over | 0 (0.0%) | 0 (0.0%) |
Disability Class: Cognitive Difficulty
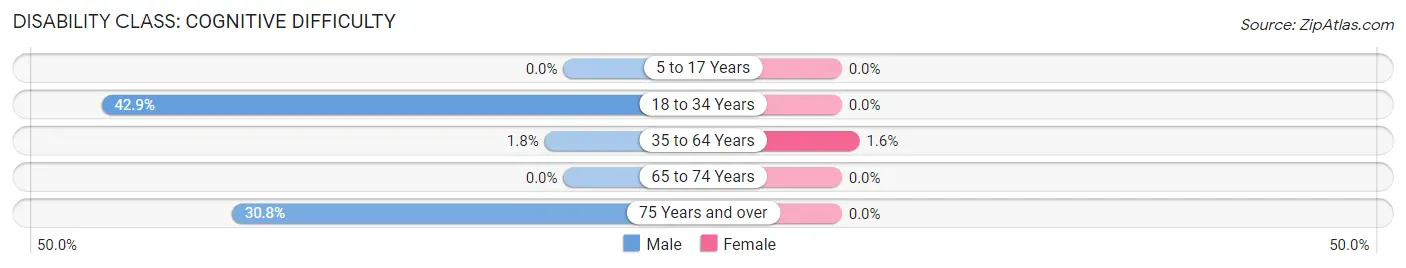
| Age Bracket | Male | Female |
| 5 to 17 Years | 0 (0.0%) | 0 (0.0%) |
| 18 to 34 Years | 3 (42.9%) | 0 (0.0%) |
| 35 to 64 Years | 1 (1.8%) | 1 (1.6%) |
| 65 to 74 Years | 0 (0.0%) | 0 (0.0%) |
| 75 Years and over | 8 (30.8%) | 0 (0.0%) |
Disability Class: Ambulatory Difficulty
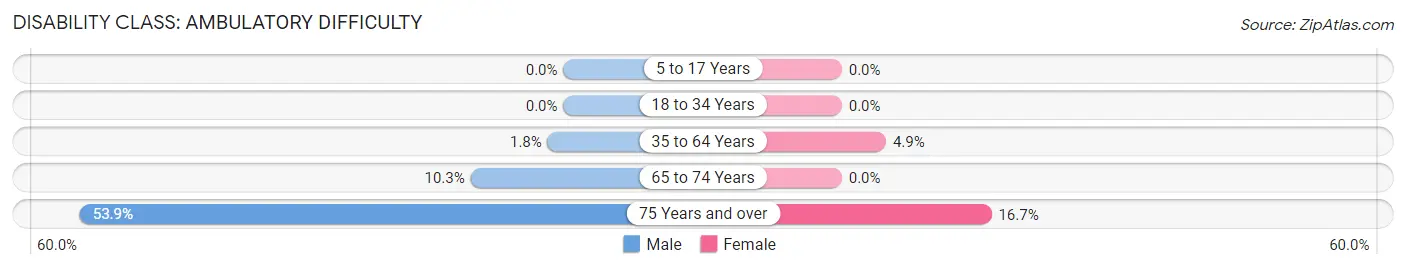
| Age Bracket | Male | Female |
| 5 to 17 Years | 0 (0.0%) | 0 (0.0%) |
| 18 to 34 Years | 0 (0.0%) | 0 (0.0%) |
| 35 to 64 Years | 1 (1.8%) | 3 (4.9%) |
| 65 to 74 Years | 3 (10.3%) | 0 (0.0%) |
| 75 Years and over | 14 (53.8%) | 1 (16.7%) |
Disability Class: Self-Care Difficulty
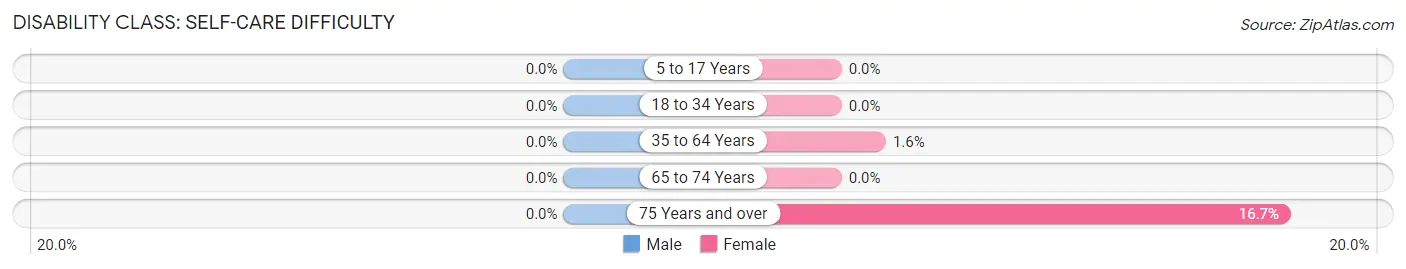
| Age Bracket | Male | Female |
| 5 to 17 Years | 0 (0.0%) | 0 (0.0%) |
| 18 to 34 Years | 0 (0.0%) | 0 (0.0%) |
| 35 to 64 Years | 0 (0.0%) | 1 (1.6%) |
| 65 to 74 Years | 0 (0.0%) | 0 (0.0%) |
| 75 Years and over | 0 (0.0%) | 1 (16.7%) |
Technology Access in Linn Creek
Computing Device Access in Linn Creek
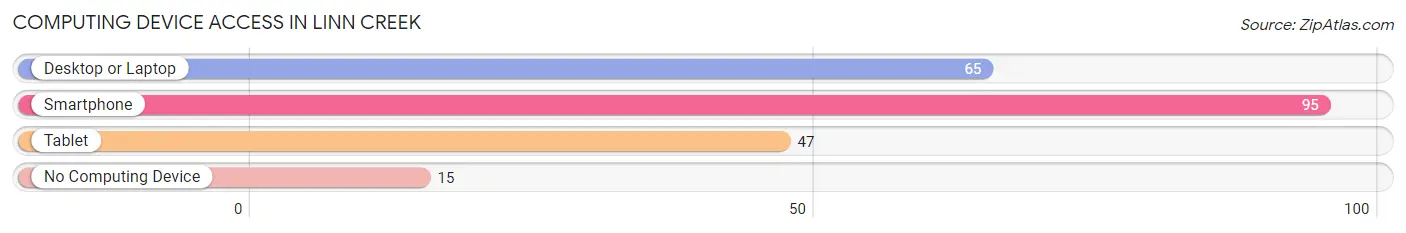
| Device Type | # Households | % Households |
| Desktop or Laptop | 65 | 56.0% |
| Smartphone | 95 | 81.9% |
| Tablet | 47 | 40.5% |
| No Computing Device | 15 | 12.9% |
| Total | 116 | 100.0% |
Internet Access in Linn Creek
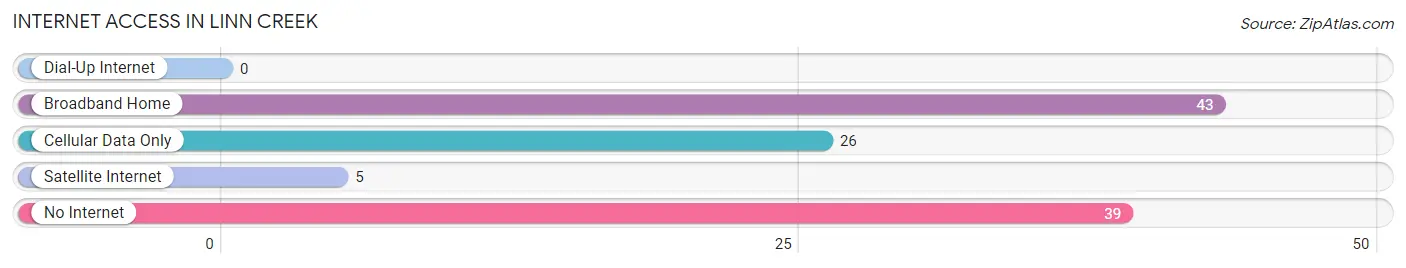
| Internet Type | # Households | % Households |
| Dial-Up Internet | 0 | 0.0% |
| Broadband Home | 43 | 37.1% |
| Cellular Data Only | 26 | 22.4% |
| Satellite Internet | 5 | 4.3% |
| No Internet | 39 | 33.6% |
| Total | 116 | 100.0% |
Linn Creek Summary
Linn Creek is a small city located in Camden County, Missouri. It is situated on the banks of the Lake of the Ozarks, and is home to a population of approximately 1,000 people. The city is known for its beautiful scenery, and is a popular destination for tourists and outdoor enthusiasts.
History
Linn Creek was founded in 1883 by William Linn, a local businessman. He purchased the land from the Osage Indians and named the town after himself. The town was originally a small farming community, but soon grew to become a popular tourist destination. In the early 1900s, the town was home to a number of resorts, including the Linn Creek Hotel and the Linn Creek Inn.
In the 1920s, the town began to experience a period of growth and development. The construction of the Bagnell Dam in 1929 created the Lake of the Ozarks, and the town quickly became a popular destination for tourists and outdoor enthusiasts. The town was incorporated in 1945, and has since grown to become a popular destination for vacationers and retirees.
Geography
Linn Creek is located in Camden County, Missouri. It is situated on the banks of the Lake of the Ozarks, and is surrounded by rolling hills and forests. The city is located approximately 30 miles south of Jefferson City, the state capital. The nearest major cities are St. Louis, Kansas City, and Springfield.
The climate in Linn Creek is humid subtropical, with hot, humid summers and mild winters. The average annual temperature is around 60 degrees Fahrenheit, and the average annual precipitation is around 40 inches.
Economy
The economy of Linn Creek is largely based on tourism and outdoor recreation. The city is home to a number of resorts, marinas, and campgrounds, and is a popular destination for fishing, boating, and other outdoor activities. The city is also home to a number of restaurants, bars, and shops, and is a popular destination for shopping and dining.
The city is also home to a number of manufacturing and industrial businesses, including a paper mill and a plastics factory. The city is also home to a number of small businesses, including retail stores, restaurants, and other service-based businesses.
Demographics
As of the 2010 census, the population of Linn Creek was 1,000. The racial makeup of the city was 97.2% White, 0.7% African American, 0.3% Native American, 0.2% Asian, 0.1% Pacific Islander, 0.2% from other races, and 1.3% from two or more races. Hispanic or Latino of any race were 1.3% of the population.
The median household income in Linn Creek was $37,500, and the median family income was $45,000. The per capita income in the city was $19,000. About 11.2% of families and 14.2% of the population were below the poverty line, including 18.2% of those under age 18 and 8.3% of those age 65 or over.
Common Questions
What is Per Capita Income in Linn Creek?
Per Capita income in Linn Creek is $27,009.
What is the Median Family Income in Linn Creek?
Median Family Income in Linn Creek is $63,646.
What is the Median Household income in Linn Creek?
Median Household Income in Linn Creek is $53,750.
What is Income or Wage Gap in Linn Creek?
Income or Wage Gap in Linn Creek is 47.2%.
Women in Linn Creek earn 52.8 cents for every dollar earned by a man.
What is Inequality or Gini Index in Linn Creek?
Inequality or Gini Index in Linn Creek is 0.39.
What is the Total Population of Linn Creek?
Total Population of Linn Creek is 247.
What is the Total Male Population of Linn Creek?
Total Male Population of Linn Creek is 140.
What is the Total Female Population of Linn Creek?
Total Female Population of Linn Creek is 107.
What is the Ratio of Males per 100 Females in Linn Creek?
There are 130.84 Males per 100 Females in Linn Creek.
What is the Ratio of Females per 100 Males in Linn Creek?
There are 76.43 Females per 100 Males in Linn Creek.
What is the Median Population Age in Linn Creek?
Median Population Age in Linn Creek is 48.9 Years.
What is the Average Family Size in Linn Creek
Average Family Size in Linn Creek is 3.2 People.
What is the Average Household Size in Linn Creek
Average Household Size in Linn Creek is 2.1 People.
How Large is the Labor Force in Linn Creek?
There are 138 People in the Labor Forcein in Linn Creek.
What is the Percentage of People in the Labor Force in Linn Creek?
65.4% of People are in the Labor Force in Linn Creek.
What is the Unemployment Rate in Linn Creek?
Unemployment Rate in Linn Creek is 8.0%.