Horine, MO Map & Demographics
Horine Map
Horine Overview
$20,520
PER CAPITA INCOME
$49,514
AVG FAMILY INCOME
$44,265
AVG HOUSEHOLD INCOME
54.4%
WAGE / INCOME GAP [ % ]
45.6¢/ $1
WAGE / INCOME GAP [ $ ]
0.39
INEQUALITY / GINI INDEX
945
TOTAL POPULATION
470
MALE POPULATION
475
FEMALE POPULATION
98.95
MALES / 100 FEMALES
101.06
FEMALES / 100 MALES
32.5
MEDIAN AGE
3.4
AVG FAMILY SIZE
2.9
AVG HOUSEHOLD SIZE
379
LABOR FORCE [ PEOPLE ]
49.2%
PERCENT IN LABOR FORCE
11.9%
UNEMPLOYMENT RATE
Income in Horine
Income Overview in Horine
Per Capita Income in Horine is $20,520, while median incomes of families and households are $49,514 and $44,265 respectively.
| Characteristic | Number | Measure |
| Per Capita Income | 945 | $20,520 |
| Median Family Income | 258 | $49,514 |
| Mean Family Income | 258 | $64,920 |
| Median Household Income | 326 | $44,265 |
| Mean Household Income | 326 | $55,784 |
| Income Deficit | 258 | $0 |
| Wage / Income Gap (%) | 945 | 54.44% |
| Wage / Income Gap ($) | 945 | 45.56¢ per $1 |
| Gini / Inequality Index | 945 | 0.39 |
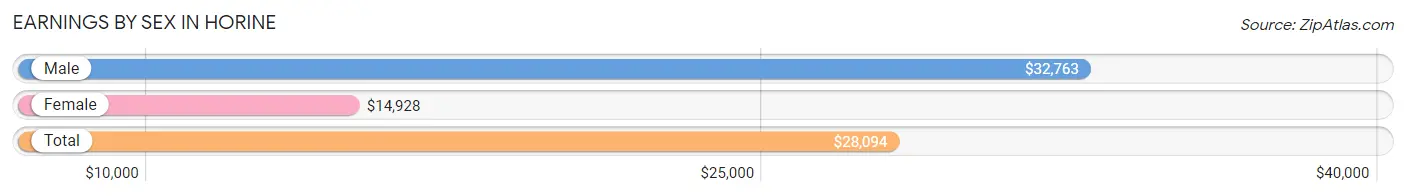
Earnings by Sex in Horine
Average Earnings in Horine are $28,094, $32,763 for men and $14,928 for women, a difference of 54.4%.
| Sex | Number | Average Earnings |
| Male | 246 (64.9%) | $32,763 |
| Female | 133 (35.1%) | $14,928 |
| Total | 379 (100.0%) | $28,094 |
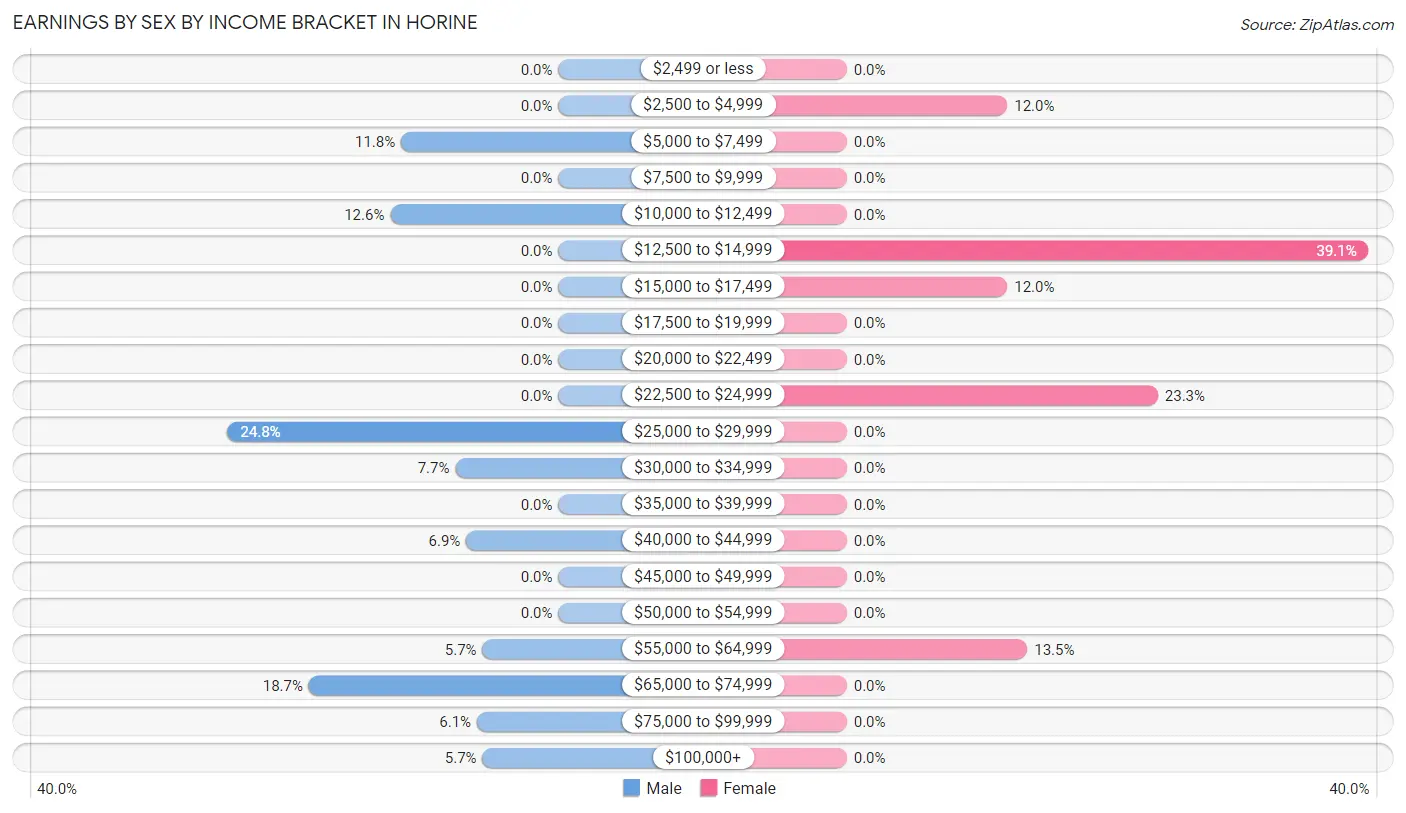
Earnings by Sex by Income Bracket in Horine
The most common earnings brackets in Horine are $25,000 to $29,999 for men (61 | 24.8%) and $12,500 to $14,999 for women (52 | 39.1%).
| Income | Male | Female |
| $2,499 or less | 0 (0.0%) | 0 (0.0%) |
| $2,500 to $4,999 | 0 (0.0%) | 16 (12.0%) |
| $5,000 to $7,499 | 29 (11.8%) | 0 (0.0%) |
| $7,500 to $9,999 | 0 (0.0%) | 0 (0.0%) |
| $10,000 to $12,499 | 31 (12.6%) | 0 (0.0%) |
| $12,500 to $14,999 | 0 (0.0%) | 52 (39.1%) |
| $15,000 to $17,499 | 0 (0.0%) | 16 (12.0%) |
| $17,500 to $19,999 | 0 (0.0%) | 0 (0.0%) |
| $20,000 to $22,499 | 0 (0.0%) | 0 (0.0%) |
| $22,500 to $24,999 | 0 (0.0%) | 31 (23.3%) |
| $25,000 to $29,999 | 61 (24.8%) | 0 (0.0%) |
| $30,000 to $34,999 | 19 (7.7%) | 0 (0.0%) |
| $35,000 to $39,999 | 0 (0.0%) | 0 (0.0%) |
| $40,000 to $44,999 | 17 (6.9%) | 0 (0.0%) |
| $45,000 to $49,999 | 0 (0.0%) | 0 (0.0%) |
| $50,000 to $54,999 | 0 (0.0%) | 0 (0.0%) |
| $55,000 to $64,999 | 14 (5.7%) | 18 (13.5%) |
| $65,000 to $74,999 | 46 (18.7%) | 0 (0.0%) |
| $75,000 to $99,999 | 15 (6.1%) | 0 (0.0%) |
| $100,000+ | 14 (5.7%) | 0 (0.0%) |
| Total | 246 (100.0%) | 133 (100.0%) |
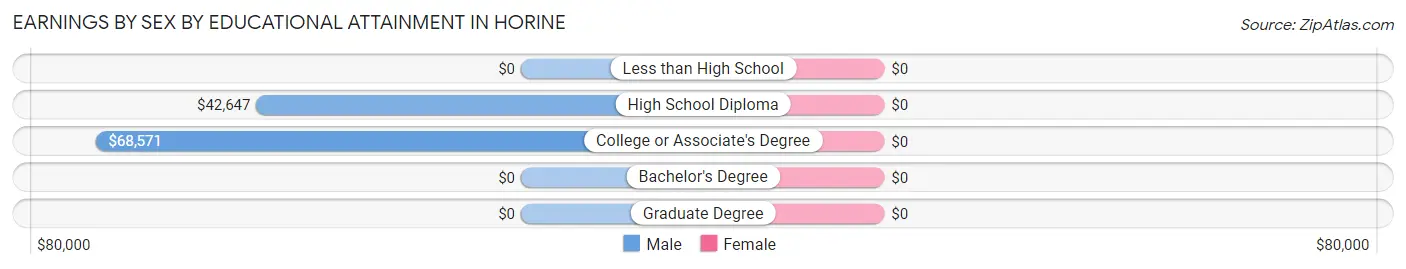
Earnings by Sex by Educational Attainment in Horine
| Educational Attainment | Male Income | Female Income |
| Less than High School | - | - |
| High School Diploma | $42,647 | $0 |
| College or Associate's Degree | $68,571 | $0 |
| Bachelor's Degree | - | - |
| Graduate Degree | - | - |
| Total | $44,412 | $0 |
Family Income in Horine
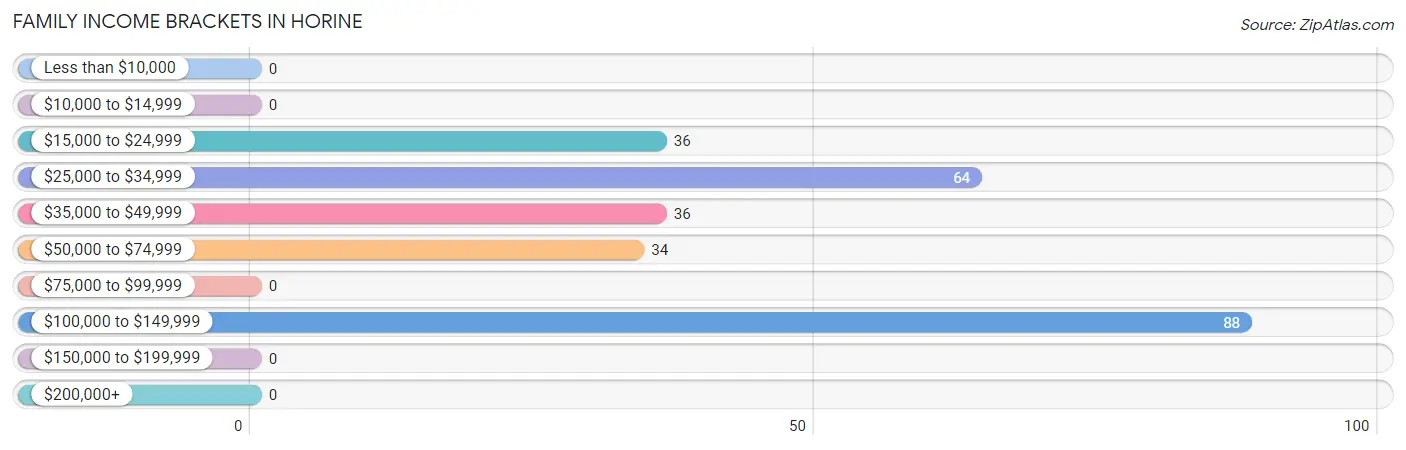
Family Income Brackets in Horine
According to the Horine family income data, there are 88 families falling into the $100,000 to $149,999 income range, which is the most common income bracket and makes up 34.1% of all families.
| Income Bracket | # Families | % Families |
| Less than $10,000 | 0 | 0.0% |
| $10,000 to $14,999 | 0 | 0.0% |
| $15,000 to $24,999 | 36 | 14.0% |
| $25,000 to $34,999 | 64 | 24.8% |
| $35,000 to $49,999 | 36 | 14.0% |
| $50,000 to $74,999 | 34 | 13.2% |
| $75,000 to $99,999 | 0 | 0.0% |
| $100,000 to $149,999 | 88 | 34.1% |
| $150,000 to $199,999 | 0 | 0.0% |
| $200,000+ | 0 | 0.0% |
Family Income by Famaliy Size in Horine
| Income Bracket | # Families | Median Income |
| 2-Person Families | 158 (61.2%) | $0 |
| 3-Person Families | 34 (13.2%) | $0 |
| 4-Person Families | 23 (8.9%) | $0 |
| 5-Person Families | 15 (5.8%) | $0 |
| 6-Person Families | 0 (0.0%) | $0 |
| 7+ Person Families | 28 (10.8%) | $0 |
| Total | 258 (100.0%) | $49,514 |
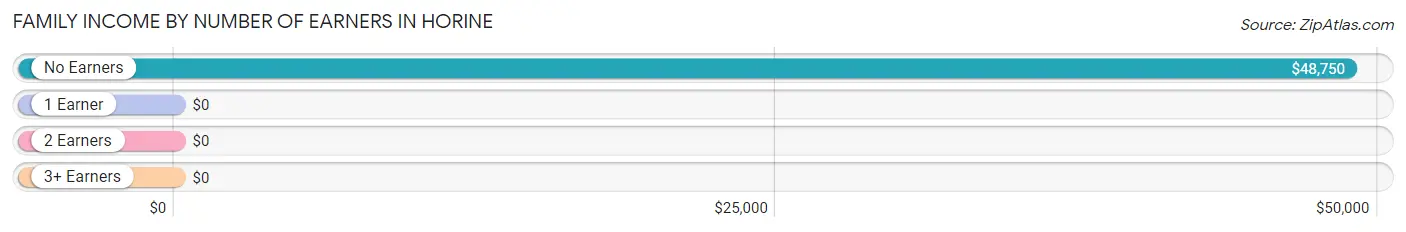
Family Income by Number of Earners in Horine
| Number of Earners | # Families | Median Income |
| No Earners | 76 (29.5%) | $48,750 |
| 1 Earner | 118 (45.7%) | $0 |
| 2 Earners | 18 (7.0%) | $0 |
| 3+ Earners | 46 (17.8%) | $0 |
| Total | 258 (100.0%) | $49,514 |
Household Income in Horine
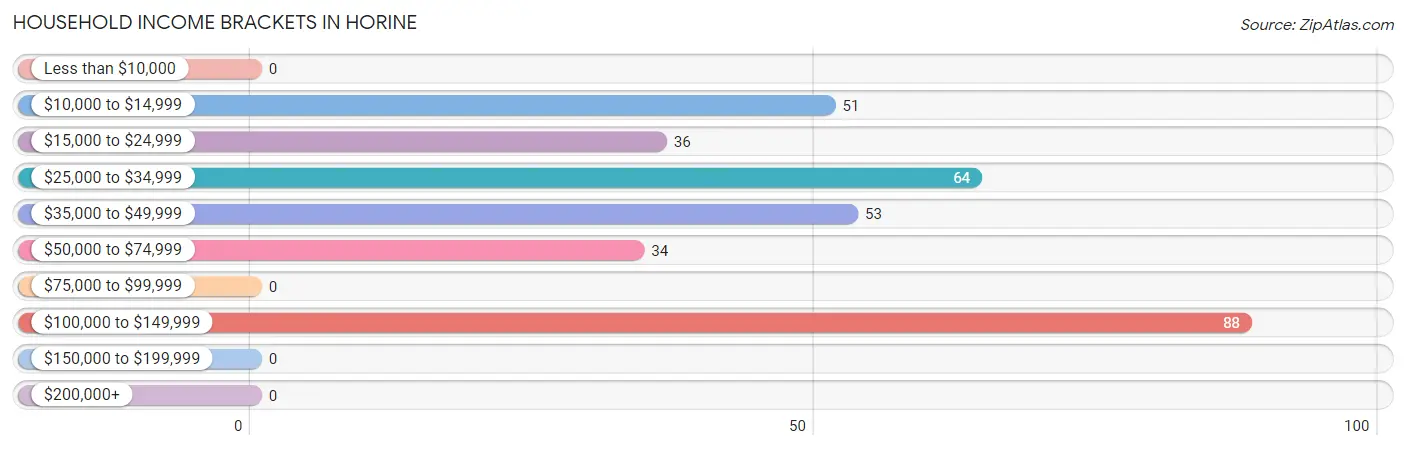
Household Income Brackets in Horine
With 88 households falling in the category, the $100,000 to $149,999 income range is the most frequent in Horine, accounting for 27.0% of all households.
| Income Bracket | # Households | % Households |
| Less than $10,000 | 0 | 0.0% |
| $10,000 to $14,999 | 51 | 15.6% |
| $15,000 to $24,999 | 36 | 11.0% |
| $25,000 to $34,999 | 64 | 19.6% |
| $35,000 to $49,999 | 53 | 16.3% |
| $50,000 to $74,999 | 34 | 10.4% |
| $75,000 to $99,999 | 0 | 0.0% |
| $100,000 to $149,999 | 88 | 27.0% |
| $150,000 to $199,999 | 0 | 0.0% |
| $200,000+ | 0 | 0.0% |
Household Income by Householder Age in Horine
The median household income in Horine is $44,265, with the highest median household income of $115,580 found in the 25 to 44 years age bracket for the primary householder. A total of 73 households (22.4%) fall into this category. Meanwhile, the 15 to 24 years age bracket for the primary householder has the lowest median household income of $0, with 64 households (19.6%) in this group.
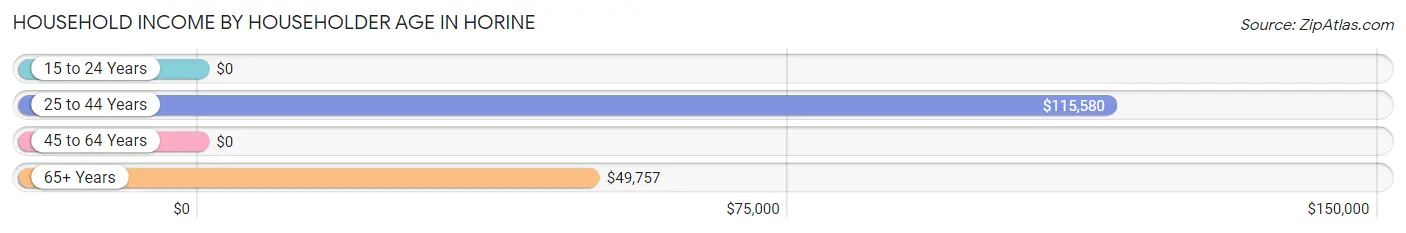
| Income Bracket | # Households | Median Income |
| 15 to 24 Years | 64 (19.6%) | $0 |
| 25 to 44 Years | 73 (22.4%) | $115,580 |
| 45 to 64 Years | 124 (38.0%) | $0 |
| 65+ Years | 65 (19.9%) | $49,757 |
| Total | 326 (100.0%) | $44,265 |
Poverty in Horine
Income Below Poverty by Sex and Age in Horine
With 14.5% poverty level for males and 16.4% for females among the residents of Horine, 55 to 64 year old males and 12 to 14 year old females are the most vulnerable to poverty, with 51 males (73.9%) and 16 females (100.0%) in their respective age groups living below the poverty level.
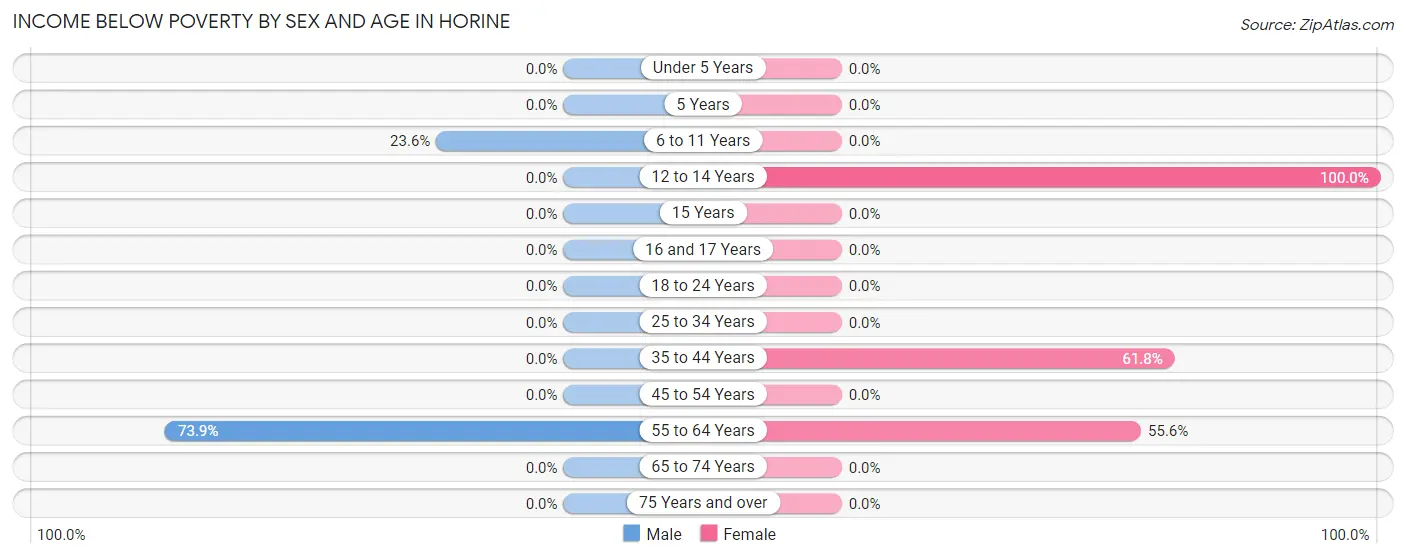
| Age Bracket | Male | Female |
| Under 5 Years | 0 (0.0%) | 0 (0.0%) |
| 5 Years | 0 (0.0%) | 0 (0.0%) |
| 6 to 11 Years | 17 (23.6%) | 0 (0.0%) |
| 12 to 14 Years | 0 (0.0%) | 16 (100.0%) |
| 15 Years | 0 (0.0%) | 0 (0.0%) |
| 16 and 17 Years | 0 (0.0%) | 0 (0.0%) |
| 18 to 24 Years | 0 (0.0%) | 0 (0.0%) |
| 25 to 34 Years | 0 (0.0%) | 0 (0.0%) |
| 35 to 44 Years | 0 (0.0%) | 42 (61.8%) |
| 45 to 54 Years | 0 (0.0%) | 0 (0.0%) |
| 55 to 64 Years | 51 (73.9%) | 20 (55.6%) |
| 65 to 74 Years | 0 (0.0%) | 0 (0.0%) |
| 75 Years and over | 0 (0.0%) | 0 (0.0%) |
| Total | 68 (14.5%) | 78 (16.4%) |
Income Above Poverty by Sex and Age in Horine
According to the poverty statistics in Horine, males aged under 5 years and females aged under 5 years are the age groups that are most secure financially, with 100.0% of males and 100.0% of females in these age groups living above the poverty line.
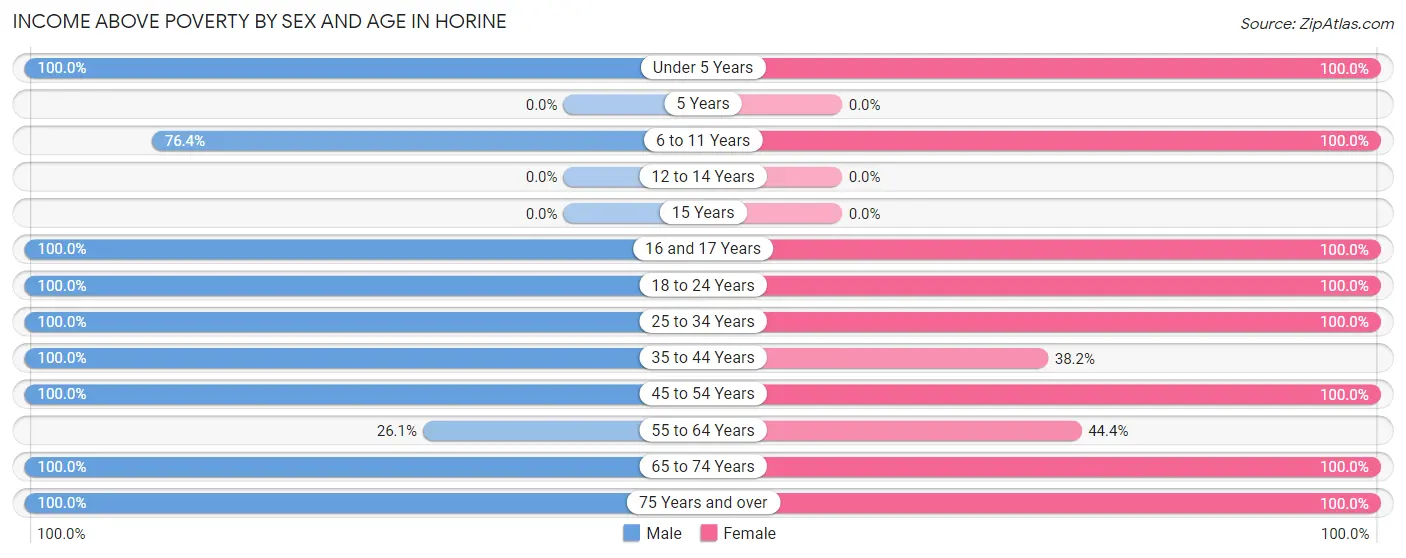
| Age Bracket | Male | Female |
| Under 5 Years | 16 (100.0%) | 16 (100.0%) |
| 5 Years | 0 (0.0%) | 0 (0.0%) |
| 6 to 11 Years | 55 (76.4%) | 55 (100.0%) |
| 12 to 14 Years | 0 (0.0%) | 0 (0.0%) |
| 15 Years | 0 (0.0%) | 0 (0.0%) |
| 16 and 17 Years | 31 (100.0%) | 21 (100.0%) |
| 18 to 24 Years | 29 (100.0%) | 147 (100.0%) |
| 25 to 34 Years | 90 (100.0%) | 14 (100.0%) |
| 35 to 44 Years | 42 (100.0%) | 26 (38.2%) |
| 45 to 54 Years | 36 (100.0%) | 18 (100.0%) |
| 55 to 64 Years | 18 (26.1%) | 16 (44.4%) |
| 65 to 74 Years | 45 (100.0%) | 30 (100.0%) |
| 75 Years and over | 40 (100.0%) | 54 (100.0%) |
| Total | 402 (85.5%) | 397 (83.6%) |
Income Below Poverty Among Married-Couple Families in Horine
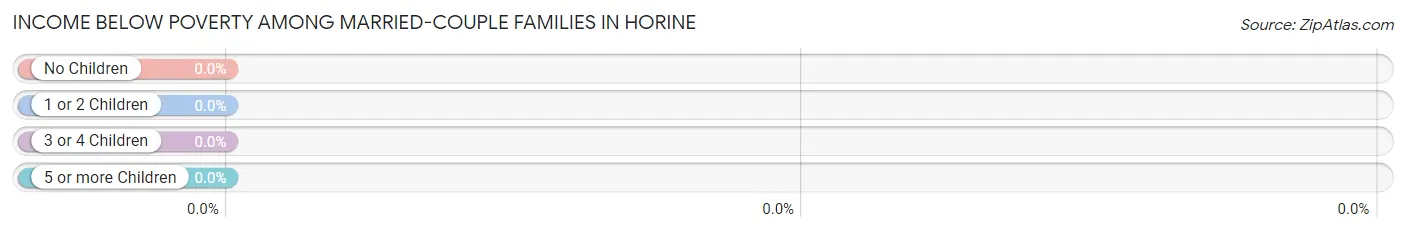
| Children | Above Poverty | Below Poverty |
| No Children | 156 (100.0%) | 0 (0.0%) |
| 1 or 2 Children | 23 (100.0%) | 0 (0.0%) |
| 3 or 4 Children | 0 (0.0%) | 0 (0.0%) |
| 5 or more Children | 28 (100.0%) | 0 (0.0%) |
| Total | 207 (100.0%) | 0 (0.0%) |
Income Below Poverty Among Single-Parent Households in Horine
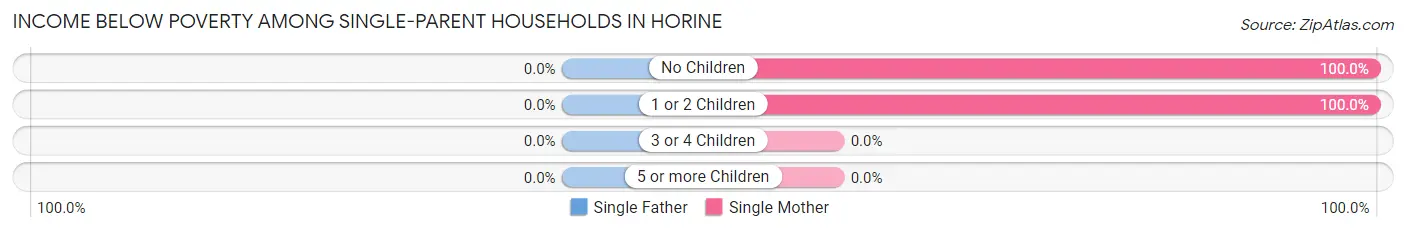
| Children | Single Father | Single Mother |
| No Children | 0 (0.0%) | 20 (100.0%) |
| 1 or 2 Children | 0 (0.0%) | 16 (100.0%) |
| 3 or 4 Children | 0 (0.0%) | 0 (0.0%) |
| 5 or more Children | 0 (0.0%) | 0 (0.0%) |
| Total | 0 (0.0%) | 36 (100.0%) |
Income Below Poverty Among Married-Couple vs Single-Parent Households in Horine
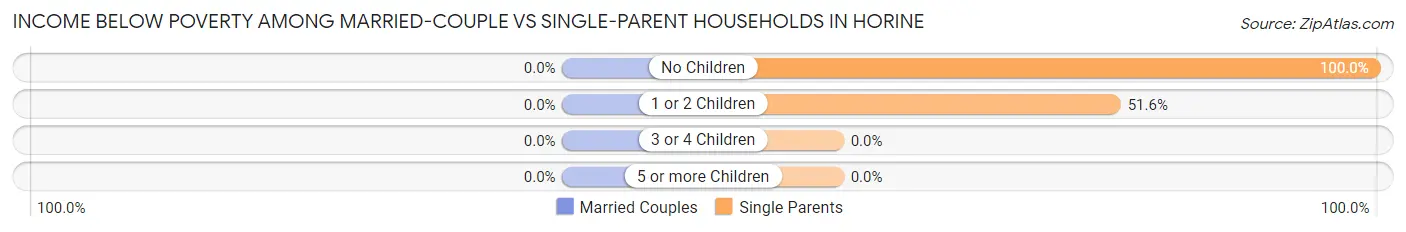
| Children | Married-Couple Families | Single-Parent Households |
| No Children | 0 (0.0%) | 20 (100.0%) |
| 1 or 2 Children | 0 (0.0%) | 16 (51.6%) |
| 3 or 4 Children | 0 (0.0%) | 0 (0.0%) |
| 5 or more Children | 0 (0.0%) | 0 (0.0%) |
| Total | 0 (0.0%) | 36 (70.6%) |
Race in Horine
The most populous races in Horine are White / Caucasian (896 | 94.8%), and Some other Race (49 | 5.2%).
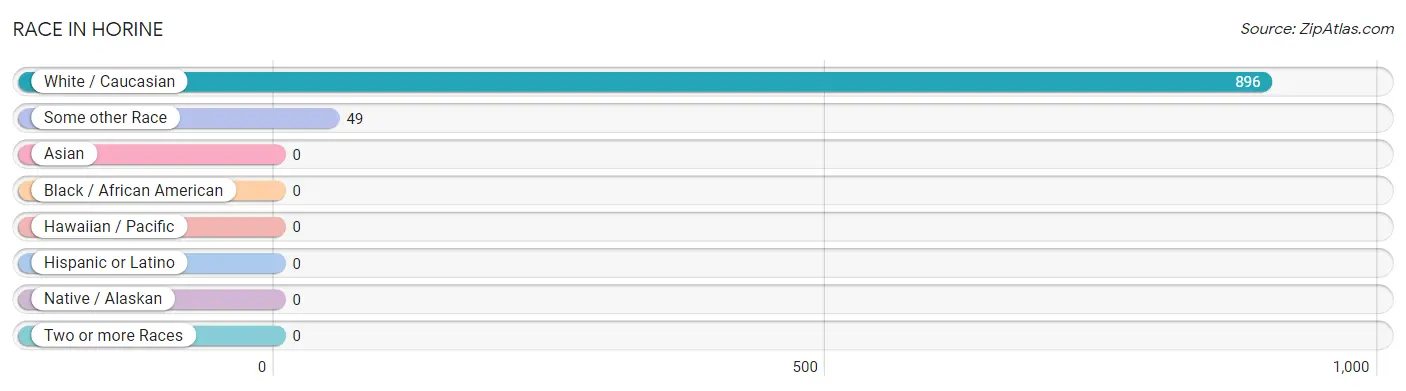
| Race | # Population | % Population |
| Asian | 0 | 0.0% |
| Black / African American | 0 | 0.0% |
| Hawaiian / Pacific | 0 | 0.0% |
| Hispanic or Latino | 0 | 0.0% |
| Native / Alaskan | 0 | 0.0% |
| White / Caucasian | 896 | 94.8% |
| Two or more Races | 0 | 0.0% |
| Some other Race | 49 | 5.2% |
| Total | 945 | 100.0% |
Ancestry in Horine
The most populous ancestries reported in Horine are European (279 | 29.5%), Irish (83 | 8.8%), American (53 | 5.6%), German (52 | 5.5%), and English (51 | 5.4%), together accounting for 54.8% of all Horine residents.
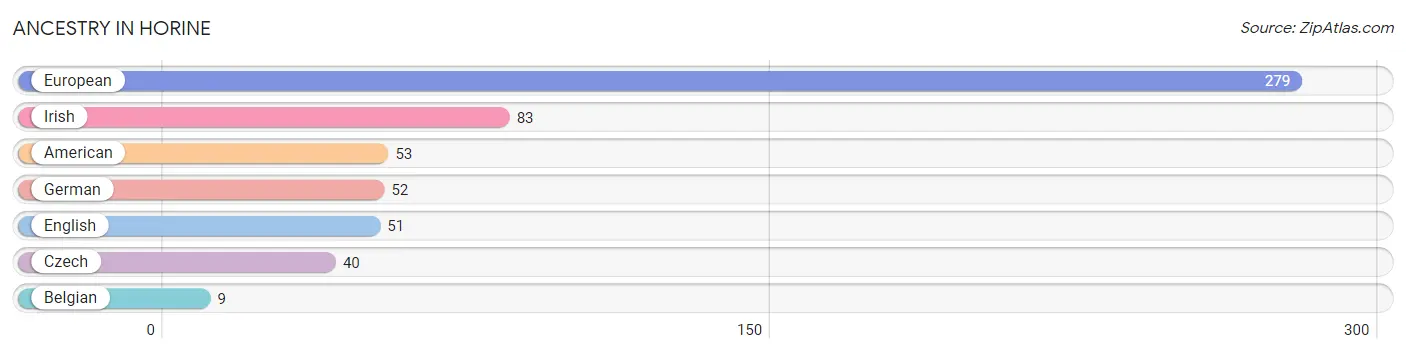
| Ancestry | # Population | % Population |
| American | 53 | 5.6% |
| Belgian | 9 | 0.9% |
| Czech | 40 | 4.2% |
| English | 51 | 5.4% |
| European | 279 | 29.5% |
| German | 52 | 5.5% |
| Irish | 83 | 8.8% | View All 7 Rows |
Immigrants in Horine

| Immigration Origin | # Population | % Population | View All 0 Rows |
Sex and Age in Horine
Sex and Age in Horine
The most populous age groups in Horine are 30 to 34 Years (76 | 16.2%) for men and 20 to 24 Years (95 | 20.0%) for women.
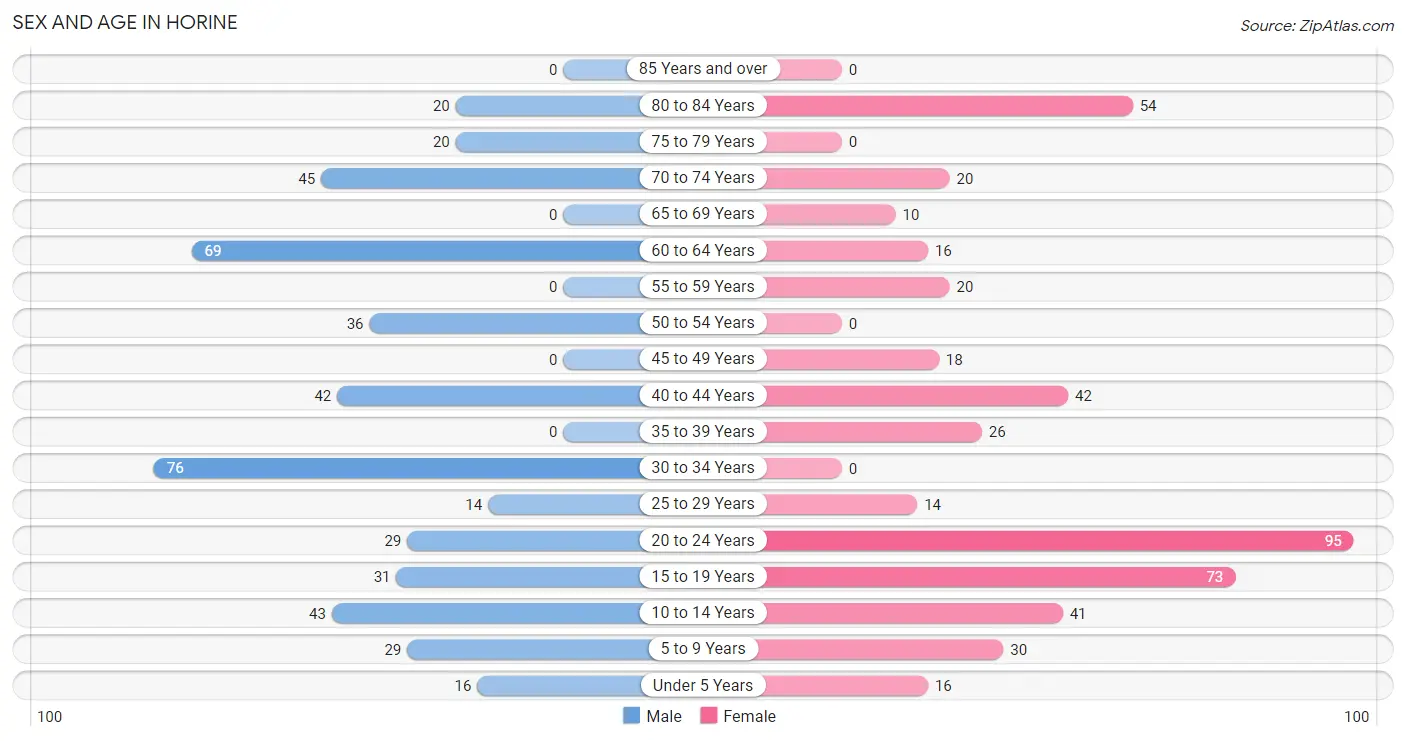
| Age Bracket | Male | Female |
| Under 5 Years | 16 (3.4%) | 16 (3.4%) |
| 5 to 9 Years | 29 (6.2%) | 30 (6.3%) |
| 10 to 14 Years | 43 (9.1%) | 41 (8.6%) |
| 15 to 19 Years | 31 (6.6%) | 73 (15.4%) |
| 20 to 24 Years | 29 (6.2%) | 95 (20.0%) |
| 25 to 29 Years | 14 (3.0%) | 14 (2.9%) |
| 30 to 34 Years | 76 (16.2%) | 0 (0.0%) |
| 35 to 39 Years | 0 (0.0%) | 26 (5.5%) |
| 40 to 44 Years | 42 (8.9%) | 42 (8.8%) |
| 45 to 49 Years | 0 (0.0%) | 18 (3.8%) |
| 50 to 54 Years | 36 (7.7%) | 0 (0.0%) |
| 55 to 59 Years | 0 (0.0%) | 20 (4.2%) |
| 60 to 64 Years | 69 (14.7%) | 16 (3.4%) |
| 65 to 69 Years | 0 (0.0%) | 10 (2.1%) |
| 70 to 74 Years | 45 (9.6%) | 20 (4.2%) |
| 75 to 79 Years | 20 (4.3%) | 0 (0.0%) |
| 80 to 84 Years | 20 (4.3%) | 54 (11.4%) |
| 85 Years and over | 0 (0.0%) | 0 (0.0%) |
| Total | 470 (100.0%) | 475 (100.0%) |
Families and Households in Horine
Median Family Size in Horine
The median family size in Horine is 3.40 persons per family, with single male/father families (15 | 5.8%) accounting for the largest median family size of 5.67 persons per family. On the other hand, single female/mother families (36 | 14.0%) represent the smallest median family size with 2.64 persons per family.
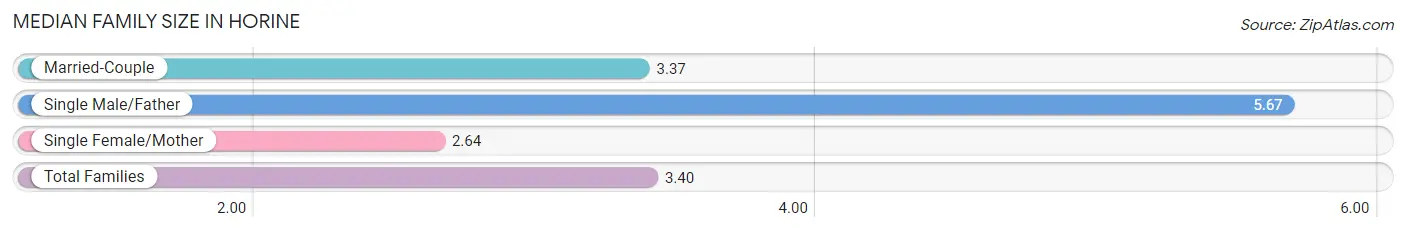
| Family Type | # Families | Family Size |
| Married-Couple | 207 (80.2%) | 3.37 |
| Single Male/Father | 15 (5.8%) | 5.67 |
| Single Female/Mother | 36 (14.0%) | 2.64 |
| Total Families | 258 (100.0%) | 3.40 |
Median Household Size in Horine
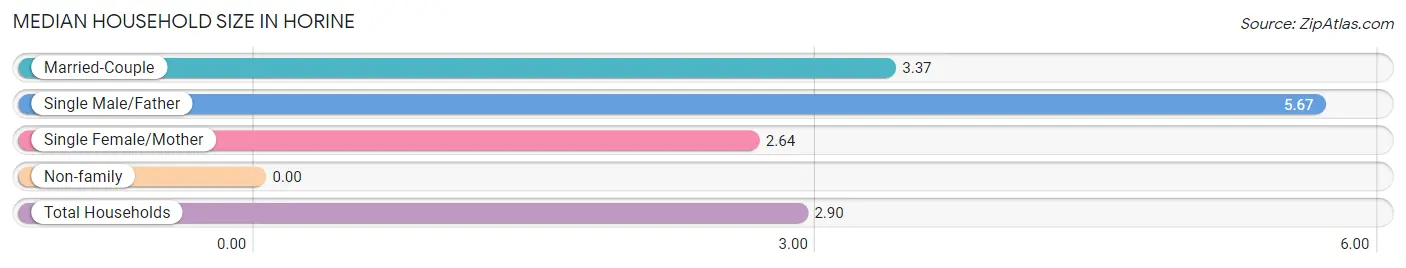
| Household Type | # Households | Household Size |
| Married-Couple | 207 (63.5%) | 3.37 |
| Single Male/Father | 15 (4.6%) | 5.67 |
| Single Female/Mother | 36 (11.0%) | 2.64 |
| Non-family | 68 (20.9%) | - |
| Total Households | 326 (100.0%) | 2.90 |
Household Size by Marriage Status in Horine
Out of a total of 326 households in Horine, 258 (79.1%) are family households, while 68 (20.9%) are nonfamily households. The most numerous type of family households are 2-person households, comprising 158, and the most common type of nonfamily households are 1-person households, comprising 68.
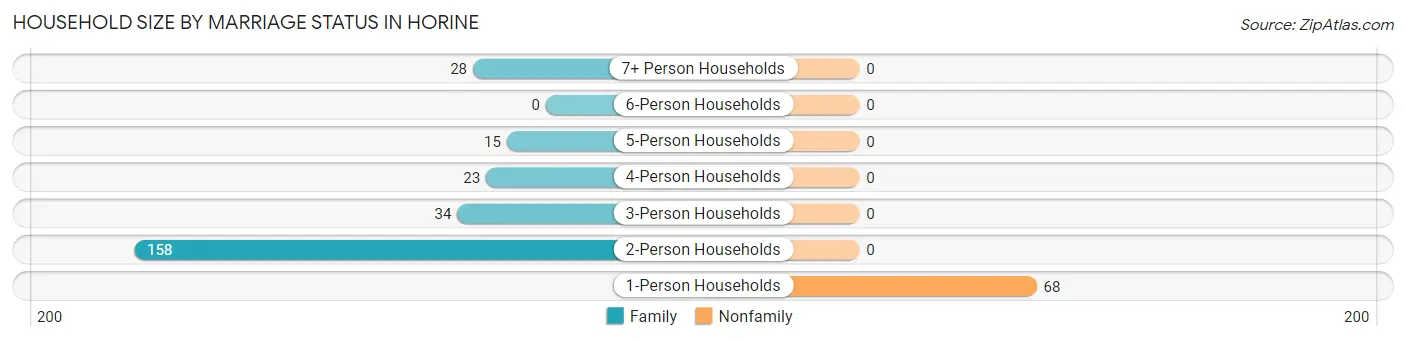
| Household Size | Family Households | Nonfamily Households |
| 1-Person Households | - | 68 (20.9%) |
| 2-Person Households | 158 (48.5%) | 0 (0.0%) |
| 3-Person Households | 34 (10.4%) | 0 (0.0%) |
| 4-Person Households | 23 (7.1%) | 0 (0.0%) |
| 5-Person Households | 15 (4.6%) | 0 (0.0%) |
| 6-Person Households | 0 (0.0%) | 0 (0.0%) |
| 7+ Person Households | 28 (8.6%) | 0 (0.0%) |
| Total | 258 (79.1%) | 68 (20.9%) |
Female Fertility in Horine
Fertility by Age in Horine
Average fertility rate in Horine is 52.0 births per 1,000 women. Women in the age bracket of 20 to 34 years have the highest fertility rate with 128.0 births per 1,000 women. Women in the age bracket of 20 to 34 years acount for 100.0% of all women with births.
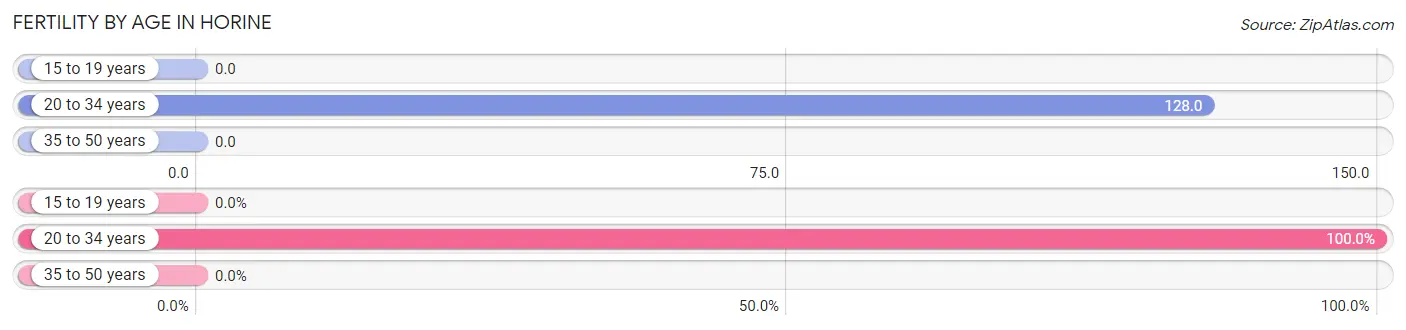
| Age Bracket | Women with Births | Births / 1,000 Women |
| 15 to 19 years | 0 (0.0%) | 0.0 |
| 20 to 34 years | 14 (100.0%) | 128.0 |
| 35 to 50 years | 0 (0.0%) | 0.0 |
| Total | 14 (100.0%) | 52.0 |
Fertility by Age by Marriage Status in Horine
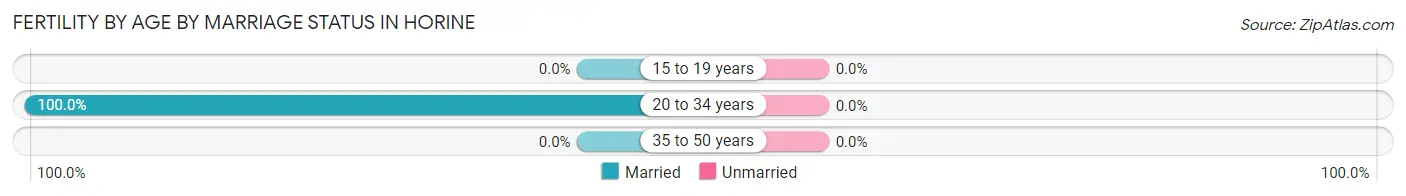
| Age Bracket | Married | Unmarried |
| 15 to 19 years | 0 (0.0%) | 0 (0.0%) |
| 20 to 34 years | 14 (100.0%) | 0 (0.0%) |
| 35 to 50 years | 0 (0.0%) | 0 (0.0%) |
| Total | 14 (100.0%) | 0 (0.0%) |
Fertility by Education in Horine
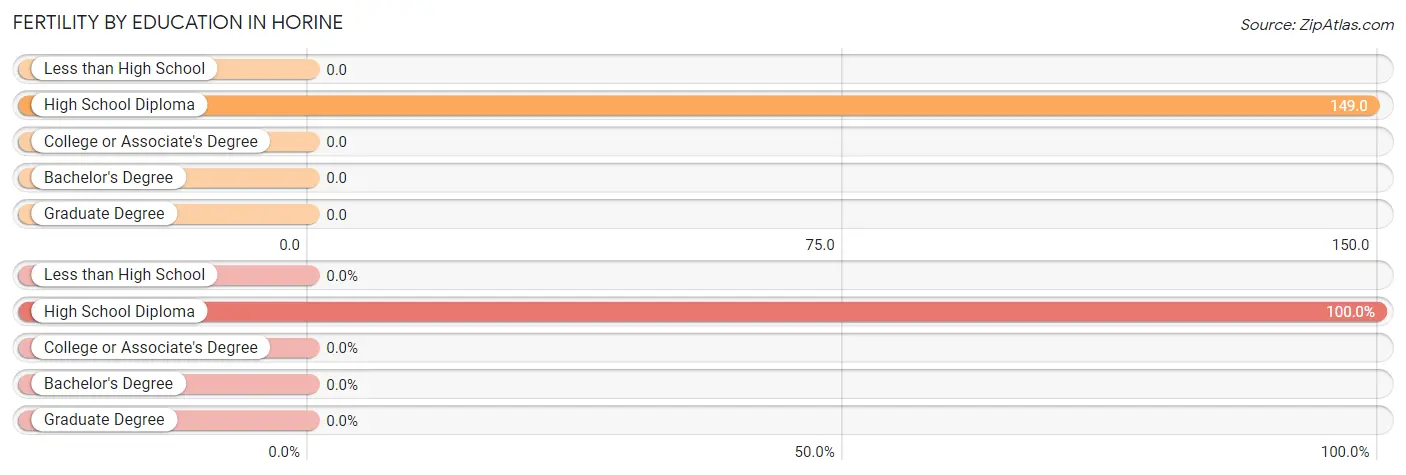
| Educational Attainment | Women with Births | Births / 1,000 Women |
| Less than High School | 0 (0.0%) | 0.0 |
| High School Diploma | 14 (100.0%) | 149.0 |
| College or Associate's Degree | 0 (0.0%) | 0.0 |
| Bachelor's Degree | 0 (0.0%) | 0.0 |
| Graduate Degree | 0 (0.0%) | 0.0 |
| Total | 14 (100.0%) | 52.0 |
Fertility by Education by Marriage Status in Horine
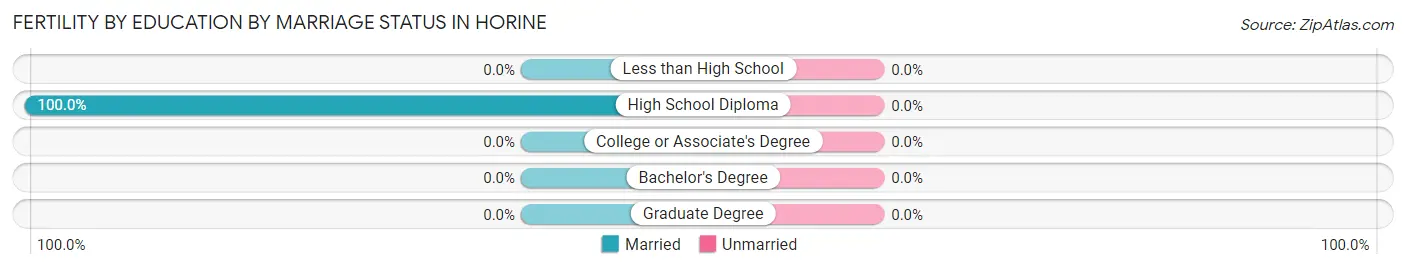
| Educational Attainment | Married | Unmarried |
| Less than High School | 0 (0.0%) | 0 (0.0%) |
| High School Diploma | 14 (100.0%) | 0 (0.0%) |
| College or Associate's Degree | 0 (0.0%) | 0 (0.0%) |
| Bachelor's Degree | 0 (0.0%) | 0 (0.0%) |
| Graduate Degree | 0 (0.0%) | 0 (0.0%) |
| Total | 14 (100.0%) | 0 (0.0%) |
Employment Characteristics in Horine
Employment by Class of Employer in Horine
Among the 334 employed individuals in Horine, private company employees (300 | 89.8%), and local government employees (34 | 10.2%) make up the most common classes of employment.
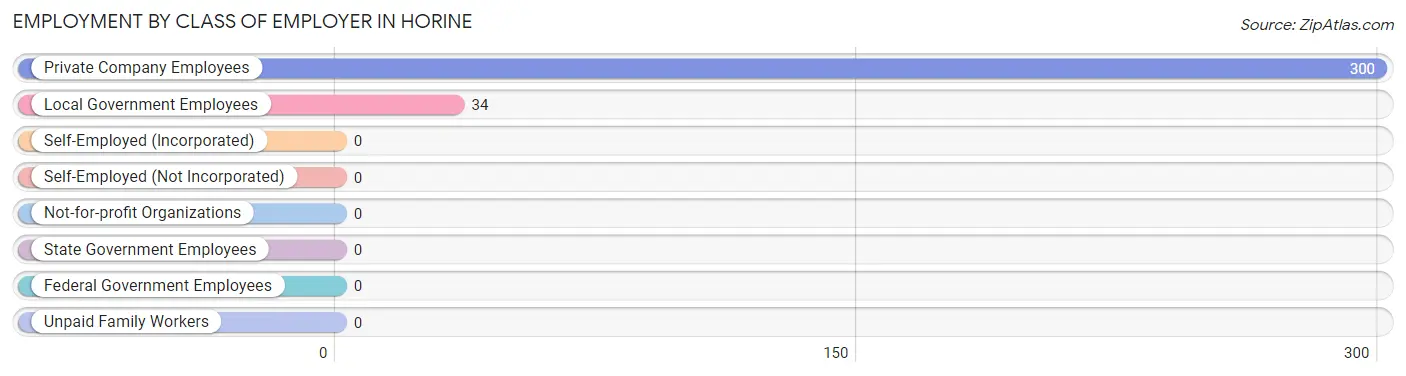
| Employer Class | # Employees | % Employees |
| Private Company Employees | 300 | 89.8% |
| Self-Employed (Incorporated) | 0 | 0.0% |
| Self-Employed (Not Incorporated) | 0 | 0.0% |
| Not-for-profit Organizations | 0 | 0.0% |
| Local Government Employees | 34 | 10.2% |
| State Government Employees | 0 | 0.0% |
| Federal Government Employees | 0 | 0.0% |
| Unpaid Family Workers | 0 | 0.0% |
| Total | 334 | 100.0% |
Employment Status by Age in Horine
According to the labor force statistics for Horine, out of the total population over 16 years of age (770), 49.2% or 379 individuals are in the labor force, with 11.9% or 45 of them unemployed. The age group with the highest labor force participation rate is 30 to 34 years, with 100.0% or 76 individuals in the labor force. Within the labor force, the 20 to 24 years age range has the highest percentage of unemployed individuals, with 48.3% or 29 of them being unemployed.
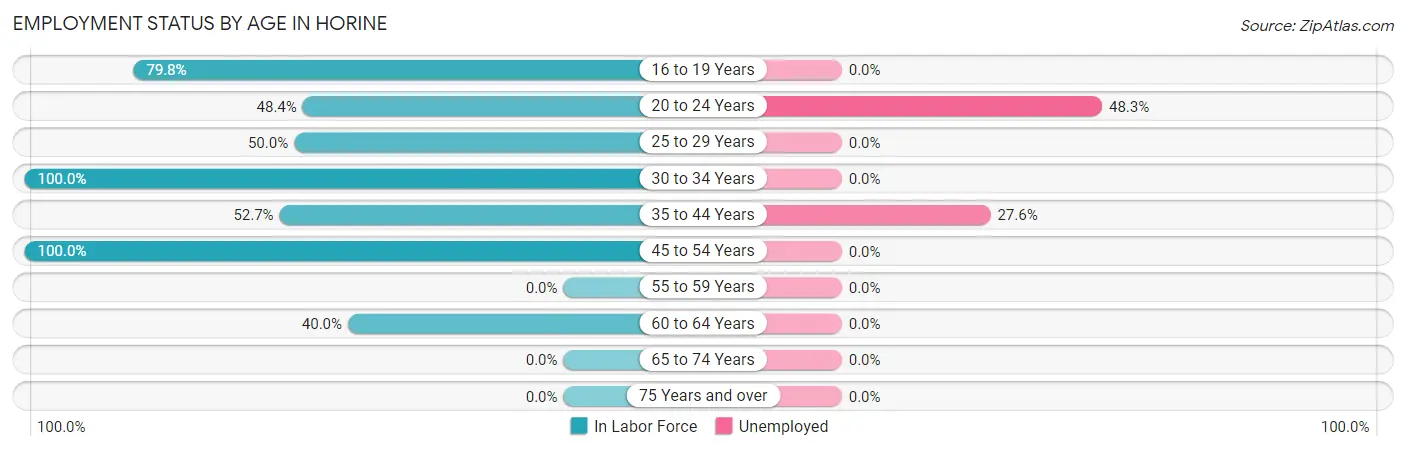
| Age Bracket | In Labor Force | Unemployed |
| 16 to 19 Years | 83 (79.8%) | 0 (0.0%) |
| 20 to 24 Years | 60 (48.4%) | 29 (48.3%) |
| 25 to 29 Years | 14 (50.0%) | 0 (0.0%) |
| 30 to 34 Years | 76 (100.0%) | 0 (0.0%) |
| 35 to 44 Years | 58 (52.7%) | 16 (27.6%) |
| 45 to 54 Years | 54 (100.0%) | 0 (0.0%) |
| 55 to 59 Years | 0 (0.0%) | 0 (0.0%) |
| 60 to 64 Years | 34 (40.0%) | 0 (0.0%) |
| 65 to 74 Years | 0 (0.0%) | 0 (0.0%) |
| 75 Years and over | 0 (0.0%) | 0 (0.0%) |
| Total | 379 (49.2%) | 45 (11.9%) |
Employment Status by Educational Attainment in Horine
According to labor force statistics for Horine, 63.3% of individuals (236) out of the total population between 25 and 64 years of age (373) are in the labor force, with 6.8% or 16 of them being unemployed. The group with the highest labor force participation rate are those with the educational attainment of high school diploma, with 80.5% or 140 individuals in the labor force. Within the labor force, individuals with high school diploma education have the highest percentage of unemployment, with 11.4% or 16 of them being unemployed.
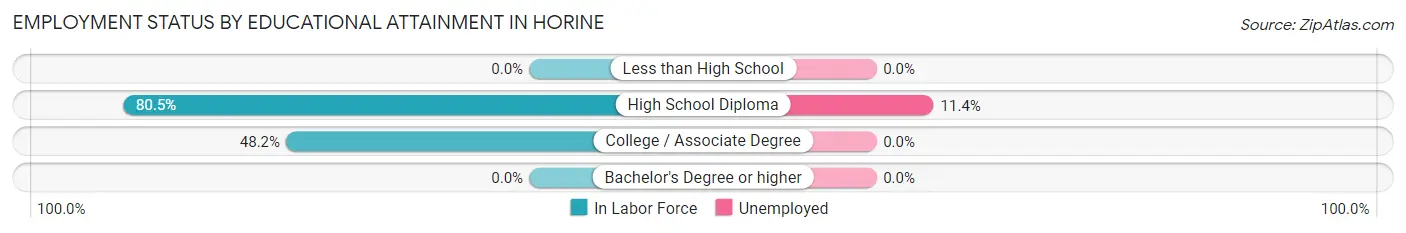
| Educational Attainment | In Labor Force | Unemployed |
| Less than High School | 0 (0.0%) | 0 (0.0%) |
| High School Diploma | 140 (80.5%) | 20 (11.4%) |
| College / Associate Degree | 96 (48.2%) | 0 (0.0%) |
| Bachelor's Degree or higher | 0 (0.0%) | 0 (0.0%) |
| Total | 236 (63.3%) | 25 (6.8%) |
Employment Occupations by Sex in Horine
Management, Business, Science and Arts Occupations
The most common Management, Business, Science and Arts occupations in Horine are Computers, Engineering & Science (29 | 8.7%), Computers & Mathematics (15 | 4.5%), and Architecture & Engineering (14 | 4.2%).
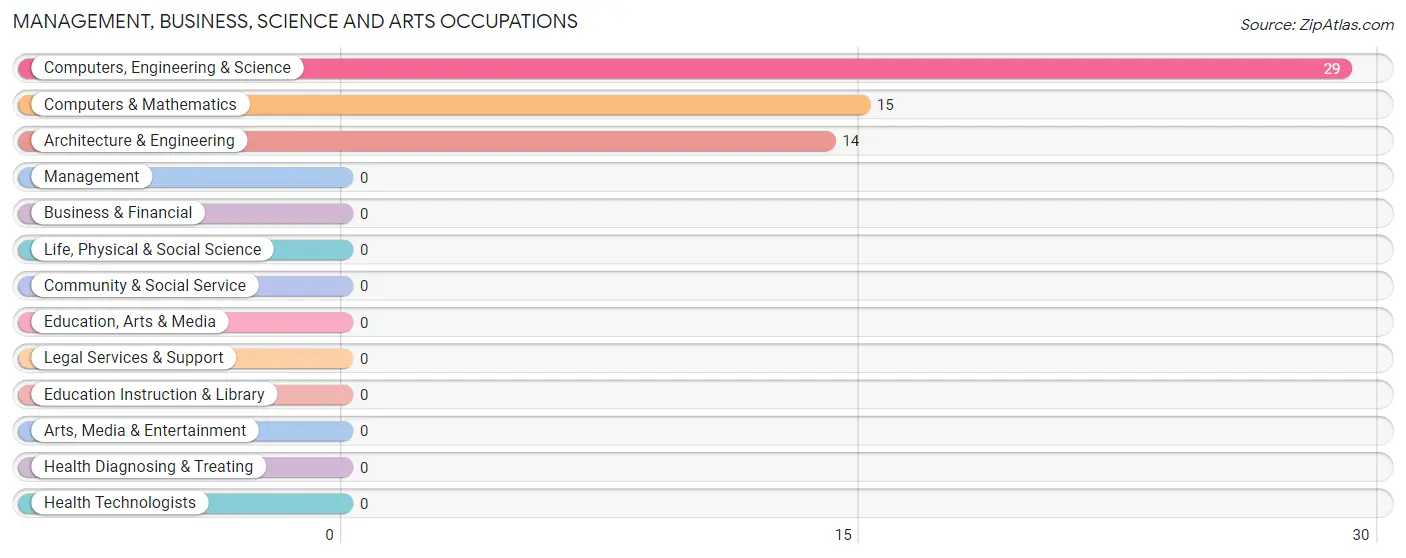
Management, Business, Science and Arts Occupations by Sex
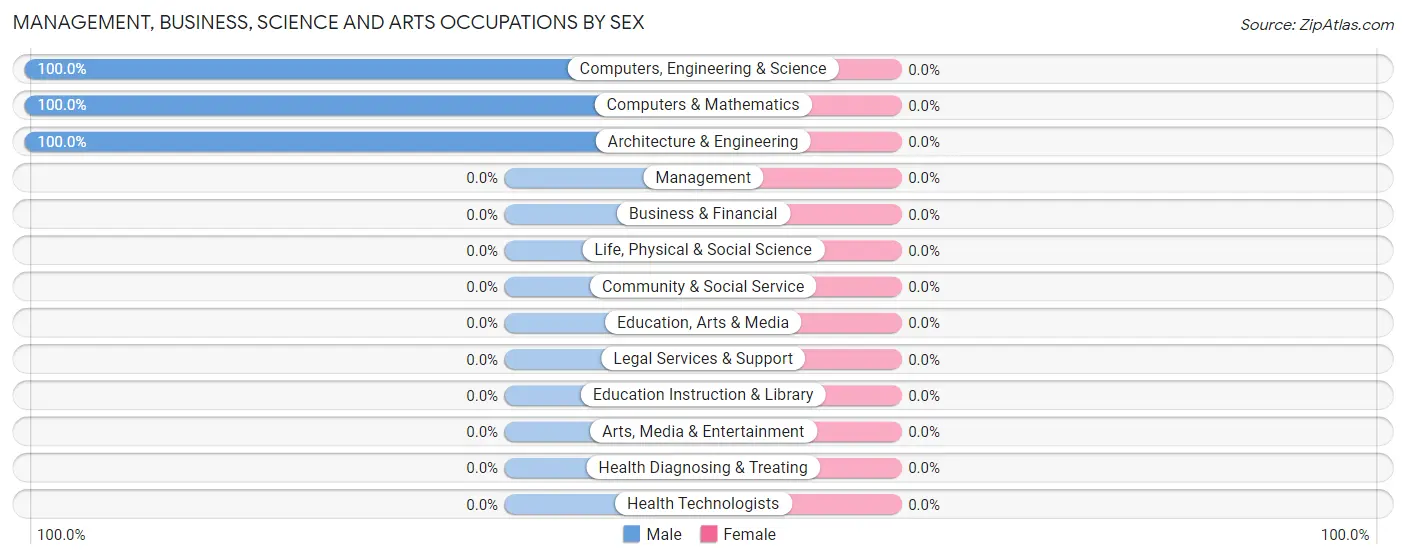
| Occupation | Male | Female |
| Management | 0 (0.0%) | 0 (0.0%) |
| Business & Financial | 0 (0.0%) | 0 (0.0%) |
| Computers, Engineering & Science | 29 (100.0%) | 0 (0.0%) |
| Computers & Mathematics | 15 (100.0%) | 0 (0.0%) |
| Architecture & Engineering | 14 (100.0%) | 0 (0.0%) |
| Life, Physical & Social Science | 0 (0.0%) | 0 (0.0%) |
| Community & Social Service | 0 (0.0%) | 0 (0.0%) |
| Education, Arts & Media | 0 (0.0%) | 0 (0.0%) |
| Legal Services & Support | 0 (0.0%) | 0 (0.0%) |
| Education Instruction & Library | 0 (0.0%) | 0 (0.0%) |
| Arts, Media & Entertainment | 0 (0.0%) | 0 (0.0%) |
| Health Diagnosing & Treating | 0 (0.0%) | 0 (0.0%) |
| Health Technologists | 0 (0.0%) | 0 (0.0%) |
| Total (Category) | 29 (100.0%) | 0 (0.0%) |
| Total (Overall) | 217 (65.0%) | 117 (35.0%) |
Services Occupations
The most common Services occupations in Horine are Food Preparation & Serving (31 | 9.3%), Security & Protection (18 | 5.4%), and Firefighting & Prevention (18 | 5.4%).
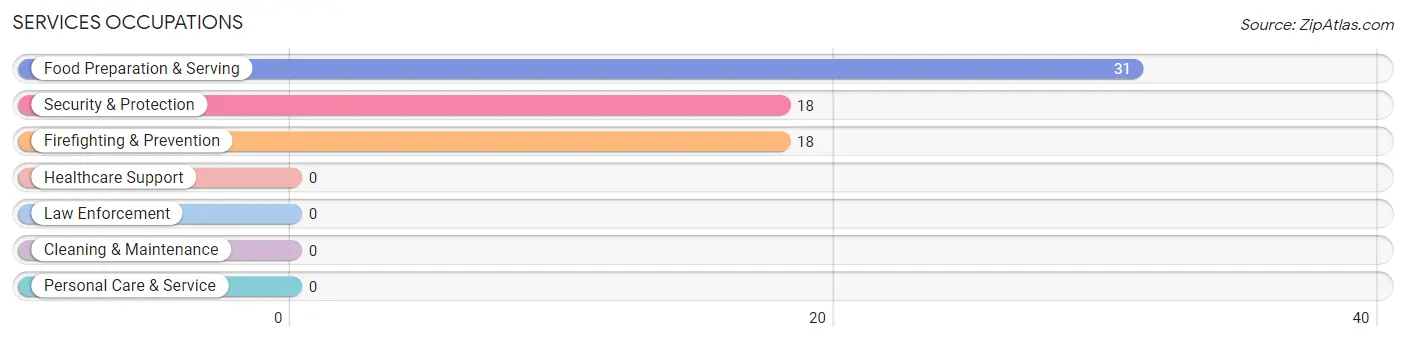
Services Occupations by Sex
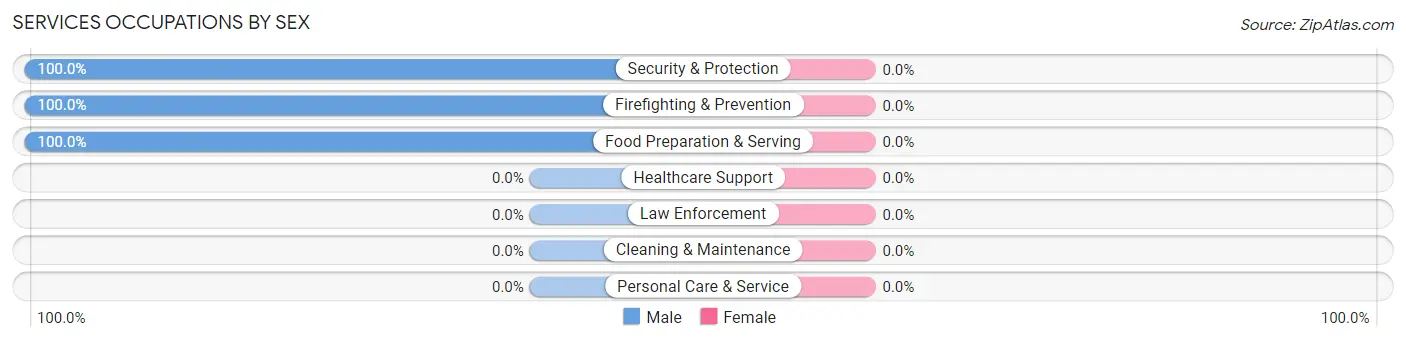
| Occupation | Male | Female |
| Healthcare Support | 0 (0.0%) | 0 (0.0%) |
| Security & Protection | 18 (100.0%) | 0 (0.0%) |
| Firefighting & Prevention | 18 (100.0%) | 0 (0.0%) |
| Law Enforcement | 0 (0.0%) | 0 (0.0%) |
| Food Preparation & Serving | 31 (100.0%) | 0 (0.0%) |
| Cleaning & Maintenance | 0 (0.0%) | 0 (0.0%) |
| Personal Care & Service | 0 (0.0%) | 0 (0.0%) |
| Total (Category) | 49 (100.0%) | 0 (0.0%) |
| Total (Overall) | 217 (65.0%) | 117 (35.0%) |
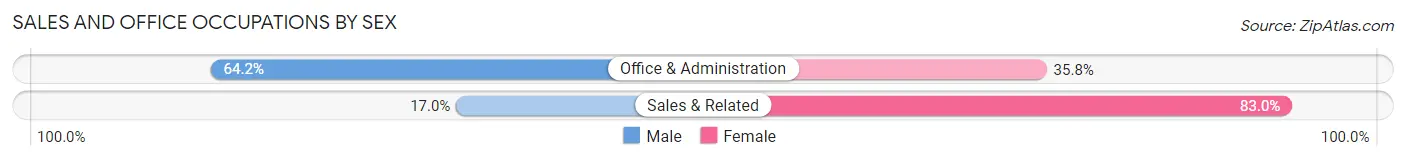
Sales and Office Occupations
The most common Sales and Office occupations in Horine are Sales & Related (100 | 29.9%), and Office & Administration (95 | 28.4%).
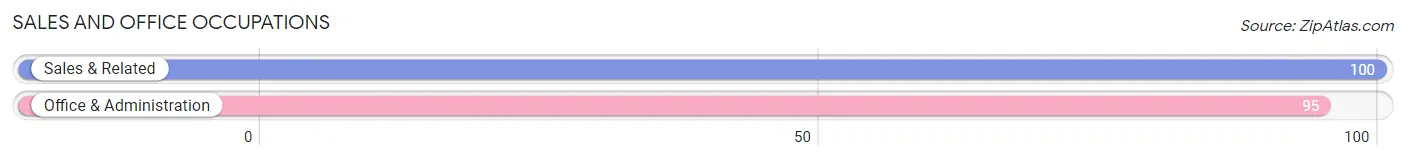
Sales and Office Occupations by Sex
| Occupation | Male | Female |
| Sales & Related | 17 (17.0%) | 83 (83.0%) |
| Office & Administration | 61 (64.2%) | 34 (35.8%) |
| Total (Category) | 78 (40.0%) | 117 (60.0%) |
| Total (Overall) | 217 (65.0%) | 117 (35.0%) |
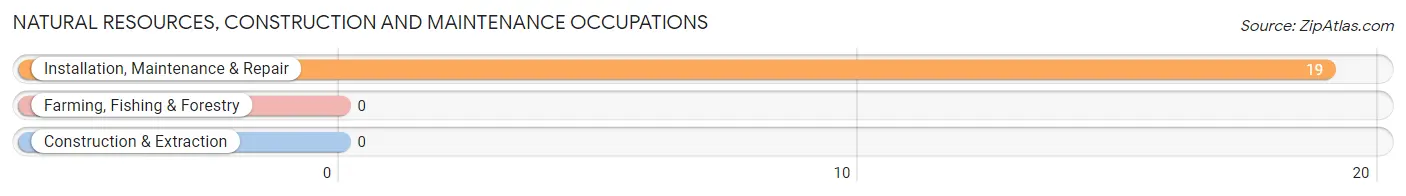
Natural Resources, Construction and Maintenance Occupations
The most common Natural Resources, Construction and Maintenance occupations in Horine are , and Installation, Maintenance & Repair (19 | 5.7%).
Natural Resources, Construction and Maintenance Occupations by Sex
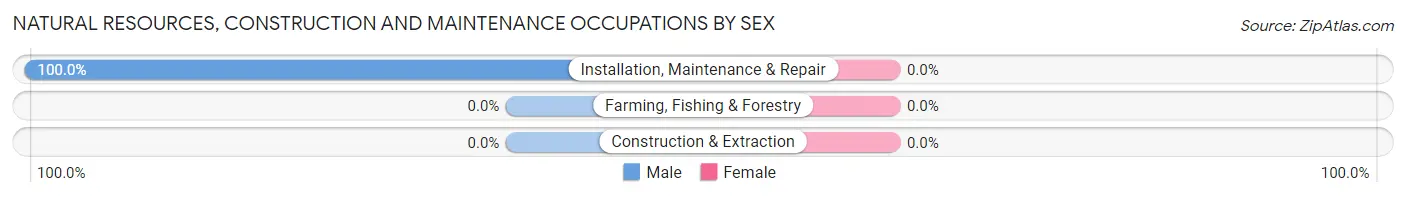
| Occupation | Male | Female |
| Farming, Fishing & Forestry | 0 (0.0%) | 0 (0.0%) |
| Construction & Extraction | 0 (0.0%) | 0 (0.0%) |
| Installation, Maintenance & Repair | 19 (100.0%) | 0 (0.0%) |
| Total (Category) | 19 (100.0%) | 0 (0.0%) |
| Total (Overall) | 217 (65.0%) | 117 (35.0%) |
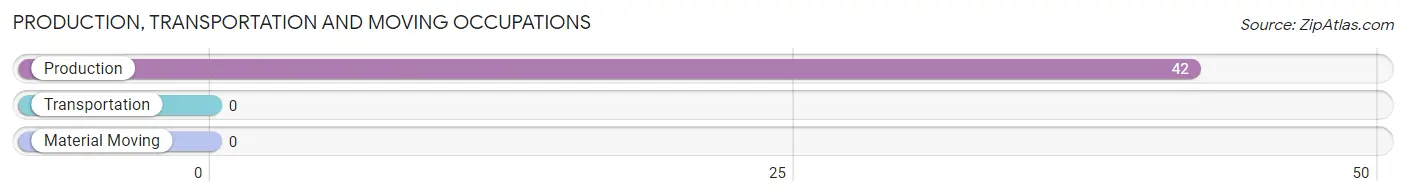
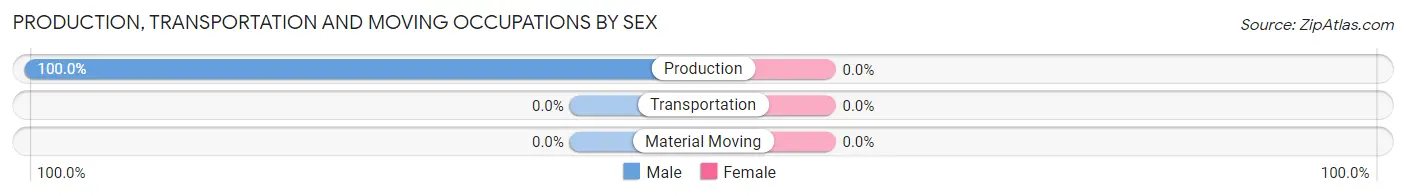
Production, Transportation and Moving Occupations
The most common Production, Transportation and Moving occupations in Horine are , and Production (42 | 12.6%).
Production, Transportation and Moving Occupations by Sex
| Occupation | Male | Female |
| Production | 42 (100.0%) | 0 (0.0%) |
| Transportation | 0 (0.0%) | 0 (0.0%) |
| Material Moving | 0 (0.0%) | 0 (0.0%) |
| Total (Category) | 42 (100.0%) | 0 (0.0%) |
| Total (Overall) | 217 (65.0%) | 117 (35.0%) |
Employment Industries by Sex in Horine
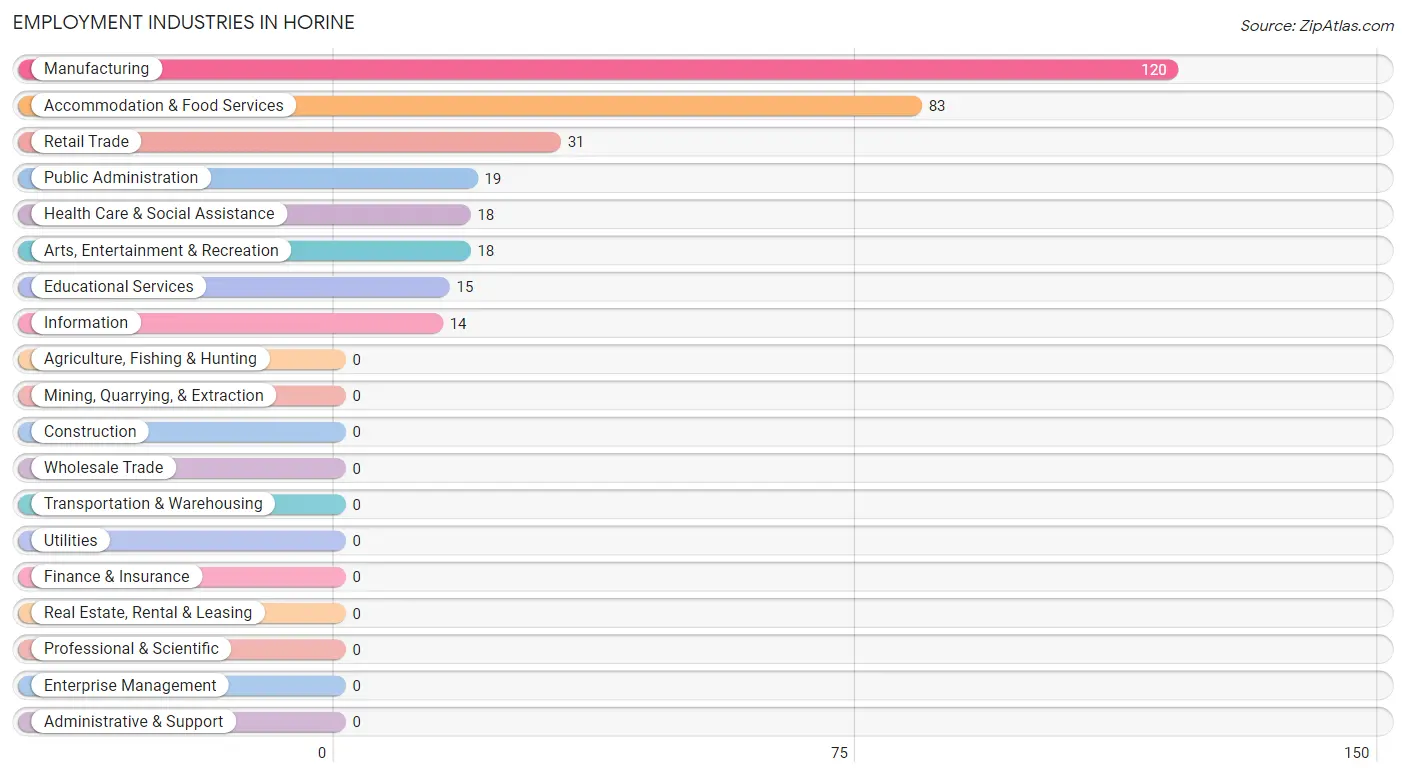
Employment Industries in Horine
The major employment industries in Horine include Manufacturing (120 | 35.9%), Accommodation & Food Services (83 | 24.8%), Retail Trade (31 | 9.3%), Public Administration (19 | 5.7%), and Health Care & Social Assistance (18 | 5.4%).
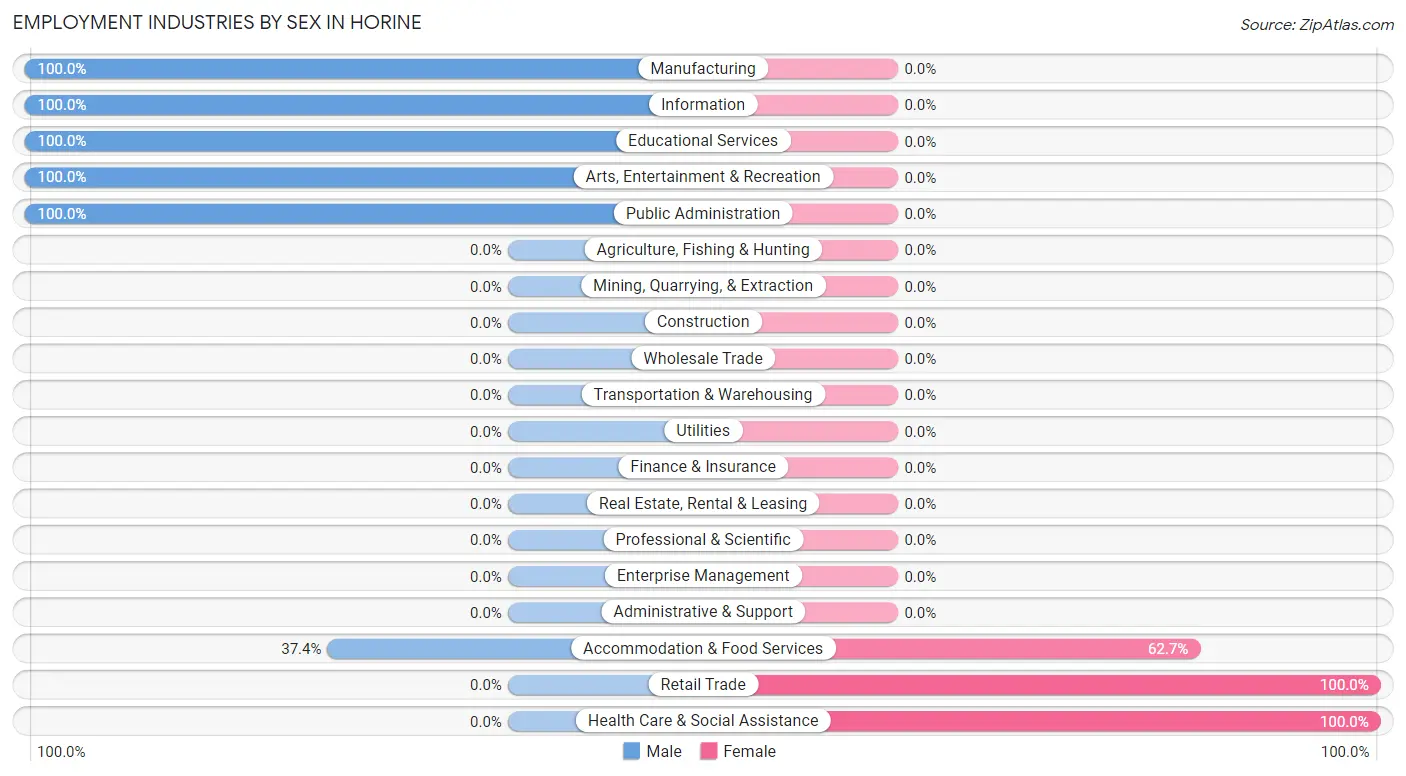
Employment Industries by Sex in Horine
The Horine industries that see more men than women are Manufacturing (100.0%), Information (100.0%), and Educational Services (100.0%), whereas the industries that tend to have a higher number of women are Retail Trade (100.0%), Health Care & Social Assistance (100.0%), and Accommodation & Food Services (62.6%).
| Industry | Male | Female |
| Agriculture, Fishing & Hunting | 0 (0.0%) | 0 (0.0%) |
| Mining, Quarrying, & Extraction | 0 (0.0%) | 0 (0.0%) |
| Construction | 0 (0.0%) | 0 (0.0%) |
| Manufacturing | 120 (100.0%) | 0 (0.0%) |
| Wholesale Trade | 0 (0.0%) | 0 (0.0%) |
| Retail Trade | 0 (0.0%) | 31 (100.0%) |
| Transportation & Warehousing | 0 (0.0%) | 0 (0.0%) |
| Utilities | 0 (0.0%) | 0 (0.0%) |
| Information | 14 (100.0%) | 0 (0.0%) |
| Finance & Insurance | 0 (0.0%) | 0 (0.0%) |
| Real Estate, Rental & Leasing | 0 (0.0%) | 0 (0.0%) |
| Professional & Scientific | 0 (0.0%) | 0 (0.0%) |
| Enterprise Management | 0 (0.0%) | 0 (0.0%) |
| Administrative & Support | 0 (0.0%) | 0 (0.0%) |
| Educational Services | 15 (100.0%) | 0 (0.0%) |
| Health Care & Social Assistance | 0 (0.0%) | 18 (100.0%) |
| Arts, Entertainment & Recreation | 18 (100.0%) | 0 (0.0%) |
| Accommodation & Food Services | 31 (37.3%) | 52 (62.6%) |
| Public Administration | 19 (100.0%) | 0 (0.0%) |
| Total | 217 (65.0%) | 117 (35.0%) |
Education in Horine
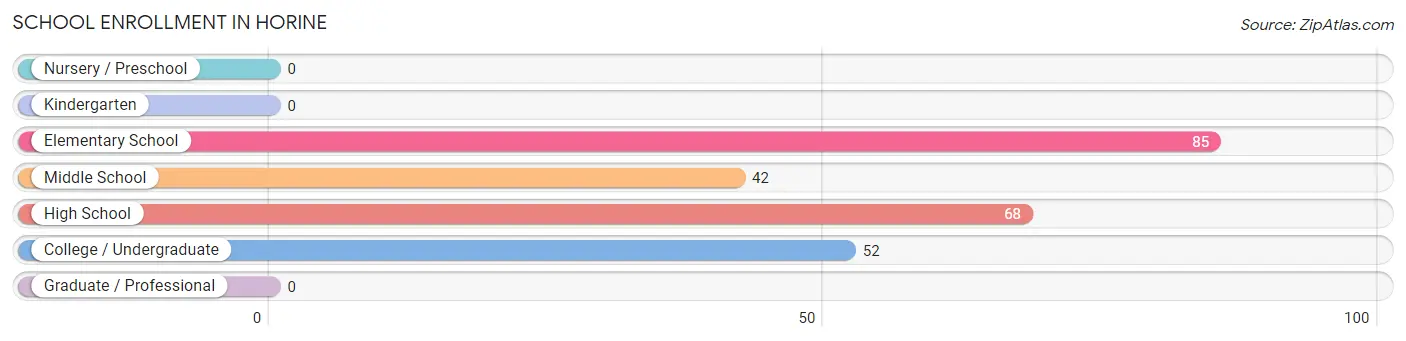
School Enrollment in Horine
The most common levels of schooling among the 247 students in Horine are elementary school (85 | 34.4%), high school (68 | 27.5%), and college / undergraduate (52 | 21.0%).
| School Level | # Students | % Students |
| Nursery / Preschool | 0 | 0.0% |
| Kindergarten | 0 | 0.0% |
| Elementary School | 85 | 34.4% |
| Middle School | 42 | 17.0% |
| High School | 68 | 27.5% |
| College / Undergraduate | 52 | 21.0% |
| Graduate / Professional | 0 | 0.0% |
| Total | 247 | 100.0% |
School Enrollment by Age by Funding Source in Horine
Out of a total of 247 students who are enrolled in schools in Horine, 106 (42.9%) attend a private institution, while the remaining 141 (57.1%) are enrolled in public schools. The age group of 15 to 17 year olds has the highest likelihood of being enrolled in private schools, with 52 (100.0% in the age bracket) enrolled. Conversely, the age group of 18 to 19 year olds has the lowest likelihood of being enrolled in a private school, with 52 (100.0% in the age bracket) attending a public institution.
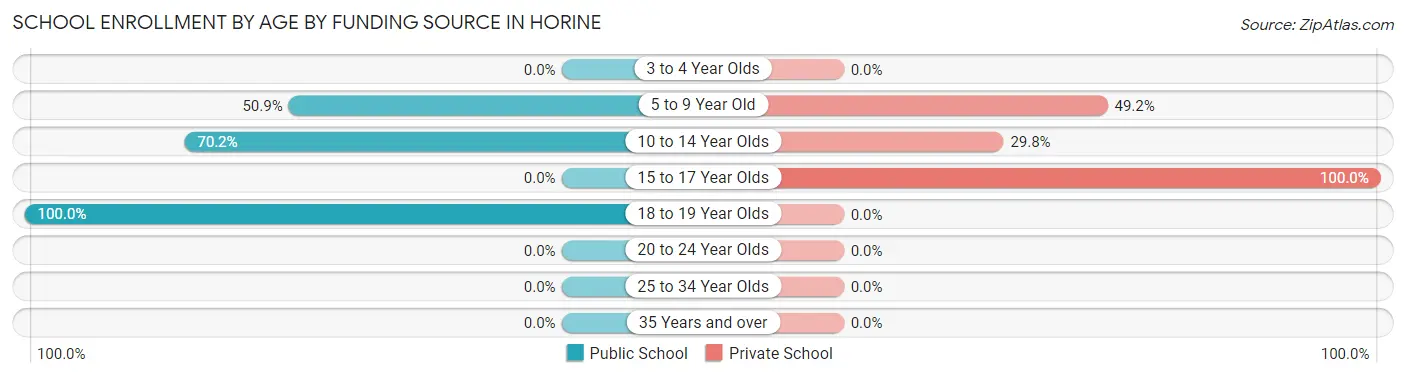
| Age Bracket | Public School | Private School |
| 3 to 4 Year Olds | 0 (0.0%) | 0 (0.0%) |
| 5 to 9 Year Old | 30 (50.8%) | 29 (49.1%) |
| 10 to 14 Year Olds | 59 (70.2%) | 25 (29.8%) |
| 15 to 17 Year Olds | 0 (0.0%) | 52 (100.0%) |
| 18 to 19 Year Olds | 52 (100.0%) | 0 (0.0%) |
| 20 to 24 Year Olds | 0 (0.0%) | 0 (0.0%) |
| 25 to 34 Year Olds | 0 (0.0%) | 0 (0.0%) |
| 35 Years and over | 0 (0.0%) | 0 (0.0%) |
| Total | 141 (57.1%) | 106 (42.9%) |
Educational Attainment by Field of Study in Horine
| Field of Study | # Graduates | % Graduates |
| Computers & Mathematics | 0 | 0.0% |
| Bio, Nature & Agricultural | 0 | 0.0% |
| Physical & Health Sciences | 0 | 0.0% |
| Psychology | 0 | 0.0% |
| Social Sciences | 0 | 0.0% |
| Engineering | 0 | 0.0% |
| Multidisciplinary Studies | 0 | 0.0% |
| Science & Technology | 0 | 0.0% |
| Business | 0 | 0.0% |
| Education | 0 | 0.0% |
| Literature & Languages | 0 | 0.0% |
| Liberal Arts & History | 0 | 0.0% |
| Visual & Performing Arts | 0 | 0.0% |
| Communications | 0 | 0.0% |
| Arts & Humanities | 0 | 0.0% |
| Total | 0 | 0.0% |
Transportation & Commute in Horine
Vehicle Availability by Sex in Horine
The most prevalent vehicle ownership categories in Horine are males with 2 vehicles (75, accounting for 34.6%) and females with 2 vehicles (0, making up 64.1%).
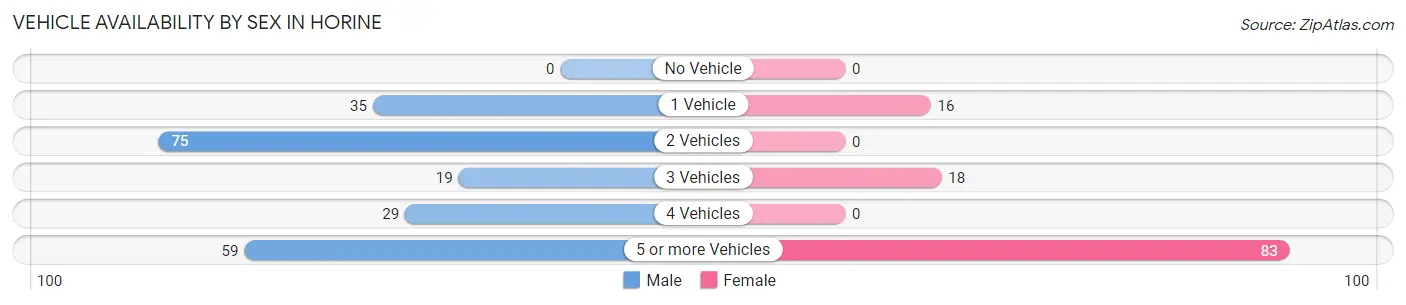
| Vehicles Available | Male | Female |
| No Vehicle | 0 (0.0%) | 0 (0.0%) |
| 1 Vehicle | 35 (16.1%) | 16 (13.7%) |
| 2 Vehicles | 75 (34.6%) | 0 (0.0%) |
| 3 Vehicles | 19 (8.8%) | 18 (15.4%) |
| 4 Vehicles | 29 (13.4%) | 0 (0.0%) |
| 5 or more Vehicles | 59 (27.2%) | 83 (70.9%) |
| Total | 217 (100.0%) | 117 (100.0%) |
Commute Time in Horine
The most frequently occuring commute durations in Horine are 15 to 19 minutes (102 commuters, 30.5%), 60 to 89 minutes (89 commuters, 26.7%), and 10 to 14 minutes (65 commuters, 19.5%).
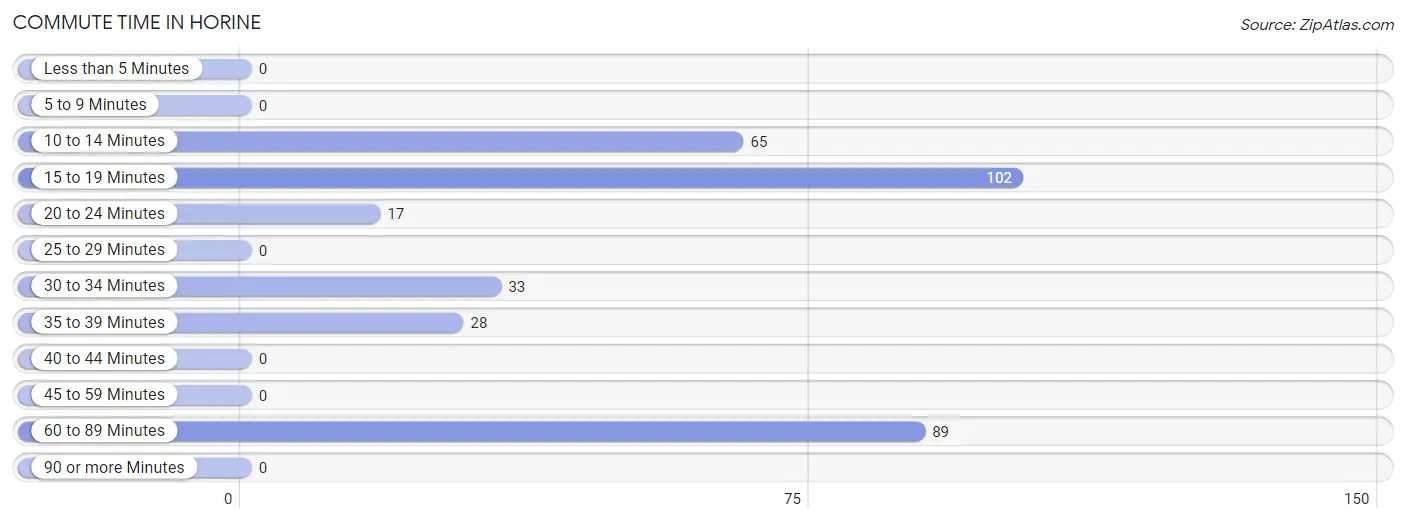
| Commute Time | # Commuters | % Commuters |
| Less than 5 Minutes | 0 | 0.0% |
| 5 to 9 Minutes | 0 | 0.0% |
| 10 to 14 Minutes | 65 | 19.5% |
| 15 to 19 Minutes | 102 | 30.5% |
| 20 to 24 Minutes | 17 | 5.1% |
| 25 to 29 Minutes | 0 | 0.0% |
| 30 to 34 Minutes | 33 | 9.9% |
| 35 to 39 Minutes | 28 | 8.4% |
| 40 to 44 Minutes | 0 | 0.0% |
| 45 to 59 Minutes | 0 | 0.0% |
| 60 to 89 Minutes | 89 | 26.7% |
| 90 or more Minutes | 0 | 0.0% |
Commute Time by Sex in Horine
The most common commute times in Horine are 60 to 89 minutes (89 commuters, 41.0%) for males and 15 to 19 minutes (52 commuters, 44.4%) for females.
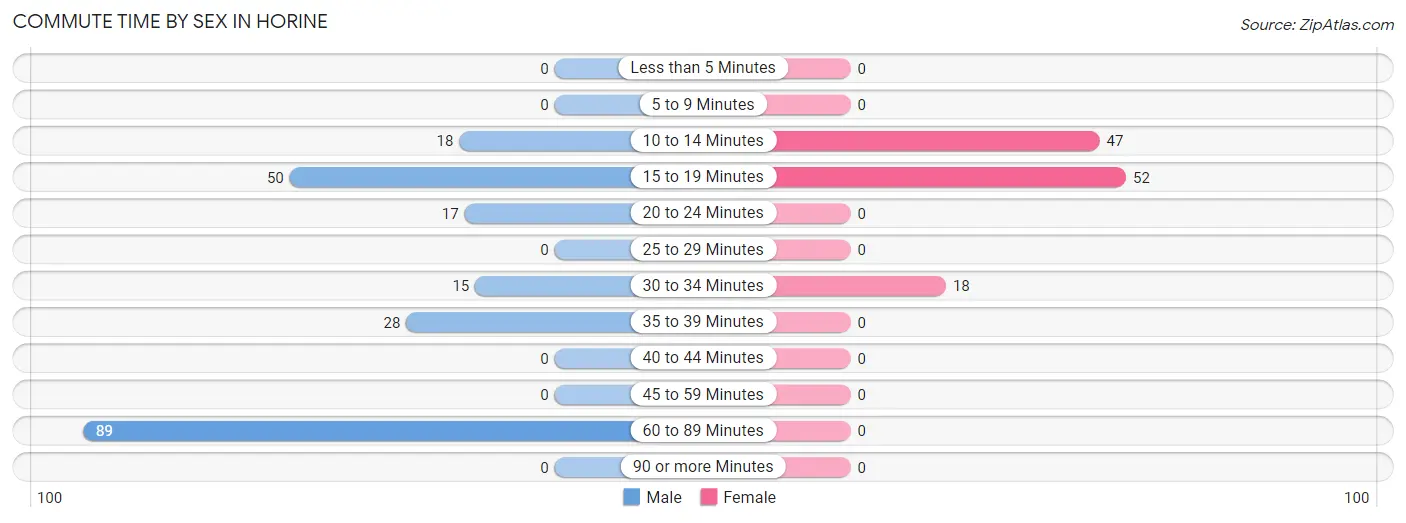
| Commute Time | Male | Female |
| Less than 5 Minutes | 0 (0.0%) | 0 (0.0%) |
| 5 to 9 Minutes | 0 (0.0%) | 0 (0.0%) |
| 10 to 14 Minutes | 18 (8.3%) | 47 (40.2%) |
| 15 to 19 Minutes | 50 (23.0%) | 52 (44.4%) |
| 20 to 24 Minutes | 17 (7.8%) | 0 (0.0%) |
| 25 to 29 Minutes | 0 (0.0%) | 0 (0.0%) |
| 30 to 34 Minutes | 15 (6.9%) | 18 (15.4%) |
| 35 to 39 Minutes | 28 (12.9%) | 0 (0.0%) |
| 40 to 44 Minutes | 0 (0.0%) | 0 (0.0%) |
| 45 to 59 Minutes | 0 (0.0%) | 0 (0.0%) |
| 60 to 89 Minutes | 89 (41.0%) | 0 (0.0%) |
| 90 or more Minutes | 0 (0.0%) | 0 (0.0%) |
Time of Departure to Work by Sex in Horine
The most frequent times of departure to work in Horine are 12:00 AM to 4:59 AM (63, 29.0%) for males and 12:00 PM to 3:59 PM (52, 44.4%) for females.
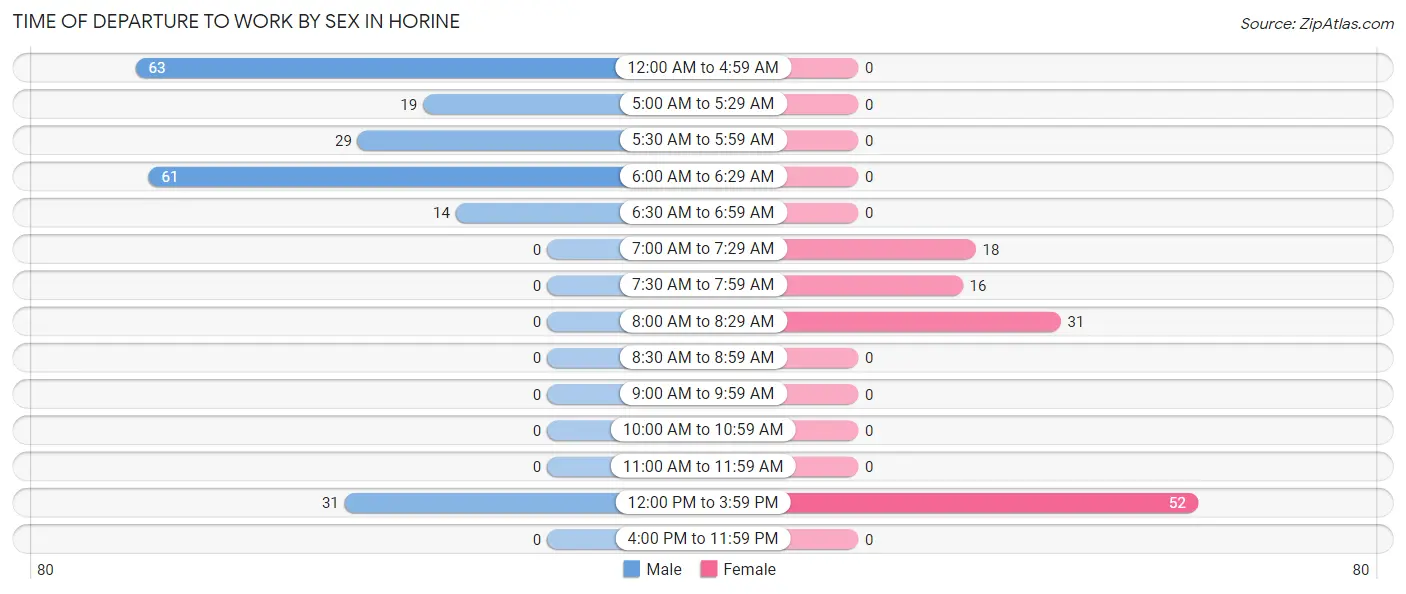
| Time of Departure | Male | Female |
| 12:00 AM to 4:59 AM | 63 (29.0%) | 0 (0.0%) |
| 5:00 AM to 5:29 AM | 19 (8.8%) | 0 (0.0%) |
| 5:30 AM to 5:59 AM | 29 (13.4%) | 0 (0.0%) |
| 6:00 AM to 6:29 AM | 61 (28.1%) | 0 (0.0%) |
| 6:30 AM to 6:59 AM | 14 (6.5%) | 0 (0.0%) |
| 7:00 AM to 7:29 AM | 0 (0.0%) | 18 (15.4%) |
| 7:30 AM to 7:59 AM | 0 (0.0%) | 16 (13.7%) |
| 8:00 AM to 8:29 AM | 0 (0.0%) | 31 (26.5%) |
| 8:30 AM to 8:59 AM | 0 (0.0%) | 0 (0.0%) |
| 9:00 AM to 9:59 AM | 0 (0.0%) | 0 (0.0%) |
| 10:00 AM to 10:59 AM | 0 (0.0%) | 0 (0.0%) |
| 11:00 AM to 11:59 AM | 0 (0.0%) | 0 (0.0%) |
| 12:00 PM to 3:59 PM | 31 (14.3%) | 52 (44.4%) |
| 4:00 PM to 11:59 PM | 0 (0.0%) | 0 (0.0%) |
| Total | 217 (100.0%) | 117 (100.0%) |
Housing Occupancy in Horine
Occupancy by Ownership in Horine
Of the total 326 dwellings in Horine, owner-occupied units account for 308 (94.5%), while renter-occupied units make up 18 (5.5%).
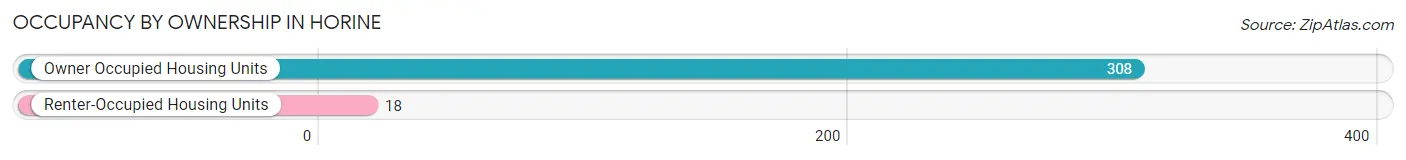
| Occupancy | # Housing Units | % Housing Units |
| Owner Occupied Housing Units | 308 | 94.5% |
| Renter-Occupied Housing Units | 18 | 5.5% |
| Total Occupied Housing Units | 326 | 100.0% |
Occupancy by Household Size in Horine
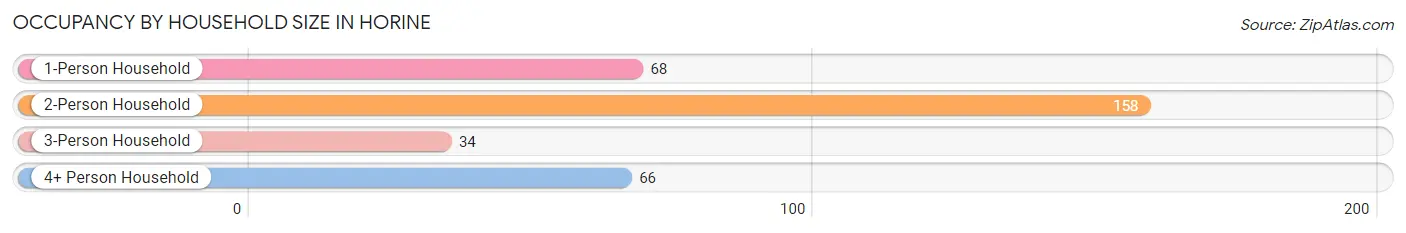
| Household Size | # Housing Units | % Housing Units |
| 1-Person Household | 68 | 20.9% |
| 2-Person Household | 158 | 48.5% |
| 3-Person Household | 34 | 10.4% |
| 4+ Person Household | 66 | 20.3% |
| Total Housing Units | 326 | 100.0% |
Occupancy by Ownership by Household Size in Horine
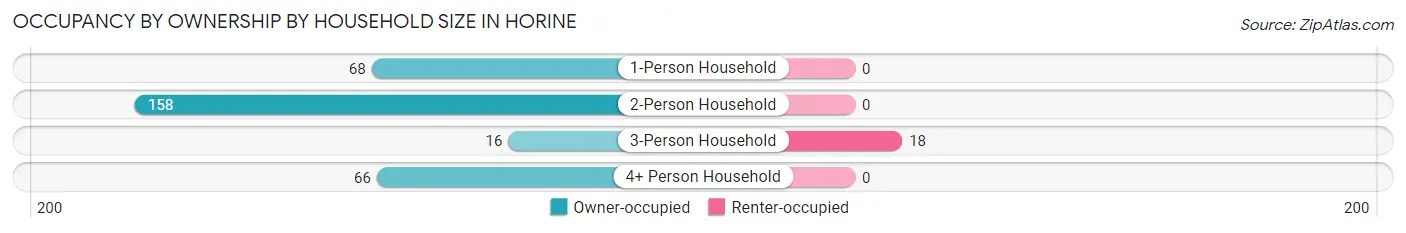
| Household Size | Owner-occupied | Renter-occupied |
| 1-Person Household | 68 (100.0%) | 0 (0.0%) |
| 2-Person Household | 158 (100.0%) | 0 (0.0%) |
| 3-Person Household | 16 (47.1%) | 18 (52.9%) |
| 4+ Person Household | 66 (100.0%) | 0 (0.0%) |
| Total Housing Units | 308 (94.5%) | 18 (5.5%) |
Occupancy by Educational Attainment in Horine
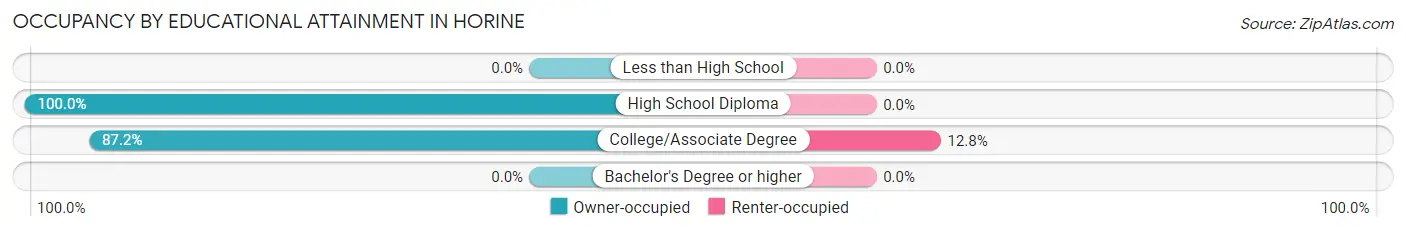
| Household Size | Owner-occupied | Renter-occupied |
| Less than High School | 0 (0.0%) | 0 (0.0%) |
| High School Diploma | 185 (100.0%) | 0 (0.0%) |
| College/Associate Degree | 123 (87.2%) | 18 (12.8%) |
| Bachelor's Degree or higher | 0 (0.0%) | 0 (0.0%) |
Occupancy by Age of Householder in Horine
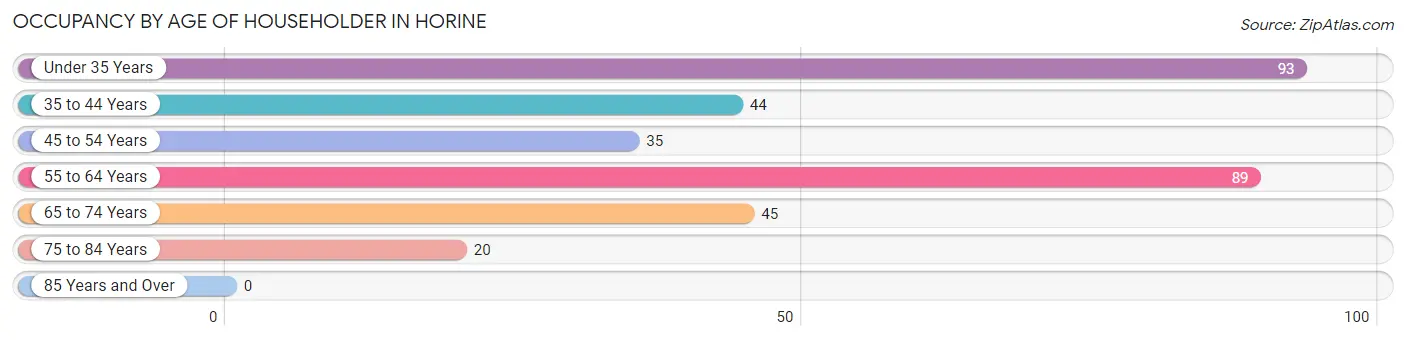
| Age Bracket | # Households | % Households |
| Under 35 Years | 93 | 28.5% |
| 35 to 44 Years | 44 | 13.5% |
| 45 to 54 Years | 35 | 10.7% |
| 55 to 64 Years | 89 | 27.3% |
| 65 to 74 Years | 45 | 13.8% |
| 75 to 84 Years | 20 | 6.1% |
| 85 Years and Over | 0 | 0.0% |
| Total | 326 | 100.0% |
Housing Finances in Horine
Median Income by Occupancy in Horine
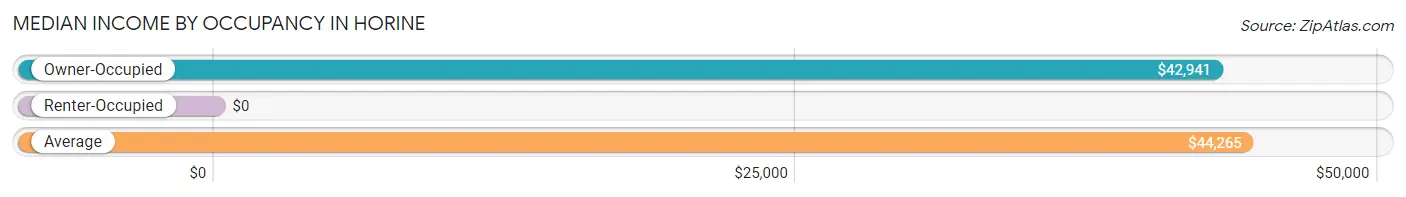
| Occupancy Type | # Households | Median Income |
| Owner-Occupied | 308 (94.5%) | $42,941 |
| Renter-Occupied | 18 (5.5%) | $0 |
| Average | 326 (100.0%) | $44,265 |
Occupancy by Householder Income Bracket in Horine
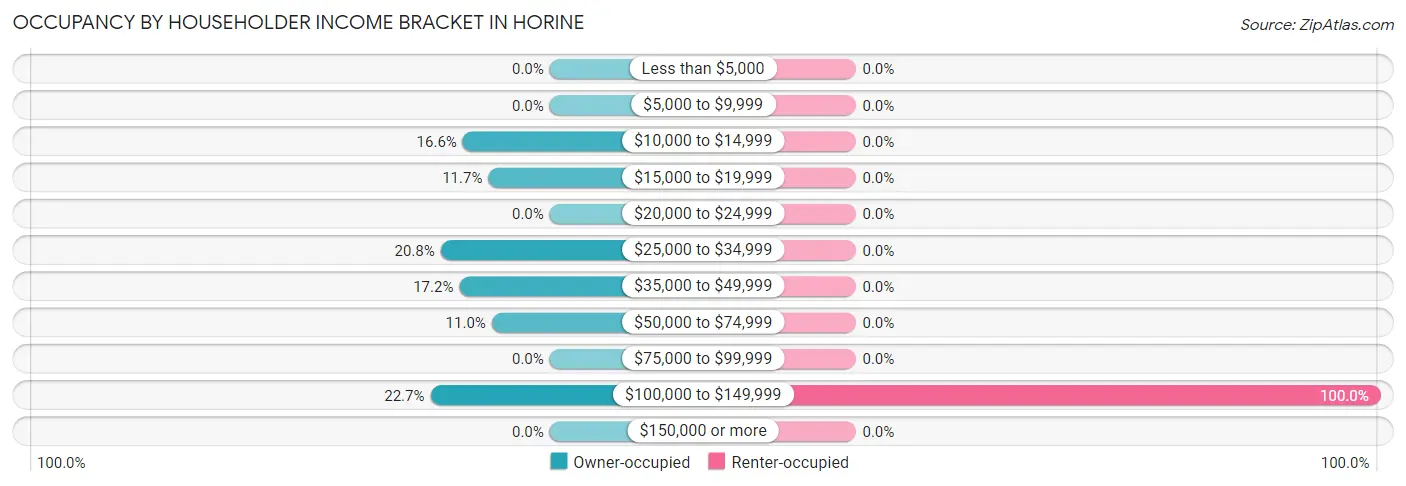
| Income Bracket | Owner-occupied | Renter-occupied |
| Less than $5,000 | 0 (0.0%) | 0 (0.0%) |
| $5,000 to $9,999 | 0 (0.0%) | 0 (0.0%) |
| $10,000 to $14,999 | 51 (16.6%) | 0 (0.0%) |
| $15,000 to $19,999 | 36 (11.7%) | 0 (0.0%) |
| $20,000 to $24,999 | 0 (0.0%) | 0 (0.0%) |
| $25,000 to $34,999 | 64 (20.8%) | 0 (0.0%) |
| $35,000 to $49,999 | 53 (17.2%) | 0 (0.0%) |
| $50,000 to $74,999 | 34 (11.0%) | 0 (0.0%) |
| $75,000 to $99,999 | 0 (0.0%) | 0 (0.0%) |
| $100,000 to $149,999 | 70 (22.7%) | 18 (100.0%) |
| $150,000 or more | 0 (0.0%) | 0 (0.0%) |
| Total | 308 (100.0%) | 18 (100.0%) |
Monthly Housing Cost Tiers in Horine
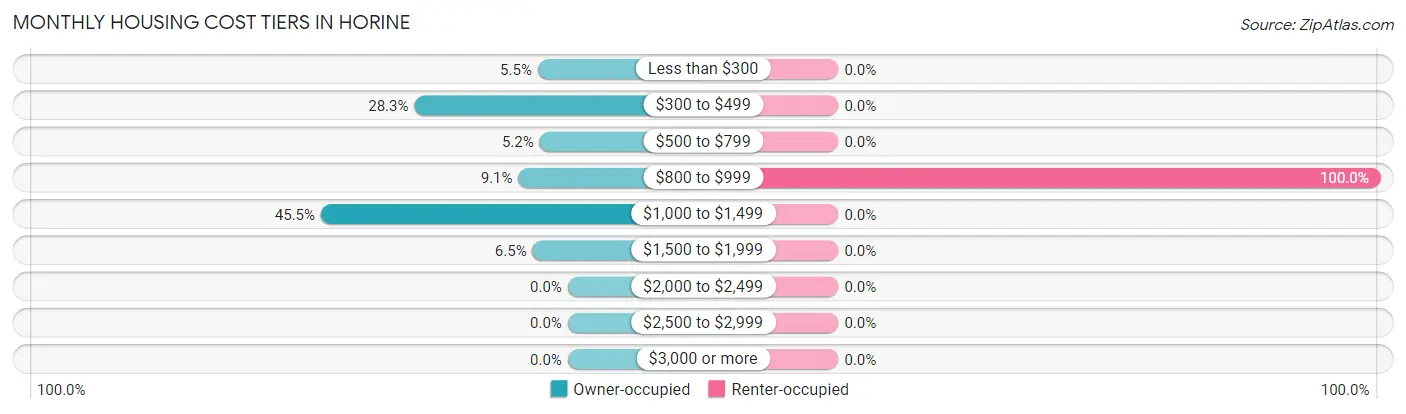
| Monthly Cost | Owner-occupied | Renter-occupied |
| Less than $300 | 17 (5.5%) | 0 (0.0%) |
| $300 to $499 | 87 (28.2%) | 0 (0.0%) |
| $500 to $799 | 16 (5.2%) | 0 (0.0%) |
| $800 to $999 | 28 (9.1%) | 18 (100.0%) |
| $1,000 to $1,499 | 140 (45.5%) | 0 (0.0%) |
| $1,500 to $1,999 | 20 (6.5%) | 0 (0.0%) |
| $2,000 to $2,499 | 0 (0.0%) | 0 (0.0%) |
| $2,500 to $2,999 | 0 (0.0%) | 0 (0.0%) |
| $3,000 or more | 0 (0.0%) | 0 (0.0%) |
| Total | 308 (100.0%) | 18 (100.0%) |
Physical Housing Characteristics in Horine
Housing Structures in Horine
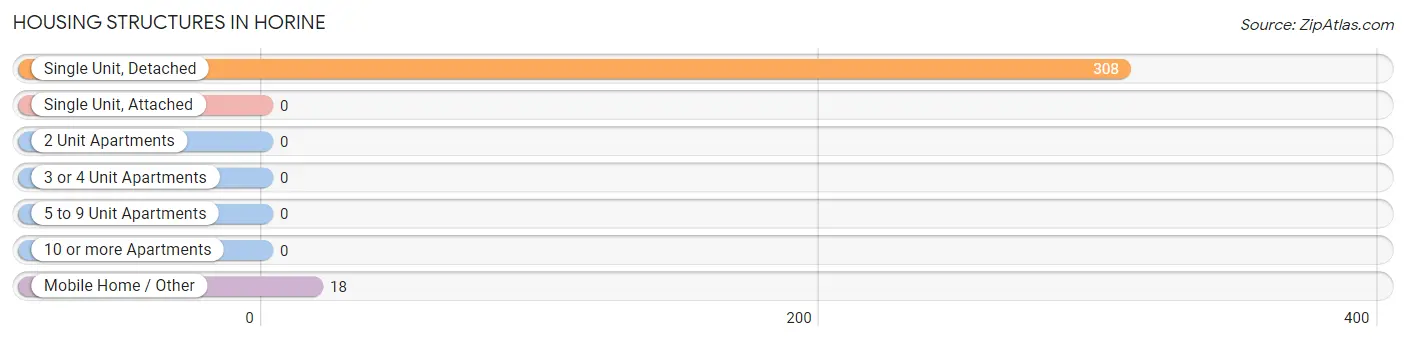
| Structure Type | # Housing Units | % Housing Units |
| Single Unit, Detached | 308 | 94.5% |
| Single Unit, Attached | 0 | 0.0% |
| 2 Unit Apartments | 0 | 0.0% |
| 3 or 4 Unit Apartments | 0 | 0.0% |
| 5 to 9 Unit Apartments | 0 | 0.0% |
| 10 or more Apartments | 0 | 0.0% |
| Mobile Home / Other | 18 | 5.5% |
| Total | 326 | 100.0% |
Housing Structures by Occupancy in Horine
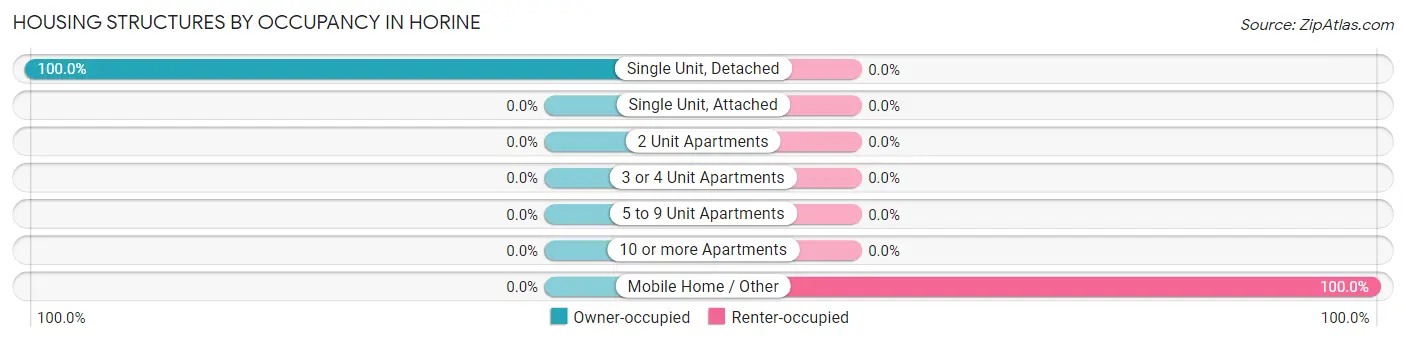
| Structure Type | Owner-occupied | Renter-occupied |
| Single Unit, Detached | 308 (100.0%) | 0 (0.0%) |
| Single Unit, Attached | 0 (0.0%) | 0 (0.0%) |
| 2 Unit Apartments | 0 (0.0%) | 0 (0.0%) |
| 3 or 4 Unit Apartments | 0 (0.0%) | 0 (0.0%) |
| 5 to 9 Unit Apartments | 0 (0.0%) | 0 (0.0%) |
| 10 or more Apartments | 0 (0.0%) | 0 (0.0%) |
| Mobile Home / Other | 0 (0.0%) | 18 (100.0%) |
| Total | 308 (94.5%) | 18 (5.5%) |
Housing Structures by Number of Rooms in Horine
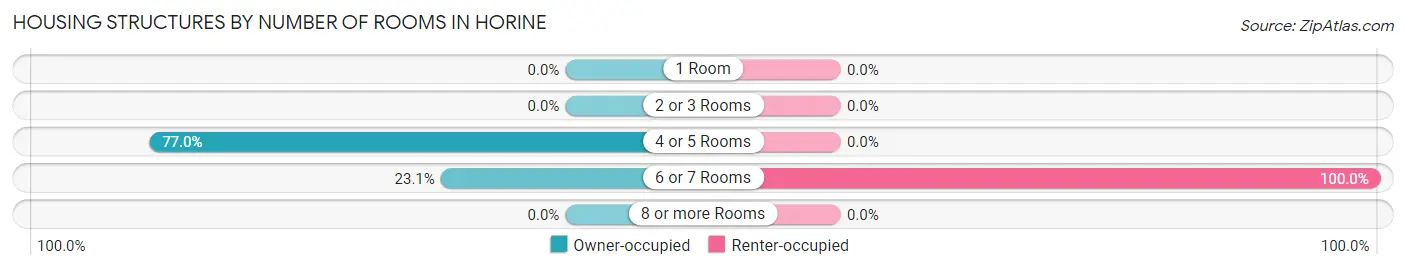
| Number of Rooms | Owner-occupied | Renter-occupied |
| 1 Room | 0 (0.0%) | 0 (0.0%) |
| 2 or 3 Rooms | 0 (0.0%) | 0 (0.0%) |
| 4 or 5 Rooms | 237 (76.9%) | 0 (0.0%) |
| 6 or 7 Rooms | 71 (23.1%) | 18 (100.0%) |
| 8 or more Rooms | 0 (0.0%) | 0 (0.0%) |
| Total | 308 (100.0%) | 18 (100.0%) |
Housing Structure by Heating Type in Horine
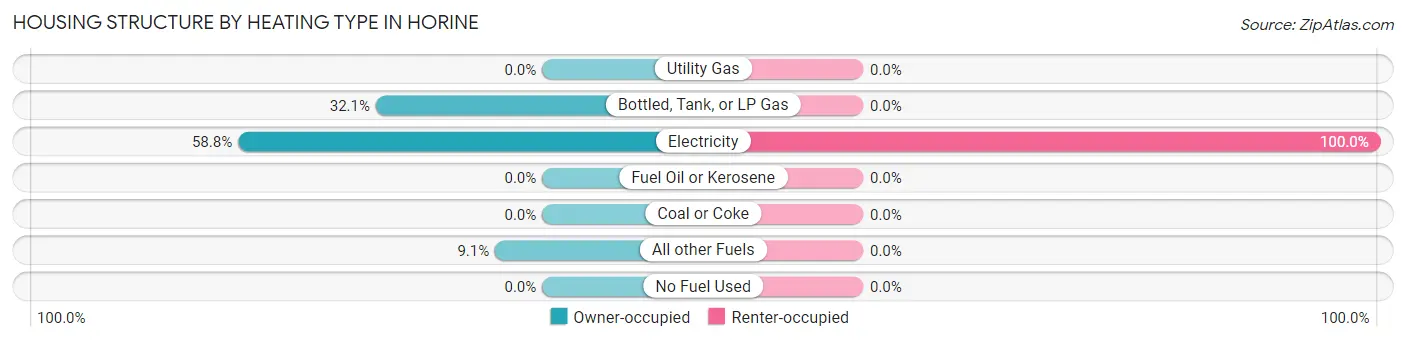
| Heating Type | Owner-occupied | Renter-occupied |
| Utility Gas | 0 (0.0%) | 0 (0.0%) |
| Bottled, Tank, or LP Gas | 99 (32.1%) | 0 (0.0%) |
| Electricity | 181 (58.8%) | 18 (100.0%) |
| Fuel Oil or Kerosene | 0 (0.0%) | 0 (0.0%) |
| Coal or Coke | 0 (0.0%) | 0 (0.0%) |
| All other Fuels | 28 (9.1%) | 0 (0.0%) |
| No Fuel Used | 0 (0.0%) | 0 (0.0%) |
| Total | 308 (100.0%) | 18 (100.0%) |
Household Vehicle Usage in Horine
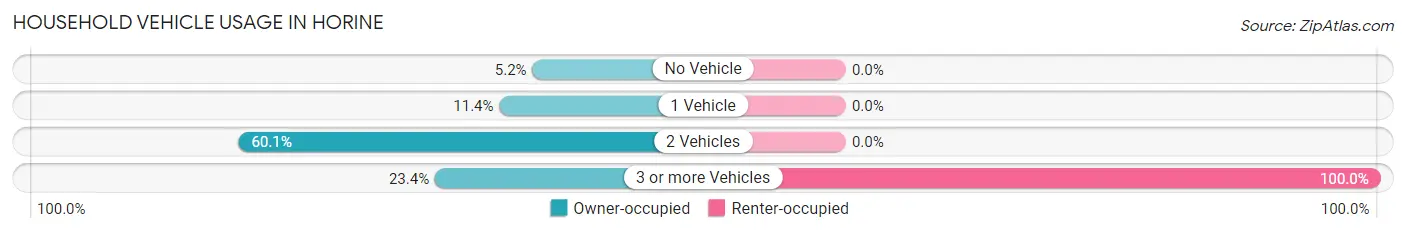
| Vehicles per Household | Owner-occupied | Renter-occupied |
| No Vehicle | 16 (5.2%) | 0 (0.0%) |
| 1 Vehicle | 35 (11.4%) | 0 (0.0%) |
| 2 Vehicles | 185 (60.1%) | 0 (0.0%) |
| 3 or more Vehicles | 72 (23.4%) | 18 (100.0%) |
| Total | 308 (100.0%) | 18 (100.0%) |
Real Estate & Mortgages in Horine
Real Estate and Mortgage Overview in Horine
| Characteristic | Without Mortgage | With Mortgage |
| Housing Units | 104 | 204 |
| Median Property Value | - | - |
| Median Household Income | - | - |
| Monthly Housing Costs | $384 | $0 |
| Real Estate Taxes | $937 | $0 |
Property Value by Mortgage Status in Horine
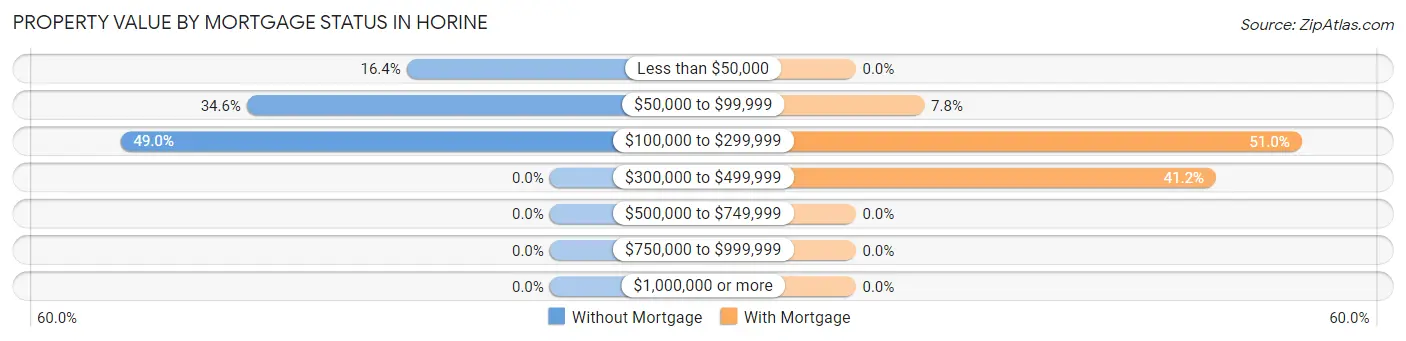
| Property Value | Without Mortgage | With Mortgage |
| Less than $50,000 | 17 (16.4%) | 0 (0.0%) |
| $50,000 to $99,999 | 36 (34.6%) | 16 (7.8%) |
| $100,000 to $299,999 | 51 (49.0%) | 104 (51.0%) |
| $300,000 to $499,999 | 0 (0.0%) | 84 (41.2%) |
| $500,000 to $749,999 | 0 (0.0%) | 0 (0.0%) |
| $750,000 to $999,999 | 0 (0.0%) | 0 (0.0%) |
| $1,000,000 or more | 0 (0.0%) | 0 (0.0%) |
| Total | 104 (100.0%) | 204 (100.0%) |
Household Income by Mortgage Status in Horine
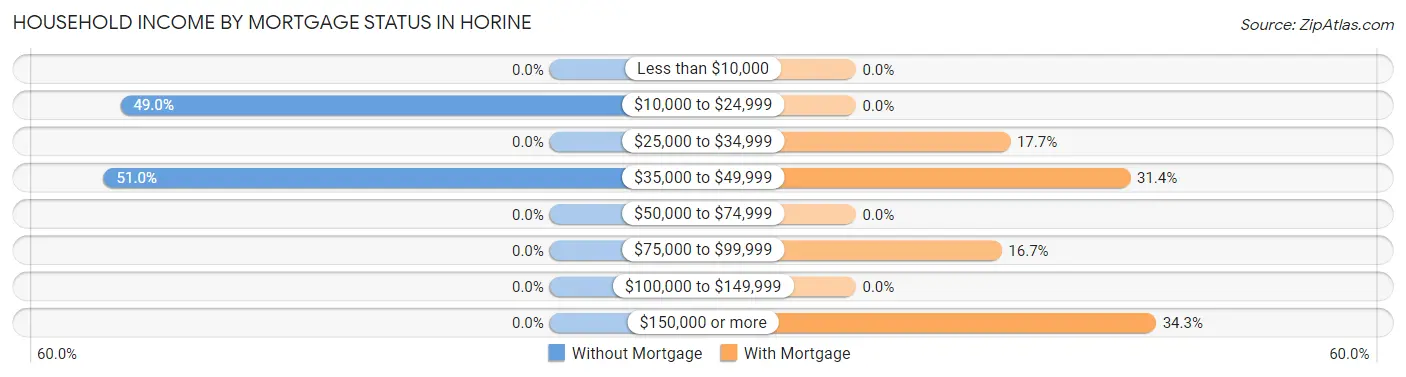
| Household Income | Without Mortgage | With Mortgage |
| Less than $10,000 | 0 (0.0%) | 0 (0.0%) |
| $10,000 to $24,999 | 51 (49.0%) | 0 (0.0%) |
| $25,000 to $34,999 | 0 (0.0%) | 36 (17.6%) |
| $35,000 to $49,999 | 53 (51.0%) | 64 (31.4%) |
| $50,000 to $74,999 | 0 (0.0%) | 0 (0.0%) |
| $75,000 to $99,999 | 0 (0.0%) | 34 (16.7%) |
| $100,000 to $149,999 | 0 (0.0%) | 0 (0.0%) |
| $150,000 or more | 0 (0.0%) | 70 (34.3%) |
| Total | 104 (100.0%) | 204 (100.0%) |
Property Value to Household Income Ratio in Horine
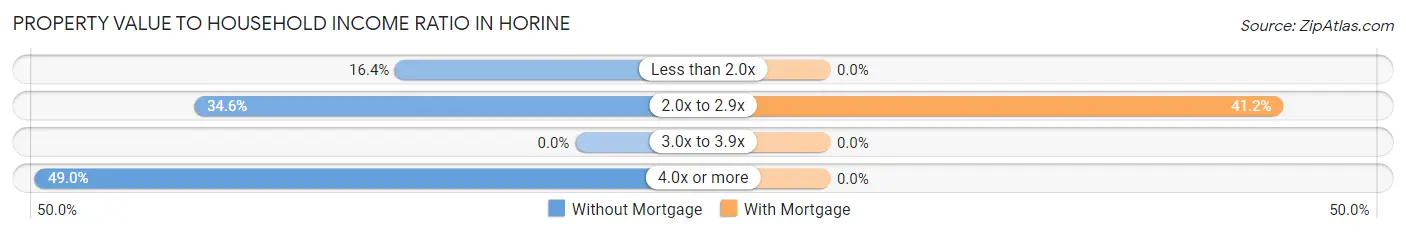
| Value-to-Income Ratio | Without Mortgage | With Mortgage |
| Less than 2.0x | 17 (16.4%) | 0 (0.0%) |
| 2.0x to 2.9x | 36 (34.6%) | 84 (41.2%) |
| 3.0x to 3.9x | 0 (0.0%) | 0 (0.0%) |
| 4.0x or more | 51 (49.0%) | 0 (0.0%) |
| Total | 104 (100.0%) | 204 (100.0%) |
Real Estate Taxes by Mortgage Status in Horine
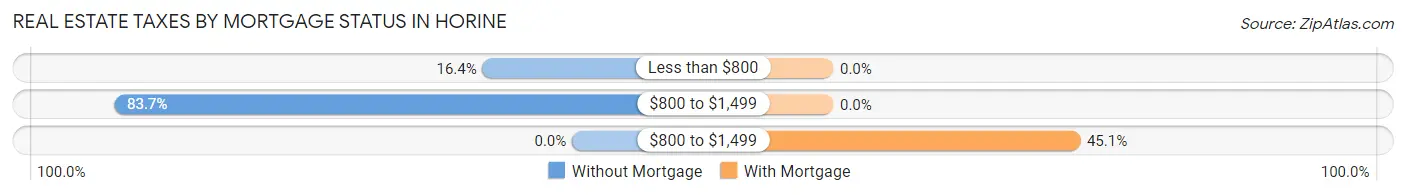
| Property Taxes | Without Mortgage | With Mortgage |
| Less than $800 | 17 (16.4%) | 0 (0.0%) |
| $800 to $1,499 | 87 (83.7%) | 0 (0.0%) |
| $800 to $1,499 | 0 (0.0%) | 92 (45.1%) |
| Total | 104 (100.0%) | 204 (100.0%) |
Health & Disability in Horine
Health Insurance Coverage by Age in Horine
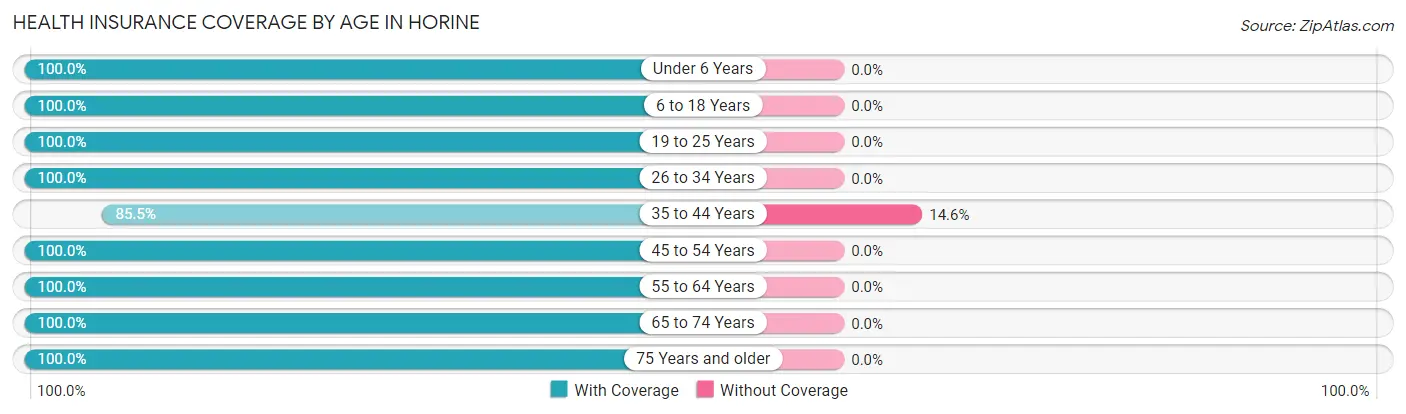
| Age Bracket | With Coverage | Without Coverage |
| Under 6 Years | 32 (100.0%) | 0 (0.0%) |
| 6 to 18 Years | 247 (100.0%) | 0 (0.0%) |
| 19 to 25 Years | 124 (100.0%) | 0 (0.0%) |
| 26 to 34 Years | 104 (100.0%) | 0 (0.0%) |
| 35 to 44 Years | 94 (85.5%) | 16 (14.5%) |
| 45 to 54 Years | 54 (100.0%) | 0 (0.0%) |
| 55 to 64 Years | 105 (100.0%) | 0 (0.0%) |
| 65 to 74 Years | 75 (100.0%) | 0 (0.0%) |
| 75 Years and older | 94 (100.0%) | 0 (0.0%) |
| Total | 929 (98.3%) | 16 (1.7%) |
Health Insurance Coverage by Citizenship Status in Horine
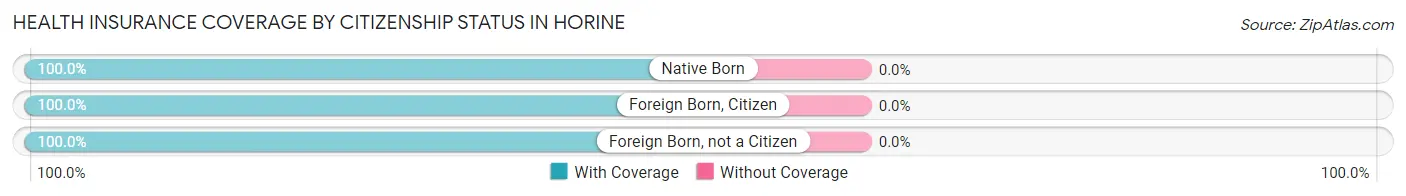
| Citizenship Status | With Coverage | Without Coverage |
| Native Born | 32 (100.0%) | 0 (0.0%) |
| Foreign Born, Citizen | 247 (100.0%) | 0 (0.0%) |
| Foreign Born, not a Citizen | 124 (100.0%) | 0 (0.0%) |
Health Insurance Coverage by Household Income in Horine
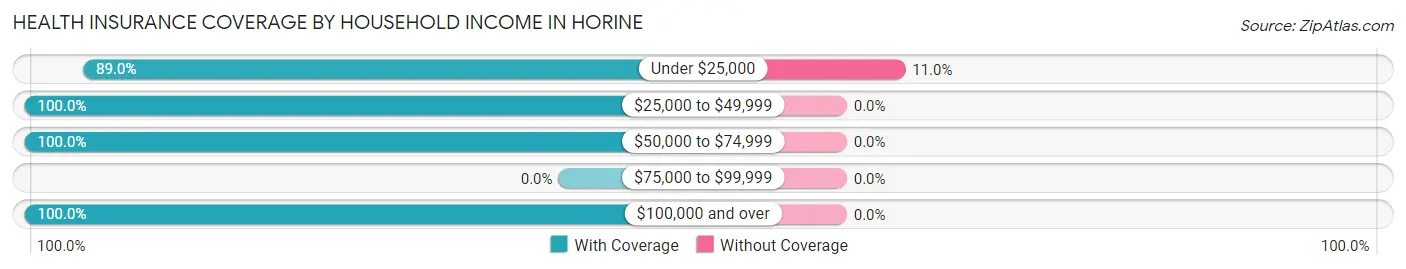
| Household Income | With Coverage | Without Coverage |
| Under $25,000 | 130 (89.0%) | 16 (11.0%) |
| $25,000 to $49,999 | 214 (100.0%) | 0 (0.0%) |
| $50,000 to $74,999 | 98 (100.0%) | 0 (0.0%) |
| $75,000 to $99,999 | 0 (0.0%) | 0 (0.0%) |
| $100,000 and over | 487 (100.0%) | 0 (0.0%) |
Public vs Private Health Insurance Coverage by Age in Horine
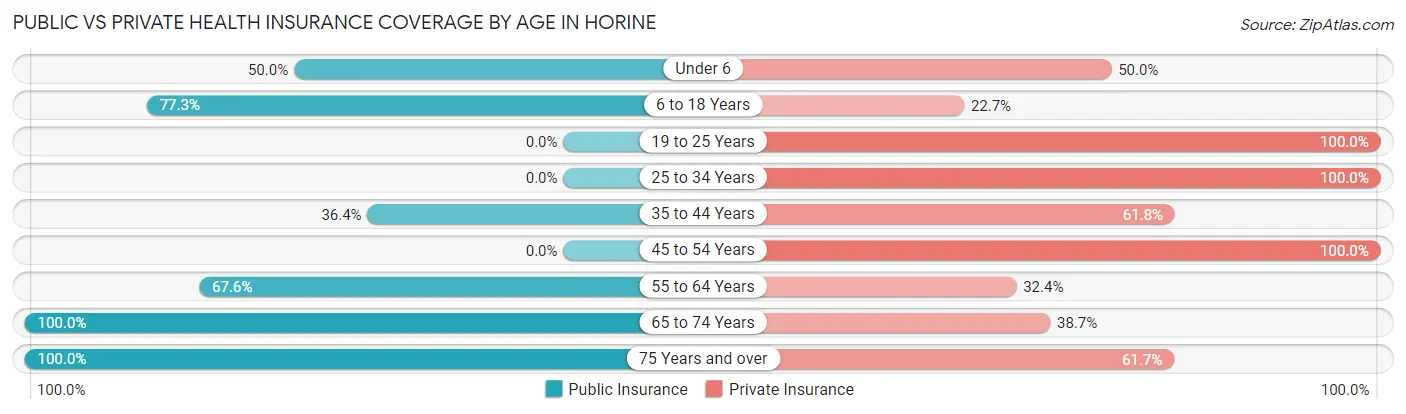
| Age Bracket | Public Insurance | Private Insurance |
| Under 6 | 16 (50.0%) | 16 (50.0%) |
| 6 to 18 Years | 191 (77.3%) | 56 (22.7%) |
| 19 to 25 Years | 0 (0.0%) | 124 (100.0%) |
| 25 to 34 Years | 0 (0.0%) | 104 (100.0%) |
| 35 to 44 Years | 40 (36.4%) | 68 (61.8%) |
| 45 to 54 Years | 0 (0.0%) | 54 (100.0%) |
| 55 to 64 Years | 71 (67.6%) | 34 (32.4%) |
| 65 to 74 Years | 75 (100.0%) | 29 (38.7%) |
| 75 Years and over | 94 (100.0%) | 58 (61.7%) |
| Total | 487 (51.5%) | 543 (57.5%) |
Disability Status by Sex by Age in Horine
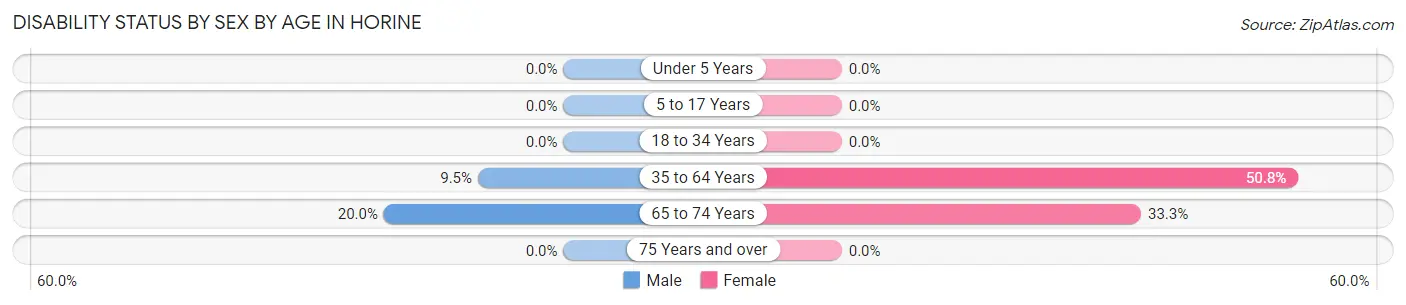
| Age Bracket | Male | Female |
| Under 5 Years | 0 (0.0%) | 0 (0.0%) |
| 5 to 17 Years | 0 (0.0%) | 0 (0.0%) |
| 18 to 34 Years | 0 (0.0%) | 0 (0.0%) |
| 35 to 64 Years | 14 (9.5%) | 62 (50.8%) |
| 65 to 74 Years | 9 (20.0%) | 10 (33.3%) |
| 75 Years and over | 0 (0.0%) | 0 (0.0%) |
Disability Class by Sex by Age in Horine
Disability Class: Hearing Difficulty
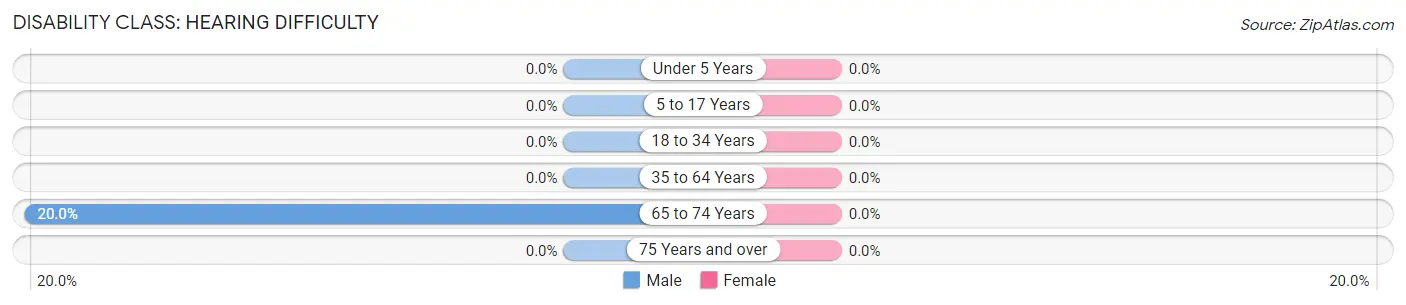
| Age Bracket | Male | Female |
| Under 5 Years | 0 (0.0%) | 0 (0.0%) |
| 5 to 17 Years | 0 (0.0%) | 0 (0.0%) |
| 18 to 34 Years | 0 (0.0%) | 0 (0.0%) |
| 35 to 64 Years | 0 (0.0%) | 0 (0.0%) |
| 65 to 74 Years | 9 (20.0%) | 0 (0.0%) |
| 75 Years and over | 0 (0.0%) | 0 (0.0%) |
Disability Class: Vision Difficulty
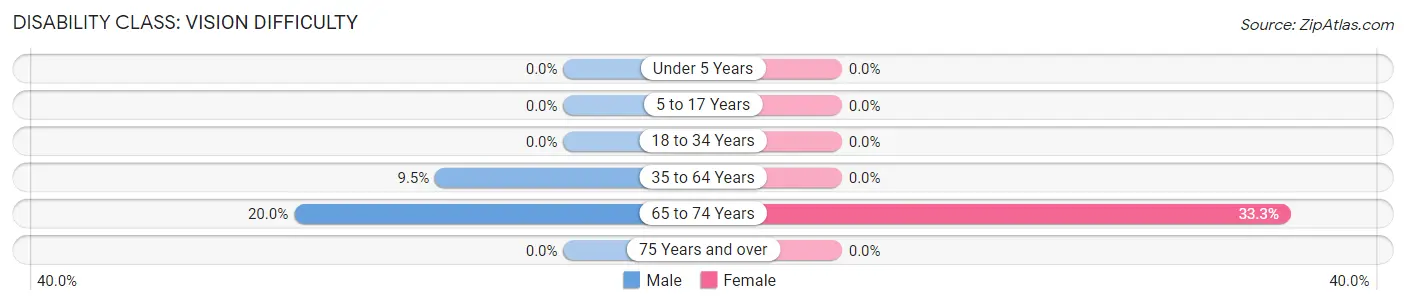
| Age Bracket | Male | Female |
| Under 5 Years | 0 (0.0%) | 0 (0.0%) |
| 5 to 17 Years | 0 (0.0%) | 0 (0.0%) |
| 18 to 34 Years | 0 (0.0%) | 0 (0.0%) |
| 35 to 64 Years | 14 (9.5%) | 0 (0.0%) |
| 65 to 74 Years | 9 (20.0%) | 10 (33.3%) |
| 75 Years and over | 0 (0.0%) | 0 (0.0%) |
Disability Class: Cognitive Difficulty
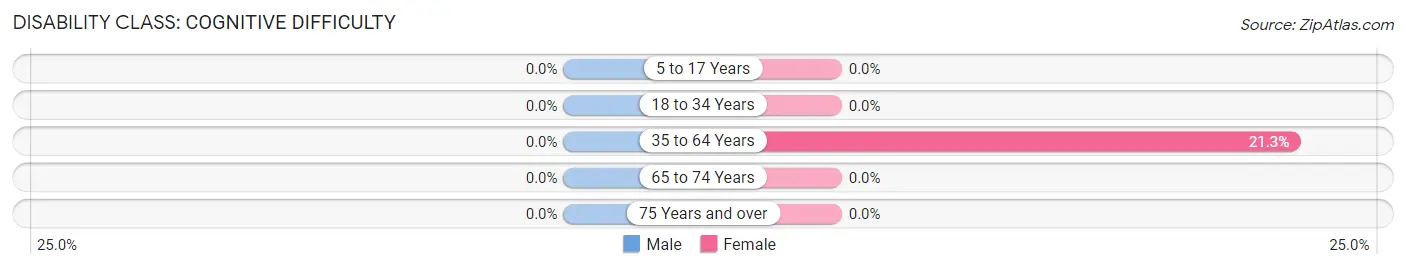
| Age Bracket | Male | Female |
| 5 to 17 Years | 0 (0.0%) | 0 (0.0%) |
| 18 to 34 Years | 0 (0.0%) | 0 (0.0%) |
| 35 to 64 Years | 0 (0.0%) | 26 (21.3%) |
| 65 to 74 Years | 0 (0.0%) | 0 (0.0%) |
| 75 Years and over | 0 (0.0%) | 0 (0.0%) |
Disability Class: Ambulatory Difficulty
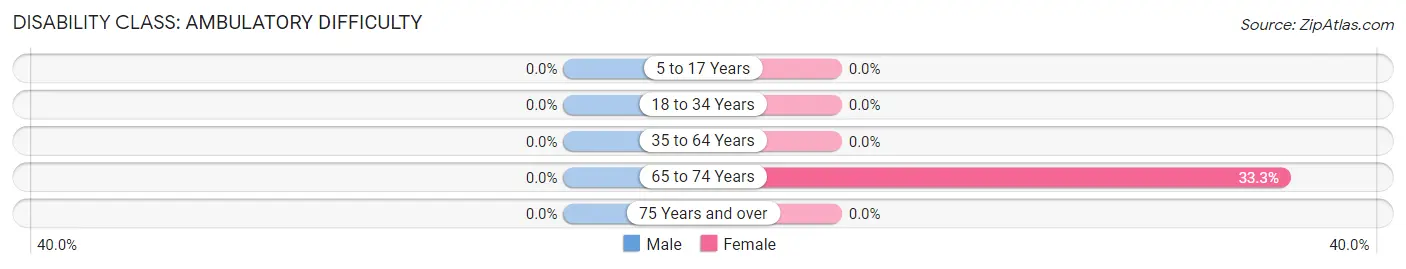
| Age Bracket | Male | Female |
| 5 to 17 Years | 0 (0.0%) | 0 (0.0%) |
| 18 to 34 Years | 0 (0.0%) | 0 (0.0%) |
| 35 to 64 Years | 0 (0.0%) | 0 (0.0%) |
| 65 to 74 Years | 0 (0.0%) | 10 (33.3%) |
| 75 Years and over | 0 (0.0%) | 0 (0.0%) |
Disability Class: Self-Care Difficulty
| Age Bracket | Male | Female |
| 5 to 17 Years | 0 (0.0%) | 0 (0.0%) |
| 18 to 34 Years | 0 (0.0%) | 0 (0.0%) |
| 35 to 64 Years | 0 (0.0%) | 0 (0.0%) |
| 65 to 74 Years | 0 (0.0%) | 0 (0.0%) |
| 75 Years and over | 0 (0.0%) | 0 (0.0%) |
Technology Access in Horine
Computing Device Access in Horine
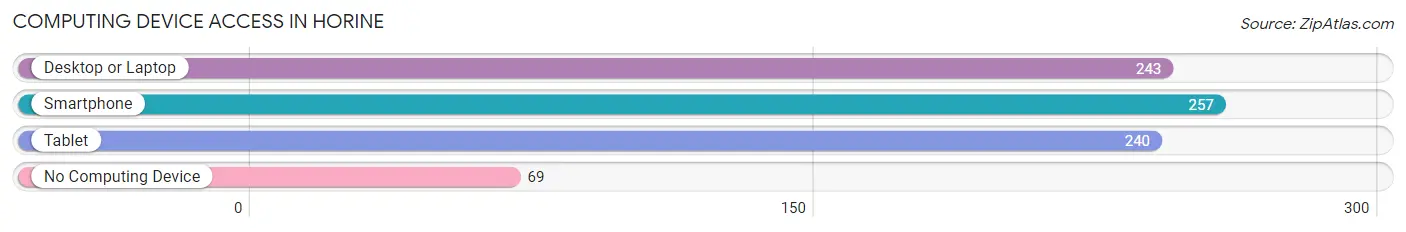
| Device Type | # Households | % Households |
| Desktop or Laptop | 243 | 74.5% |
| Smartphone | 257 | 78.8% |
| Tablet | 240 | 73.6% |
| No Computing Device | 69 | 21.2% |
| Total | 326 | 100.0% |
Internet Access in Horine
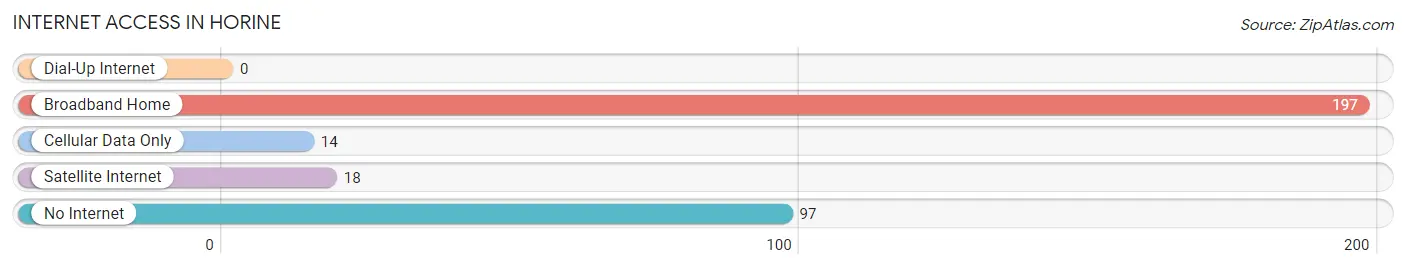
| Internet Type | # Households | % Households |
| Dial-Up Internet | 0 | 0.0% |
| Broadband Home | 197 | 60.4% |
| Cellular Data Only | 14 | 4.3% |
| Satellite Internet | 18 | 5.5% |
| No Internet | 97 | 29.7% |
| Total | 326 | 100.0% |
Horine Summary
Horine is a small unincorporated community located in St. Louis County, Missouri. It is situated in the northwest corner of the county, just south of the city of St. Louis. The community is bordered by the Missouri River to the east, the Mississippi River to the west, and the Meramec River to the south.
History
The area that is now Horine was first settled in the early 1800s by German immigrants. The community was originally known as “Horn’s Corner” after the family that owned the land. In 1876, the name was changed to Horine after the family that owned the land at the time.
The community was primarily an agricultural area, with many of the residents working in the fields and tending to their crops. In the late 1800s, the area began to develop as a small industrial center, with several factories and businesses being established.
Geography
Horine is located in the northwest corner of St. Louis County, just south of the city of St. Louis. The community is bordered by the Missouri River to the east, the Mississippi River to the west, and the Meramec River to the south. The area is mostly flat, with some rolling hills in the northern part of the community.
The climate in Horine is typical of the Midwest, with hot summers and cold winters. The average temperature in the summer is around 80 degrees Fahrenheit, while the average temperature in the winter is around 30 degrees Fahrenheit.
Economy
The economy of Horine is primarily based on agriculture and manufacturing. The area is home to several small businesses, including a few restaurants, a grocery store, and a few other retail stores. The community also has a few industrial plants, including a steel mill and a paper mill.
The area is also home to several farms, which produce a variety of crops, including corn, soybeans, wheat, and hay. The farms also raise livestock, including cattle, pigs, and chickens.
Demographics
As of the 2010 census, the population of Horine was 1,845. The racial makeup of the community was 97.3% White, 0.7% African American, 0.3% Native American, 0.2% Asian, and 1.5% from other races. The median household income was $45,000, and the median home value was $150,000.
The majority of the population is employed in the agricultural and manufacturing industries. The unemployment rate in the area is slightly higher than the national average, at 6.2%.
Conclusion
Horine is a small unincorporated community located in St. Louis County, Missouri. It is situated in the northwest corner of the county, just south of the city of St. Louis. The community is bordered by the Missouri River to the east, the Mississippi River to the west, and the Meramec River to the south. The economy of Horine is primarily based on agriculture and manufacturing, and the population is mostly employed in these industries. The population of Horine was 1,845 as of the 2010 census, and the median household income was $45,000.
Common Questions
What is Per Capita Income in Horine?
Per Capita income in Horine is $20,520.
What is the Median Family Income in Horine?
Median Family Income in Horine is $49,514.
What is the Median Household income in Horine?
Median Household Income in Horine is $44,265.
What is Income or Wage Gap in Horine?
Income or Wage Gap in Horine is 54.4%.
Women in Horine earn 45.6 cents for every dollar earned by a man.
What is Inequality or Gini Index in Horine?
Inequality or Gini Index in Horine is 0.39.
What is the Total Population of Horine?
Total Population of Horine is 945.
What is the Total Male Population of Horine?
Total Male Population of Horine is 470.
What is the Total Female Population of Horine?
Total Female Population of Horine is 475.
What is the Ratio of Males per 100 Females in Horine?
There are 98.95 Males per 100 Females in Horine.
What is the Ratio of Females per 100 Males in Horine?
There are 101.06 Females per 100 Males in Horine.
What is the Median Population Age in Horine?
Median Population Age in Horine is 32.5 Years.
What is the Average Family Size in Horine
Average Family Size in Horine is 3.4 People.
What is the Average Household Size in Horine
Average Household Size in Horine is 2.9 People.
How Large is the Labor Force in Horine?
There are 379 People in the Labor Forcein in Horine.
What is the Percentage of People in the Labor Force in Horine?
49.2% of People are in the Labor Force in Horine.
What is the Unemployment Rate in Horine?
Unemployment Rate in Horine is 11.9%.