Zip Codes with the Highest Percentage of Population Employed in Computer & Mathematics in Kansas City, MO

RELATED REPORTS & OPTIONS

Computer & Mathematics
Population
Families and Households
Female Fertility
Female Fertility (Unmarried)
Race (Community Size)
Race (Percentage)
Ancestry (Community Size)
AfghanAfricanAlaska NativeAlbanianAmericanApacheArabArgentineanArmenianAustralianAustrianBahamianBangladeshiBelgianBelizeanBhutaneseBlackfeetBolivianBrazilianBritishBulgarianBurmeseCanadianCelticCentral AmericanCentral American IndianCherokeeChickasawChileanChippewaChoctawColombianComancheCosta RicanCreeCreekCroatianCrowCubanCzechCzechoslovakianDanishDominicanDutchDutch West IndianEastern EuropeanEcuadorianEgyptianEnglishEthiopianEuropeanFijianFilipinoFinnishFrenchFrench American IndianFrench CanadianGermanGerman RussianGhanaianGreekGuamanian / ChamorroGuatemalanGuyaneseHaitianHonduranHungarianIcelanderIndian (Asian)IndonesianIranianIraqiIrishIroquoisIsraeliItalianJamaicanJapaneseJordanianKenyanKoreanLaotianLatvianLebaneseLiberianLithuanianLuxembourgerMalaysianMexicanMexican American IndianMongolianMoroccanNative HawaiianNavajoNew ZealanderNicaraguanNigerianNorthern EuropeanNorwegianOsageOttawaPakistaniPalestinianPanamanianPennsylvania GermanPeruvianPolishPortuguesePotawatomiPuebloPuerto RicanRomanianRussianSalvadoranSamoanScandinavianScotch-IrishScottishSeminoleSerbianShoshoneSierra LeoneanSiouxSlavicSlovakSloveneSomaliSouth AfricanSouth AmericanSouth American IndianSpaniardSpanishSri LankanSubsaharan AfricanSudaneseSwedishSwissSyrianThaiTrinidadian and TobagonianTurkishUgandanUkrainianUruguayanVenezuelanVietnameseWelshWest IndianYugoslavian
Ancestry (Percentage)
AfghanAfricanAlaska NativeAlbanianAmericanApacheArabArgentineanArmenianAustralianAustrianBahamianBangladeshiBelgianBelizeanBhutaneseBlackfeetBolivianBrazilianBritishBulgarianBurmeseCanadianCelticCentral AmericanCentral American IndianCherokeeChickasawChileanChippewaChoctawColombianComancheCosta RicanCreeCreekCroatianCrowCubanCzechCzechoslovakianDanishDominicanDutchDutch West IndianEastern EuropeanEcuadorianEgyptianEnglishEthiopianEuropeanFijianFilipinoFinnishFrenchFrench American IndianFrench CanadianGermanGerman RussianGhanaianGreekGuamanian / ChamorroGuatemalanGuyaneseHaitianHonduranHungarianIcelanderIndian (Asian)IndonesianIranianIraqiIrishIroquoisIsraeliItalianJamaicanJapaneseJordanianKenyanKoreanLaotianLatvianLebaneseLiberianLithuanianLuxembourgerMalaysianMexicanMexican American IndianMongolianMoroccanNative HawaiianNavajoNew ZealanderNicaraguanNigerianNorthern EuropeanNorwegianOsageOttawaPakistaniPalestinianPanamanianPennsylvania GermanPeruvianPolishPortuguesePotawatomiPuebloPuerto RicanRomanianRussianSalvadoranSamoanScandinavianScotch-IrishScottishSeminoleSerbianShoshoneSierra LeoneanSiouxSlavicSlovakSloveneSomaliSouth AfricanSouth AmericanSouth American IndianSpaniardSpanishSri LankanSubsaharan AfricanSudaneseSwedishSwissSyrianThaiTrinidadian and TobagonianTurkishUgandanUkrainianUruguayanVenezuelanVietnameseWelshWest IndianYugoslavian
Immigrant Origin (Total)
AfghanistanAfricaArgentinaAsiaAustraliaBahamasBangladeshBelarusBelgiumBelizeBoliviaBosnia and HerzegovinaBrazilBulgariaBurma / MyanmarCambodiaCameroonCanadaCaribbeanCentral AmericaChileChinaColombiaCongoCosta RicaCubaCzechoslovakiaDenmarkDominican RepublicEastern AfricaEastern AsiaEastern EuropeEcuadorEgyptEl SalvadorEnglandEritreaEthiopiaEuropeFijiFranceGermanyGhanaGreeceGuatemalaGuyanaHaitiHondurasHong KongHungaryIndiaIndonesiaIranIraqIrelandIsraelItalyJamaicaJapanJordanKazakhstanKenyaKoreaKuwaitLaosLatin AmericaLebanonLiberiaMalaysiaMexicoMicronesiaMiddle AfricaMoroccoNepalNetherlandsNicaraguaNigeriaNorthern AfricaNorthern EuropeOceaniaPakistanPeruPhilippinesPolandPortugalRomaniaRussiaSaudi ArabiaScotlandSierra LeoneSomaliaSouth AfricaSouth AmericaSouth Central AsiaSouth Eastern AsiaSouthern EuropeSpainSri LankaSudanSwedenSwitzerlandSyriaTaiwanThailandTrinidad and TobagoTurkeyUgandaUkraineUruguayVenezuelaVietnamWestern AfricaWestern AsiaWestern EuropeZaireZimbabwe
Immigrant Origin (Percentage)
AfghanistanAfricaArgentinaAsiaAustraliaBahamasBangladeshBelarusBelgiumBelizeBoliviaBosnia and HerzegovinaBrazilBulgariaBurma / MyanmarCambodiaCameroonCanadaCaribbeanCentral AmericaChileChinaColombiaCongoCosta RicaCubaCzechoslovakiaDenmarkDominican RepublicEastern AfricaEastern AsiaEastern EuropeEcuadorEgyptEl SalvadorEnglandEritreaEthiopiaEuropeFijiFranceGermanyGhanaGreeceGuatemalaGuyanaHaitiHondurasHong KongHungaryIndiaIndonesiaIranIraqIrelandIsraelItalyJamaicaJapanJordanKazakhstanKenyaKoreaKuwaitLaosLatin AmericaLebanonLiberiaMalaysiaMexicoMicronesiaMiddle AfricaMoroccoNepalNetherlandsNicaraguaNigeriaNorthern AfricaNorthern EuropeOceaniaPakistanPeruPhilippinesPolandPortugalRomaniaRussiaSaudi ArabiaScotlandSierra LeoneSomaliaSouth AfricaSouth AmericaSouth Central AsiaSouth Eastern AsiaSouthern EuropeSpainSri LankaSudanSwedenSwitzerlandSyriaTaiwanThailandTrinidad and TobagoTurkeyUgandaUkraineUruguayVenezuelaVietnamWestern AfricaWestern AsiaWestern EuropeZaireZimbabwe
Income
Income (Families)
Income (Households)
Poverty
Poverty (Families)
Unemployment
Employment Occupations
Employment Industries
Employer Class
Commute Time
Commute Means
School Enrollment
Education by Degree Field
Occupancy
Finances
Physical Characteristics
Kansas City
Compare Zip Codes
Comparison Subject

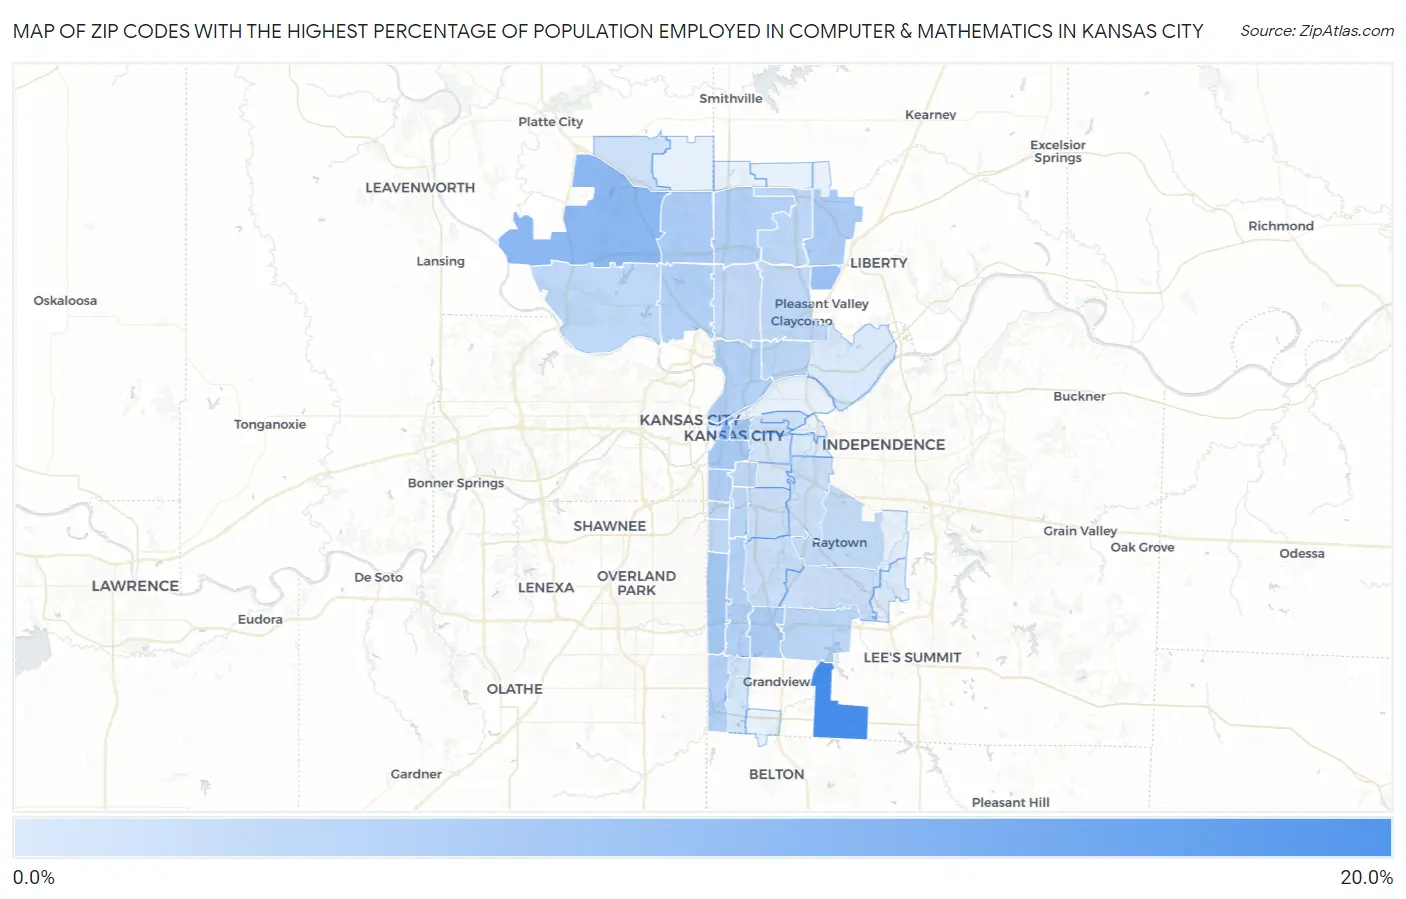
Map of Zip Codes with the Highest Percentage of Population Employed in Computer & Mathematics in Kansas City

0.0%
20.0%
Zip Codes with the Highest Percentage of Population Employed in Computer & Mathematics in Kansas City Map

Zip Codes with the Highest Percentage of Population Employed in Computer & Mathematics in Kansas City, MO

Zip Code % Employed vs State vs National
1.6414917.0%3.2%(+13.8)#43.5%(+13.5)#191
2.641539.0%3.2%(+5.79)#163.5%(+5.45)#904
3.641058.8%3.2%(+5.60)#173.5%(+5.27)#953
4.641587.4%3.2%(+4.17)#253.5%(+3.83)#1,441
5.641146.2%3.2%(+3.04)#393.5%(+2.71)#2,122
6.641066.2%3.2%(+2.97)#423.5%(+2.64)#2,169
7.641086.1%3.2%(+2.89)#453.5%(+2.56)#2,238
8.641545.7%3.2%(+2.52)#493.5%(+2.19)#2,574
9.641575.6%3.2%(+2.41)#543.5%(+2.07)#2,678
10.641375.4%3.2%(+2.23)#593.5%(+1.90)#2,870
11.641115.3%3.2%(+2.08)#653.5%(+1.75)#3,030
12.641454.8%3.2%(+1.58)#763.5%(+1.25)#3,674
13.641164.8%3.2%(+1.57)#773.5%(+1.24)#3,692
14.641514.7%3.2%(+1.54)#783.5%(+1.21)#3,733
15.641554.7%3.2%(+1.47)#813.5%(+1.14)#3,839
16.641314.5%3.2%(+1.28)#933.5%(+0.945)#4,133
17.641563.9%3.2%(+0.721)#1193.5%(+0.389)#5,229
18.641343.9%3.2%(+0.675)#1223.5%(+0.344)#5,317
19.641173.8%3.2%(+0.616)#1243.5%(+0.284)#5,461
20.641103.8%3.2%(+0.573)#1263.5%(+0.242)#5,561
21.641093.6%3.2%(+0.437)#1303.5%(+0.105)#5,894
22.641123.6%3.2%(+0.432)#1313.5%(+0.100)#5,904
23.641523.6%3.2%(+0.394)#1333.5%(+0.063)#5,978
24.641193.4%3.2%(+0.217)#1493.5%(-0.115)#6,460
25.641183.3%3.2%(+0.095)#1583.5%(-0.236)#6,819
26.641133.2%3.2%(+0.042)#1633.5%(-0.290)#6,995
27.641333.0%3.2%(-0.220)#1863.5%(-0.552)#7,834
28.641382.4%3.2%(-0.798)#2343.5%(-1.13)#10,060
29.641322.3%3.2%(-0.938)#2443.5%(-1.27)#10,656
30.641242.2%3.2%(-0.971)#2483.5%(-1.30)#10,789
31.641302.1%3.2%(-1.04)#2583.5%(-1.38)#11,128
32.641292.0%3.2%(-1.17)#2713.5%(-1.50)#11,705
33.641631.8%3.2%(-1.38)#2923.5%(-1.71)#12,686
34.641231.6%3.2%(-1.63)#3243.5%(-1.97)#14,033
35.641271.5%3.2%(-1.69)#3333.5%(-2.03)#14,382
36.641461.2%3.2%(-1.96)#3813.5%(-2.29)#15,938
37.641281.0%3.2%(-2.16)#4243.5%(-2.50)#17,206
38.641610.71%3.2%(-2.48)#4953.5%(-2.81)#19,161
39.641260.51%3.2%(-2.69)#5383.5%(-3.02)#20,447
40.641390.44%3.2%(-2.75)#5483.5%(-3.08)#20,846

Common Questions

What are the Top 10 Zip Codes with the Highest Percentage of Population Employed in Computer & Mathematics in Kansas City, MO?
Top 10 Zip Codes with the Highest Percentage of Population Employed in Computer & Mathematics in Kansas City, MO are:
#1
17.0%
#2
9.0%
#3
8.8%
#4
7.4%
#5
6.2%
#6
6.2%
#7
6.1%
#8
5.7%
#9
5.6%
#10
5.4%
What zip code has the Highest Percentage of Population Employed in Computer & Mathematics in Kansas City, MO?
64149 has the Highest Percentage of Population Employed in Computer & Mathematics in Kansas City, MO with 17.0%.
What is the Percentage of Population Employed in Computer & Mathematics in Kansas City, MO?
Percentage of Population Employed in Computer & Mathematics in Kansas City is 4.3%.
What is the Percentage of Population Employed in Computer & Mathematics in Missouri?
Percentage of Population Employed in Computer & Mathematics in Missouri is 3.2%.
What is the Percentage of Population Employed in Computer & Mathematics in the United States?
Percentage of Population Employed in Computer & Mathematics in the United States is 3.5%.