Peculiar, MO Map & Demographics
Peculiar Map
Peculiar Overview
$33,442
PER CAPITA INCOME
$96,781
AVG FAMILY INCOME
$91,783
AVG HOUSEHOLD INCOME
17.5%
WAGE / INCOME GAP [ % ]
82.5¢/ $1
WAGE / INCOME GAP [ $ ]
0.35
INEQUALITY / GINI INDEX
5,675
TOTAL POPULATION
3,007
MALE POPULATION
2,668
FEMALE POPULATION
112.71
MALES / 100 FEMALES
88.73
FEMALES / 100 MALES
36.2
MEDIAN AGE
3.1
AVG FAMILY SIZE
2.7
AVG HOUSEHOLD SIZE
3,088
LABOR FORCE [ PEOPLE ]
69.8%
PERCENT IN LABOR FORCE
4.3%
UNEMPLOYMENT RATE
Peculiar Zip Codes
Peculiar Area Codes
Income in Peculiar
Income Overview in Peculiar
Per Capita Income in Peculiar is $33,442, while median incomes of families and households are $96,781 and $91,783 respectively.
| Characteristic | Number | Measure |
| Per Capita Income | 5,675 | $33,442 |
| Median Family Income | 1,472 | $96,781 |
| Mean Family Income | 1,472 | $99,809 |
| Median Household Income | 2,075 | $91,783 |
| Mean Household Income | 2,075 | $89,096 |
| Income Deficit | 1,472 | $0 |
| Wage / Income Gap (%) | 5,675 | 17.48% |
| Wage / Income Gap ($) | 5,675 | 82.52¢ per $1 |
| Gini / Inequality Index | 5,675 | 0.35 |
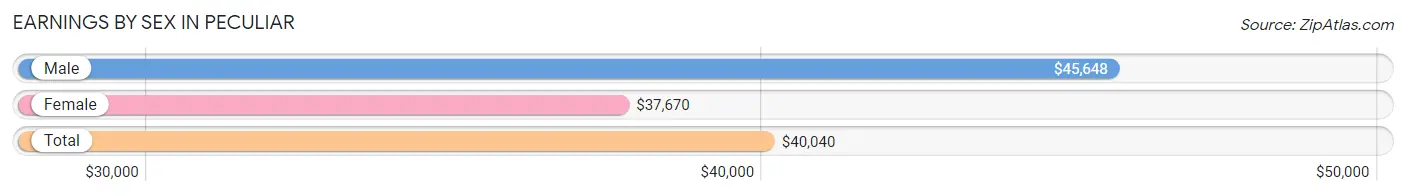
Earnings by Sex in Peculiar
Average Earnings in Peculiar are $40,040, $45,648 for men and $37,670 for women, a difference of 17.5%.
| Sex | Number | Average Earnings |
| Male | 1,933 (60.2%) | $45,648 |
| Female | 1,277 (39.8%) | $37,670 |
| Total | 3,210 (100.0%) | $40,040 |
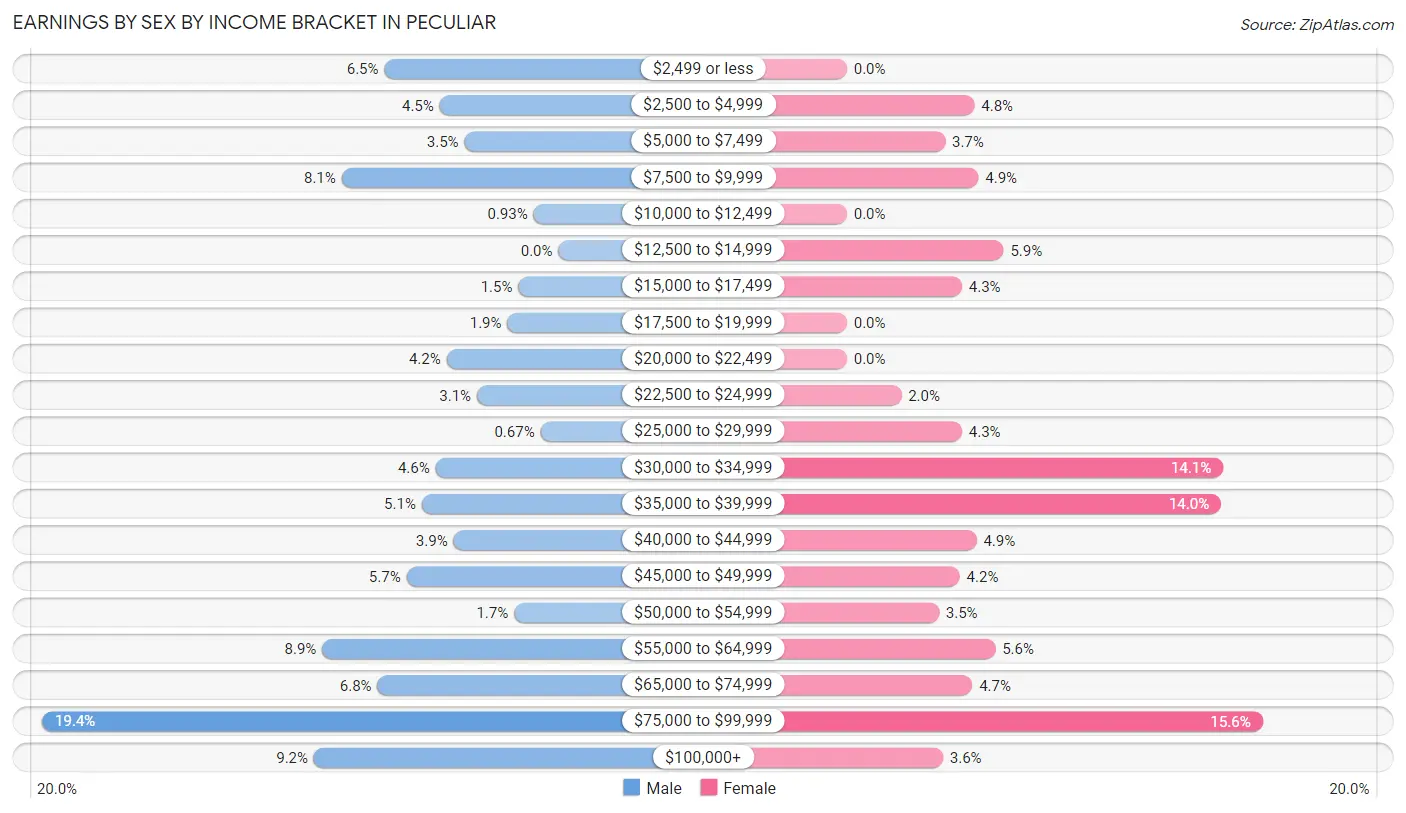
Earnings by Sex by Income Bracket in Peculiar
The most common earnings brackets in Peculiar are $75,000 to $99,999 for men (374 | 19.4%) and $75,000 to $99,999 for women (199 | 15.6%).
| Income | Male | Female |
| $2,499 or less | 126 (6.5%) | 0 (0.0%) |
| $2,500 to $4,999 | 86 (4.4%) | 61 (4.8%) |
| $5,000 to $7,499 | 68 (3.5%) | 47 (3.7%) |
| $7,500 to $9,999 | 157 (8.1%) | 63 (4.9%) |
| $10,000 to $12,499 | 18 (0.9%) | 0 (0.0%) |
| $12,500 to $14,999 | 0 (0.0%) | 75 (5.9%) |
| $15,000 to $17,499 | 29 (1.5%) | 55 (4.3%) |
| $17,500 to $19,999 | 37 (1.9%) | 0 (0.0%) |
| $20,000 to $22,499 | 81 (4.2%) | 0 (0.0%) |
| $22,500 to $24,999 | 59 (3.0%) | 26 (2.0%) |
| $25,000 to $29,999 | 13 (0.7%) | 55 (4.3%) |
| $30,000 to $34,999 | 89 (4.6%) | 180 (14.1%) |
| $35,000 to $39,999 | 99 (5.1%) | 179 (14.0%) |
| $40,000 to $44,999 | 76 (3.9%) | 62 (4.9%) |
| $45,000 to $49,999 | 110 (5.7%) | 54 (4.2%) |
| $50,000 to $54,999 | 32 (1.7%) | 44 (3.5%) |
| $55,000 to $64,999 | 171 (8.8%) | 71 (5.6%) |
| $65,000 to $74,999 | 131 (6.8%) | 60 (4.7%) |
| $75,000 to $99,999 | 374 (19.4%) | 199 (15.6%) |
| $100,000+ | 177 (9.2%) | 46 (3.6%) |
| Total | 1,933 (100.0%) | 1,277 (100.0%) |
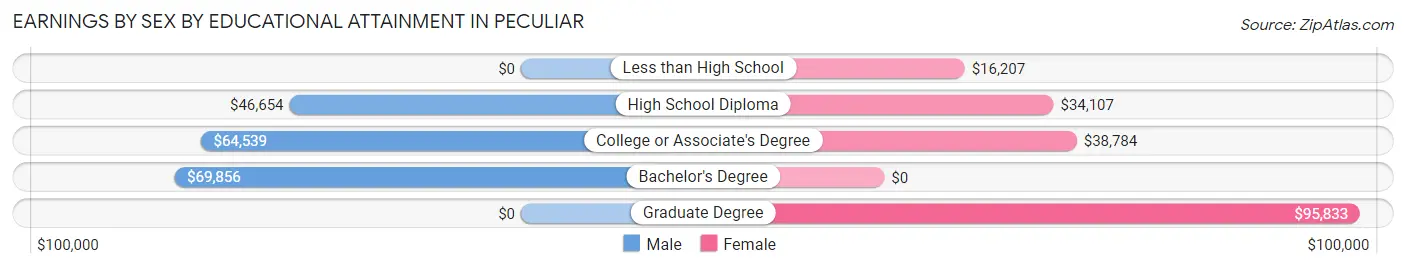
Earnings by Sex by Educational Attainment in Peculiar
Average earnings in Peculiar are $56,933 for men and $39,705 for women, a difference of 30.3%. Men with an educational attainment of bachelor's degree enjoy the highest average annual earnings of $69,856, while those with high school diploma education earn the least with $46,654. Women with an educational attainment of graduate degree earn the most with the average annual earnings of $95,833, while those with less than high school education have the smallest earnings of $16,207.
| Educational Attainment | Male Income | Female Income |
| Less than High School | - | - |
| High School Diploma | $46,654 | $34,107 |
| College or Associate's Degree | $64,539 | $38,784 |
| Bachelor's Degree | $69,856 | $0 |
| Graduate Degree | - | - |
| Total | $56,933 | $39,705 |
Family Income in Peculiar
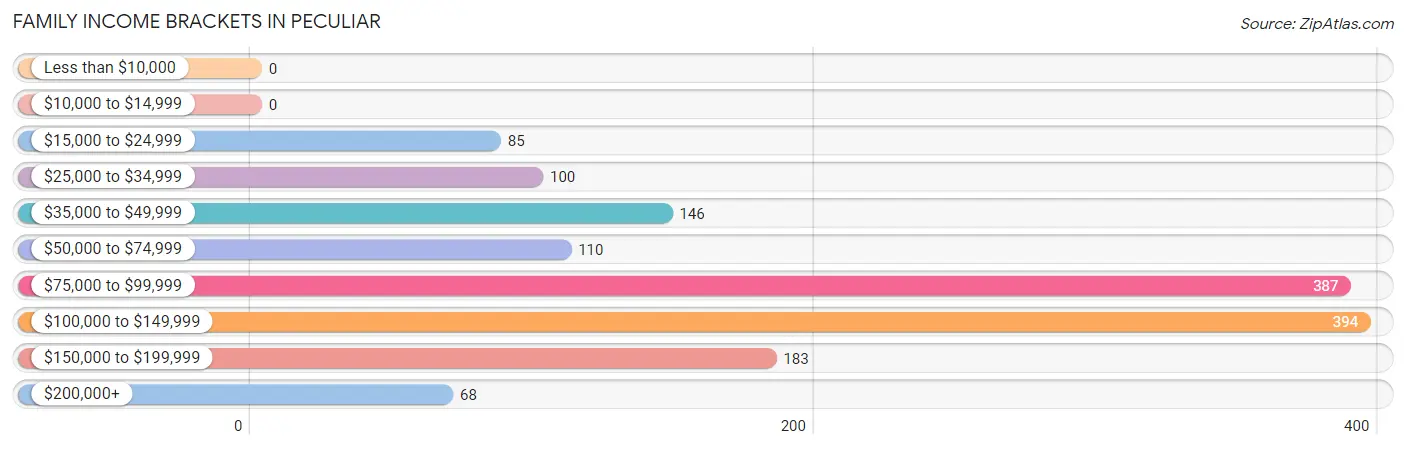
Family Income Brackets in Peculiar
According to the Peculiar family income data, there are 394 families falling into the $100,000 to $149,999 income range, which is the most common income bracket and makes up 26.8% of all families.
| Income Bracket | # Families | % Families |
| Less than $10,000 | 0 | 0.0% |
| $10,000 to $14,999 | 0 | 0.0% |
| $15,000 to $24,999 | 85 | 5.8% |
| $25,000 to $34,999 | 100 | 6.8% |
| $35,000 to $49,999 | 146 | 9.9% |
| $50,000 to $74,999 | 110 | 7.5% |
| $75,000 to $99,999 | 387 | 26.3% |
| $100,000 to $149,999 | 394 | 26.8% |
| $150,000 to $199,999 | 183 | 12.4% |
| $200,000+ | 68 | 4.6% |
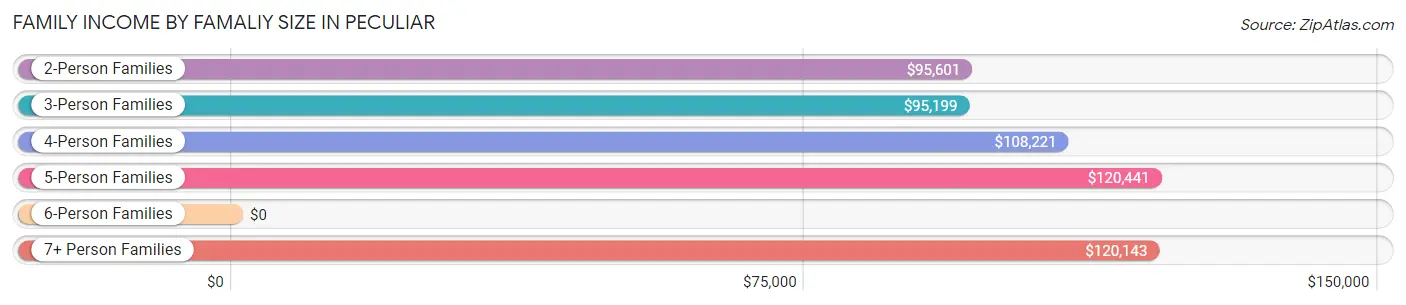
Family Income by Famaliy Size in Peculiar
5-person families (128 | 8.7%) account for the highest median family income in Peculiar with $120,441 per family, while 2-person families (694 | 47.1%) have the highest median income of $47,800 per family member.
| Income Bracket | # Families | Median Income |
| 2-Person Families | 694 (47.1%) | $95,601 |
| 3-Person Families | 294 (20.0%) | $95,199 |
| 4-Person Families | 257 (17.5%) | $108,221 |
| 5-Person Families | 128 (8.7%) | $120,441 |
| 6-Person Families | 33 (2.2%) | $0 |
| 7+ Person Families | 66 (4.5%) | $120,143 |
| Total | 1,472 (100.0%) | $96,781 |
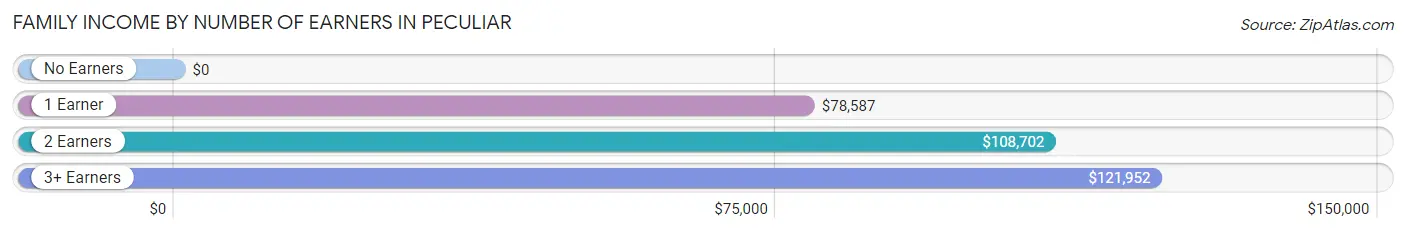
Family Income by Number of Earners in Peculiar
| Number of Earners | # Families | Median Income |
| No Earners | 95 (6.5%) | $0 |
| 1 Earner | 638 (43.3%) | $78,587 |
| 2 Earners | 571 (38.8%) | $108,702 |
| 3+ Earners | 168 (11.4%) | $121,952 |
| Total | 1,472 (100.0%) | $96,781 |
Household Income in Peculiar
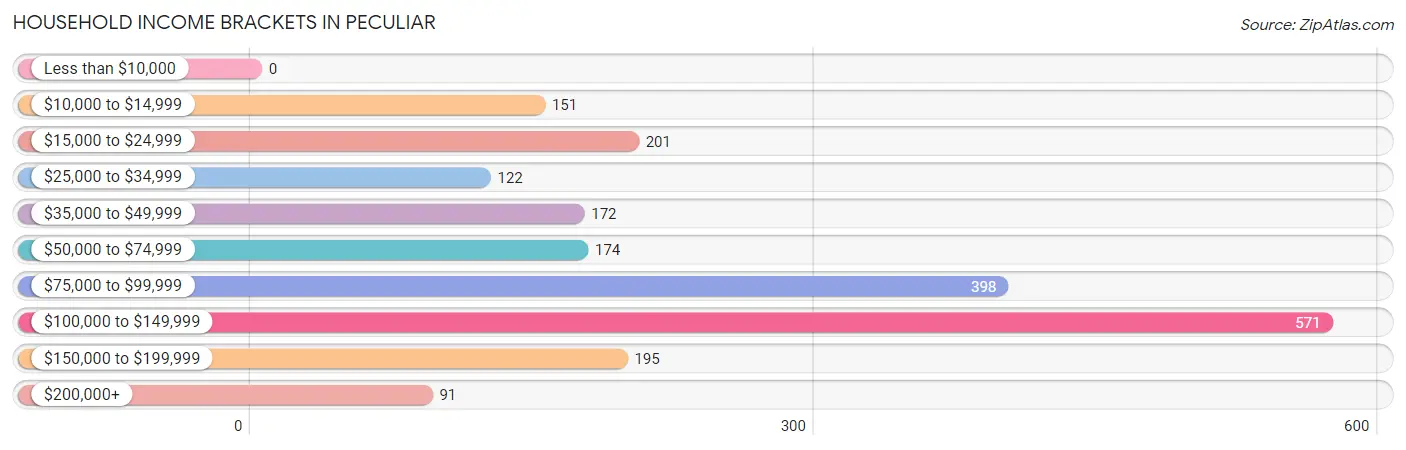
Household Income Brackets in Peculiar
With 571 households falling in the category, the $100,000 to $149,999 income range is the most frequent in Peculiar, accounting for 27.5% of all households.
| Income Bracket | # Households | % Households |
| Less than $10,000 | 0 | 0.0% |
| $10,000 to $14,999 | 151 | 7.3% |
| $15,000 to $24,999 | 201 | 9.7% |
| $25,000 to $34,999 | 122 | 5.9% |
| $35,000 to $49,999 | 172 | 8.3% |
| $50,000 to $74,999 | 174 | 8.4% |
| $75,000 to $99,999 | 398 | 19.2% |
| $100,000 to $149,999 | 571 | 27.5% |
| $150,000 to $199,999 | 195 | 9.4% |
| $200,000+ | 91 | 4.4% |
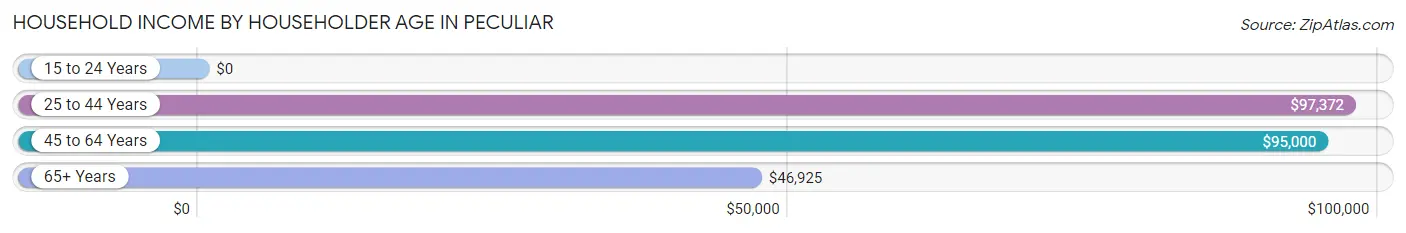
Household Income by Householder Age in Peculiar
The median household income in Peculiar is $91,783, with the highest median household income of $97,372 found in the 25 to 44 years age bracket for the primary householder. A total of 855 households (41.2%) fall into this category. Meanwhile, the 15 to 24 years age bracket for the primary householder has the lowest median household income of $0, with 17 households (0.8%) in this group.
| Income Bracket | # Households | Median Income |
| 15 to 24 Years | 17 (0.8%) | $0 |
| 25 to 44 Years | 855 (41.2%) | $97,372 |
| 45 to 64 Years | 780 (37.6%) | $95,000 |
| 65+ Years | 423 (20.4%) | $46,925 |
| Total | 2,075 (100.0%) | $91,783 |
Poverty in Peculiar
Income Below Poverty by Sex and Age in Peculiar
With 4.9% poverty level for males and 9.8% for females among the residents of Peculiar, under 5 year old males and 45 to 54 year old females are the most vulnerable to poverty, with 33 males (19.1%) and 118 females (21.7%) in their respective age groups living below the poverty level.
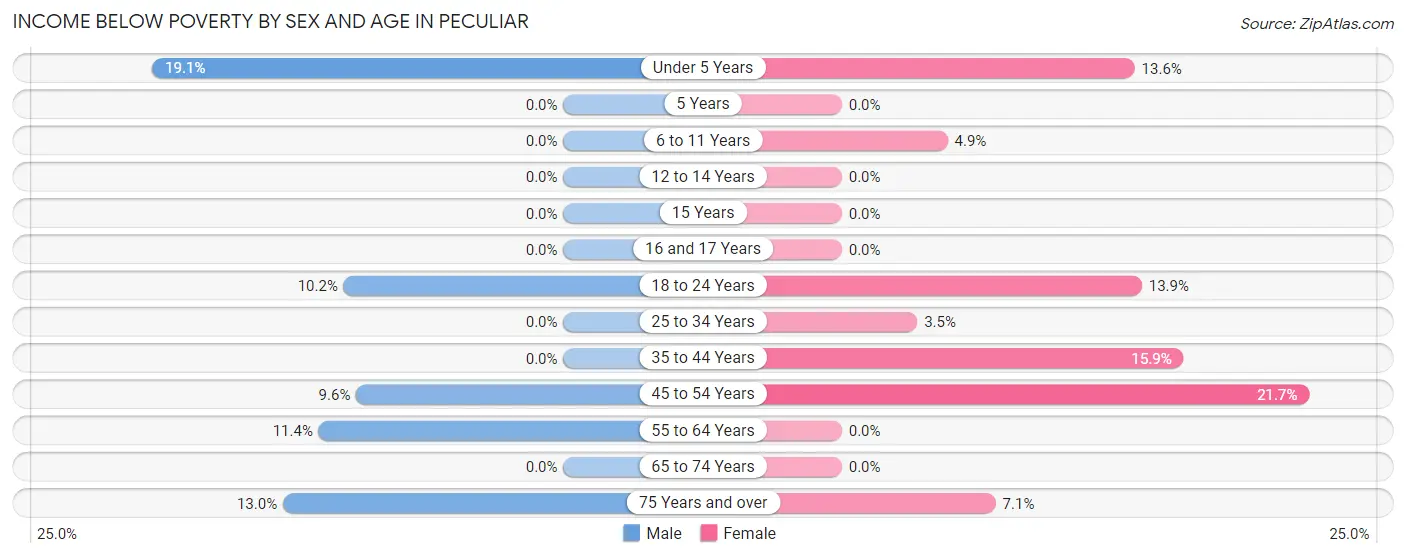
| Age Bracket | Male | Female |
| Under 5 Years | 33 (19.1%) | 25 (13.6%) |
| 5 Years | 0 (0.0%) | 0 (0.0%) |
| 6 to 11 Years | 0 (0.0%) | 13 (4.9%) |
| 12 to 14 Years | 0 (0.0%) | 0 (0.0%) |
| 15 Years | 0 (0.0%) | 0 (0.0%) |
| 16 and 17 Years | 0 (0.0%) | 0 (0.0%) |
| 18 to 24 Years | 27 (10.2%) | 22 (13.9%) |
| 25 to 34 Years | 0 (0.0%) | 12 (3.5%) |
| 35 to 44 Years | 0 (0.0%) | 56 (15.9%) |
| 45 to 54 Years | 37 (9.6%) | 118 (21.7%) |
| 55 to 64 Years | 32 (11.4%) | 0 (0.0%) |
| 65 to 74 Years | 0 (0.0%) | 0 (0.0%) |
| 75 Years and over | 19 (13.0%) | 14 (7.1%) |
| Total | 148 (4.9%) | 260 (9.8%) |
Income Above Poverty by Sex and Age in Peculiar
According to the poverty statistics in Peculiar, males aged 5 years and females aged 5 years are the age groups that are most secure financially, with 100.0% of males and 100.0% of females in these age groups living above the poverty line.
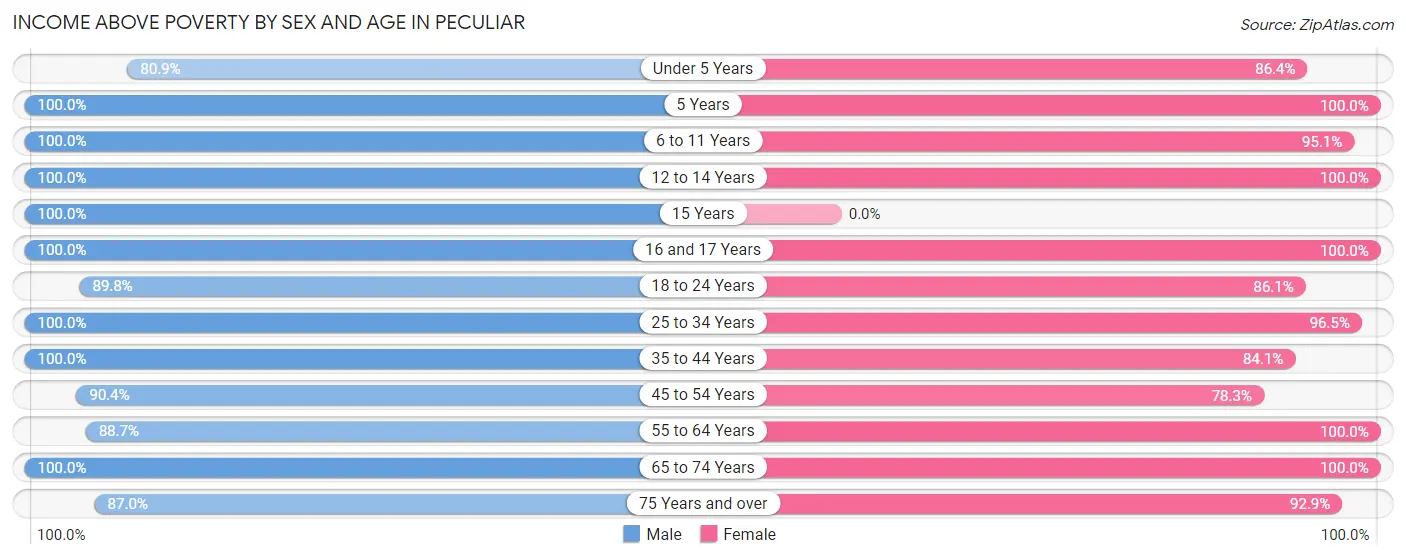
| Age Bracket | Male | Female |
| Under 5 Years | 140 (80.9%) | 159 (86.4%) |
| 5 Years | 23 (100.0%) | 13 (100.0%) |
| 6 to 11 Years | 238 (100.0%) | 252 (95.1%) |
| 12 to 14 Years | 149 (100.0%) | 128 (100.0%) |
| 15 Years | 78 (100.0%) | 0 (0.0%) |
| 16 and 17 Years | 171 (100.0%) | 74 (100.0%) |
| 18 to 24 Years | 238 (89.8%) | 136 (86.1%) |
| 25 to 34 Years | 481 (100.0%) | 331 (96.5%) |
| 35 to 44 Years | 502 (100.0%) | 297 (84.1%) |
| 45 to 54 Years | 348 (90.4%) | 426 (78.3%) |
| 55 to 64 Years | 250 (88.6%) | 225 (100.0%) |
| 65 to 74 Years | 114 (100.0%) | 185 (100.0%) |
| 75 Years and over | 127 (87.0%) | 182 (92.9%) |
| Total | 2,859 (95.1%) | 2,408 (90.2%) |
Income Below Poverty Among Married-Couple Families in Peculiar
The poverty statistics for married-couple families in Peculiar show that 4.1% or 39 of the total 952 families live below the poverty line. Families with 3 or 4 children have the highest poverty rate of 9.0%, comprising of 12 families. On the other hand, families with 1 or 2 children have the lowest poverty rate of 0.0%, which includes 0 families.
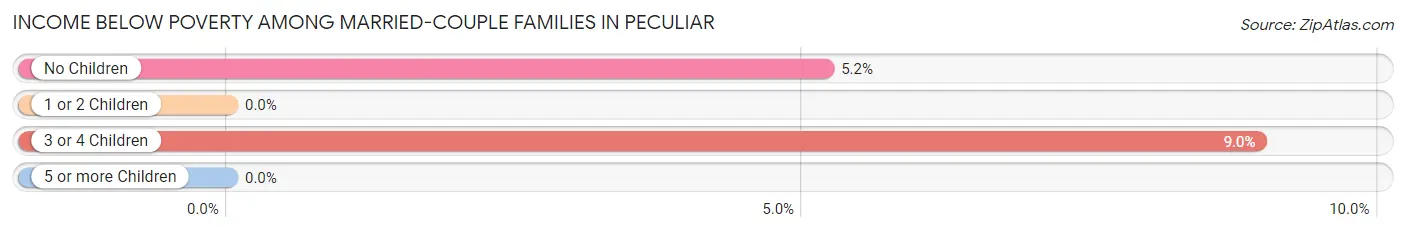
| Children | Above Poverty | Below Poverty |
| No Children | 493 (94.8%) | 27 (5.2%) |
| 1 or 2 Children | 294 (100.0%) | 0 (0.0%) |
| 3 or 4 Children | 122 (91.0%) | 12 (9.0%) |
| 5 or more Children | 4 (100.0%) | 0 (0.0%) |
| Total | 913 (95.9%) | 39 (4.1%) |
Income Below Poverty Among Single-Parent Households in Peculiar
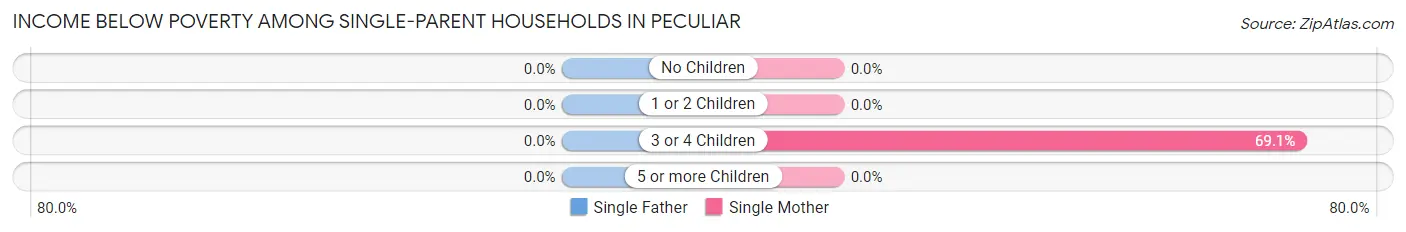
| Children | Single Father | Single Mother |
| No Children | 0 (0.0%) | 0 (0.0%) |
| 1 or 2 Children | 0 (0.0%) | 0 (0.0%) |
| 3 or 4 Children | 0 (0.0%) | 29 (69.1%) |
| 5 or more Children | 0 (0.0%) | 0 (0.0%) |
| Total | 0 (0.0%) | 29 (8.9%) |
Income Below Poverty Among Married-Couple vs Single-Parent Households in Peculiar
The poverty data for Peculiar shows that 39 of the married-couple family households (4.1%) and 29 of the single-parent households (5.6%) are living below the poverty level. Within the married-couple family households, those with 3 or 4 children have the highest poverty rate, with 12 households (9.0%) falling below the poverty line. Among the single-parent households, those with 3 or 4 children have the highest poverty rate, with 29 household (69.1%) living below poverty.
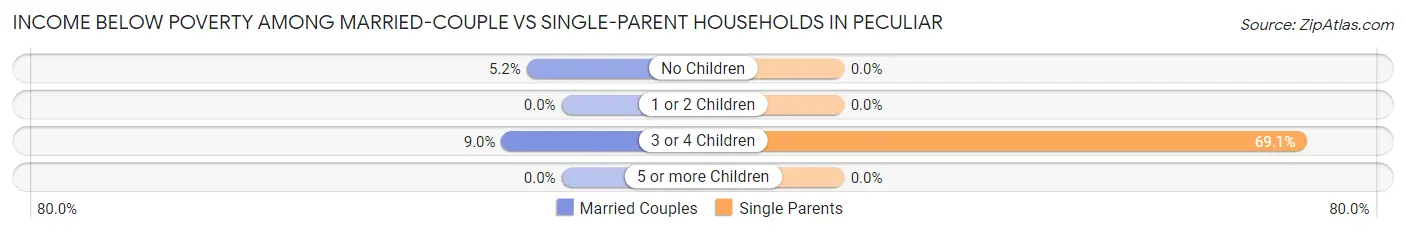
| Children | Married-Couple Families | Single-Parent Households |
| No Children | 27 (5.2%) | 0 (0.0%) |
| 1 or 2 Children | 0 (0.0%) | 0 (0.0%) |
| 3 or 4 Children | 12 (9.0%) | 29 (69.1%) |
| 5 or more Children | 0 (0.0%) | 0 (0.0%) |
| Total | 39 (4.1%) | 29 (5.6%) |
Race in Peculiar
The most populous races in Peculiar are White / Caucasian (5,081 | 89.5%), Hispanic or Latino (411 | 7.2%), and Two or more Races (402 | 7.1%).
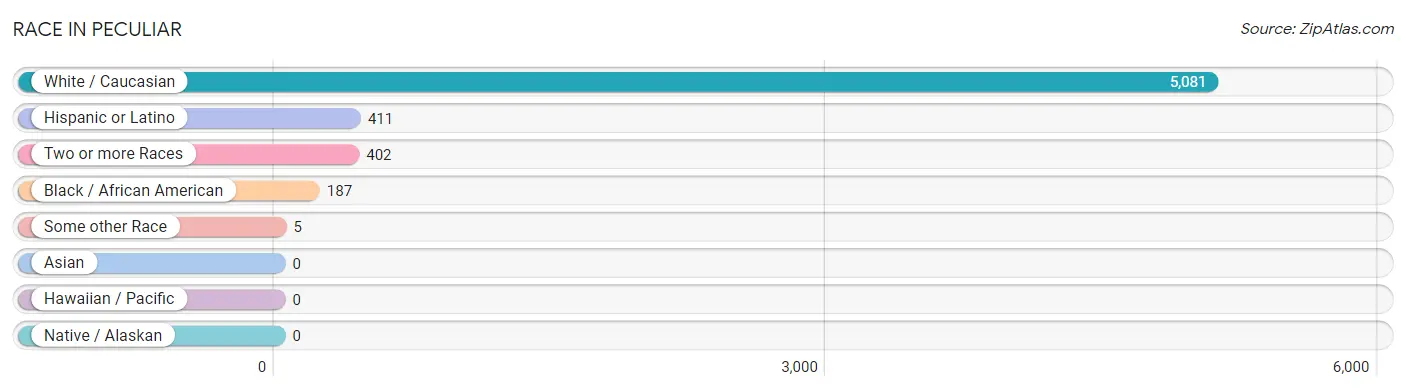
| Race | # Population | % Population |
| Asian | 0 | 0.0% |
| Black / African American | 187 | 3.3% |
| Hawaiian / Pacific | 0 | 0.0% |
| Hispanic or Latino | 411 | 7.2% |
| Native / Alaskan | 0 | 0.0% |
| White / Caucasian | 5,081 | 89.5% |
| Two or more Races | 402 | 7.1% |
| Some other Race | 5 | 0.1% |
| Total | 5,675 | 100.0% |
Ancestry in Peculiar
The most populous ancestries reported in Peculiar are German (786 | 13.9%), Irish (680 | 12.0%), English (590 | 10.4%), American (540 | 9.5%), and Mexican (209 | 3.7%), together accounting for 49.4% of all Peculiar residents.
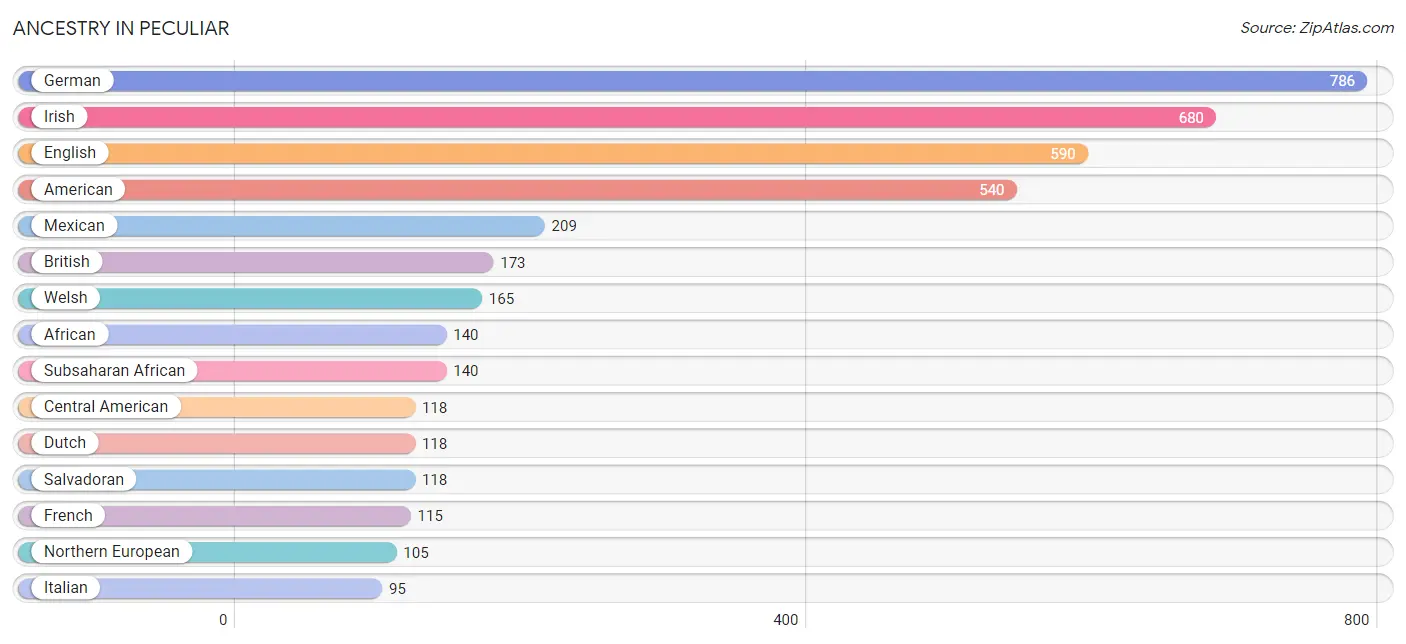
| Ancestry | # Population | % Population |
| African | 140 | 2.5% |
| American | 540 | 9.5% |
| Blackfeet | 71 | 1.3% |
| British | 173 | 3.0% |
| Central American | 118 | 2.1% |
| Danish | 11 | 0.2% |
| Dutch | 118 | 2.1% |
| English | 590 | 10.4% |
| European | 52 | 0.9% |
| French | 115 | 2.0% |
| French Canadian | 27 | 0.5% |
| German | 786 | 13.9% |
| Greek | 67 | 1.2% |
| Irish | 680 | 12.0% |
| Italian | 95 | 1.7% |
| Laotian | 81 | 1.4% |
| Luxembourger | 24 | 0.4% |
| Mexican | 209 | 3.7% |
| Northern European | 105 | 1.8% |
| Polish | 59 | 1.0% |
| Portuguese | 32 | 0.6% |
| Puerto Rican | 84 | 1.5% |
| Russian | 45 | 0.8% |
| Salvadoran | 118 | 2.1% |
| Scotch-Irish | 33 | 0.6% |
| Scottish | 22 | 0.4% |
| Subsaharan African | 140 | 2.5% |
| Swedish | 13 | 0.2% |
| Welsh | 165 | 2.9% | View All 29 Rows |
Immigrants in Peculiar
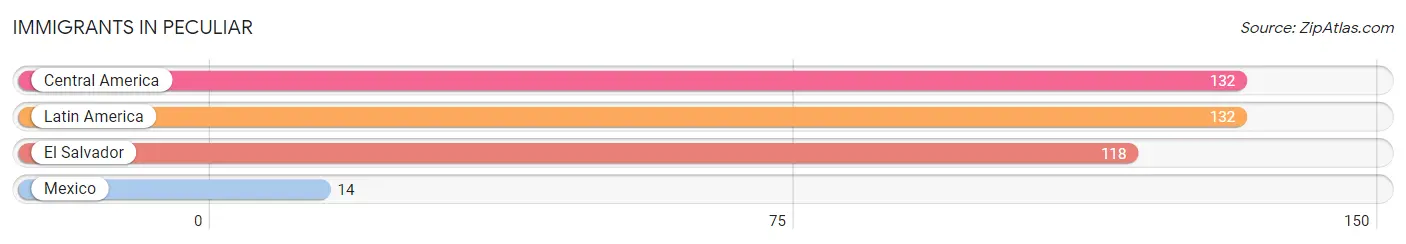
The most numerous immigrant groups reported in Peculiar came from Central America (132 | 2.3%), Latin America (132 | 2.3%), El Salvador (118 | 2.1%), and Mexico (14 | 0.3%), together accounting for 7.0% of all Peculiar residents.
| Immigration Origin | # Population | % Population |
| Central America | 132 | 2.3% |
| El Salvador | 118 | 2.1% |
| Latin America | 132 | 2.3% |
| Mexico | 14 | 0.3% | View All 4 Rows |
Sex and Age in Peculiar
Sex and Age in Peculiar
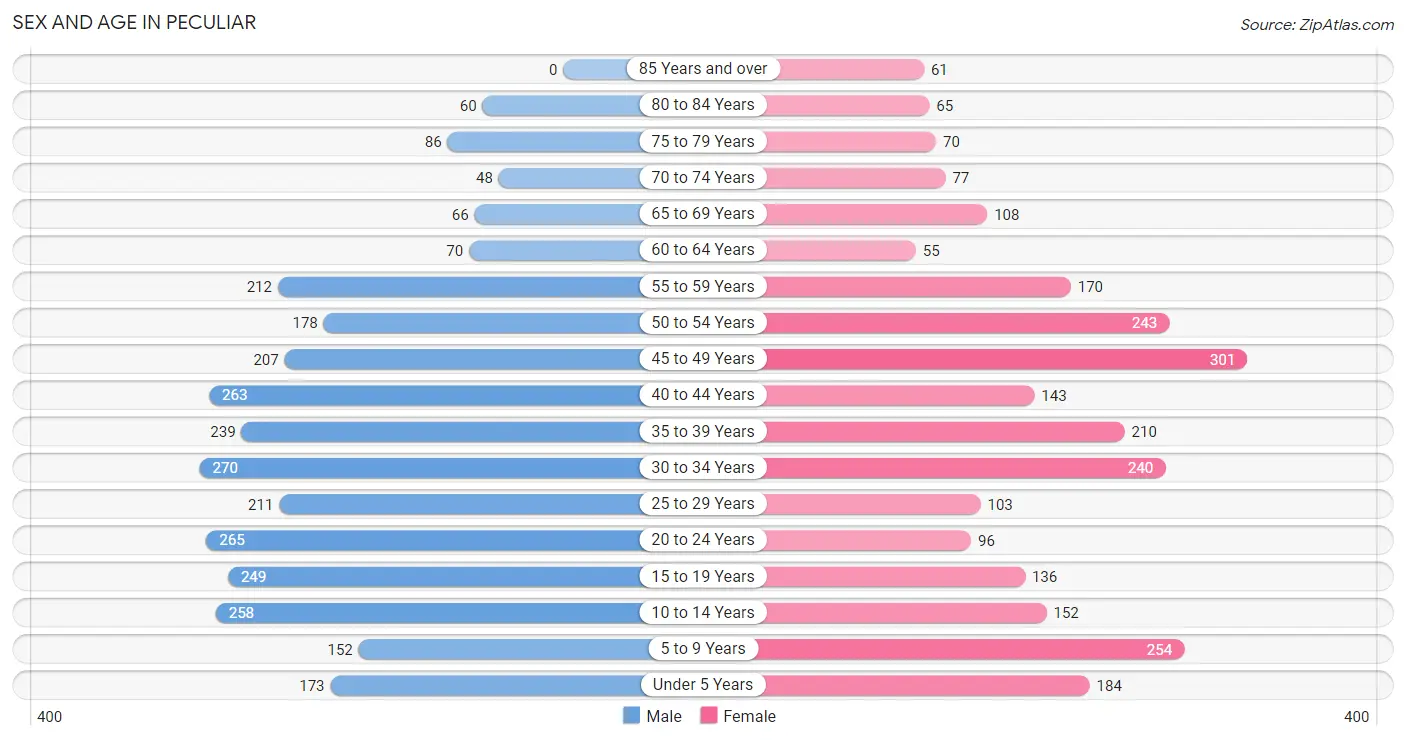
The most populous age groups in Peculiar are 30 to 34 Years (270 | 9.0%) for men and 45 to 49 Years (301 | 11.3%) for women.
| Age Bracket | Male | Female |
| Under 5 Years | 173 (5.8%) | 184 (6.9%) |
| 5 to 9 Years | 152 (5.1%) | 254 (9.5%) |
| 10 to 14 Years | 258 (8.6%) | 152 (5.7%) |
| 15 to 19 Years | 249 (8.3%) | 136 (5.1%) |
| 20 to 24 Years | 265 (8.8%) | 96 (3.6%) |
| 25 to 29 Years | 211 (7.0%) | 103 (3.9%) |
| 30 to 34 Years | 270 (9.0%) | 240 (9.0%) |
| 35 to 39 Years | 239 (8.0%) | 210 (7.9%) |
| 40 to 44 Years | 263 (8.7%) | 143 (5.4%) |
| 45 to 49 Years | 207 (6.9%) | 301 (11.3%) |
| 50 to 54 Years | 178 (5.9%) | 243 (9.1%) |
| 55 to 59 Years | 212 (7.0%) | 170 (6.4%) |
| 60 to 64 Years | 70 (2.3%) | 55 (2.1%) |
| 65 to 69 Years | 66 (2.2%) | 108 (4.1%) |
| 70 to 74 Years | 48 (1.6%) | 77 (2.9%) |
| 75 to 79 Years | 86 (2.9%) | 70 (2.6%) |
| 80 to 84 Years | 60 (2.0%) | 65 (2.4%) |
| 85 Years and over | 0 (0.0%) | 61 (2.3%) |
| Total | 3,007 (100.0%) | 2,668 (100.0%) |
Families and Households in Peculiar
Median Family Size in Peculiar
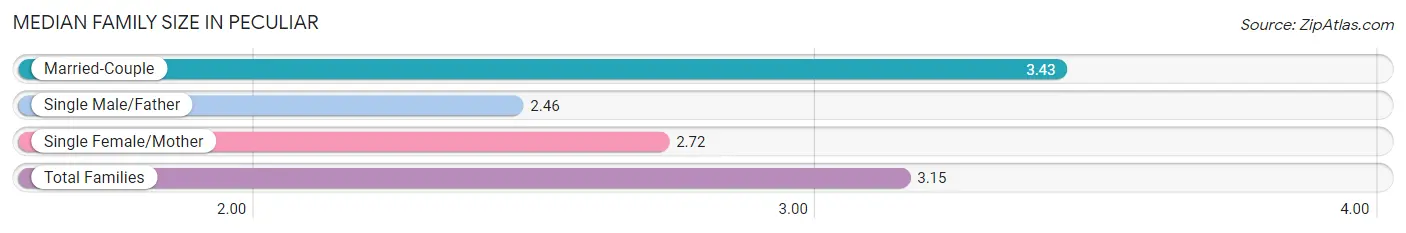
The median family size in Peculiar is 3.15 persons per family, with married-couple families (952 | 64.7%) accounting for the largest median family size of 3.43 persons per family. On the other hand, single male/father families (193 | 13.1%) represent the smallest median family size with 2.46 persons per family.
| Family Type | # Families | Family Size |
| Married-Couple | 952 (64.7%) | 3.43 |
| Single Male/Father | 193 (13.1%) | 2.46 |
| Single Female/Mother | 327 (22.2%) | 2.72 |
| Total Families | 1,472 (100.0%) | 3.15 |
Median Household Size in Peculiar
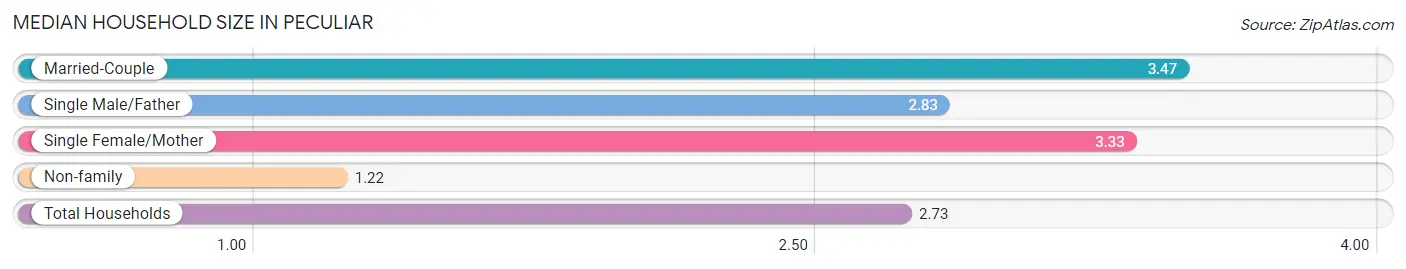
The median household size in Peculiar is 2.73 persons per household, with married-couple households (952 | 45.9%) accounting for the largest median household size of 3.47 persons per household. non-family households (603 | 29.1%) represent the smallest median household size with 1.22 persons per household.
| Household Type | # Households | Household Size |
| Married-Couple | 952 (45.9%) | 3.47 |
| Single Male/Father | 193 (9.3%) | 2.83 |
| Single Female/Mother | 327 (15.8%) | 3.33 |
| Non-family | 603 (29.1%) | 1.22 |
| Total Households | 2,075 (100.0%) | 2.73 |
Household Size by Marriage Status in Peculiar
Out of a total of 2,075 households in Peculiar, 1,472 (70.9%) are family households, while 603 (29.1%) are nonfamily households. The most numerous type of family households are 2-person households, comprising 560, and the most common type of nonfamily households are 1-person households, comprising 503.
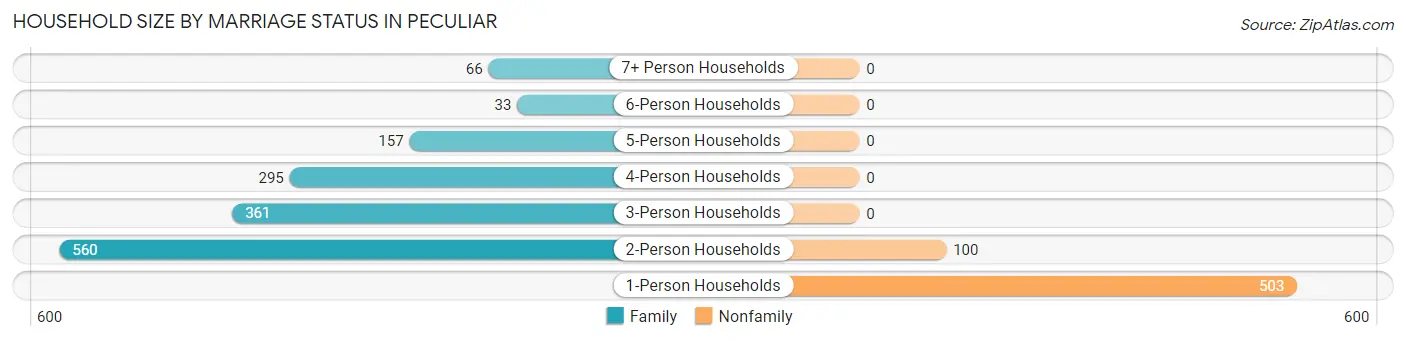
| Household Size | Family Households | Nonfamily Households |
| 1-Person Households | - | 503 (24.2%) |
| 2-Person Households | 560 (27.0%) | 100 (4.8%) |
| 3-Person Households | 361 (17.4%) | 0 (0.0%) |
| 4-Person Households | 295 (14.2%) | 0 (0.0%) |
| 5-Person Households | 157 (7.6%) | 0 (0.0%) |
| 6-Person Households | 33 (1.6%) | 0 (0.0%) |
| 7+ Person Households | 66 (3.2%) | 0 (0.0%) |
| Total | 1,472 (70.9%) | 603 (29.1%) |
Female Fertility in Peculiar
Fertility by Age in Peculiar
Average fertility rate in Peculiar is 56.0 births per 1,000 women. Women in the age bracket of 15 to 19 years have the highest fertility rate with 221.0 births per 1,000 women. Women in the age bracket of 15 to 19 years acount for 42.9% of all women with births.
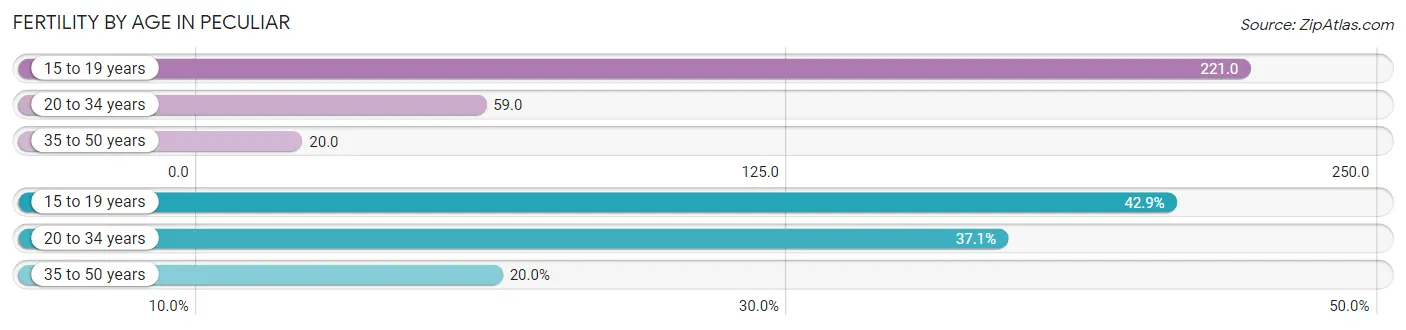
| Age Bracket | Women with Births | Births / 1,000 Women |
| 15 to 19 years | 30 (42.9%) | 221.0 |
| 20 to 34 years | 26 (37.1%) | 59.0 |
| 35 to 50 years | 14 (20.0%) | 20.0 |
| Total | 70 (100.0%) | 56.0 |
Fertility by Age by Marriage Status in Peculiar
37.1% of women with births (70) in Peculiar are married. The highest percentage of unmarried women with births falls into 15 to 19 years age bracket with 100.0% of them unmarried at the time of birth, while the lowest percentage of unmarried women with births belong to 35 to 50 years age bracket with 0.0% of them unmarried.
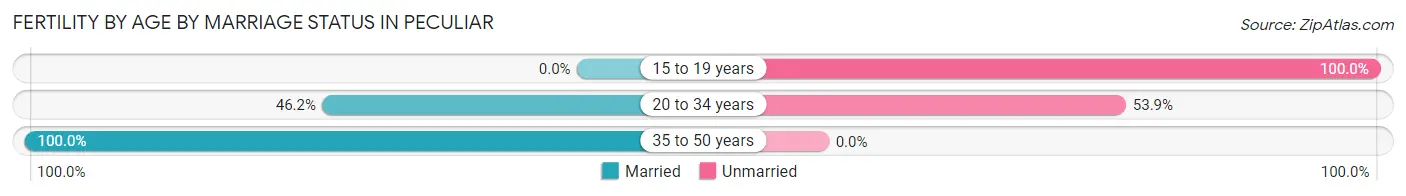
| Age Bracket | Married | Unmarried |
| 15 to 19 years | 0 (0.0%) | 30 (100.0%) |
| 20 to 34 years | 12 (46.2%) | 14 (53.8%) |
| 35 to 50 years | 14 (100.0%) | 0 (0.0%) |
| Total | 26 (37.1%) | 44 (62.9%) |
Fertility by Education in Peculiar
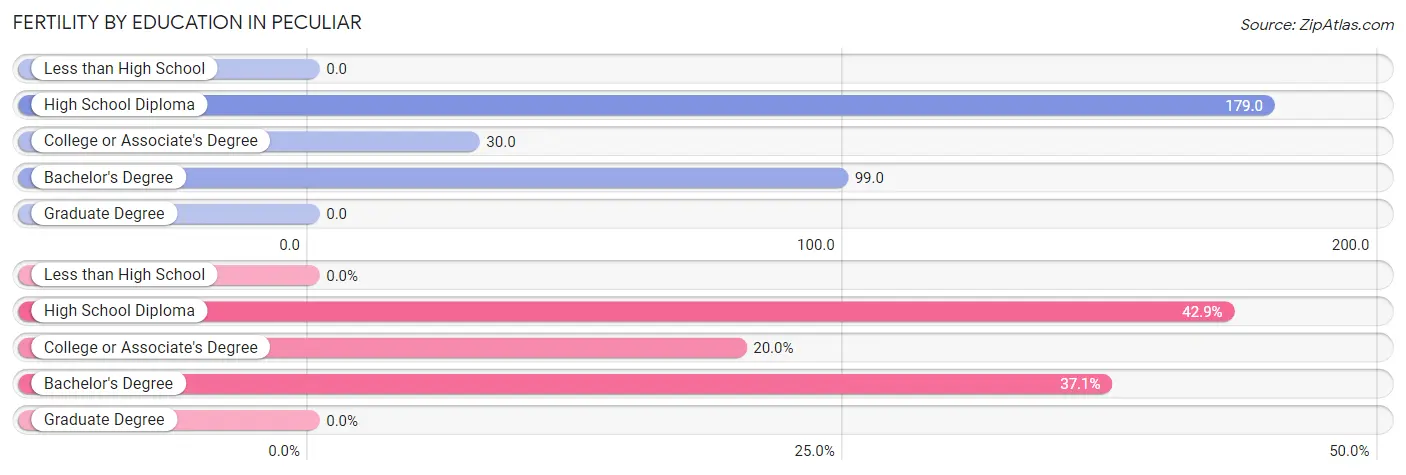
| Educational Attainment | Women with Births | Births / 1,000 Women |
| Less than High School | 0 (0.0%) | 0.0 |
| High School Diploma | 30 (42.9%) | 179.0 |
| College or Associate's Degree | 14 (20.0%) | 30.0 |
| Bachelor's Degree | 26 (37.1%) | 99.0 |
| Graduate Degree | 0 (0.0%) | 0.0 |
| Total | 70 (100.0%) | 56.0 |
Fertility by Education by Marriage Status in Peculiar
62.9% of women with births in Peculiar are unmarried. Women with the educational attainment of bachelor's degree are most likely to be married with 100.0% of them married at childbirth, while women with the educational attainment of high school diploma are least likely to be married with 100.0% of them unmarried at childbirth.
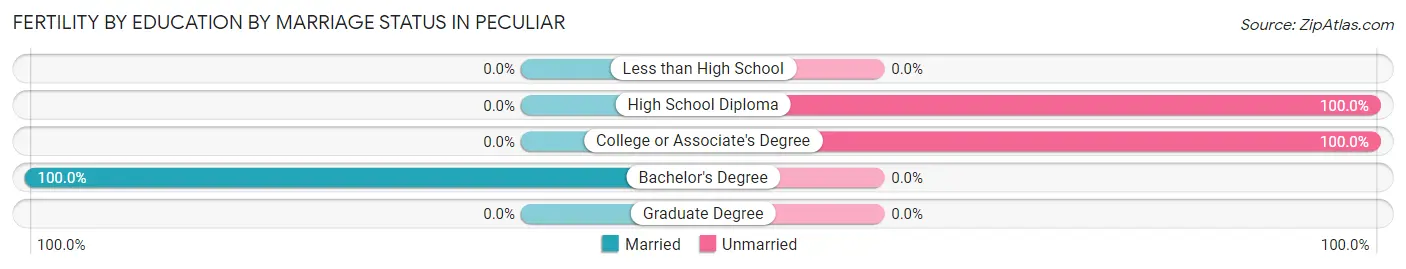
| Educational Attainment | Married | Unmarried |
| Less than High School | 0 (0.0%) | 0 (0.0%) |
| High School Diploma | 0 (0.0%) | 30 (100.0%) |
| College or Associate's Degree | 0 (0.0%) | 14 (100.0%) |
| Bachelor's Degree | 26 (100.0%) | 0 (0.0%) |
| Graduate Degree | 0 (0.0%) | 0 (0.0%) |
| Total | 26 (37.1%) | 44 (62.9%) |
Employment Characteristics in Peculiar
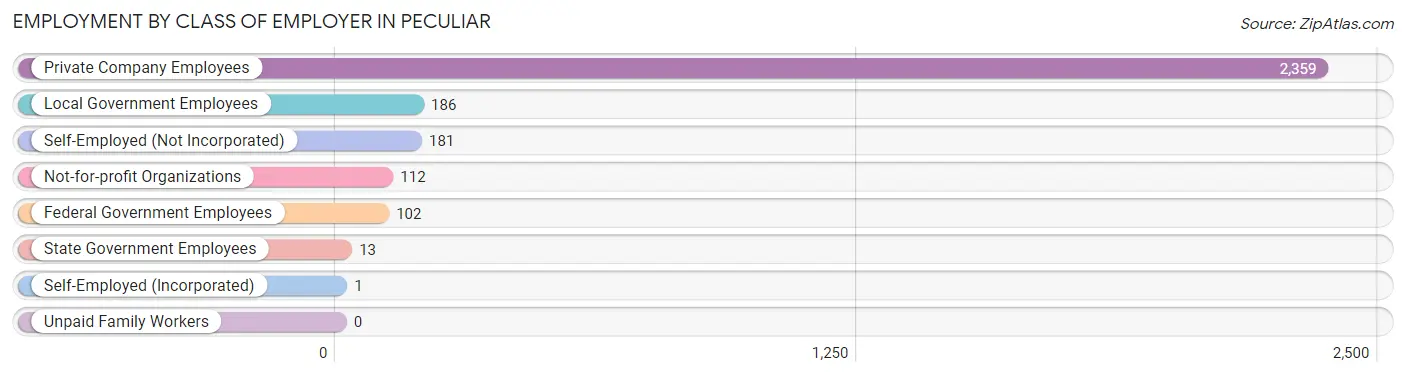
Employment by Class of Employer in Peculiar
Among the 2,954 employed individuals in Peculiar, private company employees (2,359 | 79.9%), local government employees (186 | 6.3%), and self-employed (not incorporated) (181 | 6.1%) make up the most common classes of employment.
| Employer Class | # Employees | % Employees |
| Private Company Employees | 2,359 | 79.9% |
| Self-Employed (Incorporated) | 1 | 0.0% |
| Self-Employed (Not Incorporated) | 181 | 6.1% |
| Not-for-profit Organizations | 112 | 3.8% |
| Local Government Employees | 186 | 6.3% |
| State Government Employees | 13 | 0.4% |
| Federal Government Employees | 102 | 3.5% |
| Unpaid Family Workers | 0 | 0.0% |
| Total | 2,954 | 100.0% |
Employment Status by Age in Peculiar
According to the labor force statistics for Peculiar, out of the total population over 16 years of age (4,424), 69.8% or 3,088 individuals are in the labor force, with 4.3% or 133 of them unemployed. The age group with the highest labor force participation rate is 30 to 34 years, with 100.0% or 510 individuals in the labor force. Within the labor force, the 25 to 29 years age range has the highest percentage of unemployed individuals, with 24.7% or 59 of them being unemployed.
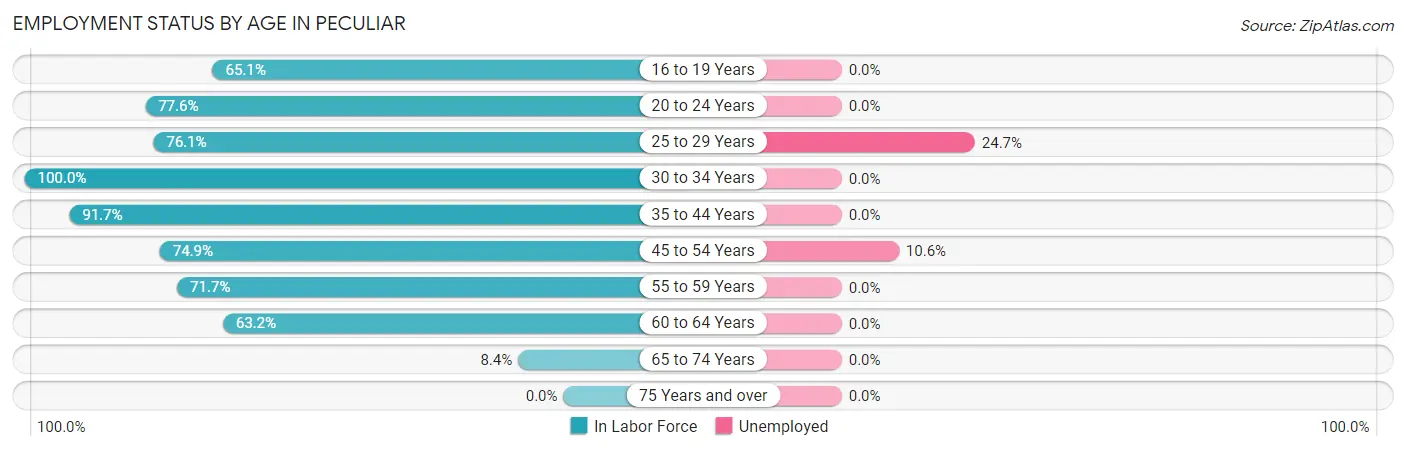
| Age Bracket | In Labor Force | Unemployed |
| 16 to 19 Years | 200 (65.1%) | 0 (0.0%) |
| 20 to 24 Years | 280 (77.6%) | 0 (0.0%) |
| 25 to 29 Years | 239 (76.1%) | 59 (24.7%) |
| 30 to 34 Years | 510 (100.0%) | 0 (0.0%) |
| 35 to 44 Years | 784 (91.7%) | 0 (0.0%) |
| 45 to 54 Years | 696 (74.9%) | 74 (10.6%) |
| 55 to 59 Years | 274 (71.7%) | 0 (0.0%) |
| 60 to 64 Years | 79 (63.2%) | 0 (0.0%) |
| 65 to 74 Years | 25 (8.4%) | 0 (0.0%) |
| 75 Years and over | 0 (0.0%) | 0 (0.0%) |
| Total | 3,088 (69.8%) | 133 (4.3%) |
Employment Status by Educational Attainment in Peculiar
According to labor force statistics for Peculiar, 82.9% of individuals (2,582) out of the total population between 25 and 64 years of age (3,115) are in the labor force, with 5.2% or 134 of them being unemployed. The group with the highest labor force participation rate are those with the educational attainment of college / associate degree, with 88.8% or 1,090 individuals in the labor force. Within the labor force, individuals with bachelor's degree or higher education have the highest percentage of unemployment, with 15.9% or 96 of them being unemployed.
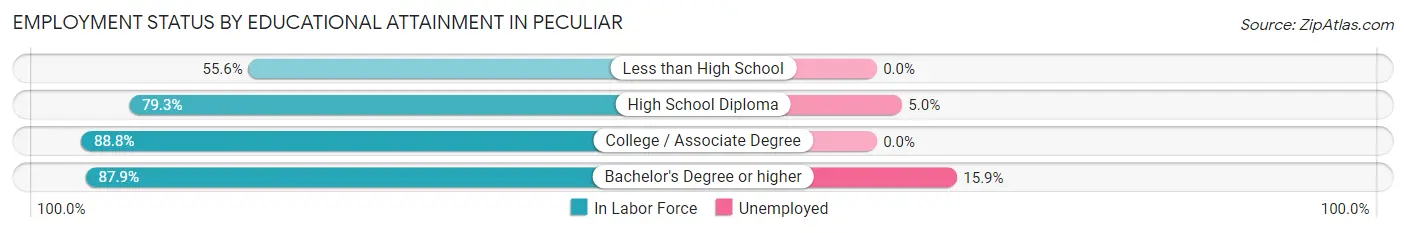
| Educational Attainment | In Labor Force | Unemployed |
| Less than High School | 148 (55.6%) | 0 (0.0%) |
| High School Diploma | 743 (79.3%) | 47 (5.0%) |
| College / Associate Degree | 1,090 (88.8%) | 0 (0.0%) |
| Bachelor's Degree or higher | 602 (87.9%) | 109 (15.9%) |
| Total | 2,582 (82.9%) | 162 (5.2%) |
Employment Occupations by Sex in Peculiar
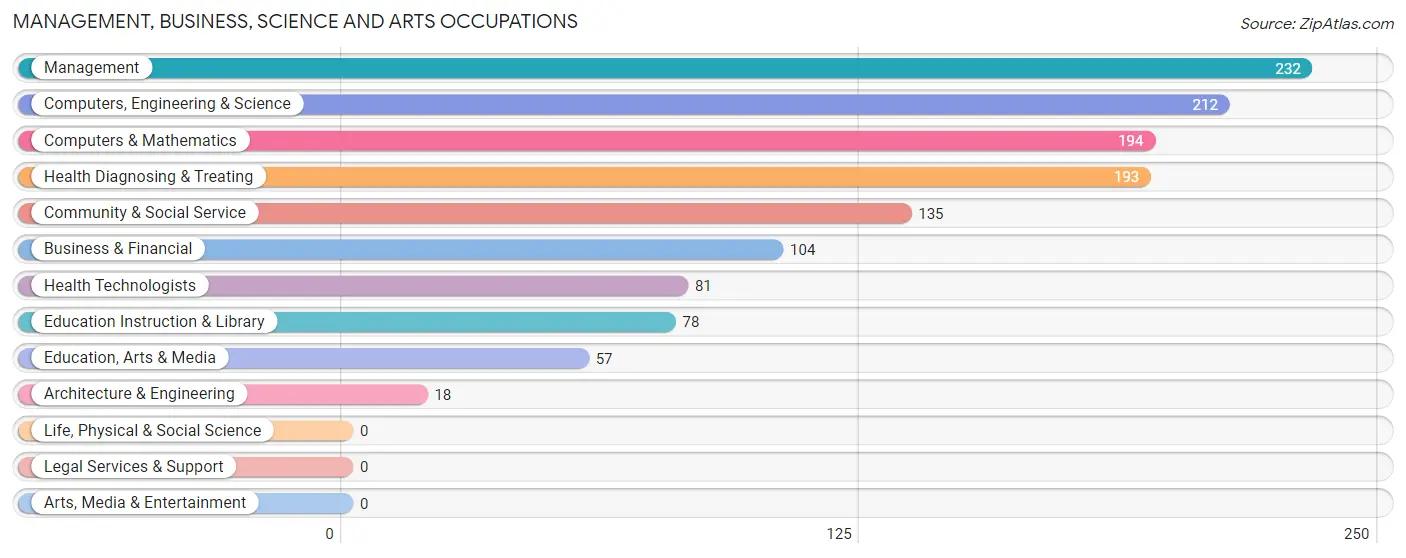
Management, Business, Science and Arts Occupations
The most common Management, Business, Science and Arts occupations in Peculiar are Management (232 | 7.9%), Computers, Engineering & Science (212 | 7.2%), Computers & Mathematics (194 | 6.6%), Health Diagnosing & Treating (193 | 6.5%), and Community & Social Service (135 | 4.6%).
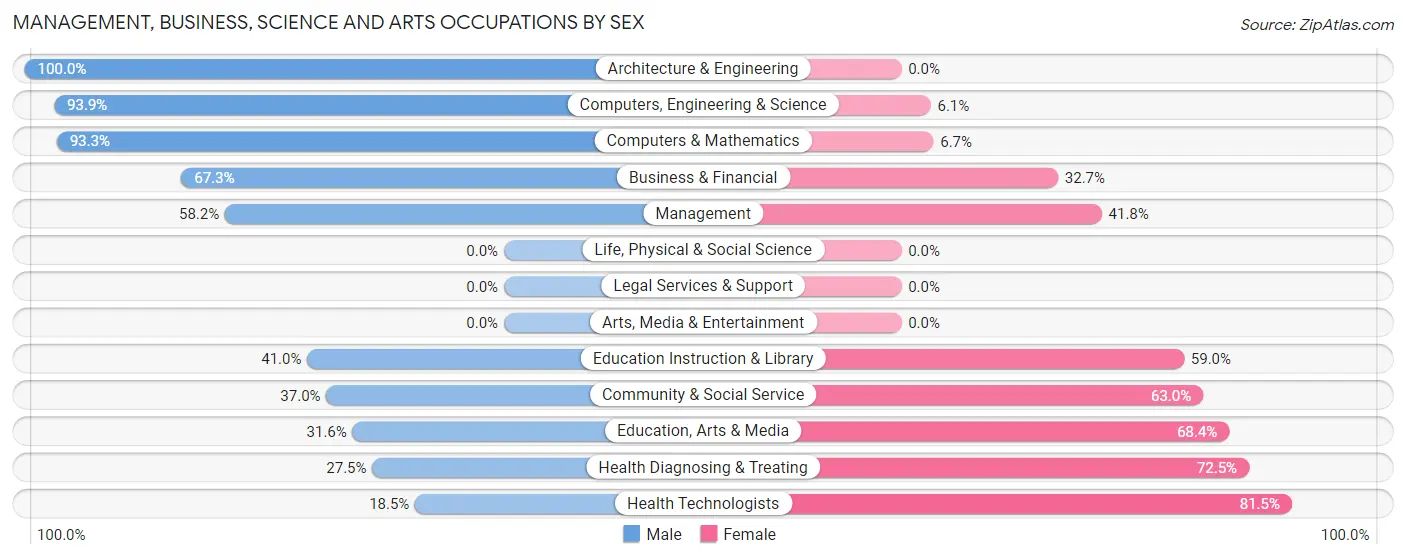
Management, Business, Science and Arts Occupations by Sex
Within the Management, Business, Science and Arts occupations in Peculiar, the most male-oriented occupations are Architecture & Engineering (100.0%), Computers, Engineering & Science (93.9%), and Computers & Mathematics (93.3%), while the most female-oriented occupations are Health Technologists (81.5%), Health Diagnosing & Treating (72.5%), and Education, Arts & Media (68.4%).
| Occupation | Male | Female |
| Management | 135 (58.2%) | 97 (41.8%) |
| Business & Financial | 70 (67.3%) | 34 (32.7%) |
| Computers, Engineering & Science | 199 (93.9%) | 13 (6.1%) |
| Computers & Mathematics | 181 (93.3%) | 13 (6.7%) |
| Architecture & Engineering | 18 (100.0%) | 0 (0.0%) |
| Life, Physical & Social Science | 0 (0.0%) | 0 (0.0%) |
| Community & Social Service | 50 (37.0%) | 85 (63.0%) |
| Education, Arts & Media | 18 (31.6%) | 39 (68.4%) |
| Legal Services & Support | 0 (0.0%) | 0 (0.0%) |
| Education Instruction & Library | 32 (41.0%) | 46 (59.0%) |
| Arts, Media & Entertainment | 0 (0.0%) | 0 (0.0%) |
| Health Diagnosing & Treating | 53 (27.5%) | 140 (72.5%) |
| Health Technologists | 15 (18.5%) | 66 (81.5%) |
| Total (Category) | 507 (57.9%) | 369 (42.1%) |
| Total (Overall) | 1,732 (58.6%) | 1,222 (41.4%) |
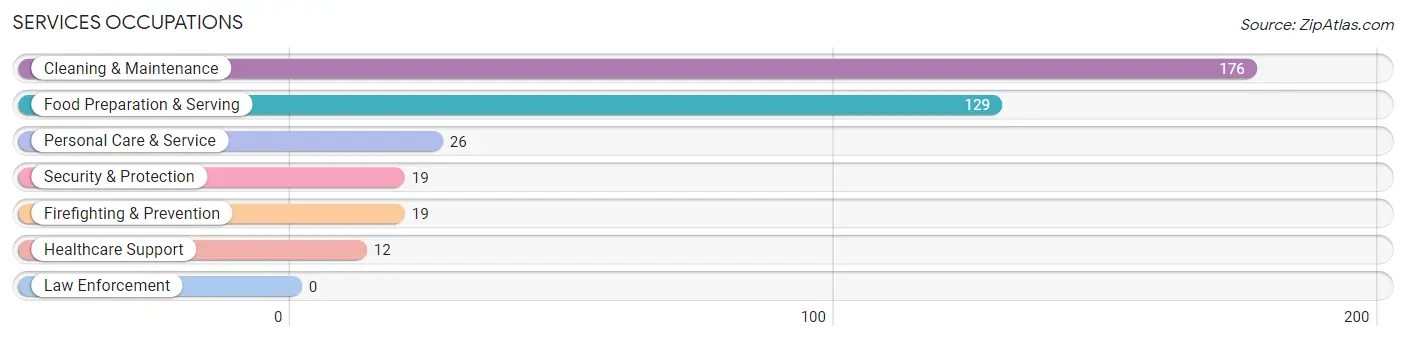
Services Occupations
The most common Services occupations in Peculiar are Cleaning & Maintenance (176 | 6.0%), Food Preparation & Serving (129 | 4.4%), Personal Care & Service (26 | 0.9%), Security & Protection (19 | 0.6%), and Firefighting & Prevention (19 | 0.6%).
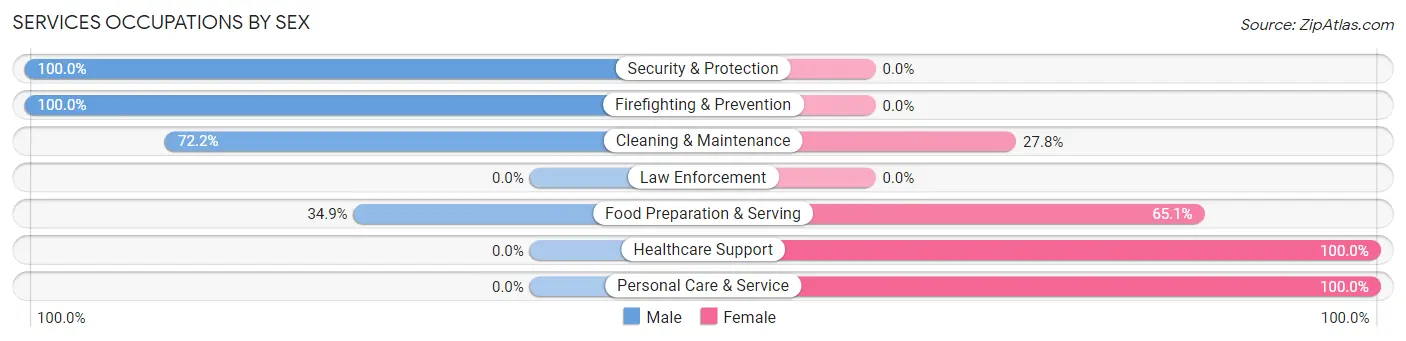
Services Occupations by Sex
Within the Services occupations in Peculiar, the most male-oriented occupations are Security & Protection (100.0%), Firefighting & Prevention (100.0%), and Cleaning & Maintenance (72.2%), while the most female-oriented occupations are Healthcare Support (100.0%), Personal Care & Service (100.0%), and Food Preparation & Serving (65.1%).
| Occupation | Male | Female |
| Healthcare Support | 0 (0.0%) | 12 (100.0%) |
| Security & Protection | 19 (100.0%) | 0 (0.0%) |
| Firefighting & Prevention | 19 (100.0%) | 0 (0.0%) |
| Law Enforcement | 0 (0.0%) | 0 (0.0%) |
| Food Preparation & Serving | 45 (34.9%) | 84 (65.1%) |
| Cleaning & Maintenance | 127 (72.2%) | 49 (27.8%) |
| Personal Care & Service | 0 (0.0%) | 26 (100.0%) |
| Total (Category) | 191 (52.8%) | 171 (47.2%) |
| Total (Overall) | 1,732 (58.6%) | 1,222 (41.4%) |
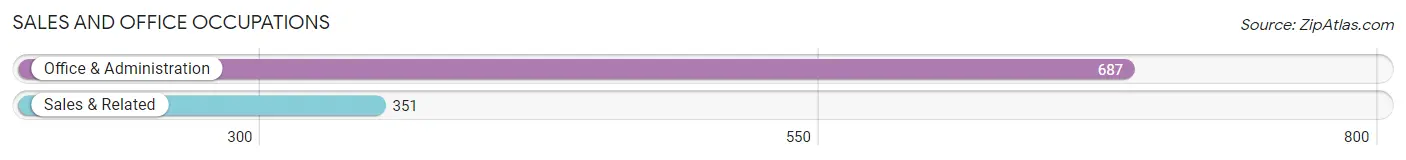
Sales and Office Occupations
The most common Sales and Office occupations in Peculiar are Office & Administration (687 | 23.3%), and Sales & Related (351 | 11.9%).
Sales and Office Occupations by Sex
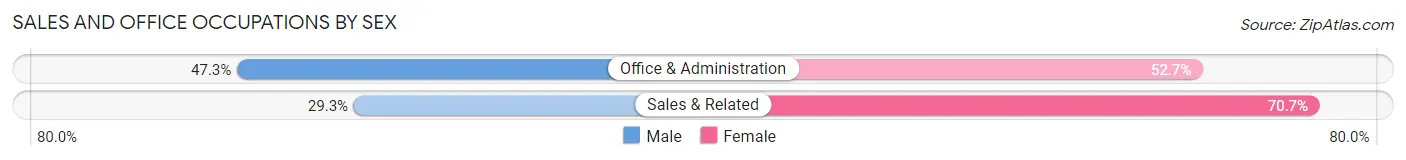
| Occupation | Male | Female |
| Sales & Related | 103 (29.3%) | 248 (70.7%) |
| Office & Administration | 325 (47.3%) | 362 (52.7%) |
| Total (Category) | 428 (41.2%) | 610 (58.8%) |
| Total (Overall) | 1,732 (58.6%) | 1,222 (41.4%) |
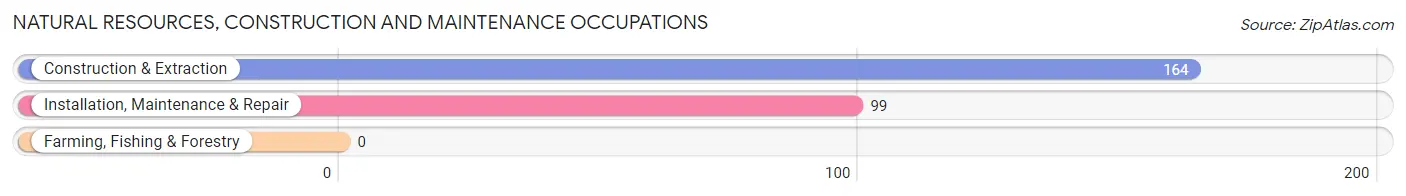
Natural Resources, Construction and Maintenance Occupations
The most common Natural Resources, Construction and Maintenance occupations in Peculiar are Construction & Extraction (164 | 5.6%), and Installation, Maintenance & Repair (99 | 3.4%).
Natural Resources, Construction and Maintenance Occupations by Sex
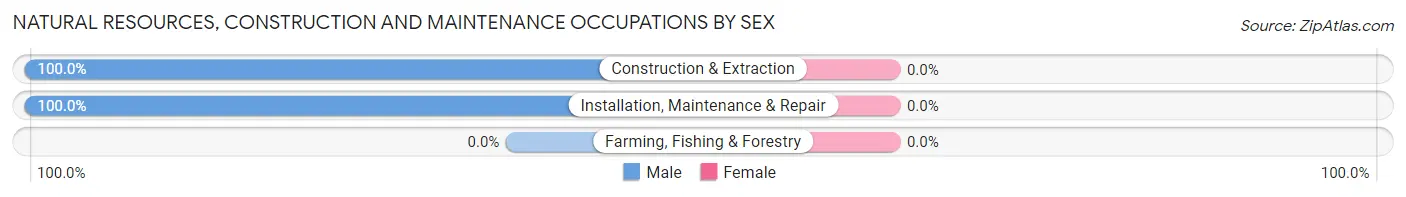
| Occupation | Male | Female |
| Farming, Fishing & Forestry | 0 (0.0%) | 0 (0.0%) |
| Construction & Extraction | 164 (100.0%) | 0 (0.0%) |
| Installation, Maintenance & Repair | 99 (100.0%) | 0 (0.0%) |
| Total (Category) | 263 (100.0%) | 0 (0.0%) |
| Total (Overall) | 1,732 (58.6%) | 1,222 (41.4%) |
Production, Transportation and Moving Occupations
The most common Production, Transportation and Moving occupations in Peculiar are Production (266 | 9.0%), Material Moving (94 | 3.2%), and Transportation (55 | 1.9%).
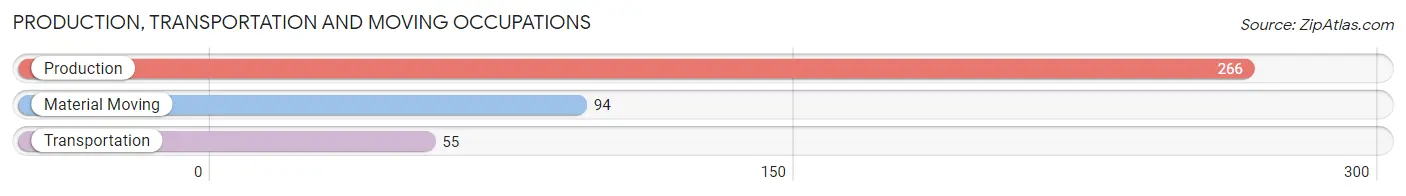
Production, Transportation and Moving Occupations by Sex
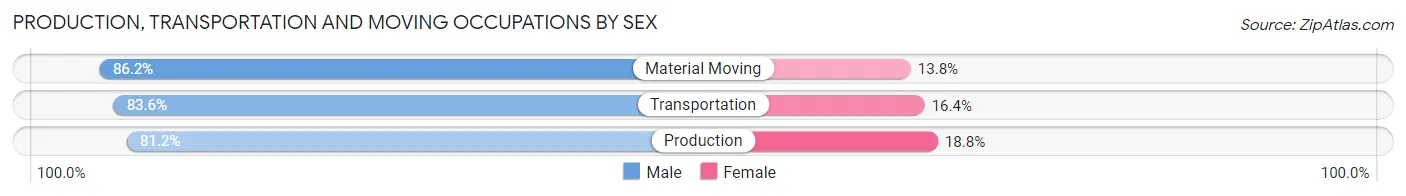
| Occupation | Male | Female |
| Production | 216 (81.2%) | 50 (18.8%) |
| Transportation | 46 (83.6%) | 9 (16.4%) |
| Material Moving | 81 (86.2%) | 13 (13.8%) |
| Total (Category) | 343 (82.7%) | 72 (17.3%) |
| Total (Overall) | 1,732 (58.6%) | 1,222 (41.4%) |
Employment Industries by Sex in Peculiar
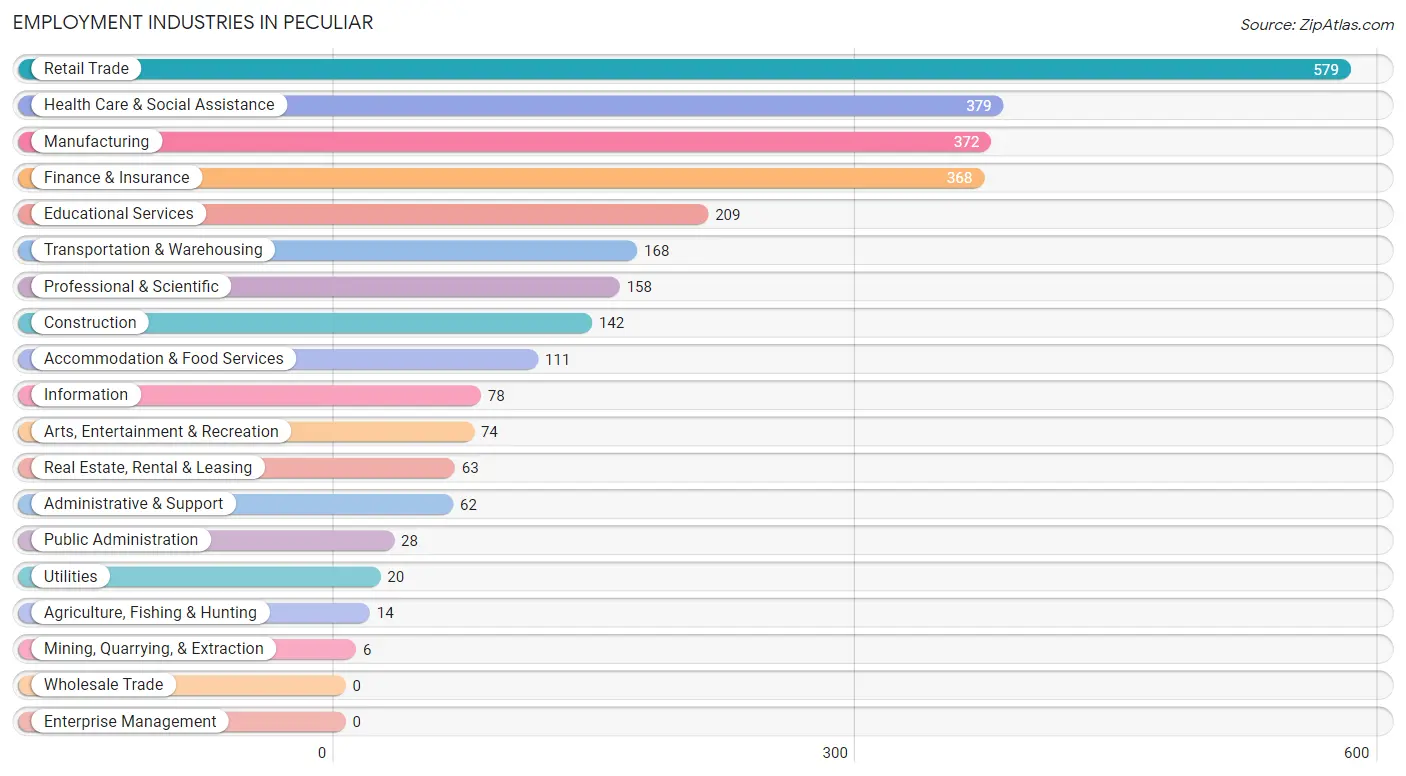
Employment Industries in Peculiar
The major employment industries in Peculiar include Retail Trade (579 | 19.6%), Health Care & Social Assistance (379 | 12.8%), Manufacturing (372 | 12.6%), Finance & Insurance (368 | 12.5%), and Educational Services (209 | 7.1%).
Employment Industries by Sex in Peculiar
The Peculiar industries that see more men than women are Agriculture, Fishing & Hunting (100.0%), Mining, Quarrying, & Extraction (100.0%), and Construction (100.0%), whereas the industries that tend to have a higher number of women are Real Estate, Rental & Leasing (100.0%), Public Administration (100.0%), and Finance & Insurance (73.1%).
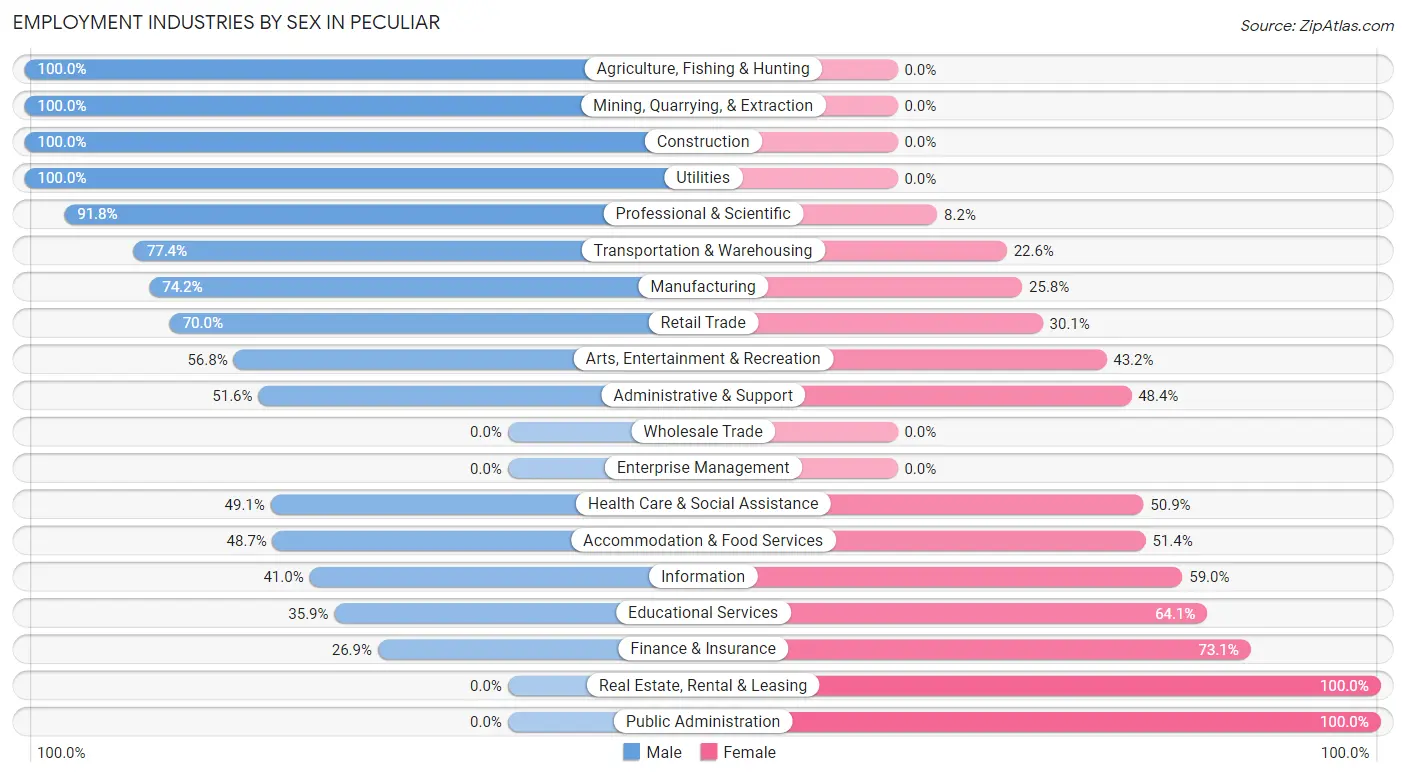
| Industry | Male | Female |
| Agriculture, Fishing & Hunting | 14 (100.0%) | 0 (0.0%) |
| Mining, Quarrying, & Extraction | 6 (100.0%) | 0 (0.0%) |
| Construction | 142 (100.0%) | 0 (0.0%) |
| Manufacturing | 276 (74.2%) | 96 (25.8%) |
| Wholesale Trade | 0 (0.0%) | 0 (0.0%) |
| Retail Trade | 405 (70.0%) | 174 (30.0%) |
| Transportation & Warehousing | 130 (77.4%) | 38 (22.6%) |
| Utilities | 20 (100.0%) | 0 (0.0%) |
| Information | 32 (41.0%) | 46 (59.0%) |
| Finance & Insurance | 99 (26.9%) | 269 (73.1%) |
| Real Estate, Rental & Leasing | 0 (0.0%) | 63 (100.0%) |
| Professional & Scientific | 145 (91.8%) | 13 (8.2%) |
| Enterprise Management | 0 (0.0%) | 0 (0.0%) |
| Administrative & Support | 32 (51.6%) | 30 (48.4%) |
| Educational Services | 75 (35.9%) | 134 (64.1%) |
| Health Care & Social Assistance | 186 (49.1%) | 193 (50.9%) |
| Arts, Entertainment & Recreation | 42 (56.8%) | 32 (43.2%) |
| Accommodation & Food Services | 54 (48.6%) | 57 (51.3%) |
| Public Administration | 0 (0.0%) | 28 (100.0%) |
| Total | 1,732 (58.6%) | 1,222 (41.4%) |
Education in Peculiar
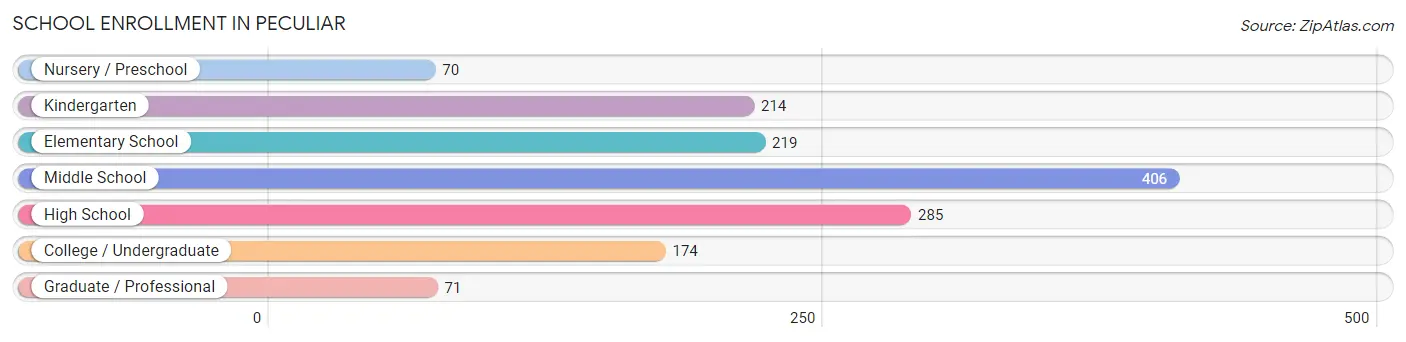
School Enrollment in Peculiar
The most common levels of schooling among the 1,439 students in Peculiar are middle school (406 | 28.2%), high school (285 | 19.8%), and elementary school (219 | 15.2%).
| School Level | # Students | % Students |
| Nursery / Preschool | 70 | 4.9% |
| Kindergarten | 214 | 14.9% |
| Elementary School | 219 | 15.2% |
| Middle School | 406 | 28.2% |
| High School | 285 | 19.8% |
| College / Undergraduate | 174 | 12.1% |
| Graduate / Professional | 71 | 4.9% |
| Total | 1,439 | 100.0% |
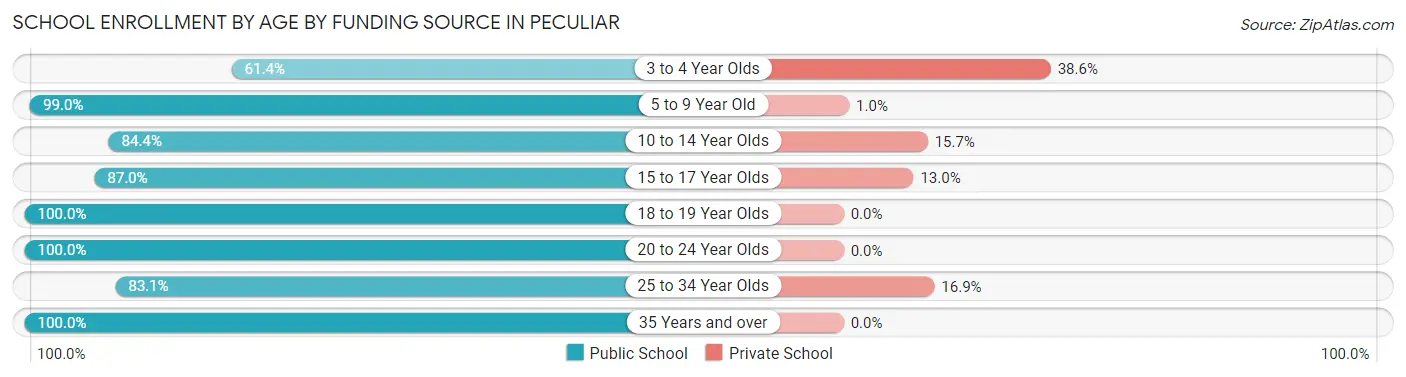
School Enrollment by Age by Funding Source in Peculiar
Out of a total of 1,439 students who are enrolled in schools in Peculiar, 150 (10.4%) attend a private institution, while the remaining 1,289 (89.6%) are enrolled in public schools. The age group of 3 to 4 year olds has the highest likelihood of being enrolled in private schools, with 27 (38.6% in the age bracket) enrolled. Conversely, the age group of 18 to 19 year olds has the lowest likelihood of being enrolled in a private school, with 11 (100.0% in the age bracket) attending a public institution.
| Age Bracket | Public School | Private School |
| 3 to 4 Year Olds | 43 (61.4%) | 27 (38.6%) |
| 5 to 9 Year Old | 388 (99.0%) | 4 (1.0%) |
| 10 to 14 Year Olds | 345 (84.4%) | 64 (15.7%) |
| 15 to 17 Year Olds | 281 (87.0%) | 42 (13.0%) |
| 18 to 19 Year Olds | 11 (100.0%) | 0 (0.0%) |
| 20 to 24 Year Olds | 29 (100.0%) | 0 (0.0%) |
| 25 to 34 Year Olds | 59 (83.1%) | 12 (16.9%) |
| 35 Years and over | 134 (100.0%) | 0 (0.0%) |
| Total | 1,289 (89.6%) | 150 (10.4%) |
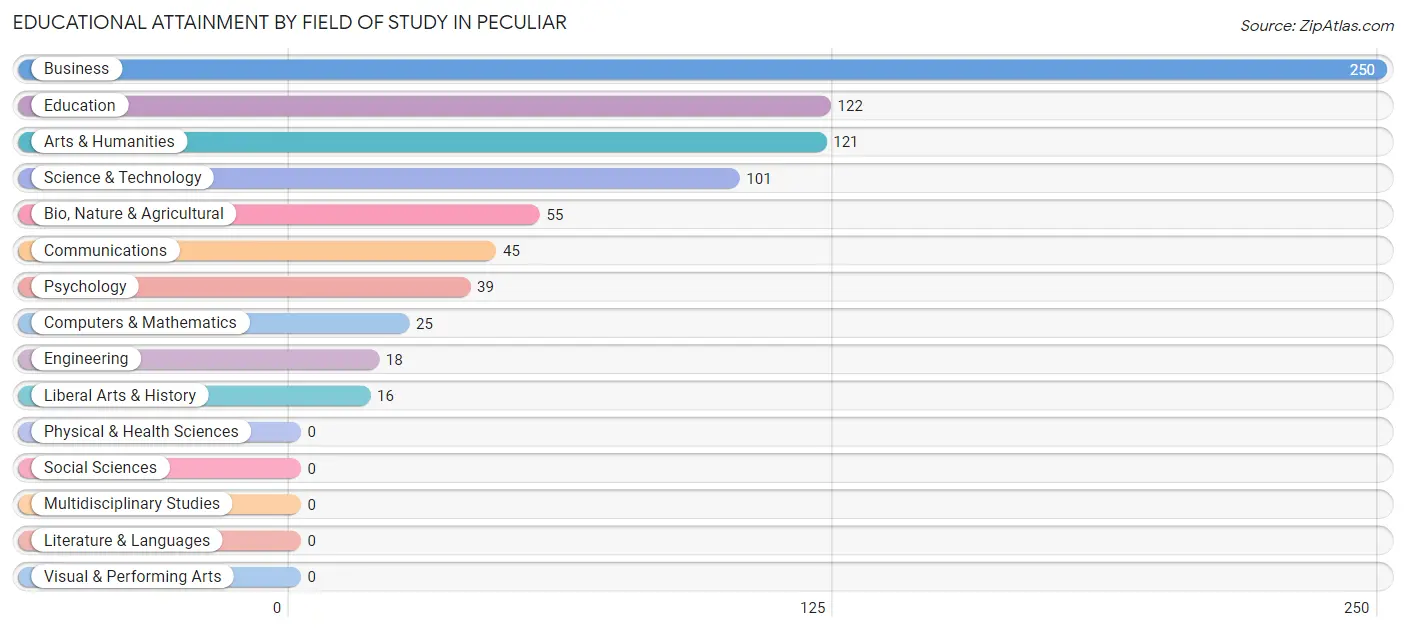
Educational Attainment by Field of Study in Peculiar
Business (250 | 31.6%), education (122 | 15.4%), arts & humanities (121 | 15.3%), science & technology (101 | 12.8%), and bio, nature & agricultural (55 | 6.9%) are the most common fields of study among 792 individuals in Peculiar who have obtained a bachelor's degree or higher.
| Field of Study | # Graduates | % Graduates |
| Computers & Mathematics | 25 | 3.2% |
| Bio, Nature & Agricultural | 55 | 6.9% |
| Physical & Health Sciences | 0 | 0.0% |
| Psychology | 39 | 4.9% |
| Social Sciences | 0 | 0.0% |
| Engineering | 18 | 2.3% |
| Multidisciplinary Studies | 0 | 0.0% |
| Science & Technology | 101 | 12.8% |
| Business | 250 | 31.6% |
| Education | 122 | 15.4% |
| Literature & Languages | 0 | 0.0% |
| Liberal Arts & History | 16 | 2.0% |
| Visual & Performing Arts | 0 | 0.0% |
| Communications | 45 | 5.7% |
| Arts & Humanities | 121 | 15.3% |
| Total | 792 | 100.0% |
Transportation & Commute in Peculiar
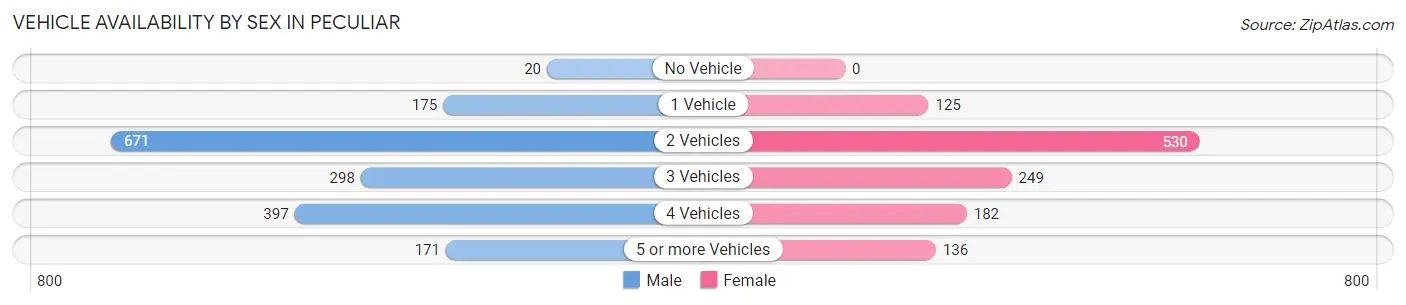
Vehicle Availability by Sex in Peculiar
The most prevalent vehicle ownership categories in Peculiar are males with 2 vehicles (671, accounting for 38.7%) and females with 2 vehicles (530, making up 54.9%).
| Vehicles Available | Male | Female |
| No Vehicle | 20 (1.1%) | 0 (0.0%) |
| 1 Vehicle | 175 (10.1%) | 125 (10.2%) |
| 2 Vehicles | 671 (38.7%) | 530 (43.4%) |
| 3 Vehicles | 298 (17.2%) | 249 (20.4%) |
| 4 Vehicles | 397 (22.9%) | 182 (14.9%) |
| 5 or more Vehicles | 171 (9.9%) | 136 (11.1%) |
| Total | 1,732 (100.0%) | 1,222 (100.0%) |
Commute Time in Peculiar
The most frequently occuring commute durations in Peculiar are 15 to 19 minutes (557 commuters, 23.1%), 30 to 34 minutes (331 commuters, 13.7%), and 45 to 59 minutes (320 commuters, 13.3%).
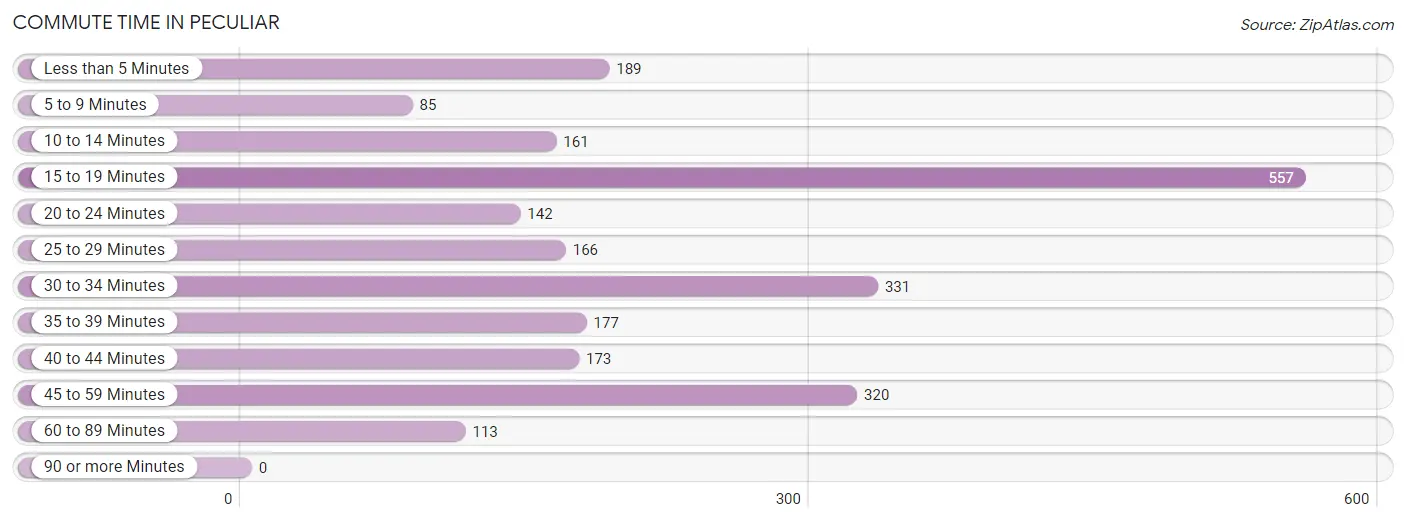
| Commute Time | # Commuters | % Commuters |
| Less than 5 Minutes | 189 | 7.8% |
| 5 to 9 Minutes | 85 | 3.5% |
| 10 to 14 Minutes | 161 | 6.7% |
| 15 to 19 Minutes | 557 | 23.1% |
| 20 to 24 Minutes | 142 | 5.9% |
| 25 to 29 Minutes | 166 | 6.9% |
| 30 to 34 Minutes | 331 | 13.7% |
| 35 to 39 Minutes | 177 | 7.3% |
| 40 to 44 Minutes | 173 | 7.2% |
| 45 to 59 Minutes | 320 | 13.3% |
| 60 to 89 Minutes | 113 | 4.7% |
| 90 or more Minutes | 0 | 0.0% |
Commute Time by Sex in Peculiar
The most common commute times in Peculiar are 15 to 19 minutes (270 commuters, 18.0%) for males and 15 to 19 minutes (287 commuters, 31.3%) for females.
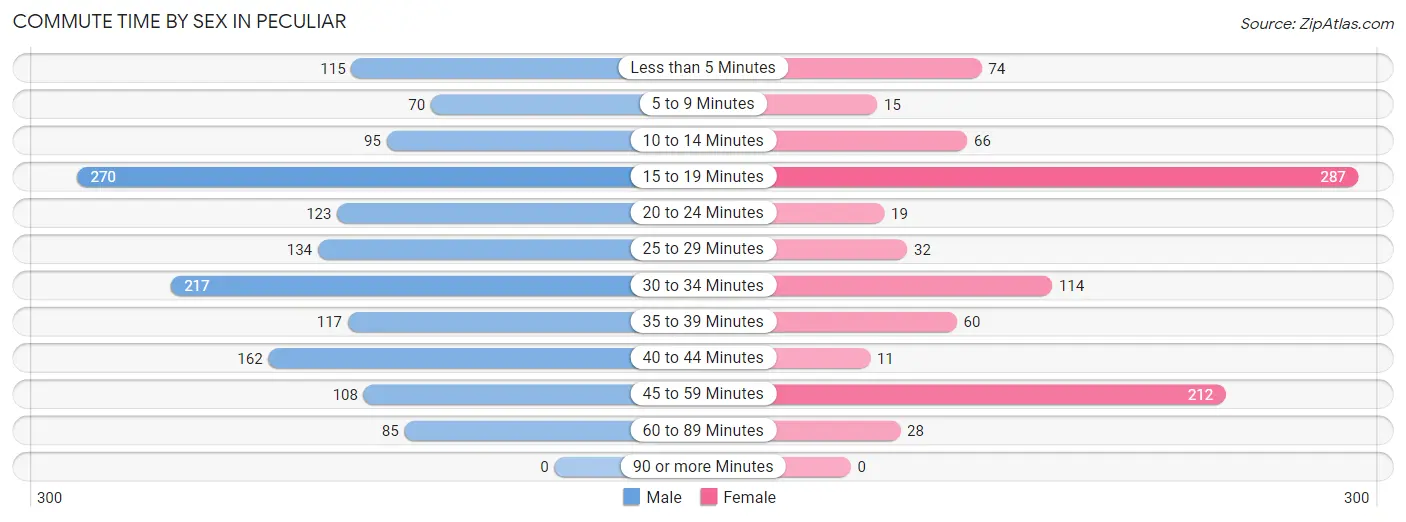
| Commute Time | Male | Female |
| Less than 5 Minutes | 115 (7.7%) | 74 (8.1%) |
| 5 to 9 Minutes | 70 (4.7%) | 15 (1.6%) |
| 10 to 14 Minutes | 95 (6.4%) | 66 (7.2%) |
| 15 to 19 Minutes | 270 (18.0%) | 287 (31.3%) |
| 20 to 24 Minutes | 123 (8.2%) | 19 (2.1%) |
| 25 to 29 Minutes | 134 (9.0%) | 32 (3.5%) |
| 30 to 34 Minutes | 217 (14.5%) | 114 (12.4%) |
| 35 to 39 Minutes | 117 (7.8%) | 60 (6.5%) |
| 40 to 44 Minutes | 162 (10.8%) | 11 (1.2%) |
| 45 to 59 Minutes | 108 (7.2%) | 212 (23.1%) |
| 60 to 89 Minutes | 85 (5.7%) | 28 (3.0%) |
| 90 or more Minutes | 0 (0.0%) | 0 (0.0%) |
Time of Departure to Work by Sex in Peculiar
The most frequent times of departure to work in Peculiar are 12:00 PM to 3:59 PM (211, 14.1%) for males and 6:00 AM to 6:29 AM (155, 16.9%) for females.
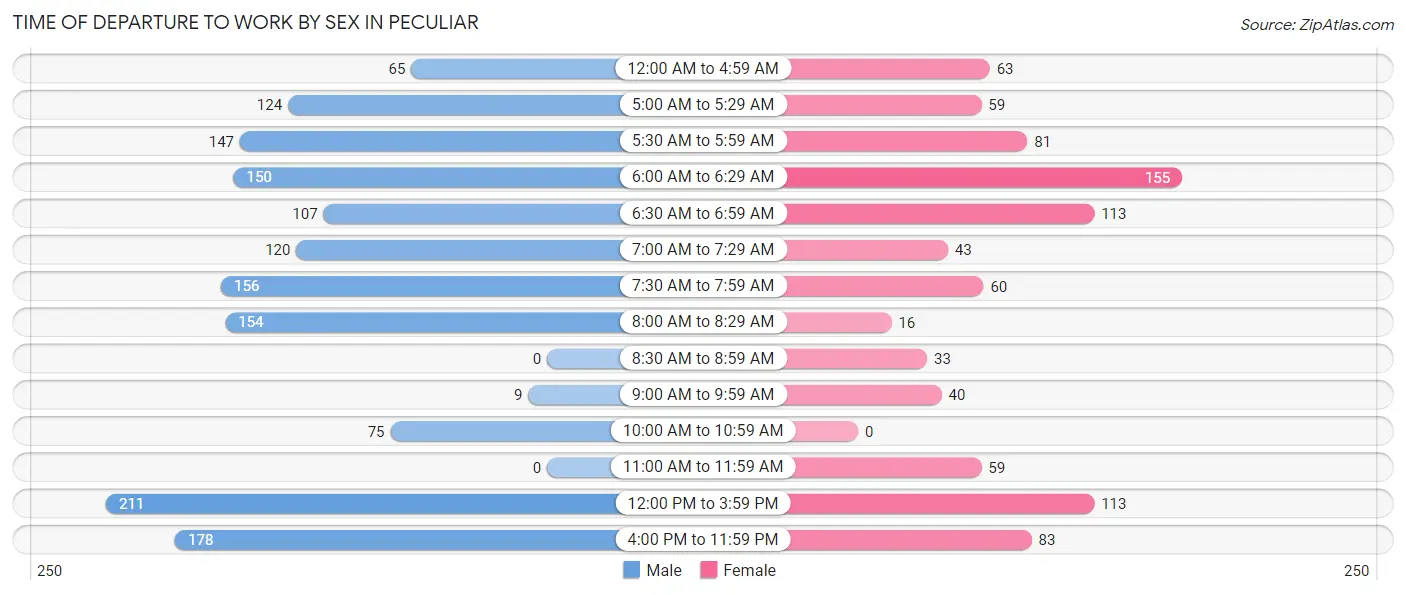
| Time of Departure | Male | Female |
| 12:00 AM to 4:59 AM | 65 (4.3%) | 63 (6.9%) |
| 5:00 AM to 5:29 AM | 124 (8.3%) | 59 (6.4%) |
| 5:30 AM to 5:59 AM | 147 (9.8%) | 81 (8.8%) |
| 6:00 AM to 6:29 AM | 150 (10.0%) | 155 (16.9%) |
| 6:30 AM to 6:59 AM | 107 (7.1%) | 113 (12.3%) |
| 7:00 AM to 7:29 AM | 120 (8.0%) | 43 (4.7%) |
| 7:30 AM to 7:59 AM | 156 (10.4%) | 60 (6.5%) |
| 8:00 AM to 8:29 AM | 154 (10.3%) | 16 (1.7%) |
| 8:30 AM to 8:59 AM | 0 (0.0%) | 33 (3.6%) |
| 9:00 AM to 9:59 AM | 9 (0.6%) | 40 (4.4%) |
| 10:00 AM to 10:59 AM | 75 (5.0%) | 0 (0.0%) |
| 11:00 AM to 11:59 AM | 0 (0.0%) | 59 (6.4%) |
| 12:00 PM to 3:59 PM | 211 (14.1%) | 113 (12.3%) |
| 4:00 PM to 11:59 PM | 178 (11.9%) | 83 (9.0%) |
| Total | 1,496 (100.0%) | 918 (100.0%) |
Housing Occupancy in Peculiar
Occupancy by Ownership in Peculiar
Of the total 2,075 dwellings in Peculiar, owner-occupied units account for 1,584 (76.3%), while renter-occupied units make up 491 (23.7%).
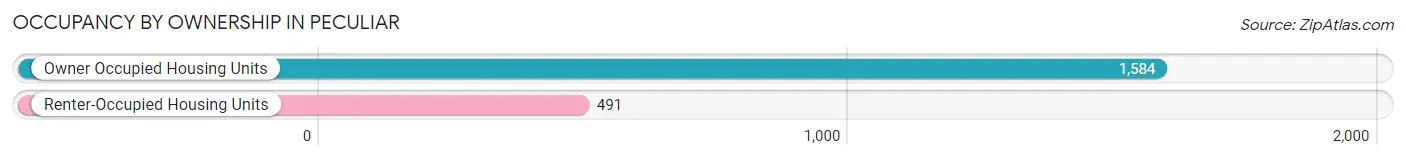
| Occupancy | # Housing Units | % Housing Units |
| Owner Occupied Housing Units | 1,584 | 76.3% |
| Renter-Occupied Housing Units | 491 | 23.7% |
| Total Occupied Housing Units | 2,075 | 100.0% |
Occupancy by Household Size in Peculiar
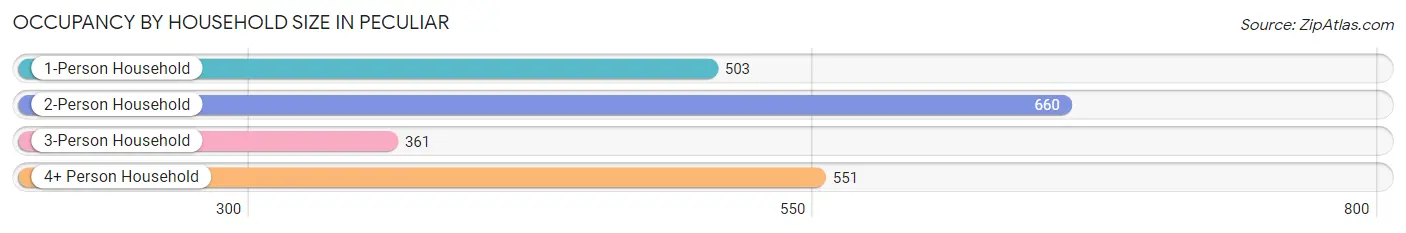
| Household Size | # Housing Units | % Housing Units |
| 1-Person Household | 503 | 24.2% |
| 2-Person Household | 660 | 31.8% |
| 3-Person Household | 361 | 17.4% |
| 4+ Person Household | 551 | 26.6% |
| Total Housing Units | 2,075 | 100.0% |
Occupancy by Ownership by Household Size in Peculiar
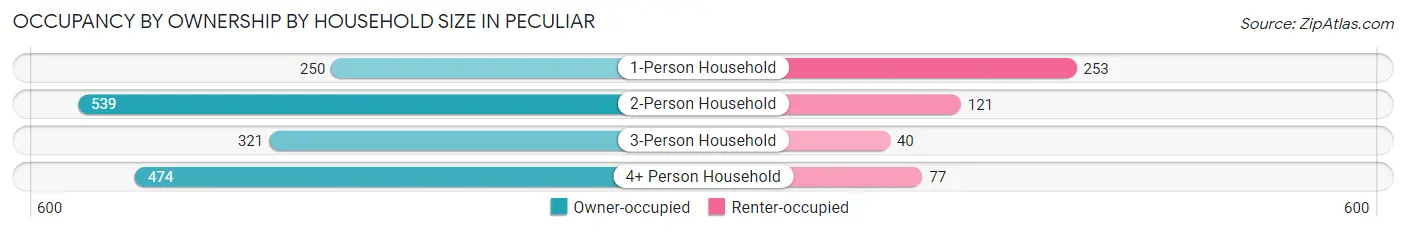
| Household Size | Owner-occupied | Renter-occupied |
| 1-Person Household | 250 (49.7%) | 253 (50.3%) |
| 2-Person Household | 539 (81.7%) | 121 (18.3%) |
| 3-Person Household | 321 (88.9%) | 40 (11.1%) |
| 4+ Person Household | 474 (86.0%) | 77 (14.0%) |
| Total Housing Units | 1,584 (76.3%) | 491 (23.7%) |
Occupancy by Educational Attainment in Peculiar
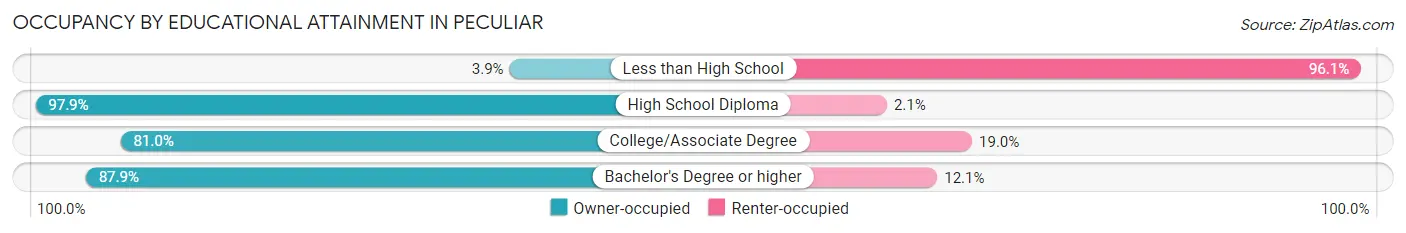
| Household Size | Owner-occupied | Renter-occupied |
| Less than High School | 11 (3.9%) | 273 (96.1%) |
| High School Diploma | 503 (97.9%) | 11 (2.1%) |
| College/Associate Degree | 613 (81.0%) | 144 (19.0%) |
| Bachelor's Degree or higher | 457 (87.9%) | 63 (12.1%) |
Occupancy by Age of Householder in Peculiar
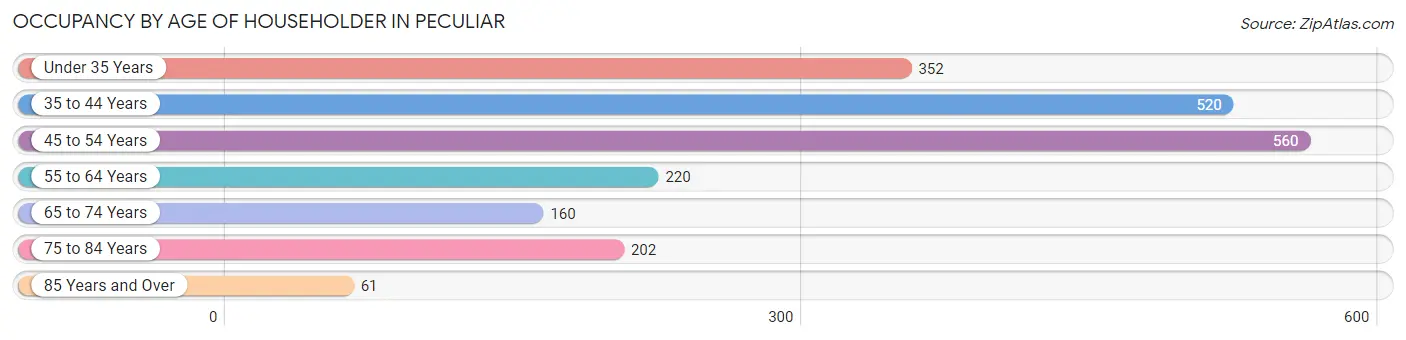
| Age Bracket | # Households | % Households |
| Under 35 Years | 352 | 17.0% |
| 35 to 44 Years | 520 | 25.1% |
| 45 to 54 Years | 560 | 27.0% |
| 55 to 64 Years | 220 | 10.6% |
| 65 to 74 Years | 160 | 7.7% |
| 75 to 84 Years | 202 | 9.7% |
| 85 Years and Over | 61 | 2.9% |
| Total | 2,075 | 100.0% |
Housing Finances in Peculiar
Median Income by Occupancy in Peculiar
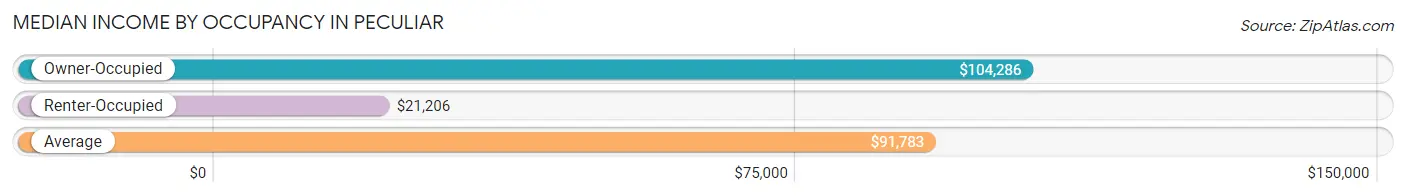
| Occupancy Type | # Households | Median Income |
| Owner-Occupied | 1,584 (76.3%) | $104,286 |
| Renter-Occupied | 491 (23.7%) | $21,206 |
| Average | 2,075 (100.0%) | $91,783 |
Occupancy by Householder Income Bracket in Peculiar
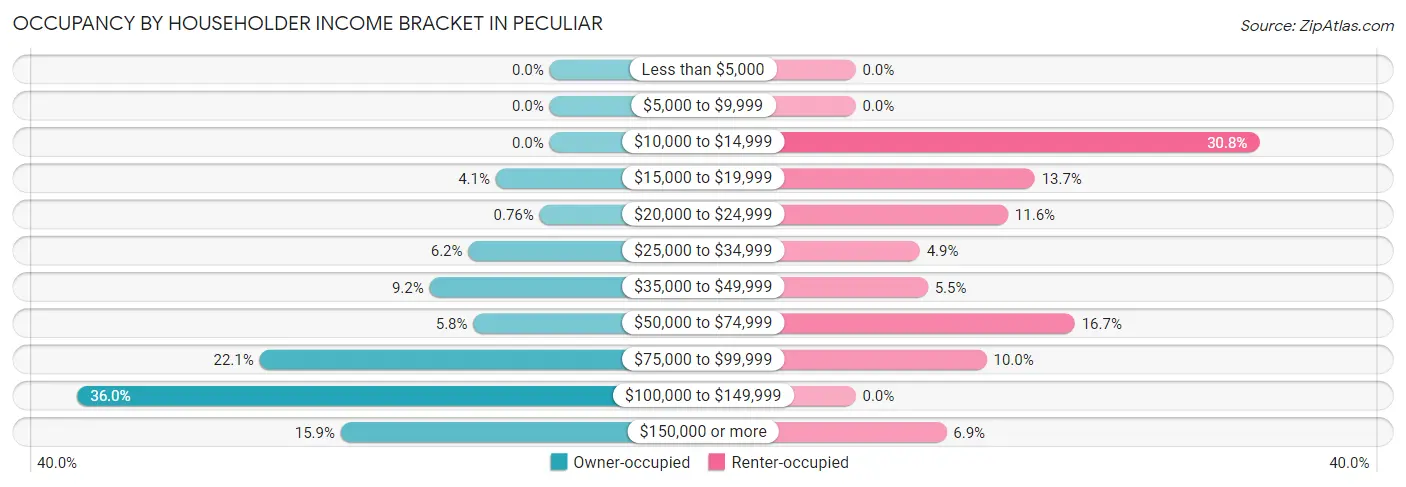
| Income Bracket | Owner-occupied | Renter-occupied |
| Less than $5,000 | 0 (0.0%) | 0 (0.0%) |
| $5,000 to $9,999 | 0 (0.0%) | 0 (0.0%) |
| $10,000 to $14,999 | 0 (0.0%) | 151 (30.7%) |
| $15,000 to $19,999 | 65 (4.1%) | 67 (13.7%) |
| $20,000 to $24,999 | 12 (0.8%) | 57 (11.6%) |
| $25,000 to $34,999 | 98 (6.2%) | 24 (4.9%) |
| $35,000 to $49,999 | 145 (9.1%) | 27 (5.5%) |
| $50,000 to $74,999 | 92 (5.8%) | 82 (16.7%) |
| $75,000 to $99,999 | 350 (22.1%) | 49 (10.0%) |
| $100,000 to $149,999 | 570 (36.0%) | 0 (0.0%) |
| $150,000 or more | 252 (15.9%) | 34 (6.9%) |
| Total | 1,584 (100.0%) | 491 (100.0%) |
Monthly Housing Cost Tiers in Peculiar
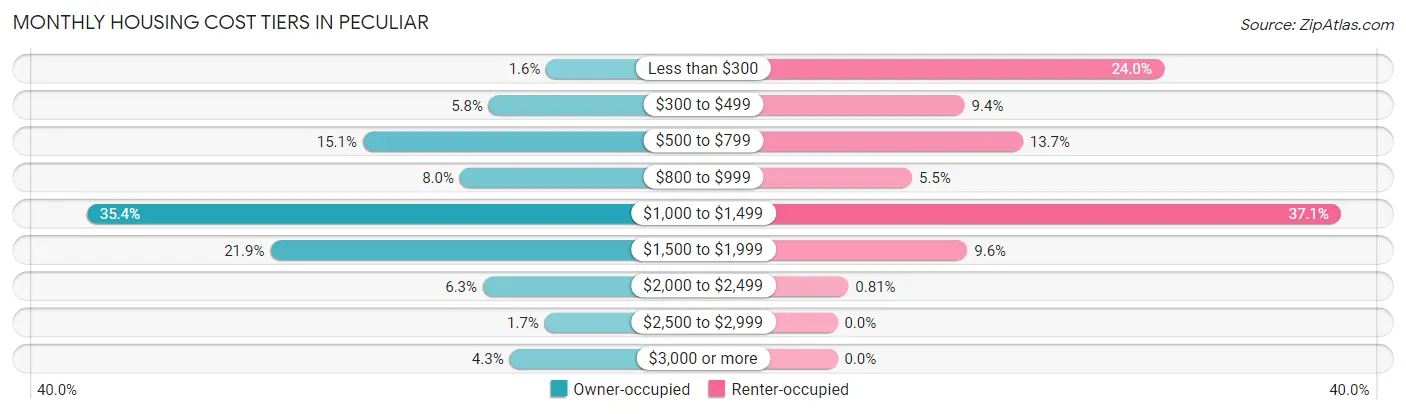
| Monthly Cost | Owner-occupied | Renter-occupied |
| Less than $300 | 25 (1.6%) | 118 (24.0%) |
| $300 to $499 | 92 (5.8%) | 46 (9.4%) |
| $500 to $799 | 239 (15.1%) | 67 (13.7%) |
| $800 to $999 | 126 (8.0%) | 27 (5.5%) |
| $1,000 to $1,499 | 561 (35.4%) | 182 (37.1%) |
| $1,500 to $1,999 | 347 (21.9%) | 47 (9.6%) |
| $2,000 to $2,499 | 99 (6.2%) | 4 (0.8%) |
| $2,500 to $2,999 | 27 (1.7%) | 0 (0.0%) |
| $3,000 or more | 68 (4.3%) | 0 (0.0%) |
| Total | 1,584 (100.0%) | 491 (100.0%) |
Physical Housing Characteristics in Peculiar
Housing Structures in Peculiar
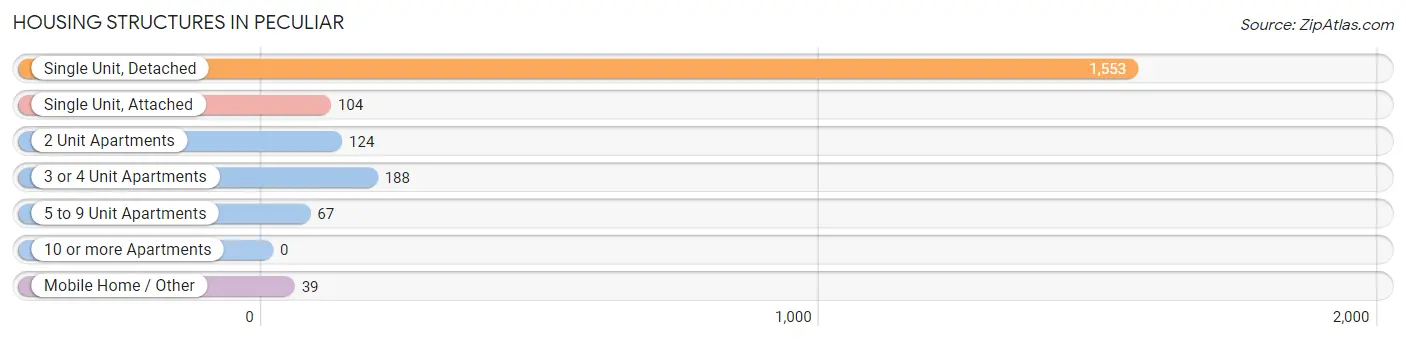
| Structure Type | # Housing Units | % Housing Units |
| Single Unit, Detached | 1,553 | 74.8% |
| Single Unit, Attached | 104 | 5.0% |
| 2 Unit Apartments | 124 | 6.0% |
| 3 or 4 Unit Apartments | 188 | 9.1% |
| 5 to 9 Unit Apartments | 67 | 3.2% |
| 10 or more Apartments | 0 | 0.0% |
| Mobile Home / Other | 39 | 1.9% |
| Total | 2,075 | 100.0% |
Housing Structures by Occupancy in Peculiar
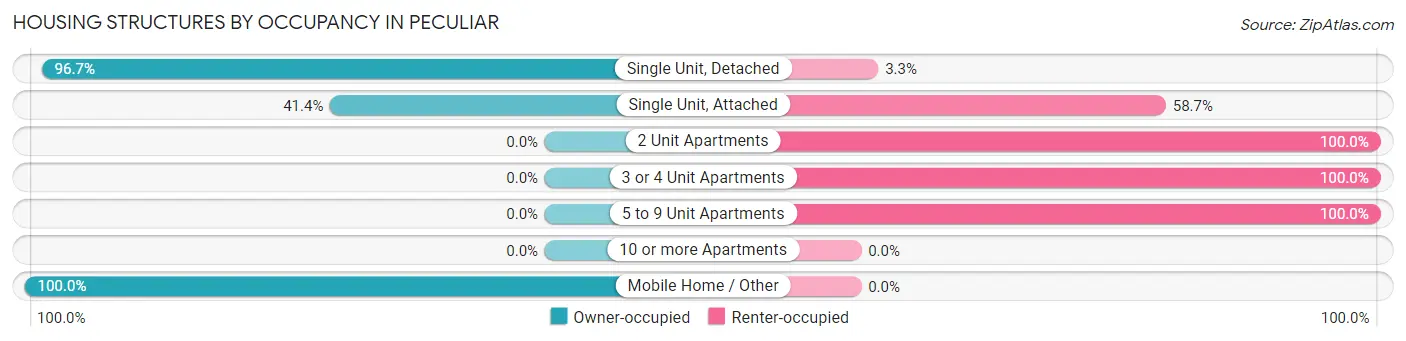
| Structure Type | Owner-occupied | Renter-occupied |
| Single Unit, Detached | 1,502 (96.7%) | 51 (3.3%) |
| Single Unit, Attached | 43 (41.3%) | 61 (58.7%) |
| 2 Unit Apartments | 0 (0.0%) | 124 (100.0%) |
| 3 or 4 Unit Apartments | 0 (0.0%) | 188 (100.0%) |
| 5 to 9 Unit Apartments | 0 (0.0%) | 67 (100.0%) |
| 10 or more Apartments | 0 (0.0%) | 0 (0.0%) |
| Mobile Home / Other | 39 (100.0%) | 0 (0.0%) |
| Total | 1,584 (76.3%) | 491 (23.7%) |
Housing Structures by Number of Rooms in Peculiar
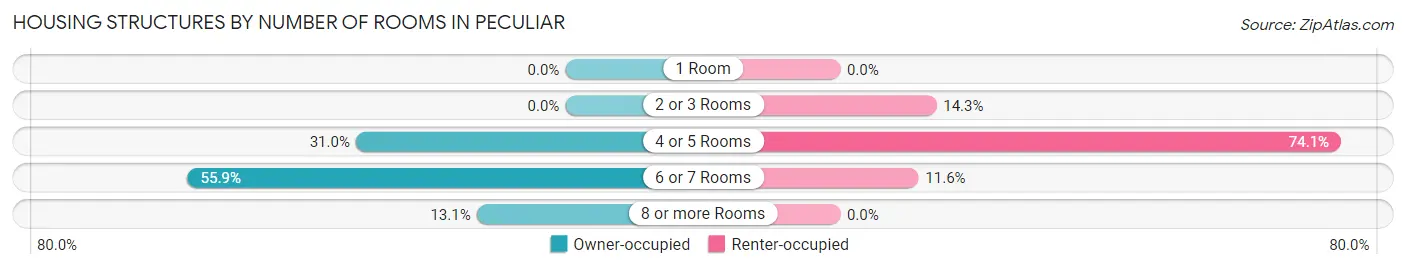
| Number of Rooms | Owner-occupied | Renter-occupied |
| 1 Room | 0 (0.0%) | 0 (0.0%) |
| 2 or 3 Rooms | 0 (0.0%) | 70 (14.3%) |
| 4 or 5 Rooms | 491 (31.0%) | 364 (74.1%) |
| 6 or 7 Rooms | 885 (55.9%) | 57 (11.6%) |
| 8 or more Rooms | 208 (13.1%) | 0 (0.0%) |
| Total | 1,584 (100.0%) | 491 (100.0%) |
Housing Structure by Heating Type in Peculiar
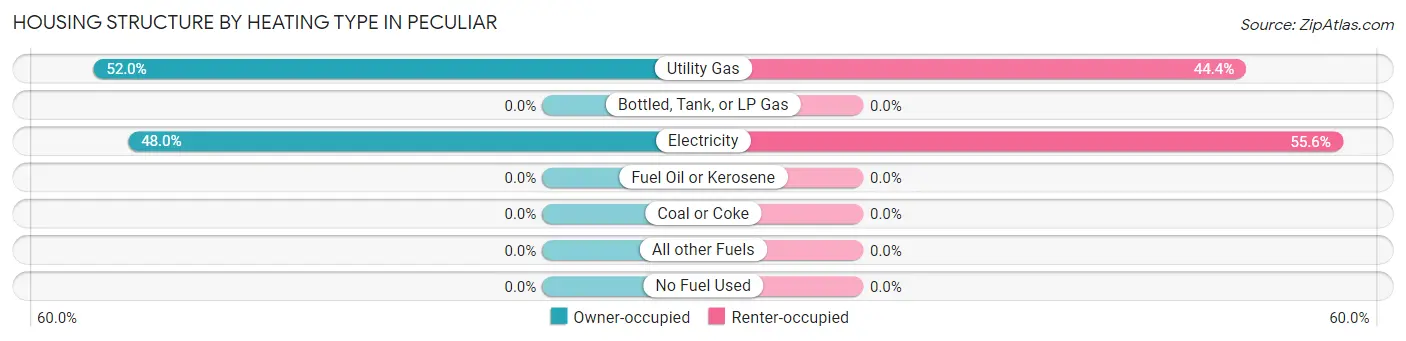
| Heating Type | Owner-occupied | Renter-occupied |
| Utility Gas | 824 (52.0%) | 218 (44.4%) |
| Bottled, Tank, or LP Gas | 0 (0.0%) | 0 (0.0%) |
| Electricity | 760 (48.0%) | 273 (55.6%) |
| Fuel Oil or Kerosene | 0 (0.0%) | 0 (0.0%) |
| Coal or Coke | 0 (0.0%) | 0 (0.0%) |
| All other Fuels | 0 (0.0%) | 0 (0.0%) |
| No Fuel Used | 0 (0.0%) | 0 (0.0%) |
| Total | 1,584 (100.0%) | 491 (100.0%) |
Household Vehicle Usage in Peculiar
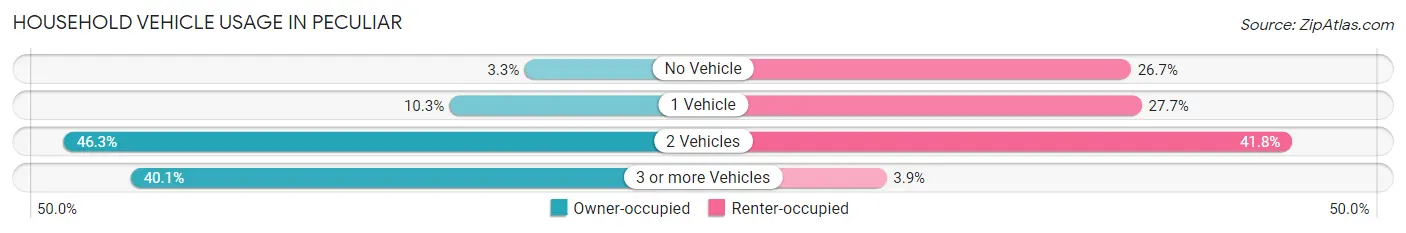
| Vehicles per Household | Owner-occupied | Renter-occupied |
| No Vehicle | 52 (3.3%) | 131 (26.7%) |
| 1 Vehicle | 163 (10.3%) | 136 (27.7%) |
| 2 Vehicles | 734 (46.3%) | 205 (41.7%) |
| 3 or more Vehicles | 635 (40.1%) | 19 (3.9%) |
| Total | 1,584 (100.0%) | 491 (100.0%) |
Real Estate & Mortgages in Peculiar
Real Estate and Mortgage Overview in Peculiar
| Characteristic | Without Mortgage | With Mortgage |
| Housing Units | 439 | 1,145 |
| Median Property Value | $225,300 | $193,200 |
| Median Household Income | $79,185 | $226 |
| Monthly Housing Costs | $635 | $68 |
| Real Estate Taxes | $2,250 | $42 |
Property Value by Mortgage Status in Peculiar
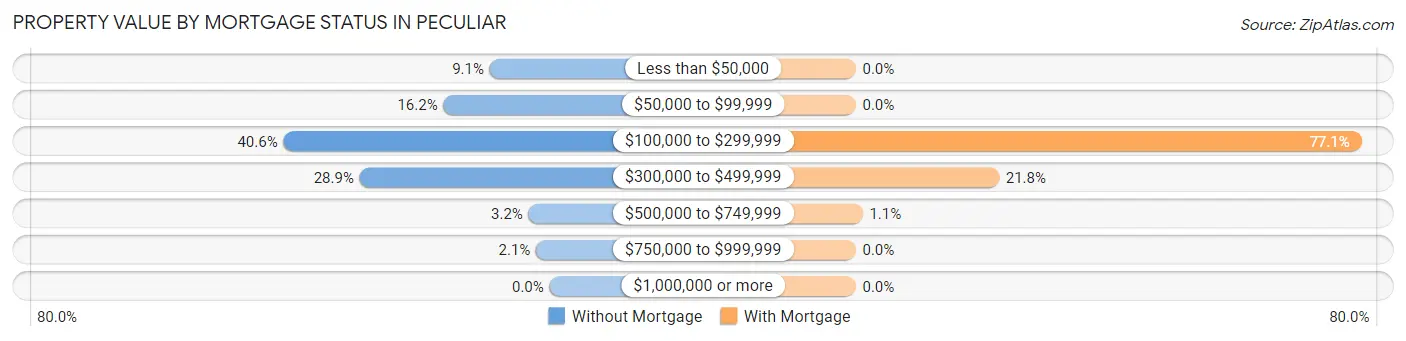
| Property Value | Without Mortgage | With Mortgage |
| Less than $50,000 | 40 (9.1%) | 0 (0.0%) |
| $50,000 to $99,999 | 71 (16.2%) | 0 (0.0%) |
| $100,000 to $299,999 | 178 (40.6%) | 883 (77.1%) |
| $300,000 to $499,999 | 127 (28.9%) | 250 (21.8%) |
| $500,000 to $749,999 | 14 (3.2%) | 12 (1.1%) |
| $750,000 to $999,999 | 9 (2.1%) | 0 (0.0%) |
| $1,000,000 or more | 0 (0.0%) | 0 (0.0%) |
| Total | 439 (100.0%) | 1,145 (100.0%) |
Household Income by Mortgage Status in Peculiar
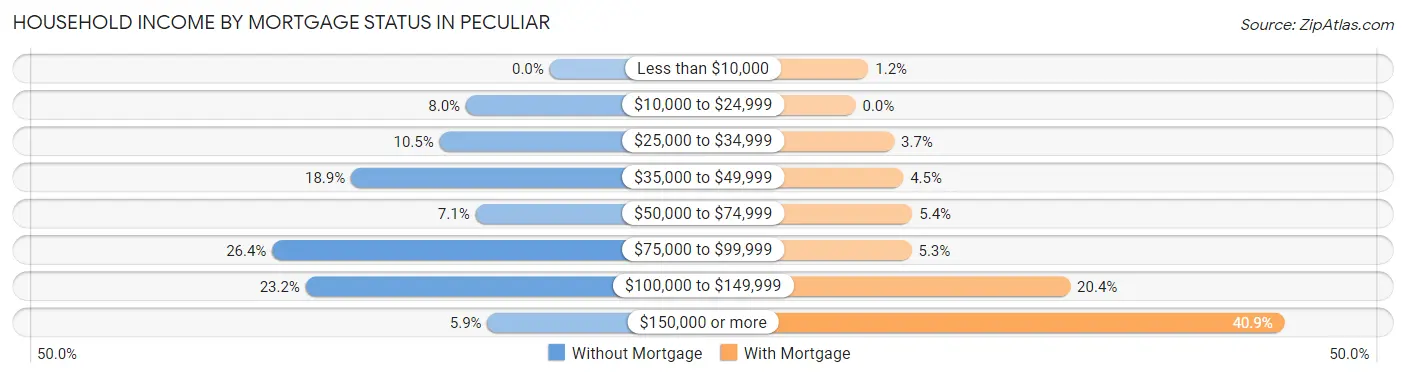
| Household Income | Without Mortgage | With Mortgage |
| Less than $10,000 | 0 (0.0%) | 14 (1.2%) |
| $10,000 to $24,999 | 35 (8.0%) | 0 (0.0%) |
| $25,000 to $34,999 | 46 (10.5%) | 42 (3.7%) |
| $35,000 to $49,999 | 83 (18.9%) | 52 (4.5%) |
| $50,000 to $74,999 | 31 (7.1%) | 62 (5.4%) |
| $75,000 to $99,999 | 116 (26.4%) | 61 (5.3%) |
| $100,000 to $149,999 | 102 (23.2%) | 234 (20.4%) |
| $150,000 or more | 26 (5.9%) | 468 (40.9%) |
| Total | 439 (100.0%) | 1,145 (100.0%) |
Property Value to Household Income Ratio in Peculiar
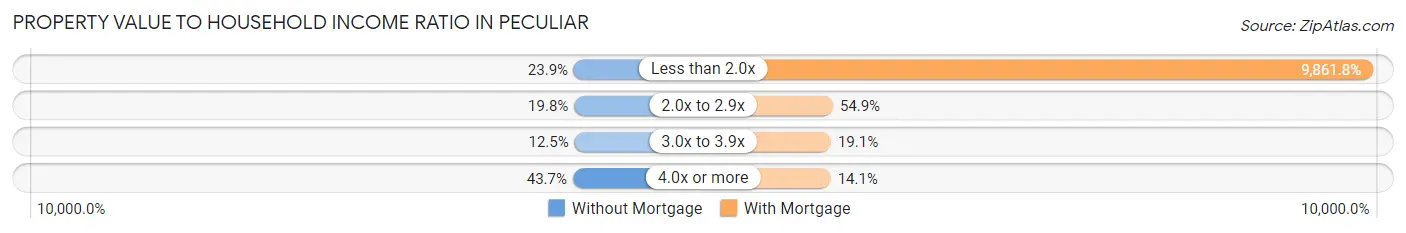
| Value-to-Income Ratio | Without Mortgage | With Mortgage |
| Less than 2.0x | 105 (23.9%) | 112,917 (9,861.8%) |
| 2.0x to 2.9x | 87 (19.8%) | 629 (54.9%) |
| 3.0x to 3.9x | 55 (12.5%) | 219 (19.1%) |
| 4.0x or more | 192 (43.7%) | 161 (14.1%) |
| Total | 439 (100.0%) | 1,145 (100.0%) |
Real Estate Taxes by Mortgage Status in Peculiar
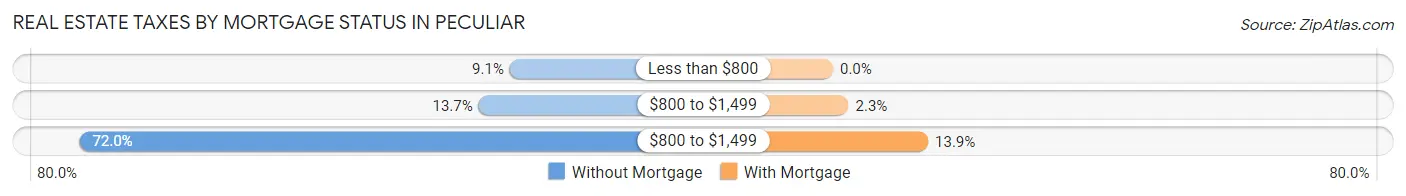
| Property Taxes | Without Mortgage | With Mortgage |
| Less than $800 | 40 (9.1%) | 0 (0.0%) |
| $800 to $1,499 | 60 (13.7%) | 26 (2.3%) |
| $800 to $1,499 | 316 (72.0%) | 159 (13.9%) |
| Total | 439 (100.0%) | 1,145 (100.0%) |
Health & Disability in Peculiar
Health Insurance Coverage by Age in Peculiar
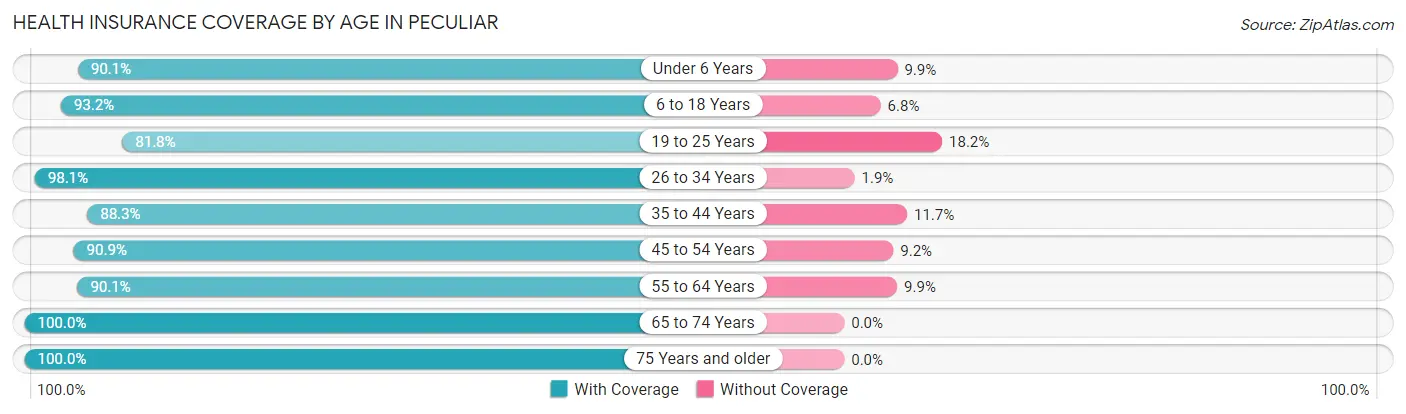
| Age Bracket | With Coverage | Without Coverage |
| Under 6 Years | 354 (90.1%) | 39 (9.9%) |
| 6 to 18 Years | 1,058 (93.2%) | 77 (6.8%) |
| 19 to 25 Years | 354 (81.8%) | 79 (18.2%) |
| 26 to 34 Years | 767 (98.1%) | 15 (1.9%) |
| 35 to 44 Years | 755 (88.3%) | 100 (11.7%) |
| 45 to 54 Years | 844 (90.8%) | 85 (9.1%) |
| 55 to 64 Years | 457 (90.1%) | 50 (9.9%) |
| 65 to 74 Years | 299 (100.0%) | 0 (0.0%) |
| 75 Years and older | 342 (100.0%) | 0 (0.0%) |
| Total | 5,230 (92.2%) | 445 (7.8%) |
Health Insurance Coverage by Citizenship Status in Peculiar
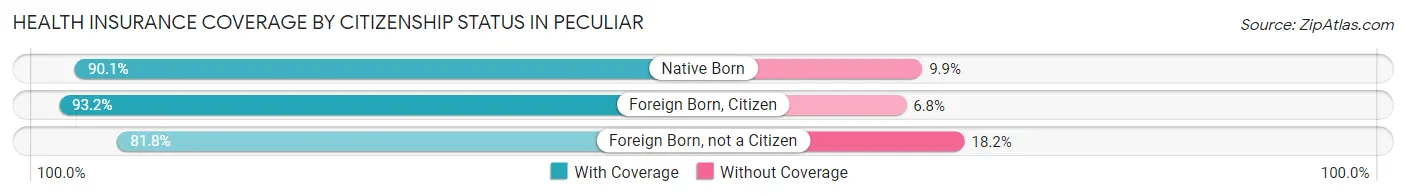
| Citizenship Status | With Coverage | Without Coverage |
| Native Born | 354 (90.1%) | 39 (9.9%) |
| Foreign Born, Citizen | 1,058 (93.2%) | 77 (6.8%) |
| Foreign Born, not a Citizen | 354 (81.8%) | 79 (18.2%) |
Health Insurance Coverage by Household Income in Peculiar
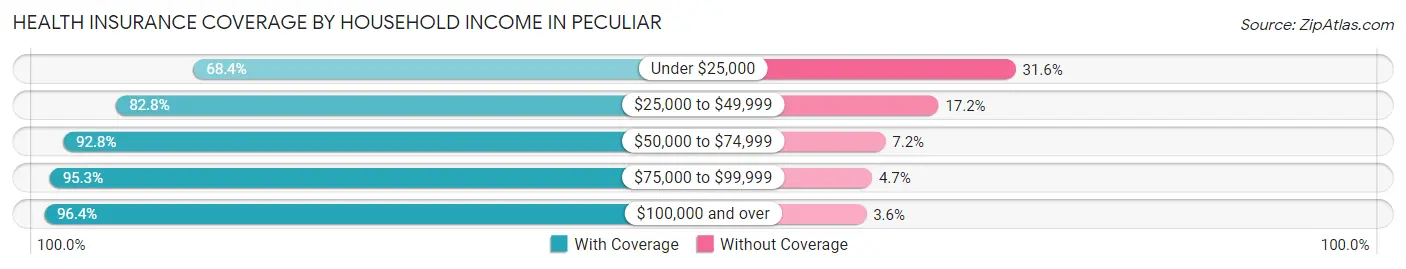
| Household Income | With Coverage | Without Coverage |
| Under $25,000 | 346 (68.4%) | 160 (31.6%) |
| $25,000 to $49,999 | 386 (82.8%) | 80 (17.2%) |
| $50,000 to $74,999 | 488 (92.8%) | 38 (7.2%) |
| $75,000 to $99,999 | 1,331 (95.3%) | 66 (4.7%) |
| $100,000 and over | 2,679 (96.4%) | 101 (3.6%) |
Public vs Private Health Insurance Coverage by Age in Peculiar
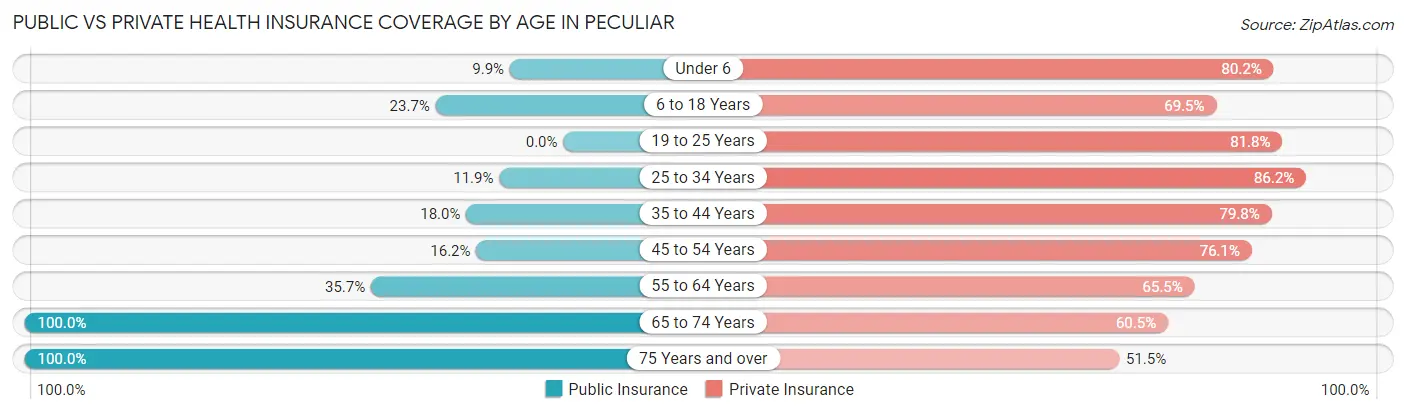
| Age Bracket | Public Insurance | Private Insurance |
| Under 6 | 39 (9.9%) | 315 (80.1%) |
| 6 to 18 Years | 269 (23.7%) | 789 (69.5%) |
| 19 to 25 Years | 0 (0.0%) | 354 (81.8%) |
| 25 to 34 Years | 93 (11.9%) | 674 (86.2%) |
| 35 to 44 Years | 154 (18.0%) | 682 (79.8%) |
| 45 to 54 Years | 150 (16.2%) | 707 (76.1%) |
| 55 to 64 Years | 181 (35.7%) | 332 (65.5%) |
| 65 to 74 Years | 299 (100.0%) | 181 (60.5%) |
| 75 Years and over | 342 (100.0%) | 176 (51.5%) |
| Total | 1,527 (26.9%) | 4,210 (74.2%) |
Disability Status by Sex by Age in Peculiar
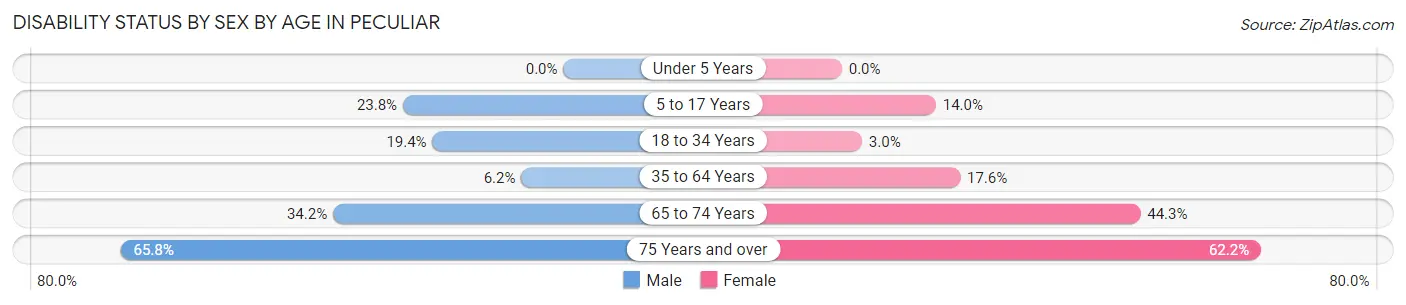
| Age Bracket | Male | Female |
| Under 5 Years | 0 (0.0%) | 0 (0.0%) |
| 5 to 17 Years | 157 (23.8%) | 67 (14.0%) |
| 18 to 34 Years | 145 (19.4%) | 15 (3.0%) |
| 35 to 64 Years | 73 (6.2%) | 197 (17.6%) |
| 65 to 74 Years | 39 (34.2%) | 82 (44.3%) |
| 75 Years and over | 96 (65.7%) | 122 (62.2%) |
Disability Class by Sex by Age in Peculiar
Disability Class: Hearing Difficulty
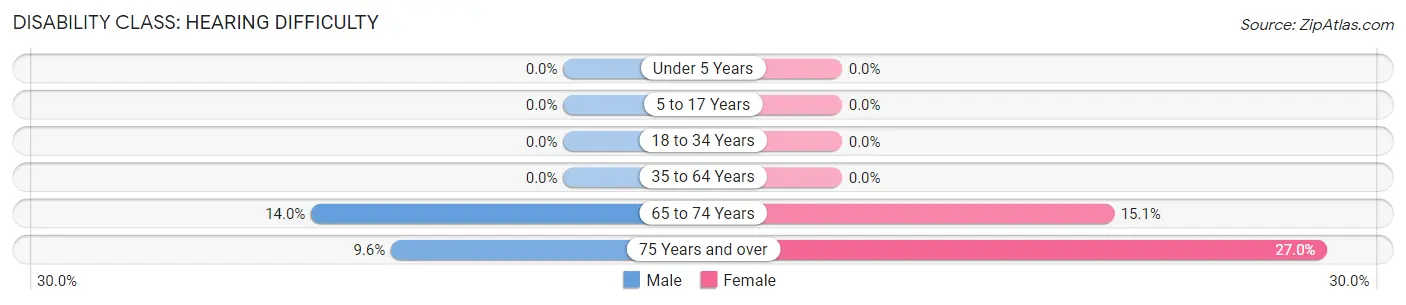
| Age Bracket | Male | Female |
| Under 5 Years | 0 (0.0%) | 0 (0.0%) |
| 5 to 17 Years | 0 (0.0%) | 0 (0.0%) |
| 18 to 34 Years | 0 (0.0%) | 0 (0.0%) |
| 35 to 64 Years | 0 (0.0%) | 0 (0.0%) |
| 65 to 74 Years | 16 (14.0%) | 28 (15.1%) |
| 75 Years and over | 14 (9.6%) | 53 (27.0%) |
Disability Class: Vision Difficulty
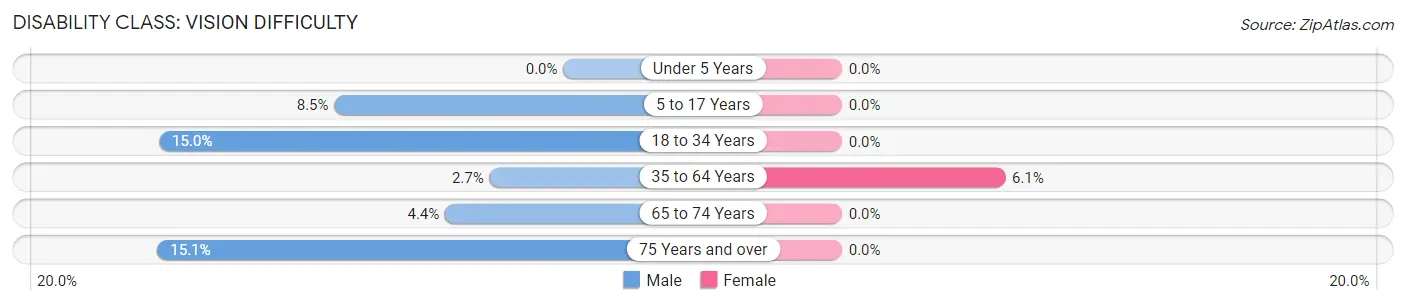
| Age Bracket | Male | Female |
| Under 5 Years | 0 (0.0%) | 0 (0.0%) |
| 5 to 17 Years | 56 (8.5%) | 0 (0.0%) |
| 18 to 34 Years | 112 (15.0%) | 0 (0.0%) |
| 35 to 64 Years | 32 (2.7%) | 68 (6.1%) |
| 65 to 74 Years | 5 (4.4%) | 0 (0.0%) |
| 75 Years and over | 22 (15.1%) | 0 (0.0%) |
Disability Class: Cognitive Difficulty
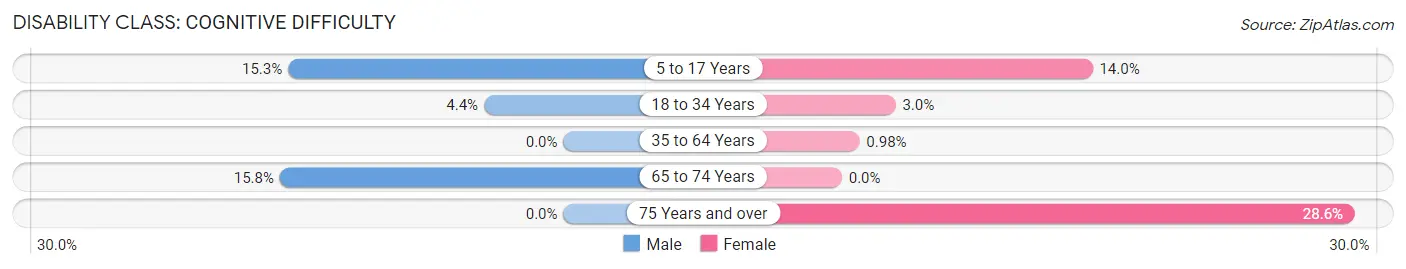
| Age Bracket | Male | Female |
| 5 to 17 Years | 101 (15.3%) | 67 (14.0%) |
| 18 to 34 Years | 33 (4.4%) | 15 (3.0%) |
| 35 to 64 Years | 0 (0.0%) | 11 (1.0%) |
| 65 to 74 Years | 18 (15.8%) | 0 (0.0%) |
| 75 Years and over | 0 (0.0%) | 56 (28.6%) |
Disability Class: Ambulatory Difficulty
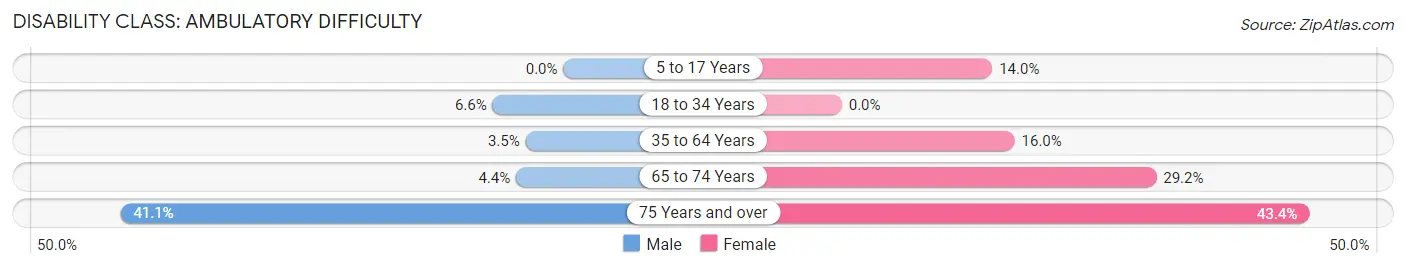
| Age Bracket | Male | Female |
| 5 to 17 Years | 0 (0.0%) | 67 (14.0%) |
| 18 to 34 Years | 49 (6.6%) | 0 (0.0%) |
| 35 to 64 Years | 41 (3.5%) | 180 (16.0%) |
| 65 to 74 Years | 5 (4.4%) | 54 (29.2%) |
| 75 Years and over | 60 (41.1%) | 85 (43.4%) |
Disability Class: Self-Care Difficulty
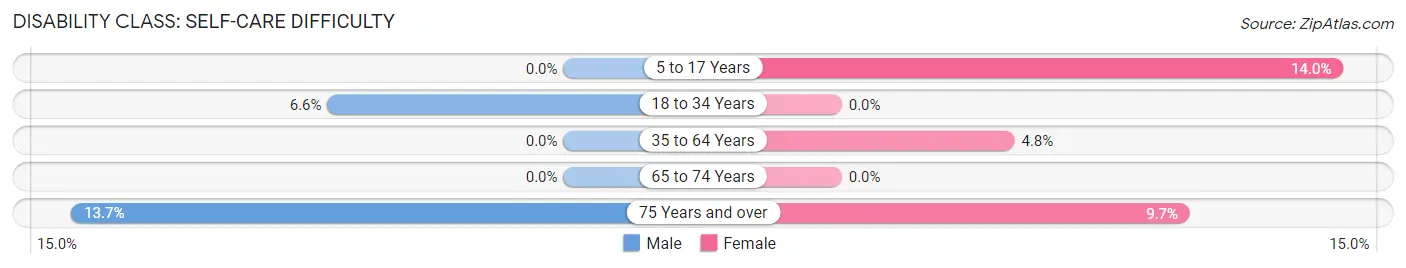
| Age Bracket | Male | Female |
| 5 to 17 Years | 0 (0.0%) | 67 (14.0%) |
| 18 to 34 Years | 49 (6.6%) | 0 (0.0%) |
| 35 to 64 Years | 0 (0.0%) | 54 (4.8%) |
| 65 to 74 Years | 0 (0.0%) | 0 (0.0%) |
| 75 Years and over | 20 (13.7%) | 19 (9.7%) |
Technology Access in Peculiar
Computing Device Access in Peculiar
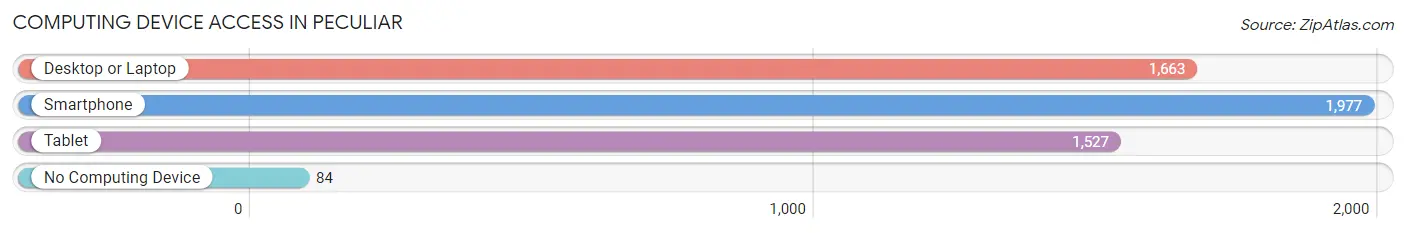
| Device Type | # Households | % Households |
| Desktop or Laptop | 1,663 | 80.1% |
| Smartphone | 1,977 | 95.3% |
| Tablet | 1,527 | 73.6% |
| No Computing Device | 84 | 4.1% |
| Total | 2,075 | 100.0% |
Internet Access in Peculiar
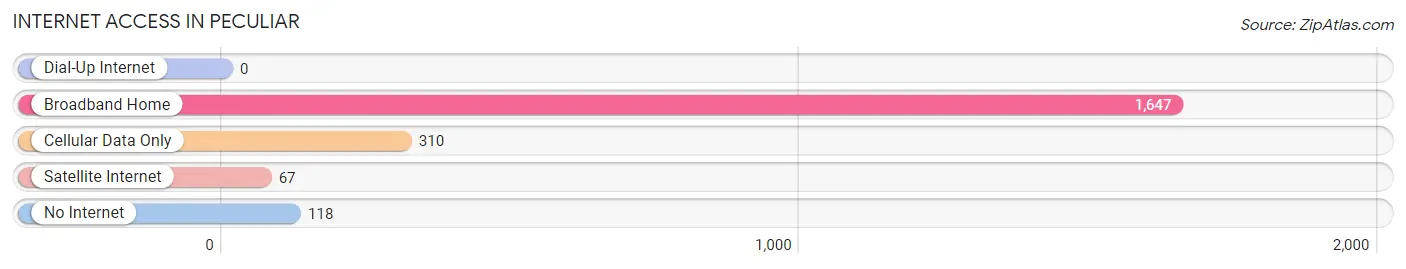
| Internet Type | # Households | % Households |
| Dial-Up Internet | 0 | 0.0% |
| Broadband Home | 1,647 | 79.4% |
| Cellular Data Only | 310 | 14.9% |
| Satellite Internet | 67 | 3.2% |
| No Internet | 118 | 5.7% |
| Total | 2,075 | 100.0% |
Peculiar Summary
Peculiar, Missouri is a small city located in Cass County, Missouri, about 25 miles south of Kansas City. It is part of the Kansas City metropolitan area and has a population of about 4,000 people. The city was founded in 1868 and was named after the peculiar shape of the nearby creek.
Geography
Peculiar is located in the western part of Cass County, Missouri, about 25 miles south of Kansas City. It is situated on the banks of the Peculiar Creek, which is the namesake of the city. The city is surrounded by rolling hills and farmland, and is located in the Missouri River Valley. The climate in Peculiar is humid continental, with hot summers and cold winters.
Economy
The economy of Peculiar is largely based on agriculture and manufacturing. The city is home to several large farms, as well as several small businesses. The city is also home to several manufacturing companies, including a plastics factory and a metal fabrication plant. The city also has a small retail sector, with several small shops and restaurants.
Demographics
As of the 2010 census, the population of Peculiar was 4,000 people. The racial makeup of the city was 95.3% White, 1.2% African American, 0.7% Native American, 0.3% Asian, 0.1% Pacific Islander, and 2.4% from other races. The median household income in Peculiar was $45,000, and the median family income was $50,000.
History
Peculiar was founded in 1868 by a group of settlers from Kentucky. The city was named after the peculiar shape of the nearby creek. The city was incorporated in 1872 and quickly grew to become a thriving agricultural community. In the early 1900s, the city began to industrialize, with several factories opening in the area. The city continued to grow throughout the 20th century, and today it is a thriving small city with a strong economy.
Peculiar is a small city with a rich history and a bright future. It is a great place to live, work, and raise a family. The city is home to a diverse population and a strong economy, and it is a great place to call home.
Common Questions
What is Per Capita Income in Peculiar?
Per Capita income in Peculiar is $33,442.
What is the Median Family Income in Peculiar?
Median Family Income in Peculiar is $96,781.
What is the Median Household income in Peculiar?
Median Household Income in Peculiar is $91,783.
What is Income or Wage Gap in Peculiar?
Income or Wage Gap in Peculiar is 17.5%.
Women in Peculiar earn 82.5 cents for every dollar earned by a man.
What is Inequality or Gini Index in Peculiar?
Inequality or Gini Index in Peculiar is 0.35.
What is the Total Population of Peculiar?
Total Population of Peculiar is 5,675.
What is the Total Male Population of Peculiar?
Total Male Population of Peculiar is 3,007.
What is the Total Female Population of Peculiar?
Total Female Population of Peculiar is 2,668.
What is the Ratio of Males per 100 Females in Peculiar?
There are 112.71 Males per 100 Females in Peculiar.
What is the Ratio of Females per 100 Males in Peculiar?
There are 88.73 Females per 100 Males in Peculiar.
What is the Median Population Age in Peculiar?
Median Population Age in Peculiar is 36.2 Years.
What is the Average Family Size in Peculiar
Average Family Size in Peculiar is 3.1 People.
What is the Average Household Size in Peculiar
Average Household Size in Peculiar is 2.7 People.
How Large is the Labor Force in Peculiar?
There are 3,088 People in the Labor Forcein in Peculiar.
What is the Percentage of People in the Labor Force in Peculiar?
69.8% of People are in the Labor Force in Peculiar.
What is the Unemployment Rate in Peculiar?
Unemployment Rate in Peculiar is 4.3%.