Kimmswick, MO Map & Demographics
Kimmswick Map
Kimmswick Overview
$30,848
PER CAPITA INCOME
$65,833
AVG FAMILY INCOME
$57,500
AVG HOUSEHOLD INCOME
0.34
INEQUALITY / GINI INDEX
122
TOTAL POPULATION
38
MALE POPULATION
84
FEMALE POPULATION
45.24
MALES / 100 FEMALES
221.05
FEMALES / 100 MALES
41.6
MEDIAN AGE
3.3
AVG FAMILY SIZE
2.1
AVG HOUSEHOLD SIZE
53
LABOR FORCE [ PEOPLE ]
54.6%
PERCENT IN LABOR FORCE
Kimmswick Zip Codes
Kimmswick Area Codes
Income in Kimmswick
Income Overview in Kimmswick
Per Capita Income in Kimmswick is $30,848, while median incomes of families and households are $65,833 and $57,500 respectively.
| Characteristic | Number | Measure |
| Per Capita Income | 122 | $30,848 |
| Median Family Income | 28 | $65,833 |
| Mean Family Income | 28 | $72,954 |
| Median Household Income | 58 | $57,500 |
| Mean Household Income | 58 | $62,652 |
| Income Deficit | 28 | $0 |
| Wage / Income Gap (%) | 122 | 0.00% |
| Wage / Income Gap ($) | 122 | 100.00¢ per $1 |
| Gini / Inequality Index | 122 | 0.34 |
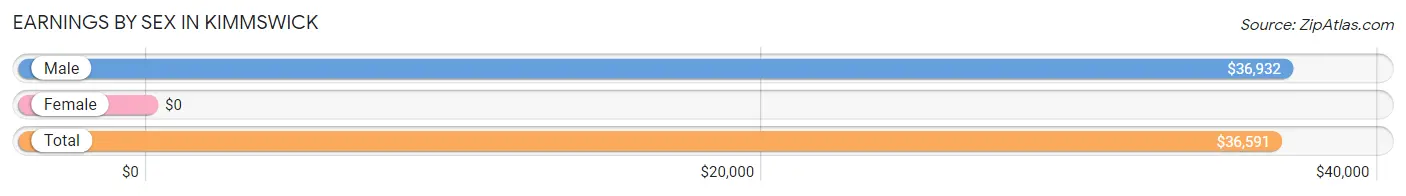
Earnings by Sex in Kimmswick
| Sex | Number | Average Earnings |
| Male | 19 (30.6%) | $36,932 |
| Female | 43 (69.4%) | $0 |
| Total | 62 (100.0%) | $36,591 |
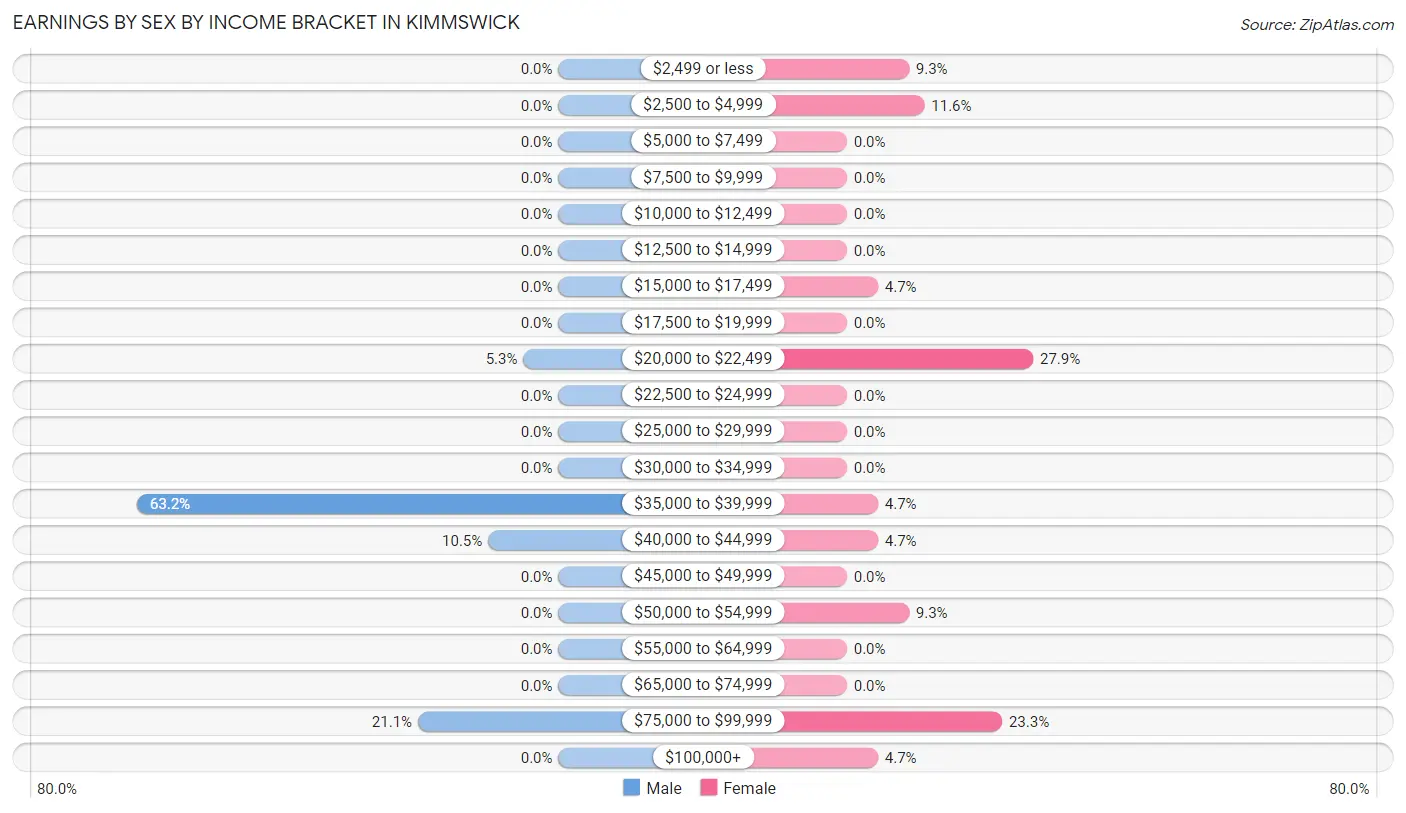
Earnings by Sex by Income Bracket in Kimmswick
The most common earnings brackets in Kimmswick are $35,000 to $39,999 for men (12 | 63.2%) and $20,000 to $22,499 for women (12 | 27.9%).
| Income | Male | Female |
| $2,499 or less | 0 (0.0%) | 4 (9.3%) |
| $2,500 to $4,999 | 0 (0.0%) | 5 (11.6%) |
| $5,000 to $7,499 | 0 (0.0%) | 0 (0.0%) |
| $7,500 to $9,999 | 0 (0.0%) | 0 (0.0%) |
| $10,000 to $12,499 | 0 (0.0%) | 0 (0.0%) |
| $12,500 to $14,999 | 0 (0.0%) | 0 (0.0%) |
| $15,000 to $17,499 | 0 (0.0%) | 2 (4.6%) |
| $17,500 to $19,999 | 0 (0.0%) | 0 (0.0%) |
| $20,000 to $22,499 | 1 (5.3%) | 12 (27.9%) |
| $22,500 to $24,999 | 0 (0.0%) | 0 (0.0%) |
| $25,000 to $29,999 | 0 (0.0%) | 0 (0.0%) |
| $30,000 to $34,999 | 0 (0.0%) | 0 (0.0%) |
| $35,000 to $39,999 | 12 (63.2%) | 2 (4.6%) |
| $40,000 to $44,999 | 2 (10.5%) | 2 (4.6%) |
| $45,000 to $49,999 | 0 (0.0%) | 0 (0.0%) |
| $50,000 to $54,999 | 0 (0.0%) | 4 (9.3%) |
| $55,000 to $64,999 | 0 (0.0%) | 0 (0.0%) |
| $65,000 to $74,999 | 0 (0.0%) | 0 (0.0%) |
| $75,000 to $99,999 | 4 (21.0%) | 10 (23.3%) |
| $100,000+ | 0 (0.0%) | 2 (4.6%) |
| Total | 19 (100.0%) | 43 (100.0%) |
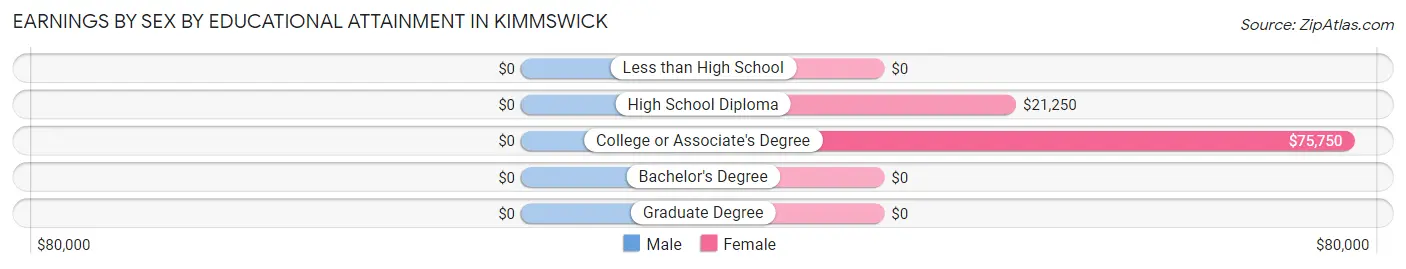
Earnings by Sex by Educational Attainment in Kimmswick
| Educational Attainment | Male Income | Female Income |
| Less than High School | - | - |
| High School Diploma | - | - |
| College or Associate's Degree | - | - |
| Bachelor's Degree | - | - |
| Graduate Degree | - | - |
| Total | $36,932 | $0 |
Family Income in Kimmswick
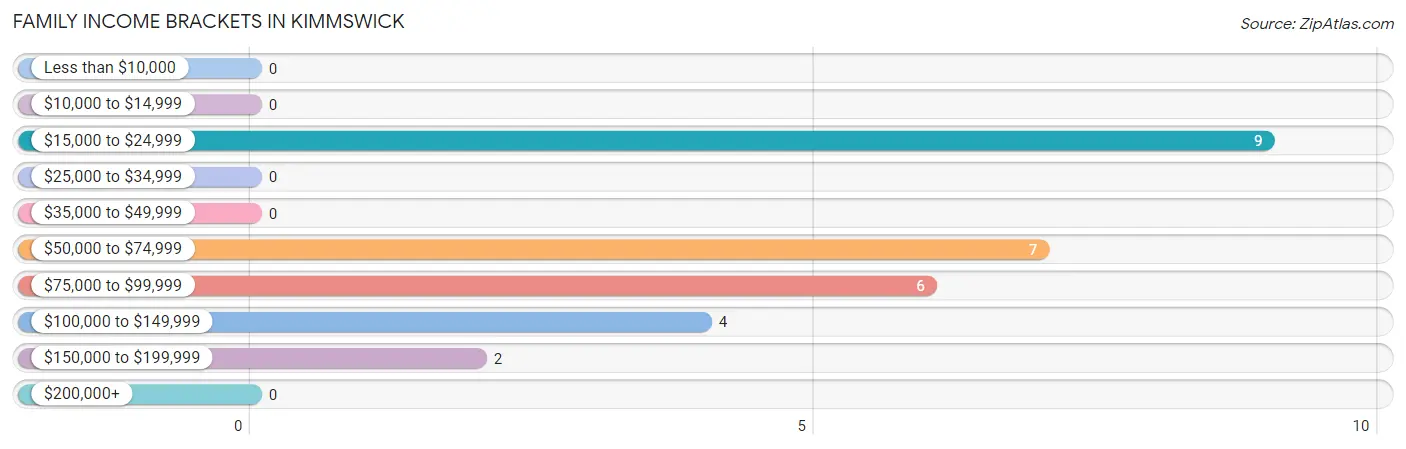
Family Income Brackets in Kimmswick
According to the Kimmswick family income data, there are 9 families falling into the $15,000 to $24,999 income range, which is the most common income bracket and makes up 32.1% of all families.
| Income Bracket | # Families | % Families |
| Less than $10,000 | 0 | 0.0% |
| $10,000 to $14,999 | 0 | 0.0% |
| $15,000 to $24,999 | 9 | 32.1% |
| $25,000 to $34,999 | 0 | 0.0% |
| $35,000 to $49,999 | 0 | 0.0% |
| $50,000 to $74,999 | 7 | 25.0% |
| $75,000 to $99,999 | 6 | 21.4% |
| $100,000 to $149,999 | 4 | 14.3% |
| $150,000 to $199,999 | 2 | 7.1% |
| $200,000+ | 0 | 0.0% |
Family Income by Famaliy Size in Kimmswick
| Income Bracket | # Families | Median Income |
| 2-Person Families | 17 (60.7%) | $0 |
| 3-Person Families | 3 (10.7%) | $0 |
| 4-Person Families | 2 (7.1%) | $0 |
| 5-Person Families | 6 (21.4%) | $0 |
| 6-Person Families | 0 (0.0%) | $0 |
| 7+ Person Families | 0 (0.0%) | $0 |
| Total | 28 (100.0%) | $65,833 |
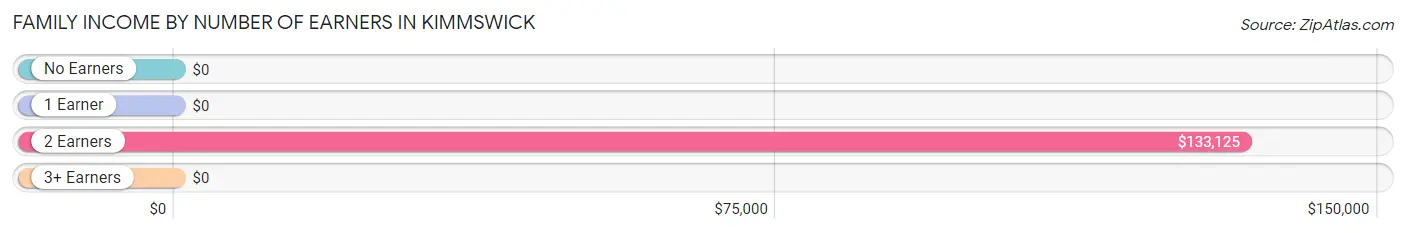
Family Income by Number of Earners in Kimmswick
| Number of Earners | # Families | Median Income |
| No Earners | 1 (3.6%) | $0 |
| 1 Earner | 17 (60.7%) | $0 |
| 2 Earners | 10 (35.7%) | $133,125 |
| 3+ Earners | 0 (0.0%) | $0 |
| Total | 28 (100.0%) | $65,833 |
Household Income in Kimmswick
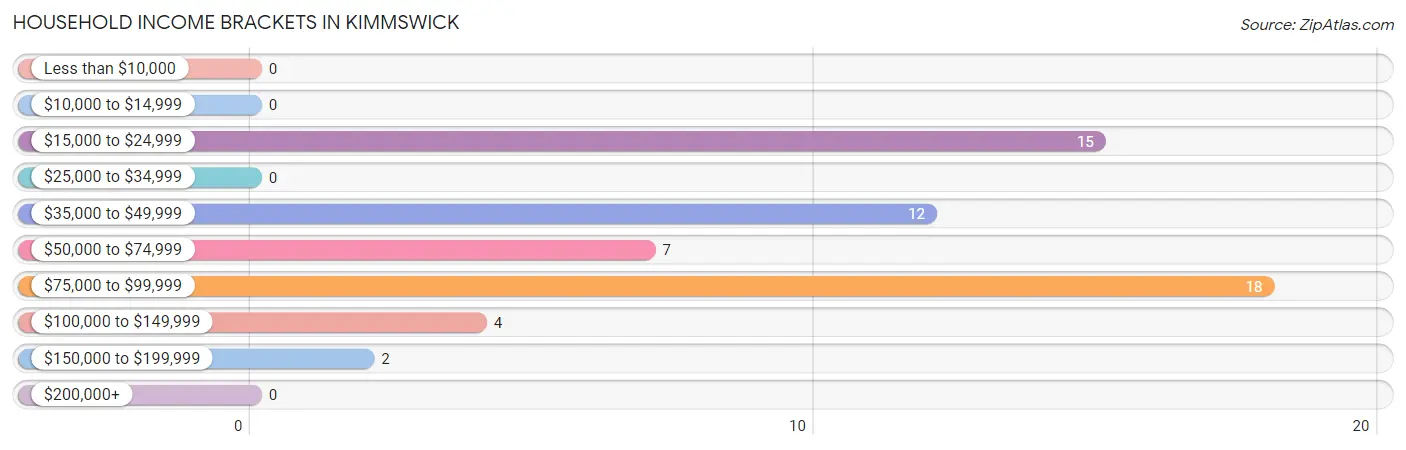
Household Income Brackets in Kimmswick
With 18 households falling in the category, the $75,000 to $99,999 income range is the most frequent in Kimmswick, accounting for 31.0% of all households.
| Income Bracket | # Households | % Households |
| Less than $10,000 | 0 | 0.0% |
| $10,000 to $14,999 | 0 | 0.0% |
| $15,000 to $24,999 | 15 | 25.9% |
| $25,000 to $34,999 | 0 | 0.0% |
| $35,000 to $49,999 | 12 | 20.7% |
| $50,000 to $74,999 | 7 | 12.1% |
| $75,000 to $99,999 | 18 | 31.0% |
| $100,000 to $149,999 | 4 | 6.9% |
| $150,000 to $199,999 | 2 | 3.4% |
| $200,000+ | 0 | 0.0% |
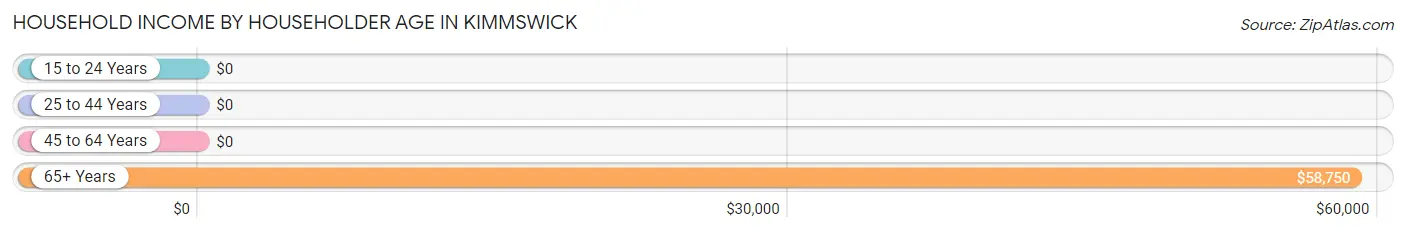
Household Income by Householder Age in Kimmswick
The median household income in Kimmswick is $57,500, with the highest median household income of $58,750 found in the 65+ years age bracket for the primary householder. A total of 22 households (37.9%) fall into this category.
| Income Bracket | # Households | Median Income |
| 15 to 24 Years | 0 (0.0%) | $0 |
| 25 to 44 Years | 14 (24.1%) | $0 |
| 45 to 64 Years | 22 (37.9%) | $0 |
| 65+ Years | 22 (37.9%) | $58,750 |
| Total | 58 (100.0%) | $57,500 |
Poverty in Kimmswick
Income Below Poverty by Sex and Age in Kimmswick
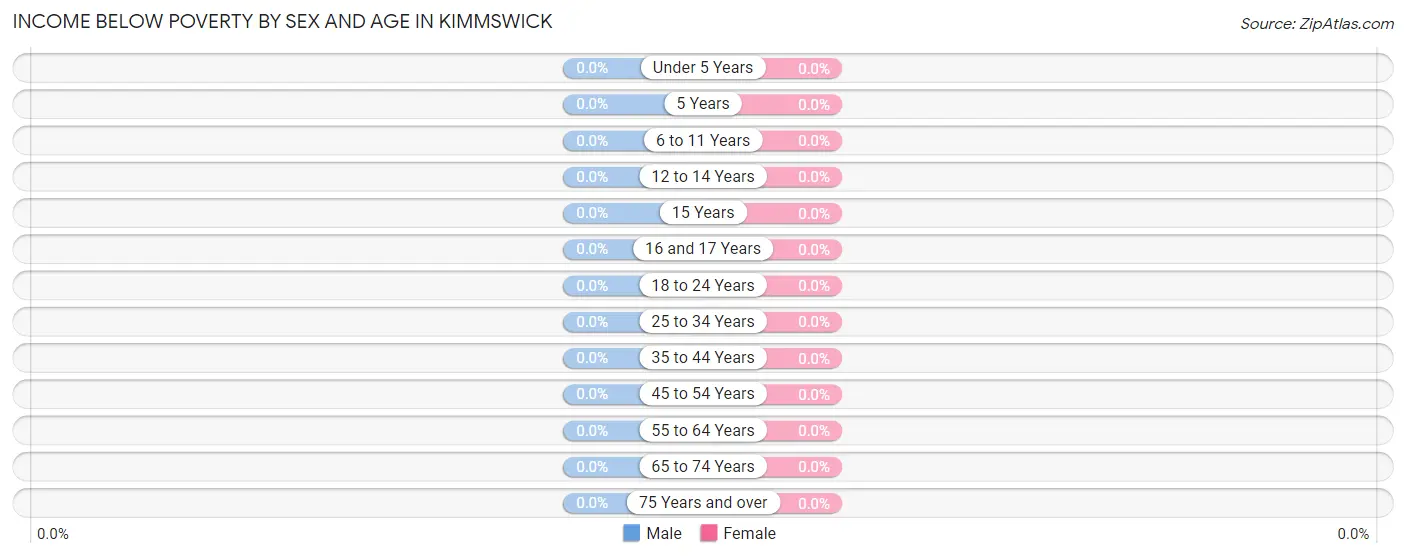
| Age Bracket | Male | Female |
| Under 5 Years | 0 (0.0%) | 0 (0.0%) |
| 5 Years | 0 (0.0%) | 0 (0.0%) |
| 6 to 11 Years | 0 (0.0%) | 0 (0.0%) |
| 12 to 14 Years | 0 (0.0%) | 0 (0.0%) |
| 15 Years | 0 (0.0%) | 0 (0.0%) |
| 16 and 17 Years | 0 (0.0%) | 0 (0.0%) |
| 18 to 24 Years | 0 (0.0%) | 0 (0.0%) |
| 25 to 34 Years | 0 (0.0%) | 0 (0.0%) |
| 35 to 44 Years | 0 (0.0%) | 0 (0.0%) |
| 45 to 54 Years | 0 (0.0%) | 0 (0.0%) |
| 55 to 64 Years | 0 (0.0%) | 0 (0.0%) |
| 65 to 74 Years | 0 (0.0%) | 0 (0.0%) |
| 75 Years and over | 0 (0.0%) | 0 (0.0%) |
| Total | 0 (0.0%) | 0 (0.0%) |
Income Above Poverty by Sex and Age in Kimmswick
According to the poverty statistics in Kimmswick, males aged 6 to 11 years and females aged under 5 years are the age groups that are most secure financially, with 100.0% of males and 100.0% of females in these age groups living above the poverty line.
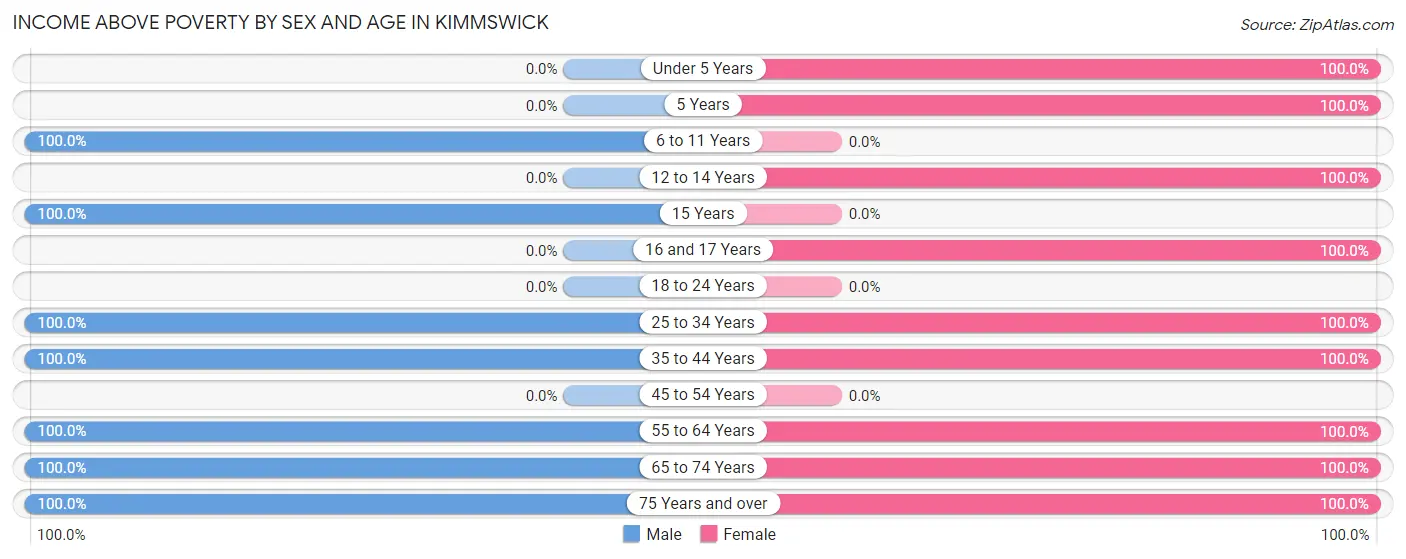
| Age Bracket | Male | Female |
| Under 5 Years | 0 (0.0%) | 8 (100.0%) |
| 5 Years | 0 (0.0%) | 7 (100.0%) |
| 6 to 11 Years | 3 (100.0%) | 0 (0.0%) |
| 12 to 14 Years | 0 (0.0%) | 3 (100.0%) |
| 15 Years | 4 (100.0%) | 0 (0.0%) |
| 16 and 17 Years | 0 (0.0%) | 7 (100.0%) |
| 18 to 24 Years | 0 (0.0%) | 0 (0.0%) |
| 25 to 34 Years | 5 (100.0%) | 16 (100.0%) |
| 35 to 44 Years | 11 (100.0%) | 2 (100.0%) |
| 45 to 54 Years | 0 (0.0%) | 0 (0.0%) |
| 55 to 64 Years | 4 (100.0%) | 20 (100.0%) |
| 65 to 74 Years | 8 (100.0%) | 16 (100.0%) |
| 75 Years and over | 3 (100.0%) | 5 (100.0%) |
| Total | 38 (100.0%) | 84 (100.0%) |
Income Below Poverty Among Married-Couple Families in Kimmswick
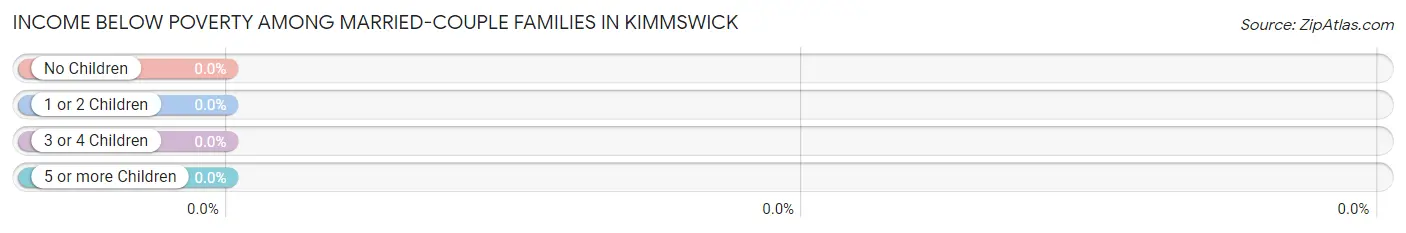
| Children | Above Poverty | Below Poverty |
| No Children | 6 (100.0%) | 0 (0.0%) |
| 1 or 2 Children | 5 (100.0%) | 0 (0.0%) |
| 3 or 4 Children | 6 (100.0%) | 0 (0.0%) |
| 5 or more Children | 0 (0.0%) | 0 (0.0%) |
| Total | 17 (100.0%) | 0 (0.0%) |
Income Below Poverty Among Single-Parent Households in Kimmswick
| Children | Single Father | Single Mother |
| No Children | 0 (0.0%) | 0 (0.0%) |
| 1 or 2 Children | 0 (0.0%) | 0 (0.0%) |
| 3 or 4 Children | 0 (0.0%) | 0 (0.0%) |
| 5 or more Children | 0 (0.0%) | 0 (0.0%) |
| Total | 0 (0.0%) | 0 (0.0%) |
Income Below Poverty Among Married-Couple vs Single-Parent Households in Kimmswick
| Children | Married-Couple Families | Single-Parent Households |
| No Children | 0 (0.0%) | 0 (0.0%) |
| 1 or 2 Children | 0 (0.0%) | 0 (0.0%) |
| 3 or 4 Children | 0 (0.0%) | 0 (0.0%) |
| 5 or more Children | 0 (0.0%) | 0 (0.0%) |
| Total | 0 (0.0%) | 0 (0.0%) |
Race in Kimmswick
The most populous races in Kimmswick are , and White / Caucasian (122 | 100.0%).
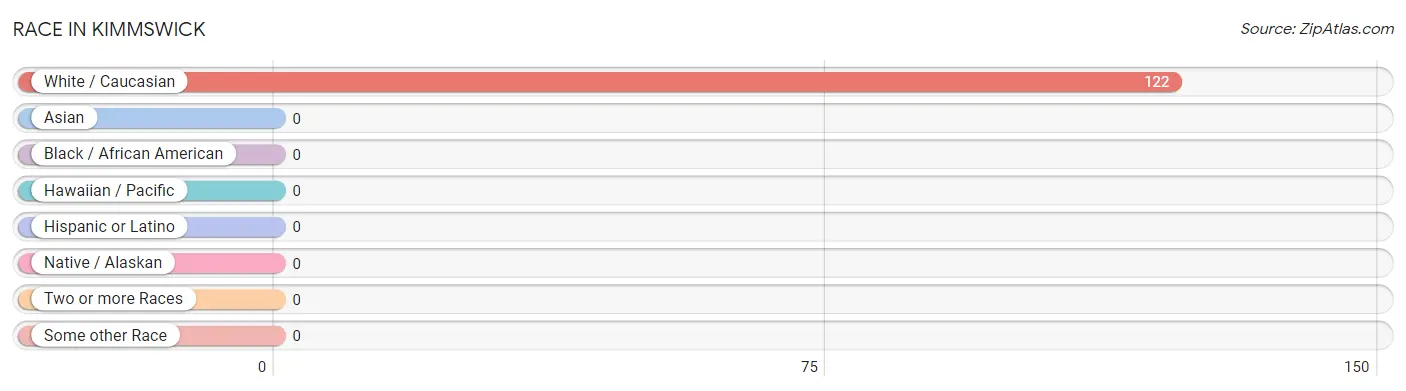
| Race | # Population | % Population |
| Asian | 0 | 0.0% |
| Black / African American | 0 | 0.0% |
| Hawaiian / Pacific | 0 | 0.0% |
| Hispanic or Latino | 0 | 0.0% |
| Native / Alaskan | 0 | 0.0% |
| White / Caucasian | 122 | 100.0% |
| Two or more Races | 0 | 0.0% |
| Some other Race | 0 | 0.0% |
| Total | 122 | 100.0% |
Ancestry in Kimmswick
The most populous ancestries reported in Kimmswick are German (51 | 41.8%), Irish (30 | 24.6%), English (29 | 23.8%), European (20 | 16.4%), and American (14 | 11.5%), together accounting for 118.0% of all Kimmswick residents.
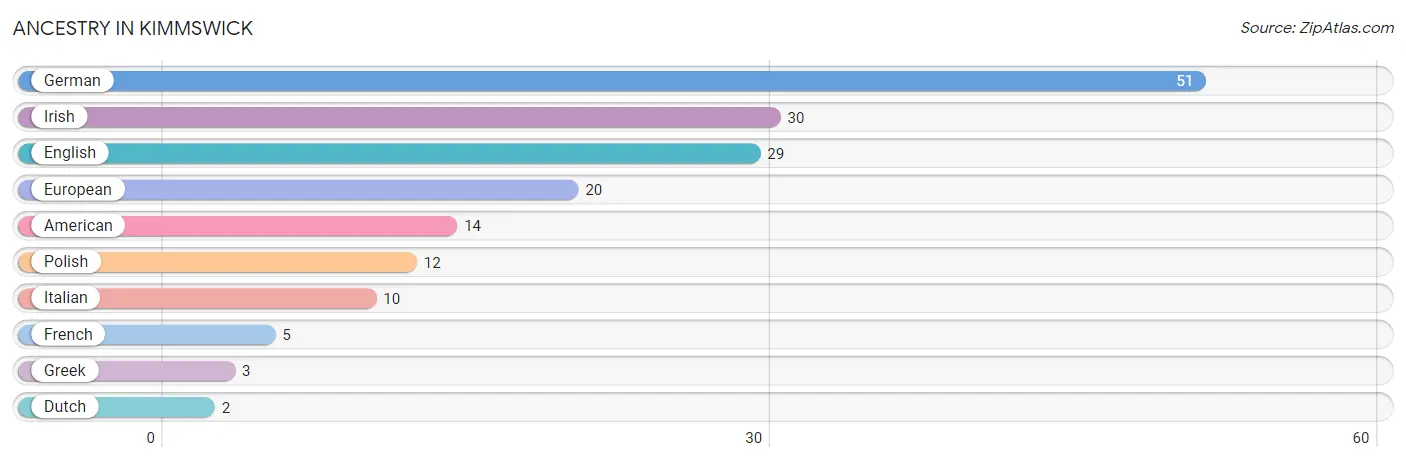
| Ancestry | # Population | % Population |
| American | 14 | 11.5% |
| Dutch | 2 | 1.6% |
| English | 29 | 23.8% |
| European | 20 | 16.4% |
| French | 5 | 4.1% |
| German | 51 | 41.8% |
| Greek | 3 | 2.5% |
| Irish | 30 | 24.6% |
| Italian | 10 | 8.2% |
| Polish | 12 | 9.8% | View All 10 Rows |
Immigrants in Kimmswick

| Immigration Origin | # Population | % Population | View All 0 Rows |
Sex and Age in Kimmswick
Sex and Age in Kimmswick
The most populous age groups in Kimmswick are 40 to 44 Years (11 | 28.9%) for men and 30 to 34 Years (16 | 19.1%) for women.
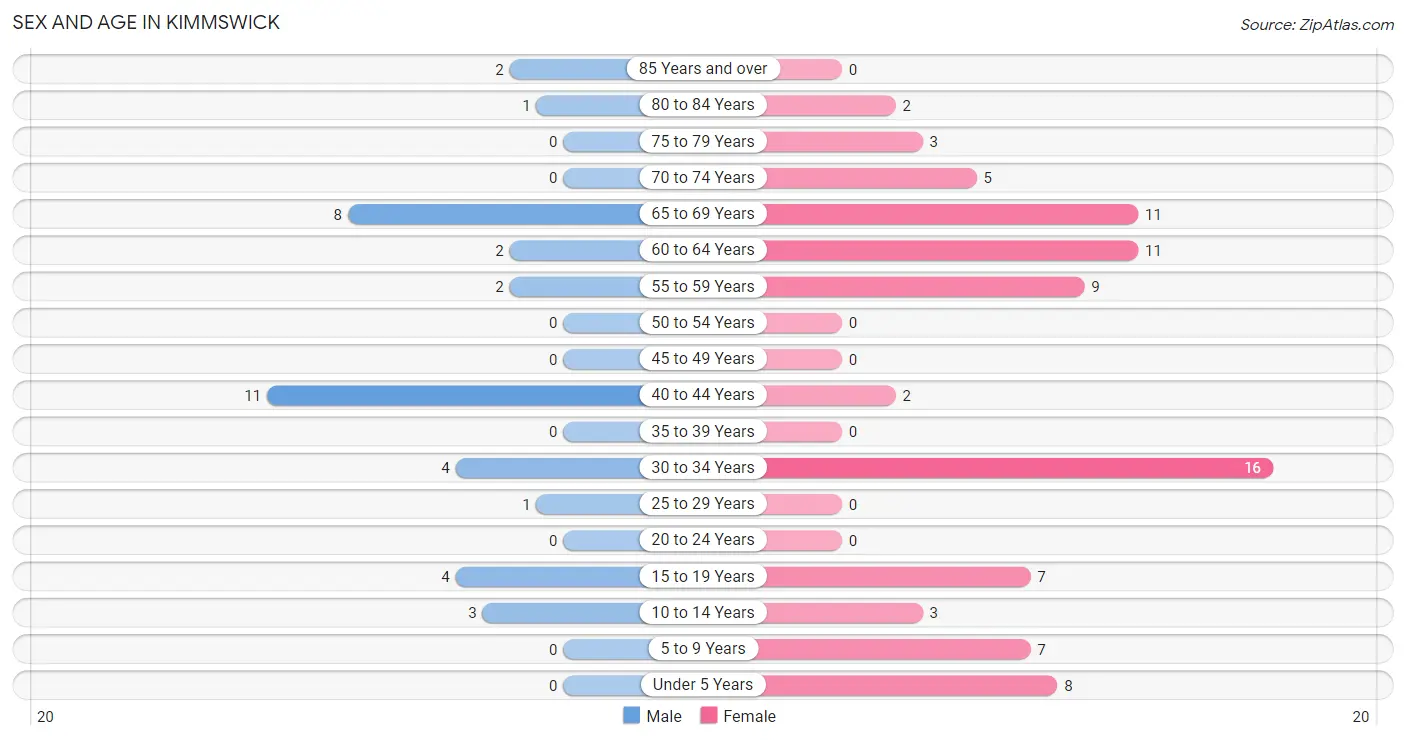
| Age Bracket | Male | Female |
| Under 5 Years | 0 (0.0%) | 8 (9.5%) |
| 5 to 9 Years | 0 (0.0%) | 7 (8.3%) |
| 10 to 14 Years | 3 (7.9%) | 3 (3.6%) |
| 15 to 19 Years | 4 (10.5%) | 7 (8.3%) |
| 20 to 24 Years | 0 (0.0%) | 0 (0.0%) |
| 25 to 29 Years | 1 (2.6%) | 0 (0.0%) |
| 30 to 34 Years | 4 (10.5%) | 16 (19.1%) |
| 35 to 39 Years | 0 (0.0%) | 0 (0.0%) |
| 40 to 44 Years | 11 (28.9%) | 2 (2.4%) |
| 45 to 49 Years | 0 (0.0%) | 0 (0.0%) |
| 50 to 54 Years | 0 (0.0%) | 0 (0.0%) |
| 55 to 59 Years | 2 (5.3%) | 9 (10.7%) |
| 60 to 64 Years | 2 (5.3%) | 11 (13.1%) |
| 65 to 69 Years | 8 (21.0%) | 11 (13.1%) |
| 70 to 74 Years | 0 (0.0%) | 5 (5.9%) |
| 75 to 79 Years | 0 (0.0%) | 3 (3.6%) |
| 80 to 84 Years | 1 (2.6%) | 2 (2.4%) |
| 85 Years and over | 2 (5.3%) | 0 (0.0%) |
| Total | 38 (100.0%) | 84 (100.0%) |
Families and Households in Kimmswick
Median Family Size in Kimmswick
The median family size in Kimmswick is 3.29 persons per family, with married-couple families (17 | 60.7%) accounting for the largest median family size of 4 persons per family. On the other hand, single male/father families (2 | 7.1%) represent the smallest median family size with 1.50 persons per family.
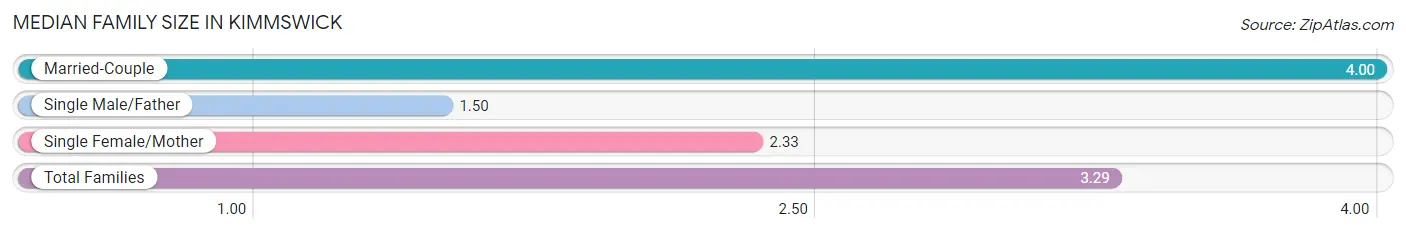
| Family Type | # Families | Family Size |
| Married-Couple | 17 (60.7%) | 4.00 |
| Single Male/Father | 2 (7.1%) | 1.50 |
| Single Female/Mother | 9 (32.1%) | 2.33 |
| Total Families | 28 (100.0%) | 3.29 |
Median Household Size in Kimmswick
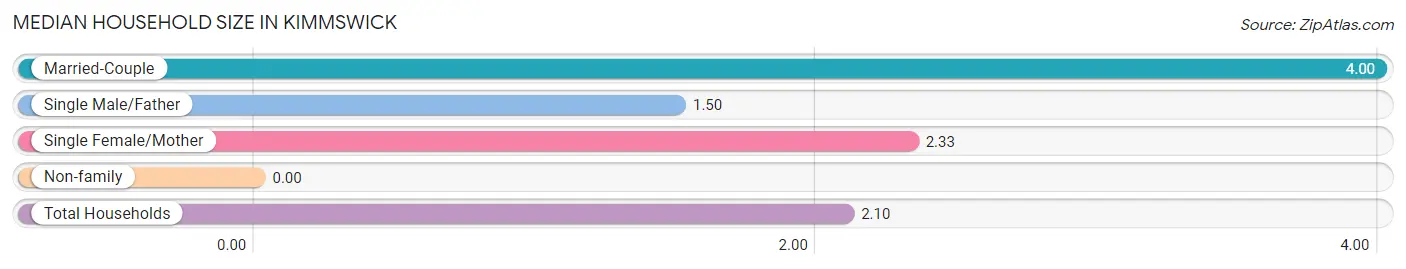
| Household Type | # Households | Household Size |
| Married-Couple | 17 (29.3%) | 4.00 |
| Single Male/Father | 2 (3.5%) | 1.50 |
| Single Female/Mother | 9 (15.5%) | 2.33 |
| Non-family | 30 (51.7%) | - |
| Total Households | 58 (100.0%) | 2.10 |
Household Size by Marriage Status in Kimmswick
Out of a total of 58 households in Kimmswick, 28 (48.3%) are family households, while 30 (51.7%) are nonfamily households. The most numerous type of family households are 2-person households, comprising 17, and the most common type of nonfamily households are 1-person households, comprising 30.
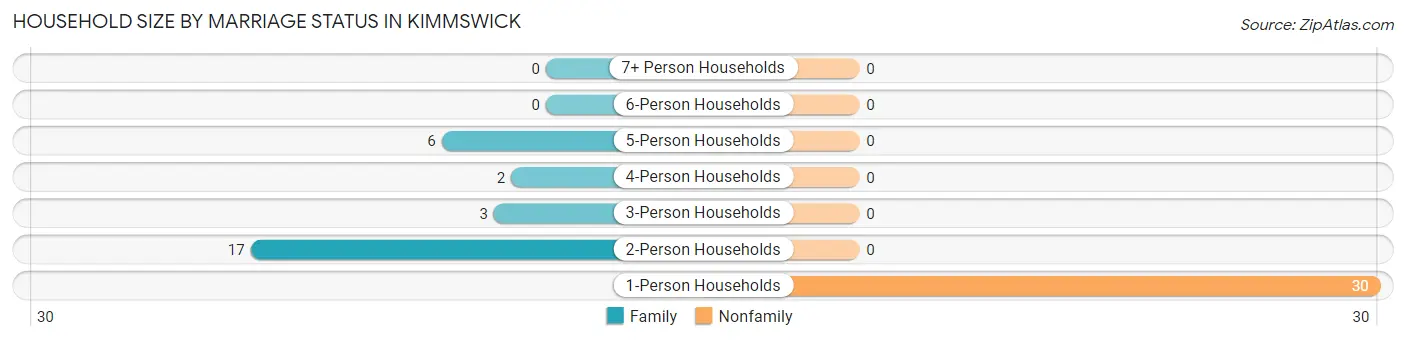
| Household Size | Family Households | Nonfamily Households |
| 1-Person Households | - | 30 (51.7%) |
| 2-Person Households | 17 (29.3%) | 0 (0.0%) |
| 3-Person Households | 3 (5.2%) | 0 (0.0%) |
| 4-Person Households | 2 (3.5%) | 0 (0.0%) |
| 5-Person Households | 6 (10.3%) | 0 (0.0%) |
| 6-Person Households | 0 (0.0%) | 0 (0.0%) |
| 7+ Person Households | 0 (0.0%) | 0 (0.0%) |
| Total | 28 (48.3%) | 30 (51.7%) |
Female Fertility in Kimmswick
Fertility by Age in Kimmswick
| Age Bracket | Women with Births | Births / 1,000 Women |
| 15 to 19 years | 0 (0.0%) | 0.0 |
| 20 to 34 years | 0 (0.0%) | 0.0 |
| 35 to 50 years | 0 (0.0%) | 0.0 |
| Total | 0 (0.0%) | 0.0 |
Fertility by Age by Marriage Status in Kimmswick
| Age Bracket | Married | Unmarried |
| 15 to 19 years | 0 (0.0%) | 0 (0.0%) |
| 20 to 34 years | 0 (0.0%) | 0 (0.0%) |
| 35 to 50 years | 0 (0.0%) | 0 (0.0%) |
| Total | 0 (0.0%) | 0 (0.0%) |
Fertility by Education in Kimmswick
| Educational Attainment | Women with Births | Births / 1,000 Women |
| Less than High School | 0 (0.0%) | 0.0 |
| High School Diploma | 0 (0.0%) | 0.0 |
| College or Associate's Degree | 0 (0.0%) | 0.0 |
| Bachelor's Degree | 0 (0.0%) | 0.0 |
| Graduate Degree | 0 (0.0%) | 0.0 |
| Total | 0 (0.0%) | 0.0 |
Fertility by Education by Marriage Status in Kimmswick
| Educational Attainment | Married | Unmarried |
| Less than High School | 0 (0.0%) | 0 (0.0%) |
| High School Diploma | 0 (0.0%) | 0 (0.0%) |
| College or Associate's Degree | 0 (0.0%) | 0 (0.0%) |
| Bachelor's Degree | 0 (0.0%) | 0 (0.0%) |
| Graduate Degree | 0 (0.0%) | 0 (0.0%) |
| Total | 0 (0.0%) | 0 (0.0%) |
Employment Characteristics in Kimmswick
Employment by Class of Employer in Kimmswick
Among the 50 employed individuals in Kimmswick, private company employees (42 | 84.0%), not-for-profit organizations (6 | 12.0%), and self-employed (incorporated) (2 | 4.0%) make up the most common classes of employment.
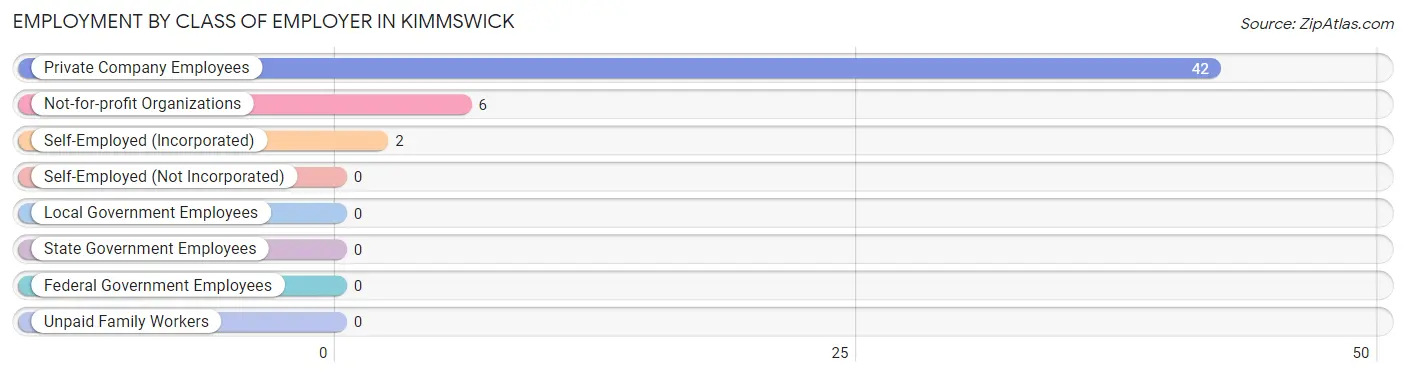
| Employer Class | # Employees | % Employees |
| Private Company Employees | 42 | 84.0% |
| Self-Employed (Incorporated) | 2 | 4.0% |
| Self-Employed (Not Incorporated) | 0 | 0.0% |
| Not-for-profit Organizations | 6 | 12.0% |
| Local Government Employees | 0 | 0.0% |
| State Government Employees | 0 | 0.0% |
| Federal Government Employees | 0 | 0.0% |
| Unpaid Family Workers | 0 | 0.0% |
| Total | 50 | 100.0% |
Employment Status by Age in Kimmswick
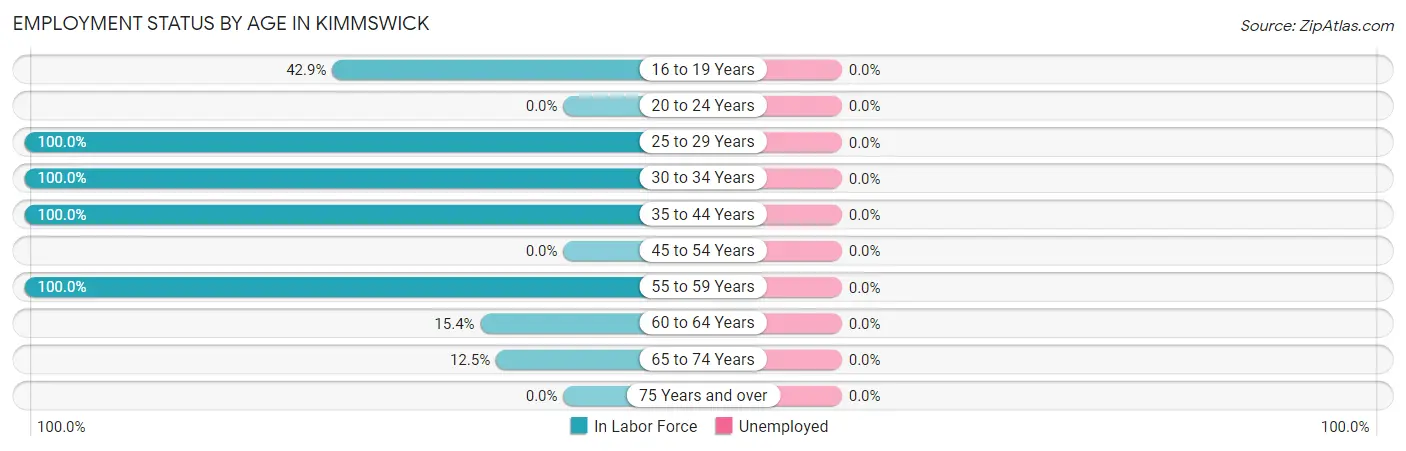
| Age Bracket | In Labor Force | Unemployed |
| 16 to 19 Years | 3 (42.9%) | 0 (0.0%) |
| 20 to 24 Years | 0 (0.0%) | 0 (0.0%) |
| 25 to 29 Years | 1 (100.0%) | 0 (0.0%) |
| 30 to 34 Years | 20 (100.0%) | 0 (0.0%) |
| 35 to 44 Years | 13 (100.0%) | 0 (0.0%) |
| 45 to 54 Years | 0 (0.0%) | 0 (0.0%) |
| 55 to 59 Years | 11 (100.0%) | 0 (0.0%) |
| 60 to 64 Years | 2 (15.4%) | 0 (0.0%) |
| 65 to 74 Years | 3 (12.5%) | 0 (0.0%) |
| 75 Years and over | 0 (0.0%) | 0 (0.0%) |
| Total | 53 (54.6%) | 0 (0.0%) |
Employment Status by Educational Attainment in Kimmswick
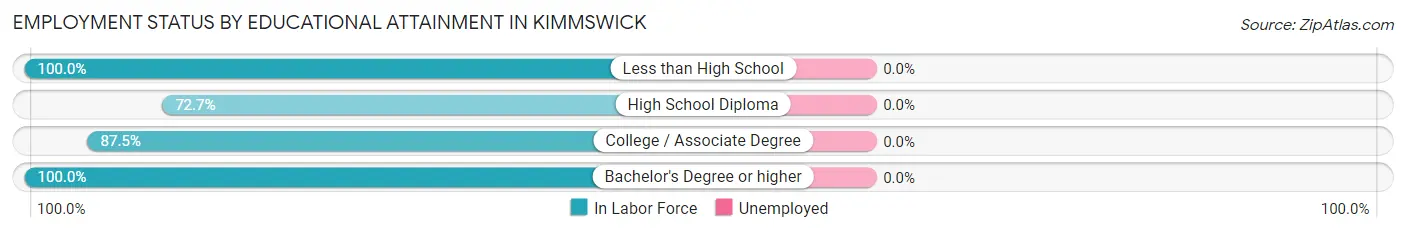
| Educational Attainment | In Labor Force | Unemployed |
| Less than High School | 3 (100.0%) | 0 (0.0%) |
| High School Diploma | 24 (72.7%) | 0 (0.0%) |
| College / Associate Degree | 14 (87.5%) | 0 (0.0%) |
| Bachelor's Degree or higher | 6 (100.0%) | 0 (0.0%) |
| Total | 47 (81.0%) | 0 (0.0%) |
Employment Occupations by Sex in Kimmswick
Management, Business, Science and Arts Occupations
The most common Management, Business, Science and Arts occupations in Kimmswick are Computers, Engineering & Science (4 | 7.5%), Computers & Mathematics (4 | 7.5%), Management (2 | 3.8%), Health Diagnosing & Treating (2 | 3.8%), and Health Technologists (2 | 3.8%).
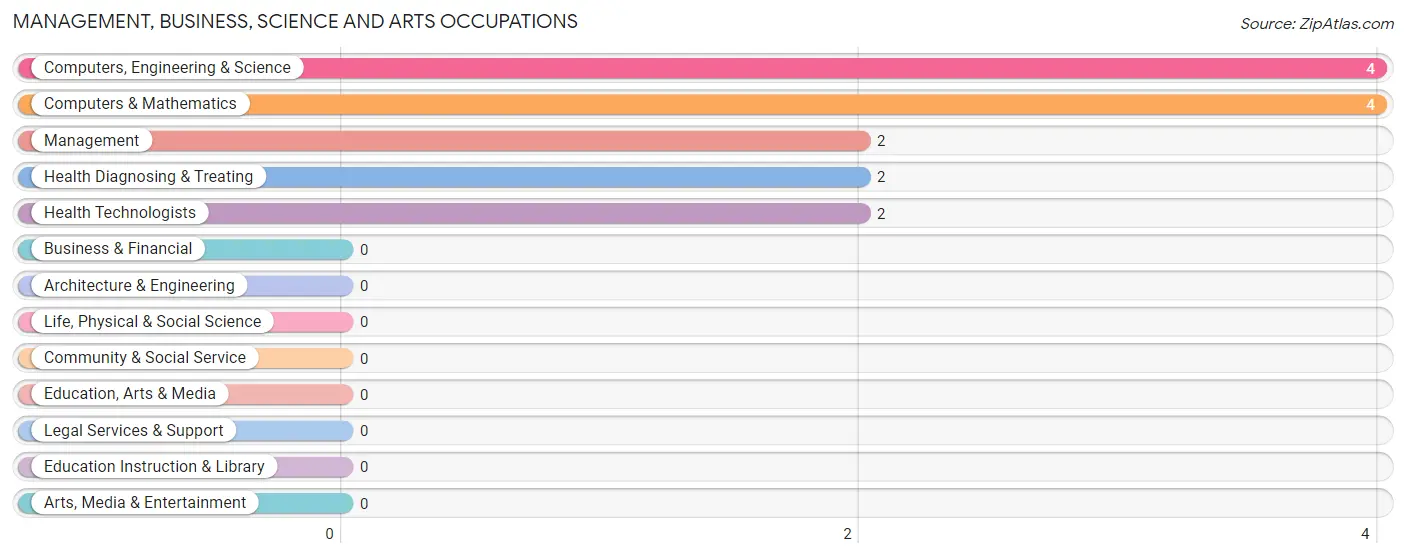
Management, Business, Science and Arts Occupations by Sex
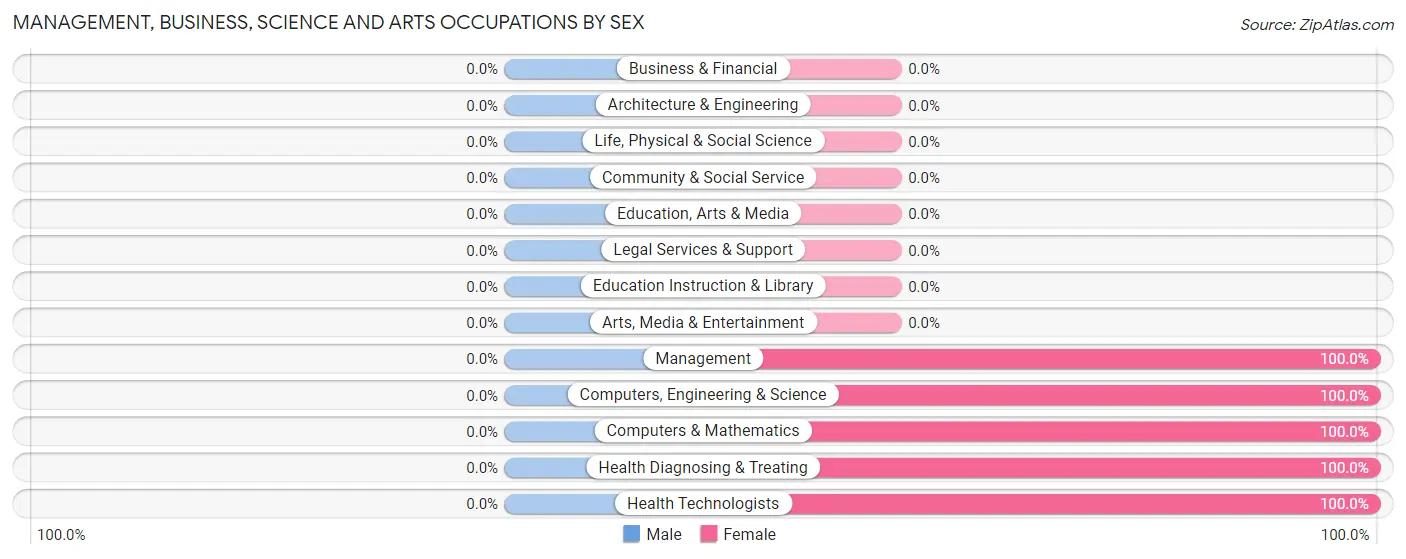
| Occupation | Male | Female |
| Management | 0 (0.0%) | 2 (100.0%) |
| Business & Financial | 0 (0.0%) | 0 (0.0%) |
| Computers, Engineering & Science | 0 (0.0%) | 4 (100.0%) |
| Computers & Mathematics | 0 (0.0%) | 4 (100.0%) |
| Architecture & Engineering | 0 (0.0%) | 0 (0.0%) |
| Life, Physical & Social Science | 0 (0.0%) | 0 (0.0%) |
| Community & Social Service | 0 (0.0%) | 0 (0.0%) |
| Education, Arts & Media | 0 (0.0%) | 0 (0.0%) |
| Legal Services & Support | 0 (0.0%) | 0 (0.0%) |
| Education Instruction & Library | 0 (0.0%) | 0 (0.0%) |
| Arts, Media & Entertainment | 0 (0.0%) | 0 (0.0%) |
| Health Diagnosing & Treating | 0 (0.0%) | 2 (100.0%) |
| Health Technologists | 0 (0.0%) | 2 (100.0%) |
| Total (Category) | 0 (0.0%) | 8 (100.0%) |
| Total (Overall) | 19 (35.8%) | 34 (64.1%) |
Services Occupations
The most common Services occupations in Kimmswick are , and Food Preparation & Serving (3 | 5.7%).
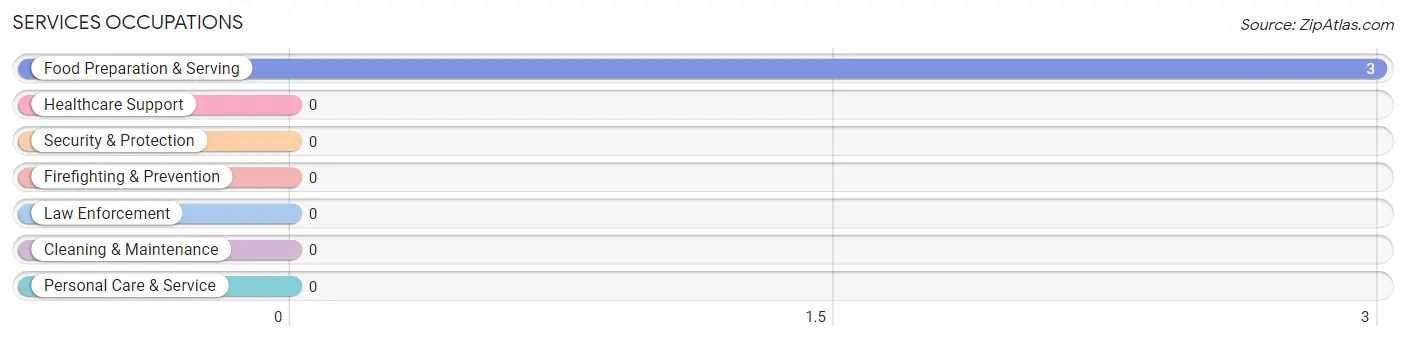
Services Occupations by Sex
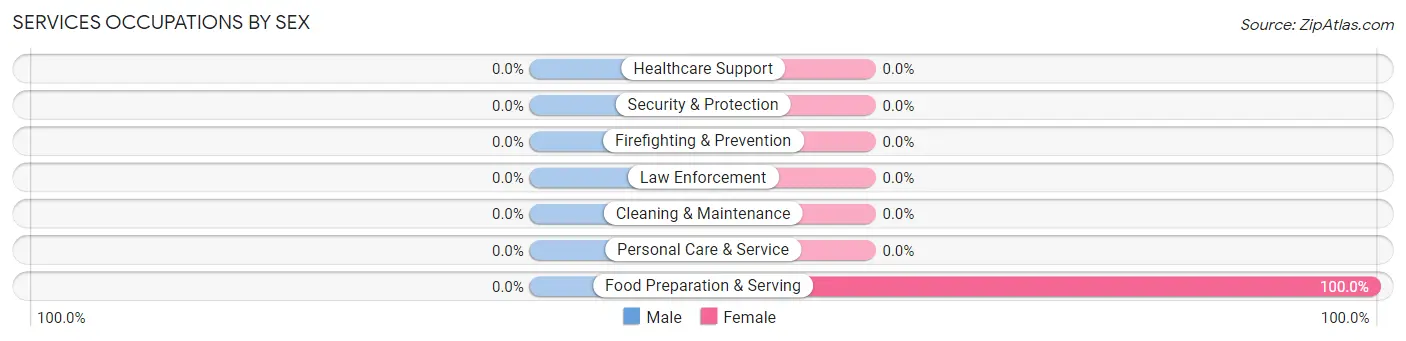
| Occupation | Male | Female |
| Healthcare Support | 0 (0.0%) | 0 (0.0%) |
| Security & Protection | 0 (0.0%) | 0 (0.0%) |
| Firefighting & Prevention | 0 (0.0%) | 0 (0.0%) |
| Law Enforcement | 0 (0.0%) | 0 (0.0%) |
| Food Preparation & Serving | 0 (0.0%) | 3 (100.0%) |
| Cleaning & Maintenance | 0 (0.0%) | 0 (0.0%) |
| Personal Care & Service | 0 (0.0%) | 0 (0.0%) |
| Total (Category) | 0 (0.0%) | 3 (100.0%) |
| Total (Overall) | 19 (35.8%) | 34 (64.1%) |
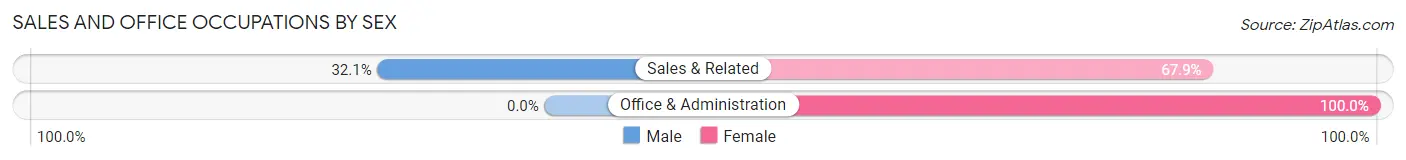
Sales and Office Occupations
The most common Sales and Office occupations in Kimmswick are Sales & Related (28 | 52.8%), and Office & Administration (4 | 7.5%).
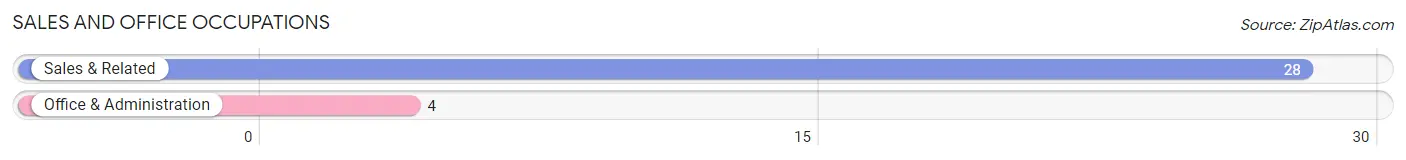
Sales and Office Occupations by Sex
| Occupation | Male | Female |
| Sales & Related | 9 (32.1%) | 19 (67.9%) |
| Office & Administration | 0 (0.0%) | 4 (100.0%) |
| Total (Category) | 9 (28.1%) | 23 (71.9%) |
| Total (Overall) | 19 (35.8%) | 34 (64.1%) |
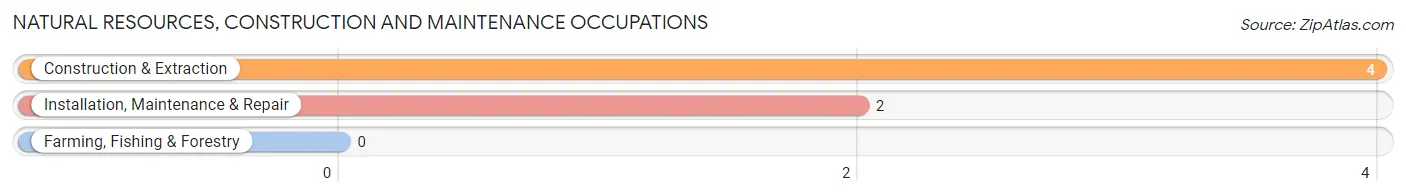
Natural Resources, Construction and Maintenance Occupations
The most common Natural Resources, Construction and Maintenance occupations in Kimmswick are Construction & Extraction (4 | 7.5%), and Installation, Maintenance & Repair (2 | 3.8%).
Natural Resources, Construction and Maintenance Occupations by Sex
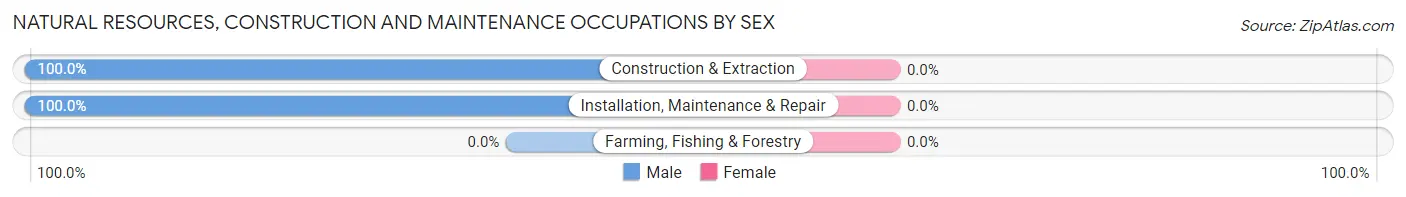
| Occupation | Male | Female |
| Farming, Fishing & Forestry | 0 (0.0%) | 0 (0.0%) |
| Construction & Extraction | 4 (100.0%) | 0 (0.0%) |
| Installation, Maintenance & Repair | 2 (100.0%) | 0 (0.0%) |
| Total (Category) | 6 (100.0%) | 0 (0.0%) |
| Total (Overall) | 19 (35.8%) | 34 (64.1%) |
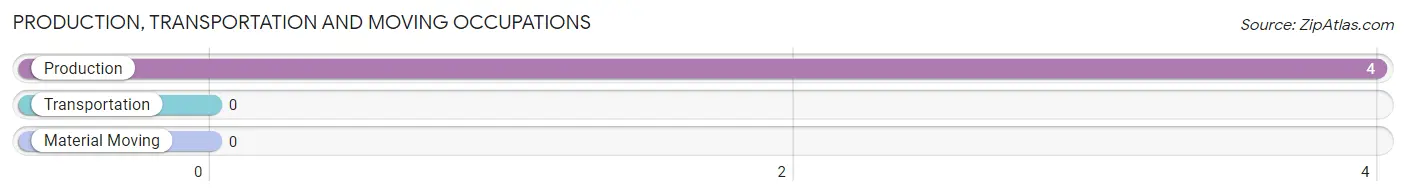
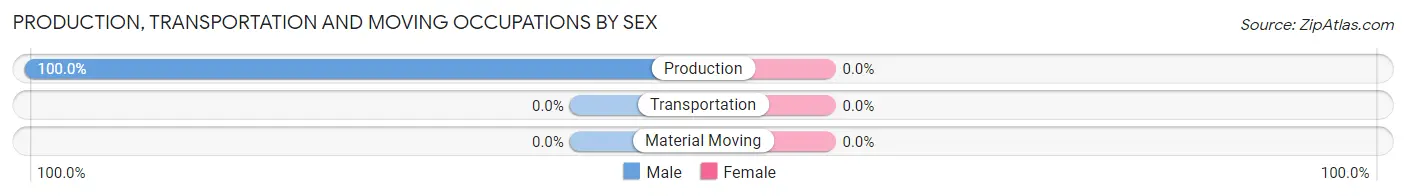
Production, Transportation and Moving Occupations
The most common Production, Transportation and Moving occupations in Kimmswick are , and Production (4 | 7.5%).
Production, Transportation and Moving Occupations by Sex
| Occupation | Male | Female |
| Production | 4 (100.0%) | 0 (0.0%) |
| Transportation | 0 (0.0%) | 0 (0.0%) |
| Material Moving | 0 (0.0%) | 0 (0.0%) |
| Total (Category) | 4 (100.0%) | 0 (0.0%) |
| Total (Overall) | 19 (35.8%) | 34 (64.1%) |
Employment Industries by Sex in Kimmswick
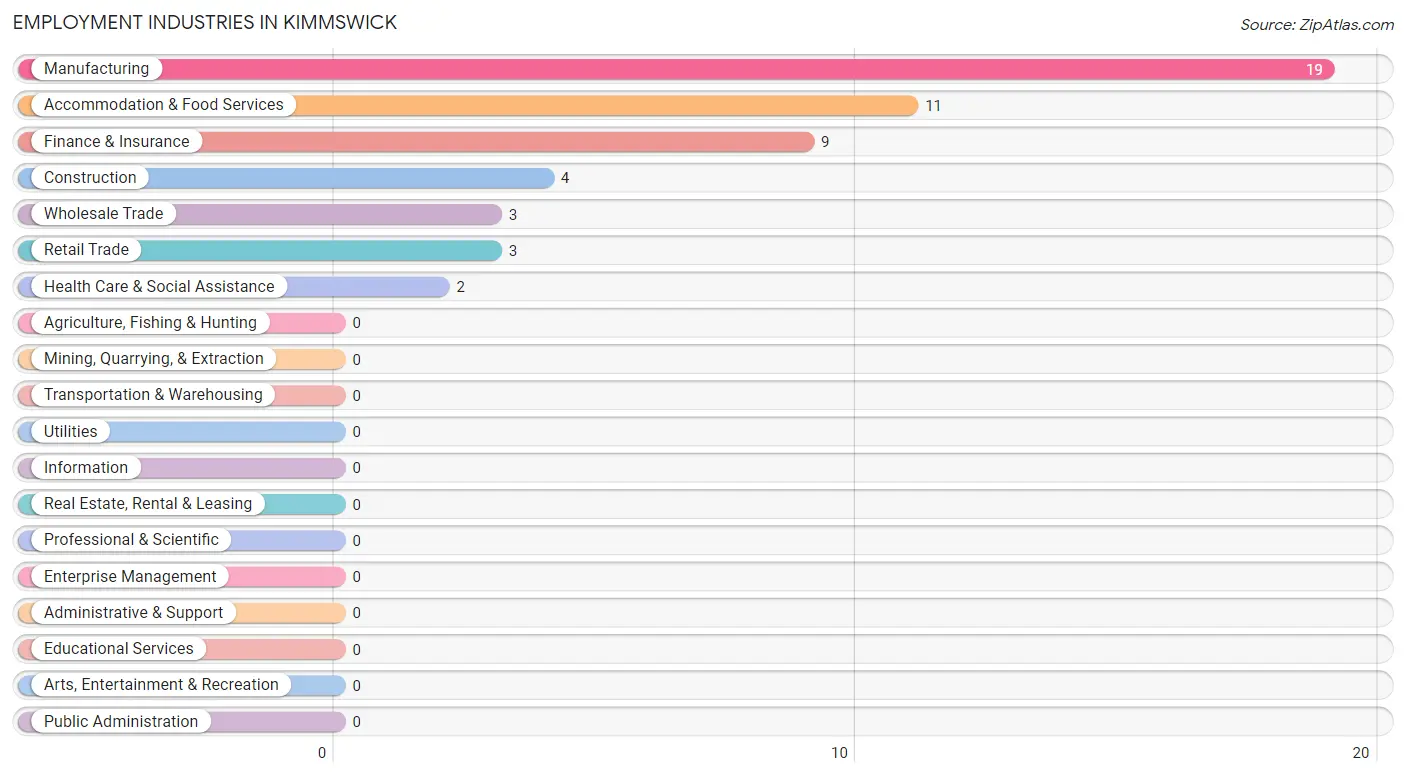
Employment Industries in Kimmswick
The major employment industries in Kimmswick include Manufacturing (19 | 35.8%), Accommodation & Food Services (11 | 20.7%), Finance & Insurance (9 | 17.0%), Construction (4 | 7.5%), and Wholesale Trade (3 | 5.7%).
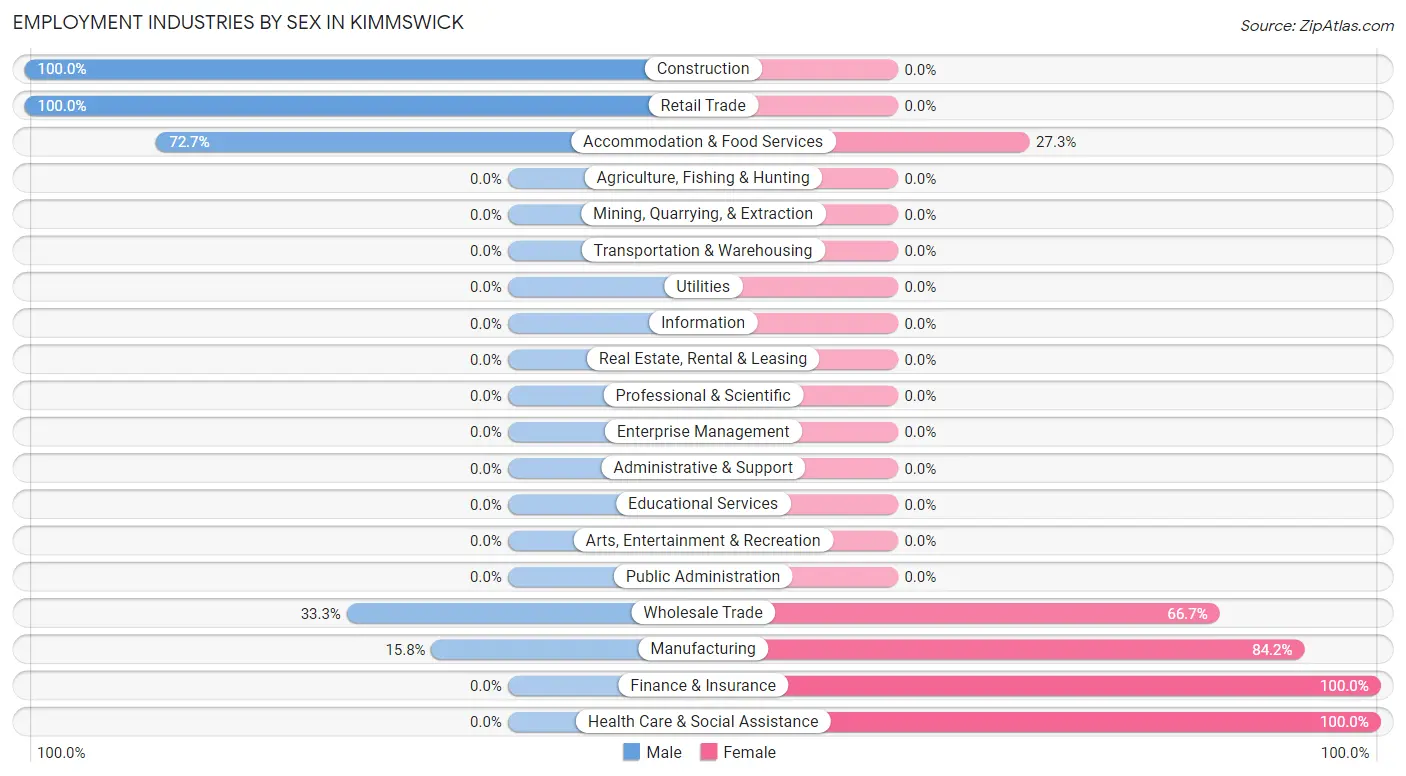
Employment Industries by Sex in Kimmswick
The Kimmswick industries that see more men than women are Construction (100.0%), Retail Trade (100.0%), and Accommodation & Food Services (72.7%), whereas the industries that tend to have a higher number of women are Finance & Insurance (100.0%), Health Care & Social Assistance (100.0%), and Manufacturing (84.2%).
| Industry | Male | Female |
| Agriculture, Fishing & Hunting | 0 (0.0%) | 0 (0.0%) |
| Mining, Quarrying, & Extraction | 0 (0.0%) | 0 (0.0%) |
| Construction | 4 (100.0%) | 0 (0.0%) |
| Manufacturing | 3 (15.8%) | 16 (84.2%) |
| Wholesale Trade | 1 (33.3%) | 2 (66.7%) |
| Retail Trade | 3 (100.0%) | 0 (0.0%) |
| Transportation & Warehousing | 0 (0.0%) | 0 (0.0%) |
| Utilities | 0 (0.0%) | 0 (0.0%) |
| Information | 0 (0.0%) | 0 (0.0%) |
| Finance & Insurance | 0 (0.0%) | 9 (100.0%) |
| Real Estate, Rental & Leasing | 0 (0.0%) | 0 (0.0%) |
| Professional & Scientific | 0 (0.0%) | 0 (0.0%) |
| Enterprise Management | 0 (0.0%) | 0 (0.0%) |
| Administrative & Support | 0 (0.0%) | 0 (0.0%) |
| Educational Services | 0 (0.0%) | 0 (0.0%) |
| Health Care & Social Assistance | 0 (0.0%) | 2 (100.0%) |
| Arts, Entertainment & Recreation | 0 (0.0%) | 0 (0.0%) |
| Accommodation & Food Services | 8 (72.7%) | 3 (27.3%) |
| Public Administration | 0 (0.0%) | 0 (0.0%) |
| Total | 19 (35.8%) | 34 (64.1%) |
Education in Kimmswick
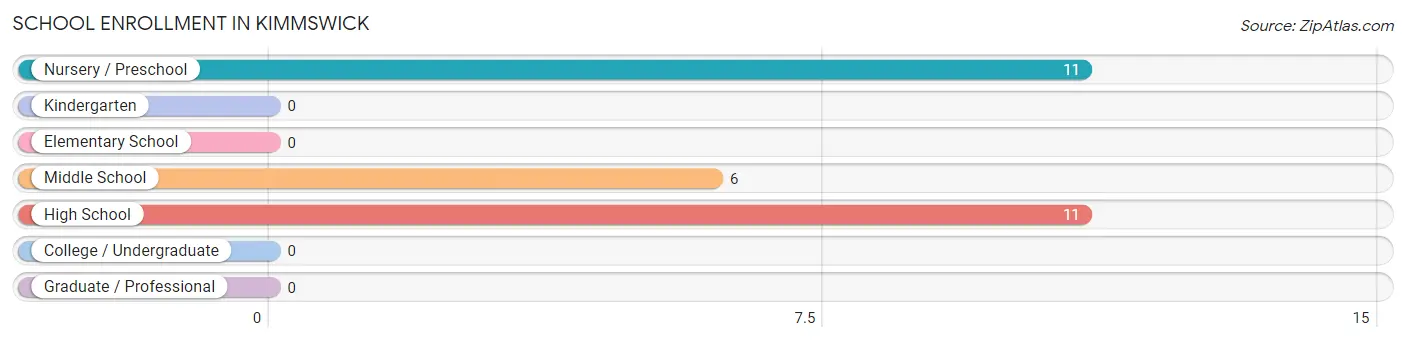
School Enrollment in Kimmswick
The most common levels of schooling among the 28 students in Kimmswick are nursery / preschool (11 | 39.3%), high school (11 | 39.3%), and middle school (6 | 21.4%).
| School Level | # Students | % Students |
| Nursery / Preschool | 11 | 39.3% |
| Kindergarten | 0 | 0.0% |
| Elementary School | 0 | 0.0% |
| Middle School | 6 | 21.4% |
| High School | 11 | 39.3% |
| College / Undergraduate | 0 | 0.0% |
| Graduate / Professional | 0 | 0.0% |
| Total | 28 | 100.0% |
School Enrollment by Age by Funding Source in Kimmswick
Out of a total of 28 students who are enrolled in schools in Kimmswick, 3 (10.7%) attend a private institution, while the remaining 25 (89.3%) are enrolled in public schools. The age group of 5 to 9 year old has the highest likelihood of being enrolled in private schools, with 3 (42.9% in the age bracket) enrolled. Conversely, the age group of 3 to 4 year olds has the lowest likelihood of being enrolled in a private school, with 4 (100.0% in the age bracket) attending a public institution.
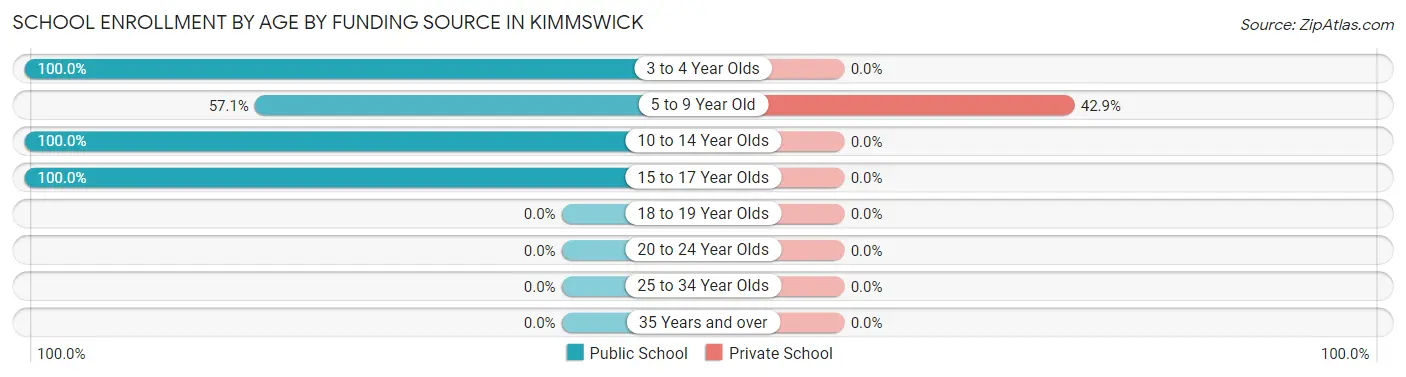
| Age Bracket | Public School | Private School |
| 3 to 4 Year Olds | 4 (100.0%) | 0 (0.0%) |
| 5 to 9 Year Old | 4 (57.1%) | 3 (42.9%) |
| 10 to 14 Year Olds | 6 (100.0%) | 0 (0.0%) |
| 15 to 17 Year Olds | 11 (100.0%) | 0 (0.0%) |
| 18 to 19 Year Olds | 0 (0.0%) | 0 (0.0%) |
| 20 to 24 Year Olds | 0 (0.0%) | 0 (0.0%) |
| 25 to 34 Year Olds | 0 (0.0%) | 0 (0.0%) |
| 35 Years and over | 0 (0.0%) | 0 (0.0%) |
| Total | 25 (89.3%) | 3 (10.7%) |
Educational Attainment by Field of Study in Kimmswick
Science & technology (6 | 60.0%), and education (4 | 40.0%) are the most common fields of study among 10 individuals in Kimmswick who have obtained a bachelor's degree or higher.
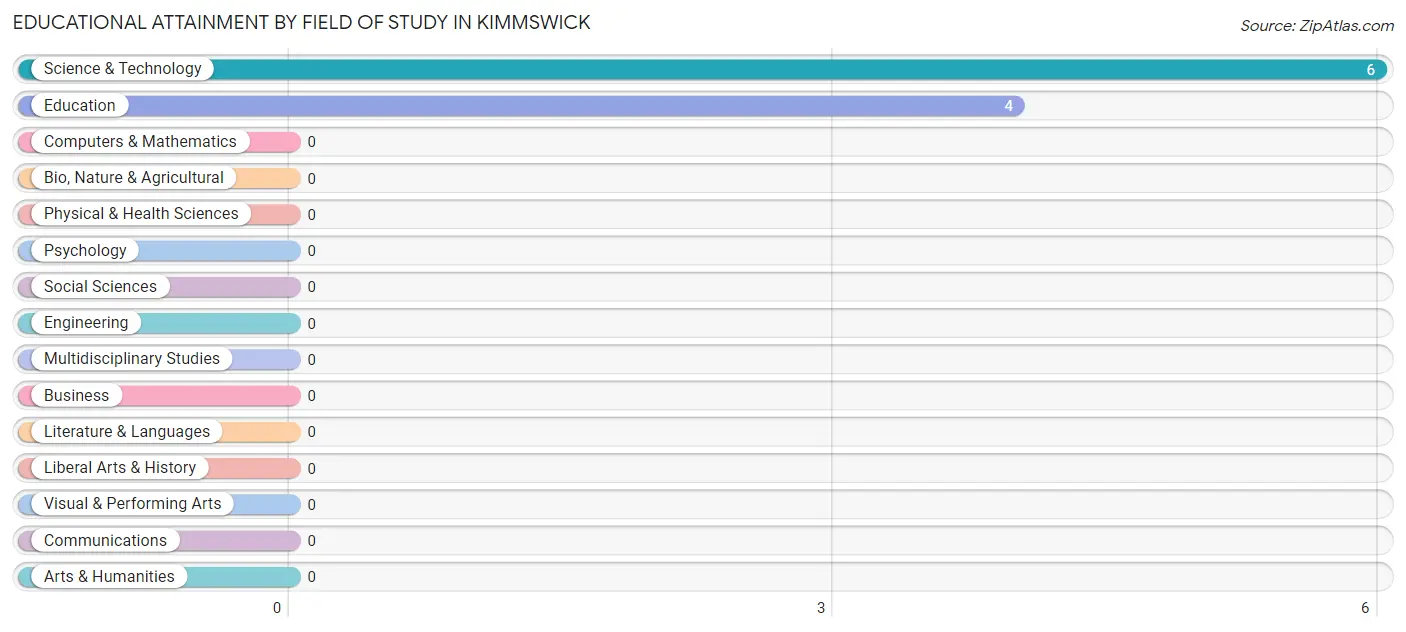
| Field of Study | # Graduates | % Graduates |
| Computers & Mathematics | 0 | 0.0% |
| Bio, Nature & Agricultural | 0 | 0.0% |
| Physical & Health Sciences | 0 | 0.0% |
| Psychology | 0 | 0.0% |
| Social Sciences | 0 | 0.0% |
| Engineering | 0 | 0.0% |
| Multidisciplinary Studies | 0 | 0.0% |
| Science & Technology | 6 | 60.0% |
| Business | 0 | 0.0% |
| Education | 4 | 40.0% |
| Literature & Languages | 0 | 0.0% |
| Liberal Arts & History | 0 | 0.0% |
| Visual & Performing Arts | 0 | 0.0% |
| Communications | 0 | 0.0% |
| Arts & Humanities | 0 | 0.0% |
| Total | 10 | 100.0% |
Transportation & Commute in Kimmswick
Vehicle Availability by Sex in Kimmswick
The most prevalent vehicle ownership categories in Kimmswick are males with 2 vehicles (8, accounting for 50.0%) and females with 2 vehicles (6, making up 23.5%).
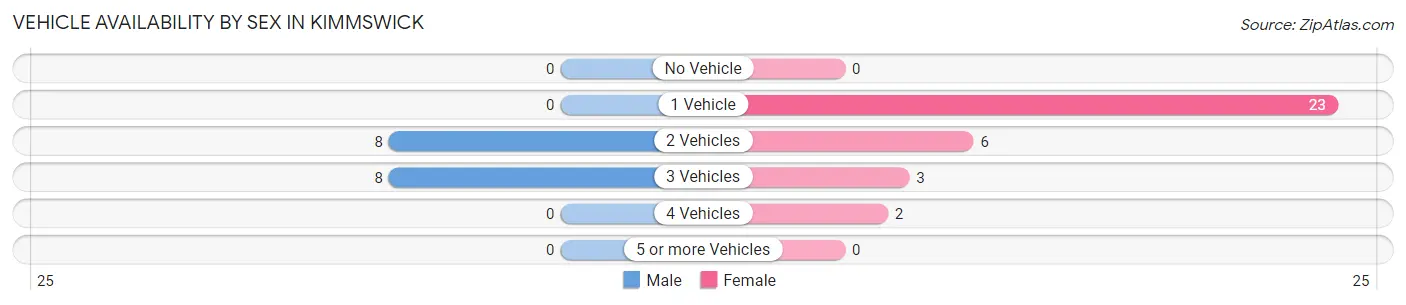
| Vehicles Available | Male | Female |
| No Vehicle | 0 (0.0%) | 0 (0.0%) |
| 1 Vehicle | 0 (0.0%) | 23 (67.6%) |
| 2 Vehicles | 8 (50.0%) | 6 (17.6%) |
| 3 Vehicles | 8 (50.0%) | 3 (8.8%) |
| 4 Vehicles | 0 (0.0%) | 2 (5.9%) |
| 5 or more Vehicles | 0 (0.0%) | 0 (0.0%) |
| Total | 16 (100.0%) | 34 (100.0%) |
Commute Time in Kimmswick
The most frequently occuring commute durations in Kimmswick are 10 to 14 minutes (12 commuters, 29.3%), 60 to 89 minutes (8 commuters, 19.5%), and 45 to 59 minutes (6 commuters, 14.6%).
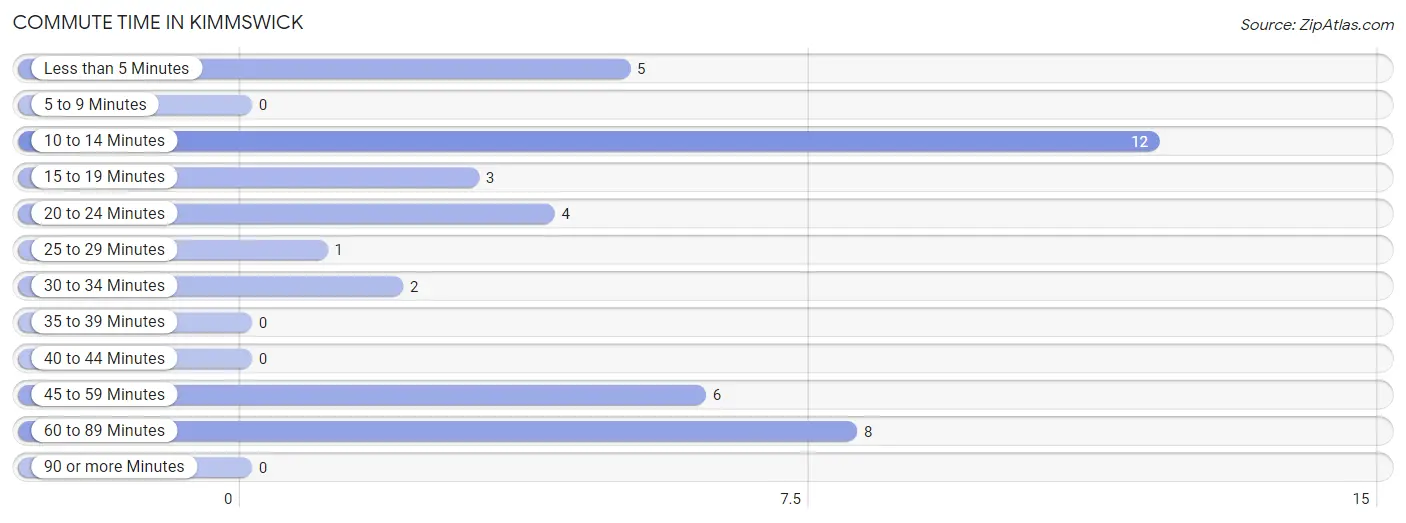
| Commute Time | # Commuters | % Commuters |
| Less than 5 Minutes | 5 | 12.2% |
| 5 to 9 Minutes | 0 | 0.0% |
| 10 to 14 Minutes | 12 | 29.3% |
| 15 to 19 Minutes | 3 | 7.3% |
| 20 to 24 Minutes | 4 | 9.8% |
| 25 to 29 Minutes | 1 | 2.4% |
| 30 to 34 Minutes | 2 | 4.9% |
| 35 to 39 Minutes | 0 | 0.0% |
| 40 to 44 Minutes | 0 | 0.0% |
| 45 to 59 Minutes | 6 | 14.6% |
| 60 to 89 Minutes | 8 | 19.5% |
| 90 or more Minutes | 0 | 0.0% |
Commute Time by Sex in Kimmswick
The most common commute times in Kimmswick are 60 to 89 minutes (8 commuters, 50.0%) for males and 10 to 14 minutes (12 commuters, 48.0%) for females.
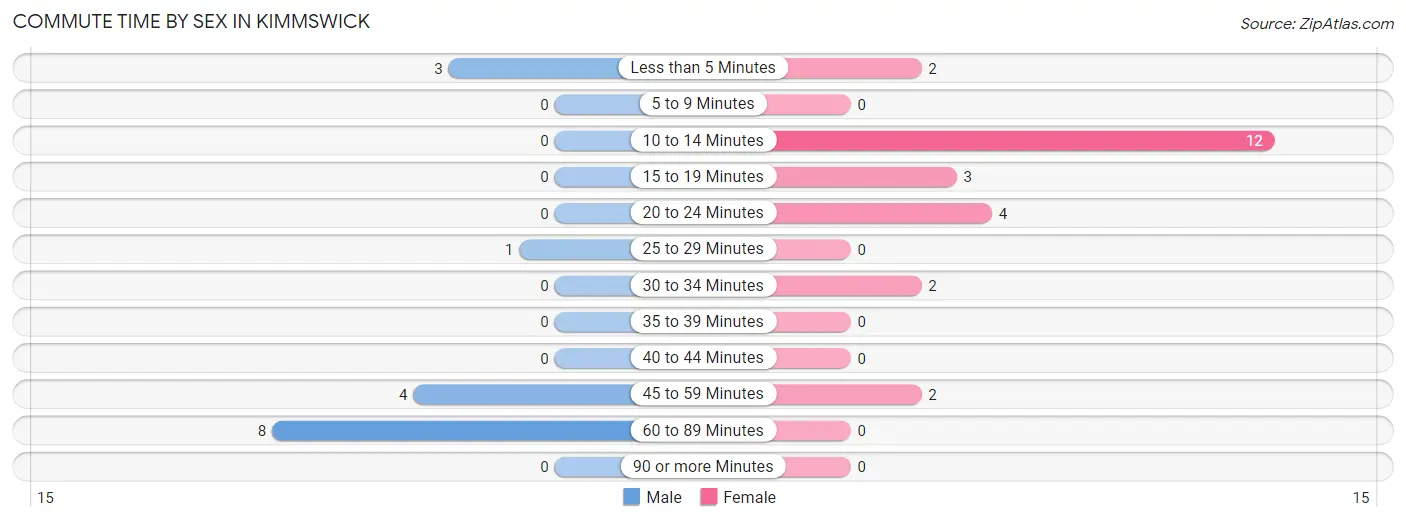
| Commute Time | Male | Female |
| Less than 5 Minutes | 3 (18.8%) | 2 (8.0%) |
| 5 to 9 Minutes | 0 (0.0%) | 0 (0.0%) |
| 10 to 14 Minutes | 0 (0.0%) | 12 (48.0%) |
| 15 to 19 Minutes | 0 (0.0%) | 3 (12.0%) |
| 20 to 24 Minutes | 0 (0.0%) | 4 (16.0%) |
| 25 to 29 Minutes | 1 (6.2%) | 0 (0.0%) |
| 30 to 34 Minutes | 0 (0.0%) | 2 (8.0%) |
| 35 to 39 Minutes | 0 (0.0%) | 0 (0.0%) |
| 40 to 44 Minutes | 0 (0.0%) | 0 (0.0%) |
| 45 to 59 Minutes | 4 (25.0%) | 2 (8.0%) |
| 60 to 89 Minutes | 8 (50.0%) | 0 (0.0%) |
| 90 or more Minutes | 0 (0.0%) | 0 (0.0%) |
Time of Departure to Work by Sex in Kimmswick
The most frequent times of departure to work in Kimmswick are 9:00 AM to 9:59 AM (9, 56.2%) for males and 12:00 AM to 4:59 AM (12, 48.0%) for females.
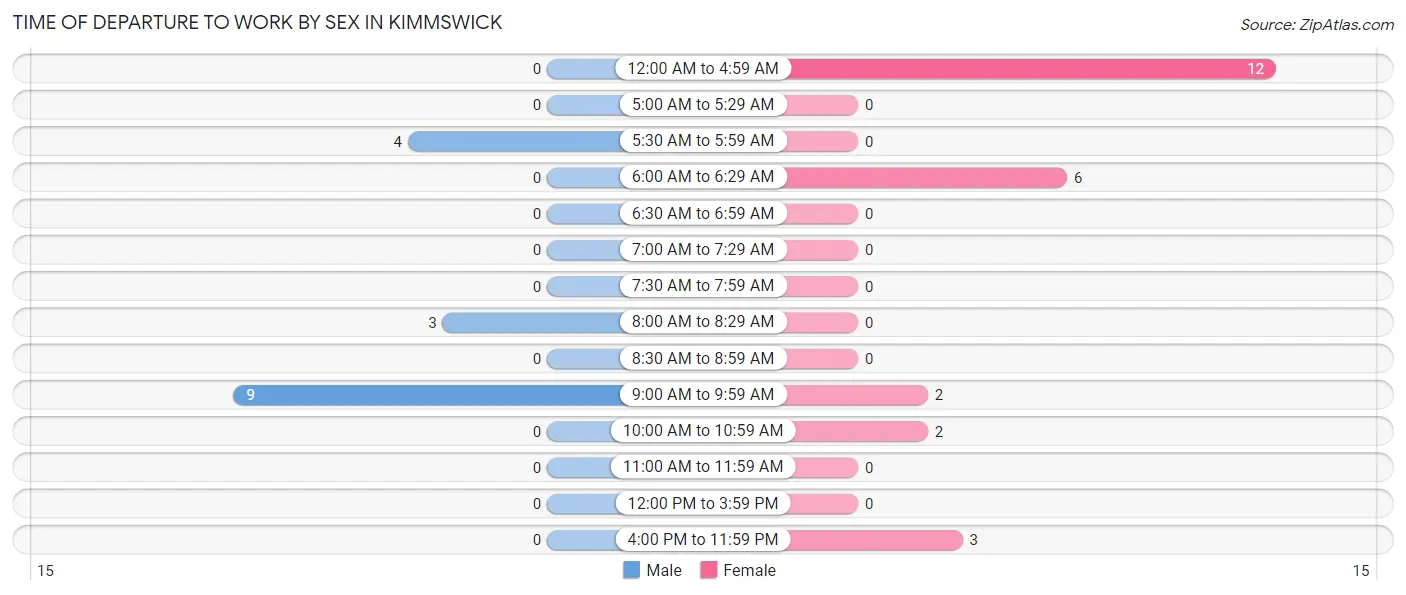
| Time of Departure | Male | Female |
| 12:00 AM to 4:59 AM | 0 (0.0%) | 12 (48.0%) |
| 5:00 AM to 5:29 AM | 0 (0.0%) | 0 (0.0%) |
| 5:30 AM to 5:59 AM | 4 (25.0%) | 0 (0.0%) |
| 6:00 AM to 6:29 AM | 0 (0.0%) | 6 (24.0%) |
| 6:30 AM to 6:59 AM | 0 (0.0%) | 0 (0.0%) |
| 7:00 AM to 7:29 AM | 0 (0.0%) | 0 (0.0%) |
| 7:30 AM to 7:59 AM | 0 (0.0%) | 0 (0.0%) |
| 8:00 AM to 8:29 AM | 3 (18.8%) | 0 (0.0%) |
| 8:30 AM to 8:59 AM | 0 (0.0%) | 0 (0.0%) |
| 9:00 AM to 9:59 AM | 9 (56.2%) | 2 (8.0%) |
| 10:00 AM to 10:59 AM | 0 (0.0%) | 2 (8.0%) |
| 11:00 AM to 11:59 AM | 0 (0.0%) | 0 (0.0%) |
| 12:00 PM to 3:59 PM | 0 (0.0%) | 0 (0.0%) |
| 4:00 PM to 11:59 PM | 0 (0.0%) | 3 (12.0%) |
| Total | 16 (100.0%) | 25 (100.0%) |
Housing Occupancy in Kimmswick
Occupancy by Ownership in Kimmswick
Of the total 58 dwellings in Kimmswick, owner-occupied units account for 51 (87.9%), while renter-occupied units make up 7 (12.1%).
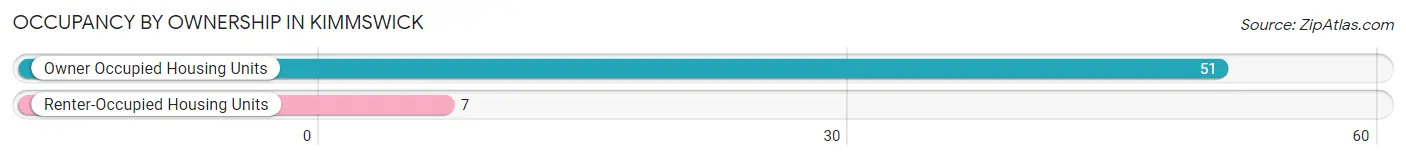
| Occupancy | # Housing Units | % Housing Units |
| Owner Occupied Housing Units | 51 | 87.9% |
| Renter-Occupied Housing Units | 7 | 12.1% |
| Total Occupied Housing Units | 58 | 100.0% |
Occupancy by Household Size in Kimmswick
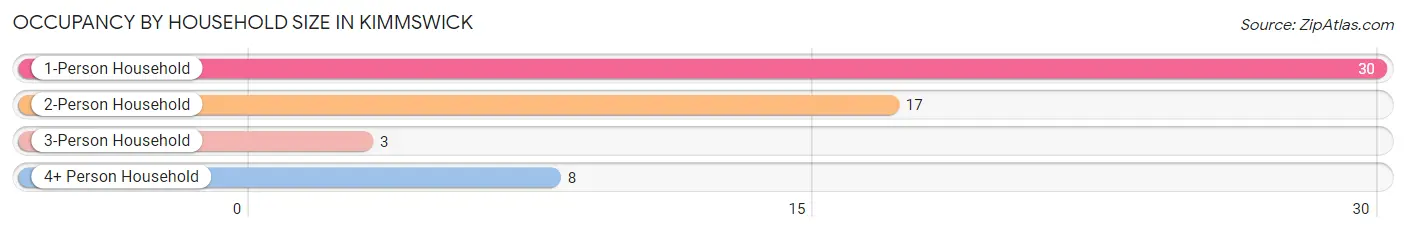
| Household Size | # Housing Units | % Housing Units |
| 1-Person Household | 30 | 51.7% |
| 2-Person Household | 17 | 29.3% |
| 3-Person Household | 3 | 5.2% |
| 4+ Person Household | 8 | 13.8% |
| Total Housing Units | 58 | 100.0% |
Occupancy by Ownership by Household Size in Kimmswick
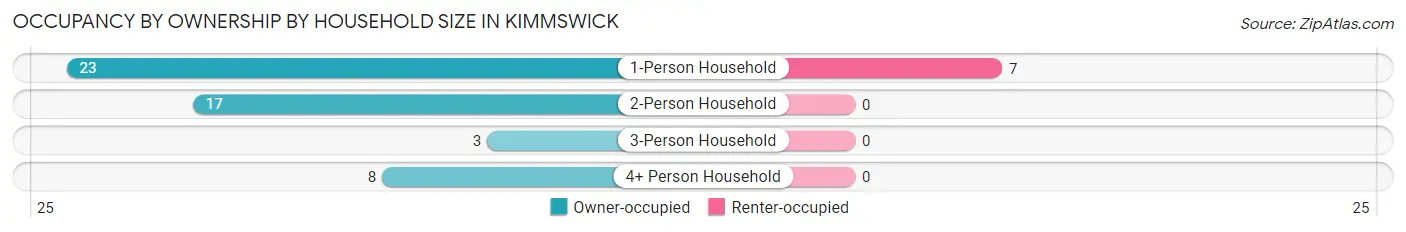
| Household Size | Owner-occupied | Renter-occupied |
| 1-Person Household | 23 (76.7%) | 7 (23.3%) |
| 2-Person Household | 17 (100.0%) | 0 (0.0%) |
| 3-Person Household | 3 (100.0%) | 0 (0.0%) |
| 4+ Person Household | 8 (100.0%) | 0 (0.0%) |
| Total Housing Units | 51 (87.9%) | 7 (12.1%) |
Occupancy by Educational Attainment in Kimmswick
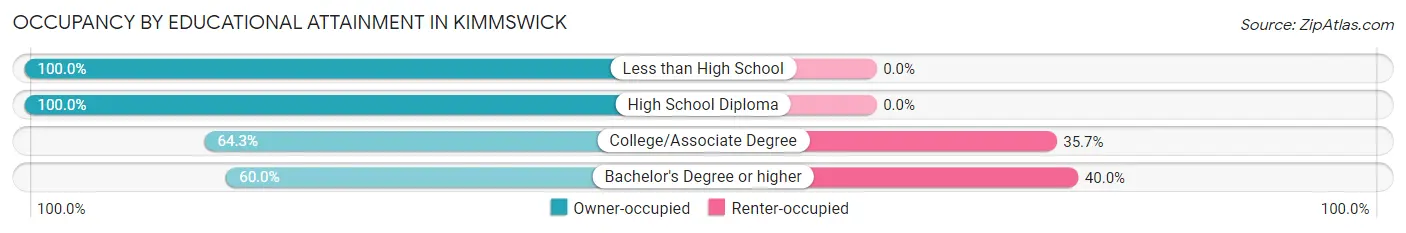
| Household Size | Owner-occupied | Renter-occupied |
| Less than High School | 2 (100.0%) | 0 (0.0%) |
| High School Diploma | 37 (100.0%) | 0 (0.0%) |
| College/Associate Degree | 9 (64.3%) | 5 (35.7%) |
| Bachelor's Degree or higher | 3 (60.0%) | 2 (40.0%) |
Occupancy by Age of Householder in Kimmswick
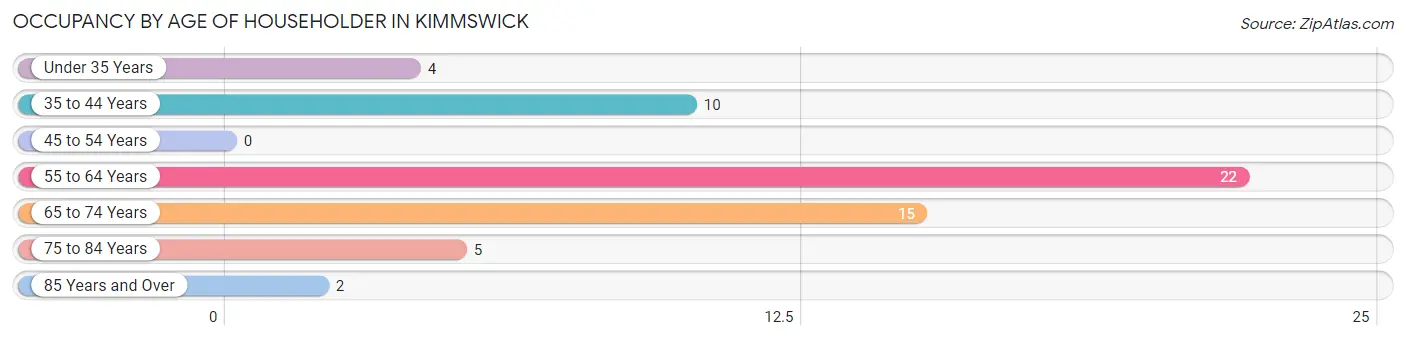
| Age Bracket | # Households | % Households |
| Under 35 Years | 4 | 6.9% |
| 35 to 44 Years | 10 | 17.2% |
| 45 to 54 Years | 0 | 0.0% |
| 55 to 64 Years | 22 | 37.9% |
| 65 to 74 Years | 15 | 25.9% |
| 75 to 84 Years | 5 | 8.6% |
| 85 Years and Over | 2 | 3.5% |
| Total | 58 | 100.0% |
Housing Finances in Kimmswick
Median Income by Occupancy in Kimmswick
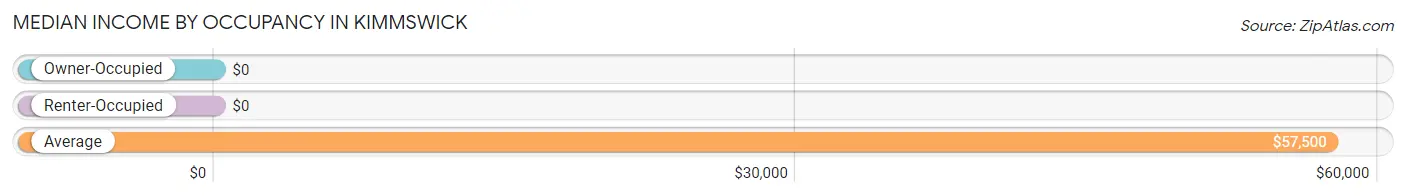
| Occupancy Type | # Households | Median Income |
| Owner-Occupied | 51 (87.9%) | $0 |
| Renter-Occupied | 7 (12.1%) | $0 |
| Average | 58 (100.0%) | $57,500 |
Occupancy by Householder Income Bracket in Kimmswick
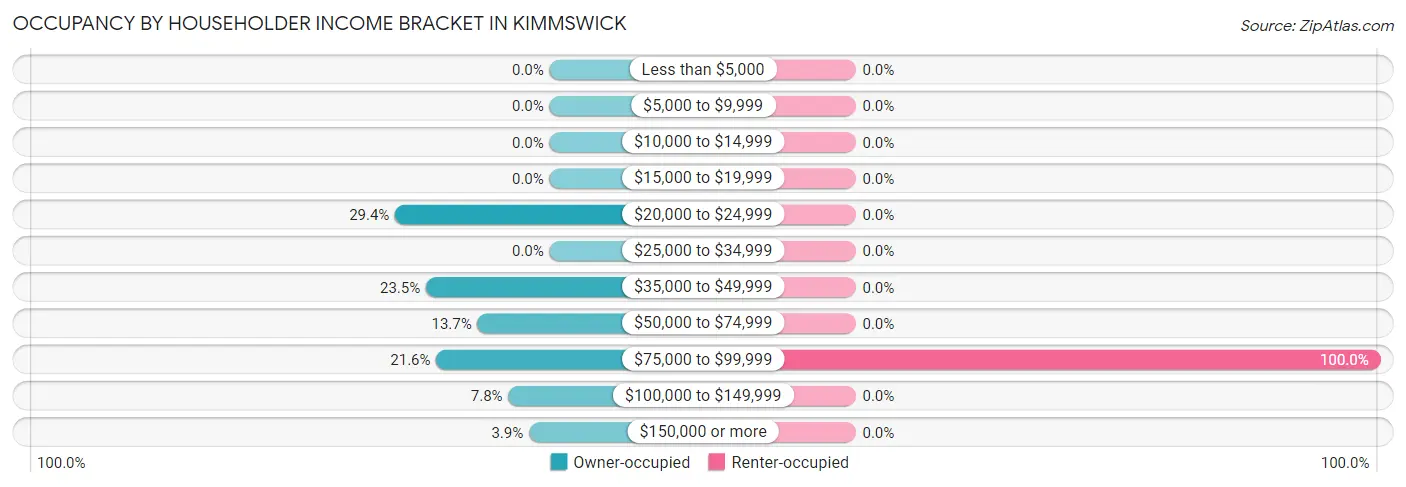
| Income Bracket | Owner-occupied | Renter-occupied |
| Less than $5,000 | 0 (0.0%) | 0 (0.0%) |
| $5,000 to $9,999 | 0 (0.0%) | 0 (0.0%) |
| $10,000 to $14,999 | 0 (0.0%) | 0 (0.0%) |
| $15,000 to $19,999 | 0 (0.0%) | 0 (0.0%) |
| $20,000 to $24,999 | 15 (29.4%) | 0 (0.0%) |
| $25,000 to $34,999 | 0 (0.0%) | 0 (0.0%) |
| $35,000 to $49,999 | 12 (23.5%) | 0 (0.0%) |
| $50,000 to $74,999 | 7 (13.7%) | 0 (0.0%) |
| $75,000 to $99,999 | 11 (21.6%) | 7 (100.0%) |
| $100,000 to $149,999 | 4 (7.8%) | 0 (0.0%) |
| $150,000 or more | 2 (3.9%) | 0 (0.0%) |
| Total | 51 (100.0%) | 7 (100.0%) |
Monthly Housing Cost Tiers in Kimmswick
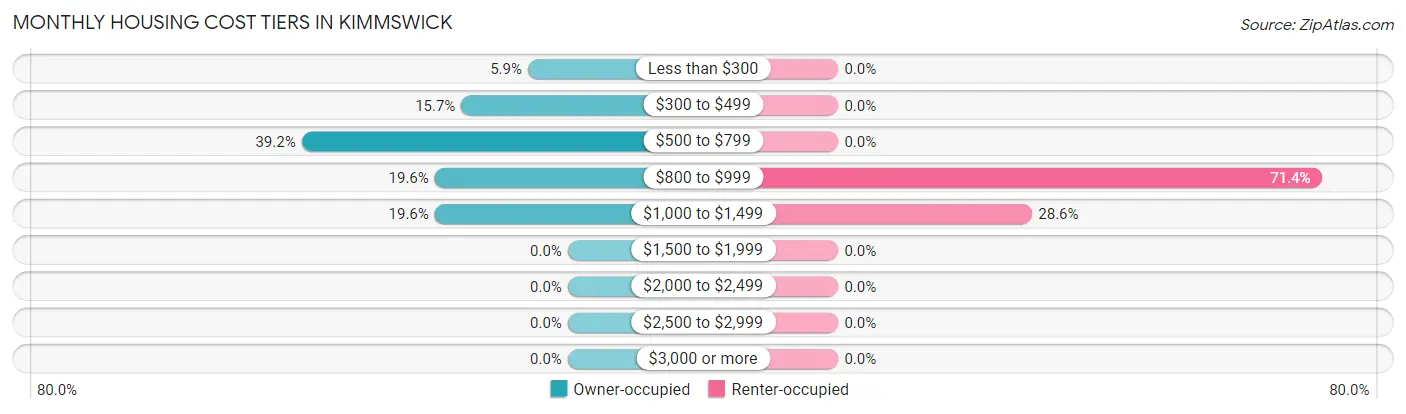
| Monthly Cost | Owner-occupied | Renter-occupied |
| Less than $300 | 3 (5.9%) | 0 (0.0%) |
| $300 to $499 | 8 (15.7%) | 0 (0.0%) |
| $500 to $799 | 20 (39.2%) | 0 (0.0%) |
| $800 to $999 | 10 (19.6%) | 5 (71.4%) |
| $1,000 to $1,499 | 10 (19.6%) | 2 (28.6%) |
| $1,500 to $1,999 | 0 (0.0%) | 0 (0.0%) |
| $2,000 to $2,499 | 0 (0.0%) | 0 (0.0%) |
| $2,500 to $2,999 | 0 (0.0%) | 0 (0.0%) |
| $3,000 or more | 0 (0.0%) | 0 (0.0%) |
| Total | 51 (100.0%) | 7 (100.0%) |
Physical Housing Characteristics in Kimmswick
Housing Structures in Kimmswick
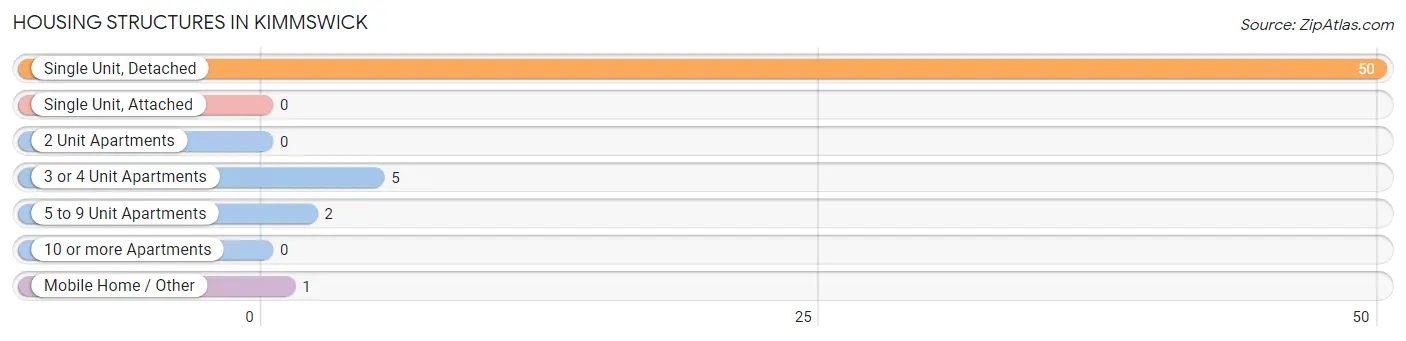
| Structure Type | # Housing Units | % Housing Units |
| Single Unit, Detached | 50 | 86.2% |
| Single Unit, Attached | 0 | 0.0% |
| 2 Unit Apartments | 0 | 0.0% |
| 3 or 4 Unit Apartments | 5 | 8.6% |
| 5 to 9 Unit Apartments | 2 | 3.5% |
| 10 or more Apartments | 0 | 0.0% |
| Mobile Home / Other | 1 | 1.7% |
| Total | 58 | 100.0% |
Housing Structures by Occupancy in Kimmswick
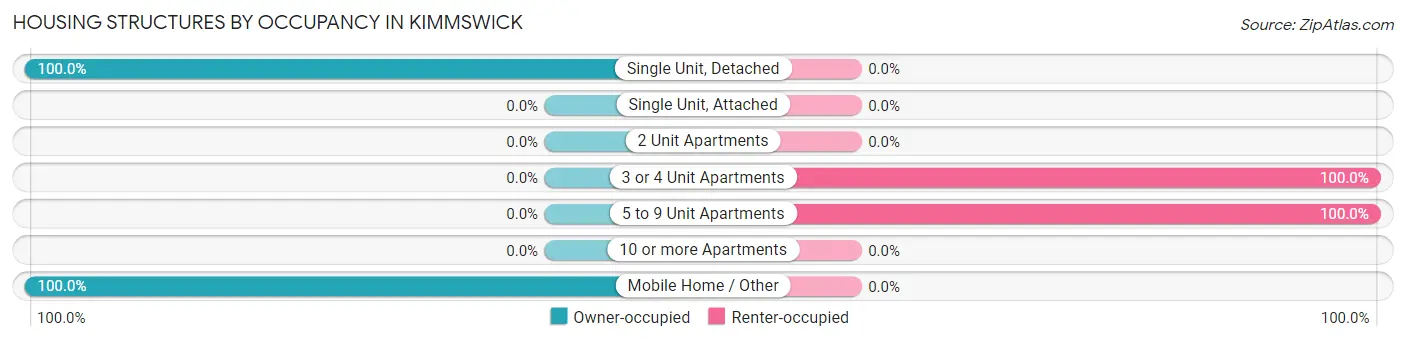
| Structure Type | Owner-occupied | Renter-occupied |
| Single Unit, Detached | 50 (100.0%) | 0 (0.0%) |
| Single Unit, Attached | 0 (0.0%) | 0 (0.0%) |
| 2 Unit Apartments | 0 (0.0%) | 0 (0.0%) |
| 3 or 4 Unit Apartments | 0 (0.0%) | 5 (100.0%) |
| 5 to 9 Unit Apartments | 0 (0.0%) | 2 (100.0%) |
| 10 or more Apartments | 0 (0.0%) | 0 (0.0%) |
| Mobile Home / Other | 1 (100.0%) | 0 (0.0%) |
| Total | 51 (87.9%) | 7 (12.1%) |
Housing Structures by Number of Rooms in Kimmswick
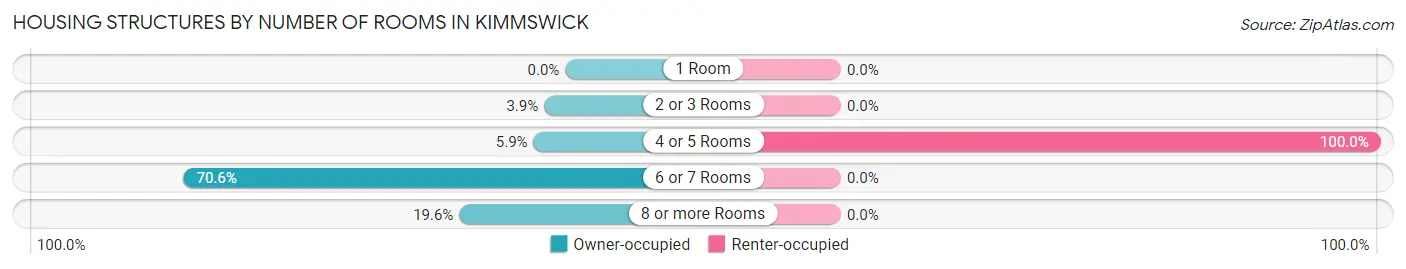
| Number of Rooms | Owner-occupied | Renter-occupied |
| 1 Room | 0 (0.0%) | 0 (0.0%) |
| 2 or 3 Rooms | 2 (3.9%) | 0 (0.0%) |
| 4 or 5 Rooms | 3 (5.9%) | 7 (100.0%) |
| 6 or 7 Rooms | 36 (70.6%) | 0 (0.0%) |
| 8 or more Rooms | 10 (19.6%) | 0 (0.0%) |
| Total | 51 (100.0%) | 7 (100.0%) |
Housing Structure by Heating Type in Kimmswick
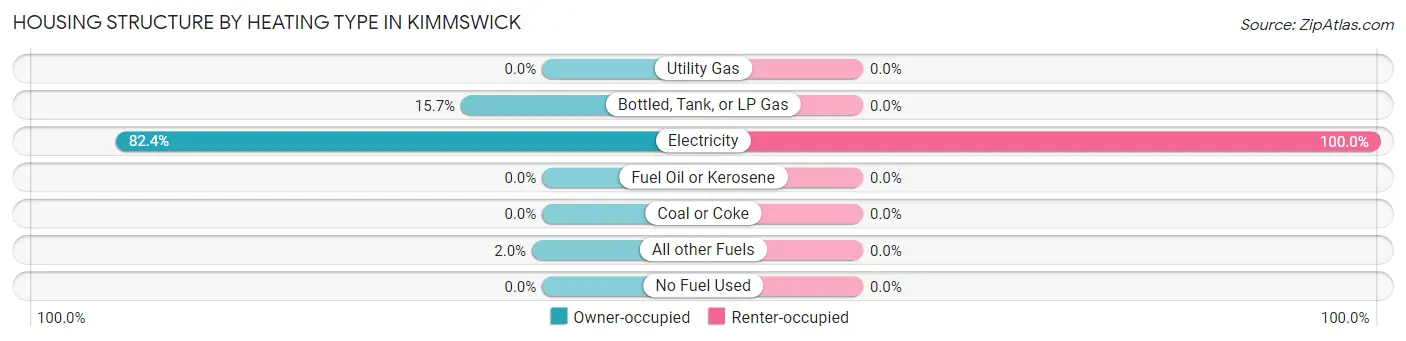
| Heating Type | Owner-occupied | Renter-occupied |
| Utility Gas | 0 (0.0%) | 0 (0.0%) |
| Bottled, Tank, or LP Gas | 8 (15.7%) | 0 (0.0%) |
| Electricity | 42 (82.4%) | 7 (100.0%) |
| Fuel Oil or Kerosene | 0 (0.0%) | 0 (0.0%) |
| Coal or Coke | 0 (0.0%) | 0 (0.0%) |
| All other Fuels | 1 (2.0%) | 0 (0.0%) |
| No Fuel Used | 0 (0.0%) | 0 (0.0%) |
| Total | 51 (100.0%) | 7 (100.0%) |
Household Vehicle Usage in Kimmswick
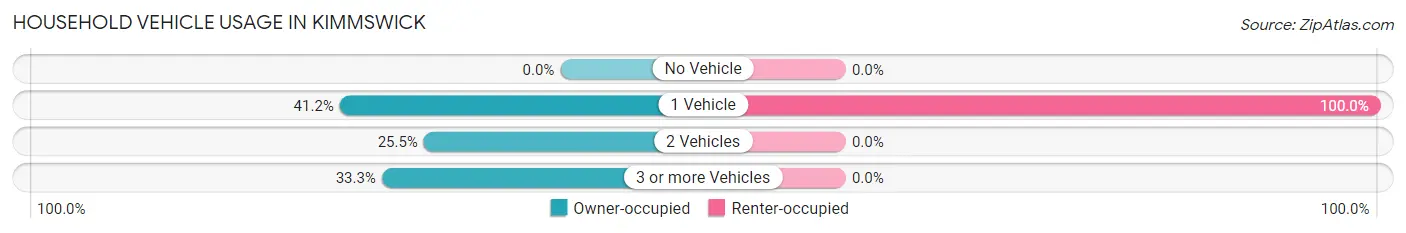
| Vehicles per Household | Owner-occupied | Renter-occupied |
| No Vehicle | 0 (0.0%) | 0 (0.0%) |
| 1 Vehicle | 21 (41.2%) | 7 (100.0%) |
| 2 Vehicles | 13 (25.5%) | 0 (0.0%) |
| 3 or more Vehicles | 17 (33.3%) | 0 (0.0%) |
| Total | 51 (100.0%) | 7 (100.0%) |
Real Estate & Mortgages in Kimmswick
Real Estate and Mortgage Overview in Kimmswick
| Characteristic | Without Mortgage | With Mortgage |
| Housing Units | 31 | 20 |
| Median Property Value | $217,200 | $125,000 |
| Median Household Income | - | - |
| Monthly Housing Costs | $663 | $0 |
| Real Estate Taxes | $1,327 | $0 |
Property Value by Mortgage Status in Kimmswick
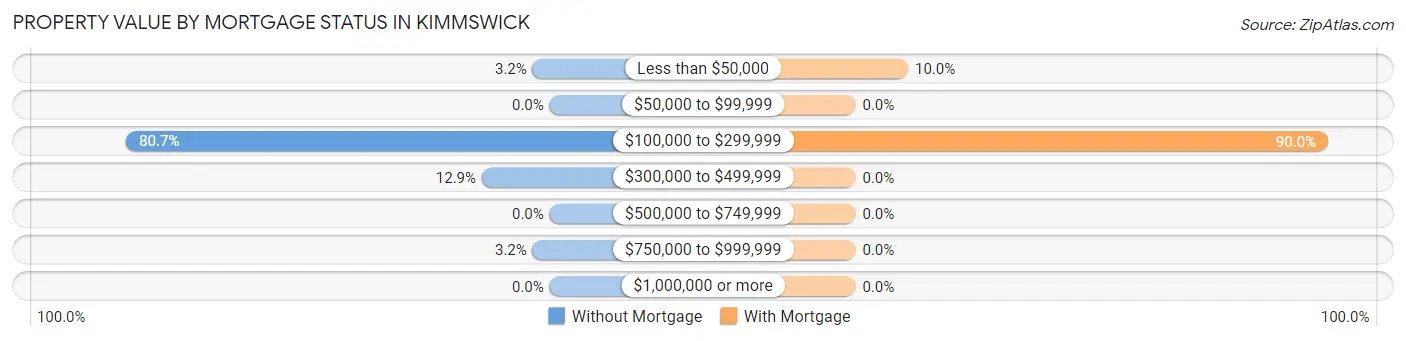
| Property Value | Without Mortgage | With Mortgage |
| Less than $50,000 | 1 (3.2%) | 2 (10.0%) |
| $50,000 to $99,999 | 0 (0.0%) | 0 (0.0%) |
| $100,000 to $299,999 | 25 (80.6%) | 18 (90.0%) |
| $300,000 to $499,999 | 4 (12.9%) | 0 (0.0%) |
| $500,000 to $749,999 | 0 (0.0%) | 0 (0.0%) |
| $750,000 to $999,999 | 1 (3.2%) | 0 (0.0%) |
| $1,000,000 or more | 0 (0.0%) | 0 (0.0%) |
| Total | 31 (100.0%) | 20 (100.0%) |
Household Income by Mortgage Status in Kimmswick
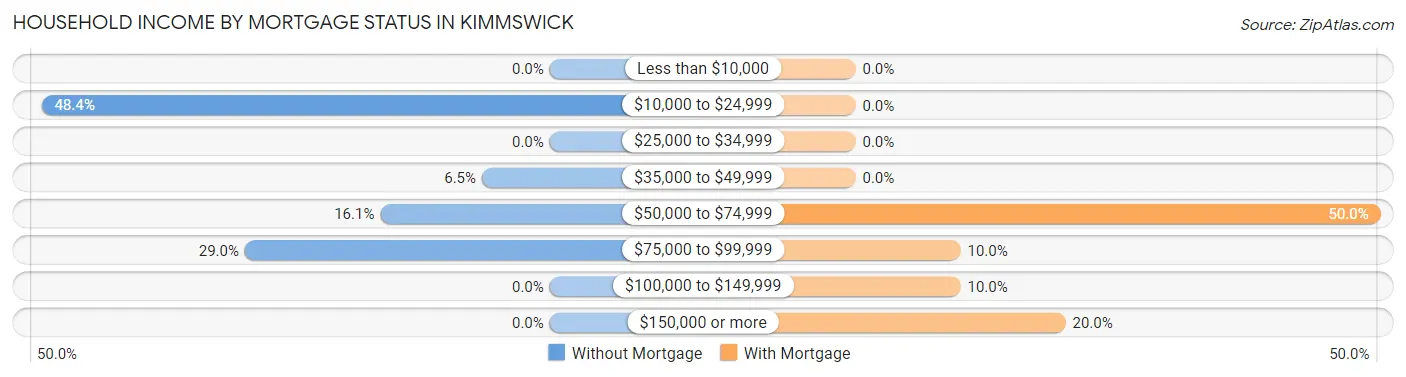
| Household Income | Without Mortgage | With Mortgage |
| Less than $10,000 | 0 (0.0%) | 0 (0.0%) |
| $10,000 to $24,999 | 15 (48.4%) | 0 (0.0%) |
| $25,000 to $34,999 | 0 (0.0%) | 0 (0.0%) |
| $35,000 to $49,999 | 2 (6.5%) | 0 (0.0%) |
| $50,000 to $74,999 | 5 (16.1%) | 10 (50.0%) |
| $75,000 to $99,999 | 9 (29.0%) | 2 (10.0%) |
| $100,000 to $149,999 | 0 (0.0%) | 2 (10.0%) |
| $150,000 or more | 0 (0.0%) | 4 (20.0%) |
| Total | 31 (100.0%) | 20 (100.0%) |
Property Value to Household Income Ratio in Kimmswick
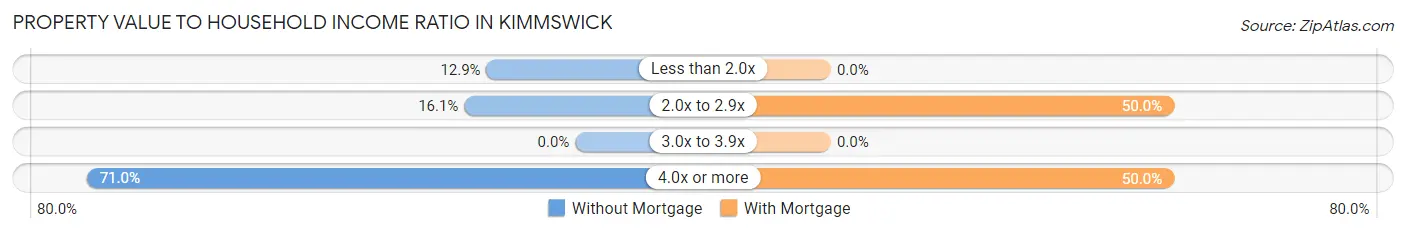
| Value-to-Income Ratio | Without Mortgage | With Mortgage |
| Less than 2.0x | 4 (12.9%) | 0 (0.0%) |
| 2.0x to 2.9x | 5 (16.1%) | 10 (50.0%) |
| 3.0x to 3.9x | 0 (0.0%) | 0 (0.0%) |
| 4.0x or more | 22 (71.0%) | 10 (50.0%) |
| Total | 31 (100.0%) | 20 (100.0%) |
Real Estate Taxes by Mortgage Status in Kimmswick
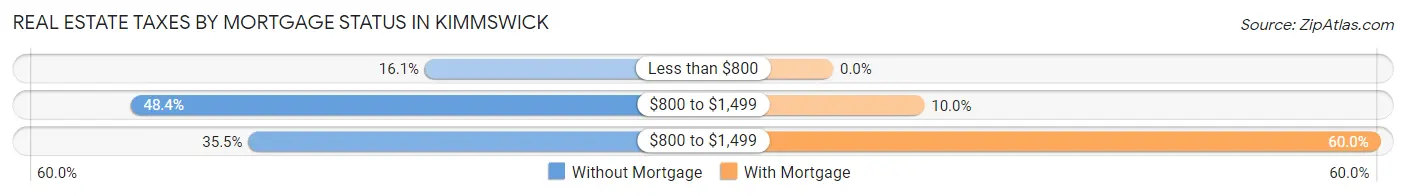
| Property Taxes | Without Mortgage | With Mortgage |
| Less than $800 | 5 (16.1%) | 0 (0.0%) |
| $800 to $1,499 | 15 (48.4%) | 2 (10.0%) |
| $800 to $1,499 | 11 (35.5%) | 12 (60.0%) |
| Total | 31 (100.0%) | 20 (100.0%) |
Health & Disability in Kimmswick
Health Insurance Coverage by Age in Kimmswick
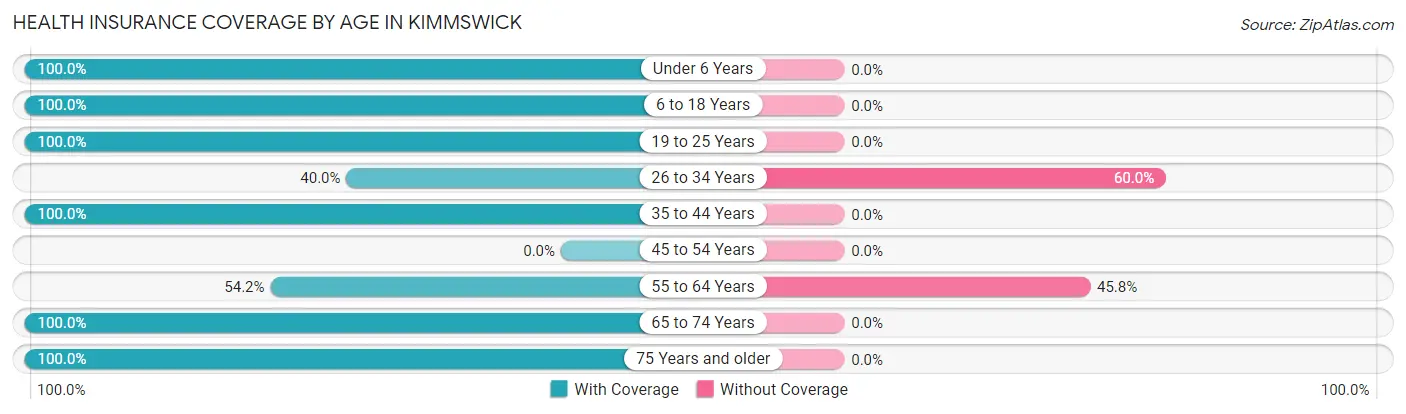
| Age Bracket | With Coverage | Without Coverage |
| Under 6 Years | 15 (100.0%) | 0 (0.0%) |
| 6 to 18 Years | 17 (100.0%) | 0 (0.0%) |
| 19 to 25 Years | 1 (100.0%) | 0 (0.0%) |
| 26 to 34 Years | 8 (40.0%) | 12 (60.0%) |
| 35 to 44 Years | 13 (100.0%) | 0 (0.0%) |
| 45 to 54 Years | 0 (0.0%) | 0 (0.0%) |
| 55 to 64 Years | 13 (54.2%) | 11 (45.8%) |
| 65 to 74 Years | 24 (100.0%) | 0 (0.0%) |
| 75 Years and older | 8 (100.0%) | 0 (0.0%) |
| Total | 99 (81.1%) | 23 (18.9%) |
Health Insurance Coverage by Citizenship Status in Kimmswick
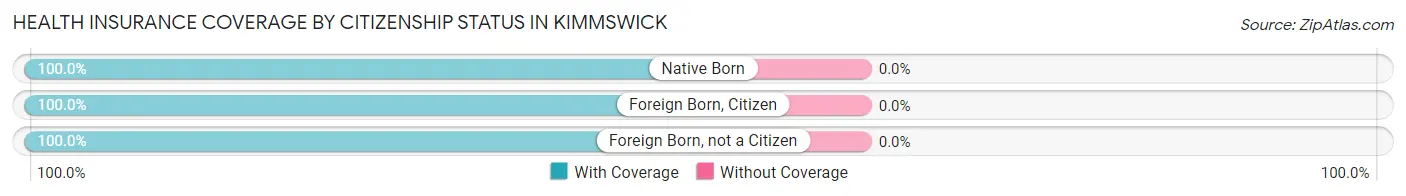
| Citizenship Status | With Coverage | Without Coverage |
| Native Born | 15 (100.0%) | 0 (0.0%) |
| Foreign Born, Citizen | 17 (100.0%) | 0 (0.0%) |
| Foreign Born, not a Citizen | 1 (100.0%) | 0 (0.0%) |
Health Insurance Coverage by Household Income in Kimmswick
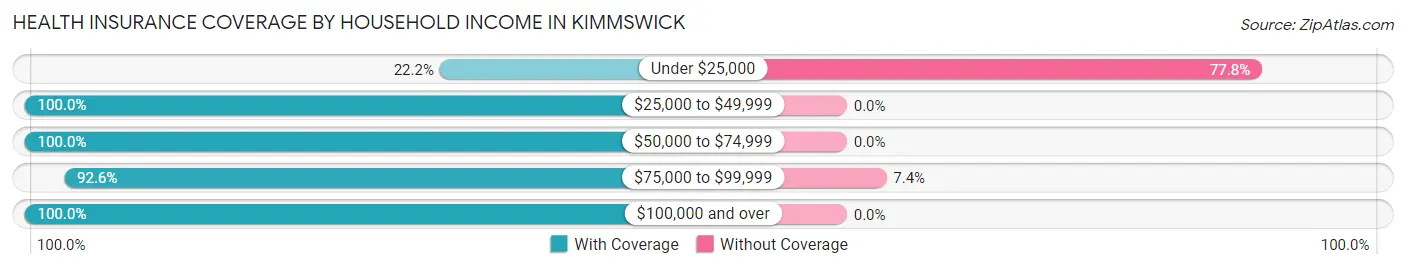
| Household Income | With Coverage | Without Coverage |
| Under $25,000 | 6 (22.2%) | 21 (77.8%) |
| $25,000 to $49,999 | 12 (100.0%) | 0 (0.0%) |
| $50,000 to $74,999 | 24 (100.0%) | 0 (0.0%) |
| $75,000 to $99,999 | 25 (92.6%) | 2 (7.4%) |
| $100,000 and over | 32 (100.0%) | 0 (0.0%) |
Public vs Private Health Insurance Coverage by Age in Kimmswick
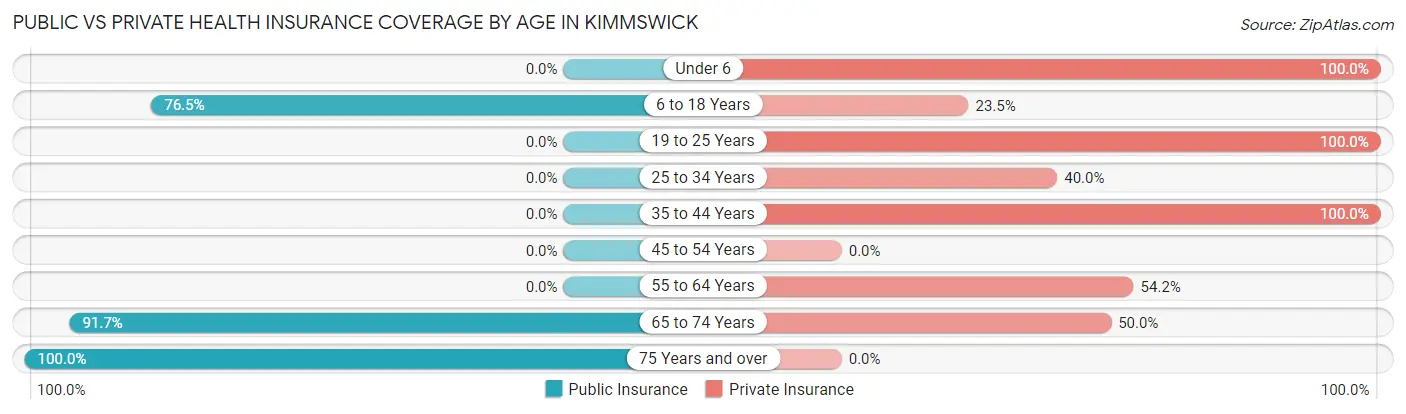
| Age Bracket | Public Insurance | Private Insurance |
| Under 6 | 0 (0.0%) | 15 (100.0%) |
| 6 to 18 Years | 13 (76.5%) | 4 (23.5%) |
| 19 to 25 Years | 0 (0.0%) | 1 (100.0%) |
| 25 to 34 Years | 0 (0.0%) | 8 (40.0%) |
| 35 to 44 Years | 0 (0.0%) | 13 (100.0%) |
| 45 to 54 Years | 0 (0.0%) | 0 (0.0%) |
| 55 to 64 Years | 0 (0.0%) | 13 (54.2%) |
| 65 to 74 Years | 22 (91.7%) | 12 (50.0%) |
| 75 Years and over | 8 (100.0%) | 0 (0.0%) |
| Total | 43 (35.2%) | 66 (54.1%) |
Disability Status by Sex by Age in Kimmswick
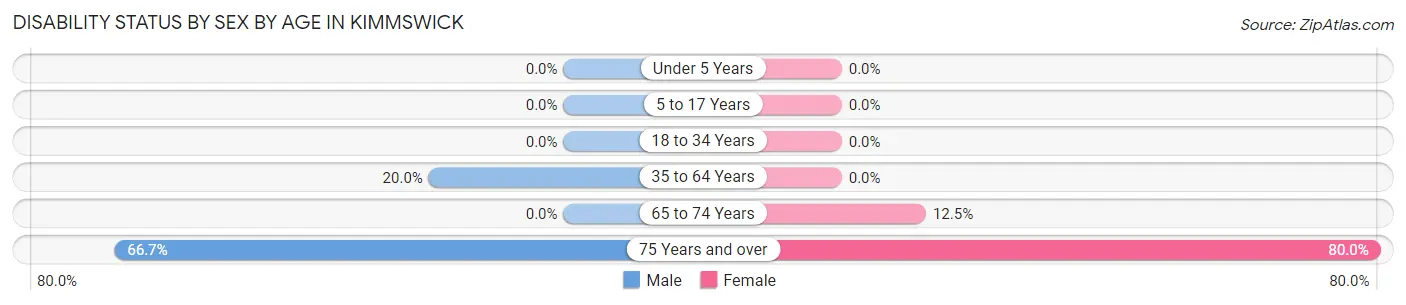
| Age Bracket | Male | Female |
| Under 5 Years | 0 (0.0%) | 0 (0.0%) |
| 5 to 17 Years | 0 (0.0%) | 0 (0.0%) |
| 18 to 34 Years | 0 (0.0%) | 0 (0.0%) |
| 35 to 64 Years | 3 (20.0%) | 0 (0.0%) |
| 65 to 74 Years | 0 (0.0%) | 2 (12.5%) |
| 75 Years and over | 2 (66.7%) | 4 (80.0%) |
Disability Class by Sex by Age in Kimmswick
Disability Class: Hearing Difficulty
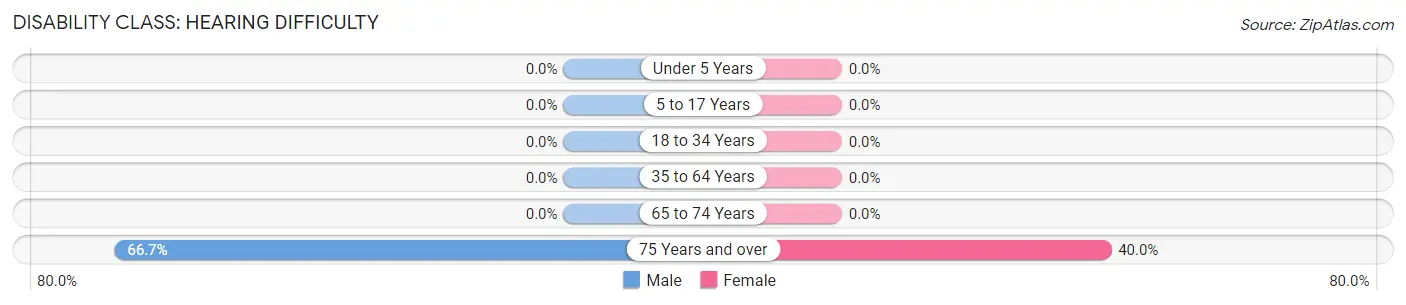
| Age Bracket | Male | Female |
| Under 5 Years | 0 (0.0%) | 0 (0.0%) |
| 5 to 17 Years | 0 (0.0%) | 0 (0.0%) |
| 18 to 34 Years | 0 (0.0%) | 0 (0.0%) |
| 35 to 64 Years | 0 (0.0%) | 0 (0.0%) |
| 65 to 74 Years | 0 (0.0%) | 0 (0.0%) |
| 75 Years and over | 2 (66.7%) | 2 (40.0%) |
Disability Class: Vision Difficulty
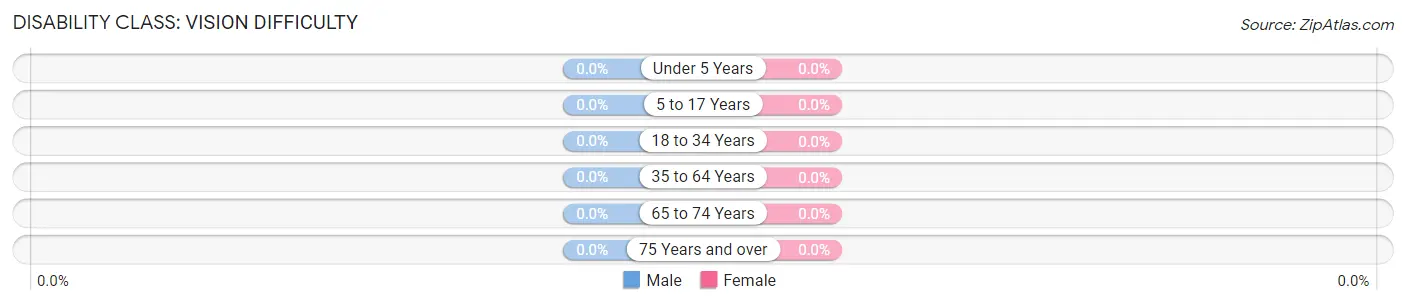
| Age Bracket | Male | Female |
| Under 5 Years | 0 (0.0%) | 0 (0.0%) |
| 5 to 17 Years | 0 (0.0%) | 0 (0.0%) |
| 18 to 34 Years | 0 (0.0%) | 0 (0.0%) |
| 35 to 64 Years | 0 (0.0%) | 0 (0.0%) |
| 65 to 74 Years | 0 (0.0%) | 0 (0.0%) |
| 75 Years and over | 0 (0.0%) | 0 (0.0%) |
Disability Class: Cognitive Difficulty
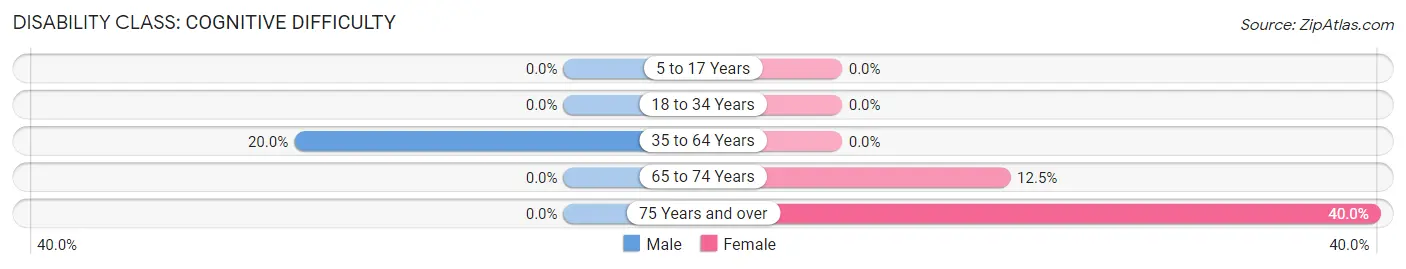
| Age Bracket | Male | Female |
| 5 to 17 Years | 0 (0.0%) | 0 (0.0%) |
| 18 to 34 Years | 0 (0.0%) | 0 (0.0%) |
| 35 to 64 Years | 3 (20.0%) | 0 (0.0%) |
| 65 to 74 Years | 0 (0.0%) | 2 (12.5%) |
| 75 Years and over | 0 (0.0%) | 2 (40.0%) |
Disability Class: Ambulatory Difficulty
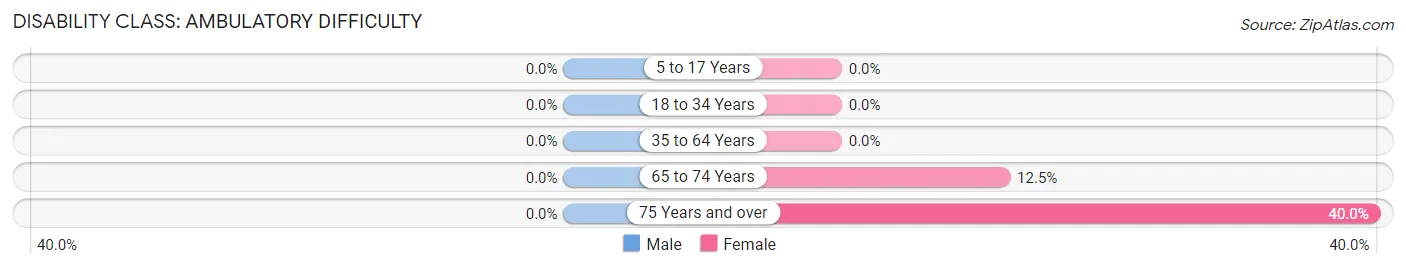
| Age Bracket | Male | Female |
| 5 to 17 Years | 0 (0.0%) | 0 (0.0%) |
| 18 to 34 Years | 0 (0.0%) | 0 (0.0%) |
| 35 to 64 Years | 0 (0.0%) | 0 (0.0%) |
| 65 to 74 Years | 0 (0.0%) | 2 (12.5%) |
| 75 Years and over | 0 (0.0%) | 2 (40.0%) |
Disability Class: Self-Care Difficulty
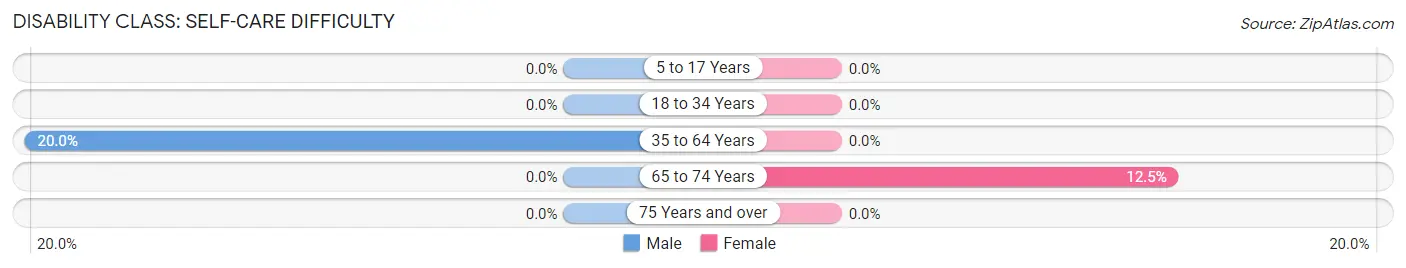
| Age Bracket | Male | Female |
| 5 to 17 Years | 0 (0.0%) | 0 (0.0%) |
| 18 to 34 Years | 0 (0.0%) | 0 (0.0%) |
| 35 to 64 Years | 3 (20.0%) | 0 (0.0%) |
| 65 to 74 Years | 0 (0.0%) | 2 (12.5%) |
| 75 Years and over | 0 (0.0%) | 0 (0.0%) |
Technology Access in Kimmswick
Computing Device Access in Kimmswick
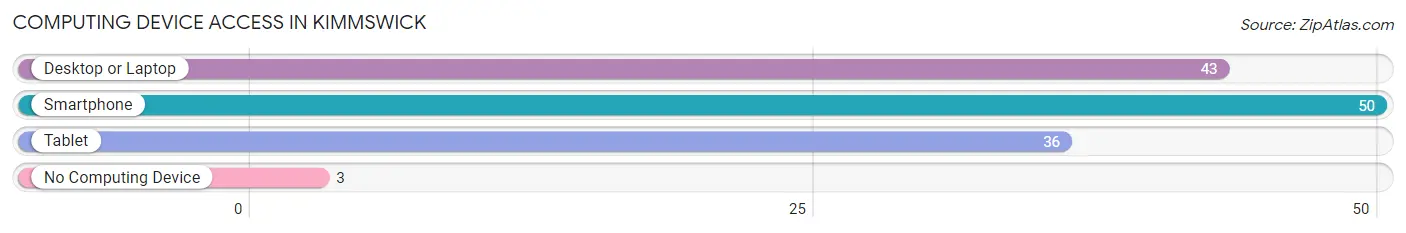
| Device Type | # Households | % Households |
| Desktop or Laptop | 43 | 74.1% |
| Smartphone | 50 | 86.2% |
| Tablet | 36 | 62.1% |
| No Computing Device | 3 | 5.2% |
| Total | 58 | 100.0% |
Internet Access in Kimmswick
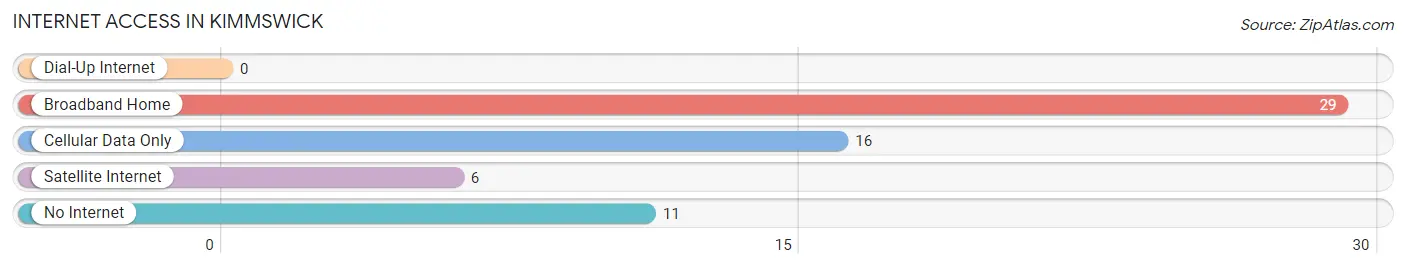
| Internet Type | # Households | % Households |
| Dial-Up Internet | 0 | 0.0% |
| Broadband Home | 29 | 50.0% |
| Cellular Data Only | 16 | 27.6% |
| Satellite Internet | 6 | 10.3% |
| No Internet | 11 | 19.0% |
| Total | 58 | 100.0% |
Kimmswick Summary
Kimmswick, Missouri is a small town located in Jefferson County, Missouri, United States. It is situated on the Mississippi River, approximately 25 miles south of St. Louis. The town was founded in 1859 by Theodore Kimm, a German immigrant who had come to the United States in 1854. Kimm purchased the land from the local Native American tribes and named the town after himself.
Kimmswick is a small town with a population of just over 500 people. The town is located in a rural area and is surrounded by farmland. The town is home to a variety of businesses, including restaurants, antique stores, and a winery. The town is also home to the Kimmswick Historical Society, which is dedicated to preserving the history of the town.
Geographically, Kimmswick is located in the southeastern corner of Jefferson County. It is situated on the Mississippi River, approximately 25 miles south of St. Louis. The town is located in a rural area and is surrounded by farmland. The town is located in a temperate climate, with hot summers and cold winters.
The economy of Kimmswick is largely based on tourism. The town is home to a variety of businesses, including restaurants, antique stores, and a winery. The town is also home to the Kimmswick Historical Society, which is dedicated to preserving the history of the town. The town is also home to a number of festivals and events throughout the year, including the Kimmswick Apple Butter Festival and the Kimmswick Christmas Festival.
The demographics of Kimmswick are largely white, with a small percentage of African Americans and Hispanics. The median household income is approximately $45,000, and the median home value is approximately $150,000. The town is home to a variety of churches, including Baptist, Methodist, and Catholic.
Kimmswick is a small town with a rich history and a vibrant economy. The town is home to a variety of businesses, including restaurants, antique stores, and a winery. The town is also home to the Kimmswick Historical Society, which is dedicated to preserving the history of the town. The town is also home to a number of festivals and events throughout the year, including the Kimmswick Apple Butter Festival and the Kimmswick Christmas Festival. The town is also home to a variety of churches, including Baptist, Methodist, and Catholic. The town is located in a rural area and is surrounded by farmland. The town is located in a temperate climate, with hot summers and cold winters. The economy of Kimmswick is largely based on tourism. The town is home to a variety of businesses, including restaurants, antique stores, and a winery. The town is also home to the Kimmswick Historical Society, which is dedicated to preserving the history of the town. The demographics of Kimmswick are largely white, with a small percentage of African Americans and Hispanics. The median household income is approximately $45,000, and the median home value is approximately $150,000.
Common Questions
What is Per Capita Income in Kimmswick?
Per Capita income in Kimmswick is $30,848.
What is the Median Family Income in Kimmswick?
Median Family Income in Kimmswick is $65,833.
What is the Median Household income in Kimmswick?
Median Household Income in Kimmswick is $57,500.
What is Inequality or Gini Index in Kimmswick?
Inequality or Gini Index in Kimmswick is 0.34.
What is the Total Population of Kimmswick?
Total Population of Kimmswick is 122.
What is the Total Male Population of Kimmswick?
Total Male Population of Kimmswick is 38.
What is the Total Female Population of Kimmswick?
Total Female Population of Kimmswick is 84.
What is the Ratio of Males per 100 Females in Kimmswick?
There are 45.24 Males per 100 Females in Kimmswick.
What is the Ratio of Females per 100 Males in Kimmswick?
There are 221.05 Females per 100 Males in Kimmswick.
What is the Median Population Age in Kimmswick?
Median Population Age in Kimmswick is 41.6 Years.
What is the Average Family Size in Kimmswick
Average Family Size in Kimmswick is 3.3 People.
What is the Average Household Size in Kimmswick
Average Household Size in Kimmswick is 2.1 People.
How Large is the Labor Force in Kimmswick?
There are 53 People in the Labor Forcein in Kimmswick.
What is the Percentage of People in the Labor Force in Kimmswick?
54.6% of People are in the Labor Force in Kimmswick.