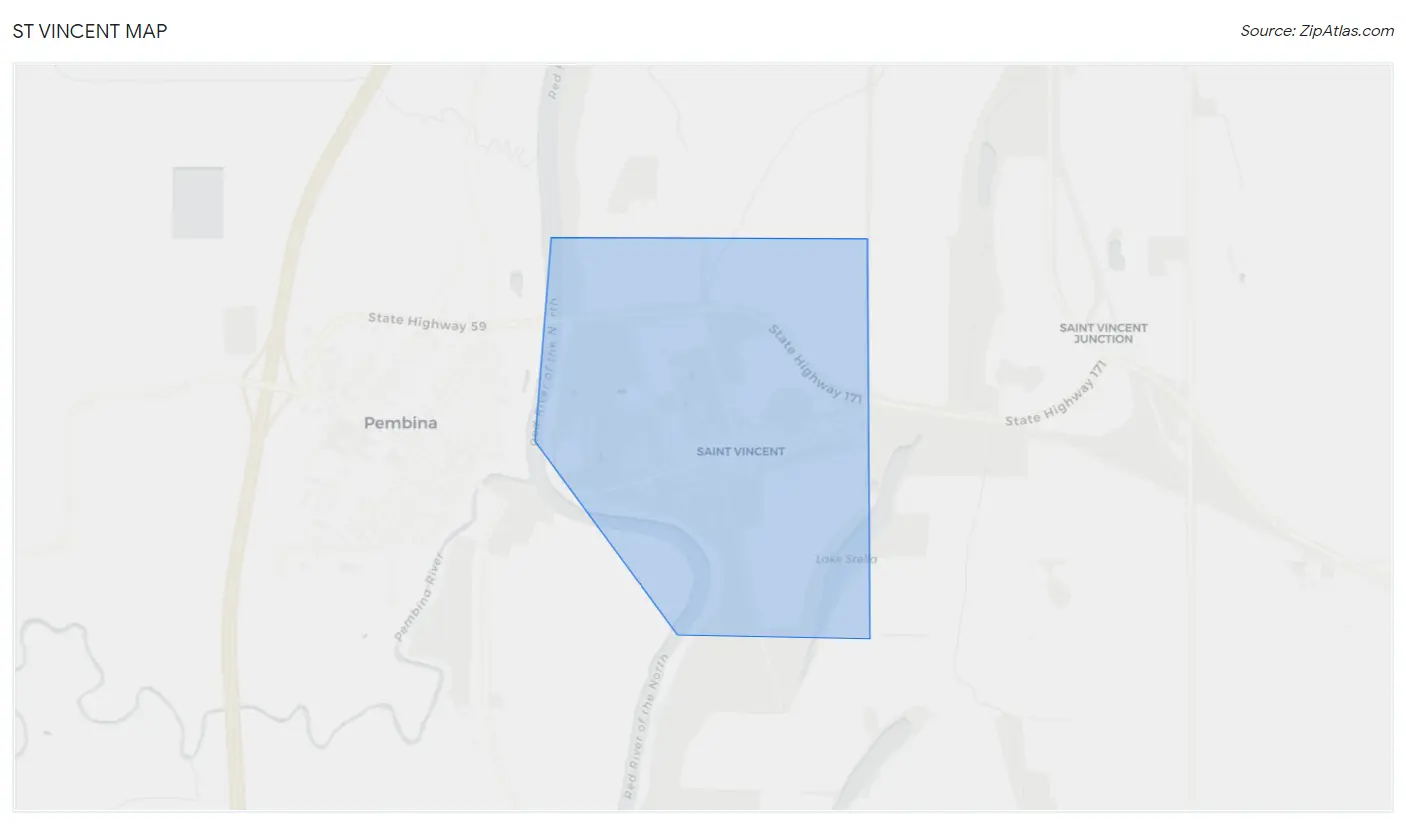
St Vincent, MN Map & Demographics
St Vincent Map
St Vincent Overview
$32,388
PER CAPITA INCOME
$61,250
AVG FAMILY INCOME
$49,375
AVG HOUSEHOLD INCOME
0.33
INEQUALITY / GINI INDEX
43
TOTAL POPULATION
26
MALE POPULATION
17
FEMALE POPULATION
152.94
MALES / 100 FEMALES
65.38
FEMALES / 100 MALES
57.8
MEDIAN AGE
2.3
AVG FAMILY SIZE
1.9
AVG HOUSEHOLD SIZE
28
LABOR FORCE [ PEOPLE ]
70.0%
PERCENT IN LABOR FORCE
3.6%
UNEMPLOYMENT RATE
Income in St Vincent
Income Overview in St Vincent
Per Capita Income in St Vincent is $32,388, while median incomes of families and households are $61,250 and $49,375 respectively.
| Characteristic | Number | Measure |
| Per Capita Income | 43 | $32,388 |
| Median Family Income | 15 | $61,250 |
| Mean Family Income | 15 | $66,713 |
| Median Household Income | 23 | $49,375 |
| Mean Household Income | 23 | $56,857 |
| Income Deficit | 15 | $0 |
| Wage / Income Gap (%) | 43 | 0.00% |
| Wage / Income Gap ($) | 43 | 100.00¢ per $1 |
| Gini / Inequality Index | 43 | 0.33 |
Earnings by Sex in St Vincent
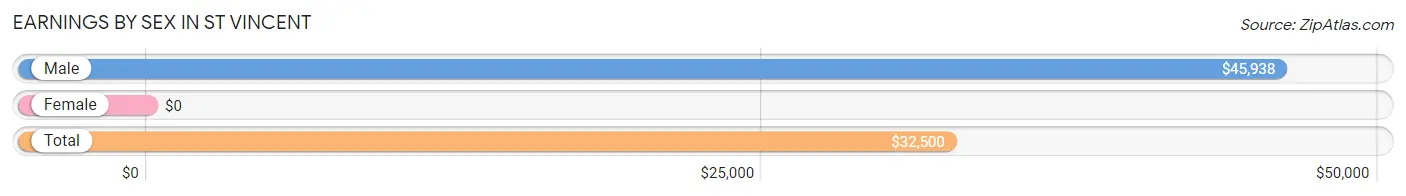
| Sex | Number | Average Earnings |
| Male | 19 (67.9%) | $45,938 |
| Female | 9 (32.1%) | $0 |
| Total | 28 (100.0%) | $32,500 |
Earnings by Sex by Income Bracket in St Vincent
The most common earnings brackets in St Vincent are $25,000 to $29,999 for men (7 | 36.8%) and $2,500 to $4,999 for women (4 | 44.4%).
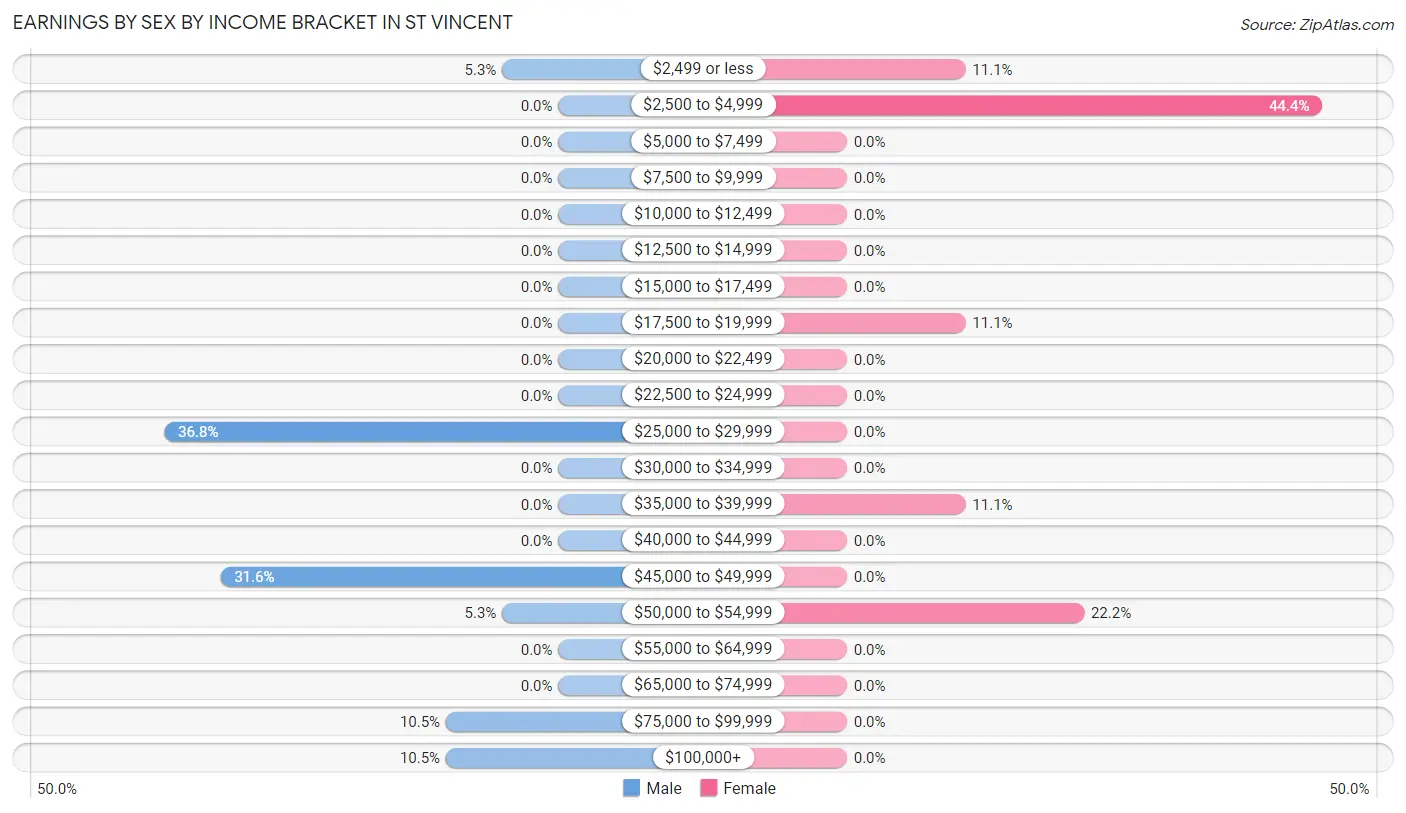
| Income | Male | Female |
| $2,499 or less | 1 (5.3%) | 1 (11.1%) |
| $2,500 to $4,999 | 0 (0.0%) | 4 (44.4%) |
| $5,000 to $7,499 | 0 (0.0%) | 0 (0.0%) |
| $7,500 to $9,999 | 0 (0.0%) | 0 (0.0%) |
| $10,000 to $12,499 | 0 (0.0%) | 0 (0.0%) |
| $12,500 to $14,999 | 0 (0.0%) | 0 (0.0%) |
| $15,000 to $17,499 | 0 (0.0%) | 0 (0.0%) |
| $17,500 to $19,999 | 0 (0.0%) | 1 (11.1%) |
| $20,000 to $22,499 | 0 (0.0%) | 0 (0.0%) |
| $22,500 to $24,999 | 0 (0.0%) | 0 (0.0%) |
| $25,000 to $29,999 | 7 (36.8%) | 0 (0.0%) |
| $30,000 to $34,999 | 0 (0.0%) | 0 (0.0%) |
| $35,000 to $39,999 | 0 (0.0%) | 1 (11.1%) |
| $40,000 to $44,999 | 0 (0.0%) | 0 (0.0%) |
| $45,000 to $49,999 | 6 (31.6%) | 0 (0.0%) |
| $50,000 to $54,999 | 1 (5.3%) | 2 (22.2%) |
| $55,000 to $64,999 | 0 (0.0%) | 0 (0.0%) |
| $65,000 to $74,999 | 0 (0.0%) | 0 (0.0%) |
| $75,000 to $99,999 | 2 (10.5%) | 0 (0.0%) |
| $100,000+ | 2 (10.5%) | 0 (0.0%) |
| Total | 19 (100.0%) | 9 (100.0%) |
Earnings by Sex by Educational Attainment in St Vincent
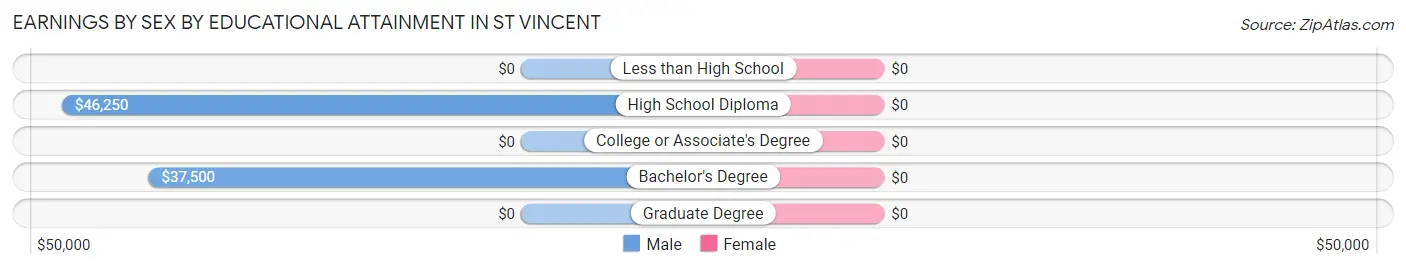
| Educational Attainment | Male Income | Female Income |
| Less than High School | - | - |
| High School Diploma | $46,250 | $0 |
| College or Associate's Degree | - | - |
| Bachelor's Degree | $37,500 | $0 |
| Graduate Degree | - | - |
| Total | $46,250 | $0 |
Family Income in St Vincent
Family Income Brackets in St Vincent
According to the St Vincent family income data, there are 4 families falling into the $35,000 to $49,999 income range, which is the most common income bracket and makes up 26.7% of all families.
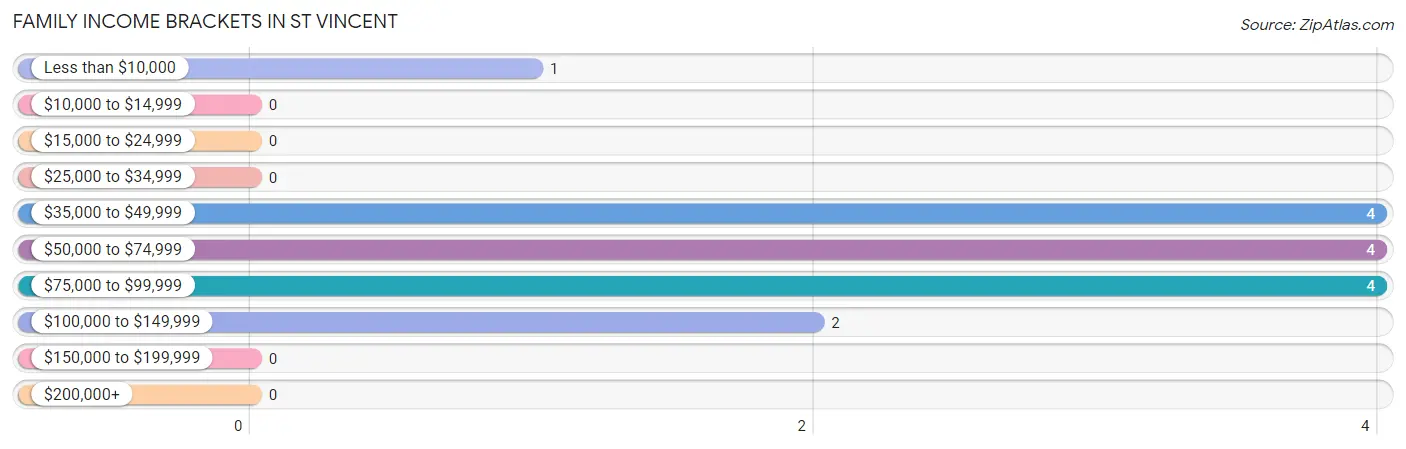
| Income Bracket | # Families | % Families |
| Less than $10,000 | 1 | 6.7% |
| $10,000 to $14,999 | 0 | 0.0% |
| $15,000 to $24,999 | 0 | 0.0% |
| $25,000 to $34,999 | 0 | 0.0% |
| $35,000 to $49,999 | 4 | 26.7% |
| $50,000 to $74,999 | 4 | 26.7% |
| $75,000 to $99,999 | 4 | 26.7% |
| $100,000 to $149,999 | 2 | 13.3% |
| $150,000 to $199,999 | 0 | 0.0% |
| $200,000+ | 0 | 0.0% |
Family Income by Famaliy Size in St Vincent
2-person families (12 | 80.0%) account for the highest median family income in St Vincent with $51,250 per family, while 2-person families (12 | 80.0%) have the highest median income of $25,625 per family member.
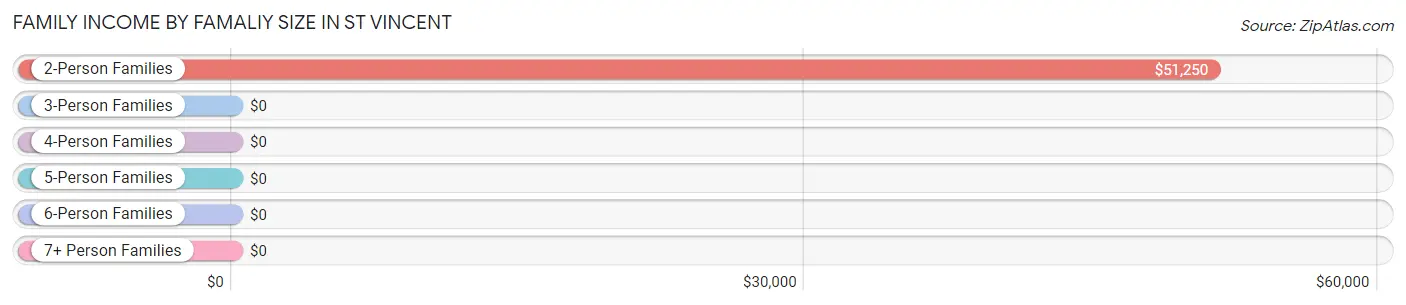
| Income Bracket | # Families | Median Income |
| 2-Person Families | 12 (80.0%) | $51,250 |
| 3-Person Families | 2 (13.3%) | $0 |
| 4-Person Families | 1 (6.7%) | $0 |
| 5-Person Families | 0 (0.0%) | $0 |
| 6-Person Families | 0 (0.0%) | $0 |
| 7+ Person Families | 0 (0.0%) | $0 |
| Total | 15 (100.0%) | $61,250 |
Family Income by Number of Earners in St Vincent
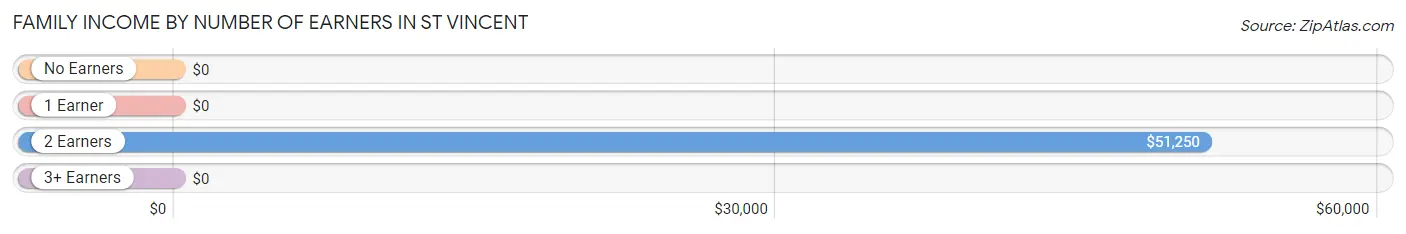
| Number of Earners | # Families | Median Income |
| No Earners | 2 (13.3%) | $0 |
| 1 Earner | 3 (20.0%) | $0 |
| 2 Earners | 10 (66.7%) | $51,250 |
| 3+ Earners | 0 (0.0%) | $0 |
| Total | 15 (100.0%) | $61,250 |
Household Income in St Vincent
Household Income Brackets in St Vincent
With 6 households falling in the category, the $35,000 to $49,999 income range is the most frequent in St Vincent, accounting for 26.1% of all households.
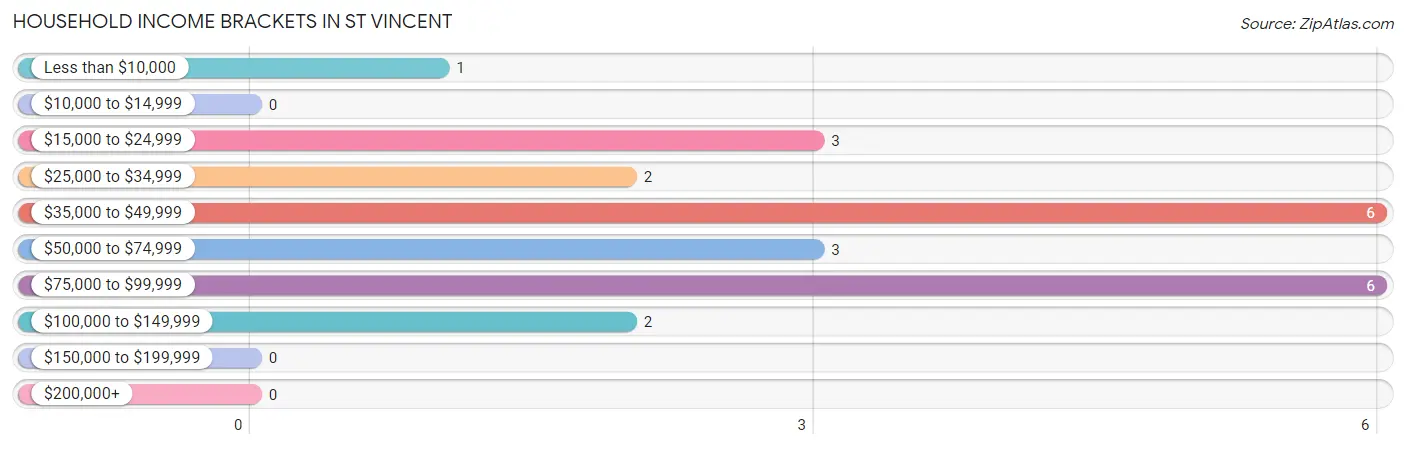
| Income Bracket | # Households | % Households |
| Less than $10,000 | 1 | 4.3% |
| $10,000 to $14,999 | 0 | 0.0% |
| $15,000 to $24,999 | 3 | 13.0% |
| $25,000 to $34,999 | 2 | 8.7% |
| $35,000 to $49,999 | 6 | 26.1% |
| $50,000 to $74,999 | 3 | 13.0% |
| $75,000 to $99,999 | 6 | 26.1% |
| $100,000 to $149,999 | 2 | 8.7% |
| $150,000 to $199,999 | 0 | 0.0% |
| $200,000+ | 0 | 0.0% |
Household Income by Householder Age in St Vincent
The median household income in St Vincent is $49,375, with the highest median household income of $48,750 found in the 45 to 64 years age bracket for the primary householder. A total of 16 households (69.6%) fall into this category.
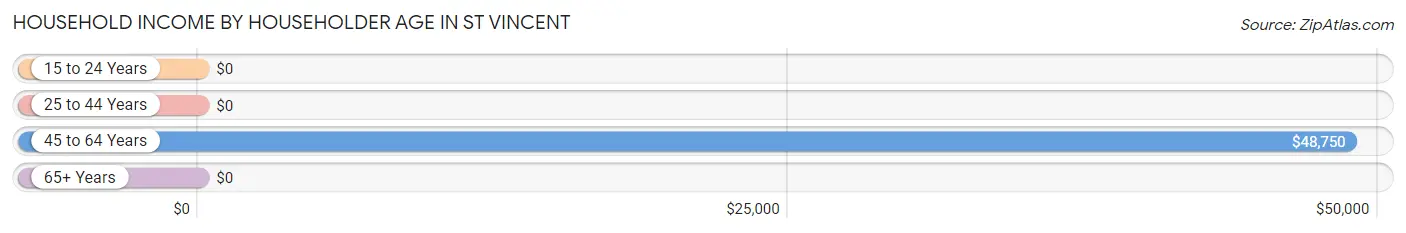
| Income Bracket | # Households | Median Income |
| 15 to 24 Years | 0 (0.0%) | $0 |
| 25 to 44 Years | 1 (4.3%) | $0 |
| 45 to 64 Years | 16 (69.6%) | $48,750 |
| 65+ Years | 6 (26.1%) | $0 |
| Total | 23 (100.0%) | $49,375 |
Poverty in St Vincent
Income Below Poverty by Sex and Age in St Vincent
With 3.8% poverty level for males and 5.9% for females among the residents of St Vincent, 25 to 34 year old males and 55 to 64 year old females are the most vulnerable to poverty, with 1 males (100.0%) and 1 females (14.3%) in their respective age groups living below the poverty level.
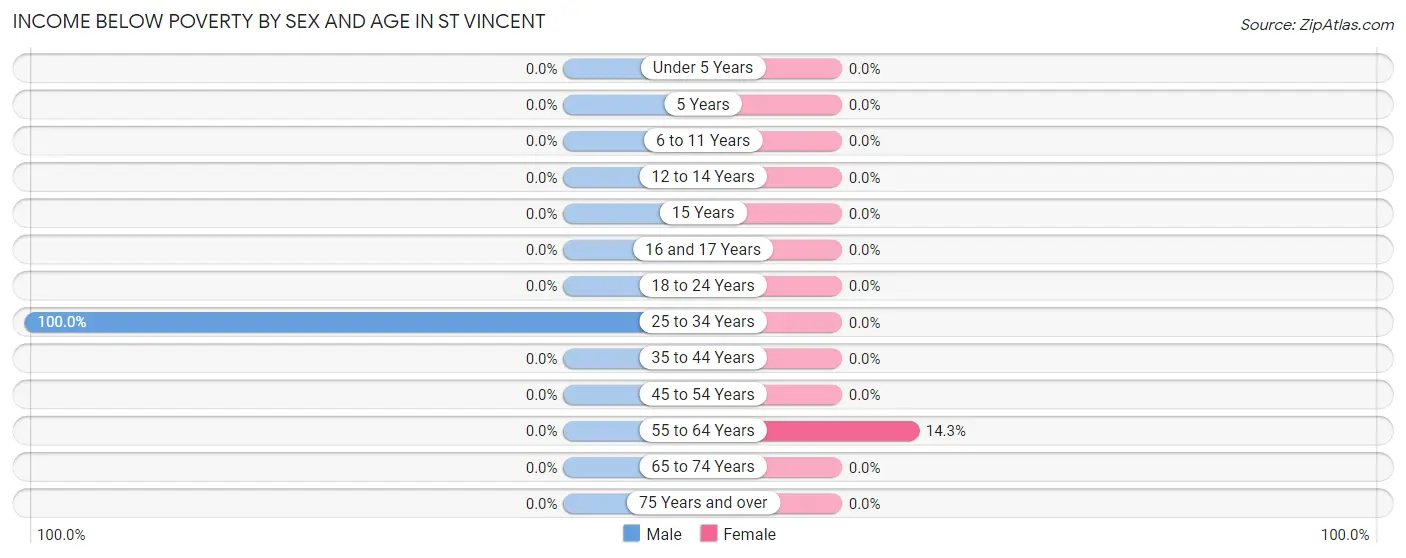
| Age Bracket | Male | Female |
| Under 5 Years | 0 (0.0%) | 0 (0.0%) |
| 5 Years | 0 (0.0%) | 0 (0.0%) |
| 6 to 11 Years | 0 (0.0%) | 0 (0.0%) |
| 12 to 14 Years | 0 (0.0%) | 0 (0.0%) |
| 15 Years | 0 (0.0%) | 0 (0.0%) |
| 16 and 17 Years | 0 (0.0%) | 0 (0.0%) |
| 18 to 24 Years | 0 (0.0%) | 0 (0.0%) |
| 25 to 34 Years | 1 (100.0%) | 0 (0.0%) |
| 35 to 44 Years | 0 (0.0%) | 0 (0.0%) |
| 45 to 54 Years | 0 (0.0%) | 0 (0.0%) |
| 55 to 64 Years | 0 (0.0%) | 1 (14.3%) |
| 65 to 74 Years | 0 (0.0%) | 0 (0.0%) |
| 75 Years and over | 0 (0.0%) | 0 (0.0%) |
| Total | 1 (3.8%) | 1 (5.9%) |
Income Above Poverty by Sex and Age in St Vincent
According to the poverty statistics in St Vincent, males aged 12 to 14 years and females aged 16 and 17 years are the age groups that are most secure financially, with 100.0% of males and 100.0% of females in these age groups living above the poverty line.
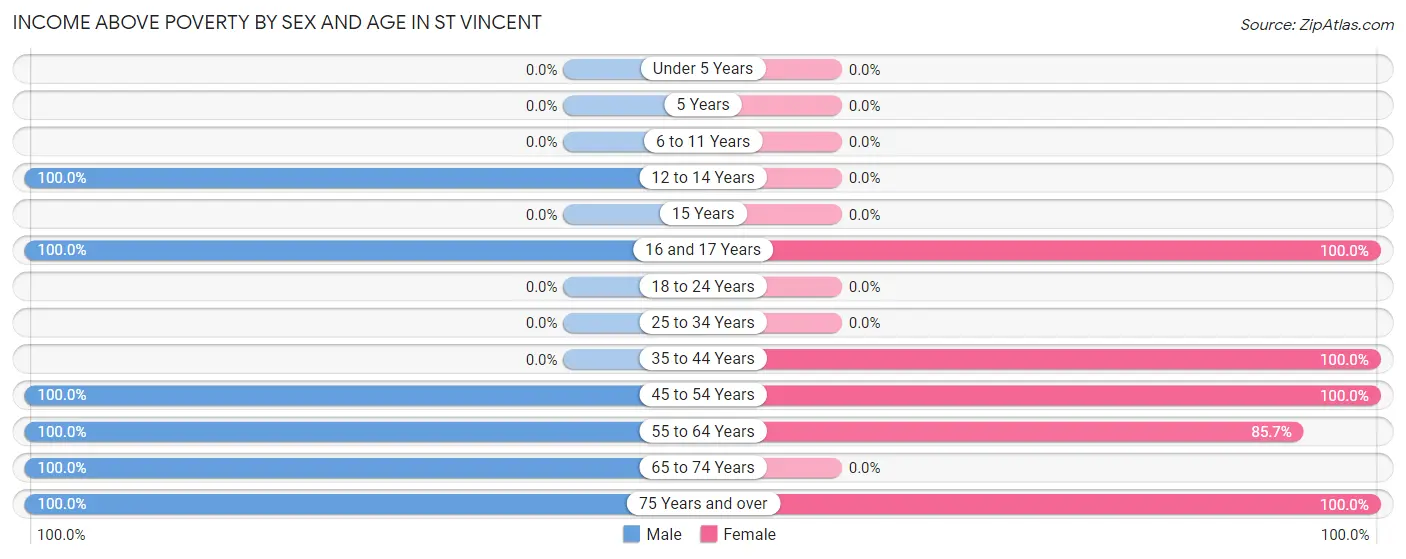
| Age Bracket | Male | Female |
| Under 5 Years | 0 (0.0%) | 0 (0.0%) |
| 5 Years | 0 (0.0%) | 0 (0.0%) |
| 6 to 11 Years | 0 (0.0%) | 0 (0.0%) |
| 12 to 14 Years | 3 (100.0%) | 0 (0.0%) |
| 15 Years | 0 (0.0%) | 0 (0.0%) |
| 16 and 17 Years | 1 (100.0%) | 1 (100.0%) |
| 18 to 24 Years | 0 (0.0%) | 0 (0.0%) |
| 25 to 34 Years | 0 (0.0%) | 0 (0.0%) |
| 35 to 44 Years | 0 (0.0%) | 1 (100.0%) |
| 45 to 54 Years | 7 (100.0%) | 4 (100.0%) |
| 55 to 64 Years | 10 (100.0%) | 6 (85.7%) |
| 65 to 74 Years | 1 (100.0%) | 0 (0.0%) |
| 75 Years and over | 3 (100.0%) | 4 (100.0%) |
| Total | 25 (96.2%) | 16 (94.1%) |
Income Below Poverty Among Married-Couple Families in St Vincent
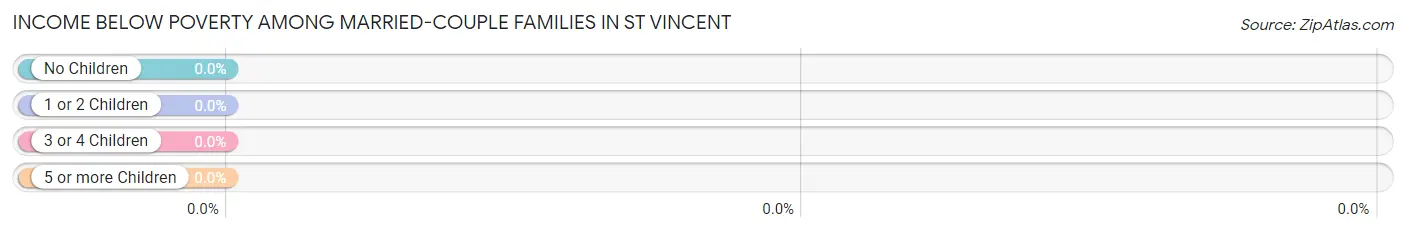
| Children | Above Poverty | Below Poverty |
| No Children | 9 (100.0%) | 0 (0.0%) |
| 1 or 2 Children | 3 (100.0%) | 0 (0.0%) |
| 3 or 4 Children | 0 (0.0%) | 0 (0.0%) |
| 5 or more Children | 0 (0.0%) | 0 (0.0%) |
| Total | 12 (100.0%) | 0 (0.0%) |
Income Below Poverty Among Single-Parent Households in St Vincent
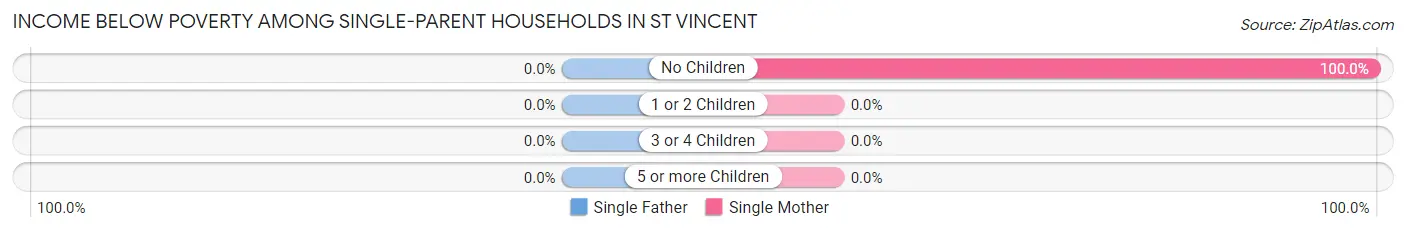
| Children | Single Father | Single Mother |
| No Children | 0 (0.0%) | 1 (100.0%) |
| 1 or 2 Children | 0 (0.0%) | 0 (0.0%) |
| 3 or 4 Children | 0 (0.0%) | 0 (0.0%) |
| 5 or more Children | 0 (0.0%) | 0 (0.0%) |
| Total | 0 (0.0%) | 1 (100.0%) |
Income Below Poverty Among Married-Couple vs Single-Parent Households in St Vincent
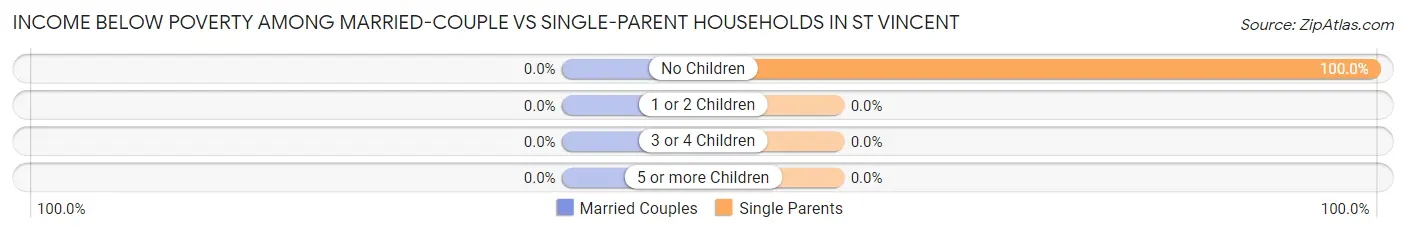
| Children | Married-Couple Families | Single-Parent Households |
| No Children | 0 (0.0%) | 1 (100.0%) |
| 1 or 2 Children | 0 (0.0%) | 0 (0.0%) |
| 3 or 4 Children | 0 (0.0%) | 0 (0.0%) |
| 5 or more Children | 0 (0.0%) | 0 (0.0%) |
| Total | 0 (0.0%) | 1 (33.3%) |
Race in St Vincent
The most populous races in St Vincent are , and White / Caucasian (43 | 100.0%).
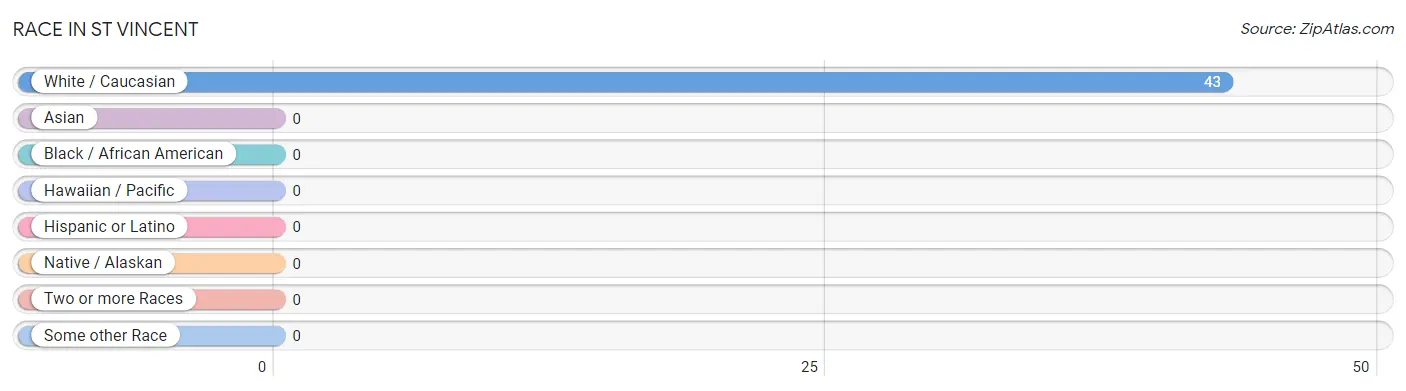
| Race | # Population | % Population |
| Asian | 0 | 0.0% |
| Black / African American | 0 | 0.0% |
| Hawaiian / Pacific | 0 | 0.0% |
| Hispanic or Latino | 0 | 0.0% |
| Native / Alaskan | 0 | 0.0% |
| White / Caucasian | 43 | 100.0% |
| Two or more Races | 0 | 0.0% |
| Some other Race | 0 | 0.0% |
| Total | 43 | 100.0% |
Ancestry in St Vincent
The most populous ancestries reported in St Vincent are English (10 | 23.3%), German (8 | 18.6%), Scandinavian (8 | 18.6%), Irish (5 | 11.6%), and Norwegian (4 | 9.3%), together accounting for 81.4% of all St Vincent residents.
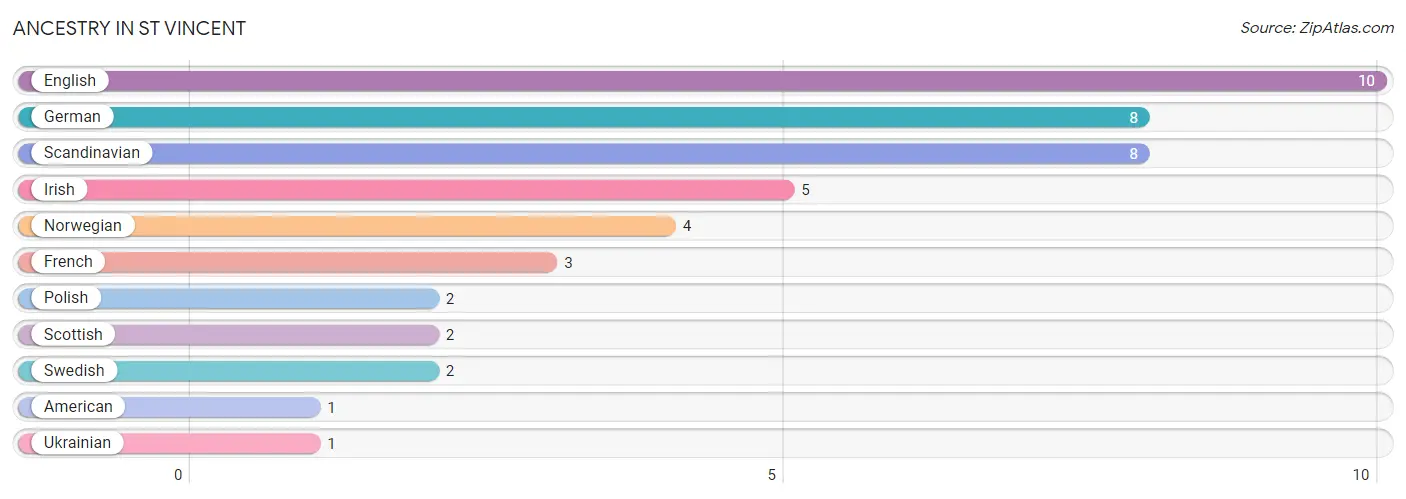
| Ancestry | # Population | % Population |
| American | 1 | 2.3% |
| English | 10 | 23.3% |
| French | 3 | 7.0% |
| German | 8 | 18.6% |
| Irish | 5 | 11.6% |
| Norwegian | 4 | 9.3% |
| Polish | 2 | 4.6% |
| Scandinavian | 8 | 18.6% |
| Scottish | 2 | 4.6% |
| Swedish | 2 | 4.6% |
| Ukrainian | 1 | 2.3% | View All 11 Rows |
Immigrants in St Vincent
The most numerous immigrant groups reported in St Vincent came from , and Canada (5 | 11.6%), together accounting for 11.6% of all St Vincent residents.

| Immigration Origin | # Population | % Population |
| Canada | 5 | 11.6% | View All 1 Rows |
Sex and Age in St Vincent
Sex and Age in St Vincent
The most populous age groups in St Vincent are 50 to 54 Years (6 | 23.1%) for men and 55 to 59 Years (5 | 29.4%) for women.
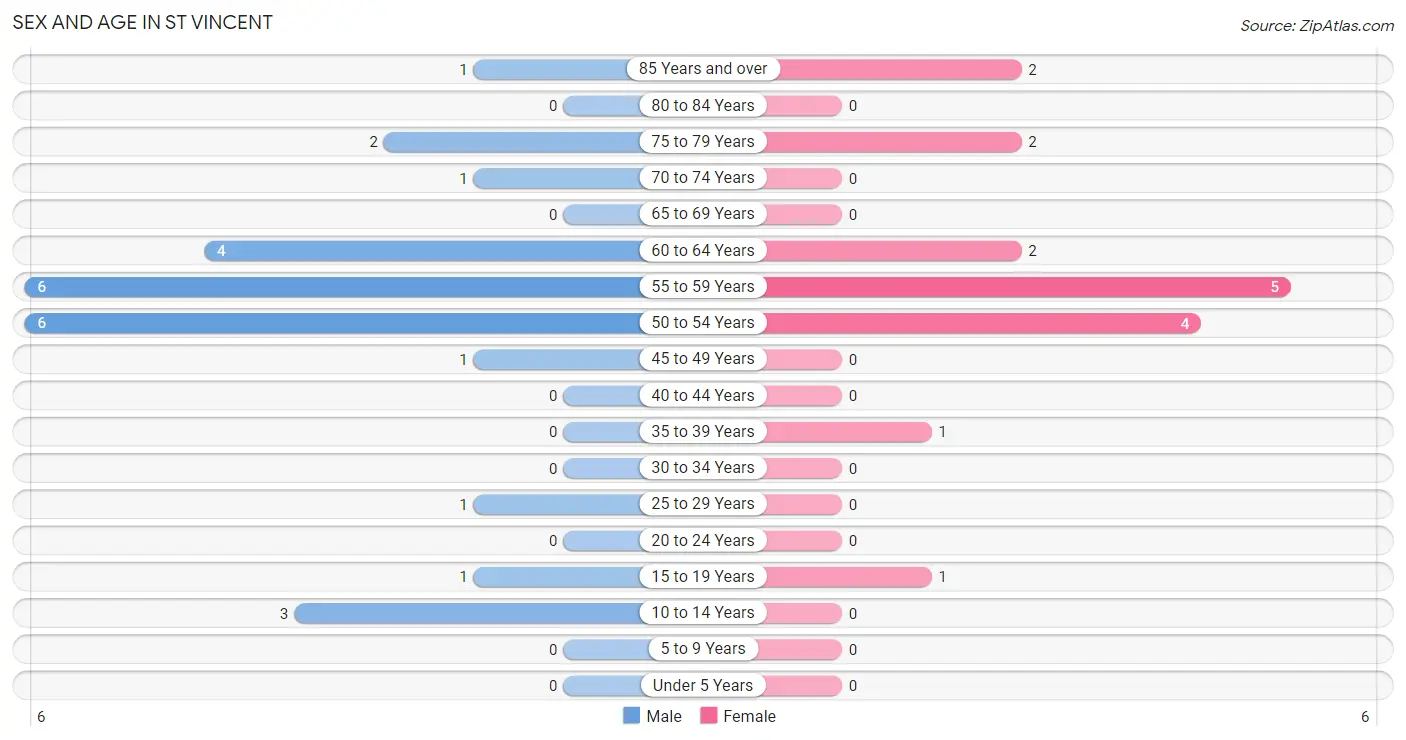
| Age Bracket | Male | Female |
| Under 5 Years | 0 (0.0%) | 0 (0.0%) |
| 5 to 9 Years | 0 (0.0%) | 0 (0.0%) |
| 10 to 14 Years | 3 (11.5%) | 0 (0.0%) |
| 15 to 19 Years | 1 (3.8%) | 1 (5.9%) |
| 20 to 24 Years | 0 (0.0%) | 0 (0.0%) |
| 25 to 29 Years | 1 (3.8%) | 0 (0.0%) |
| 30 to 34 Years | 0 (0.0%) | 0 (0.0%) |
| 35 to 39 Years | 0 (0.0%) | 1 (5.9%) |
| 40 to 44 Years | 0 (0.0%) | 0 (0.0%) |
| 45 to 49 Years | 1 (3.8%) | 0 (0.0%) |
| 50 to 54 Years | 6 (23.1%) | 4 (23.5%) |
| 55 to 59 Years | 6 (23.1%) | 5 (29.4%) |
| 60 to 64 Years | 4 (15.4%) | 2 (11.8%) |
| 65 to 69 Years | 0 (0.0%) | 0 (0.0%) |
| 70 to 74 Years | 1 (3.8%) | 0 (0.0%) |
| 75 to 79 Years | 2 (7.7%) | 2 (11.8%) |
| 80 to 84 Years | 0 (0.0%) | 0 (0.0%) |
| 85 Years and over | 1 (3.8%) | 2 (11.8%) |
| Total | 26 (100.0%) | 17 (100.0%) |
Families and Households in St Vincent
Median Family Size in St Vincent
The median family size in St Vincent is 2.27 persons per family, with married-couple families (12 | 80.0%) accounting for the largest median family size of 2.42 persons per family. On the other hand, single male/father families (2 | 13.3%) represent the smallest median family size with 1.50 persons per family.
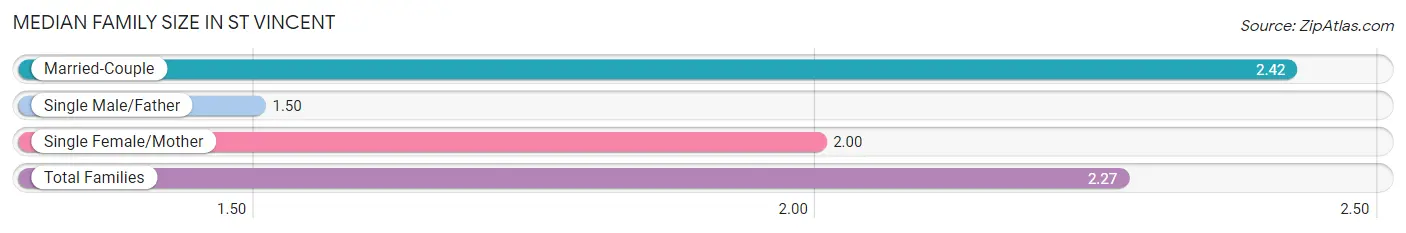
| Family Type | # Families | Family Size |
| Married-Couple | 12 (80.0%) | 2.42 |
| Single Male/Father | 2 (13.3%) | 1.50 |
| Single Female/Mother | 1 (6.7%) | 2.00 |
| Total Families | 15 (100.0%) | 2.27 |
Median Household Size in St Vincent
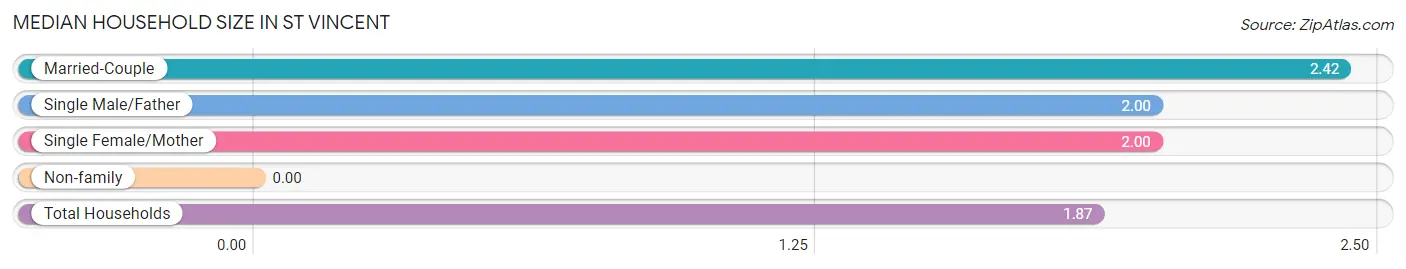
| Household Type | # Households | Household Size |
| Married-Couple | 12 (52.2%) | 2.42 |
| Single Male/Father | 2 (8.7%) | 2.00 |
| Single Female/Mother | 1 (4.3%) | 2.00 |
| Non-family | 8 (34.8%) | - |
| Total Households | 23 (100.0%) | 1.87 |
Household Size by Marriage Status in St Vincent
Out of a total of 23 households in St Vincent, 15 (65.2%) are family households, while 8 (34.8%) are nonfamily households. The most numerous type of family households are 2-person households, comprising 10, and the most common type of nonfamily households are 1-person households, comprising 8.
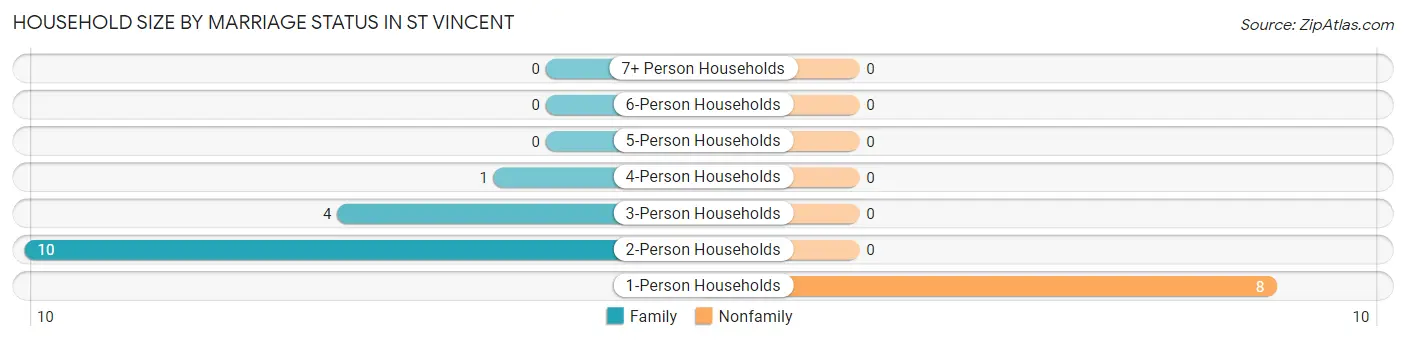
| Household Size | Family Households | Nonfamily Households |
| 1-Person Households | - | 8 (34.8%) |
| 2-Person Households | 10 (43.5%) | 0 (0.0%) |
| 3-Person Households | 4 (17.4%) | 0 (0.0%) |
| 4-Person Households | 1 (4.3%) | 0 (0.0%) |
| 5-Person Households | 0 (0.0%) | 0 (0.0%) |
| 6-Person Households | 0 (0.0%) | 0 (0.0%) |
| 7+ Person Households | 0 (0.0%) | 0 (0.0%) |
| Total | 15 (65.2%) | 8 (34.8%) |
Female Fertility in St Vincent
Fertility by Age in St Vincent
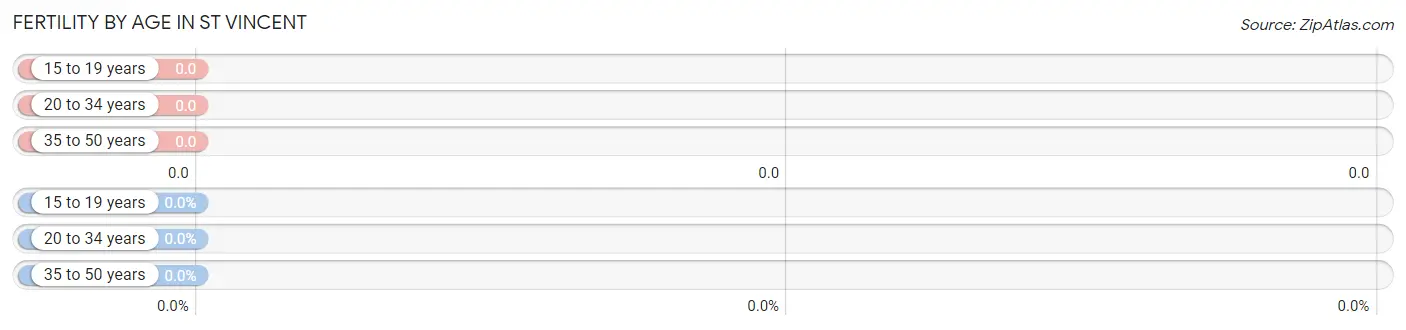
| Age Bracket | Women with Births | Births / 1,000 Women |
| 15 to 19 years | 0 (0.0%) | 0.0 |
| 20 to 34 years | 0 (0.0%) | 0.0 |
| 35 to 50 years | 0 (0.0%) | 0.0 |
| Total | 0 (0.0%) | 0.0 |
Fertility by Age by Marriage Status in St Vincent
| Age Bracket | Married | Unmarried |
| 15 to 19 years | 0 (0.0%) | 0 (0.0%) |
| 20 to 34 years | 0 (0.0%) | 0 (0.0%) |
| 35 to 50 years | 0 (0.0%) | 0 (0.0%) |
| Total | 0 (0.0%) | 0 (0.0%) |
Fertility by Education in St Vincent
| Educational Attainment | Women with Births | Births / 1,000 Women |
| Less than High School | 0 (0.0%) | 0.0 |
| High School Diploma | 0 (0.0%) | 0.0 |
| College or Associate's Degree | 0 (0.0%) | 0.0 |
| Bachelor's Degree | 0 (0.0%) | 0.0 |
| Graduate Degree | 0 (0.0%) | 0.0 |
| Total | 0 (0.0%) | 0.0 |
Fertility by Education by Marriage Status in St Vincent
| Educational Attainment | Married | Unmarried |
| Less than High School | 0 (0.0%) | 0 (0.0%) |
| High School Diploma | 0 (0.0%) | 0 (0.0%) |
| College or Associate's Degree | 0 (0.0%) | 0 (0.0%) |
| Bachelor's Degree | 0 (0.0%) | 0 (0.0%) |
| Graduate Degree | 0 (0.0%) | 0 (0.0%) |
| Total | 0 (0.0%) | 0 (0.0%) |
Employment Characteristics in St Vincent
Employment by Class of Employer in St Vincent
Among the 27 employed individuals in St Vincent, private company employees (15 | 55.6%), federal government employees (6 | 22.2%), and self-employed (not incorporated) (4 | 14.8%) make up the most common classes of employment.
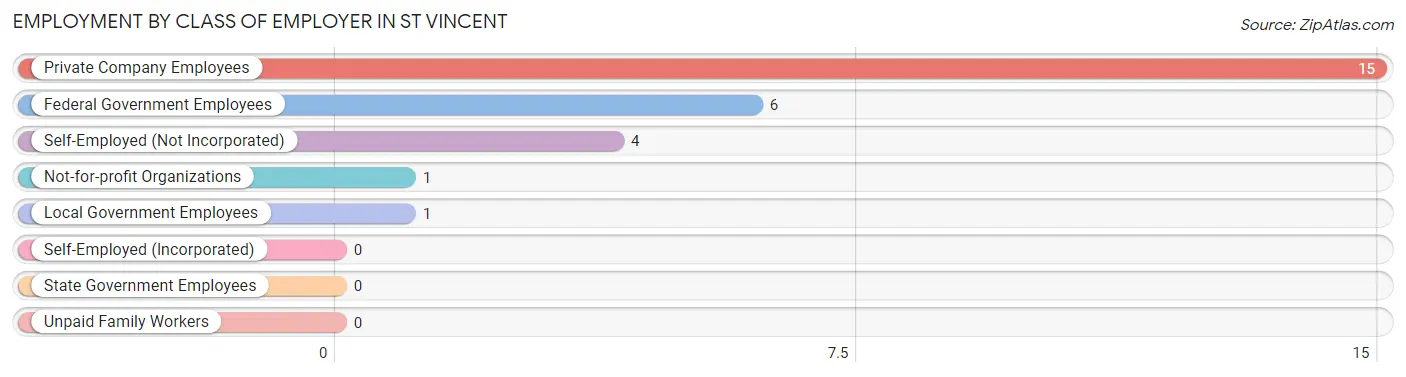
| Employer Class | # Employees | % Employees |
| Private Company Employees | 15 | 55.6% |
| Self-Employed (Incorporated) | 0 | 0.0% |
| Self-Employed (Not Incorporated) | 4 | 14.8% |
| Not-for-profit Organizations | 1 | 3.7% |
| Local Government Employees | 1 | 3.7% |
| State Government Employees | 0 | 0.0% |
| Federal Government Employees | 6 | 22.2% |
| Unpaid Family Workers | 0 | 0.0% |
| Total | 27 | 100.0% |
Employment Status by Age in St Vincent
According to the labor force statistics for St Vincent, out of the total population over 16 years of age (40), 70.0% or 28 individuals are in the labor force, with 3.6% or 1 of them unemployed. The age group with the highest labor force participation rate is 35 to 44 years, with 100.0% or 1 individuals in the labor force. Within the labor force, the 65 to 74 years age range has the highest percentage of unemployed individuals, with 100.0% or 1 of them being unemployed.
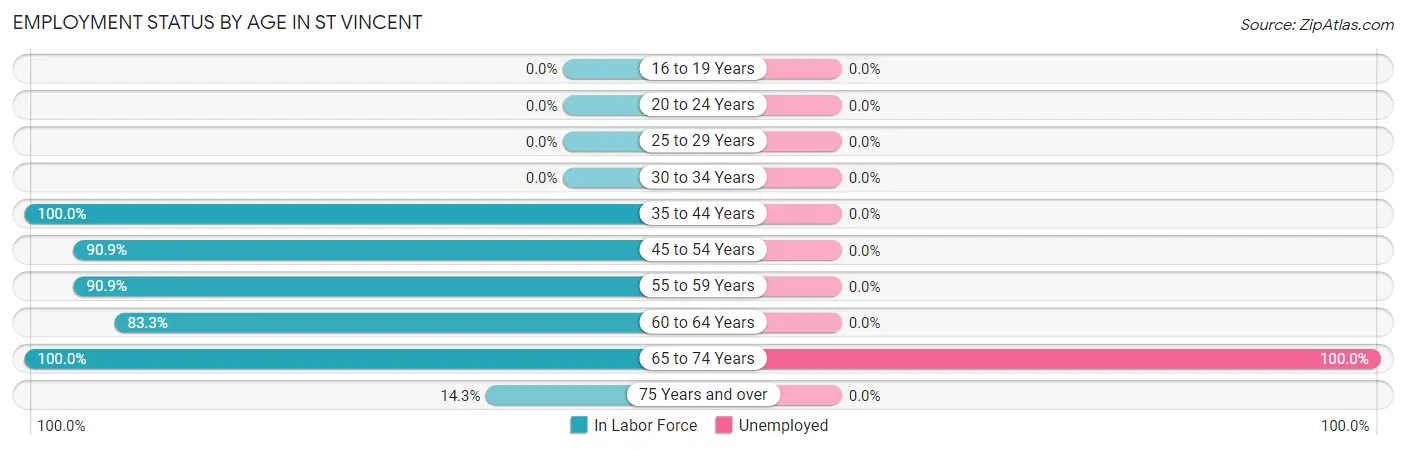
| Age Bracket | In Labor Force | Unemployed |
| 16 to 19 Years | 0 (0.0%) | 0 (0.0%) |
| 20 to 24 Years | 0 (0.0%) | 0 (0.0%) |
| 25 to 29 Years | 0 (0.0%) | 0 (0.0%) |
| 30 to 34 Years | 0 (0.0%) | 0 (0.0%) |
| 35 to 44 Years | 1 (100.0%) | 0 (0.0%) |
| 45 to 54 Years | 10 (90.9%) | 0 (0.0%) |
| 55 to 59 Years | 10 (90.9%) | 0 (0.0%) |
| 60 to 64 Years | 5 (83.3%) | 0 (0.0%) |
| 65 to 74 Years | 1 (100.0%) | 1 (100.0%) |
| 75 Years and over | 1 (14.3%) | 0 (0.0%) |
| Total | 28 (70.0%) | 1 (3.6%) |
Employment Status by Educational Attainment in St Vincent
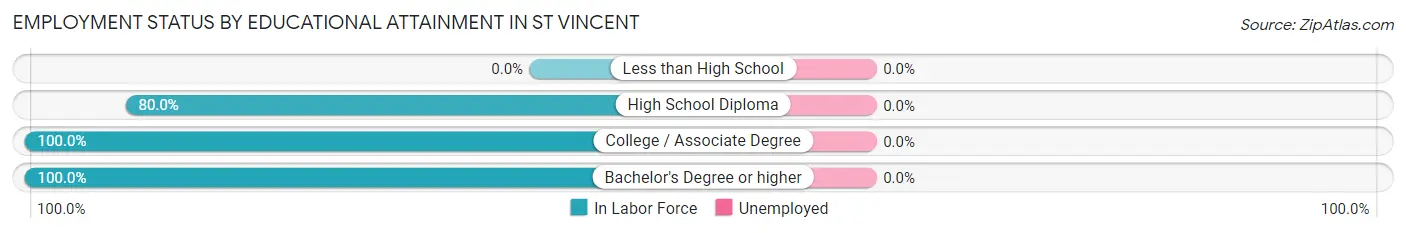
| Educational Attainment | In Labor Force | Unemployed |
| Less than High School | 0 (0.0%) | 0 (0.0%) |
| High School Diploma | 8 (80.0%) | 0 (0.0%) |
| College / Associate Degree | 4 (100.0%) | 0 (0.0%) |
| Bachelor's Degree or higher | 14 (100.0%) | 0 (0.0%) |
| Total | 26 (86.7%) | 0 (0.0%) |
Employment Occupations by Sex in St Vincent
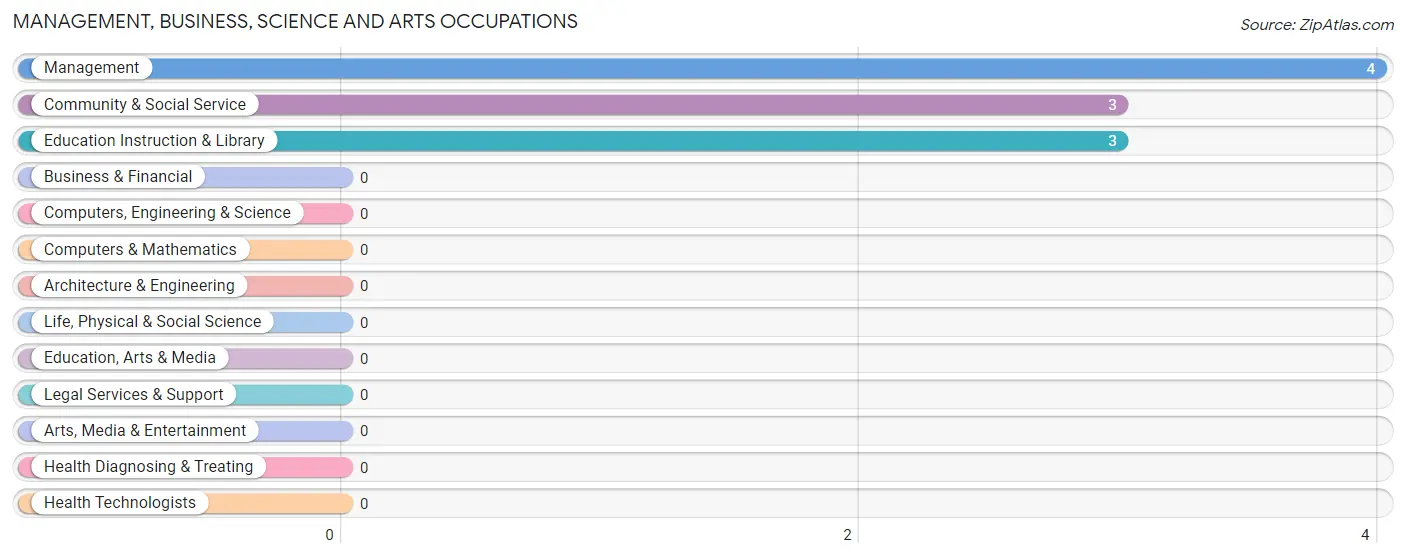
Management, Business, Science and Arts Occupations
The most common Management, Business, Science and Arts occupations in St Vincent are Management (4 | 14.8%), Community & Social Service (3 | 11.1%), and Education Instruction & Library (3 | 11.1%).
Management, Business, Science and Arts Occupations by Sex
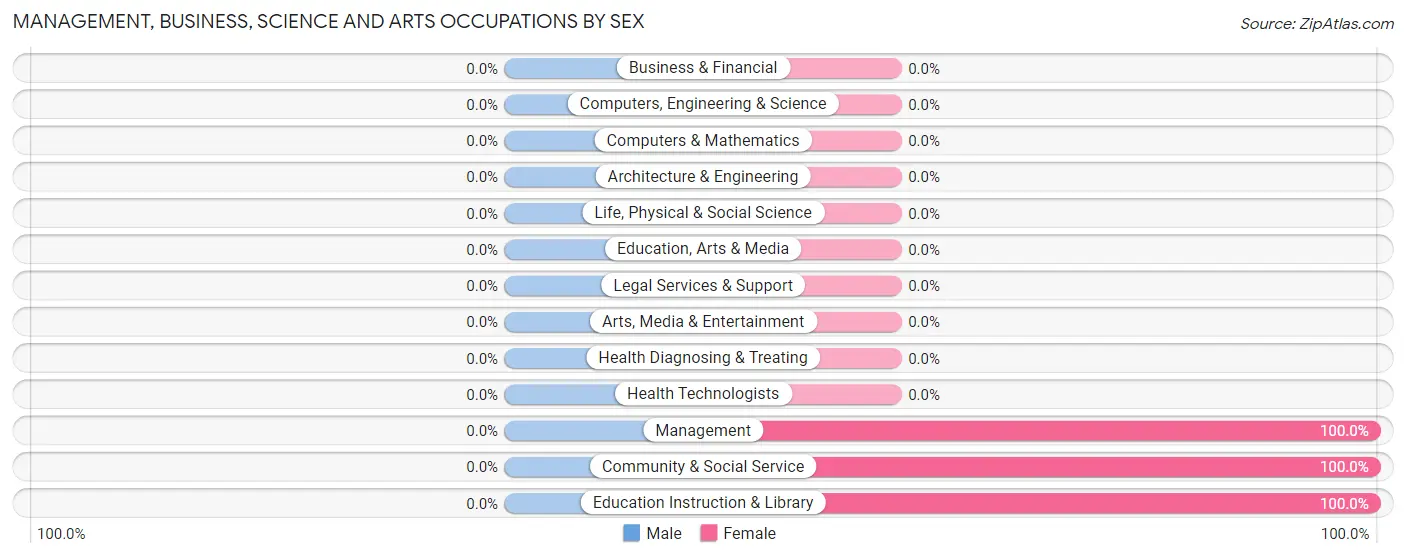
| Occupation | Male | Female |
| Management | 0 (0.0%) | 4 (100.0%) |
| Business & Financial | 0 (0.0%) | 0 (0.0%) |
| Computers, Engineering & Science | 0 (0.0%) | 0 (0.0%) |
| Computers & Mathematics | 0 (0.0%) | 0 (0.0%) |
| Architecture & Engineering | 0 (0.0%) | 0 (0.0%) |
| Life, Physical & Social Science | 0 (0.0%) | 0 (0.0%) |
| Community & Social Service | 0 (0.0%) | 3 (100.0%) |
| Education, Arts & Media | 0 (0.0%) | 0 (0.0%) |
| Legal Services & Support | 0 (0.0%) | 0 (0.0%) |
| Education Instruction & Library | 0 (0.0%) | 3 (100.0%) |
| Arts, Media & Entertainment | 0 (0.0%) | 0 (0.0%) |
| Health Diagnosing & Treating | 0 (0.0%) | 0 (0.0%) |
| Health Technologists | 0 (0.0%) | 0 (0.0%) |
| Total (Category) | 0 (0.0%) | 7 (100.0%) |
| Total (Overall) | 18 (66.7%) | 9 (33.3%) |
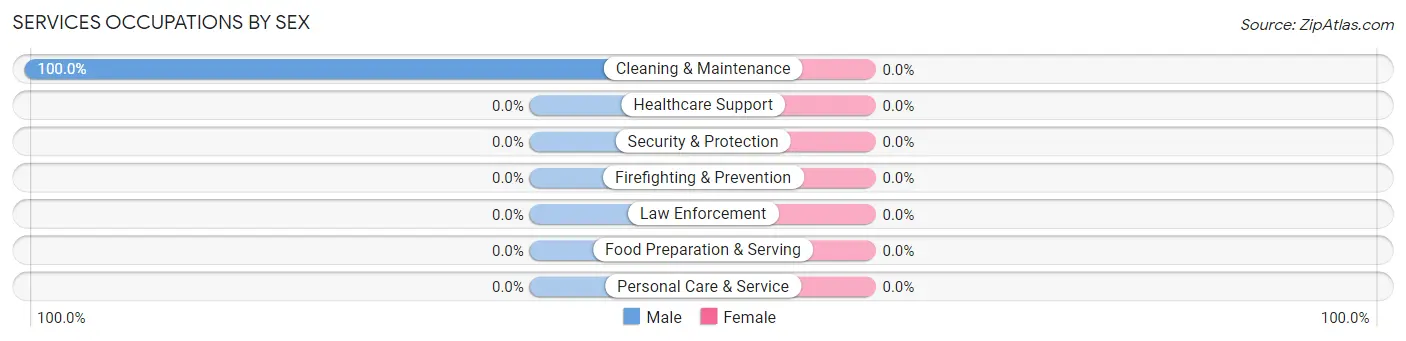
Services Occupations
The most common Services occupations in St Vincent are , and Cleaning & Maintenance (4 | 14.8%).
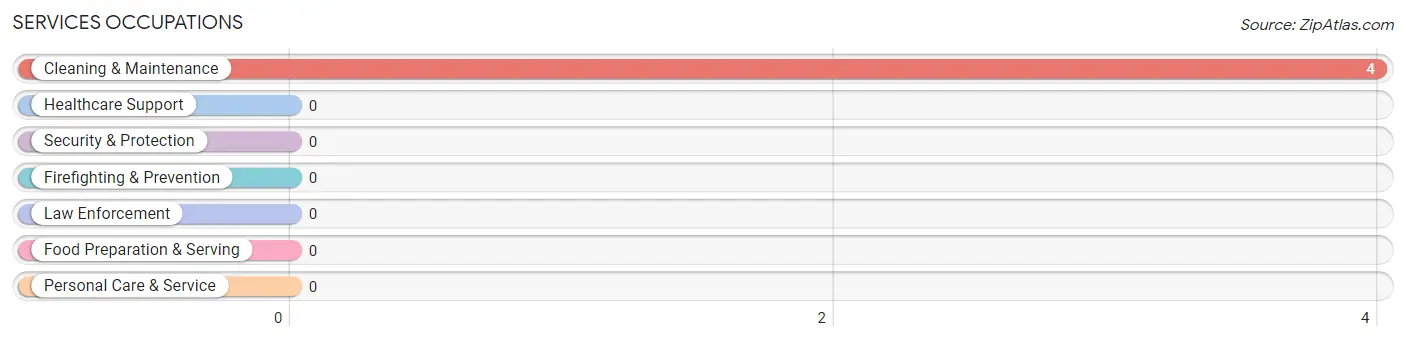
Services Occupations by Sex
| Occupation | Male | Female |
| Healthcare Support | 0 (0.0%) | 0 (0.0%) |
| Security & Protection | 0 (0.0%) | 0 (0.0%) |
| Firefighting & Prevention | 0 (0.0%) | 0 (0.0%) |
| Law Enforcement | 0 (0.0%) | 0 (0.0%) |
| Food Preparation & Serving | 0 (0.0%) | 0 (0.0%) |
| Cleaning & Maintenance | 4 (100.0%) | 0 (0.0%) |
| Personal Care & Service | 0 (0.0%) | 0 (0.0%) |
| Total (Category) | 4 (100.0%) | 0 (0.0%) |
| Total (Overall) | 18 (66.7%) | 9 (33.3%) |
Sales and Office Occupations
The most common Sales and Office occupations in St Vincent are Sales & Related (2 | 7.4%), and Office & Administration (1 | 3.7%).
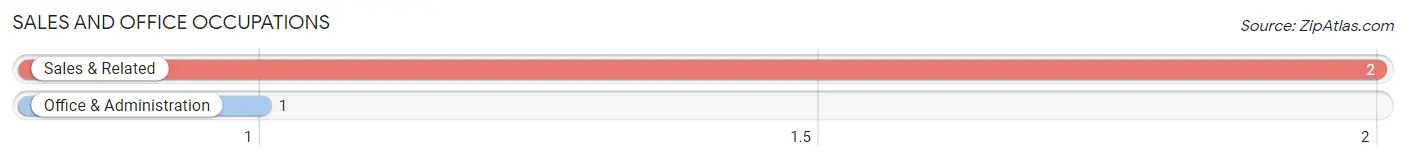
Sales and Office Occupations by Sex
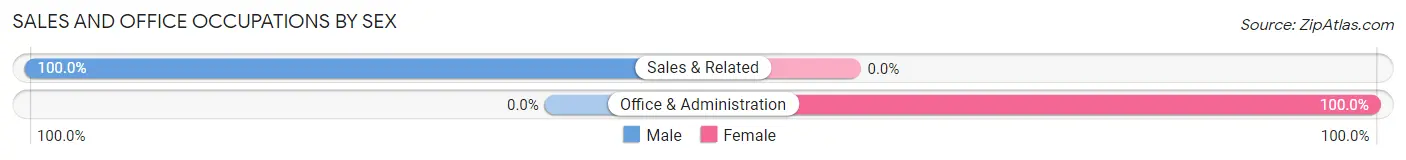
| Occupation | Male | Female |
| Sales & Related | 2 (100.0%) | 0 (0.0%) |
| Office & Administration | 0 (0.0%) | 1 (100.0%) |
| Total (Category) | 2 (66.7%) | 1 (33.3%) |
| Total (Overall) | 18 (66.7%) | 9 (33.3%) |
Natural Resources, Construction and Maintenance Occupations
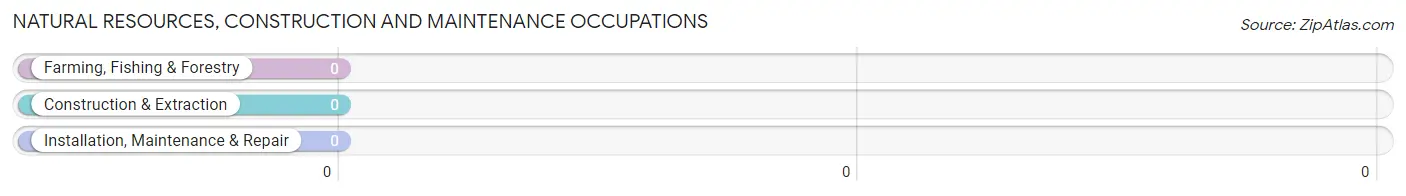
Natural Resources, Construction and Maintenance Occupations by Sex
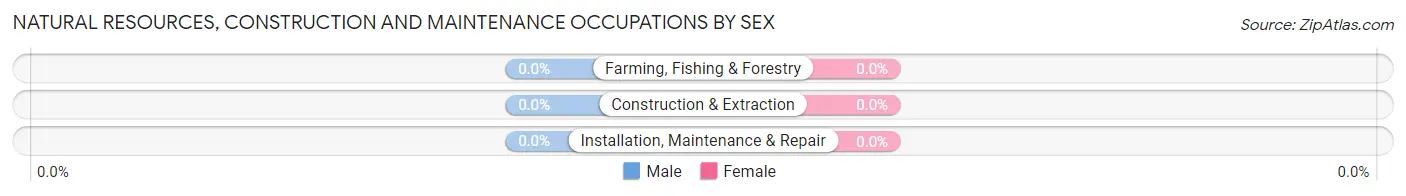
| Occupation | Male | Female |
| Farming, Fishing & Forestry | 0 (0.0%) | 0 (0.0%) |
| Construction & Extraction | 0 (0.0%) | 0 (0.0%) |
| Installation, Maintenance & Repair | 0 (0.0%) | 0 (0.0%) |
| Total (Category) | 0 (0.0%) | 0 (0.0%) |
| Total (Overall) | 18 (66.7%) | 9 (33.3%) |
Production, Transportation and Moving Occupations
The most common Production, Transportation and Moving occupations in St Vincent are Material Moving (5 | 18.5%), Production (4 | 14.8%), and Transportation (4 | 14.8%).
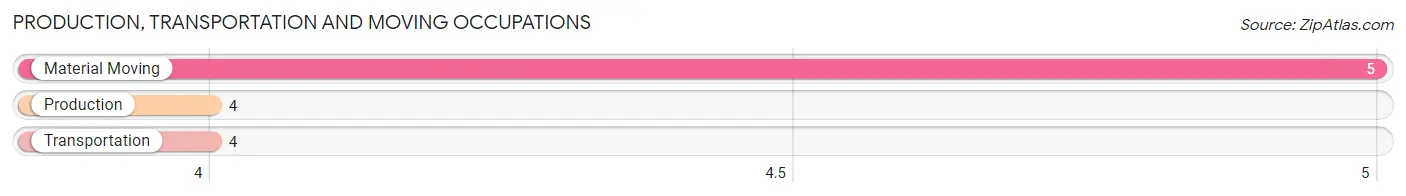
Production, Transportation and Moving Occupations by Sex
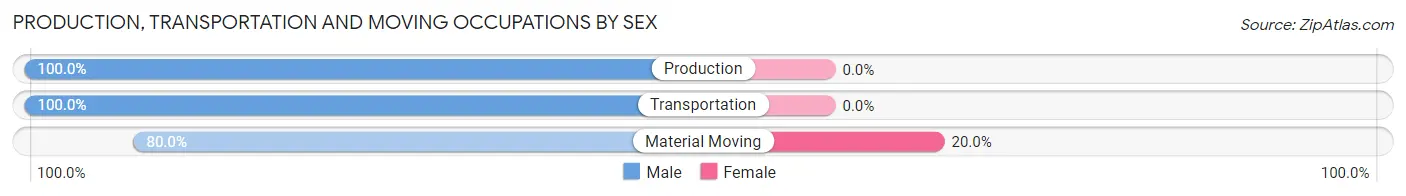
| Occupation | Male | Female |
| Production | 4 (100.0%) | 0 (0.0%) |
| Transportation | 4 (100.0%) | 0 (0.0%) |
| Material Moving | 4 (80.0%) | 1 (20.0%) |
| Total (Category) | 12 (92.3%) | 1 (7.7%) |
| Total (Overall) | 18 (66.7%) | 9 (33.3%) |
Employment Industries by Sex in St Vincent
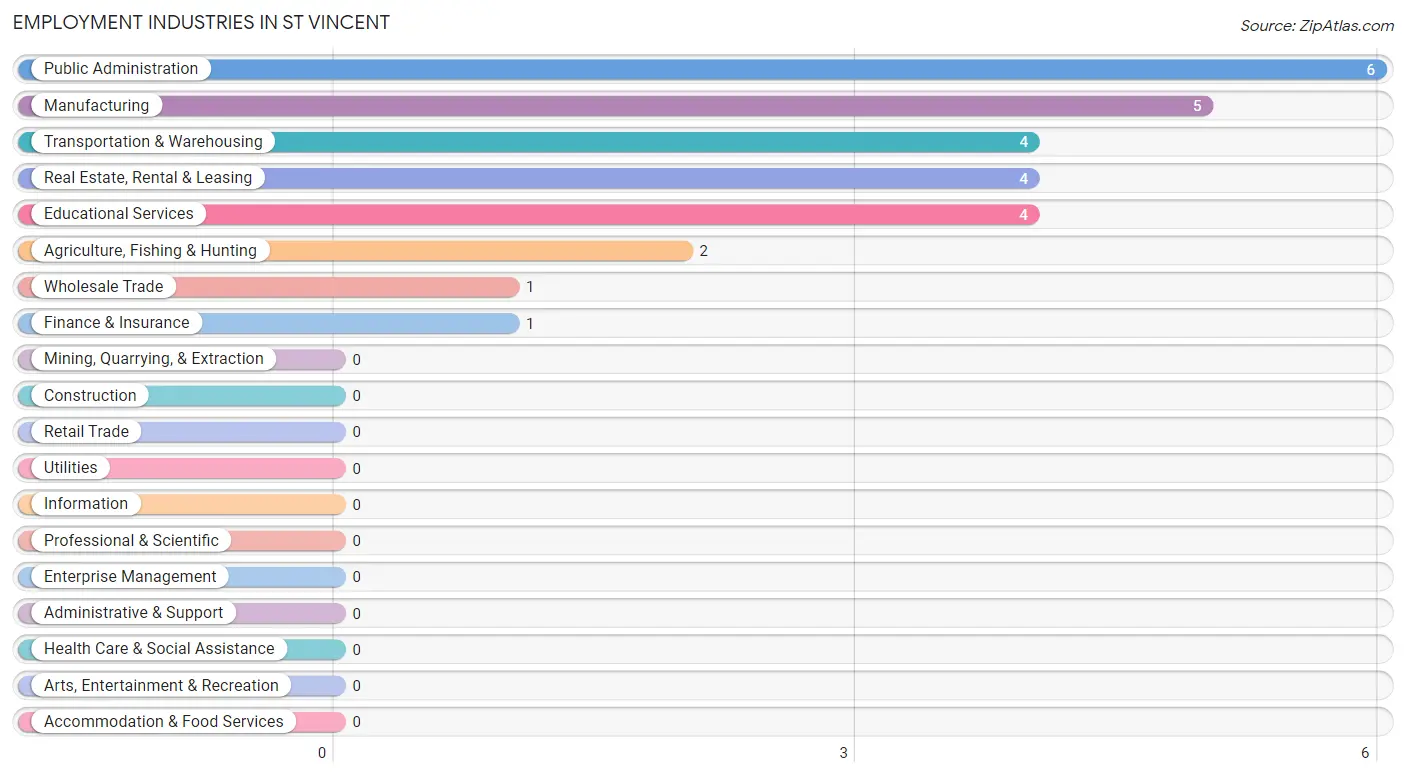
Employment Industries in St Vincent
The major employment industries in St Vincent include Public Administration (6 | 22.2%), Manufacturing (5 | 18.5%), Transportation & Warehousing (4 | 14.8%), Real Estate, Rental & Leasing (4 | 14.8%), and Educational Services (4 | 14.8%).
Employment Industries by Sex in St Vincent
The St Vincent industries that see more men than women are Agriculture, Fishing & Hunting (100.0%), Manufacturing (100.0%), and Transportation & Warehousing (100.0%), whereas the industries that tend to have a higher number of women are Wholesale Trade (100.0%), Finance & Insurance (100.0%), and Real Estate, Rental & Leasing (100.0%).
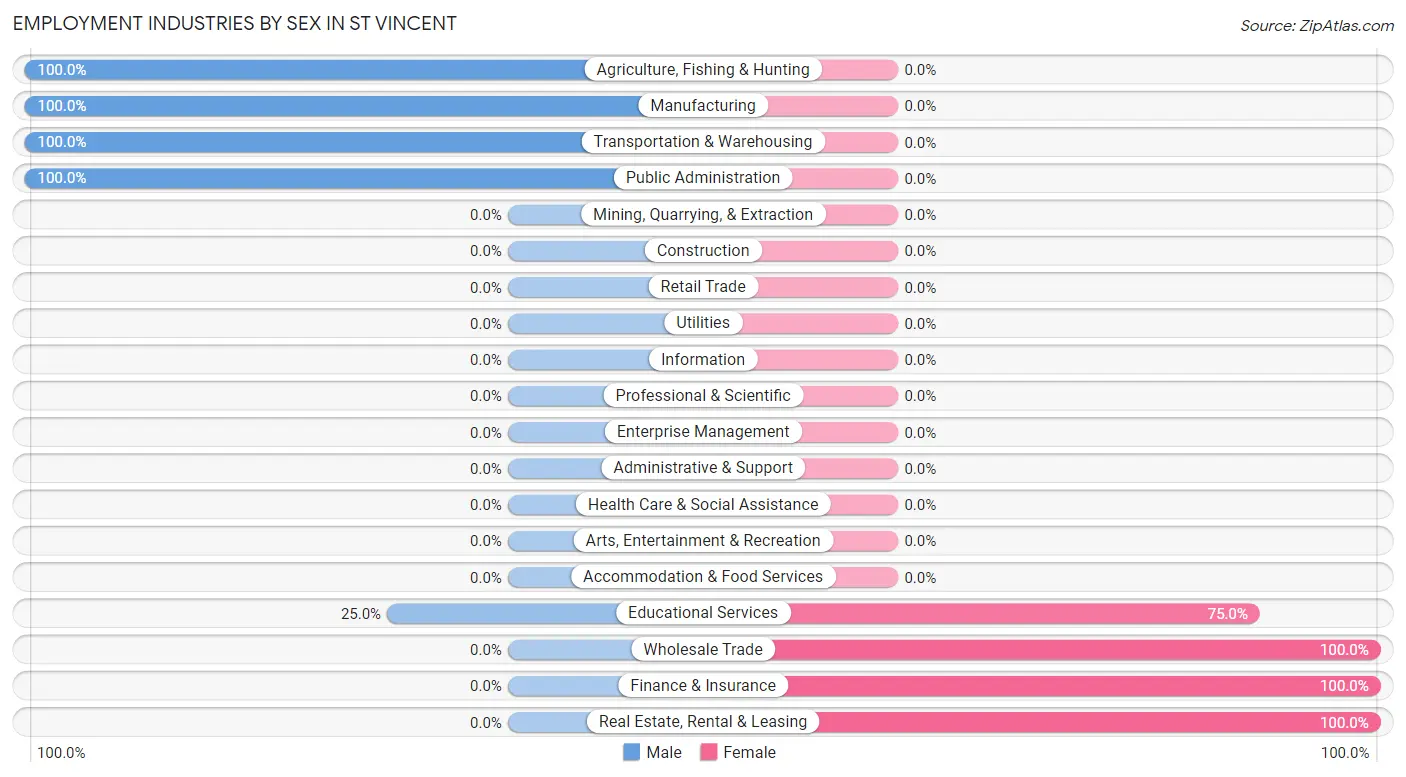
| Industry | Male | Female |
| Agriculture, Fishing & Hunting | 2 (100.0%) | 0 (0.0%) |
| Mining, Quarrying, & Extraction | 0 (0.0%) | 0 (0.0%) |
| Construction | 0 (0.0%) | 0 (0.0%) |
| Manufacturing | 5 (100.0%) | 0 (0.0%) |
| Wholesale Trade | 0 (0.0%) | 1 (100.0%) |
| Retail Trade | 0 (0.0%) | 0 (0.0%) |
| Transportation & Warehousing | 4 (100.0%) | 0 (0.0%) |
| Utilities | 0 (0.0%) | 0 (0.0%) |
| Information | 0 (0.0%) | 0 (0.0%) |
| Finance & Insurance | 0 (0.0%) | 1 (100.0%) |
| Real Estate, Rental & Leasing | 0 (0.0%) | 4 (100.0%) |
| Professional & Scientific | 0 (0.0%) | 0 (0.0%) |
| Enterprise Management | 0 (0.0%) | 0 (0.0%) |
| Administrative & Support | 0 (0.0%) | 0 (0.0%) |
| Educational Services | 1 (25.0%) | 3 (75.0%) |
| Health Care & Social Assistance | 0 (0.0%) | 0 (0.0%) |
| Arts, Entertainment & Recreation | 0 (0.0%) | 0 (0.0%) |
| Accommodation & Food Services | 0 (0.0%) | 0 (0.0%) |
| Public Administration | 6 (100.0%) | 0 (0.0%) |
| Total | 18 (66.7%) | 9 (33.3%) |
Education in St Vincent
School Enrollment in St Vincent
The most common levels of schooling among the 4 students in St Vincent are middle school (3 | 75.0%), and high school (1 | 25.0%).
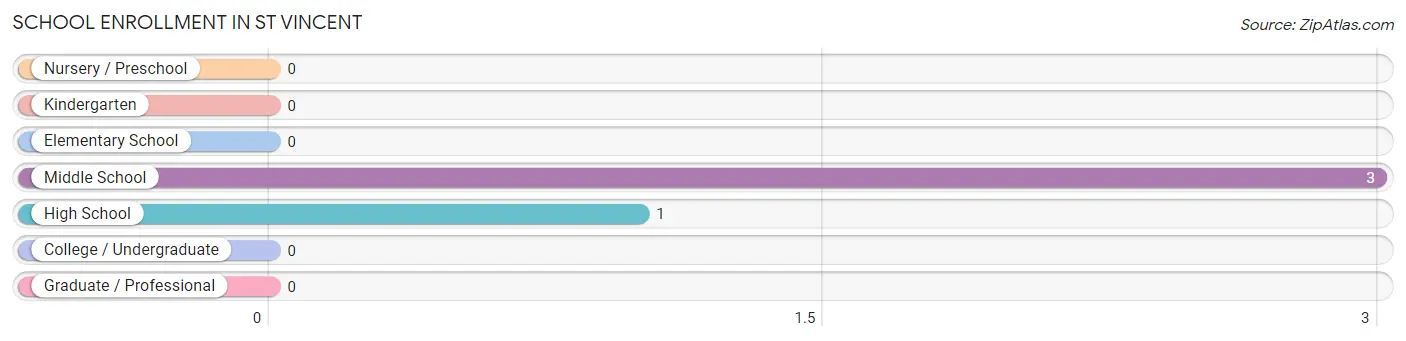
| School Level | # Students | % Students |
| Nursery / Preschool | 0 | 0.0% |
| Kindergarten | 0 | 0.0% |
| Elementary School | 0 | 0.0% |
| Middle School | 3 | 75.0% |
| High School | 1 | 25.0% |
| College / Undergraduate | 0 | 0.0% |
| Graduate / Professional | 0 | 0.0% |
| Total | 4 | 100.0% |
School Enrollment by Age by Funding Source in St Vincent
Out of a total of 4 students who are enrolled in schools in St Vincent, 2 (50.0%) attend a private institution, while the remaining 2 (50.0%) are enrolled in public schools. The age group of 10 to 14 year olds has the highest likelihood of being enrolled in private schools, with 2 (66.7% in the age bracket) enrolled. Conversely, the age group of 15 to 17 year olds has the lowest likelihood of being enrolled in a private school, with 1 (100.0% in the age bracket) attending a public institution.
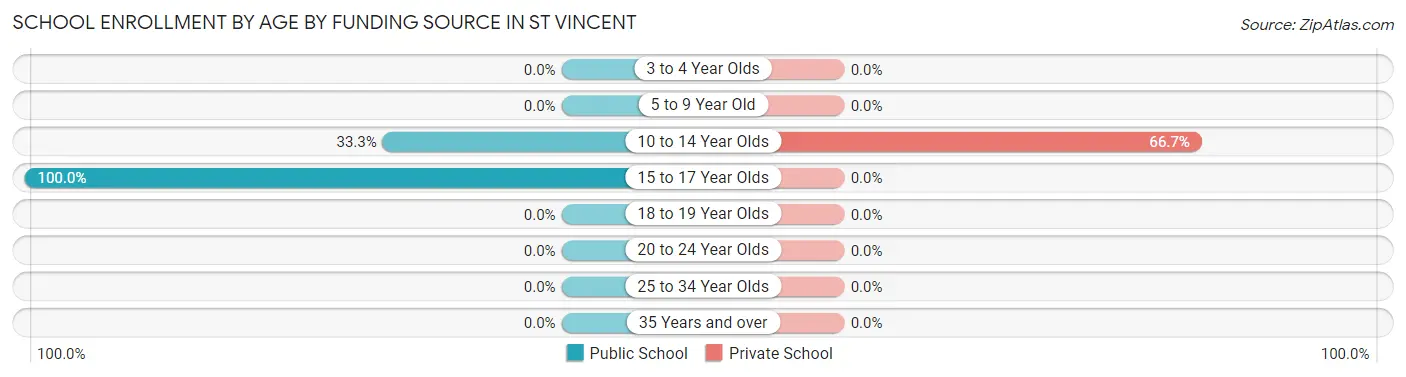
| Age Bracket | Public School | Private School |
| 3 to 4 Year Olds | 0 (0.0%) | 0 (0.0%) |
| 5 to 9 Year Old | 0 (0.0%) | 0 (0.0%) |
| 10 to 14 Year Olds | 1 (33.3%) | 2 (66.7%) |
| 15 to 17 Year Olds | 1 (100.0%) | 0 (0.0%) |
| 18 to 19 Year Olds | 0 (0.0%) | 0 (0.0%) |
| 20 to 24 Year Olds | 0 (0.0%) | 0 (0.0%) |
| 25 to 34 Year Olds | 0 (0.0%) | 0 (0.0%) |
| 35 Years and over | 0 (0.0%) | 0 (0.0%) |
| Total | 2 (50.0%) | 2 (50.0%) |
Educational Attainment by Field of Study in St Vincent
Science & technology (8 | 57.1%), education (4 | 28.6%), and computers & mathematics (2 | 14.3%) are the most common fields of study among 14 individuals in St Vincent who have obtained a bachelor's degree or higher.
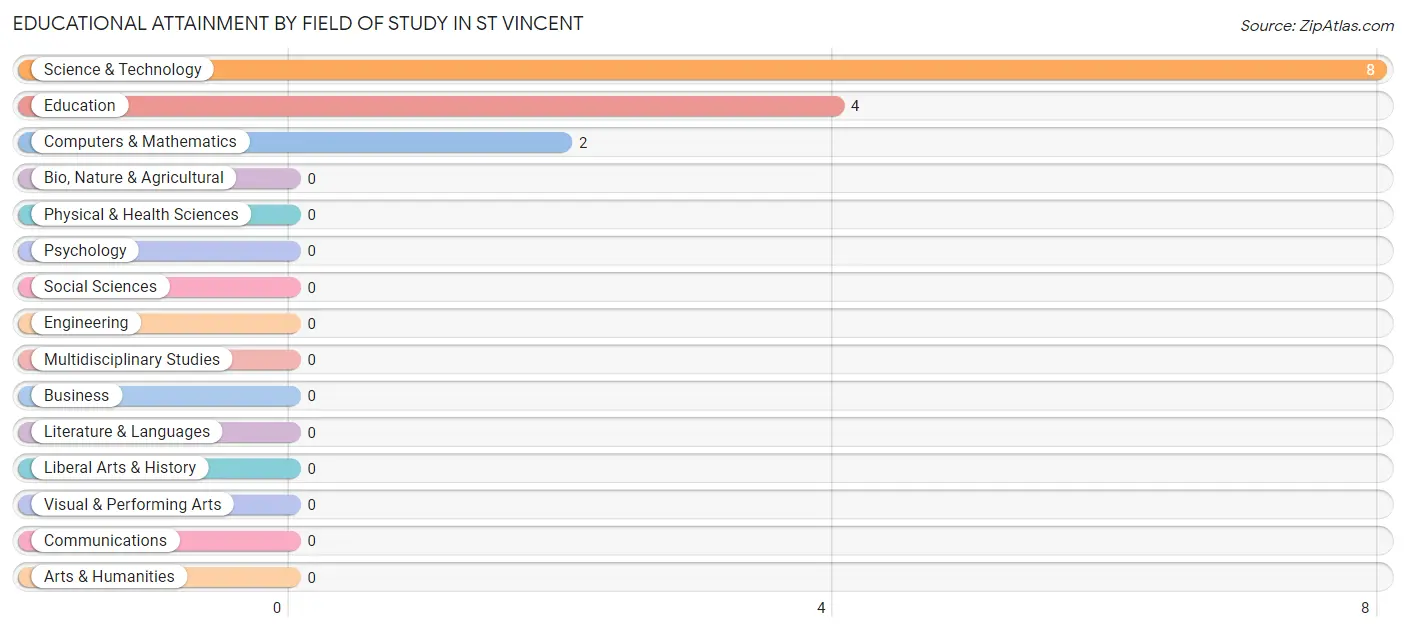
| Field of Study | # Graduates | % Graduates |
| Computers & Mathematics | 2 | 14.3% |
| Bio, Nature & Agricultural | 0 | 0.0% |
| Physical & Health Sciences | 0 | 0.0% |
| Psychology | 0 | 0.0% |
| Social Sciences | 0 | 0.0% |
| Engineering | 0 | 0.0% |
| Multidisciplinary Studies | 0 | 0.0% |
| Science & Technology | 8 | 57.1% |
| Business | 0 | 0.0% |
| Education | 4 | 28.6% |
| Literature & Languages | 0 | 0.0% |
| Liberal Arts & History | 0 | 0.0% |
| Visual & Performing Arts | 0 | 0.0% |
| Communications | 0 | 0.0% |
| Arts & Humanities | 0 | 0.0% |
| Total | 14 | 100.0% |
Transportation & Commute in St Vincent
Vehicle Availability by Sex in St Vincent
The most prevalent vehicle ownership categories in St Vincent are males with 2 vehicles (13, accounting for 72.2%) and females with 2 vehicles (7, making up 144.4%).
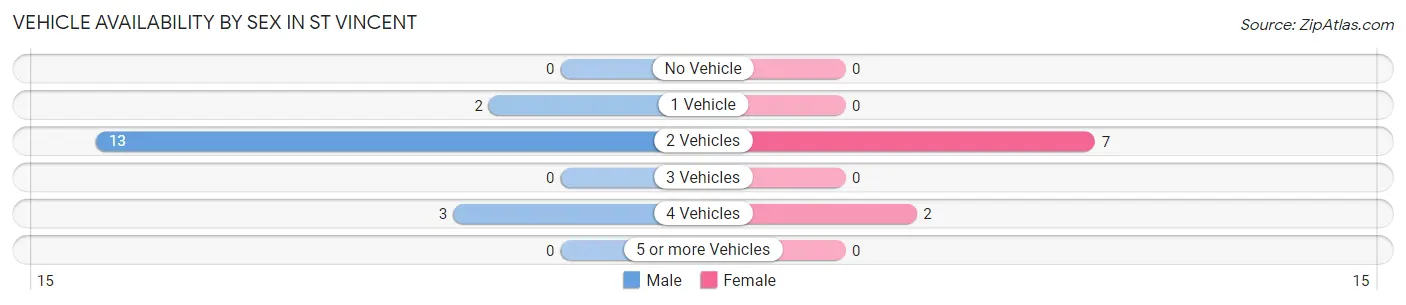
| Vehicles Available | Male | Female |
| No Vehicle | 0 (0.0%) | 0 (0.0%) |
| 1 Vehicle | 2 (11.1%) | 0 (0.0%) |
| 2 Vehicles | 13 (72.2%) | 7 (77.8%) |
| 3 Vehicles | 0 (0.0%) | 0 (0.0%) |
| 4 Vehicles | 3 (16.7%) | 2 (22.2%) |
| 5 or more Vehicles | 0 (0.0%) | 0 (0.0%) |
| Total | 18 (100.0%) | 9 (100.0%) |
Commute Time in St Vincent
The most frequently occuring commute durations in St Vincent are 5 to 9 minutes (12 commuters, 52.2%), 10 to 14 minutes (4 commuters, 17.4%), and less than 5 minutes (2 commuters, 8.7%).
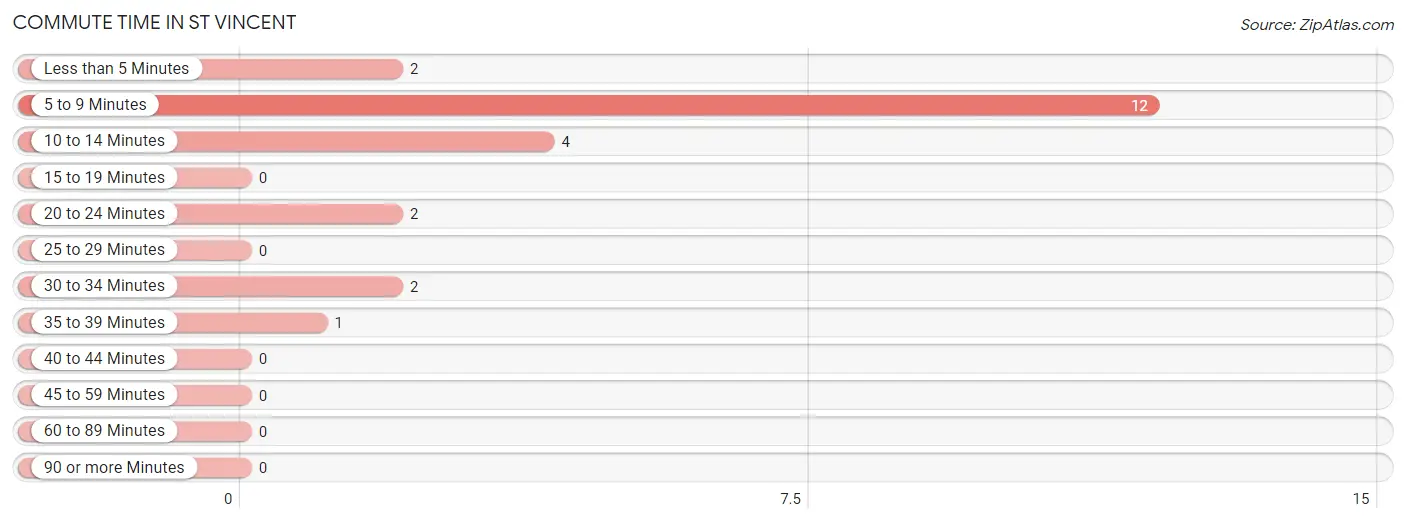
| Commute Time | # Commuters | % Commuters |
| Less than 5 Minutes | 2 | 8.7% |
| 5 to 9 Minutes | 12 | 52.2% |
| 10 to 14 Minutes | 4 | 17.4% |
| 15 to 19 Minutes | 0 | 0.0% |
| 20 to 24 Minutes | 2 | 8.7% |
| 25 to 29 Minutes | 0 | 0.0% |
| 30 to 34 Minutes | 2 | 8.7% |
| 35 to 39 Minutes | 1 | 4.3% |
| 40 to 44 Minutes | 0 | 0.0% |
| 45 to 59 Minutes | 0 | 0.0% |
| 60 to 89 Minutes | 0 | 0.0% |
| 90 or more Minutes | 0 | 0.0% |
Commute Time by Sex in St Vincent
The most common commute times in St Vincent are 5 to 9 minutes (10 commuters, 55.6%) for males and less than 5 minutes (2 commuters, 40.0%) for females.
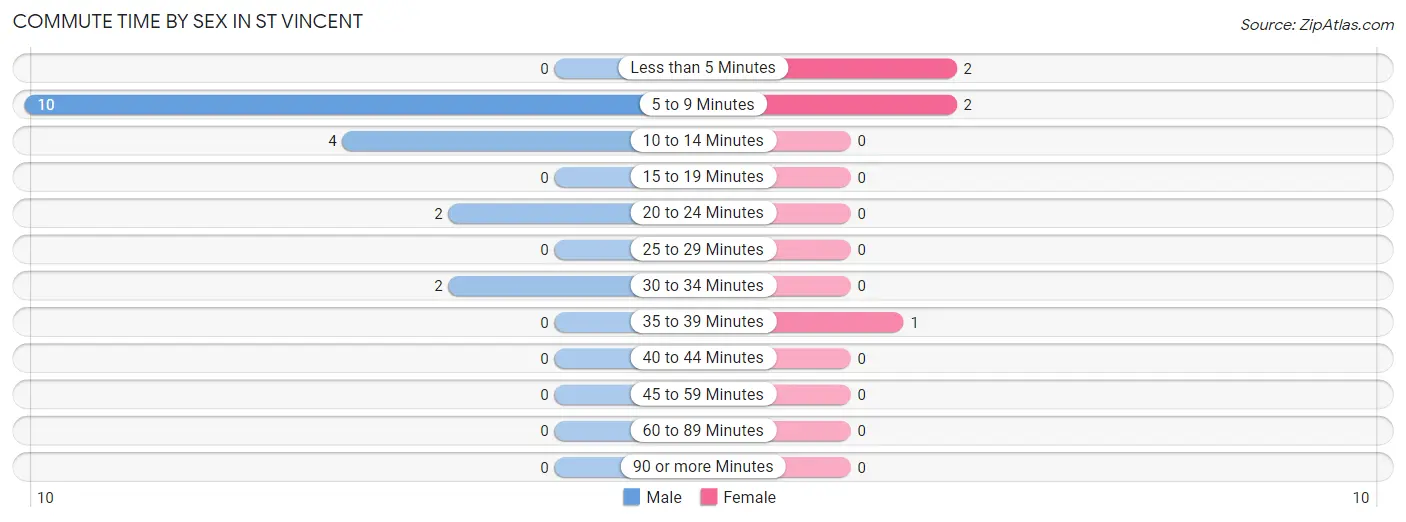
| Commute Time | Male | Female |
| Less than 5 Minutes | 0 (0.0%) | 2 (40.0%) |
| 5 to 9 Minutes | 10 (55.6%) | 2 (40.0%) |
| 10 to 14 Minutes | 4 (22.2%) | 0 (0.0%) |
| 15 to 19 Minutes | 0 (0.0%) | 0 (0.0%) |
| 20 to 24 Minutes | 2 (11.1%) | 0 (0.0%) |
| 25 to 29 Minutes | 0 (0.0%) | 0 (0.0%) |
| 30 to 34 Minutes | 2 (11.1%) | 0 (0.0%) |
| 35 to 39 Minutes | 0 (0.0%) | 1 (20.0%) |
| 40 to 44 Minutes | 0 (0.0%) | 0 (0.0%) |
| 45 to 59 Minutes | 0 (0.0%) | 0 (0.0%) |
| 60 to 89 Minutes | 0 (0.0%) | 0 (0.0%) |
| 90 or more Minutes | 0 (0.0%) | 0 (0.0%) |
Time of Departure to Work by Sex in St Vincent
The most frequent times of departure to work in St Vincent are 7:30 AM to 7:59 AM (4, 22.2%) for males and 7:00 AM to 7:29 AM (2, 40.0%) for females.
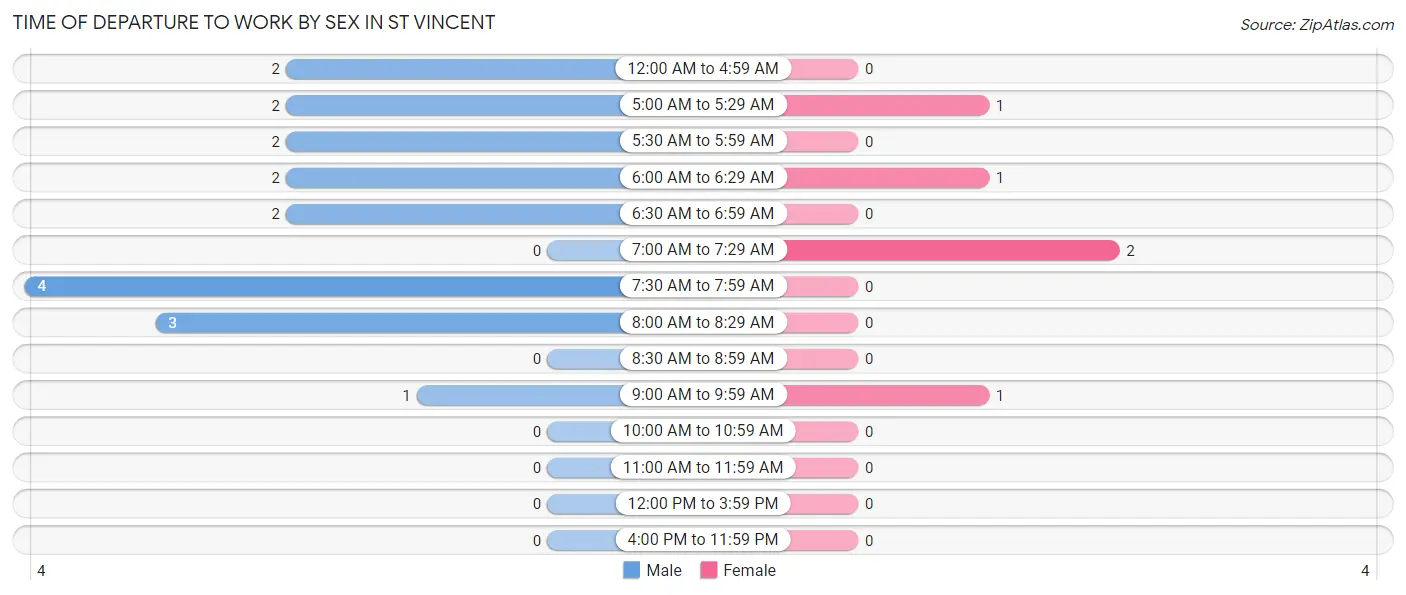
| Time of Departure | Male | Female |
| 12:00 AM to 4:59 AM | 2 (11.1%) | 0 (0.0%) |
| 5:00 AM to 5:29 AM | 2 (11.1%) | 1 (20.0%) |
| 5:30 AM to 5:59 AM | 2 (11.1%) | 0 (0.0%) |
| 6:00 AM to 6:29 AM | 2 (11.1%) | 1 (20.0%) |
| 6:30 AM to 6:59 AM | 2 (11.1%) | 0 (0.0%) |
| 7:00 AM to 7:29 AM | 0 (0.0%) | 2 (40.0%) |
| 7:30 AM to 7:59 AM | 4 (22.2%) | 0 (0.0%) |
| 8:00 AM to 8:29 AM | 3 (16.7%) | 0 (0.0%) |
| 8:30 AM to 8:59 AM | 0 (0.0%) | 0 (0.0%) |
| 9:00 AM to 9:59 AM | 1 (5.6%) | 1 (20.0%) |
| 10:00 AM to 10:59 AM | 0 (0.0%) | 0 (0.0%) |
| 11:00 AM to 11:59 AM | 0 (0.0%) | 0 (0.0%) |
| 12:00 PM to 3:59 PM | 0 (0.0%) | 0 (0.0%) |
| 4:00 PM to 11:59 PM | 0 (0.0%) | 0 (0.0%) |
| Total | 18 (100.0%) | 5 (100.0%) |
Housing Occupancy in St Vincent
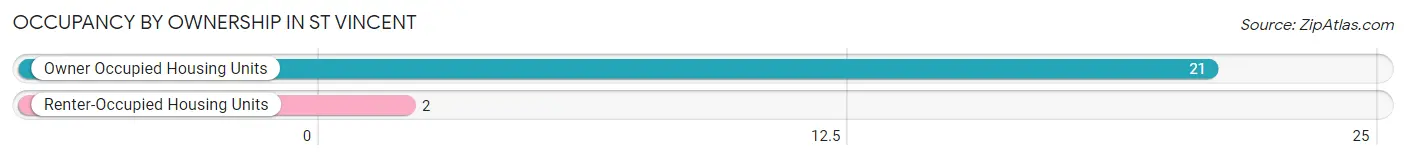
Occupancy by Ownership in St Vincent
Of the total 23 dwellings in St Vincent, owner-occupied units account for 21 (91.3%), while renter-occupied units make up 2 (8.7%).
| Occupancy | # Housing Units | % Housing Units |
| Owner Occupied Housing Units | 21 | 91.3% |
| Renter-Occupied Housing Units | 2 | 8.7% |
| Total Occupied Housing Units | 23 | 100.0% |
Occupancy by Household Size in St Vincent
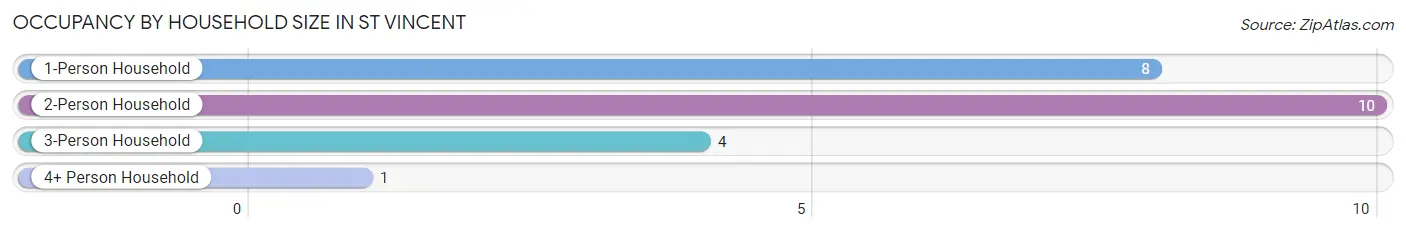
| Household Size | # Housing Units | % Housing Units |
| 1-Person Household | 8 | 34.8% |
| 2-Person Household | 10 | 43.5% |
| 3-Person Household | 4 | 17.4% |
| 4+ Person Household | 1 | 4.3% |
| Total Housing Units | 23 | 100.0% |
Occupancy by Ownership by Household Size in St Vincent
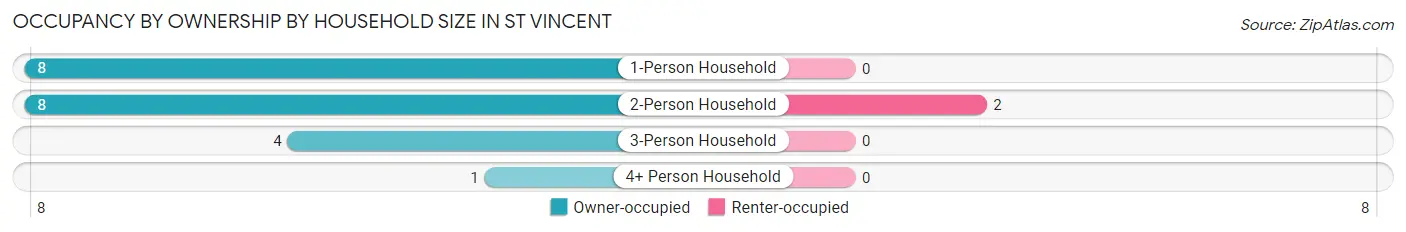
| Household Size | Owner-occupied | Renter-occupied |
| 1-Person Household | 8 (100.0%) | 0 (0.0%) |
| 2-Person Household | 8 (80.0%) | 2 (20.0%) |
| 3-Person Household | 4 (100.0%) | 0 (0.0%) |
| 4+ Person Household | 1 (100.0%) | 0 (0.0%) |
| Total Housing Units | 21 (91.3%) | 2 (8.7%) |
Occupancy by Educational Attainment in St Vincent
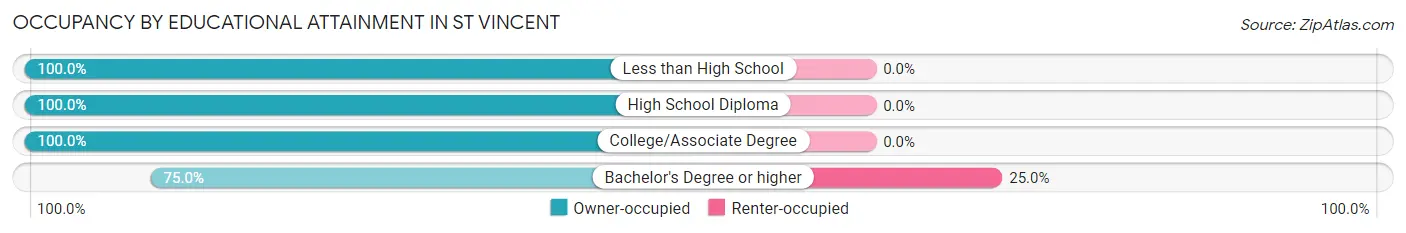
| Household Size | Owner-occupied | Renter-occupied |
| Less than High School | 2 (100.0%) | 0 (0.0%) |
| High School Diploma | 9 (100.0%) | 0 (0.0%) |
| College/Associate Degree | 4 (100.0%) | 0 (0.0%) |
| Bachelor's Degree or higher | 6 (75.0%) | 2 (25.0%) |
Occupancy by Age of Householder in St Vincent
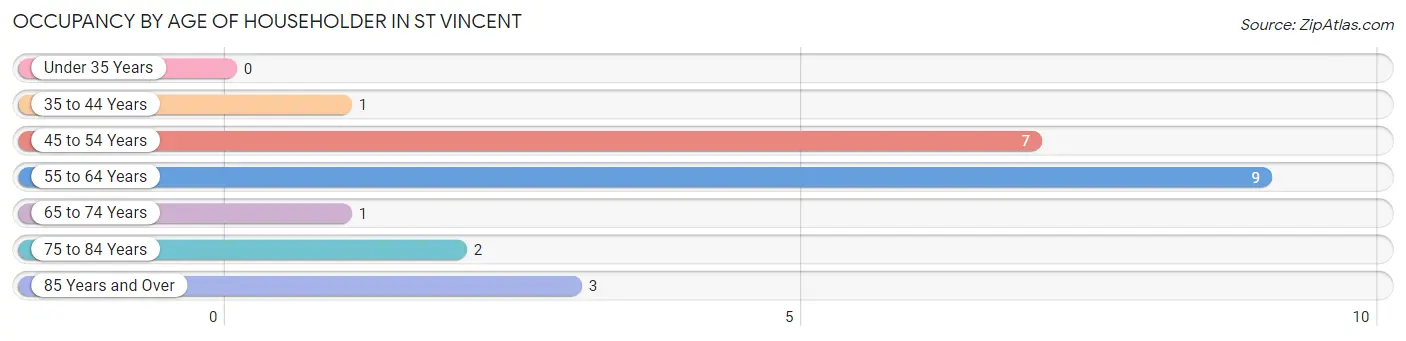
| Age Bracket | # Households | % Households |
| Under 35 Years | 0 | 0.0% |
| 35 to 44 Years | 1 | 4.3% |
| 45 to 54 Years | 7 | 30.4% |
| 55 to 64 Years | 9 | 39.1% |
| 65 to 74 Years | 1 | 4.3% |
| 75 to 84 Years | 2 | 8.7% |
| 85 Years and Over | 3 | 13.0% |
| Total | 23 | 100.0% |
Housing Finances in St Vincent
Median Income by Occupancy in St Vincent
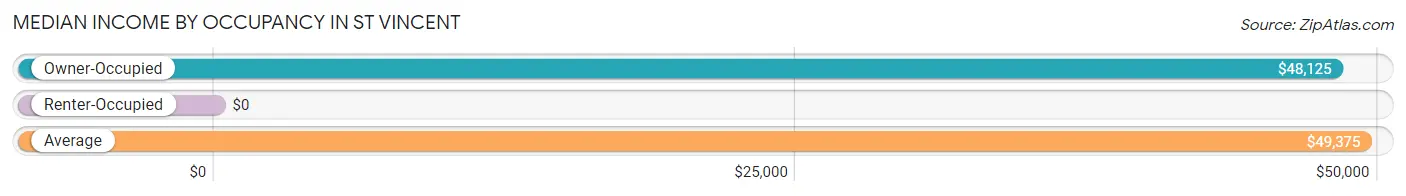
| Occupancy Type | # Households | Median Income |
| Owner-Occupied | 21 (91.3%) | $48,125 |
| Renter-Occupied | 2 (8.7%) | $0 |
| Average | 23 (100.0%) | $49,375 |
Occupancy by Householder Income Bracket in St Vincent
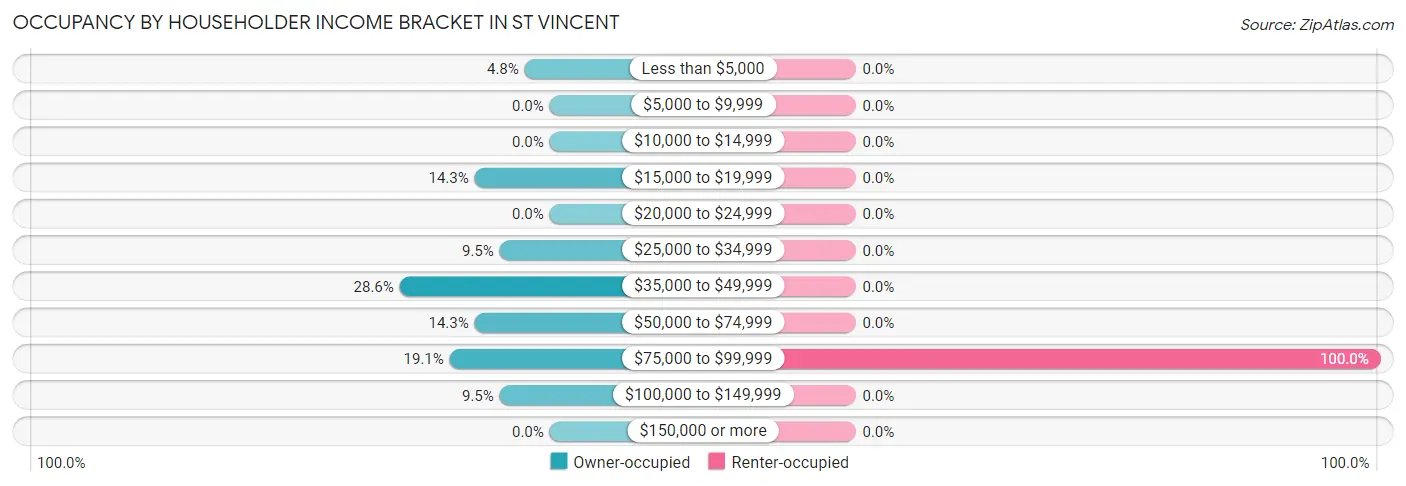
| Income Bracket | Owner-occupied | Renter-occupied |
| Less than $5,000 | 1 (4.8%) | 0 (0.0%) |
| $5,000 to $9,999 | 0 (0.0%) | 0 (0.0%) |
| $10,000 to $14,999 | 0 (0.0%) | 0 (0.0%) |
| $15,000 to $19,999 | 3 (14.3%) | 0 (0.0%) |
| $20,000 to $24,999 | 0 (0.0%) | 0 (0.0%) |
| $25,000 to $34,999 | 2 (9.5%) | 0 (0.0%) |
| $35,000 to $49,999 | 6 (28.6%) | 0 (0.0%) |
| $50,000 to $74,999 | 3 (14.3%) | 0 (0.0%) |
| $75,000 to $99,999 | 4 (19.1%) | 2 (100.0%) |
| $100,000 to $149,999 | 2 (9.5%) | 0 (0.0%) |
| $150,000 or more | 0 (0.0%) | 0 (0.0%) |
| Total | 21 (100.0%) | 2 (100.0%) |
Monthly Housing Cost Tiers in St Vincent
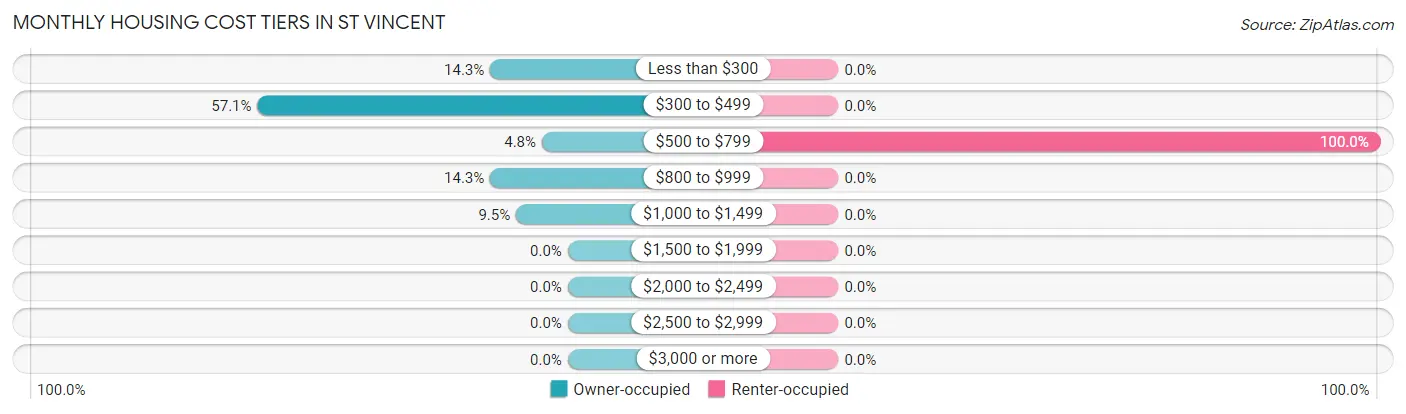
| Monthly Cost | Owner-occupied | Renter-occupied |
| Less than $300 | 3 (14.3%) | 0 (0.0%) |
| $300 to $499 | 12 (57.1%) | 0 (0.0%) |
| $500 to $799 | 1 (4.8%) | 2 (100.0%) |
| $800 to $999 | 3 (14.3%) | 0 (0.0%) |
| $1,000 to $1,499 | 2 (9.5%) | 0 (0.0%) |
| $1,500 to $1,999 | 0 (0.0%) | 0 (0.0%) |
| $2,000 to $2,499 | 0 (0.0%) | 0 (0.0%) |
| $2,500 to $2,999 | 0 (0.0%) | 0 (0.0%) |
| $3,000 or more | 0 (0.0%) | 0 (0.0%) |
| Total | 21 (100.0%) | 2 (100.0%) |
Physical Housing Characteristics in St Vincent
Housing Structures in St Vincent
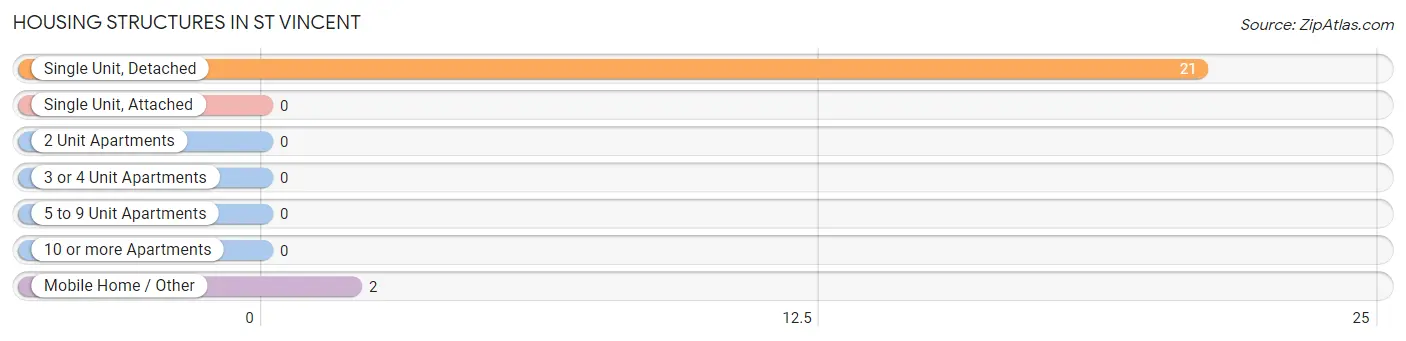
| Structure Type | # Housing Units | % Housing Units |
| Single Unit, Detached | 21 | 91.3% |
| Single Unit, Attached | 0 | 0.0% |
| 2 Unit Apartments | 0 | 0.0% |
| 3 or 4 Unit Apartments | 0 | 0.0% |
| 5 to 9 Unit Apartments | 0 | 0.0% |
| 10 or more Apartments | 0 | 0.0% |
| Mobile Home / Other | 2 | 8.7% |
| Total | 23 | 100.0% |
Housing Structures by Occupancy in St Vincent
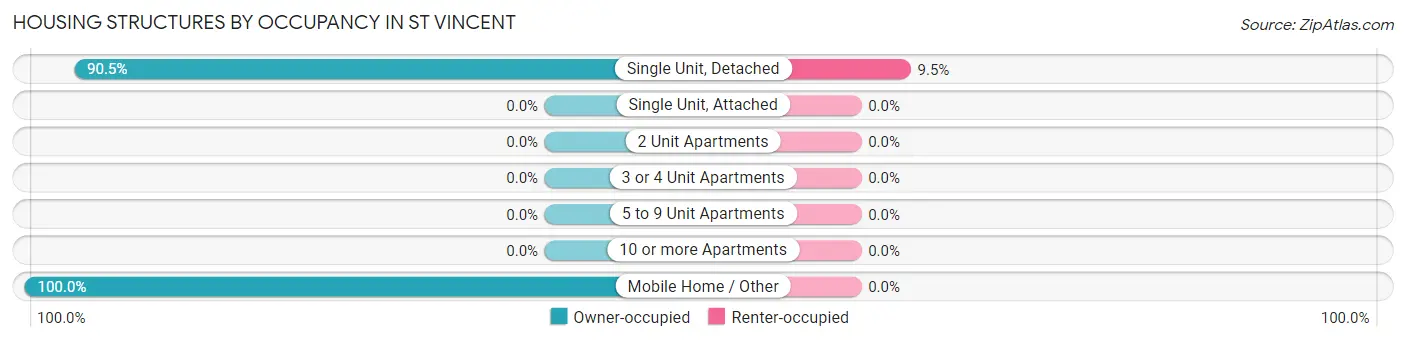
| Structure Type | Owner-occupied | Renter-occupied |
| Single Unit, Detached | 19 (90.5%) | 2 (9.5%) |
| Single Unit, Attached | 0 (0.0%) | 0 (0.0%) |
| 2 Unit Apartments | 0 (0.0%) | 0 (0.0%) |
| 3 or 4 Unit Apartments | 0 (0.0%) | 0 (0.0%) |
| 5 to 9 Unit Apartments | 0 (0.0%) | 0 (0.0%) |
| 10 or more Apartments | 0 (0.0%) | 0 (0.0%) |
| Mobile Home / Other | 2 (100.0%) | 0 (0.0%) |
| Total | 21 (91.3%) | 2 (8.7%) |
Housing Structures by Number of Rooms in St Vincent
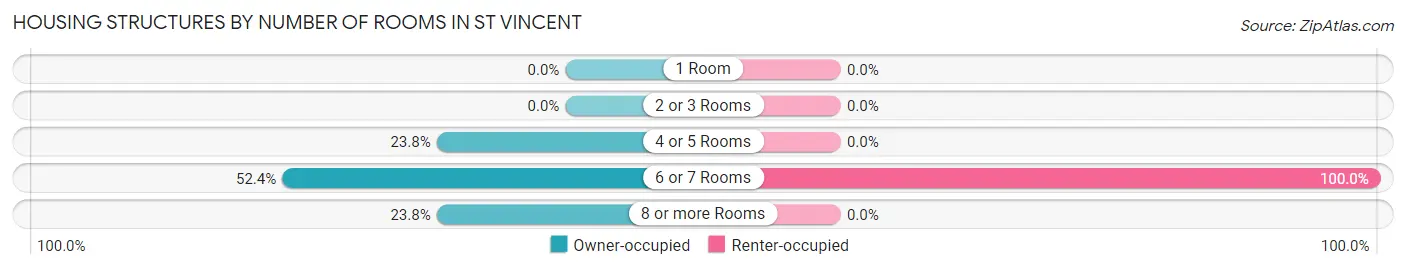
| Number of Rooms | Owner-occupied | Renter-occupied |
| 1 Room | 0 (0.0%) | 0 (0.0%) |
| 2 or 3 Rooms | 0 (0.0%) | 0 (0.0%) |
| 4 or 5 Rooms | 5 (23.8%) | 0 (0.0%) |
| 6 or 7 Rooms | 11 (52.4%) | 2 (100.0%) |
| 8 or more Rooms | 5 (23.8%) | 0 (0.0%) |
| Total | 21 (100.0%) | 2 (100.0%) |
Housing Structure by Heating Type in St Vincent
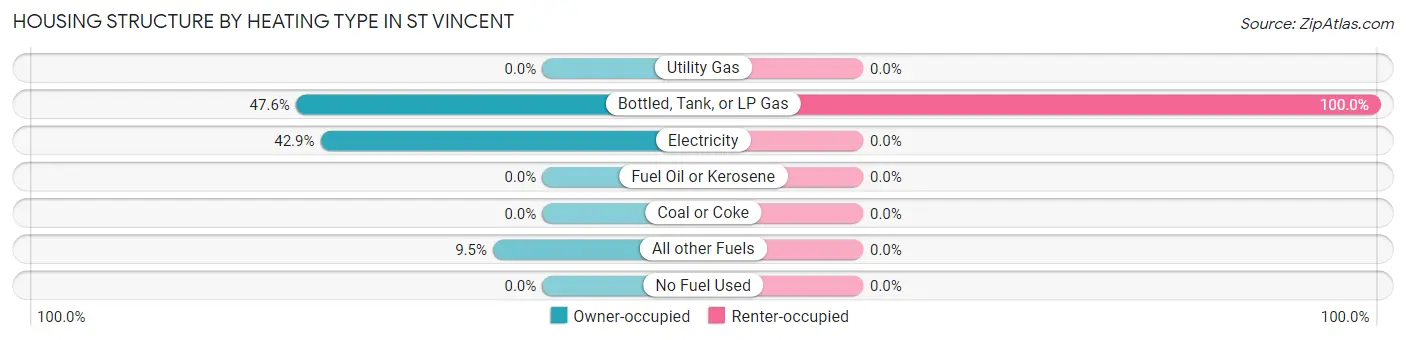
| Heating Type | Owner-occupied | Renter-occupied |
| Utility Gas | 0 (0.0%) | 0 (0.0%) |
| Bottled, Tank, or LP Gas | 10 (47.6%) | 2 (100.0%) |
| Electricity | 9 (42.9%) | 0 (0.0%) |
| Fuel Oil or Kerosene | 0 (0.0%) | 0 (0.0%) |
| Coal or Coke | 0 (0.0%) | 0 (0.0%) |
| All other Fuels | 2 (9.5%) | 0 (0.0%) |
| No Fuel Used | 0 (0.0%) | 0 (0.0%) |
| Total | 21 (100.0%) | 2 (100.0%) |
Household Vehicle Usage in St Vincent
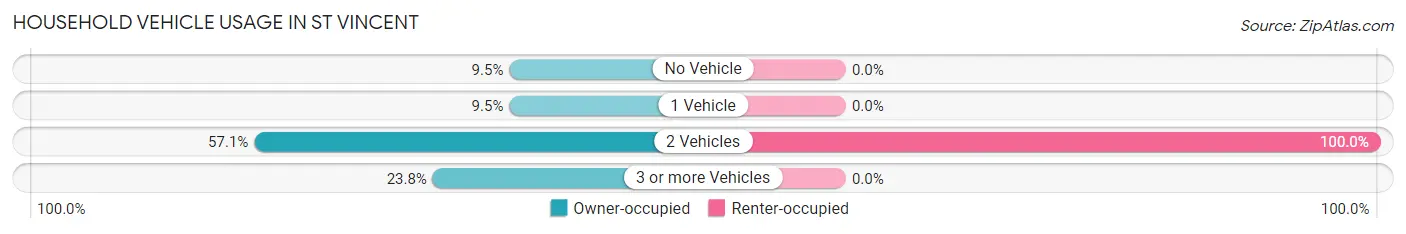
| Vehicles per Household | Owner-occupied | Renter-occupied |
| No Vehicle | 2 (9.5%) | 0 (0.0%) |
| 1 Vehicle | 2 (9.5%) | 0 (0.0%) |
| 2 Vehicles | 12 (57.1%) | 2 (100.0%) |
| 3 or more Vehicles | 5 (23.8%) | 0 (0.0%) |
| Total | 21 (100.0%) | 2 (100.0%) |
Real Estate & Mortgages in St Vincent
Real Estate and Mortgage Overview in St Vincent
| Characteristic | Without Mortgage | With Mortgage |
| Housing Units | 19 | 2 |
| Median Property Value | $58,300 | $0 |
| Median Household Income | $39,688 | $0 |
| Monthly Housing Costs | $408 | $0 |
| Real Estate Taxes | $433 | $0 |
Property Value by Mortgage Status in St Vincent
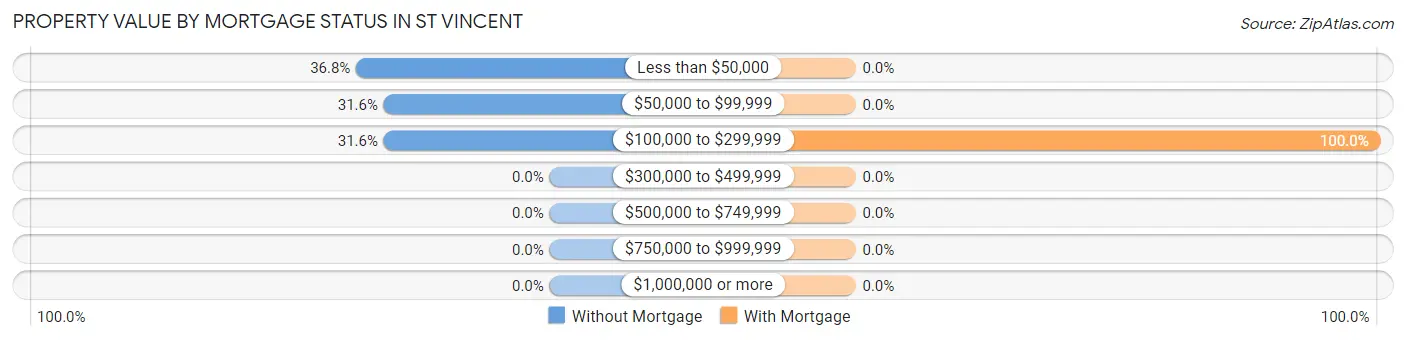
| Property Value | Without Mortgage | With Mortgage |
| Less than $50,000 | 7 (36.8%) | 0 (0.0%) |
| $50,000 to $99,999 | 6 (31.6%) | 0 (0.0%) |
| $100,000 to $299,999 | 6 (31.6%) | 2 (100.0%) |
| $300,000 to $499,999 | 0 (0.0%) | 0 (0.0%) |
| $500,000 to $749,999 | 0 (0.0%) | 0 (0.0%) |
| $750,000 to $999,999 | 0 (0.0%) | 0 (0.0%) |
| $1,000,000 or more | 0 (0.0%) | 0 (0.0%) |
| Total | 19 (100.0%) | 2 (100.0%) |
Household Income by Mortgage Status in St Vincent
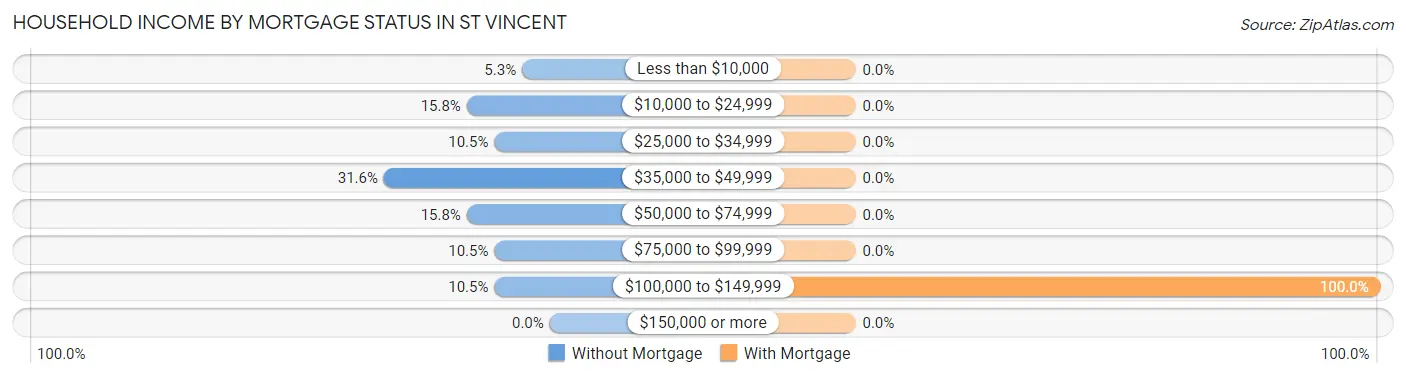
| Household Income | Without Mortgage | With Mortgage |
| Less than $10,000 | 1 (5.3%) | 0 (0.0%) |
| $10,000 to $24,999 | 3 (15.8%) | 0 (0.0%) |
| $25,000 to $34,999 | 2 (10.5%) | 0 (0.0%) |
| $35,000 to $49,999 | 6 (31.6%) | 0 (0.0%) |
| $50,000 to $74,999 | 3 (15.8%) | 0 (0.0%) |
| $75,000 to $99,999 | 2 (10.5%) | 0 (0.0%) |
| $100,000 to $149,999 | 2 (10.5%) | 2 (100.0%) |
| $150,000 or more | 0 (0.0%) | 0 (0.0%) |
| Total | 19 (100.0%) | 2 (100.0%) |
Property Value to Household Income Ratio in St Vincent
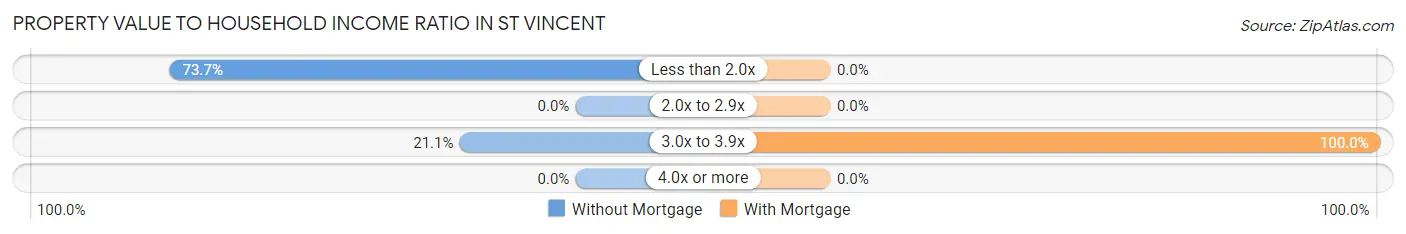
| Value-to-Income Ratio | Without Mortgage | With Mortgage |
| Less than 2.0x | 14 (73.7%) | 0 (0.0%) |
| 2.0x to 2.9x | 0 (0.0%) | 0 (0.0%) |
| 3.0x to 3.9x | 4 (21.0%) | 2 (100.0%) |
| 4.0x or more | 0 (0.0%) | 0 (0.0%) |
| Total | 19 (100.0%) | 2 (100.0%) |
Real Estate Taxes by Mortgage Status in St Vincent
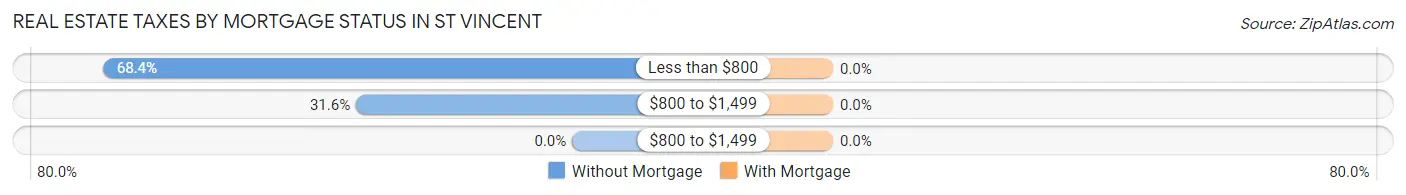
| Property Taxes | Without Mortgage | With Mortgage |
| Less than $800 | 13 (68.4%) | 0 (0.0%) |
| $800 to $1,499 | 6 (31.6%) | 0 (0.0%) |
| $800 to $1,499 | 0 (0.0%) | 0 (0.0%) |
| Total | 19 (100.0%) | 2 (100.0%) |
Health & Disability in St Vincent
Health Insurance Coverage by Age in St Vincent
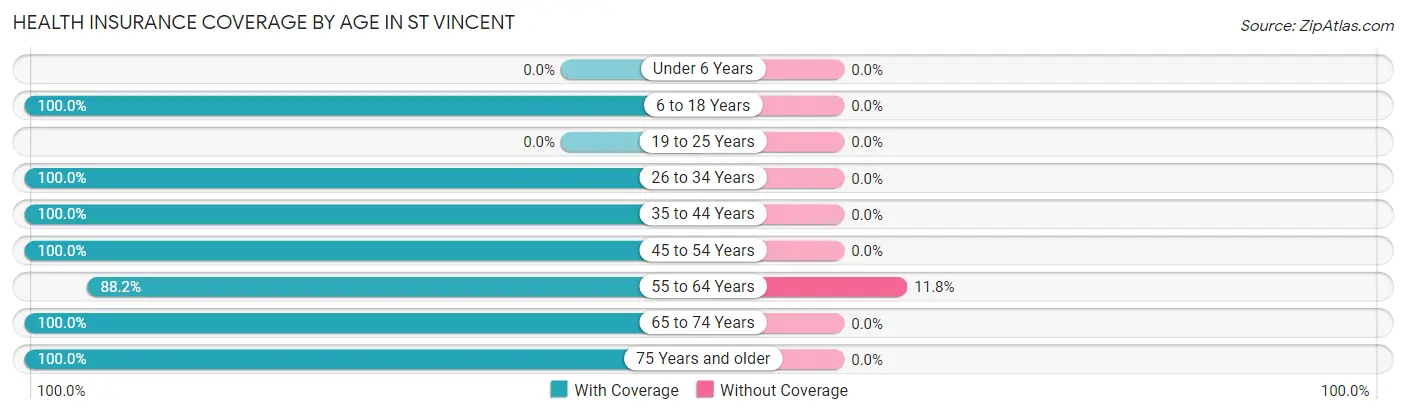
| Age Bracket | With Coverage | Without Coverage |
| Under 6 Years | 0 (0.0%) | 0 (0.0%) |
| 6 to 18 Years | 5 (100.0%) | 0 (0.0%) |
| 19 to 25 Years | 0 (0.0%) | 0 (0.0%) |
| 26 to 34 Years | 1 (100.0%) | 0 (0.0%) |
| 35 to 44 Years | 1 (100.0%) | 0 (0.0%) |
| 45 to 54 Years | 11 (100.0%) | 0 (0.0%) |
| 55 to 64 Years | 15 (88.2%) | 2 (11.8%) |
| 65 to 74 Years | 1 (100.0%) | 0 (0.0%) |
| 75 Years and older | 7 (100.0%) | 0 (0.0%) |
| Total | 41 (95.4%) | 2 (4.6%) |
Health Insurance Coverage by Citizenship Status in St Vincent
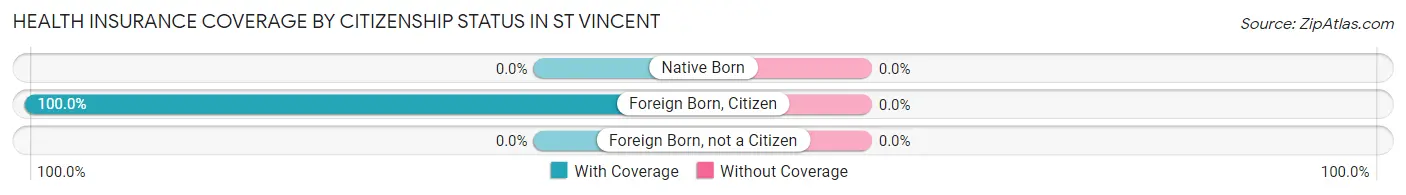
| Citizenship Status | With Coverage | Without Coverage |
| Native Born | 0 (0.0%) | 0 (0.0%) |
| Foreign Born, Citizen | 5 (100.0%) | 0 (0.0%) |
| Foreign Born, not a Citizen | 0 (0.0%) | 0 (0.0%) |
Health Insurance Coverage by Household Income in St Vincent
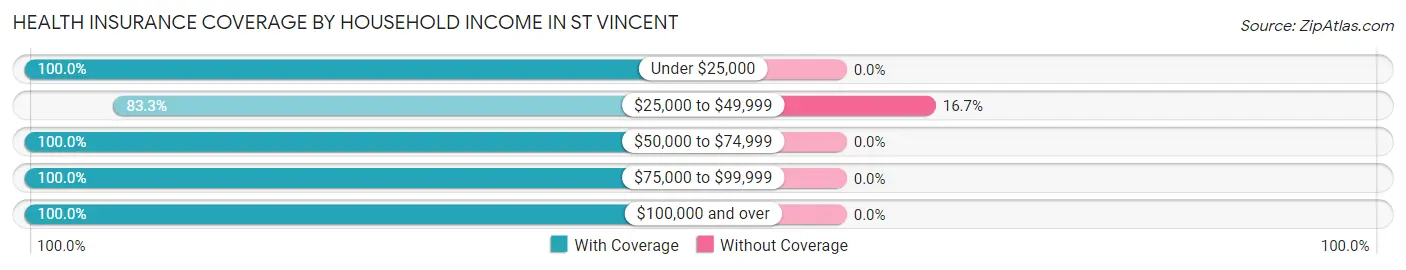
| Household Income | With Coverage | Without Coverage |
| Under $25,000 | 5 (100.0%) | 0 (0.0%) |
| $25,000 to $49,999 | 10 (83.3%) | 2 (16.7%) |
| $50,000 to $74,999 | 7 (100.0%) | 0 (0.0%) |
| $75,000 to $99,999 | 13 (100.0%) | 0 (0.0%) |
| $100,000 and over | 6 (100.0%) | 0 (0.0%) |
Public vs Private Health Insurance Coverage by Age in St Vincent
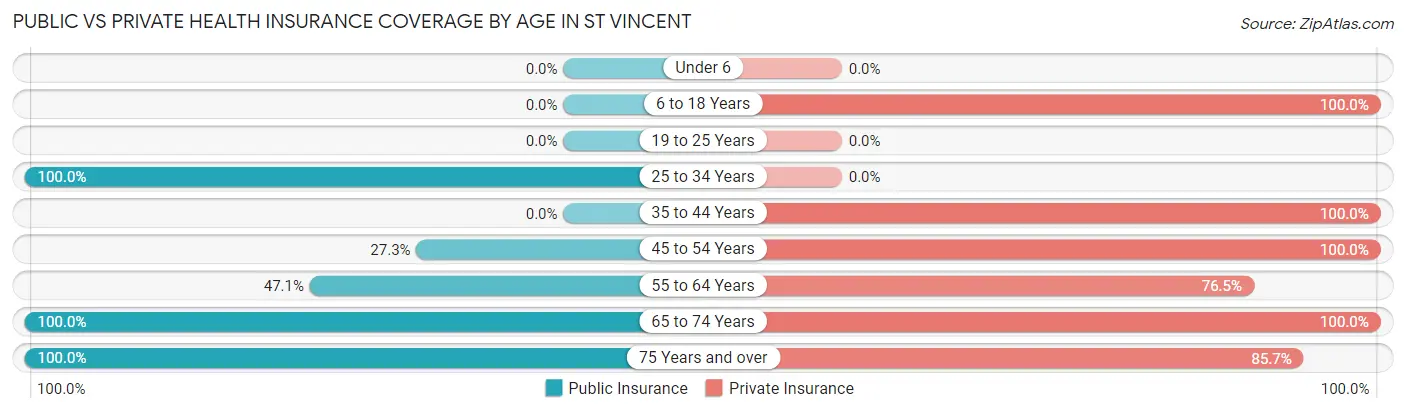
| Age Bracket | Public Insurance | Private Insurance |
| Under 6 | 0 (0.0%) | 0 (0.0%) |
| 6 to 18 Years | 0 (0.0%) | 5 (100.0%) |
| 19 to 25 Years | 0 (0.0%) | 0 (0.0%) |
| 25 to 34 Years | 1 (100.0%) | 0 (0.0%) |
| 35 to 44 Years | 0 (0.0%) | 1 (100.0%) |
| 45 to 54 Years | 3 (27.3%) | 11 (100.0%) |
| 55 to 64 Years | 8 (47.1%) | 13 (76.5%) |
| 65 to 74 Years | 1 (100.0%) | 1 (100.0%) |
| 75 Years and over | 7 (100.0%) | 6 (85.7%) |
| Total | 20 (46.5%) | 37 (86.1%) |
Disability Status by Sex by Age in St Vincent
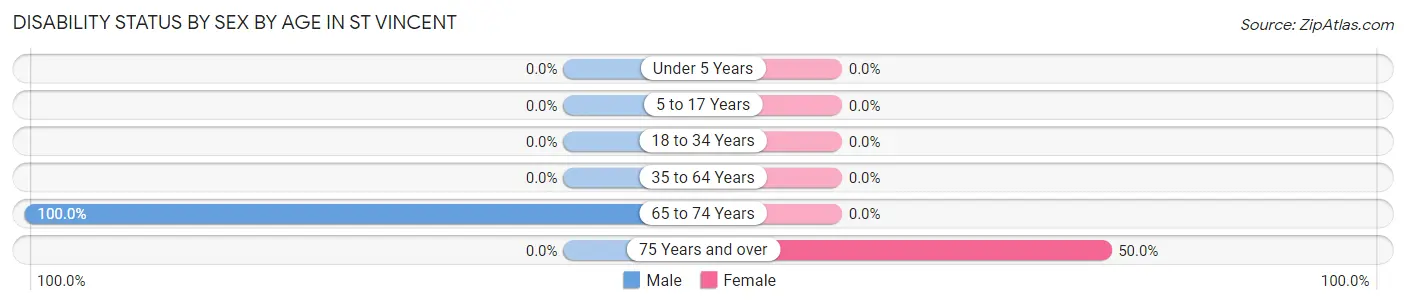
| Age Bracket | Male | Female |
| Under 5 Years | 0 (0.0%) | 0 (0.0%) |
| 5 to 17 Years | 0 (0.0%) | 0 (0.0%) |
| 18 to 34 Years | 0 (0.0%) | 0 (0.0%) |
| 35 to 64 Years | 0 (0.0%) | 0 (0.0%) |
| 65 to 74 Years | 1 (100.0%) | 0 (0.0%) |
| 75 Years and over | 0 (0.0%) | 2 (50.0%) |
Disability Class by Sex by Age in St Vincent
Disability Class: Hearing Difficulty
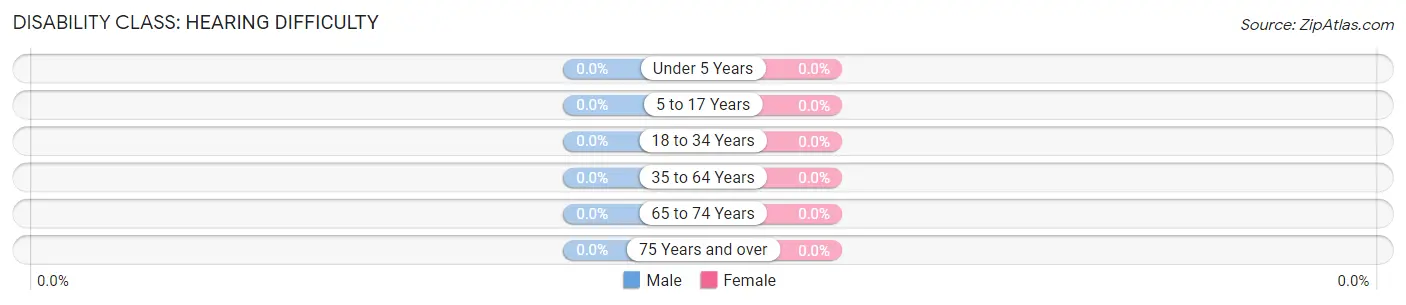
| Age Bracket | Male | Female |
| Under 5 Years | 0 (0.0%) | 0 (0.0%) |
| 5 to 17 Years | 0 (0.0%) | 0 (0.0%) |
| 18 to 34 Years | 0 (0.0%) | 0 (0.0%) |
| 35 to 64 Years | 0 (0.0%) | 0 (0.0%) |
| 65 to 74 Years | 0 (0.0%) | 0 (0.0%) |
| 75 Years and over | 0 (0.0%) | 0 (0.0%) |
Disability Class: Vision Difficulty
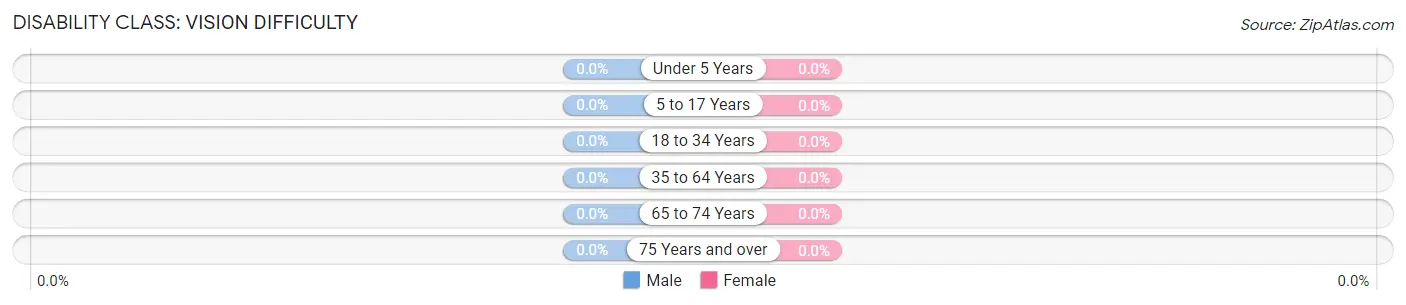
| Age Bracket | Male | Female |
| Under 5 Years | 0 (0.0%) | 0 (0.0%) |
| 5 to 17 Years | 0 (0.0%) | 0 (0.0%) |
| 18 to 34 Years | 0 (0.0%) | 0 (0.0%) |
| 35 to 64 Years | 0 (0.0%) | 0 (0.0%) |
| 65 to 74 Years | 0 (0.0%) | 0 (0.0%) |
| 75 Years and over | 0 (0.0%) | 0 (0.0%) |
Disability Class: Cognitive Difficulty
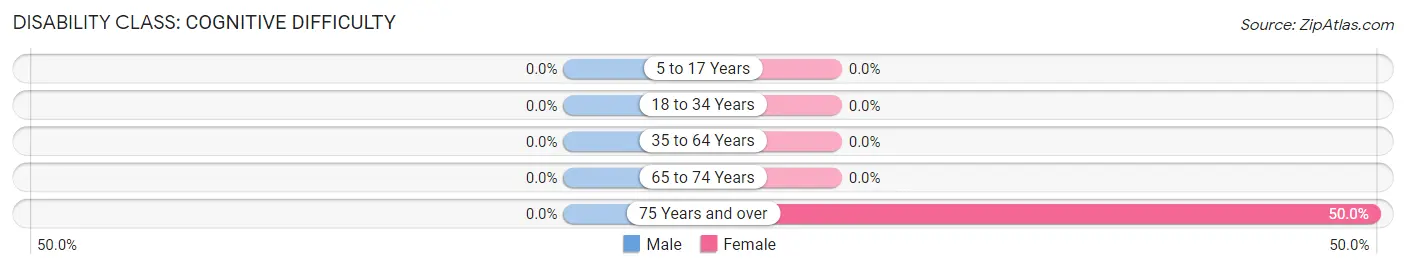
| Age Bracket | Male | Female |
| 5 to 17 Years | 0 (0.0%) | 0 (0.0%) |
| 18 to 34 Years | 0 (0.0%) | 0 (0.0%) |
| 35 to 64 Years | 0 (0.0%) | 0 (0.0%) |
| 65 to 74 Years | 0 (0.0%) | 0 (0.0%) |
| 75 Years and over | 0 (0.0%) | 2 (50.0%) |
Disability Class: Ambulatory Difficulty
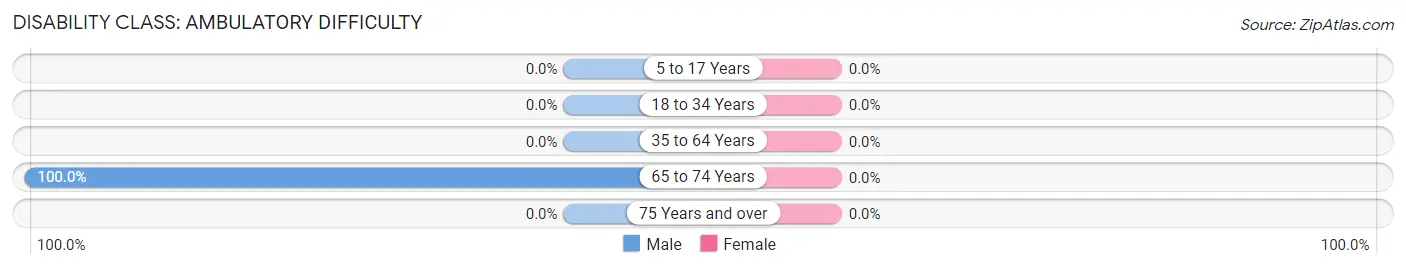
| Age Bracket | Male | Female |
| 5 to 17 Years | 0 (0.0%) | 0 (0.0%) |
| 18 to 34 Years | 0 (0.0%) | 0 (0.0%) |
| 35 to 64 Years | 0 (0.0%) | 0 (0.0%) |
| 65 to 74 Years | 1 (100.0%) | 0 (0.0%) |
| 75 Years and over | 0 (0.0%) | 0 (0.0%) |
Disability Class: Self-Care Difficulty
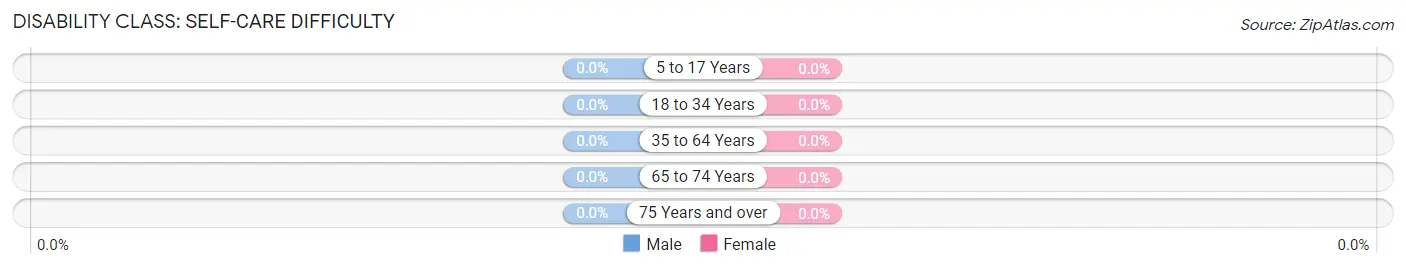
| Age Bracket | Male | Female |
| 5 to 17 Years | 0 (0.0%) | 0 (0.0%) |
| 18 to 34 Years | 0 (0.0%) | 0 (0.0%) |
| 35 to 64 Years | 0 (0.0%) | 0 (0.0%) |
| 65 to 74 Years | 0 (0.0%) | 0 (0.0%) |
| 75 Years and over | 0 (0.0%) | 0 (0.0%) |
Technology Access in St Vincent
Computing Device Access in St Vincent
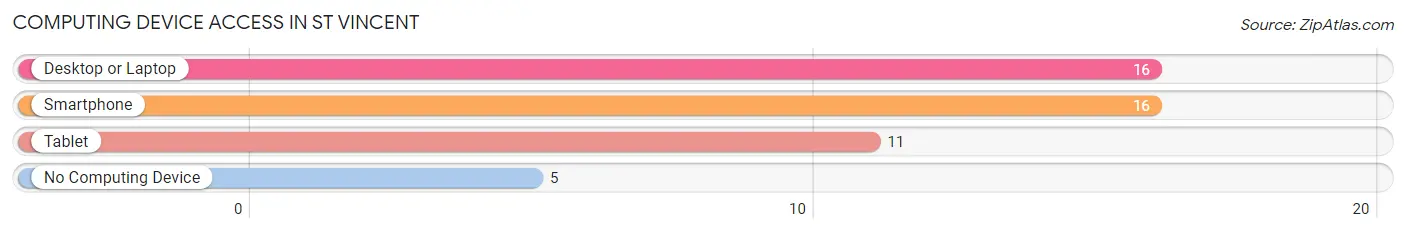
| Device Type | # Households | % Households |
| Desktop or Laptop | 16 | 69.6% |
| Smartphone | 16 | 69.6% |
| Tablet | 11 | 47.8% |
| No Computing Device | 5 | 21.7% |
| Total | 23 | 100.0% |
Internet Access in St Vincent
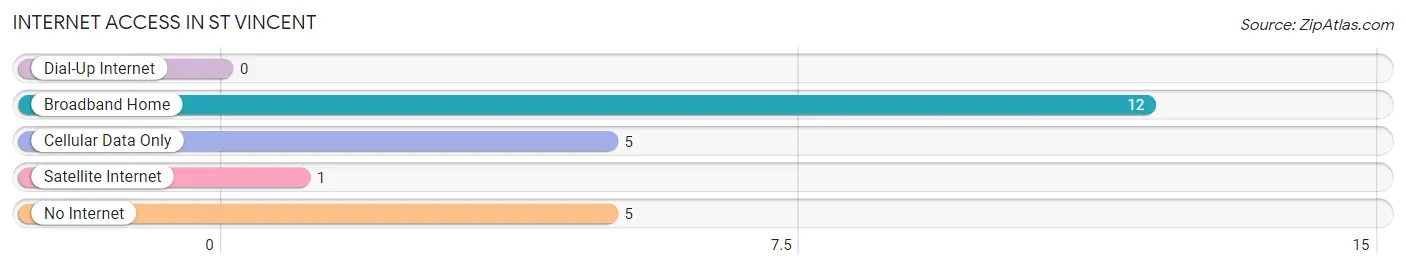
| Internet Type | # Households | % Households |
| Dial-Up Internet | 0 | 0.0% |
| Broadband Home | 12 | 52.2% |
| Cellular Data Only | 5 | 21.7% |
| Satellite Internet | 1 | 4.3% |
| No Internet | 5 | 21.7% |
| Total | 23 | 100.0% |
St Vincent Summary
Vincent, Minnesota is a small town located in the central part of the state, about an hour and a half north of the Twin Cities. It is a rural community with a population of just over 1,000 people. The town was founded in 1856 and has a rich history of farming, logging, and small business.
Geography
Vincent is located in the central part of Minnesota, in Stearns County. It is situated on the banks of the Sauk River, which flows through the town. The town is surrounded by rolling hills and farmland, and is located about an hour and a half north of the Twin Cities.
Economy
Vincent’s economy is largely based on agriculture and small businesses. The town is home to several small businesses, including a grocery store, a hardware store, a restaurant, and a few other small shops. The town also has a few small manufacturing businesses, such as a woodworking shop and a metal fabrication shop.
The town is also home to a few farms, which produce a variety of crops, including corn, soybeans, and hay. The town also has a few small dairy farms, which produce milk and other dairy products.
Demographics
Vincent is a predominantly white town, with a population of just over 1,000 people. The town has a median age of 44.7 years, and the median household income is $45,000. The town has a low unemployment rate of just 3.2%.
The town is home to a variety of religious denominations, including Catholic, Lutheran, and Methodist. The town also has a few churches, including a Catholic church, a Lutheran church, and a Methodist church.
History
Vincent was founded in 1856 by a group of settlers from Germany. The town was originally called “New Germany”, but the name was changed to Vincent in 1858. The town was named after the first settler, John Vincent.
The town grew slowly over the years, and by the early 1900s, it had become a thriving farming community. The town was also home to several small businesses, including a grocery store, a hardware store, and a few other small shops.
In the 1950s, the town began to decline, as many of the small businesses closed and the population began to decline. The town was revitalized in the late 1970s, when a new highway was built through the town, bringing in new businesses and residents.
Today, Vincent is a small, rural town with a population of just over 1,000 people. The town is home to several small businesses, farms, and churches, and is a popular destination for tourists and outdoor enthusiasts.
Common Questions
What is Per Capita Income in St Vincent?
Per Capita income in St Vincent is $32,388.
What is the Median Family Income in St Vincent?
Median Family Income in St Vincent is $61,250.
What is the Median Household income in St Vincent?
Median Household Income in St Vincent is $49,375.
What is Inequality or Gini Index in St Vincent?
Inequality or Gini Index in St Vincent is 0.33.
What is the Total Population of St Vincent?
Total Population of St Vincent is 43.
What is the Total Male Population of St Vincent?
Total Male Population of St Vincent is 26.
What is the Total Female Population of St Vincent?
Total Female Population of St Vincent is 17.
What is the Ratio of Males per 100 Females in St Vincent?
There are 152.94 Males per 100 Females in St Vincent.
What is the Ratio of Females per 100 Males in St Vincent?
There are 65.38 Females per 100 Males in St Vincent.
What is the Median Population Age in St Vincent?
Median Population Age in St Vincent is 57.8 Years.
What is the Average Family Size in St Vincent
Average Family Size in St Vincent is 2.3 People.
What is the Average Household Size in St Vincent
Average Household Size in St Vincent is 1.9 People.
How Large is the Labor Force in St Vincent?
There are 28 People in the Labor Forcein in St Vincent.
What is the Percentage of People in the Labor Force in St Vincent?
70.0% of People are in the Labor Force in St Vincent.
What is the Unemployment Rate in St Vincent?
Unemployment Rate in St Vincent is 3.6%.