Whipholt, MN Map & Demographics
Whipholt Map
Whipholt Overview
$63,772
PER CAPITA INCOME
$100,000
AVG FAMILY INCOME
$72,500
AVG HOUSEHOLD INCOME
40.0%
WAGE / INCOME GAP [ % ]
60.0¢/ $1
WAGE / INCOME GAP [ $ ]
0.53
INEQUALITY / GINI INDEX
74
TOTAL POPULATION
34
MALE POPULATION
40
FEMALE POPULATION
85.00
MALES / 100 FEMALES
117.65
FEMALES / 100 MALES
55.5
MEDIAN AGE
2.7
AVG FAMILY SIZE
2.2
AVG HOUSEHOLD SIZE
36
LABOR FORCE [ PEOPLE ]
55.4%
PERCENT IN LABOR FORCE
8.3%
UNEMPLOYMENT RATE
Whipholt Area Codes
Income in Whipholt
Income Overview in Whipholt
Per Capita Income in Whipholt is $63,772, while median incomes of families and households are $100,000 and $72,500 respectively.
| Characteristic | Number | Measure |
| Per Capita Income | 74 | $63,772 |
| Median Family Income | 22 | $100,000 |
| Mean Family Income | 22 | $171,105 |
| Median Household Income | 34 | $72,500 |
| Mean Household Income | 34 | $132,271 |
| Income Deficit | 22 | $0 |
| Wage / Income Gap (%) | 74 | 40.04% |
| Wage / Income Gap ($) | 74 | 59.96¢ per $1 |
| Gini / Inequality Index | 74 | 0.53 |
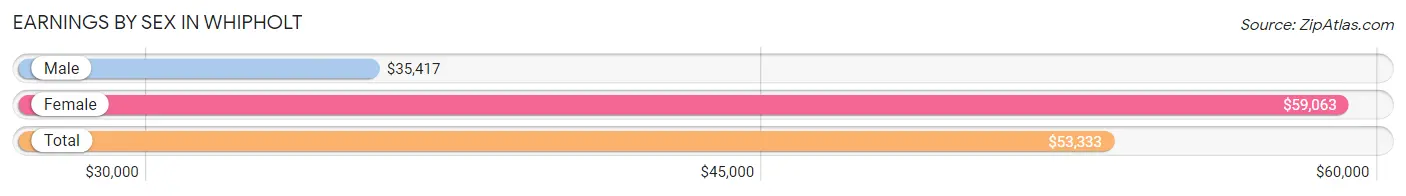
Earnings by Sex in Whipholt
Average Earnings in Whipholt are $53,333, $35,417 for men and $59,063 for women, a difference of 40.0%.
| Sex | Number | Average Earnings |
| Male | 19 (45.2%) | $35,417 |
| Female | 23 (54.8%) | $59,063 |
| Total | 42 (100.0%) | $53,333 |
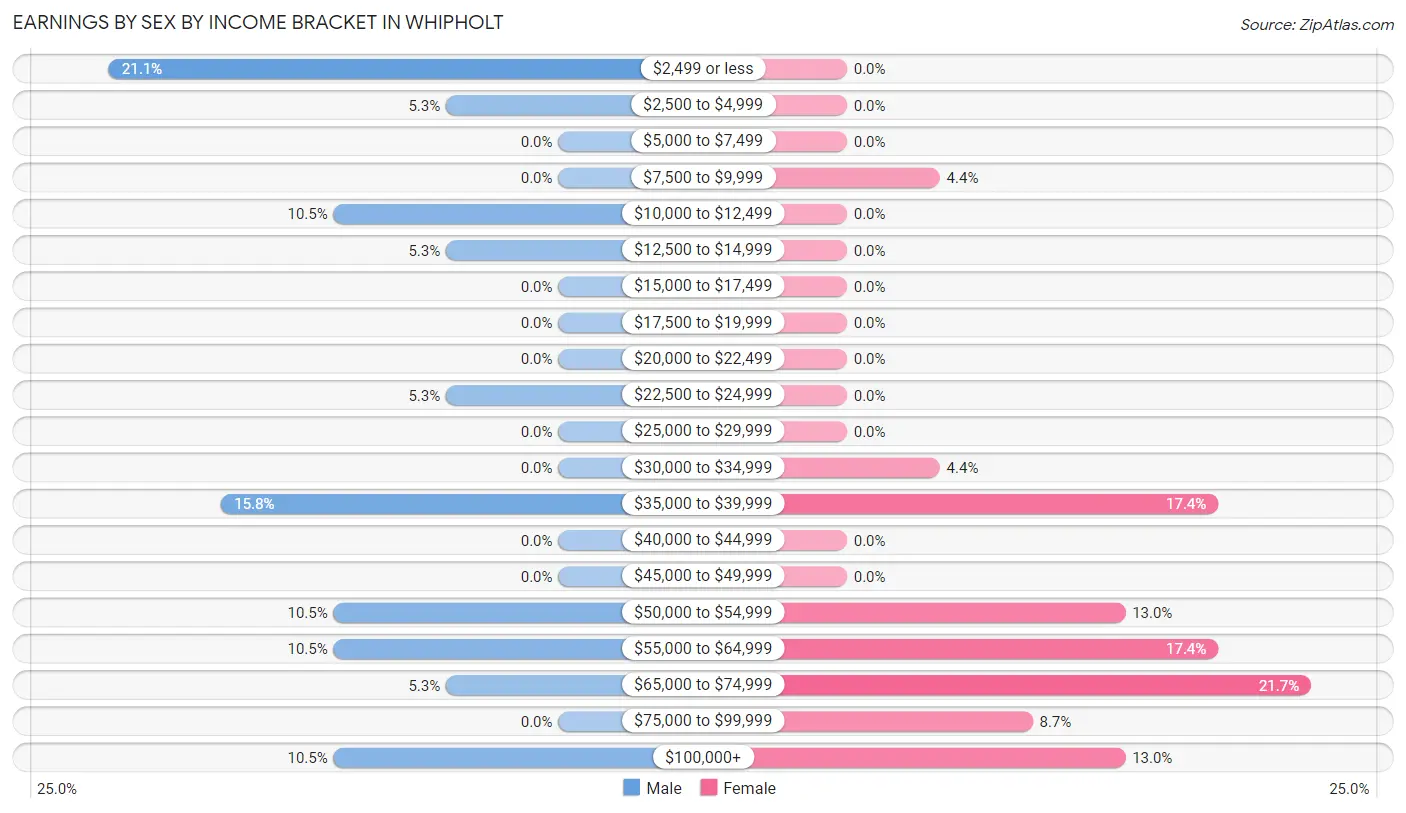
Earnings by Sex by Income Bracket in Whipholt
The most common earnings brackets in Whipholt are $2,499 or less for men (4 | 21.0%) and $65,000 to $74,999 for women (5 | 21.7%).
| Income | Male | Female |
| $2,499 or less | 4 (21.0%) | 0 (0.0%) |
| $2,500 to $4,999 | 1 (5.3%) | 0 (0.0%) |
| $5,000 to $7,499 | 0 (0.0%) | 0 (0.0%) |
| $7,500 to $9,999 | 0 (0.0%) | 1 (4.3%) |
| $10,000 to $12,499 | 2 (10.5%) | 0 (0.0%) |
| $12,500 to $14,999 | 1 (5.3%) | 0 (0.0%) |
| $15,000 to $17,499 | 0 (0.0%) | 0 (0.0%) |
| $17,500 to $19,999 | 0 (0.0%) | 0 (0.0%) |
| $20,000 to $22,499 | 0 (0.0%) | 0 (0.0%) |
| $22,500 to $24,999 | 1 (5.3%) | 0 (0.0%) |
| $25,000 to $29,999 | 0 (0.0%) | 0 (0.0%) |
| $30,000 to $34,999 | 0 (0.0%) | 1 (4.3%) |
| $35,000 to $39,999 | 3 (15.8%) | 4 (17.4%) |
| $40,000 to $44,999 | 0 (0.0%) | 0 (0.0%) |
| $45,000 to $49,999 | 0 (0.0%) | 0 (0.0%) |
| $50,000 to $54,999 | 2 (10.5%) | 3 (13.0%) |
| $55,000 to $64,999 | 2 (10.5%) | 4 (17.4%) |
| $65,000 to $74,999 | 1 (5.3%) | 5 (21.7%) |
| $75,000 to $99,999 | 0 (0.0%) | 2 (8.7%) |
| $100,000+ | 2 (10.5%) | 3 (13.0%) |
| Total | 19 (100.0%) | 23 (100.0%) |
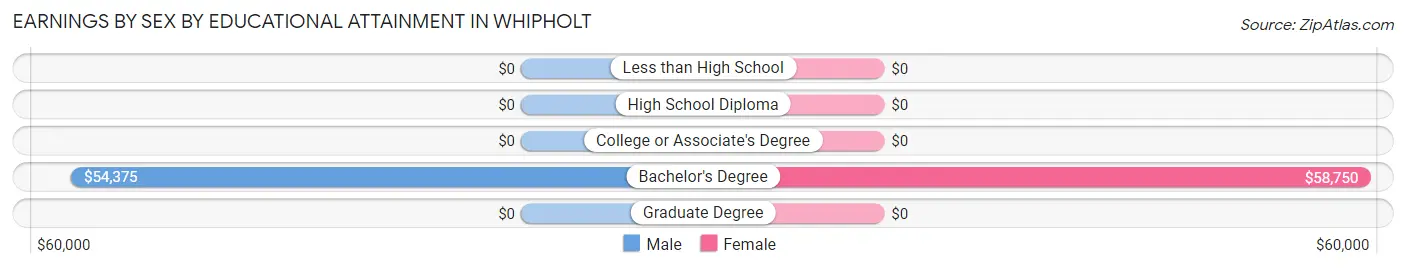
Earnings by Sex by Educational Attainment in Whipholt
Average earnings in Whipholt are $36,250 for men and $59,688 for women, a difference of 39.3%. Men with an educational attainment of bachelor's degree enjoy the highest average annual earnings of $54,375, while those with bachelor's degree education earn the least with $54,375. Women with an educational attainment of bachelor's degree earn the most with the average annual earnings of $58,750, while those with bachelor's degree education have the smallest earnings of $58,750.
| Educational Attainment | Male Income | Female Income |
| Less than High School | - | - |
| High School Diploma | - | - |
| College or Associate's Degree | - | - |
| Bachelor's Degree | $54,375 | $58,750 |
| Graduate Degree | - | - |
| Total | $36,250 | $59,688 |
Family Income in Whipholt
Family Income Brackets in Whipholt
According to the Whipholt family income data, there are 5 families falling into the $75,000 to $99,999 income range, which is the most common income bracket and makes up 22.7% of all families.
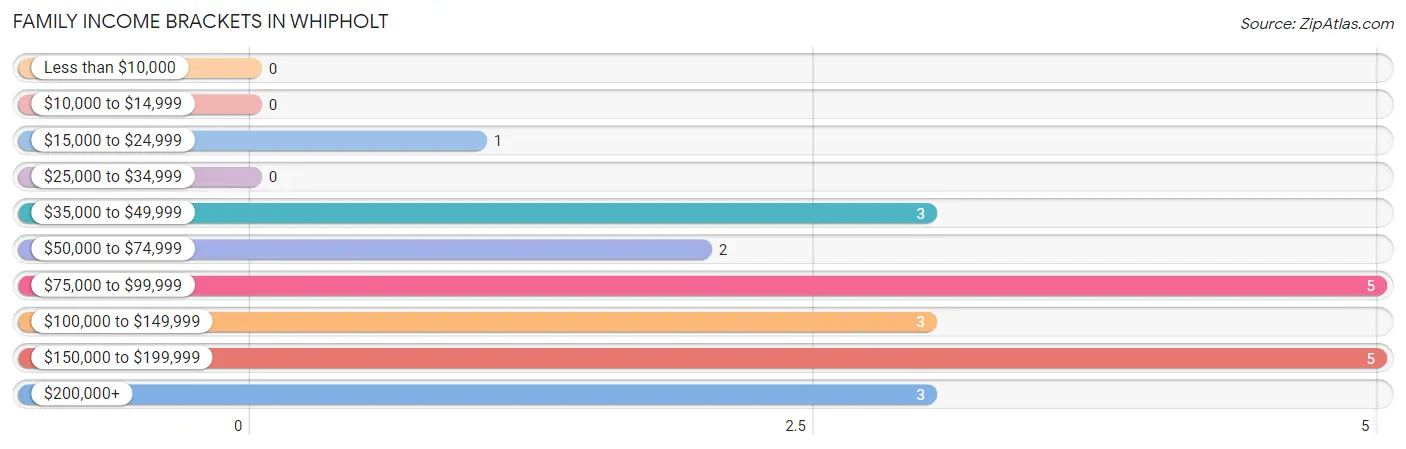
| Income Bracket | # Families | % Families |
| Less than $10,000 | 0 | 0.0% |
| $10,000 to $14,999 | 0 | 0.0% |
| $15,000 to $24,999 | 1 | 4.5% |
| $25,000 to $34,999 | 0 | 0.0% |
| $35,000 to $49,999 | 3 | 13.6% |
| $50,000 to $74,999 | 2 | 9.1% |
| $75,000 to $99,999 | 5 | 22.7% |
| $100,000 to $149,999 | 3 | 13.6% |
| $150,000 to $199,999 | 5 | 22.7% |
| $200,000+ | 3 | 13.6% |
Family Income by Famaliy Size in Whipholt
2-person families (19 | 86.4%) account for the highest median family income in Whipholt with $89,375 per family, while 2-person families (19 | 86.4%) have the highest median income of $44,688 per family member.
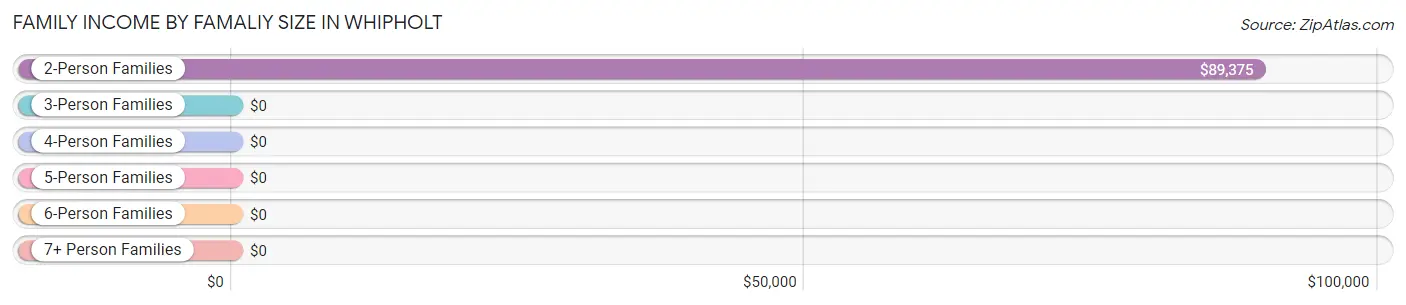
| Income Bracket | # Families | Median Income |
| 2-Person Families | 19 (86.4%) | $89,375 |
| 3-Person Families | 1 (4.5%) | $0 |
| 4-Person Families | 1 (4.5%) | $0 |
| 5-Person Families | 0 (0.0%) | $0 |
| 6-Person Families | 0 (0.0%) | $0 |
| 7+ Person Families | 1 (4.5%) | $0 |
| Total | 22 (100.0%) | $100,000 |
Family Income by Number of Earners in Whipholt
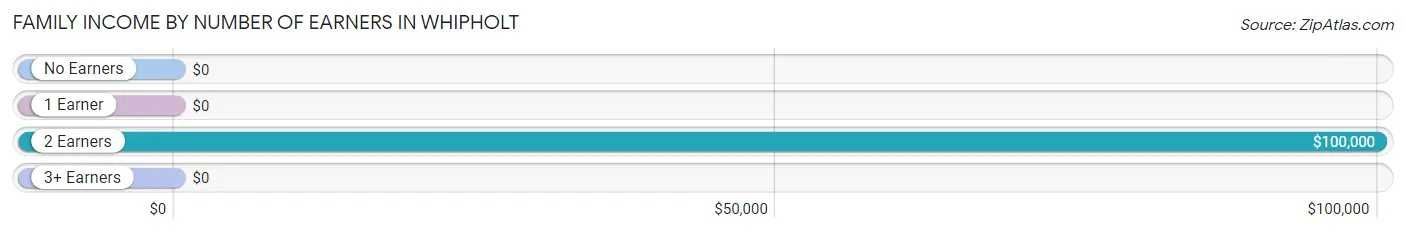
| Number of Earners | # Families | Median Income |
| No Earners | 7 (31.8%) | $0 |
| 1 Earner | 4 (18.2%) | $0 |
| 2 Earners | 10 (45.5%) | $100,000 |
| 3+ Earners | 1 (4.5%) | $0 |
| Total | 22 (100.0%) | $100,000 |
Household Income in Whipholt
Household Income Brackets in Whipholt
With 7 households falling in the category, the $150,000 to $199,999 income range is the most frequent in Whipholt, accounting for 20.6% of all households.
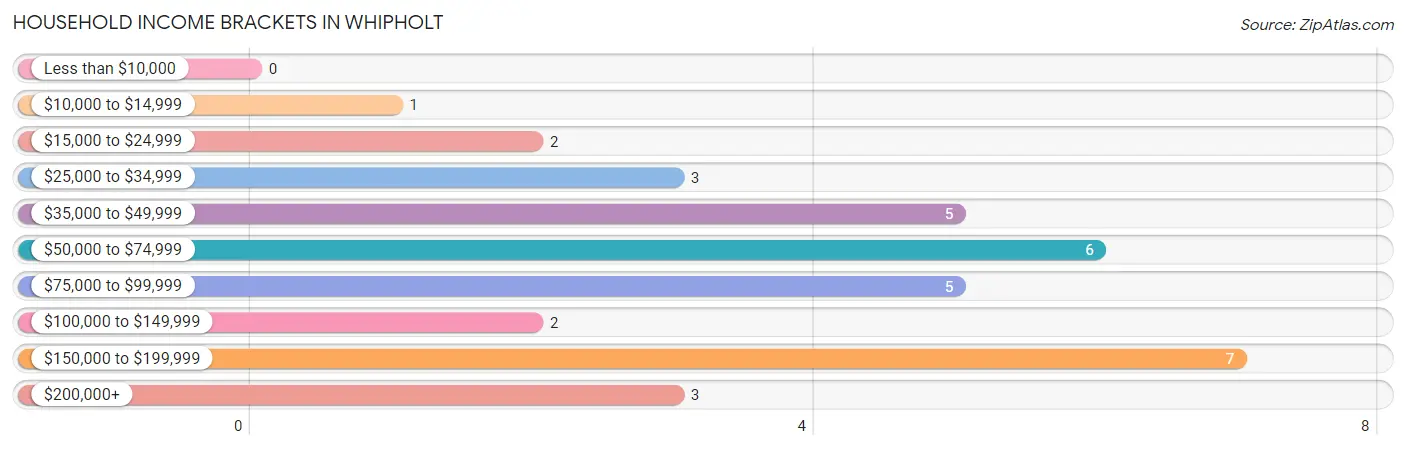
| Income Bracket | # Households | % Households |
| Less than $10,000 | 0 | 0.0% |
| $10,000 to $14,999 | 1 | 2.9% |
| $15,000 to $24,999 | 2 | 5.9% |
| $25,000 to $34,999 | 3 | 8.8% |
| $35,000 to $49,999 | 5 | 14.7% |
| $50,000 to $74,999 | 6 | 17.6% |
| $75,000 to $99,999 | 5 | 14.7% |
| $100,000 to $149,999 | 2 | 5.9% |
| $150,000 to $199,999 | 7 | 20.6% |
| $200,000+ | 3 | 8.8% |
Household Income by Householder Age in Whipholt
The median household income in Whipholt is $72,500, with the highest median household income of $73,750 found in the 45 to 64 years age bracket for the primary householder. A total of 16 households (47.1%) fall into this category.
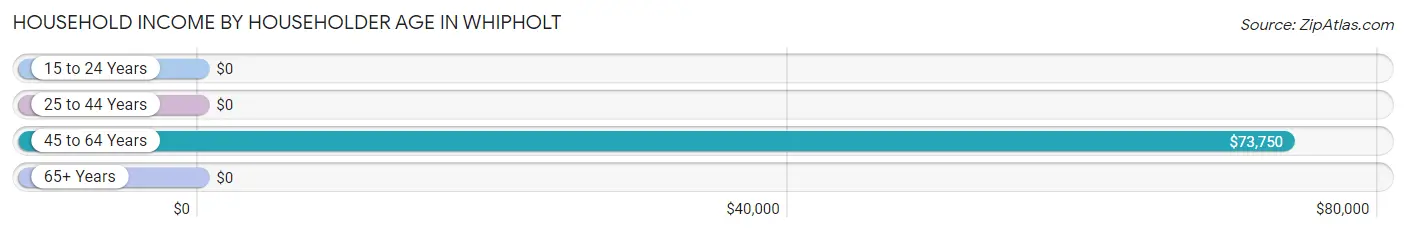
| Income Bracket | # Households | Median Income |
| 15 to 24 Years | 0 (0.0%) | $0 |
| 25 to 44 Years | 4 (11.8%) | $0 |
| 45 to 64 Years | 16 (47.1%) | $73,750 |
| 65+ Years | 14 (41.2%) | $0 |
| Total | 34 (100.0%) | $72,500 |
Poverty in Whipholt
Income Below Poverty by Sex and Age in Whipholt
With 11.8% poverty level for males and 5.0% for females among the residents of Whipholt, 16 and 17 year old males and 12 to 14 year old females are the most vulnerable to poverty, with 2 males (100.0%) and 2 females (100.0%) in their respective age groups living below the poverty level.
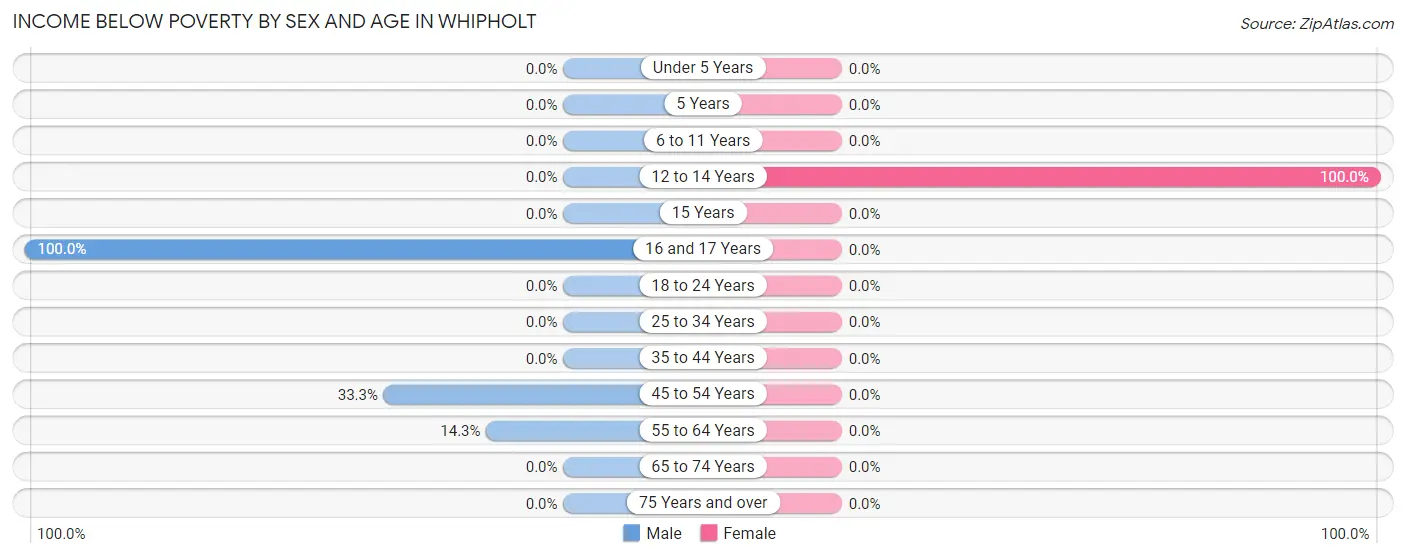
| Age Bracket | Male | Female |
| Under 5 Years | 0 (0.0%) | 0 (0.0%) |
| 5 Years | 0 (0.0%) | 0 (0.0%) |
| 6 to 11 Years | 0 (0.0%) | 0 (0.0%) |
| 12 to 14 Years | 0 (0.0%) | 2 (100.0%) |
| 15 Years | 0 (0.0%) | 0 (0.0%) |
| 16 and 17 Years | 2 (100.0%) | 0 (0.0%) |
| 18 to 24 Years | 0 (0.0%) | 0 (0.0%) |
| 25 to 34 Years | 0 (0.0%) | 0 (0.0%) |
| 35 to 44 Years | 0 (0.0%) | 0 (0.0%) |
| 45 to 54 Years | 1 (33.3%) | 0 (0.0%) |
| 55 to 64 Years | 1 (14.3%) | 0 (0.0%) |
| 65 to 74 Years | 0 (0.0%) | 0 (0.0%) |
| 75 Years and over | 0 (0.0%) | 0 (0.0%) |
| Total | 4 (11.8%) | 2 (5.0%) |
Income Above Poverty by Sex and Age in Whipholt
According to the poverty statistics in Whipholt, males aged 5 years and females aged 6 to 11 years are the age groups that are most secure financially, with 100.0% of males and 100.0% of females in these age groups living above the poverty line.
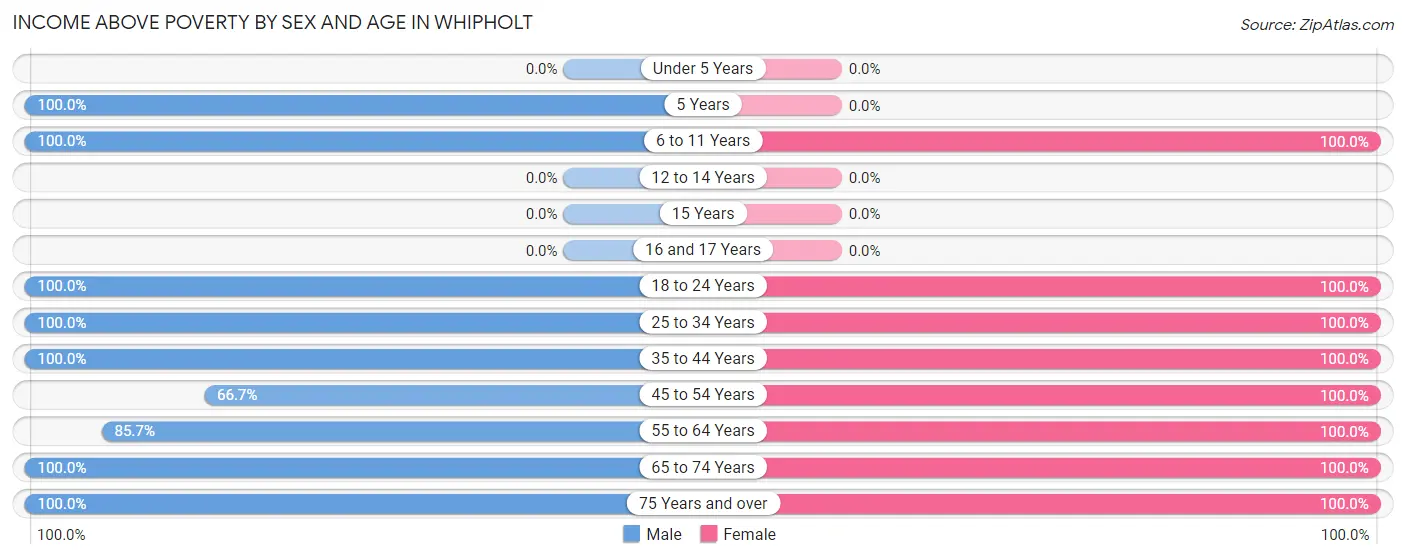
| Age Bracket | Male | Female |
| Under 5 Years | 0 (0.0%) | 0 (0.0%) |
| 5 Years | 1 (100.0%) | 0 (0.0%) |
| 6 to 11 Years | 1 (100.0%) | 5 (100.0%) |
| 12 to 14 Years | 0 (0.0%) | 0 (0.0%) |
| 15 Years | 0 (0.0%) | 0 (0.0%) |
| 16 and 17 Years | 0 (0.0%) | 0 (0.0%) |
| 18 to 24 Years | 2 (100.0%) | 2 (100.0%) |
| 25 to 34 Years | 1 (100.0%) | 4 (100.0%) |
| 35 to 44 Years | 3 (100.0%) | 2 (100.0%) |
| 45 to 54 Years | 2 (66.7%) | 9 (100.0%) |
| 55 to 64 Years | 6 (85.7%) | 6 (100.0%) |
| 65 to 74 Years | 9 (100.0%) | 6 (100.0%) |
| 75 Years and over | 5 (100.0%) | 4 (100.0%) |
| Total | 30 (88.2%) | 38 (95.0%) |
Income Below Poverty Among Married-Couple Families in Whipholt
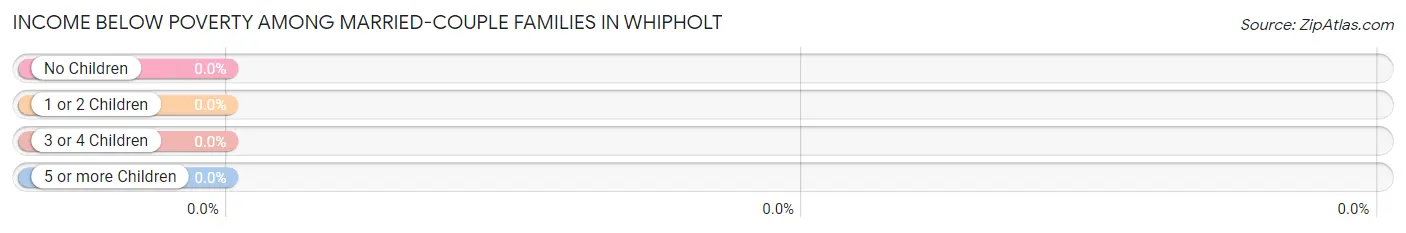
| Children | Above Poverty | Below Poverty |
| No Children | 15 (100.0%) | 0 (0.0%) |
| 1 or 2 Children | 2 (100.0%) | 0 (0.0%) |
| 3 or 4 Children | 0 (0.0%) | 0 (0.0%) |
| 5 or more Children | 0 (0.0%) | 0 (0.0%) |
| Total | 17 (100.0%) | 0 (0.0%) |
Income Below Poverty Among Single-Parent Households in Whipholt
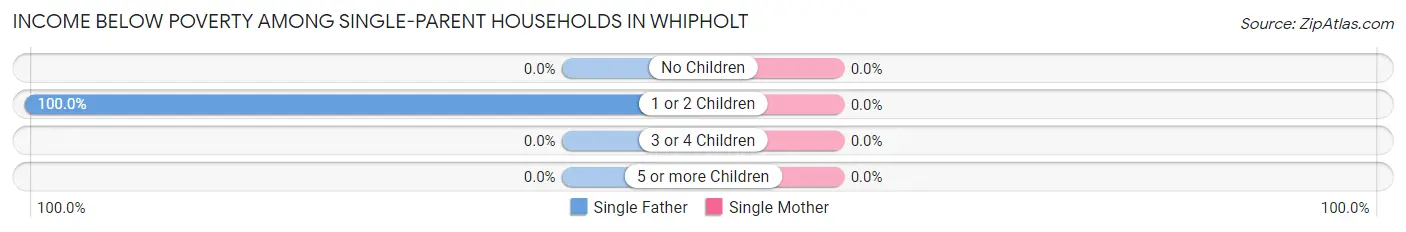
| Children | Single Father | Single Mother |
| No Children | 0 (0.0%) | 0 (0.0%) |
| 1 or 2 Children | 1 (100.0%) | 0 (0.0%) |
| 3 or 4 Children | 0 (0.0%) | 0 (0.0%) |
| 5 or more Children | 0 (0.0%) | 0 (0.0%) |
| Total | 1 (100.0%) | 0 (0.0%) |
Income Below Poverty Among Married-Couple vs Single-Parent Households in Whipholt
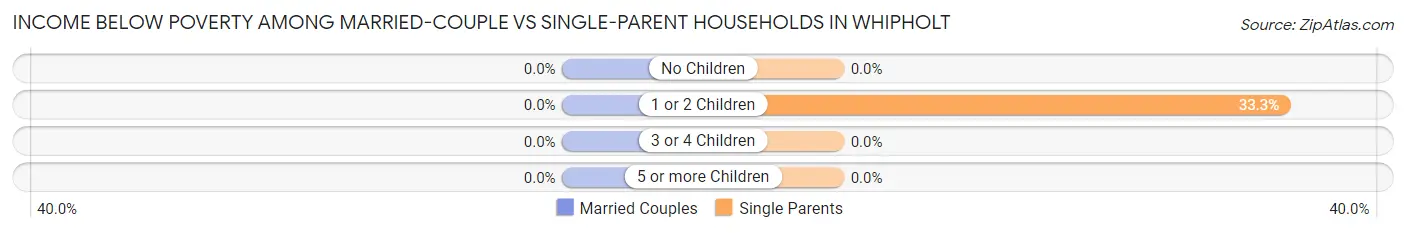
| Children | Married-Couple Families | Single-Parent Households |
| No Children | 0 (0.0%) | 0 (0.0%) |
| 1 or 2 Children | 0 (0.0%) | 1 (33.3%) |
| 3 or 4 Children | 0 (0.0%) | 0 (0.0%) |
| 5 or more Children | 0 (0.0%) | 0 (0.0%) |
| Total | 0 (0.0%) | 1 (20.0%) |
Race in Whipholt
The most populous races in Whipholt are , and White / Caucasian (74 | 100.0%).
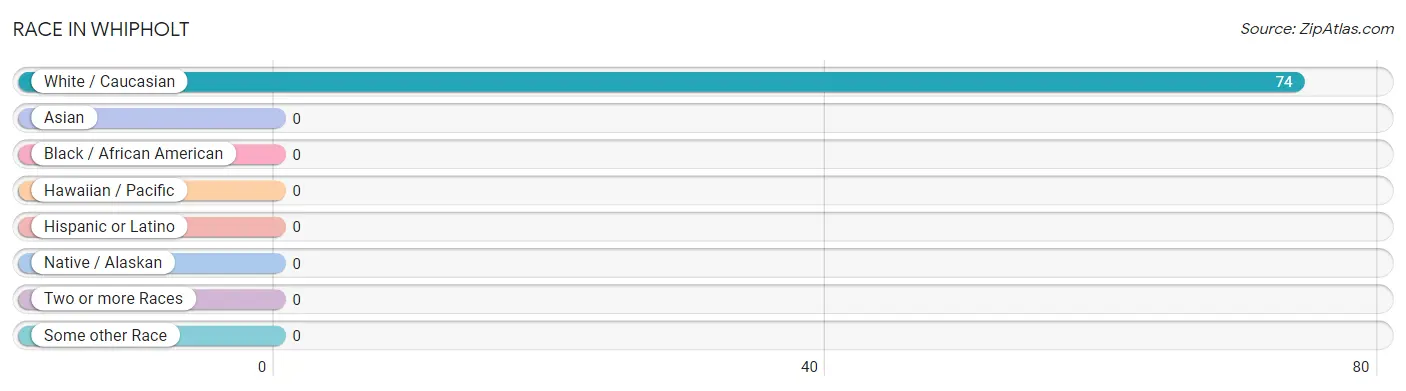
| Race | # Population | % Population |
| Asian | 0 | 0.0% |
| Black / African American | 0 | 0.0% |
| Hawaiian / Pacific | 0 | 0.0% |
| Hispanic or Latino | 0 | 0.0% |
| Native / Alaskan | 0 | 0.0% |
| White / Caucasian | 74 | 100.0% |
| Two or more Races | 0 | 0.0% |
| Some other Race | 0 | 0.0% |
| Total | 74 | 100.0% |
Ancestry in Whipholt
The most populous ancestries reported in Whipholt are German (31 | 41.9%), Irish (12 | 16.2%), English (11 | 14.9%), Norwegian (11 | 14.9%), and Danish (9 | 12.2%), together accounting for 100.0% of all Whipholt residents.
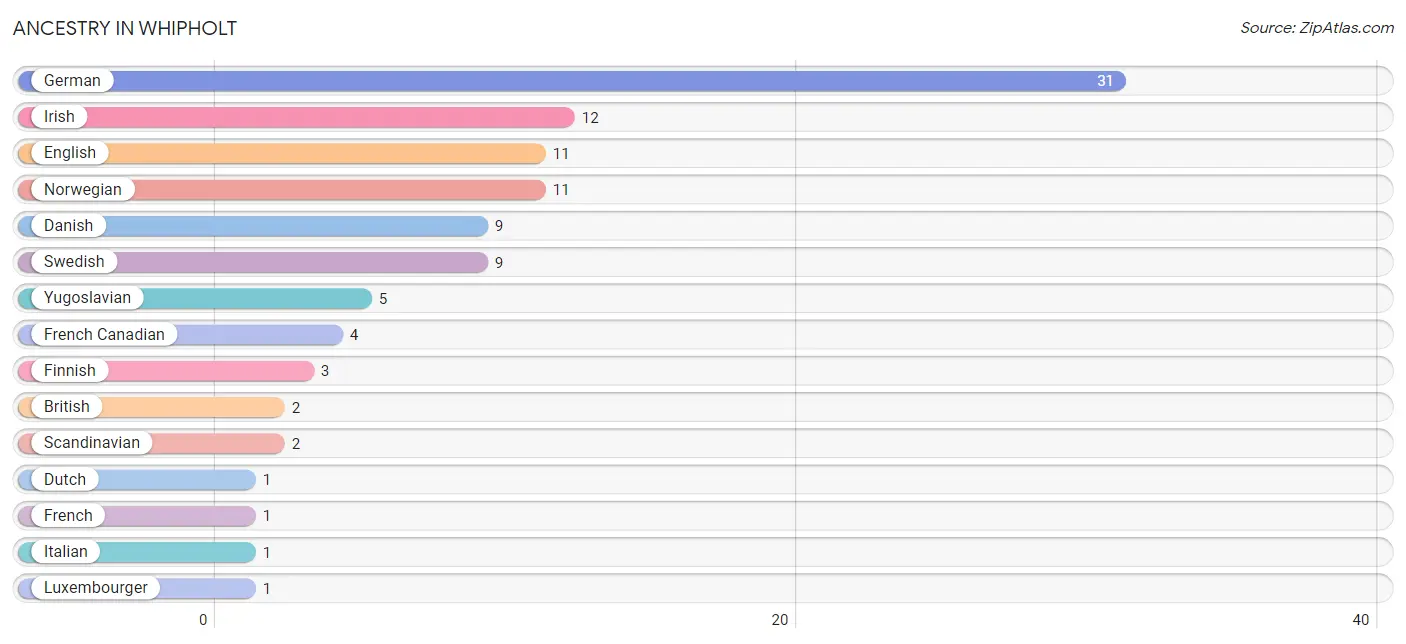
| Ancestry | # Population | % Population |
| British | 2 | 2.7% |
| Danish | 9 | 12.2% |
| Dutch | 1 | 1.3% |
| English | 11 | 14.9% |
| Finnish | 3 | 4.1% |
| French | 1 | 1.3% |
| French Canadian | 4 | 5.4% |
| German | 31 | 41.9% |
| Irish | 12 | 16.2% |
| Italian | 1 | 1.3% |
| Luxembourger | 1 | 1.3% |
| Norwegian | 11 | 14.9% |
| Polish | 1 | 1.3% |
| Scandinavian | 2 | 2.7% |
| Swedish | 9 | 12.2% |
| Welsh | 1 | 1.3% |
| Yugoslavian | 5 | 6.8% | View All 17 Rows |
Immigrants in Whipholt
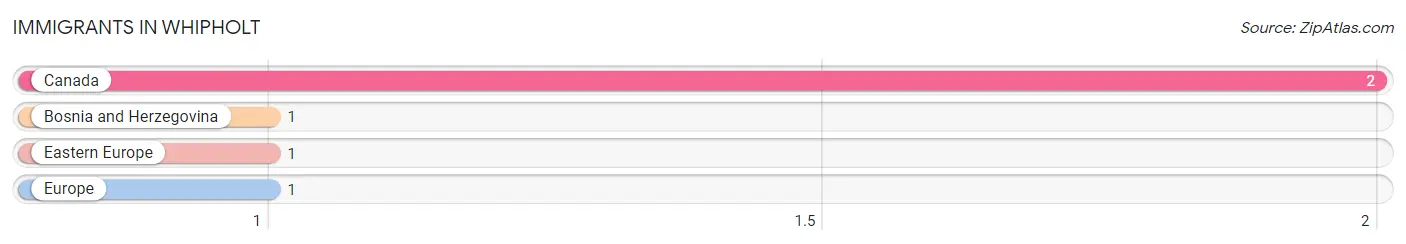
The most numerous immigrant groups reported in Whipholt came from Canada (2 | 2.7%), Bosnia and Herzegovina (1 | 1.3%), Eastern Europe (1 | 1.3%), and Europe (1 | 1.3%), together accounting for 6.8% of all Whipholt residents.
| Immigration Origin | # Population | % Population |
| Bosnia and Herzegovina | 1 | 1.3% |
| Canada | 2 | 2.7% |
| Eastern Europe | 1 | 1.3% |
| Europe | 1 | 1.3% | View All 4 Rows |
Sex and Age in Whipholt
Sex and Age in Whipholt
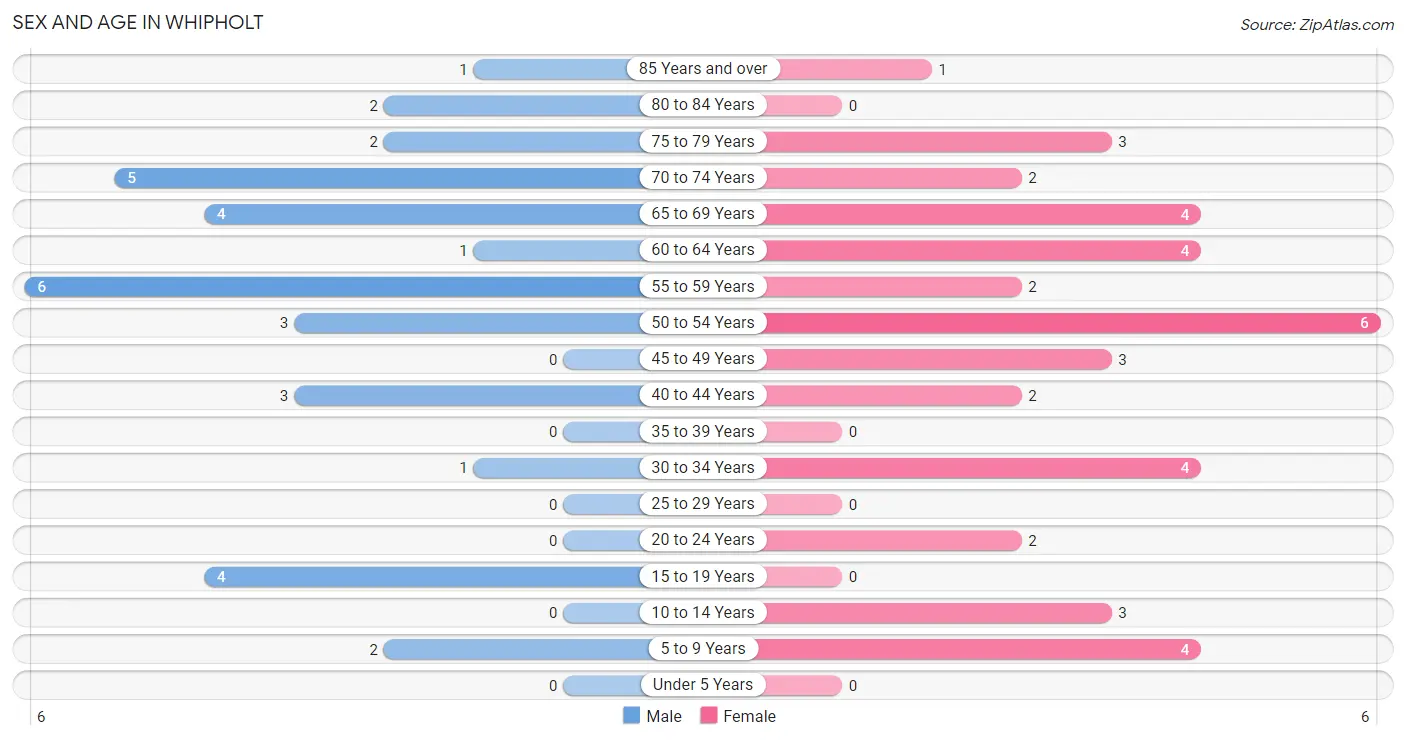
The most populous age groups in Whipholt are 55 to 59 Years (6 | 17.6%) for men and 50 to 54 Years (6 | 15.0%) for women.
| Age Bracket | Male | Female |
| Under 5 Years | 0 (0.0%) | 0 (0.0%) |
| 5 to 9 Years | 2 (5.9%) | 4 (10.0%) |
| 10 to 14 Years | 0 (0.0%) | 3 (7.5%) |
| 15 to 19 Years | 4 (11.8%) | 0 (0.0%) |
| 20 to 24 Years | 0 (0.0%) | 2 (5.0%) |
| 25 to 29 Years | 0 (0.0%) | 0 (0.0%) |
| 30 to 34 Years | 1 (2.9%) | 4 (10.0%) |
| 35 to 39 Years | 0 (0.0%) | 0 (0.0%) |
| 40 to 44 Years | 3 (8.8%) | 2 (5.0%) |
| 45 to 49 Years | 0 (0.0%) | 3 (7.5%) |
| 50 to 54 Years | 3 (8.8%) | 6 (15.0%) |
| 55 to 59 Years | 6 (17.6%) | 2 (5.0%) |
| 60 to 64 Years | 1 (2.9%) | 4 (10.0%) |
| 65 to 69 Years | 4 (11.8%) | 4 (10.0%) |
| 70 to 74 Years | 5 (14.7%) | 2 (5.0%) |
| 75 to 79 Years | 2 (5.9%) | 3 (7.5%) |
| 80 to 84 Years | 2 (5.9%) | 0 (0.0%) |
| 85 Years and over | 1 (2.9%) | 1 (2.5%) |
| Total | 34 (100.0%) | 40 (100.0%) |
Families and Households in Whipholt
Median Family Size in Whipholt
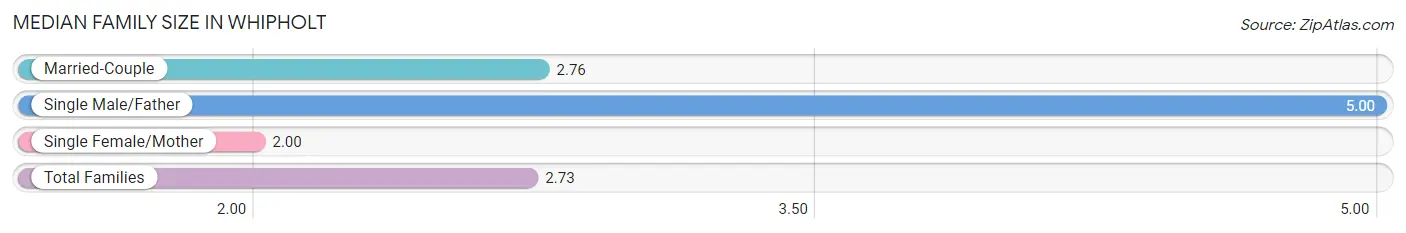
The median family size in Whipholt is 2.73 persons per family, with single male/father families (1 | 4.5%) accounting for the largest median family size of 5 persons per family. On the other hand, single female/mother families (4 | 18.2%) represent the smallest median family size with 2.00 persons per family.
| Family Type | # Families | Family Size |
| Married-Couple | 17 (77.3%) | 2.76 |
| Single Male/Father | 1 (4.5%) | 5.00 |
| Single Female/Mother | 4 (18.2%) | 2.00 |
| Total Families | 22 (100.0%) | 2.73 |
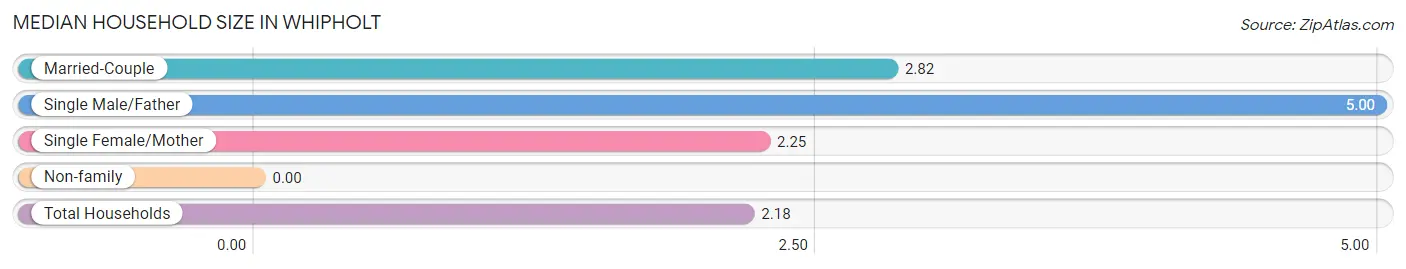
Median Household Size in Whipholt
| Household Type | # Households | Household Size |
| Married-Couple | 17 (50.0%) | 2.82 |
| Single Male/Father | 1 (2.9%) | 5.00 |
| Single Female/Mother | 4 (11.8%) | 2.25 |
| Non-family | 12 (35.3%) | - |
| Total Households | 34 (100.0%) | 2.18 |
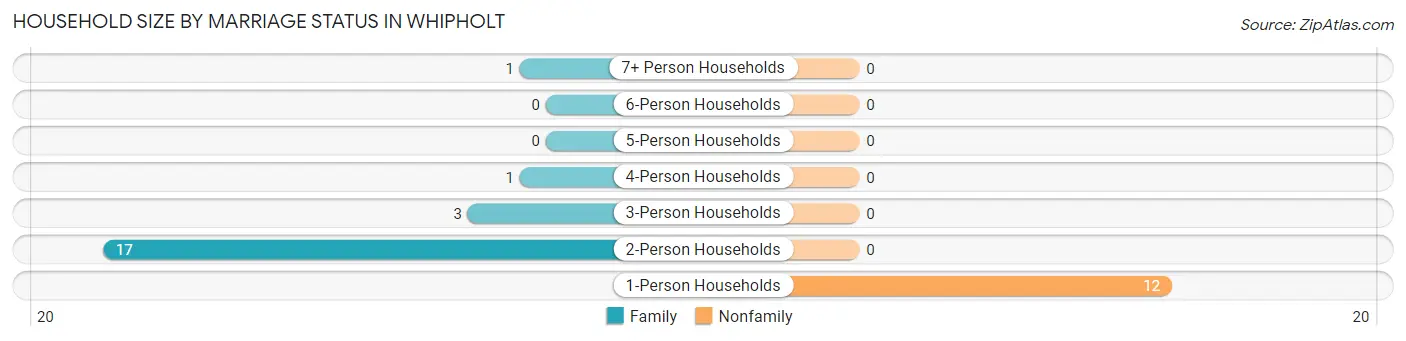
Household Size by Marriage Status in Whipholt
Out of a total of 34 households in Whipholt, 22 (64.7%) are family households, while 12 (35.3%) are nonfamily households. The most numerous type of family households are 2-person households, comprising 17, and the most common type of nonfamily households are 1-person households, comprising 12.
| Household Size | Family Households | Nonfamily Households |
| 1-Person Households | - | 12 (35.3%) |
| 2-Person Households | 17 (50.0%) | 0 (0.0%) |
| 3-Person Households | 3 (8.8%) | 0 (0.0%) |
| 4-Person Households | 1 (2.9%) | 0 (0.0%) |
| 5-Person Households | 0 (0.0%) | 0 (0.0%) |
| 6-Person Households | 0 (0.0%) | 0 (0.0%) |
| 7+ Person Households | 1 (2.9%) | 0 (0.0%) |
| Total | 22 (64.7%) | 12 (35.3%) |
Female Fertility in Whipholt
Fertility by Age in Whipholt
| Age Bracket | Women with Births | Births / 1,000 Women |
| 15 to 19 years | 0 (0.0%) | 0.0 |
| 20 to 34 years | 0 (0.0%) | 0.0 |
| 35 to 50 years | 0 (0.0%) | 0.0 |
| Total | 0 (0.0%) | 0.0 |
Fertility by Age by Marriage Status in Whipholt
| Age Bracket | Married | Unmarried |
| 15 to 19 years | 0 (0.0%) | 0 (0.0%) |
| 20 to 34 years | 0 (0.0%) | 0 (0.0%) |
| 35 to 50 years | 0 (0.0%) | 0 (0.0%) |
| Total | 0 (0.0%) | 0 (0.0%) |
Fertility by Education in Whipholt
| Educational Attainment | Women with Births | Births / 1,000 Women |
| Less than High School | 0 (0.0%) | 0.0 |
| High School Diploma | 0 (0.0%) | 0.0 |
| College or Associate's Degree | 0 (0.0%) | 0.0 |
| Bachelor's Degree | 0 (0.0%) | 0.0 |
| Graduate Degree | 0 (0.0%) | 0.0 |
| Total | 0 (0.0%) | 0.0 |
Fertility by Education by Marriage Status in Whipholt
| Educational Attainment | Married | Unmarried |
| Less than High School | 0 (0.0%) | 0 (0.0%) |
| High School Diploma | 0 (0.0%) | 0 (0.0%) |
| College or Associate's Degree | 0 (0.0%) | 0 (0.0%) |
| Bachelor's Degree | 0 (0.0%) | 0 (0.0%) |
| Graduate Degree | 0 (0.0%) | 0 (0.0%) |
| Total | 0 (0.0%) | 0 (0.0%) |
Employment Characteristics in Whipholt
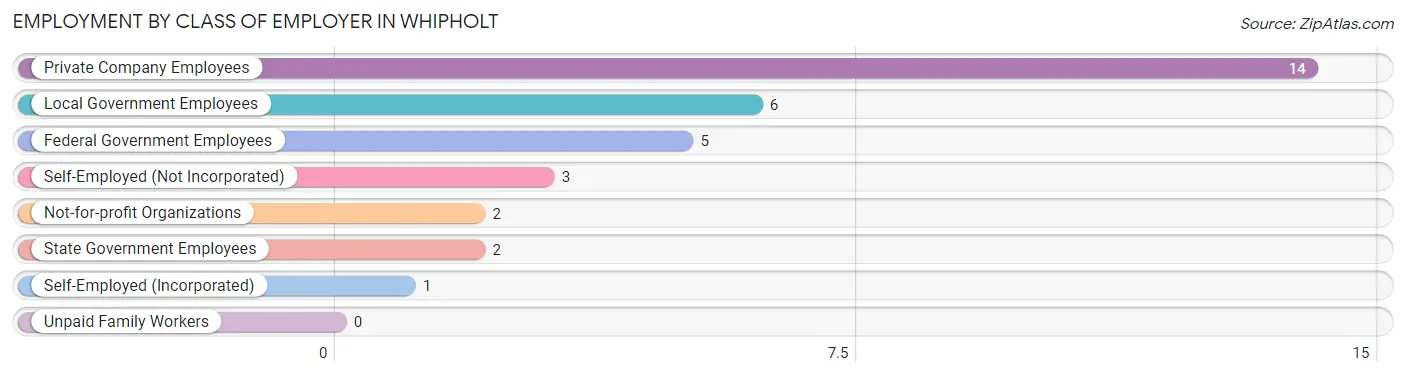
Employment by Class of Employer in Whipholt
Among the 33 employed individuals in Whipholt, private company employees (14 | 42.4%), local government employees (6 | 18.2%), and federal government employees (5 | 15.1%) make up the most common classes of employment.
| Employer Class | # Employees | % Employees |
| Private Company Employees | 14 | 42.4% |
| Self-Employed (Incorporated) | 1 | 3.0% |
| Self-Employed (Not Incorporated) | 3 | 9.1% |
| Not-for-profit Organizations | 2 | 6.1% |
| Local Government Employees | 6 | 18.2% |
| State Government Employees | 2 | 6.1% |
| Federal Government Employees | 5 | 15.1% |
| Unpaid Family Workers | 0 | 0.0% |
| Total | 33 | 100.0% |
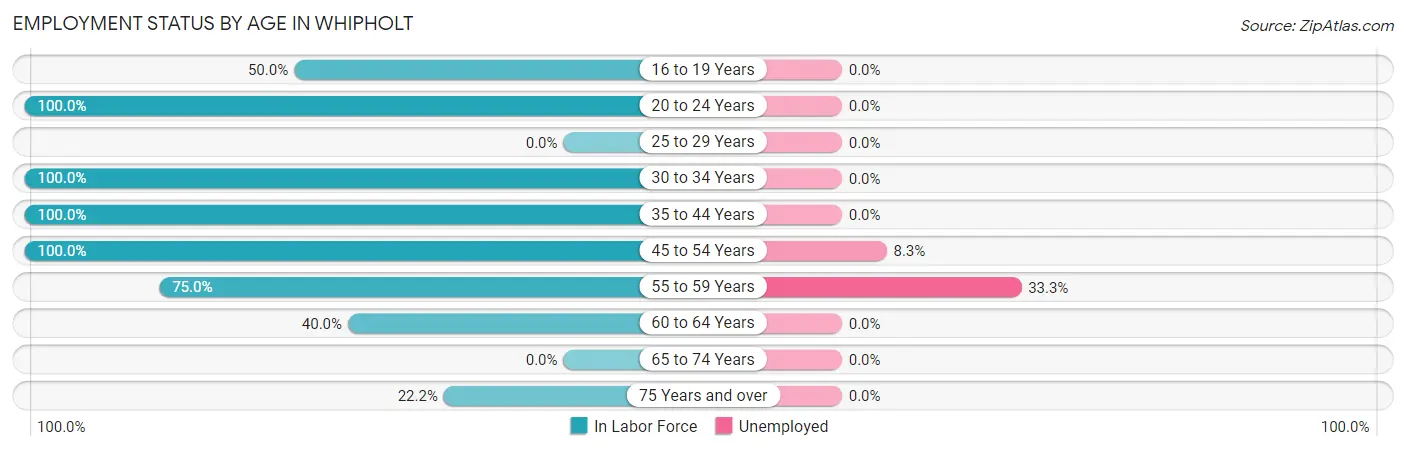
Employment Status by Age in Whipholt
According to the labor force statistics for Whipholt, out of the total population over 16 years of age (65), 55.4% or 36 individuals are in the labor force, with 8.3% or 3 of them unemployed. The age group with the highest labor force participation rate is 20 to 24 years, with 100.0% or 2 individuals in the labor force. Within the labor force, the 55 to 59 years age range has the highest percentage of unemployed individuals, with 33.3% or 2 of them being unemployed.
| Age Bracket | In Labor Force | Unemployed |
| 16 to 19 Years | 2 (50.0%) | 0 (0.0%) |
| 20 to 24 Years | 2 (100.0%) | 0 (0.0%) |
| 25 to 29 Years | 0 (0.0%) | 0 (0.0%) |
| 30 to 34 Years | 5 (100.0%) | 0 (0.0%) |
| 35 to 44 Years | 5 (100.0%) | 0 (0.0%) |
| 45 to 54 Years | 12 (100.0%) | 1 (8.3%) |
| 55 to 59 Years | 6 (75.0%) | 2 (33.3%) |
| 60 to 64 Years | 2 (40.0%) | 0 (0.0%) |
| 65 to 74 Years | 0 (0.0%) | 0 (0.0%) |
| 75 Years and over | 2 (22.2%) | 0 (0.0%) |
| Total | 36 (55.4%) | 3 (8.3%) |
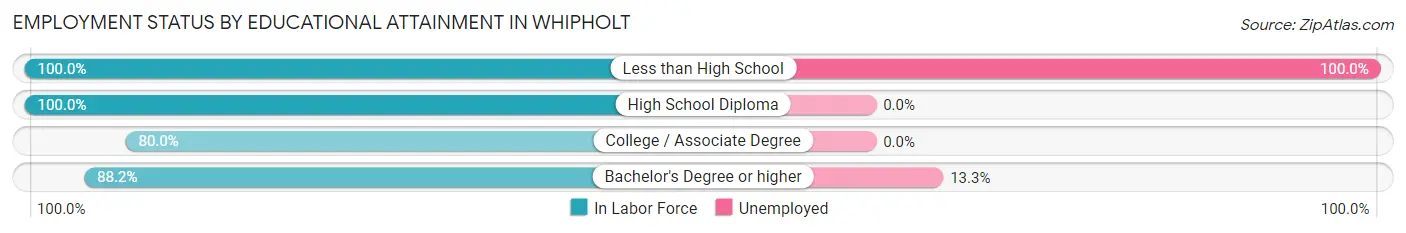
Employment Status by Educational Attainment in Whipholt
According to labor force statistics for Whipholt, 85.7% of individuals (30) out of the total population between 25 and 64 years of age (35) are in the labor force, with 10.0% or 3 of them being unemployed. The group with the highest labor force participation rate are those with the educational attainment of less than high school, with 100.0% or 1 individuals in the labor force. Within the labor force, individuals with less than high school education have the highest percentage of unemployment, with 100.0% or 1 of them being unemployed.
| Educational Attainment | In Labor Force | Unemployed |
| Less than High School | 1 (100.0%) | 1 (100.0%) |
| High School Diploma | 2 (100.0%) | 0 (0.0%) |
| College / Associate Degree | 12 (80.0%) | 0 (0.0%) |
| Bachelor's Degree or higher | 15 (88.2%) | 2 (13.3%) |
| Total | 30 (85.7%) | 4 (10.0%) |
Employment Occupations by Sex in Whipholt
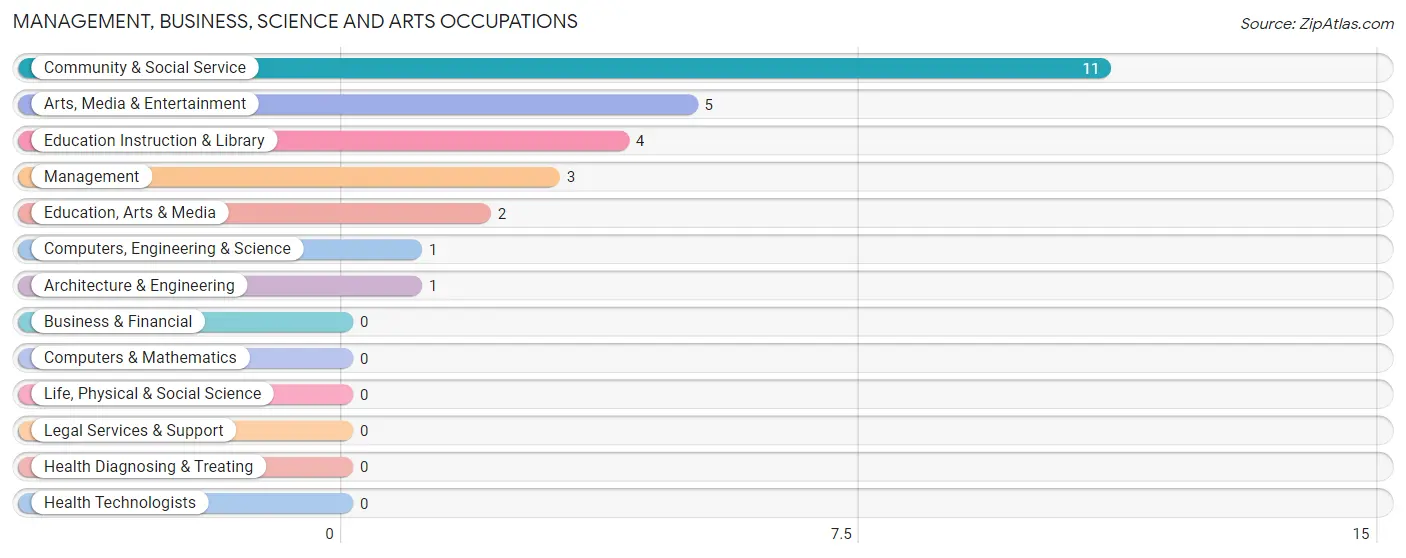
Management, Business, Science and Arts Occupations
The most common Management, Business, Science and Arts occupations in Whipholt are Community & Social Service (11 | 33.3%), Arts, Media & Entertainment (5 | 15.1%), Education Instruction & Library (4 | 12.1%), Management (3 | 9.1%), and Education, Arts & Media (2 | 6.1%).
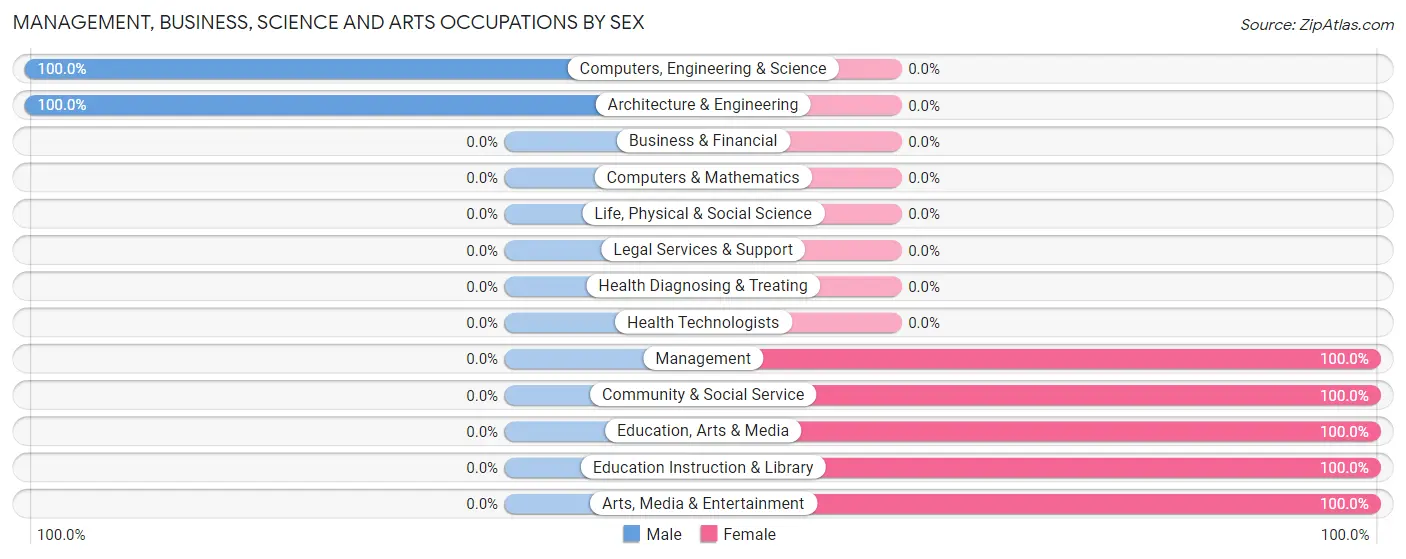
Management, Business, Science and Arts Occupations by Sex
Within the Management, Business, Science and Arts occupations in Whipholt, the most male-oriented occupations are Computers, Engineering & Science (100.0%), and Architecture & Engineering (100.0%), while the most female-oriented occupations are Management (100.0%), Community & Social Service (100.0%), and Education, Arts & Media (100.0%).
| Occupation | Male | Female |
| Management | 0 (0.0%) | 3 (100.0%) |
| Business & Financial | 0 (0.0%) | 0 (0.0%) |
| Computers, Engineering & Science | 1 (100.0%) | 0 (0.0%) |
| Computers & Mathematics | 0 (0.0%) | 0 (0.0%) |
| Architecture & Engineering | 1 (100.0%) | 0 (0.0%) |
| Life, Physical & Social Science | 0 (0.0%) | 0 (0.0%) |
| Community & Social Service | 0 (0.0%) | 11 (100.0%) |
| Education, Arts & Media | 0 (0.0%) | 2 (100.0%) |
| Legal Services & Support | 0 (0.0%) | 0 (0.0%) |
| Education Instruction & Library | 0 (0.0%) | 4 (100.0%) |
| Arts, Media & Entertainment | 0 (0.0%) | 5 (100.0%) |
| Health Diagnosing & Treating | 0 (0.0%) | 0 (0.0%) |
| Health Technologists | 0 (0.0%) | 0 (0.0%) |
| Total (Category) | 1 (6.7%) | 14 (93.3%) |
| Total (Overall) | 11 (33.3%) | 22 (66.7%) |
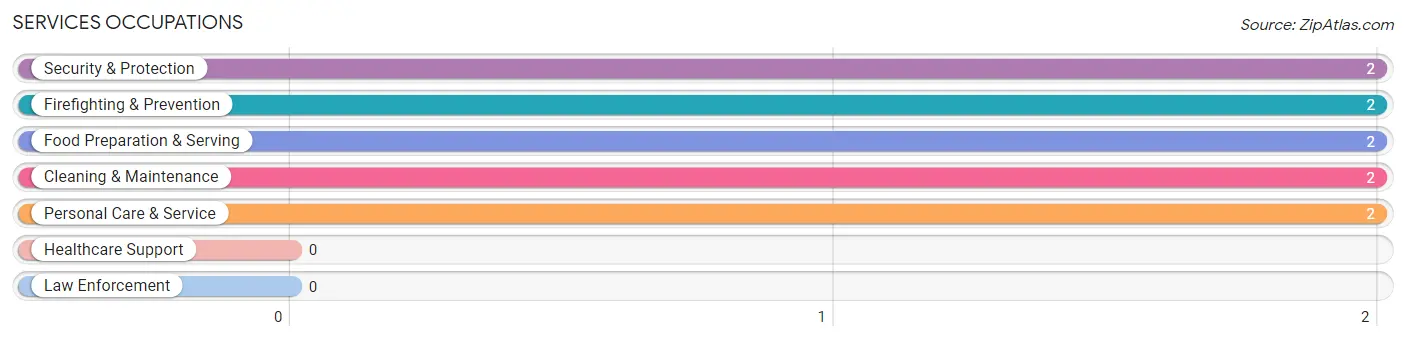
Services Occupations
The most common Services occupations in Whipholt are Security & Protection (2 | 6.1%), Firefighting & Prevention (2 | 6.1%), Food Preparation & Serving (2 | 6.1%), Cleaning & Maintenance (2 | 6.1%), and Personal Care & Service (2 | 6.1%).
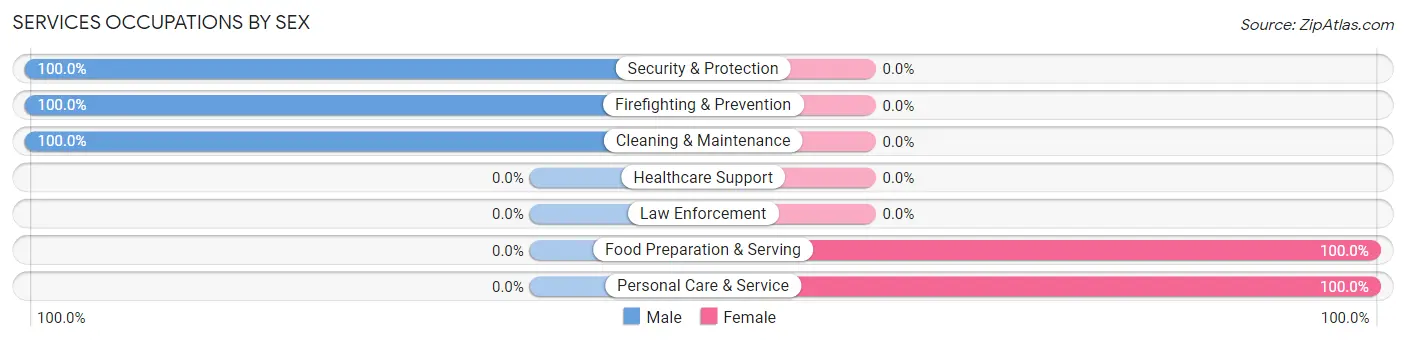
Services Occupations by Sex
Within the Services occupations in Whipholt, the most male-oriented occupations are Security & Protection (100.0%), Firefighting & Prevention (100.0%), and Cleaning & Maintenance (100.0%), while the most female-oriented occupations are Food Preparation & Serving (100.0%), and Personal Care & Service (100.0%).
| Occupation | Male | Female |
| Healthcare Support | 0 (0.0%) | 0 (0.0%) |
| Security & Protection | 2 (100.0%) | 0 (0.0%) |
| Firefighting & Prevention | 2 (100.0%) | 0 (0.0%) |
| Law Enforcement | 0 (0.0%) | 0 (0.0%) |
| Food Preparation & Serving | 0 (0.0%) | 2 (100.0%) |
| Cleaning & Maintenance | 2 (100.0%) | 0 (0.0%) |
| Personal Care & Service | 0 (0.0%) | 2 (100.0%) |
| Total (Category) | 4 (50.0%) | 4 (50.0%) |
| Total (Overall) | 11 (33.3%) | 22 (66.7%) |
Sales and Office Occupations
The most common Sales and Office occupations in Whipholt are , and Sales & Related (4 | 12.1%).
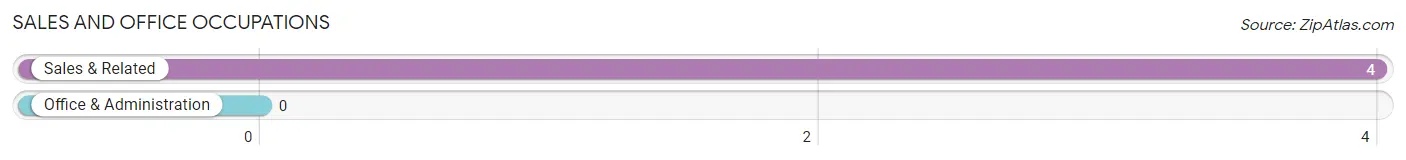
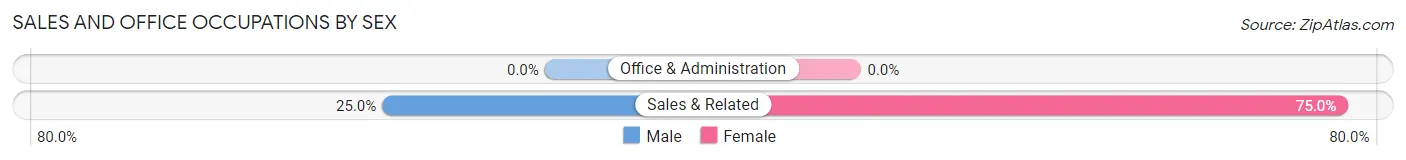
Sales and Office Occupations by Sex
| Occupation | Male | Female |
| Sales & Related | 1 (25.0%) | 3 (75.0%) |
| Office & Administration | 0 (0.0%) | 0 (0.0%) |
| Total (Category) | 1 (25.0%) | 3 (75.0%) |
| Total (Overall) | 11 (33.3%) | 22 (66.7%) |
Natural Resources, Construction and Maintenance Occupations
The most common Natural Resources, Construction and Maintenance occupations in Whipholt are Construction & Extraction (3 | 9.1%), and Installation, Maintenance & Repair (2 | 6.1%).
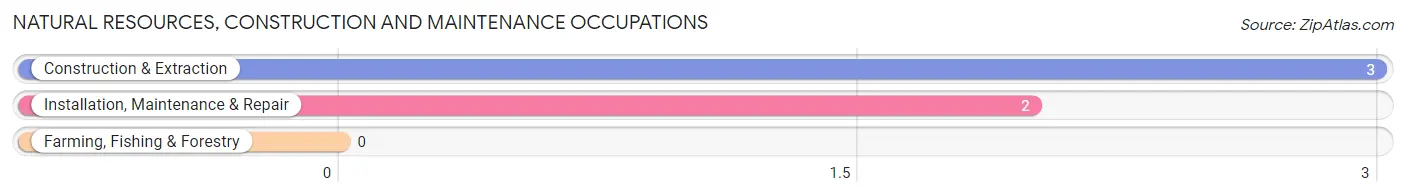
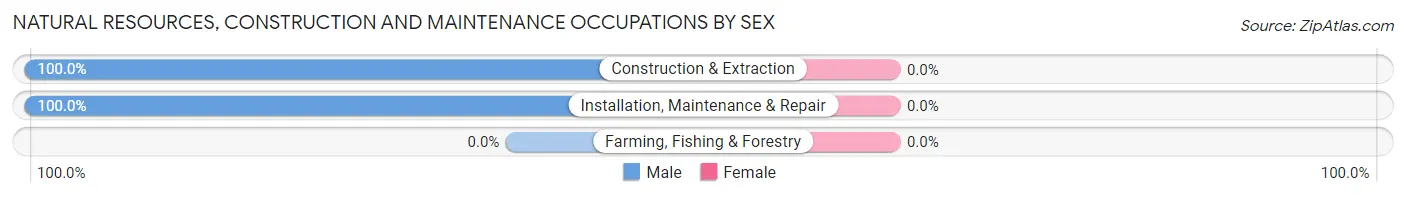
Natural Resources, Construction and Maintenance Occupations by Sex
| Occupation | Male | Female |
| Farming, Fishing & Forestry | 0 (0.0%) | 0 (0.0%) |
| Construction & Extraction | 3 (100.0%) | 0 (0.0%) |
| Installation, Maintenance & Repair | 2 (100.0%) | 0 (0.0%) |
| Total (Category) | 5 (100.0%) | 0 (0.0%) |
| Total (Overall) | 11 (33.3%) | 22 (66.7%) |
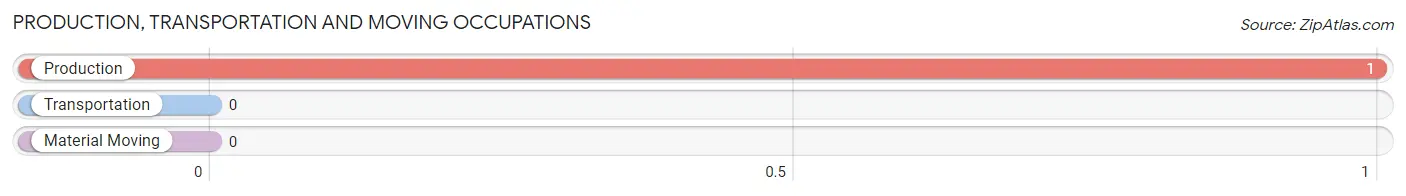
Production, Transportation and Moving Occupations
The most common Production, Transportation and Moving occupations in Whipholt are , and Production (1 | 3.0%).
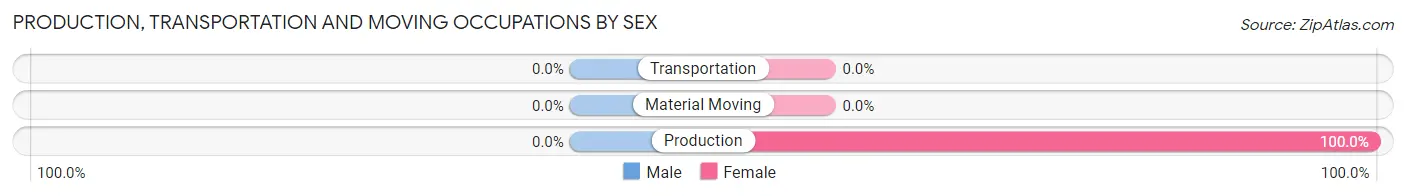
Production, Transportation and Moving Occupations by Sex
| Occupation | Male | Female |
| Production | 0 (0.0%) | 1 (100.0%) |
| Transportation | 0 (0.0%) | 0 (0.0%) |
| Material Moving | 0 (0.0%) | 0 (0.0%) |
| Total (Category) | 0 (0.0%) | 1 (100.0%) |
| Total (Overall) | 11 (33.3%) | 22 (66.7%) |
Employment Industries by Sex in Whipholt
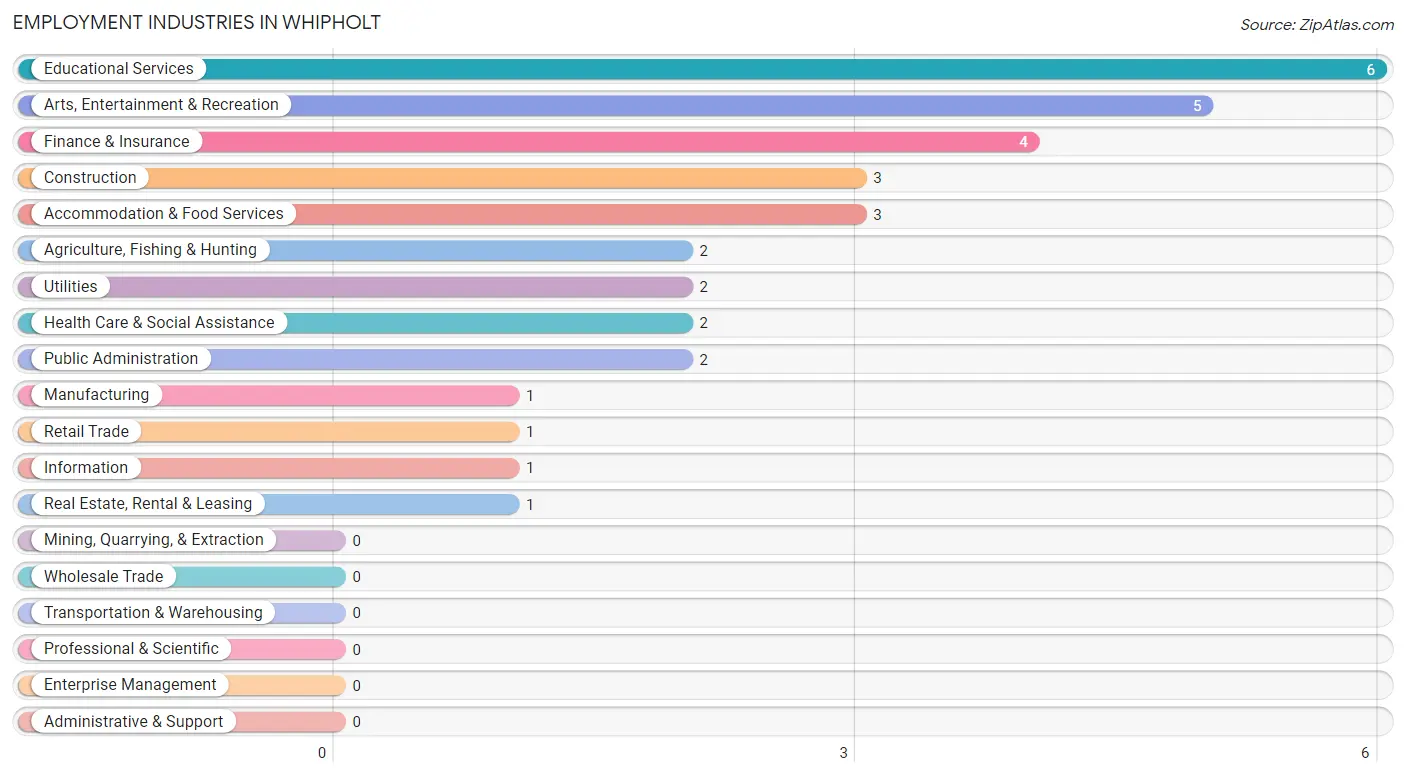
Employment Industries in Whipholt
The major employment industries in Whipholt include Educational Services (6 | 18.2%), Arts, Entertainment & Recreation (5 | 15.1%), Finance & Insurance (4 | 12.1%), Construction (3 | 9.1%), and Accommodation & Food Services (3 | 9.1%).
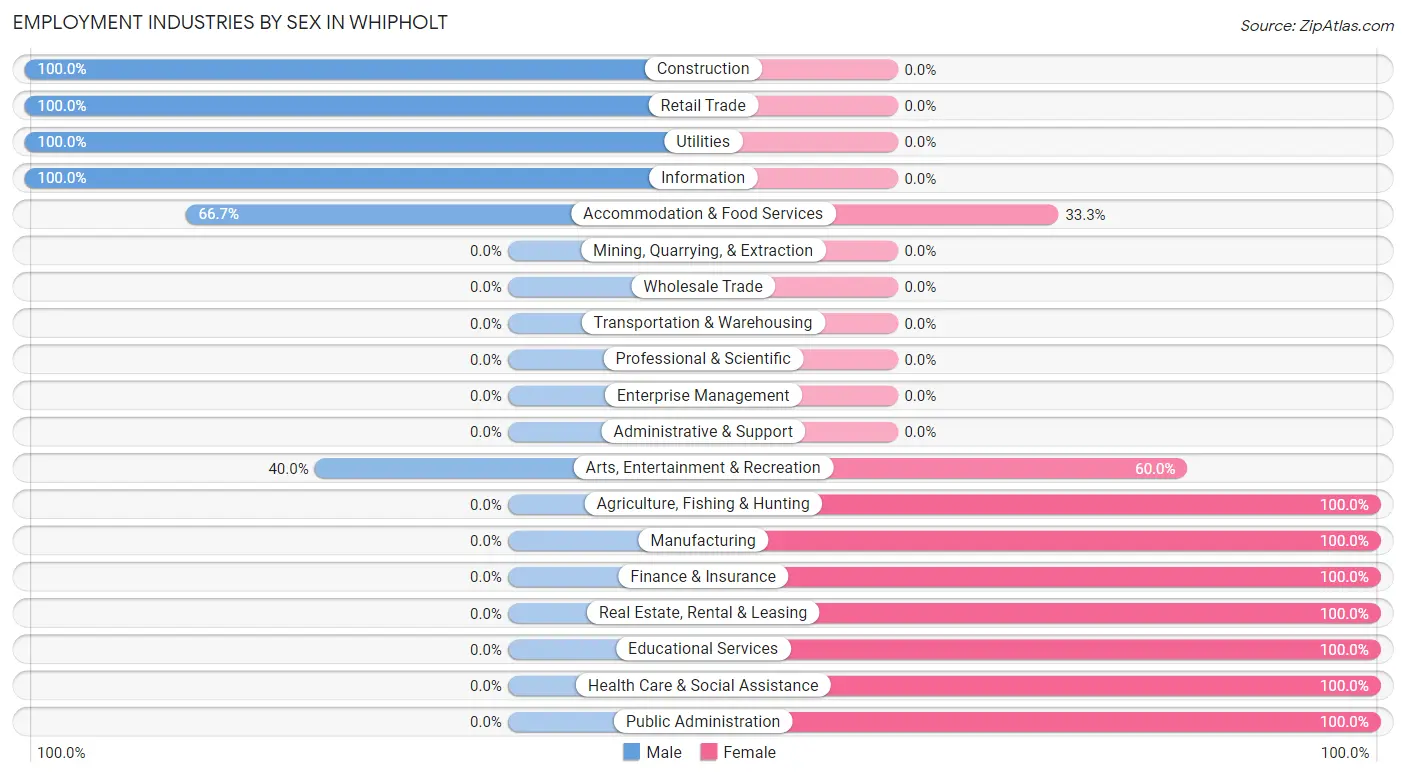
Employment Industries by Sex in Whipholt
The Whipholt industries that see more men than women are Construction (100.0%), Retail Trade (100.0%), and Utilities (100.0%), whereas the industries that tend to have a higher number of women are Agriculture, Fishing & Hunting (100.0%), Manufacturing (100.0%), and Finance & Insurance (100.0%).
| Industry | Male | Female |
| Agriculture, Fishing & Hunting | 0 (0.0%) | 2 (100.0%) |
| Mining, Quarrying, & Extraction | 0 (0.0%) | 0 (0.0%) |
| Construction | 3 (100.0%) | 0 (0.0%) |
| Manufacturing | 0 (0.0%) | 1 (100.0%) |
| Wholesale Trade | 0 (0.0%) | 0 (0.0%) |
| Retail Trade | 1 (100.0%) | 0 (0.0%) |
| Transportation & Warehousing | 0 (0.0%) | 0 (0.0%) |
| Utilities | 2 (100.0%) | 0 (0.0%) |
| Information | 1 (100.0%) | 0 (0.0%) |
| Finance & Insurance | 0 (0.0%) | 4 (100.0%) |
| Real Estate, Rental & Leasing | 0 (0.0%) | 1 (100.0%) |
| Professional & Scientific | 0 (0.0%) | 0 (0.0%) |
| Enterprise Management | 0 (0.0%) | 0 (0.0%) |
| Administrative & Support | 0 (0.0%) | 0 (0.0%) |
| Educational Services | 0 (0.0%) | 6 (100.0%) |
| Health Care & Social Assistance | 0 (0.0%) | 2 (100.0%) |
| Arts, Entertainment & Recreation | 2 (40.0%) | 3 (60.0%) |
| Accommodation & Food Services | 2 (66.7%) | 1 (33.3%) |
| Public Administration | 0 (0.0%) | 2 (100.0%) |
| Total | 11 (33.3%) | 22 (66.7%) |
Education in Whipholt
School Enrollment in Whipholt
The most common levels of schooling among the 13 students in Whipholt are elementary school (3 | 23.1%), kindergarten (2 | 15.4%), and middle school (2 | 15.4%).
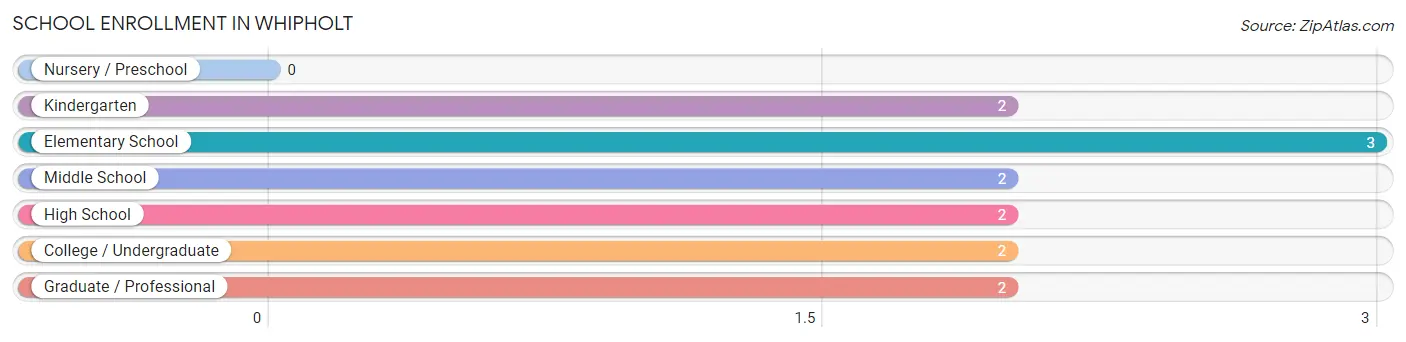
| School Level | # Students | % Students |
| Nursery / Preschool | 0 | 0.0% |
| Kindergarten | 2 | 15.4% |
| Elementary School | 3 | 23.1% |
| Middle School | 2 | 15.4% |
| High School | 2 | 15.4% |
| College / Undergraduate | 2 | 15.4% |
| Graduate / Professional | 2 | 15.4% |
| Total | 13 | 100.0% |
School Enrollment by Age by Funding Source in Whipholt
Out of a total of 13 students who are enrolled in schools in Whipholt, 6 (46.2%) attend a private institution, while the remaining 7 (53.8%) are enrolled in public schools. The age group of 10 to 14 year olds has the highest likelihood of being enrolled in private schools, with 2 (100.0% in the age bracket) enrolled. Conversely, the age group of 20 to 24 year olds has the lowest likelihood of being enrolled in a private school, with 2 (100.0% in the age bracket) attending a public institution.
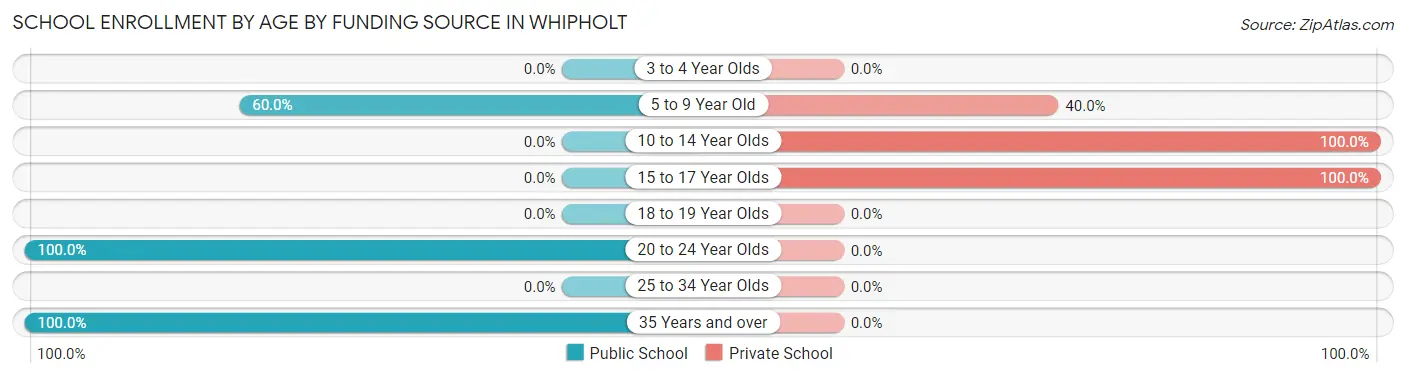
| Age Bracket | Public School | Private School |
| 3 to 4 Year Olds | 0 (0.0%) | 0 (0.0%) |
| 5 to 9 Year Old | 3 (60.0%) | 2 (40.0%) |
| 10 to 14 Year Olds | 0 (0.0%) | 2 (100.0%) |
| 15 to 17 Year Olds | 0 (0.0%) | 2 (100.0%) |
| 18 to 19 Year Olds | 0 (0.0%) | 0 (0.0%) |
| 20 to 24 Year Olds | 2 (100.0%) | 0 (0.0%) |
| 25 to 34 Year Olds | 0 (0.0%) | 0 (0.0%) |
| 35 Years and over | 2 (100.0%) | 0 (0.0%) |
| Total | 7 (53.8%) | 6 (46.2%) |
Educational Attainment by Field of Study in Whipholt
Education (8 | 28.6%), business (6 | 21.4%), bio, nature & agricultural (4 | 14.3%), liberal arts & history (4 | 14.3%), and literature & languages (2 | 7.1%) are the most common fields of study among 28 individuals in Whipholt who have obtained a bachelor's degree or higher.
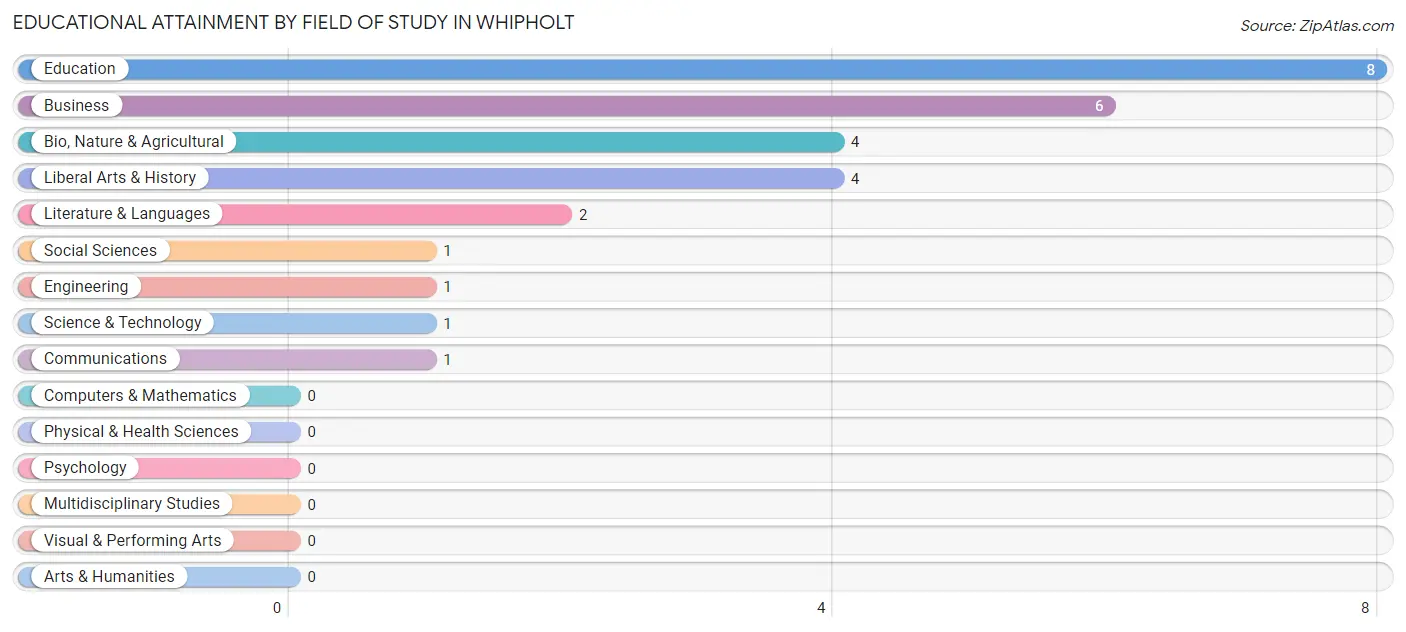
| Field of Study | # Graduates | % Graduates |
| Computers & Mathematics | 0 | 0.0% |
| Bio, Nature & Agricultural | 4 | 14.3% |
| Physical & Health Sciences | 0 | 0.0% |
| Psychology | 0 | 0.0% |
| Social Sciences | 1 | 3.6% |
| Engineering | 1 | 3.6% |
| Multidisciplinary Studies | 0 | 0.0% |
| Science & Technology | 1 | 3.6% |
| Business | 6 | 21.4% |
| Education | 8 | 28.6% |
| Literature & Languages | 2 | 7.1% |
| Liberal Arts & History | 4 | 14.3% |
| Visual & Performing Arts | 0 | 0.0% |
| Communications | 1 | 3.6% |
| Arts & Humanities | 0 | 0.0% |
| Total | 28 | 100.0% |
Transportation & Commute in Whipholt
Vehicle Availability by Sex in Whipholt
The most prevalent vehicle ownership categories in Whipholt are males with 4 vehicles (5, accounting for 45.5%) and females with 4 vehicles (10, making up 22.7%).
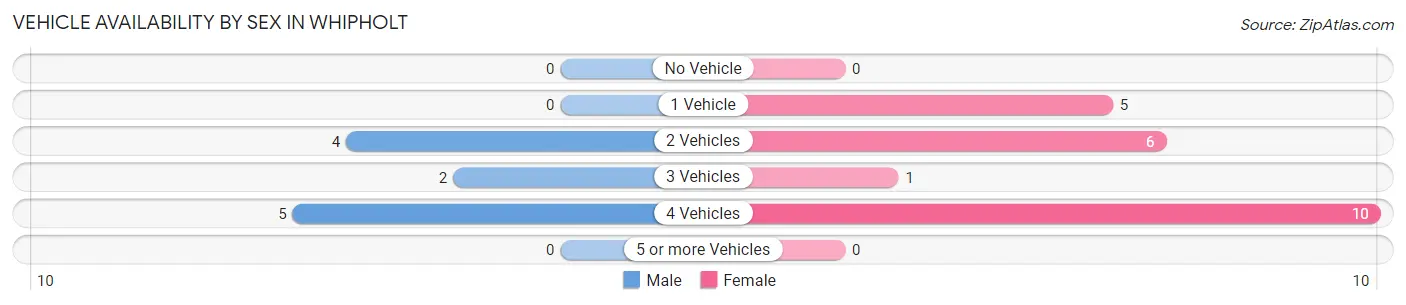
| Vehicles Available | Male | Female |
| No Vehicle | 0 (0.0%) | 0 (0.0%) |
| 1 Vehicle | 0 (0.0%) | 5 (22.7%) |
| 2 Vehicles | 4 (36.4%) | 6 (27.3%) |
| 3 Vehicles | 2 (18.2%) | 1 (4.5%) |
| 4 Vehicles | 5 (45.5%) | 10 (45.5%) |
| 5 or more Vehicles | 0 (0.0%) | 0 (0.0%) |
| Total | 11 (100.0%) | 22 (100.0%) |
Commute Time in Whipholt
The most frequently occuring commute durations in Whipholt are 20 to 24 minutes (6 commuters, 21.4%), 15 to 19 minutes (5 commuters, 17.9%), and 45 to 59 minutes (5 commuters, 17.9%).
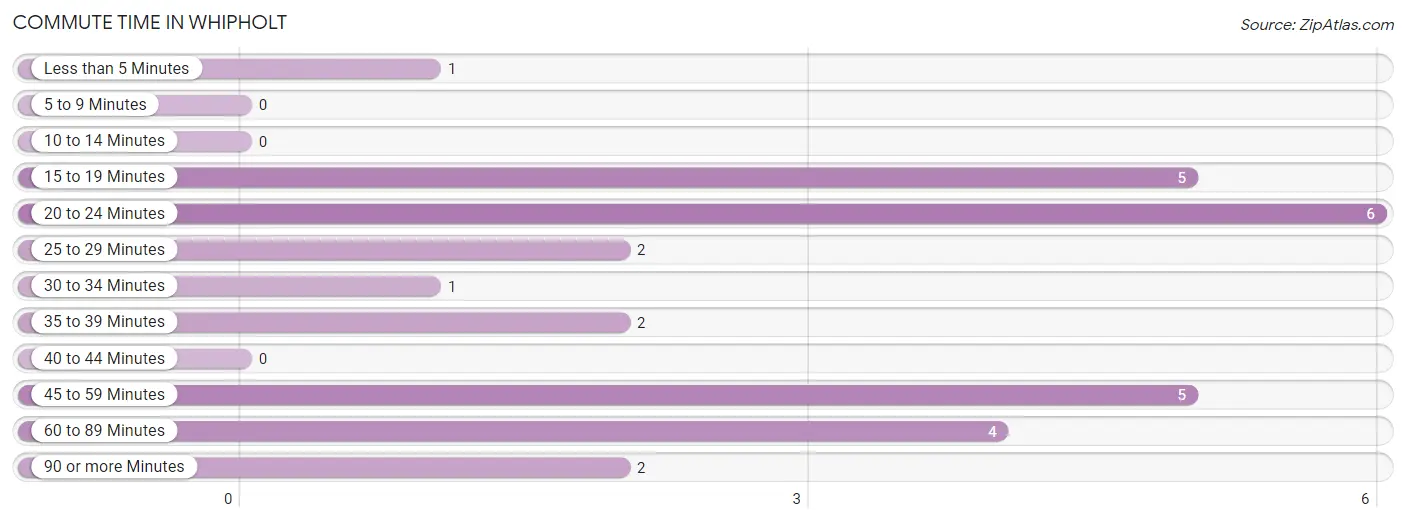
| Commute Time | # Commuters | % Commuters |
| Less than 5 Minutes | 1 | 3.6% |
| 5 to 9 Minutes | 0 | 0.0% |
| 10 to 14 Minutes | 0 | 0.0% |
| 15 to 19 Minutes | 5 | 17.9% |
| 20 to 24 Minutes | 6 | 21.4% |
| 25 to 29 Minutes | 2 | 7.1% |
| 30 to 34 Minutes | 1 | 3.6% |
| 35 to 39 Minutes | 2 | 7.1% |
| 40 to 44 Minutes | 0 | 0.0% |
| 45 to 59 Minutes | 5 | 17.9% |
| 60 to 89 Minutes | 4 | 14.3% |
| 90 or more Minutes | 2 | 7.1% |
Commute Time by Sex in Whipholt
The most common commute times in Whipholt are 60 to 89 minutes (4 commuters, 40.0%) for males and 45 to 59 minutes (5 commuters, 27.8%) for females.
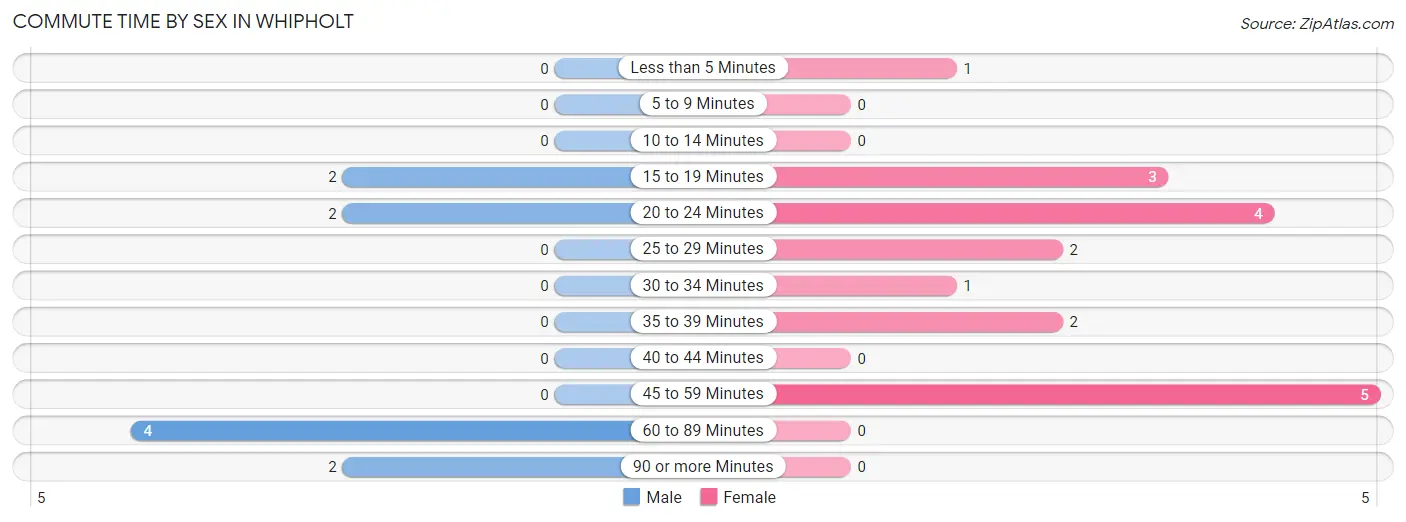
| Commute Time | Male | Female |
| Less than 5 Minutes | 0 (0.0%) | 1 (5.6%) |
| 5 to 9 Minutes | 0 (0.0%) | 0 (0.0%) |
| 10 to 14 Minutes | 0 (0.0%) | 0 (0.0%) |
| 15 to 19 Minutes | 2 (20.0%) | 3 (16.7%) |
| 20 to 24 Minutes | 2 (20.0%) | 4 (22.2%) |
| 25 to 29 Minutes | 0 (0.0%) | 2 (11.1%) |
| 30 to 34 Minutes | 0 (0.0%) | 1 (5.6%) |
| 35 to 39 Minutes | 0 (0.0%) | 2 (11.1%) |
| 40 to 44 Minutes | 0 (0.0%) | 0 (0.0%) |
| 45 to 59 Minutes | 0 (0.0%) | 5 (27.8%) |
| 60 to 89 Minutes | 4 (40.0%) | 0 (0.0%) |
| 90 or more Minutes | 2 (20.0%) | 0 (0.0%) |
Time of Departure to Work by Sex in Whipholt
The most frequent times of departure to work in Whipholt are 6:30 AM to 6:59 AM (4, 40.0%) for males and 7:00 AM to 7:29 AM (7, 38.9%) for females.
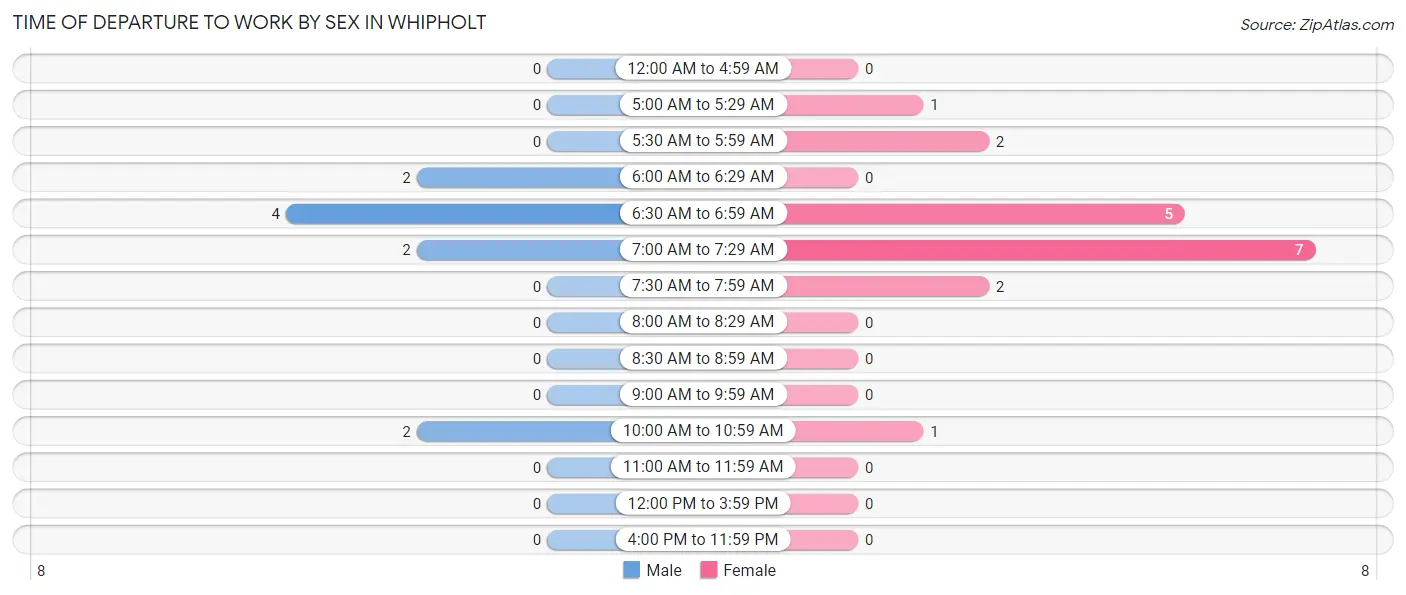
| Time of Departure | Male | Female |
| 12:00 AM to 4:59 AM | 0 (0.0%) | 0 (0.0%) |
| 5:00 AM to 5:29 AM | 0 (0.0%) | 1 (5.6%) |
| 5:30 AM to 5:59 AM | 0 (0.0%) | 2 (11.1%) |
| 6:00 AM to 6:29 AM | 2 (20.0%) | 0 (0.0%) |
| 6:30 AM to 6:59 AM | 4 (40.0%) | 5 (27.8%) |
| 7:00 AM to 7:29 AM | 2 (20.0%) | 7 (38.9%) |
| 7:30 AM to 7:59 AM | 0 (0.0%) | 2 (11.1%) |
| 8:00 AM to 8:29 AM | 0 (0.0%) | 0 (0.0%) |
| 8:30 AM to 8:59 AM | 0 (0.0%) | 0 (0.0%) |
| 9:00 AM to 9:59 AM | 0 (0.0%) | 0 (0.0%) |
| 10:00 AM to 10:59 AM | 2 (20.0%) | 1 (5.6%) |
| 11:00 AM to 11:59 AM | 0 (0.0%) | 0 (0.0%) |
| 12:00 PM to 3:59 PM | 0 (0.0%) | 0 (0.0%) |
| 4:00 PM to 11:59 PM | 0 (0.0%) | 0 (0.0%) |
| Total | 10 (100.0%) | 18 (100.0%) |
Housing Occupancy in Whipholt
Occupancy by Ownership in Whipholt
Of the total 34 dwellings in Whipholt, owner-occupied units account for 28 (82.4%), while renter-occupied units make up 6 (17.6%).
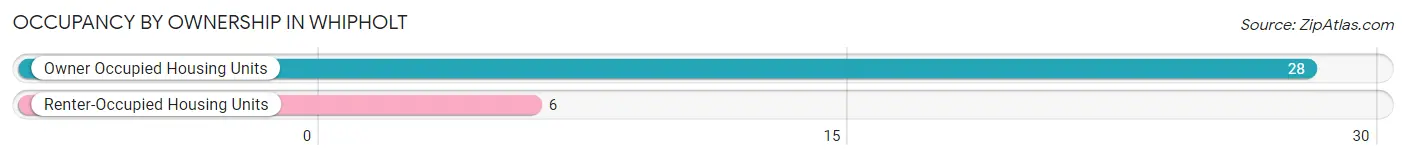
| Occupancy | # Housing Units | % Housing Units |
| Owner Occupied Housing Units | 28 | 82.4% |
| Renter-Occupied Housing Units | 6 | 17.6% |
| Total Occupied Housing Units | 34 | 100.0% |
Occupancy by Household Size in Whipholt
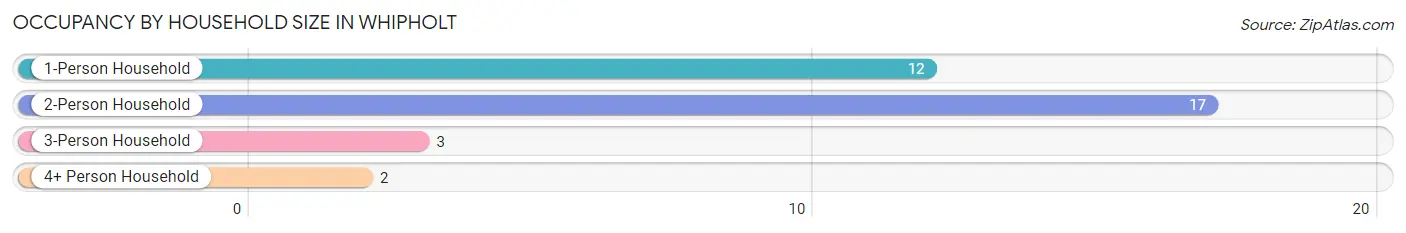
| Household Size | # Housing Units | % Housing Units |
| 1-Person Household | 12 | 35.3% |
| 2-Person Household | 17 | 50.0% |
| 3-Person Household | 3 | 8.8% |
| 4+ Person Household | 2 | 5.9% |
| Total Housing Units | 34 | 100.0% |
Occupancy by Ownership by Household Size in Whipholt
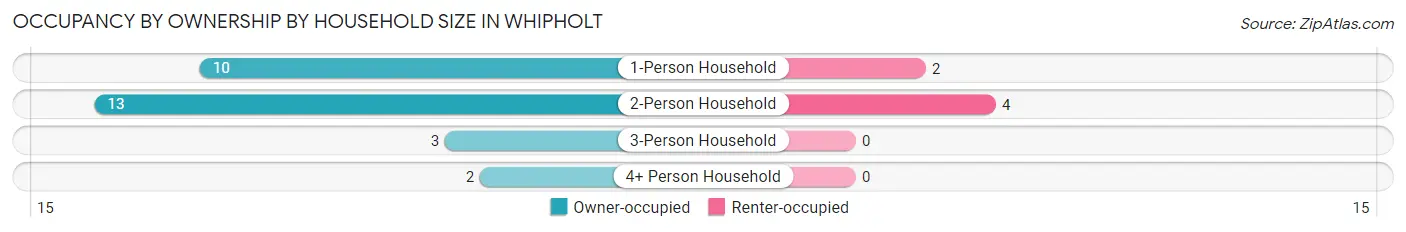
| Household Size | Owner-occupied | Renter-occupied |
| 1-Person Household | 10 (83.3%) | 2 (16.7%) |
| 2-Person Household | 13 (76.5%) | 4 (23.5%) |
| 3-Person Household | 3 (100.0%) | 0 (0.0%) |
| 4+ Person Household | 2 (100.0%) | 0 (0.0%) |
| Total Housing Units | 28 (82.4%) | 6 (17.6%) |
Occupancy by Educational Attainment in Whipholt
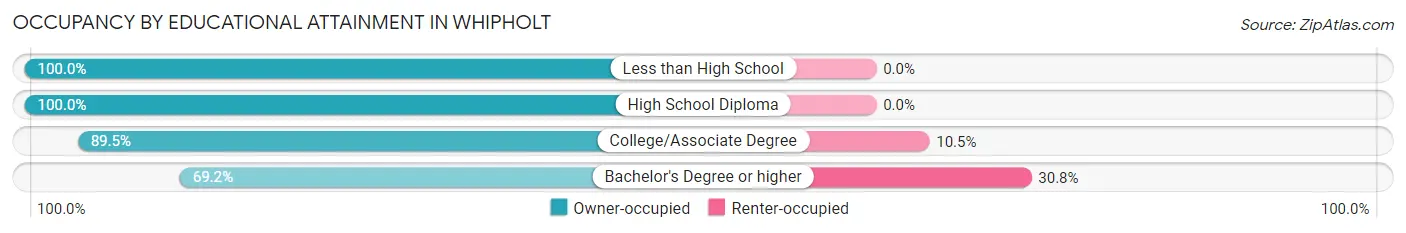
| Household Size | Owner-occupied | Renter-occupied |
| Less than High School | 1 (100.0%) | 0 (0.0%) |
| High School Diploma | 1 (100.0%) | 0 (0.0%) |
| College/Associate Degree | 17 (89.5%) | 2 (10.5%) |
| Bachelor's Degree or higher | 9 (69.2%) | 4 (30.8%) |
Occupancy by Age of Householder in Whipholt
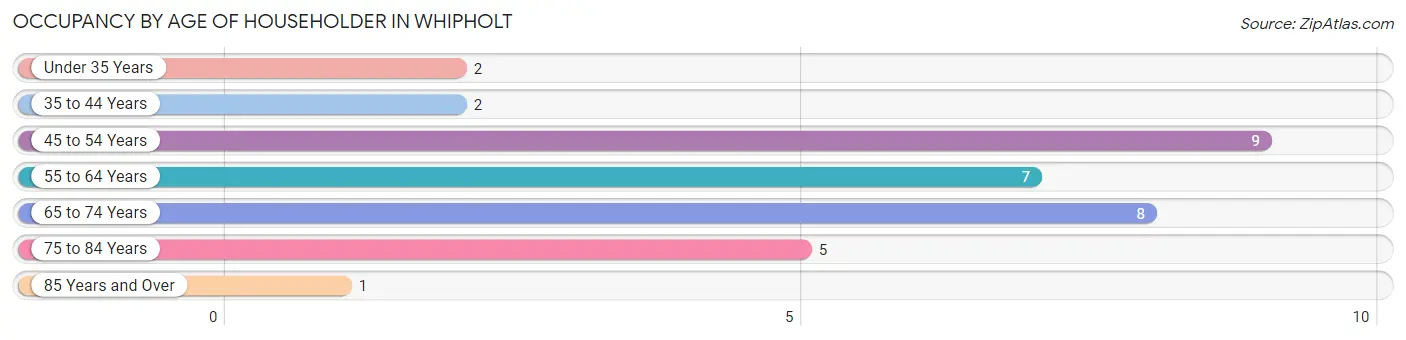
| Age Bracket | # Households | % Households |
| Under 35 Years | 2 | 5.9% |
| 35 to 44 Years | 2 | 5.9% |
| 45 to 54 Years | 9 | 26.5% |
| 55 to 64 Years | 7 | 20.6% |
| 65 to 74 Years | 8 | 23.5% |
| 75 to 84 Years | 5 | 14.7% |
| 85 Years and Over | 1 | 2.9% |
| Total | 34 | 100.0% |
Housing Finances in Whipholt
Median Income by Occupancy in Whipholt
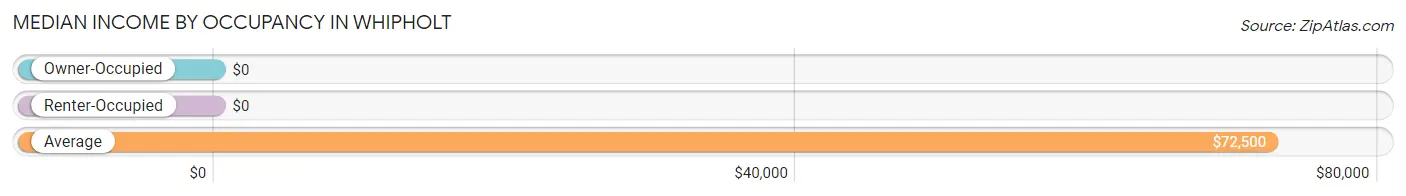
| Occupancy Type | # Households | Median Income |
| Owner-Occupied | 28 (82.4%) | $0 |
| Renter-Occupied | 6 (17.6%) | $0 |
| Average | 34 (100.0%) | $72,500 |
Occupancy by Householder Income Bracket in Whipholt
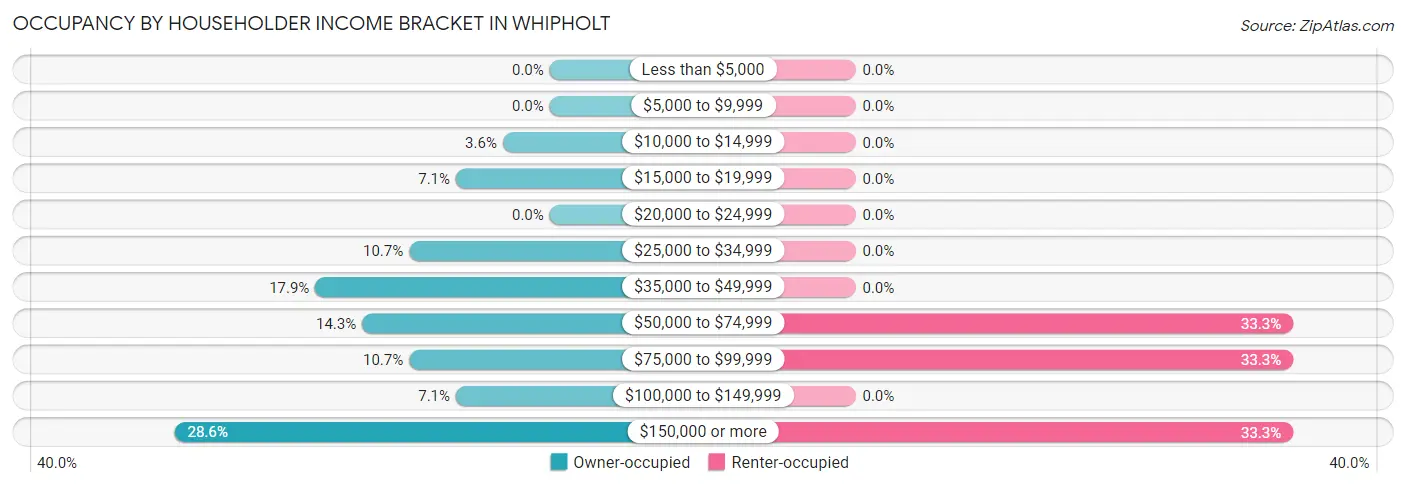
| Income Bracket | Owner-occupied | Renter-occupied |
| Less than $5,000 | 0 (0.0%) | 0 (0.0%) |
| $5,000 to $9,999 | 0 (0.0%) | 0 (0.0%) |
| $10,000 to $14,999 | 1 (3.6%) | 0 (0.0%) |
| $15,000 to $19,999 | 2 (7.1%) | 0 (0.0%) |
| $20,000 to $24,999 | 0 (0.0%) | 0 (0.0%) |
| $25,000 to $34,999 | 3 (10.7%) | 0 (0.0%) |
| $35,000 to $49,999 | 5 (17.9%) | 0 (0.0%) |
| $50,000 to $74,999 | 4 (14.3%) | 2 (33.3%) |
| $75,000 to $99,999 | 3 (10.7%) | 2 (33.3%) |
| $100,000 to $149,999 | 2 (7.1%) | 0 (0.0%) |
| $150,000 or more | 8 (28.6%) | 2 (33.3%) |
| Total | 28 (100.0%) | 6 (100.0%) |
Monthly Housing Cost Tiers in Whipholt
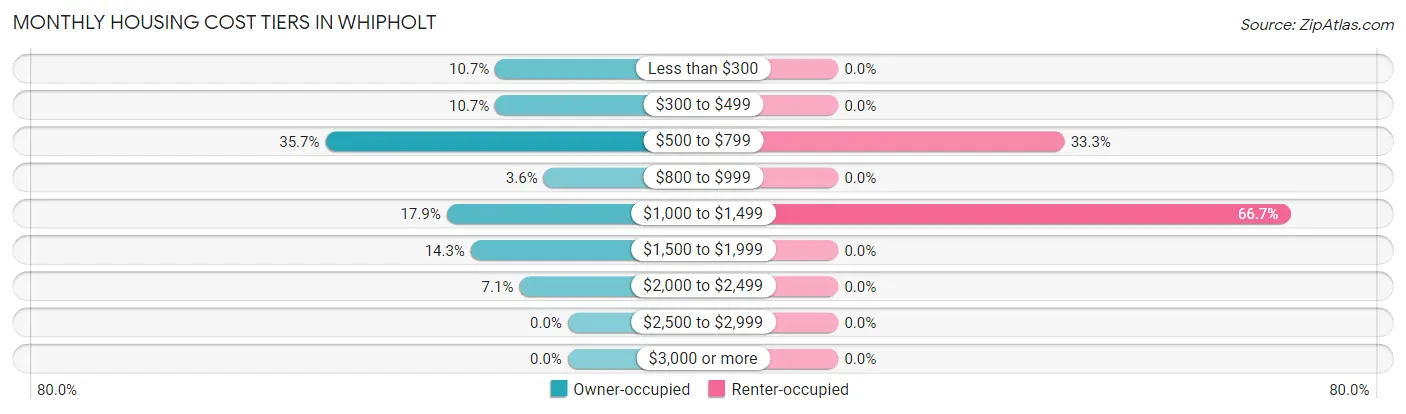
| Monthly Cost | Owner-occupied | Renter-occupied |
| Less than $300 | 3 (10.7%) | 0 (0.0%) |
| $300 to $499 | 3 (10.7%) | 0 (0.0%) |
| $500 to $799 | 10 (35.7%) | 2 (33.3%) |
| $800 to $999 | 1 (3.6%) | 0 (0.0%) |
| $1,000 to $1,499 | 5 (17.9%) | 4 (66.7%) |
| $1,500 to $1,999 | 4 (14.3%) | 0 (0.0%) |
| $2,000 to $2,499 | 2 (7.1%) | 0 (0.0%) |
| $2,500 to $2,999 | 0 (0.0%) | 0 (0.0%) |
| $3,000 or more | 0 (0.0%) | 0 (0.0%) |
| Total | 28 (100.0%) | 6 (100.0%) |
Physical Housing Characteristics in Whipholt
Housing Structures in Whipholt
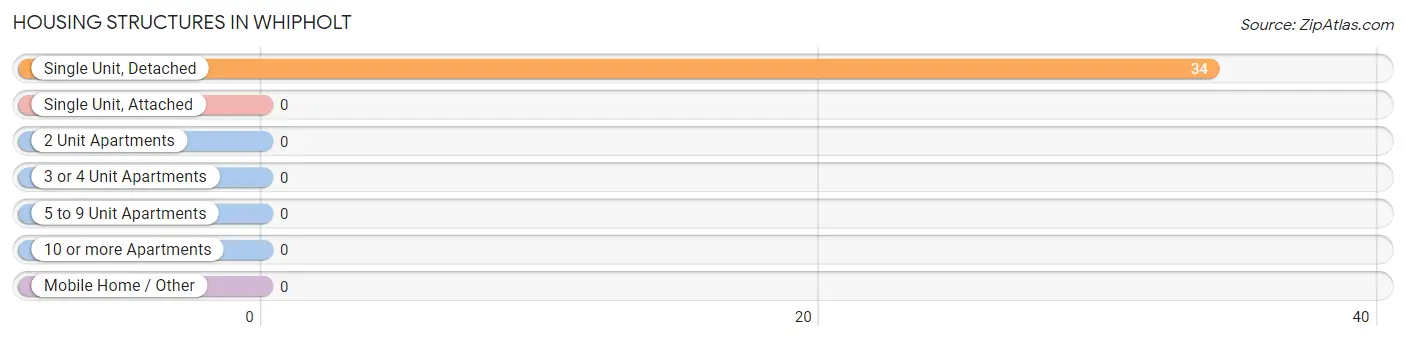
| Structure Type | # Housing Units | % Housing Units |
| Single Unit, Detached | 34 | 100.0% |
| Single Unit, Attached | 0 | 0.0% |
| 2 Unit Apartments | 0 | 0.0% |
| 3 or 4 Unit Apartments | 0 | 0.0% |
| 5 to 9 Unit Apartments | 0 | 0.0% |
| 10 or more Apartments | 0 | 0.0% |
| Mobile Home / Other | 0 | 0.0% |
| Total | 34 | 100.0% |
Housing Structures by Occupancy in Whipholt
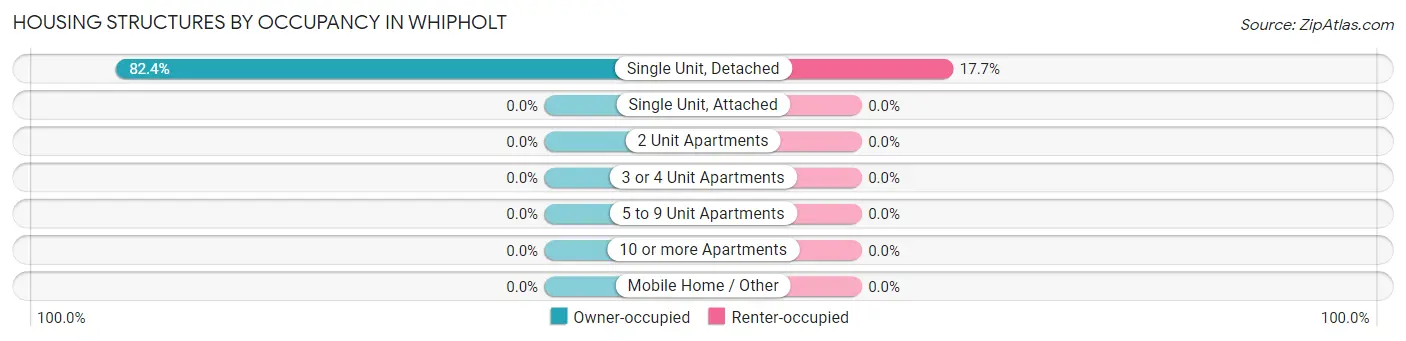
| Structure Type | Owner-occupied | Renter-occupied |
| Single Unit, Detached | 28 (82.4%) | 6 (17.6%) |
| Single Unit, Attached | 0 (0.0%) | 0 (0.0%) |
| 2 Unit Apartments | 0 (0.0%) | 0 (0.0%) |
| 3 or 4 Unit Apartments | 0 (0.0%) | 0 (0.0%) |
| 5 to 9 Unit Apartments | 0 (0.0%) | 0 (0.0%) |
| 10 or more Apartments | 0 (0.0%) | 0 (0.0%) |
| Mobile Home / Other | 0 (0.0%) | 0 (0.0%) |
| Total | 28 (82.4%) | 6 (17.6%) |
Housing Structures by Number of Rooms in Whipholt
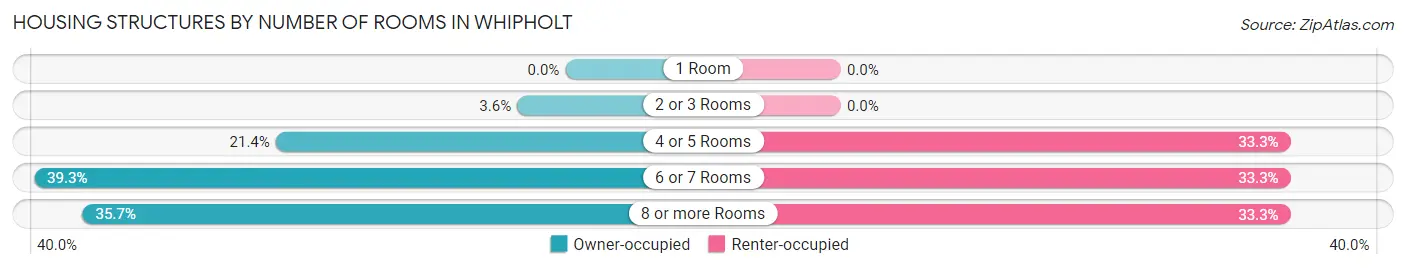
| Number of Rooms | Owner-occupied | Renter-occupied |
| 1 Room | 0 (0.0%) | 0 (0.0%) |
| 2 or 3 Rooms | 1 (3.6%) | 0 (0.0%) |
| 4 or 5 Rooms | 6 (21.4%) | 2 (33.3%) |
| 6 or 7 Rooms | 11 (39.3%) | 2 (33.3%) |
| 8 or more Rooms | 10 (35.7%) | 2 (33.3%) |
| Total | 28 (100.0%) | 6 (100.0%) |
Housing Structure by Heating Type in Whipholt
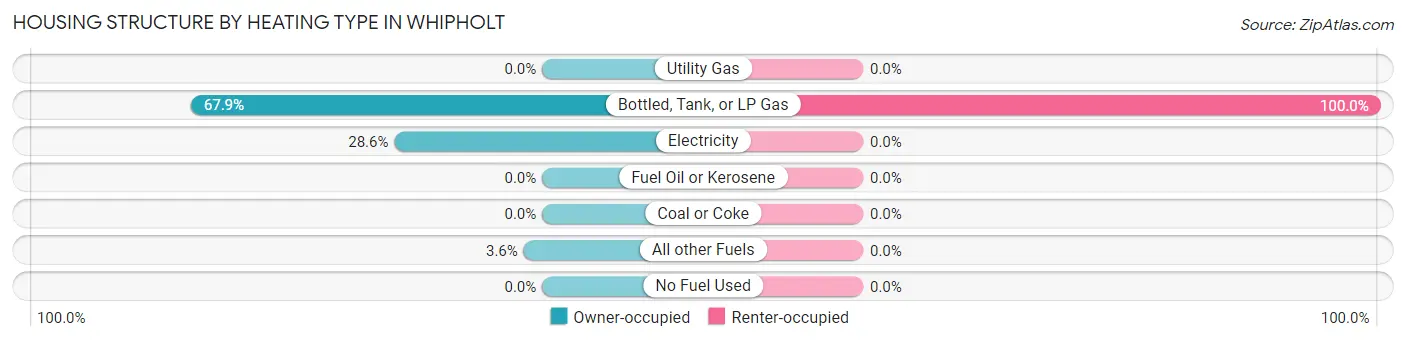
| Heating Type | Owner-occupied | Renter-occupied |
| Utility Gas | 0 (0.0%) | 0 (0.0%) |
| Bottled, Tank, or LP Gas | 19 (67.9%) | 6 (100.0%) |
| Electricity | 8 (28.6%) | 0 (0.0%) |
| Fuel Oil or Kerosene | 0 (0.0%) | 0 (0.0%) |
| Coal or Coke | 0 (0.0%) | 0 (0.0%) |
| All other Fuels | 1 (3.6%) | 0 (0.0%) |
| No Fuel Used | 0 (0.0%) | 0 (0.0%) |
| Total | 28 (100.0%) | 6 (100.0%) |
Household Vehicle Usage in Whipholt
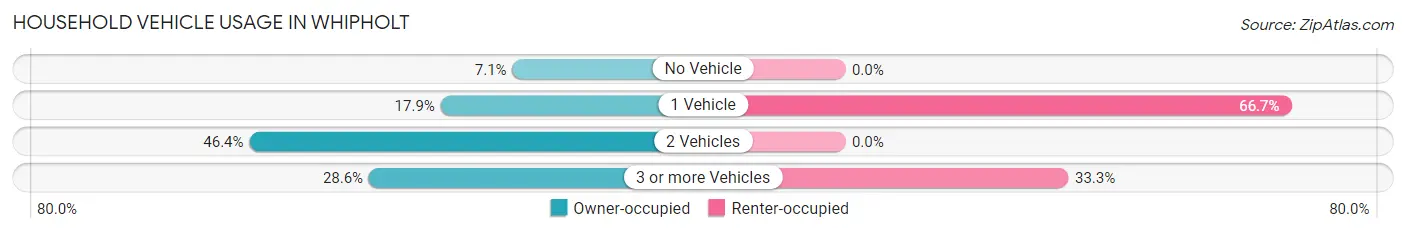
| Vehicles per Household | Owner-occupied | Renter-occupied |
| No Vehicle | 2 (7.1%) | 0 (0.0%) |
| 1 Vehicle | 5 (17.9%) | 4 (66.7%) |
| 2 Vehicles | 13 (46.4%) | 0 (0.0%) |
| 3 or more Vehicles | 8 (28.6%) | 2 (33.3%) |
| Total | 28 (100.0%) | 6 (100.0%) |
Real Estate & Mortgages in Whipholt
Real Estate and Mortgage Overview in Whipholt
| Characteristic | Without Mortgage | With Mortgage |
| Housing Units | 17 | 11 |
| Median Property Value | $287,500 | $237,500 |
| Median Household Income | $51,875 | $5 |
| Monthly Housing Costs | $550 | $0 |
| Real Estate Taxes | $1,125 | $0 |
Property Value by Mortgage Status in Whipholt
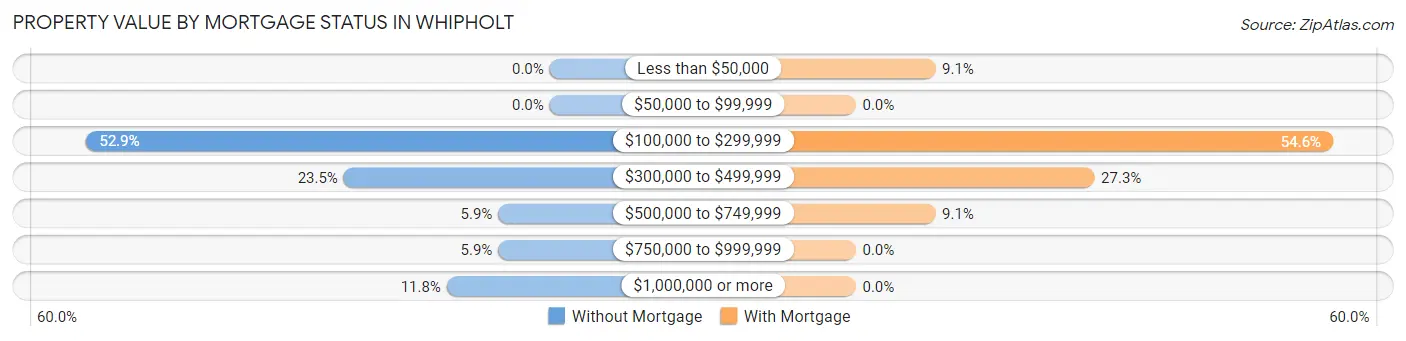
| Property Value | Without Mortgage | With Mortgage |
| Less than $50,000 | 0 (0.0%) | 1 (9.1%) |
| $50,000 to $99,999 | 0 (0.0%) | 0 (0.0%) |
| $100,000 to $299,999 | 9 (52.9%) | 6 (54.5%) |
| $300,000 to $499,999 | 4 (23.5%) | 3 (27.3%) |
| $500,000 to $749,999 | 1 (5.9%) | 1 (9.1%) |
| $750,000 to $999,999 | 1 (5.9%) | 0 (0.0%) |
| $1,000,000 or more | 2 (11.8%) | 0 (0.0%) |
| Total | 17 (100.0%) | 11 (100.0%) |
Household Income by Mortgage Status in Whipholt
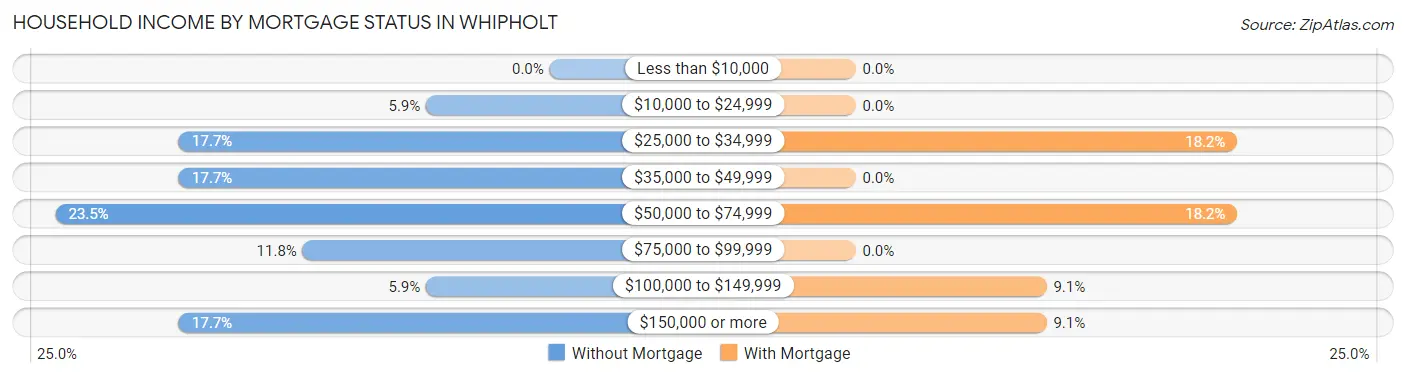
| Household Income | Without Mortgage | With Mortgage |
| Less than $10,000 | 0 (0.0%) | 0 (0.0%) |
| $10,000 to $24,999 | 1 (5.9%) | 0 (0.0%) |
| $25,000 to $34,999 | 3 (17.6%) | 2 (18.2%) |
| $35,000 to $49,999 | 3 (17.6%) | 0 (0.0%) |
| $50,000 to $74,999 | 4 (23.5%) | 2 (18.2%) |
| $75,000 to $99,999 | 2 (11.8%) | 0 (0.0%) |
| $100,000 to $149,999 | 1 (5.9%) | 1 (9.1%) |
| $150,000 or more | 3 (17.6%) | 1 (9.1%) |
| Total | 17 (100.0%) | 11 (100.0%) |
Property Value to Household Income Ratio in Whipholt
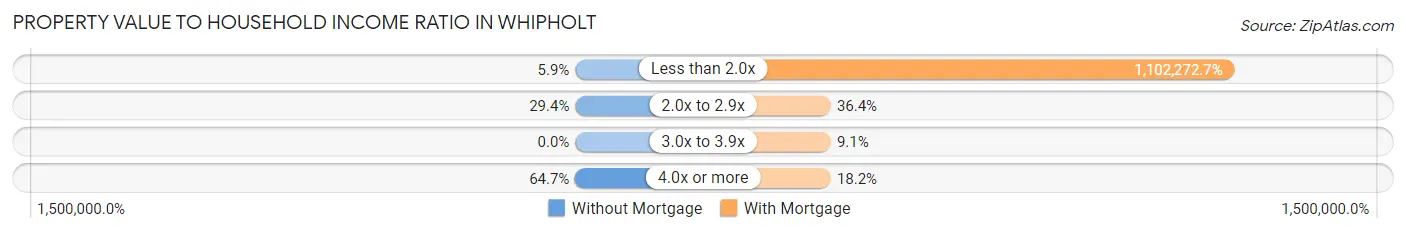
| Value-to-Income Ratio | Without Mortgage | With Mortgage |
| Less than 2.0x | 1 (5.9%) | 121,250 (1,102,272.7%) |
| 2.0x to 2.9x | 5 (29.4%) | 4 (36.4%) |
| 3.0x to 3.9x | 0 (0.0%) | 1 (9.1%) |
| 4.0x or more | 11 (64.7%) | 2 (18.2%) |
| Total | 17 (100.0%) | 11 (100.0%) |
Real Estate Taxes by Mortgage Status in Whipholt
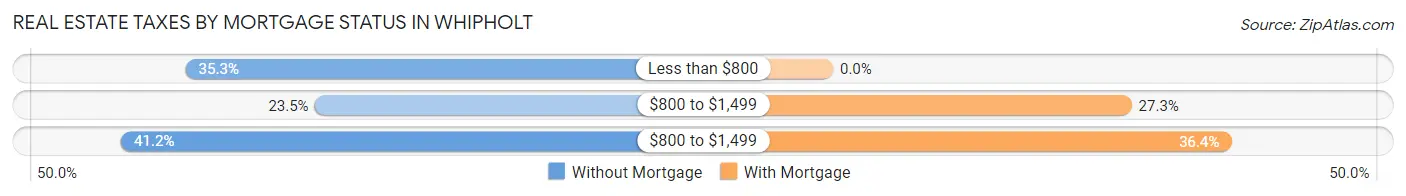
| Property Taxes | Without Mortgage | With Mortgage |
| Less than $800 | 6 (35.3%) | 0 (0.0%) |
| $800 to $1,499 | 4 (23.5%) | 3 (27.3%) |
| $800 to $1,499 | 7 (41.2%) | 4 (36.4%) |
| Total | 17 (100.0%) | 11 (100.0%) |
Health & Disability in Whipholt
Health Insurance Coverage by Age in Whipholt
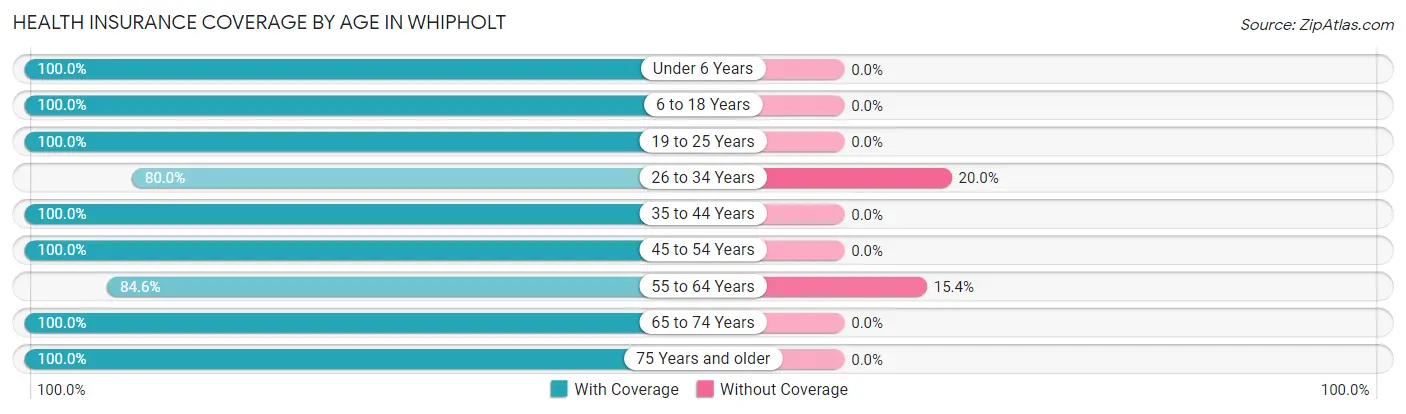
| Age Bracket | With Coverage | Without Coverage |
| Under 6 Years | 1 (100.0%) | 0 (0.0%) |
| 6 to 18 Years | 10 (100.0%) | 0 (0.0%) |
| 19 to 25 Years | 4 (100.0%) | 0 (0.0%) |
| 26 to 34 Years | 4 (80.0%) | 1 (20.0%) |
| 35 to 44 Years | 5 (100.0%) | 0 (0.0%) |
| 45 to 54 Years | 12 (100.0%) | 0 (0.0%) |
| 55 to 64 Years | 11 (84.6%) | 2 (15.4%) |
| 65 to 74 Years | 15 (100.0%) | 0 (0.0%) |
| 75 Years and older | 9 (100.0%) | 0 (0.0%) |
| Total | 71 (96.0%) | 3 (4.1%) |
Health Insurance Coverage by Citizenship Status in Whipholt
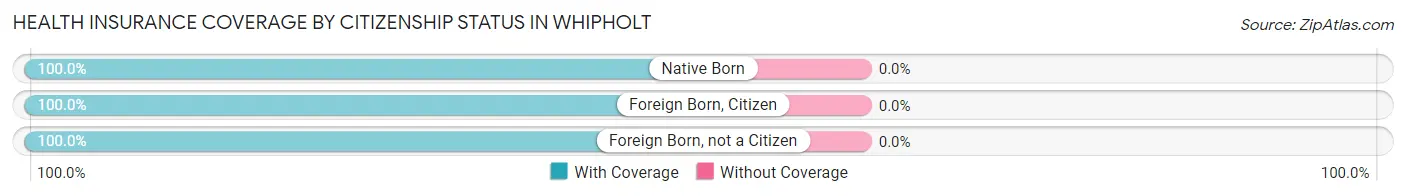
| Citizenship Status | With Coverage | Without Coverage |
| Native Born | 1 (100.0%) | 0 (0.0%) |
| Foreign Born, Citizen | 10 (100.0%) | 0 (0.0%) |
| Foreign Born, not a Citizen | 4 (100.0%) | 0 (0.0%) |
Health Insurance Coverage by Household Income in Whipholt
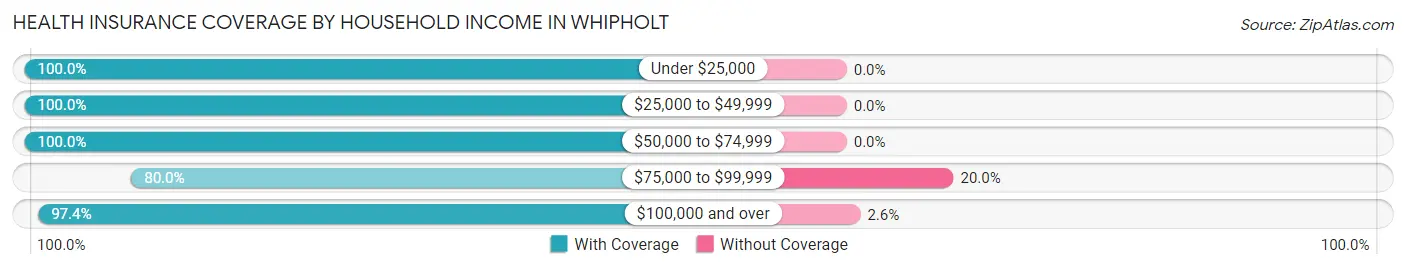
| Household Income | With Coverage | Without Coverage |
| Under $25,000 | 7 (100.0%) | 0 (0.0%) |
| $25,000 to $49,999 | 10 (100.0%) | 0 (0.0%) |
| $50,000 to $74,999 | 8 (100.0%) | 0 (0.0%) |
| $75,000 to $99,999 | 8 (80.0%) | 2 (20.0%) |
| $100,000 and over | 38 (97.4%) | 1 (2.6%) |
Public vs Private Health Insurance Coverage by Age in Whipholt
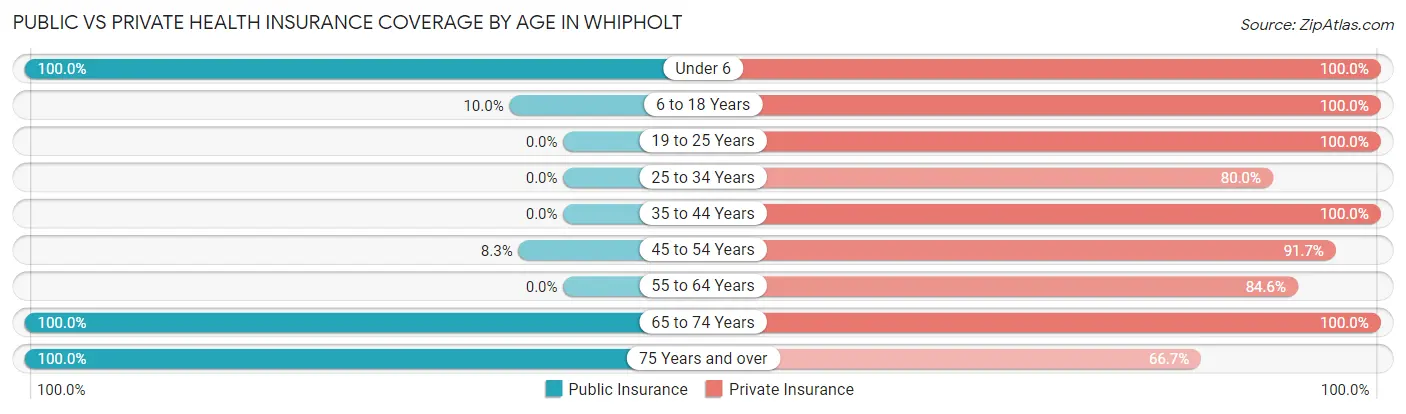
| Age Bracket | Public Insurance | Private Insurance |
| Under 6 | 1 (100.0%) | 1 (100.0%) |
| 6 to 18 Years | 1 (10.0%) | 10 (100.0%) |
| 19 to 25 Years | 0 (0.0%) | 4 (100.0%) |
| 25 to 34 Years | 0 (0.0%) | 4 (80.0%) |
| 35 to 44 Years | 0 (0.0%) | 5 (100.0%) |
| 45 to 54 Years | 1 (8.3%) | 11 (91.7%) |
| 55 to 64 Years | 0 (0.0%) | 11 (84.6%) |
| 65 to 74 Years | 15 (100.0%) | 15 (100.0%) |
| 75 Years and over | 9 (100.0%) | 6 (66.7%) |
| Total | 27 (36.5%) | 67 (90.5%) |
Disability Status by Sex by Age in Whipholt
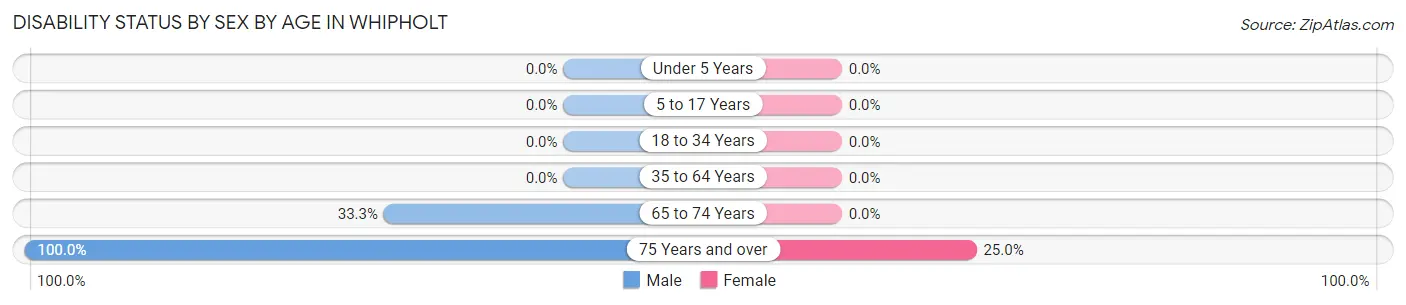
| Age Bracket | Male | Female |
| Under 5 Years | 0 (0.0%) | 0 (0.0%) |
| 5 to 17 Years | 0 (0.0%) | 0 (0.0%) |
| 18 to 34 Years | 0 (0.0%) | 0 (0.0%) |
| 35 to 64 Years | 0 (0.0%) | 0 (0.0%) |
| 65 to 74 Years | 3 (33.3%) | 0 (0.0%) |
| 75 Years and over | 5 (100.0%) | 1 (25.0%) |
Disability Class by Sex by Age in Whipholt
Disability Class: Hearing Difficulty
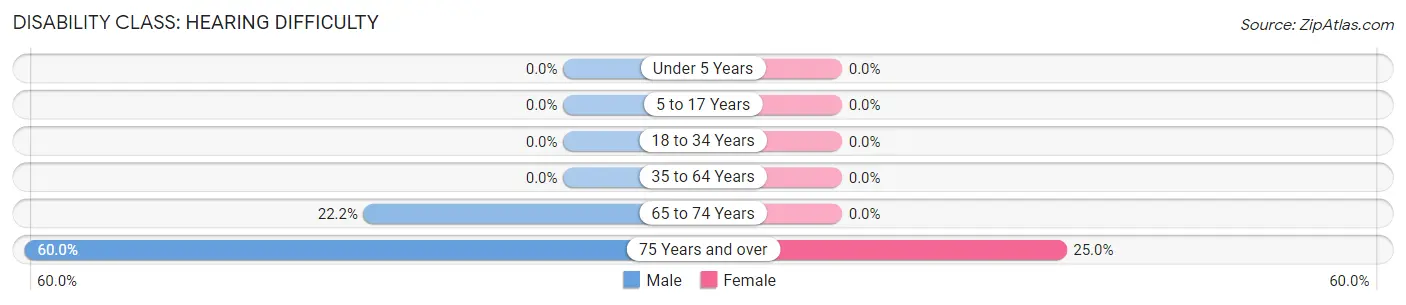
| Age Bracket | Male | Female |
| Under 5 Years | 0 (0.0%) | 0 (0.0%) |
| 5 to 17 Years | 0 (0.0%) | 0 (0.0%) |
| 18 to 34 Years | 0 (0.0%) | 0 (0.0%) |
| 35 to 64 Years | 0 (0.0%) | 0 (0.0%) |
| 65 to 74 Years | 2 (22.2%) | 0 (0.0%) |
| 75 Years and over | 3 (60.0%) | 1 (25.0%) |
Disability Class: Vision Difficulty
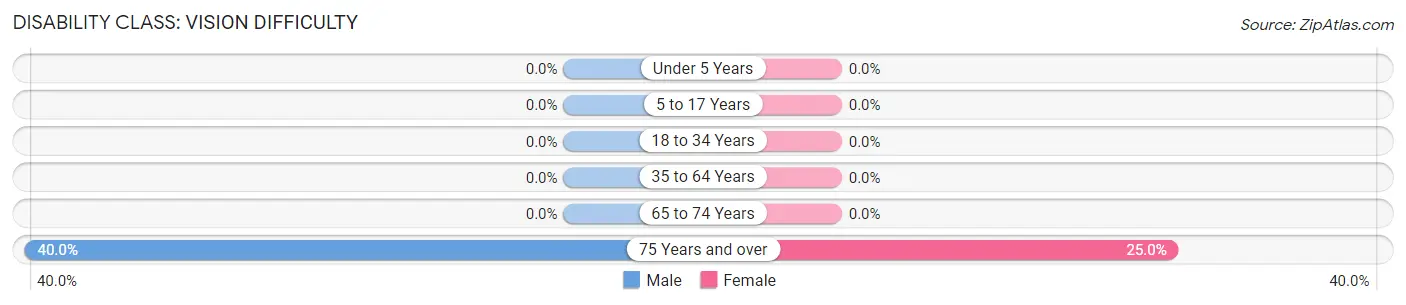
| Age Bracket | Male | Female |
| Under 5 Years | 0 (0.0%) | 0 (0.0%) |
| 5 to 17 Years | 0 (0.0%) | 0 (0.0%) |
| 18 to 34 Years | 0 (0.0%) | 0 (0.0%) |
| 35 to 64 Years | 0 (0.0%) | 0 (0.0%) |
| 65 to 74 Years | 0 (0.0%) | 0 (0.0%) |
| 75 Years and over | 2 (40.0%) | 1 (25.0%) |
Disability Class: Cognitive Difficulty
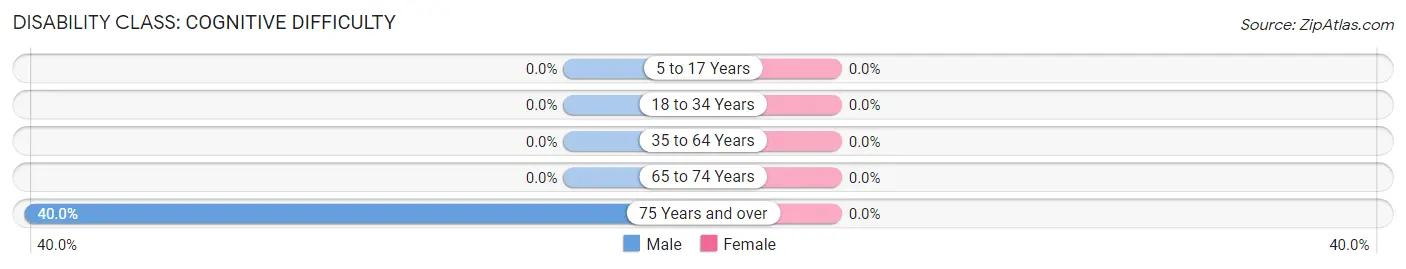
| Age Bracket | Male | Female |
| 5 to 17 Years | 0 (0.0%) | 0 (0.0%) |
| 18 to 34 Years | 0 (0.0%) | 0 (0.0%) |
| 35 to 64 Years | 0 (0.0%) | 0 (0.0%) |
| 65 to 74 Years | 0 (0.0%) | 0 (0.0%) |
| 75 Years and over | 2 (40.0%) | 0 (0.0%) |
Disability Class: Ambulatory Difficulty
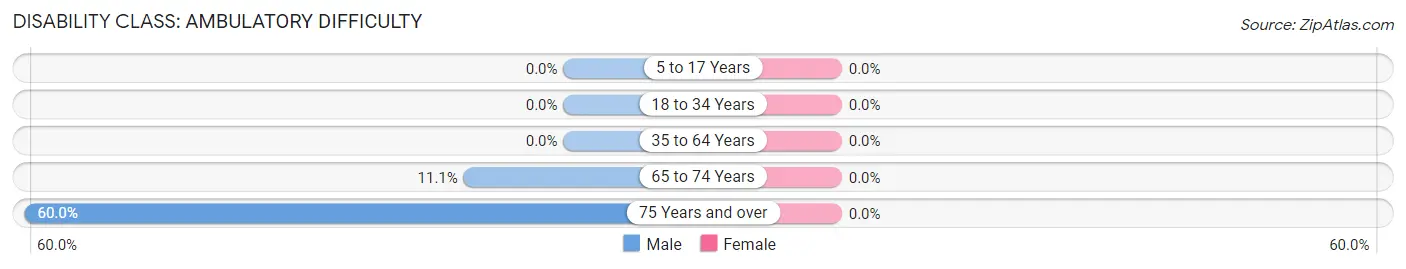
| Age Bracket | Male | Female |
| 5 to 17 Years | 0 (0.0%) | 0 (0.0%) |
| 18 to 34 Years | 0 (0.0%) | 0 (0.0%) |
| 35 to 64 Years | 0 (0.0%) | 0 (0.0%) |
| 65 to 74 Years | 1 (11.1%) | 0 (0.0%) |
| 75 Years and over | 3 (60.0%) | 0 (0.0%) |
Disability Class: Self-Care Difficulty
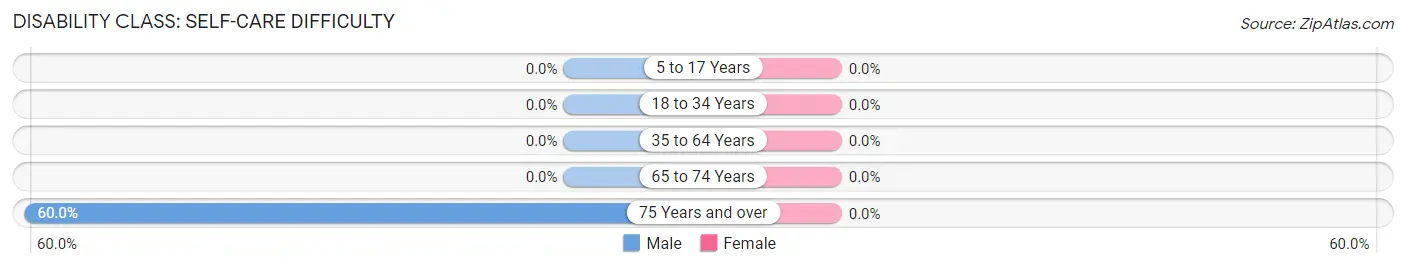
| Age Bracket | Male | Female |
| 5 to 17 Years | 0 (0.0%) | 0 (0.0%) |
| 18 to 34 Years | 0 (0.0%) | 0 (0.0%) |
| 35 to 64 Years | 0 (0.0%) | 0 (0.0%) |
| 65 to 74 Years | 0 (0.0%) | 0 (0.0%) |
| 75 Years and over | 3 (60.0%) | 0 (0.0%) |
Technology Access in Whipholt
Computing Device Access in Whipholt
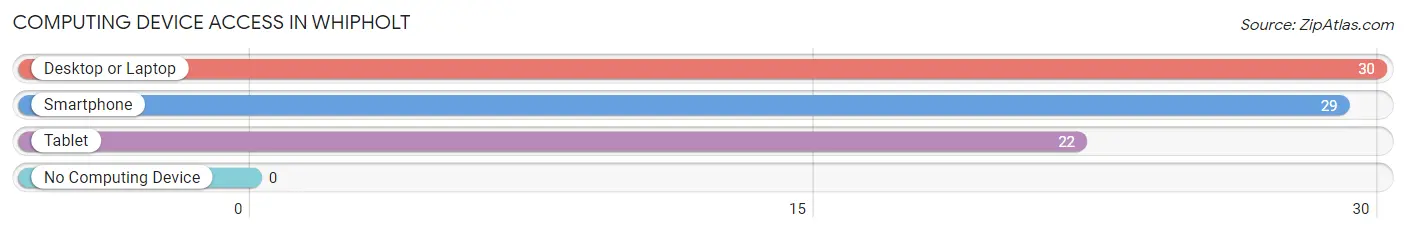
| Device Type | # Households | % Households |
| Desktop or Laptop | 30 | 88.2% |
| Smartphone | 29 | 85.3% |
| Tablet | 22 | 64.7% |
| No Computing Device | 0 | 0.0% |
| Total | 34 | 100.0% |
Internet Access in Whipholt
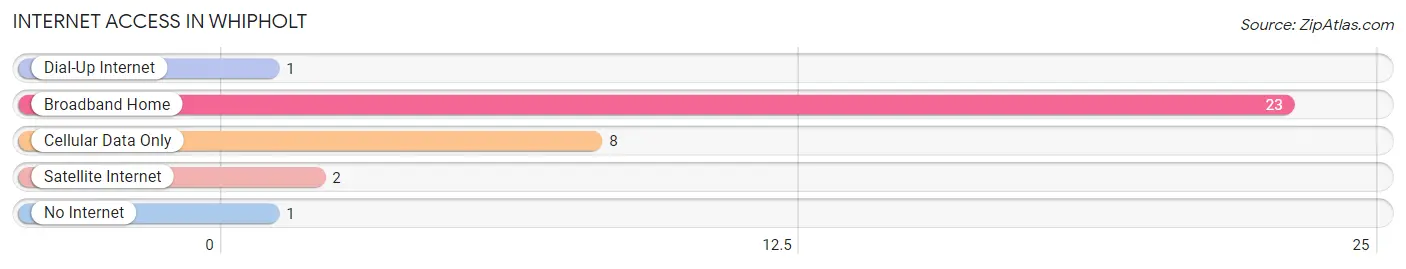
| Internet Type | # Households | % Households |
| Dial-Up Internet | 1 | 2.9% |
| Broadband Home | 23 | 67.6% |
| Cellular Data Only | 8 | 23.5% |
| Satellite Internet | 2 | 5.9% |
| No Internet | 1 | 2.9% |
| Total | 34 | 100.0% |
Whipholt Summary
Whipholt is a small unincorporated community located in Cass County, Minnesota, United States. It is situated along the Mississippi River, approximately 20 miles north of Brainerd. The population of Whipholt was estimated to be around 200 people in 2020.
History
Whipholt was first settled in the late 1800s by a group of Scandinavian immigrants. The town was named after a nearby lake, Whipholt Lake, which was named after a local Native American chief. The first post office in Whipholt was established in 1887.
In the early 1900s, Whipholt was a thriving logging and farming community. The town had a sawmill, a general store, a blacksmith shop, a hotel, and a school. The town also had a train station, which was used to transport logs to the nearby sawmill.
In the 1950s, Whipholt began to decline as the logging industry moved away from the area. The sawmill closed and the train station was abandoned. The population of Whipholt decreased significantly and the town became a quiet, rural community.
Geography
Whipholt is located in Cass County, Minnesota, approximately 20 miles north of Brainerd. The town is situated along the Mississippi River and is surrounded by forests and lakes. The nearest major city is Duluth, which is about 90 miles away.
The terrain around Whipholt is mostly flat with some rolling hills. The area is heavily forested and is home to a variety of wildlife, including deer, bear, and moose.
Economy
The economy of Whipholt is largely based on tourism and outdoor recreation. The town is a popular destination for fishing, hunting, and camping. There are several resorts and campgrounds in the area, as well as a few restaurants and bars.
The town also has a few small businesses, including a gas station, a grocery store, and a hardware store.
Demographics
The population of Whipholt was estimated to be around 200 people in 2020. The town is predominantly white, with a small minority population. The median household income in Whipholt is around $45,000, which is slightly lower than the national average.
The town has a high rate of poverty, with nearly one-third of the population living below the poverty line. The unemployment rate in Whipholt is also higher than the national average.
Conclusion
Whipholt is a small unincorporated community located in Cass County, Minnesota. The town was first settled in the late 1800s by a group of Scandinavian immigrants and was once a thriving logging and farming community. Today, the economy of Whipholt is largely based on tourism and outdoor recreation. The population of Whipholt was estimated to be around 200 people in 2020 and the town has a high rate of poverty.
Common Questions
What is Per Capita Income in Whipholt?
Per Capita income in Whipholt is $63,772.
What is the Median Family Income in Whipholt?
Median Family Income in Whipholt is $100,000.
What is the Median Household income in Whipholt?
Median Household Income in Whipholt is $72,500.
What is Income or Wage Gap in Whipholt?
Income or Wage Gap in Whipholt is 40.0%.
Women in Whipholt earn 60.0 cents for every dollar earned by a man.
What is Inequality or Gini Index in Whipholt?
Inequality or Gini Index in Whipholt is 0.53.
What is the Total Population of Whipholt?
Total Population of Whipholt is 74.
What is the Total Male Population of Whipholt?
Total Male Population of Whipholt is 34.
What is the Total Female Population of Whipholt?
Total Female Population of Whipholt is 40.
What is the Ratio of Males per 100 Females in Whipholt?
There are 85.00 Males per 100 Females in Whipholt.
What is the Ratio of Females per 100 Males in Whipholt?
There are 117.65 Females per 100 Males in Whipholt.
What is the Median Population Age in Whipholt?
Median Population Age in Whipholt is 55.5 Years.
What is the Average Family Size in Whipholt
Average Family Size in Whipholt is 2.7 People.
What is the Average Household Size in Whipholt
Average Household Size in Whipholt is 2.2 People.
How Large is the Labor Force in Whipholt?
There are 36 People in the Labor Forcein in Whipholt.
What is the Percentage of People in the Labor Force in Whipholt?
55.4% of People are in the Labor Force in Whipholt.
What is the Unemployment Rate in Whipholt?
Unemployment Rate in Whipholt is 8.3%.