Zip Codes with the Highest Percentage of Population Employed in Real Estate, Rental & Leasing in Minnesota
RELATED REPORTS & OPTIONS
Real Estate, Rental & Leasing
Minnesota
Compare Zip Codes
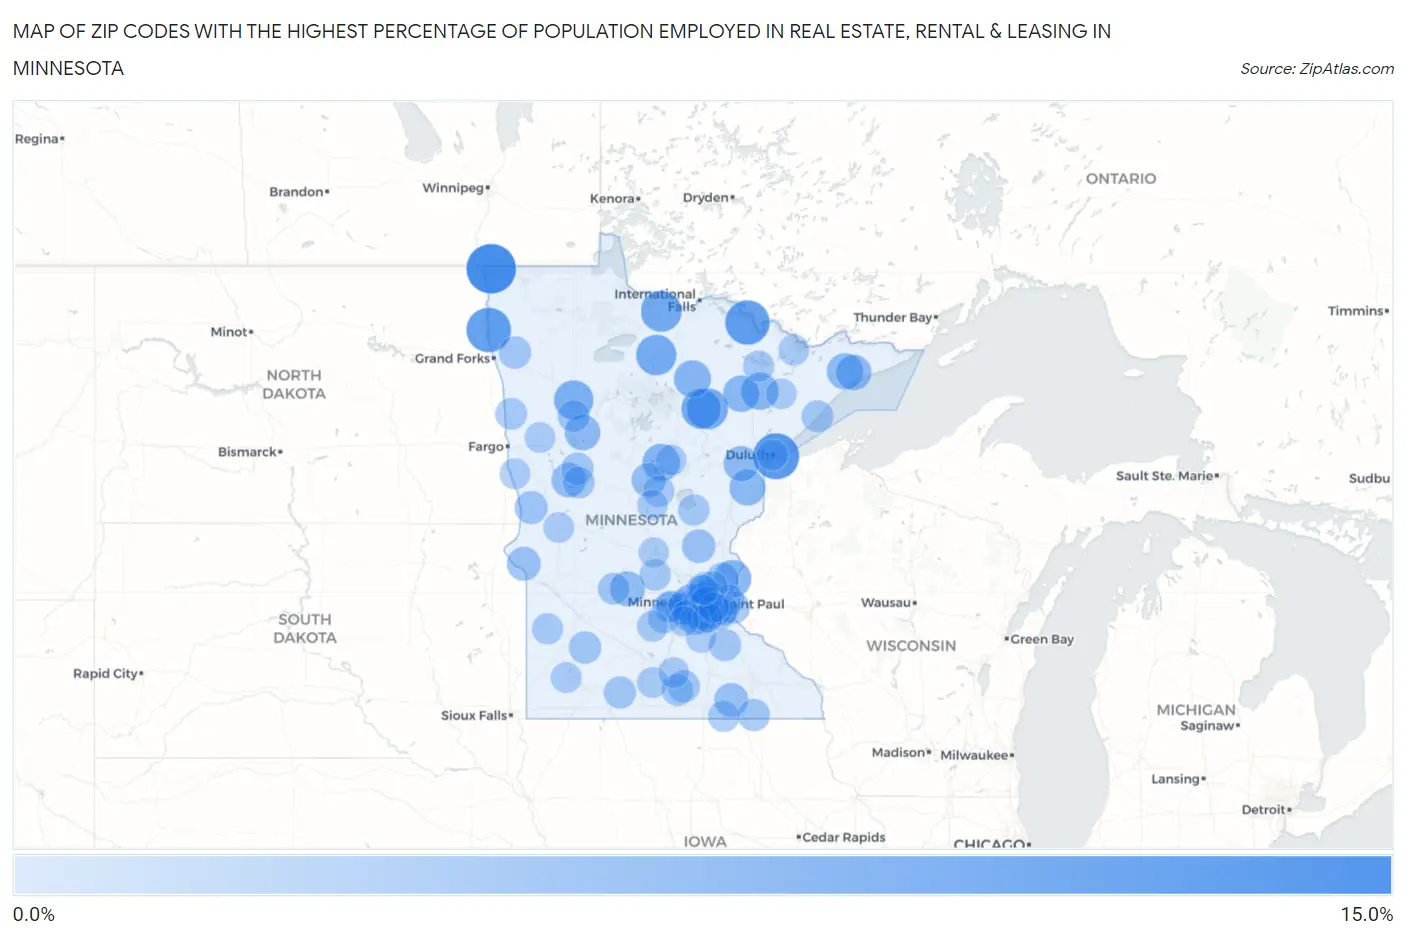
Map of Zip Codes with the Highest Percentage of Population Employed in Real Estate, Rental & Leasing in Minnesota
0.0%
15.0%
Zip Codes with the Highest Percentage of Population Employed in Real Estate, Rental & Leasing in Minnesota
| Zip Code | % Employed | vs State | vs National | |
| 1. | 56755 | 11.4% | 1.4%(+10.0)#1 | 1.9%(+9.54)#291 |
| 2. | 55802 | 9.7% | 1.4%(+8.26)#2 | 1.9%(+7.76)#409 |
| 3. | 56744 | 8.9% | 1.4%(+7.55)#3 | 1.9%(+7.05)#467 |
| 4. | 55725 | 8.9% | 1.4%(+7.49)#4 | 1.9%(+7.00)#471 |
| 5. | 56629 | 7.2% | 1.4%(+5.83)#5 | 1.9%(+5.34)#686 |
| 6. | 55716 | 7.2% | 1.4%(+5.82)#6 | 1.9%(+5.32)#690 |
| 7. | 56660 | 6.9% | 1.4%(+5.50)#7 | 1.9%(+5.00)#748 |
| 8. | 55786 | 6.6% | 1.4%(+5.20)#8 | 1.9%(+4.70)#803 |
| 9. | 56651 | 6.4% | 1.4%(+5.03)#9 | 1.9%(+4.54)#843 |
| 10. | 55073 | 5.6% | 1.4%(+4.17)#10 | 1.9%(+3.67)#1,127 |
| 11. | 56442 | 5.5% | 1.4%(+4.11)#11 | 1.9%(+3.61)#1,142 |
| 12. | 55708 | 5.5% | 1.4%(+4.08)#12 | 1.9%(+3.58)#1,158 |
| 13. | 56628 | 5.3% | 1.4%(+3.89)#13 | 1.9%(+3.39)#1,256 |
| 14. | 55391 | 5.2% | 1.4%(+3.82)#14 | 1.9%(+3.32)#1,283 |
| 15. | 55768 | 5.1% | 1.4%(+3.66)#15 | 1.9%(+3.16)#1,360 |
| 16. | 55615 | 4.9% | 1.4%(+3.54)#16 | 1.9%(+3.05)#1,432 |
| 17. | 55756 | 4.8% | 1.4%(+3.41)#17 | 1.9%(+2.92)#1,502 |
| 18. | 56575 | 4.7% | 1.4%(+3.27)#18 | 1.9%(+2.77)#1,595 |
| 19. | 55612 | 4.6% | 1.4%(+3.19)#19 | 1.9%(+2.70)#1,650 |
| 20. | 55439 | 4.6% | 1.4%(+3.16)#20 | 1.9%(+2.66)#1,673 |
| 21. | 55780 | 4.5% | 1.4%(+3.10)#21 | 1.9%(+2.60)#1,725 |
| 22. | 56243 | 4.3% | 1.4%(+2.90)#22 | 1.9%(+2.41)#1,865 |
| 23. | 56576 | 4.1% | 1.4%(+2.74)#23 | 1.9%(+2.24)#2,033 |
| 24. | 56468 | 4.0% | 1.4%(+2.60)#24 | 1.9%(+2.10)#2,177 |
| 25. | 55435 | 4.0% | 1.4%(+2.59)#25 | 1.9%(+2.09)#2,190 |
| 26. | 55918 | 3.8% | 1.4%(+2.43)#26 | 1.9%(+1.94)#2,362 |
| 27. | 55402 | 3.8% | 1.4%(+2.43)#27 | 1.9%(+1.93)#2,365 |
| 28. | 55120 | 3.8% | 1.4%(+2.42)#28 | 1.9%(+1.92)#2,375 |
| 29. | 56225 | 3.7% | 1.4%(+2.34)#29 | 1.9%(+1.84)#2,471 |
| 30. | 55436 | 3.7% | 1.4%(+2.30)#30 | 1.9%(+1.80)#2,536 |
| 31. | 55424 | 3.7% | 1.4%(+2.26)#31 | 1.9%(+1.76)#2,583 |
| 32. | 55017 | 3.6% | 1.4%(+2.26)#32 | 1.9%(+1.76)#2,585 |
| 33. | 55437 | 3.6% | 1.4%(+2.24)#33 | 1.9%(+1.74)#2,613 |
| 34. | 56522 | 3.4% | 1.4%(+1.97)#34 | 1.9%(+1.47)#3,098 |
| 35. | 55077 | 3.2% | 1.4%(+1.83)#35 | 1.9%(+1.33)#3,368 |
| 36. | 55025 | 3.1% | 1.4%(+1.72)#36 | 1.9%(+1.22)#3,593 |
| 37. | 56255 | 3.1% | 1.4%(+1.71)#37 | 1.9%(+1.22)#3,606 |
| 38. | 55001 | 3.1% | 1.4%(+1.71)#38 | 1.9%(+1.21)#3,623 |
| 39. | 56722 | 3.1% | 1.4%(+1.70)#39 | 1.9%(+1.20)#3,637 |
| 40. | 55118 | 3.1% | 1.4%(+1.70)#40 | 1.9%(+1.20)#3,650 |
| 41. | 56091 | 3.1% | 1.4%(+1.66)#41 | 1.9%(+1.16)#3,748 |
| 42. | 55951 | 3.1% | 1.4%(+1.66)#42 | 1.9%(+1.16)#3,755 |
| 43. | 56573 | 3.0% | 1.4%(+1.65)#43 | 1.9%(+1.16)#3,760 |
| 44. | 55018 | 3.0% | 1.4%(+1.64)#44 | 1.9%(+1.14)#3,792 |
| 45. | 55410 | 3.0% | 1.4%(+1.63)#45 | 1.9%(+1.13)#3,823 |
| 46. | 56160 | 2.9% | 1.4%(+1.55)#46 | 1.9%(+1.05)#4,054 |
| 47. | 55423 | 2.9% | 1.4%(+1.54)#47 | 1.9%(+1.04)#4,075 |
| 48. | 56566 | 2.9% | 1.4%(+1.53)#48 | 1.9%(+1.03)#4,103 |
| 49. | 55601 | 2.8% | 1.4%(+1.42)#49 | 1.9%(+0.925)#4,383 |
| 50. | 56571 | 2.8% | 1.4%(+1.40)#50 | 1.9%(+0.906)#4,440 |
| 51. | 56251 | 2.8% | 1.4%(+1.38)#51 | 1.9%(+0.881)#4,511 |
| 52. | 56068 | 2.8% | 1.4%(+1.37)#52 | 1.9%(+0.876)#4,532 |
| 53. | 55370 | 2.7% | 1.4%(+1.34)#53 | 1.9%(+0.844)#4,632 |
| 54. | 56550 | 2.7% | 1.4%(+1.33)#54 | 1.9%(+0.829)#4,683 |
| 55. | 55382 | 2.7% | 1.4%(+1.31)#55 | 1.9%(+0.808)#4,750 |
| 56. | 55953 | 2.7% | 1.4%(+1.26)#56 | 1.9%(+0.763)#4,918 |
| 57. | 55042 | 2.7% | 1.4%(+1.26)#57 | 1.9%(+0.759)#4,932 |
| 58. | 55425 | 2.6% | 1.4%(+1.24)#58 | 1.9%(+0.741)#4,984 |
| 59. | 56386 | 2.6% | 1.4%(+1.24)#59 | 1.9%(+0.740)#4,994 |
| 60. | 56401 | 2.6% | 1.4%(+1.22)#60 | 1.9%(+0.718)#5,065 |
| 61. | 55433 | 2.6% | 1.4%(+1.18)#61 | 1.9%(+0.679)#5,208 |
| 62. | 55331 | 2.6% | 1.4%(+1.16)#62 | 1.9%(+0.660)#5,281 |
| 63. | 55441 | 2.6% | 1.4%(+1.16)#63 | 1.9%(+0.659)#5,284 |
| 64. | 55427 | 2.5% | 1.4%(+1.14)#64 | 1.9%(+0.638)#5,375 |
| 65. | 56291 | 2.5% | 1.4%(+1.12)#65 | 1.9%(+0.619)#5,445 |
| 66. | 55790 | 2.5% | 1.4%(+1.10)#66 | 1.9%(+0.605)#5,502 |
| 67. | 55317 | 2.5% | 1.4%(+1.10)#67 | 1.9%(+0.602)#5,514 |
| 68. | 55375 | 2.5% | 1.4%(+1.08)#68 | 1.9%(+0.583)#5,579 |
| 69. | 55806 | 2.5% | 1.4%(+1.07)#69 | 1.9%(+0.568)#5,628 |
| 70. | 56090 | 2.4% | 1.4%(+1.03)#70 | 1.9%(+0.528)#5,815 |
| 71. | 55367 | 2.4% | 1.4%(+1.02)#71 | 1.9%(+0.520)#5,849 |
| 72. | 55360 | 2.4% | 1.4%(+1.02)#72 | 1.9%(+0.518)#5,856 |
| 73. | 55366 | 2.4% | 1.4%(+0.996)#73 | 1.9%(+0.499)#5,936 |
| 74. | 55409 | 2.3% | 1.4%(+0.954)#74 | 1.9%(+0.456)#6,106 |
| 75. | 55731 | 2.3% | 1.4%(+0.948)#75 | 1.9%(+0.450)#6,131 |
| 76. | 56172 | 2.3% | 1.4%(+0.946)#76 | 1.9%(+0.448)#6,135 |
| 77. | 55421 | 2.3% | 1.4%(+0.936)#77 | 1.9%(+0.439)#6,177 |
| 78. | 56552 | 2.3% | 1.4%(+0.900)#78 | 1.9%(+0.402)#6,336 |
| 79. | 55305 | 2.3% | 1.4%(+0.897)#79 | 1.9%(+0.399)#6,349 |
| 80. | 56594 | 2.3% | 1.4%(+0.887)#80 | 1.9%(+0.390)#6,397 |
| 81. | 55364 | 2.3% | 1.4%(+0.876)#81 | 1.9%(+0.378)#6,466 |
| 82. | 56311 | 2.3% | 1.4%(+0.864)#82 | 1.9%(+0.366)#6,523 |
| 83. | 56080 | 2.3% | 1.4%(+0.858)#83 | 1.9%(+0.361)#6,559 |
| 84. | 55318 | 2.2% | 1.4%(+0.850)#84 | 1.9%(+0.352)#6,599 |
| 85. | 56447 | 2.2% | 1.4%(+0.842)#85 | 1.9%(+0.345)#6,626 |
| 86. | 55378 | 2.2% | 1.4%(+0.821)#86 | 1.9%(+0.323)#6,737 |
| 87. | 55750 | 2.2% | 1.4%(+0.815)#87 | 1.9%(+0.317)#6,769 |
| 88. | 55055 | 2.2% | 1.4%(+0.809)#88 | 1.9%(+0.311)#6,798 |
| 89. | 55416 | 2.2% | 1.4%(+0.807)#89 | 1.9%(+0.309)#6,808 |
| 90. | 56449 | 2.2% | 1.4%(+0.803)#90 | 1.9%(+0.305)#6,827 |
| 91. | 55449 | 2.2% | 1.4%(+0.799)#91 | 1.9%(+0.301)#6,843 |
| 92. | 55088 | 2.2% | 1.4%(+0.792)#92 | 1.9%(+0.295)#6,872 |
| 93. | 55445 | 2.2% | 1.4%(+0.781)#93 | 1.9%(+0.283)#6,926 |
| 94. | 56303 | 2.2% | 1.4%(+0.778)#94 | 1.9%(+0.280)#6,948 |
| 95. | 55403 | 2.2% | 1.4%(+0.763)#95 | 1.9%(+0.265)#7,034 |
| 96. | 55379 | 2.1% | 1.4%(+0.745)#96 | 1.9%(+0.247)#7,115 |
| 97. | 55337 | 2.1% | 1.4%(+0.738)#97 | 1.9%(+0.240)#7,152 |
| 98. | 55116 | 2.1% | 1.4%(+0.730)#98 | 1.9%(+0.233)#7,193 |
| 99. | 55443 | 2.1% | 1.4%(+0.730)#99 | 1.9%(+0.232)#7,195 |
| 100. | 55315 | 2.1% | 1.4%(+0.704)#100 | 1.9%(+0.206)#7,328 |
Common Questions
What are the Top 10 Zip Codes with the Highest Percentage of Population Employed in Real Estate, Rental & Leasing in Minnesota?
Top 10 Zip Codes with the Highest Percentage of Population Employed in Real Estate, Rental & Leasing in Minnesota are:
What zip code has the Highest Percentage of Population Employed in Real Estate, Rental & Leasing in Minnesota?
56755 has the Highest Percentage of Population Employed in Real Estate, Rental & Leasing in Minnesota with 11.4%.
What is the Percentage of Population Employed in Real Estate, Rental & Leasing in the State of Minnesota?
Percentage of Population Employed in Real Estate, Rental & Leasing in Minnesota is 1.4%.
What is the Percentage of Population Employed in Real Estate, Rental & Leasing in the United States?
Percentage of Population Employed in Real Estate, Rental & Leasing in the United States is 1.9%.