Redby, MN Map & Demographics
Redby Map
Redby Overview
$13,280
PER CAPITA INCOME
$45,962
AVG FAMILY INCOME
$43,125
AVG HOUSEHOLD INCOME
18.4%
WAGE / INCOME GAP [ % ]
81.6¢/ $1
WAGE / INCOME GAP [ $ ]
0.50
INEQUALITY / GINI INDEX
1,228
TOTAL POPULATION
626
MALE POPULATION
602
FEMALE POPULATION
103.99
MALES / 100 FEMALES
96.17
FEMALES / 100 MALES
27.7
MEDIAN AGE
4.9
AVG FAMILY SIZE
4.2
AVG HOUSEHOLD SIZE
414
LABOR FORCE [ PEOPLE ]
56.3%
PERCENT IN LABOR FORCE
15.9%
UNEMPLOYMENT RATE
Redby Zip Codes
Redby Area Codes
Income in Redby
Income Overview in Redby
Per Capita Income in Redby is $13,280, while median incomes of families and households are $45,962 and $43,125 respectively.
| Characteristic | Number | Measure |
| Per Capita Income | 1,228 | $13,280 |
| Median Family Income | 214 | $45,962 |
| Mean Family Income | 214 | $80,408 |
| Median Household Income | 287 | $43,125 |
| Mean Household Income | 287 | $68,864 |
| Income Deficit | 214 | $0 |
| Wage / Income Gap (%) | 1,228 | 18.44% |
| Wage / Income Gap ($) | 1,228 | 81.56¢ per $1 |
| Gini / Inequality Index | 1,228 | 0.50 |
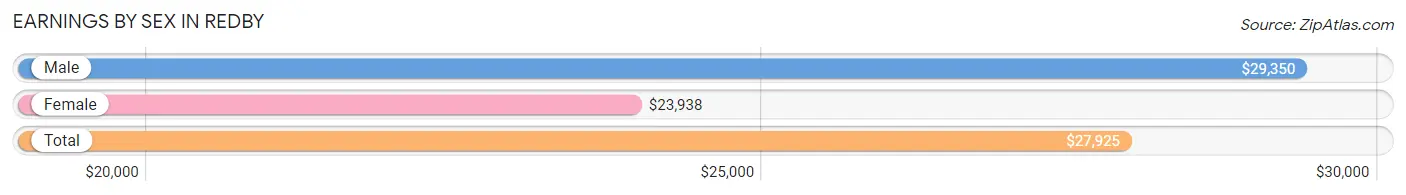
Earnings by Sex in Redby
Average Earnings in Redby are $27,925, $29,350 for men and $23,938 for women, a difference of 18.4%.
| Sex | Number | Average Earnings |
| Male | 234 (59.5%) | $29,350 |
| Female | 159 (40.5%) | $23,938 |
| Total | 393 (100.0%) | $27,925 |
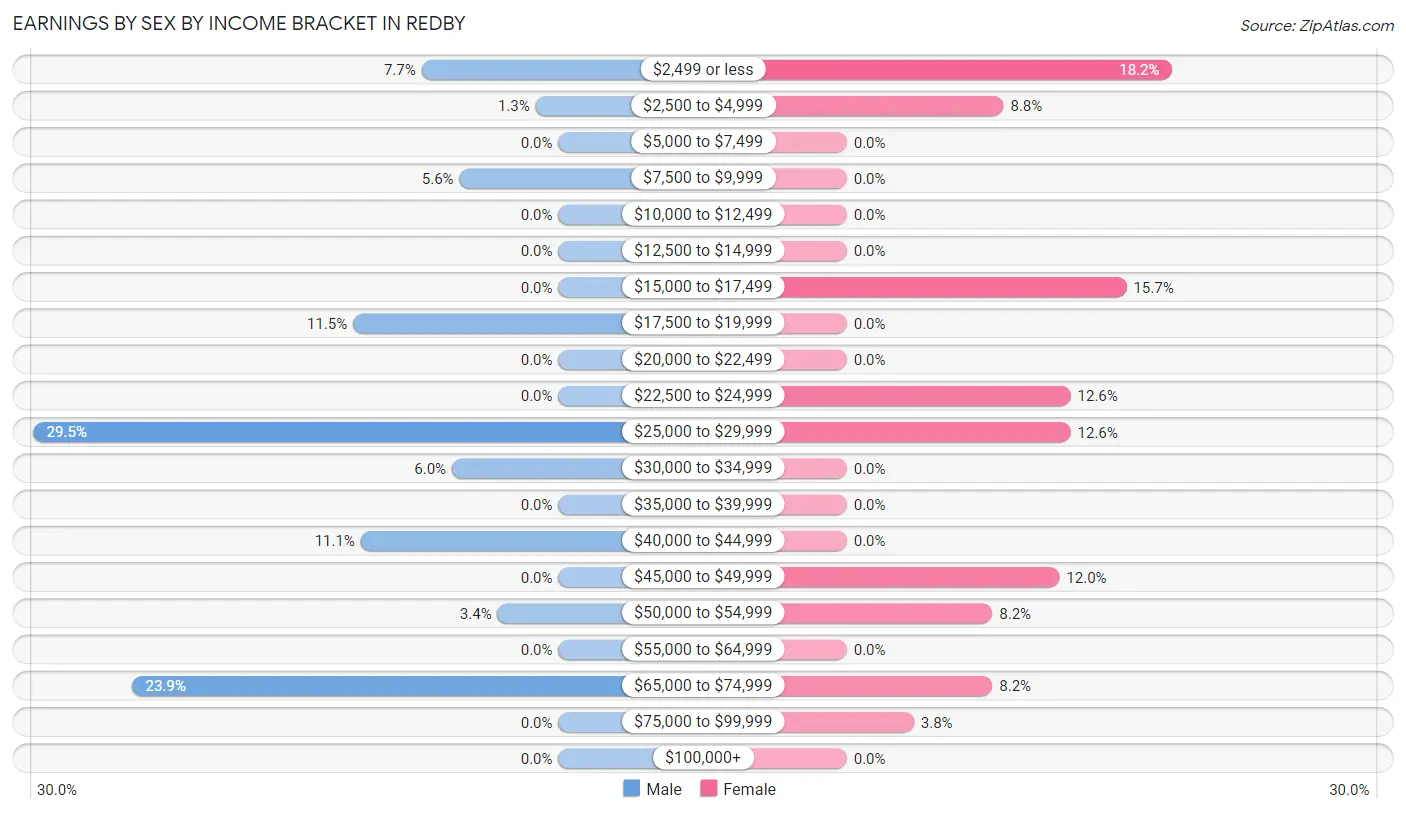
Earnings by Sex by Income Bracket in Redby
The most common earnings brackets in Redby are $25,000 to $29,999 for men (69 | 29.5%) and $2,499 or less for women (29 | 18.2%).
| Income | Male | Female |
| $2,499 or less | 18 (7.7%) | 29 (18.2%) |
| $2,500 to $4,999 | 3 (1.3%) | 14 (8.8%) |
| $5,000 to $7,499 | 0 (0.0%) | 0 (0.0%) |
| $7,500 to $9,999 | 13 (5.6%) | 0 (0.0%) |
| $10,000 to $12,499 | 0 (0.0%) | 0 (0.0%) |
| $12,500 to $14,999 | 0 (0.0%) | 0 (0.0%) |
| $15,000 to $17,499 | 0 (0.0%) | 25 (15.7%) |
| $17,500 to $19,999 | 27 (11.5%) | 0 (0.0%) |
| $20,000 to $22,499 | 0 (0.0%) | 0 (0.0%) |
| $22,500 to $24,999 | 0 (0.0%) | 20 (12.6%) |
| $25,000 to $29,999 | 69 (29.5%) | 20 (12.6%) |
| $30,000 to $34,999 | 14 (6.0%) | 0 (0.0%) |
| $35,000 to $39,999 | 0 (0.0%) | 0 (0.0%) |
| $40,000 to $44,999 | 26 (11.1%) | 0 (0.0%) |
| $45,000 to $49,999 | 0 (0.0%) | 19 (11.9%) |
| $50,000 to $54,999 | 8 (3.4%) | 13 (8.2%) |
| $55,000 to $64,999 | 0 (0.0%) | 0 (0.0%) |
| $65,000 to $74,999 | 56 (23.9%) | 13 (8.2%) |
| $75,000 to $99,999 | 0 (0.0%) | 6 (3.8%) |
| $100,000+ | 0 (0.0%) | 0 (0.0%) |
| Total | 234 (100.0%) | 159 (100.0%) |
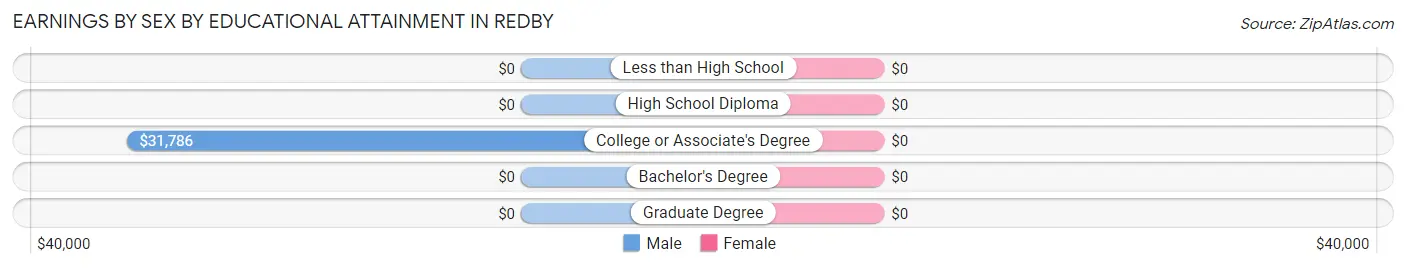
Earnings by Sex by Educational Attainment in Redby
| Educational Attainment | Male Income | Female Income |
| Less than High School | - | - |
| High School Diploma | - | - |
| College or Associate's Degree | $31,786 | $0 |
| Bachelor's Degree | - | - |
| Graduate Degree | - | - |
| Total | $29,800 | $24,875 |
Family Income in Redby
Family Income Brackets in Redby
According to the Redby family income data, there are 50 families falling into the $150,000 to $199,999 income range, which is the most common income bracket and makes up 23.4% of all families.
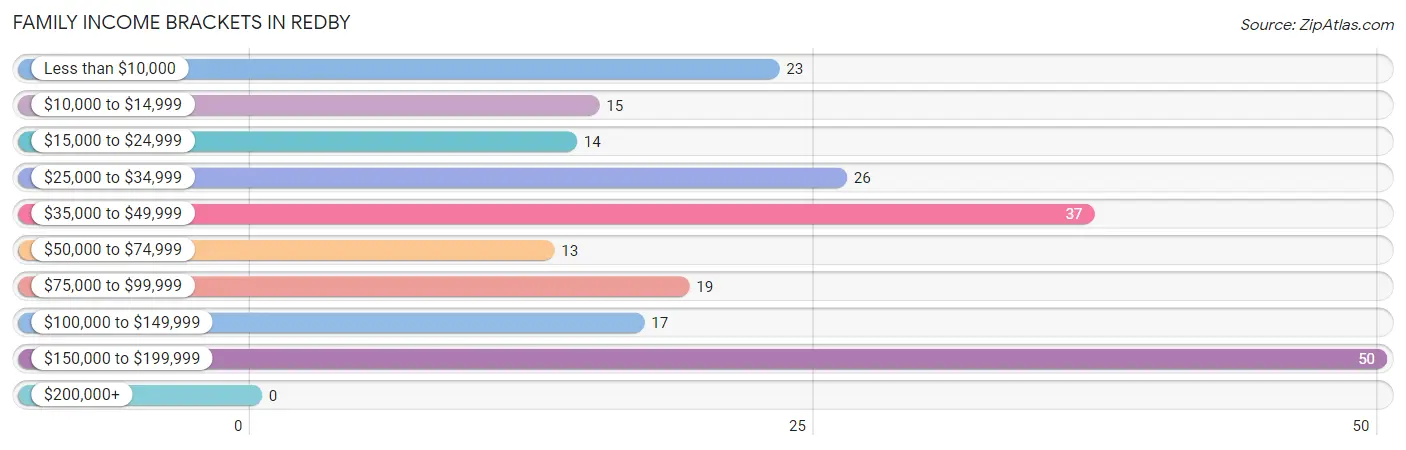
| Income Bracket | # Families | % Families |
| Less than $10,000 | 23 | 10.7% |
| $10,000 to $14,999 | 15 | 7.0% |
| $15,000 to $24,999 | 14 | 6.5% |
| $25,000 to $34,999 | 26 | 12.1% |
| $35,000 to $49,999 | 37 | 17.3% |
| $50,000 to $74,999 | 13 | 6.1% |
| $75,000 to $99,999 | 19 | 8.9% |
| $100,000 to $149,999 | 17 | 7.9% |
| $150,000 to $199,999 | 50 | 23.4% |
| $200,000+ | 0 | 0.0% |
Family Income by Famaliy Size in Redby
6-person families (73 | 34.1%) account for the highest median family income in Redby with $193,175 per family, while 6-person families (73 | 34.1%) have the highest median income of $32,196 per family member.
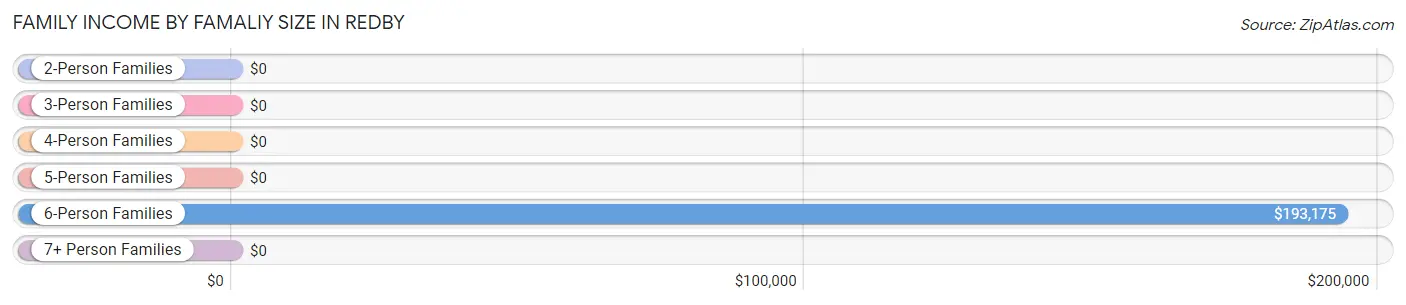
| Income Bracket | # Families | Median Income |
| 2-Person Families | 36 (16.8%) | $0 |
| 3-Person Families | 38 (17.8%) | $0 |
| 4-Person Families | 17 (7.9%) | $0 |
| 5-Person Families | 30 (14.0%) | $0 |
| 6-Person Families | 73 (34.1%) | $193,175 |
| 7+ Person Families | 20 (9.3%) | $0 |
| Total | 214 (100.0%) | $45,962 |
Family Income by Number of Earners in Redby
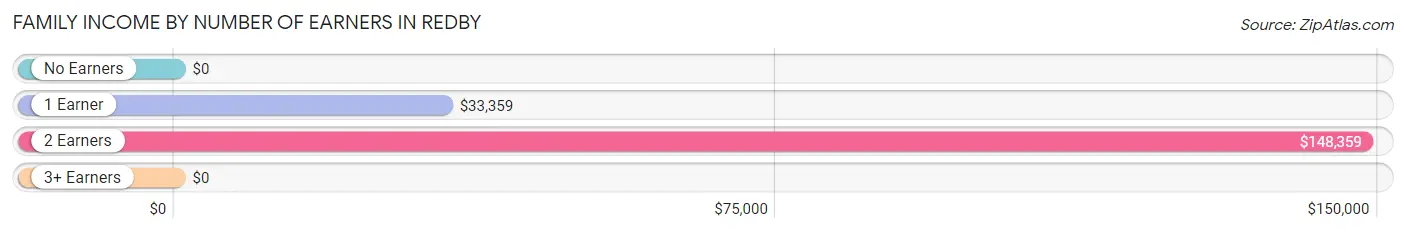
| Number of Earners | # Families | Median Income |
| No Earners | 11 (5.1%) | $0 |
| 1 Earner | 113 (52.8%) | $33,359 |
| 2 Earners | 21 (9.8%) | $148,359 |
| 3+ Earners | 69 (32.2%) | $0 |
| Total | 214 (100.0%) | $45,962 |
Household Income in Redby
Household Income Brackets in Redby
With 51 households falling in the category, the $35,000 to $49,999 income range is the most frequent in Redby, accounting for 17.8% of all households.
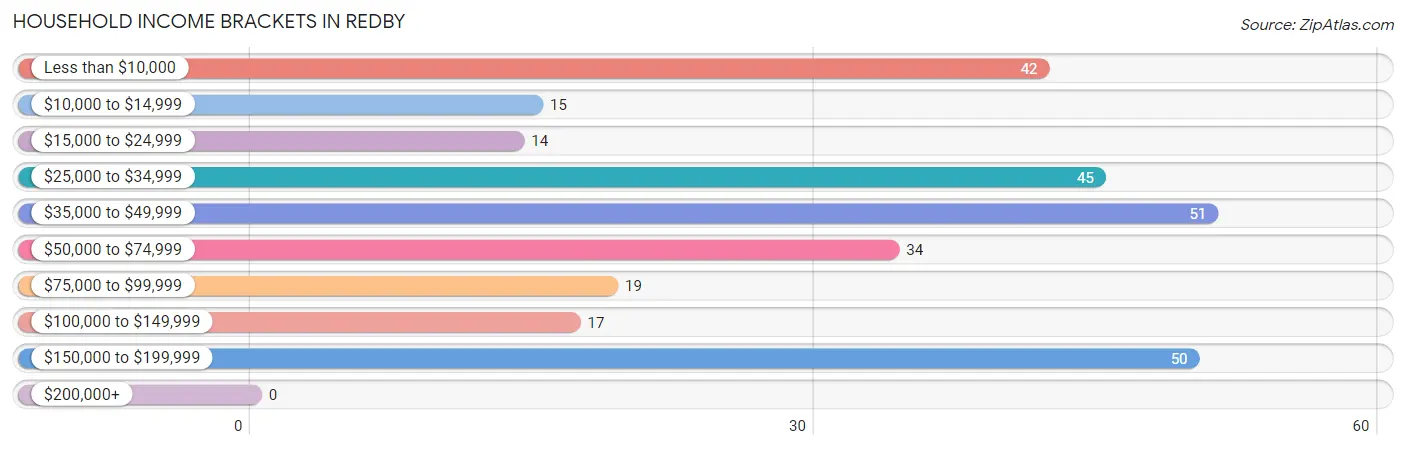
| Income Bracket | # Households | % Households |
| Less than $10,000 | 42 | 14.6% |
| $10,000 to $14,999 | 15 | 5.2% |
| $15,000 to $24,999 | 14 | 4.9% |
| $25,000 to $34,999 | 45 | 15.7% |
| $35,000 to $49,999 | 51 | 17.8% |
| $50,000 to $74,999 | 34 | 11.8% |
| $75,000 to $99,999 | 19 | 6.6% |
| $100,000 to $149,999 | 17 | 5.9% |
| $150,000 to $199,999 | 50 | 17.4% |
| $200,000+ | 0 | 0.0% |
Household Income by Householder Age in Redby
The median household income in Redby is $43,125, with the highest median household income of $38,188 found in the 45 to 64 years age bracket for the primary householder. A total of 137 households (47.7%) fall into this category. Meanwhile, the 15 to 24 years age bracket for the primary householder has the lowest median household income of $0, with 15 households (5.2%) in this group.
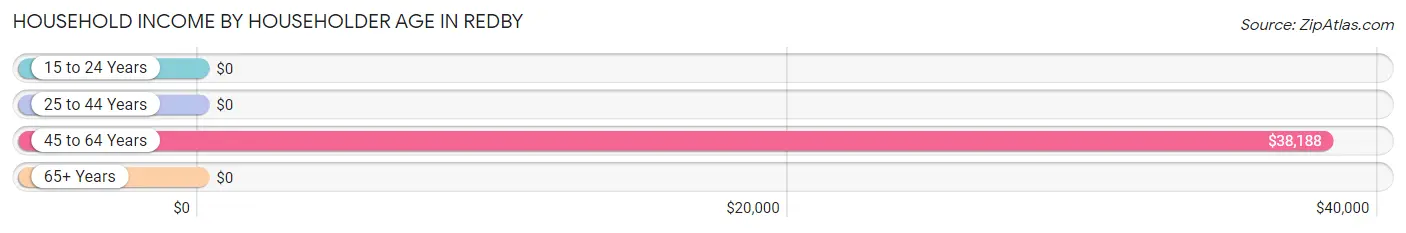
| Income Bracket | # Households | Median Income |
| 15 to 24 Years | 15 (5.2%) | $0 |
| 25 to 44 Years | 97 (33.8%) | $0 |
| 45 to 64 Years | 137 (47.7%) | $38,188 |
| 65+ Years | 38 (13.2%) | $0 |
| Total | 287 (100.0%) | $43,125 |
Poverty in Redby
Income Below Poverty by Sex and Age in Redby
With 34.7% poverty level for males and 51.8% for females among the residents of Redby, under 5 year old males and 5 year old females are the most vulnerable to poverty, with 66 males (100.0%) and 17 females (100.0%) in their respective age groups living below the poverty level.
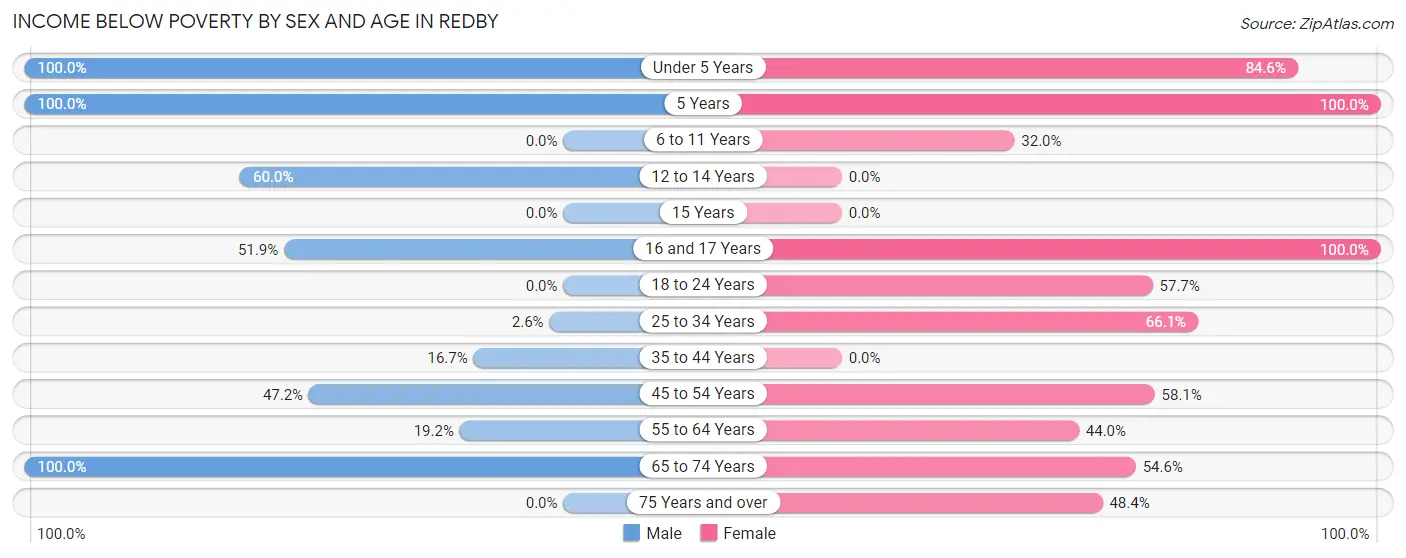
| Age Bracket | Male | Female |
| Under 5 Years | 66 (100.0%) | 33 (84.6%) |
| 5 Years | 21 (100.0%) | 17 (100.0%) |
| 6 to 11 Years | 0 (0.0%) | 41 (32.0%) |
| 12 to 14 Years | 42 (60.0%) | 0 (0.0%) |
| 15 Years | 0 (0.0%) | 0 (0.0%) |
| 16 and 17 Years | 14 (51.8%) | 23 (100.0%) |
| 18 to 24 Years | 0 (0.0%) | 15 (57.7%) |
| 25 to 34 Years | 3 (2.6%) | 115 (66.1%) |
| 35 to 44 Years | 6 (16.7%) | 0 (0.0%) |
| 45 to 54 Years | 17 (47.2%) | 18 (58.1%) |
| 55 to 64 Years | 20 (19.2%) | 22 (44.0%) |
| 65 to 74 Years | 27 (100.0%) | 12 (54.5%) |
| 75 Years and over | 0 (0.0%) | 15 (48.4%) |
| Total | 216 (34.7%) | 311 (51.8%) |
Income Above Poverty by Sex and Age in Redby
According to the poverty statistics in Redby, males aged 6 to 11 years and females aged 12 to 14 years are the age groups that are most secure financially, with 100.0% of males and 100.0% of females in these age groups living above the poverty line.
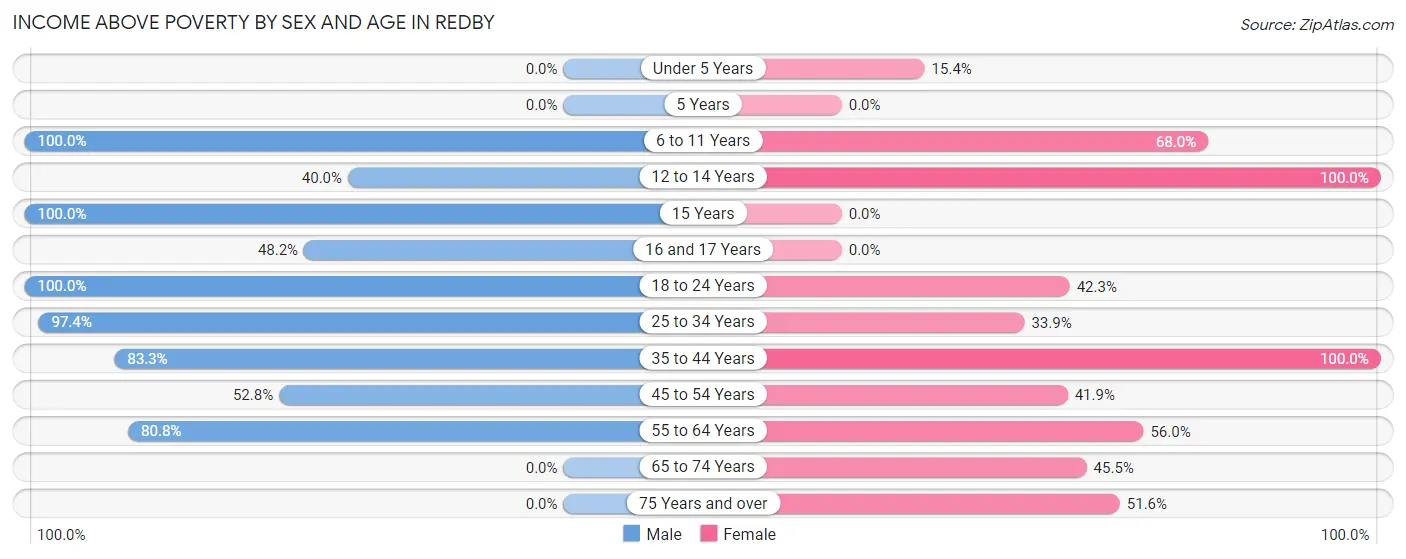
| Age Bracket | Male | Female |
| Under 5 Years | 0 (0.0%) | 6 (15.4%) |
| 5 Years | 0 (0.0%) | 0 (0.0%) |
| 6 to 11 Years | 52 (100.0%) | 87 (68.0%) |
| 12 to 14 Years | 28 (40.0%) | 46 (100.0%) |
| 15 Years | 49 (100.0%) | 0 (0.0%) |
| 16 and 17 Years | 13 (48.1%) | 0 (0.0%) |
| 18 to 24 Years | 18 (100.0%) | 11 (42.3%) |
| 25 to 34 Years | 113 (97.4%) | 59 (33.9%) |
| 35 to 44 Years | 30 (83.3%) | 13 (100.0%) |
| 45 to 54 Years | 19 (52.8%) | 13 (41.9%) |
| 55 to 64 Years | 84 (80.8%) | 28 (56.0%) |
| 65 to 74 Years | 0 (0.0%) | 10 (45.5%) |
| 75 Years and over | 0 (0.0%) | 16 (51.6%) |
| Total | 406 (65.3%) | 289 (48.2%) |
Income Below Poverty Among Married-Couple Families in Redby
The poverty statistics for married-couple families in Redby show that 33.3% or 2 of the total 6 families live below the poverty line. Families with no children have the highest poverty rate of 100.0%, comprising of 2 families. On the other hand, families with 3 or 4 children have the lowest poverty rate of 0.0%, which includes 0 families.
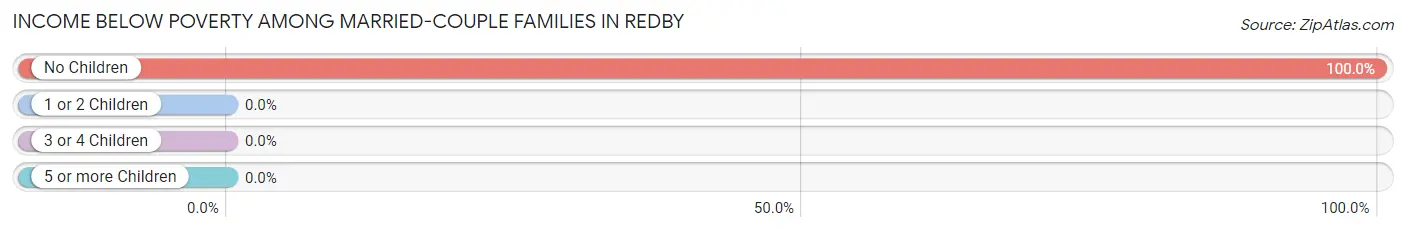
| Children | Above Poverty | Below Poverty |
| No Children | 0 (0.0%) | 2 (100.0%) |
| 1 or 2 Children | 0 (0.0%) | 0 (0.0%) |
| 3 or 4 Children | 4 (100.0%) | 0 (0.0%) |
| 5 or more Children | 0 (0.0%) | 0 (0.0%) |
| Total | 4 (66.7%) | 2 (33.3%) |
Income Below Poverty Among Single-Parent Households in Redby
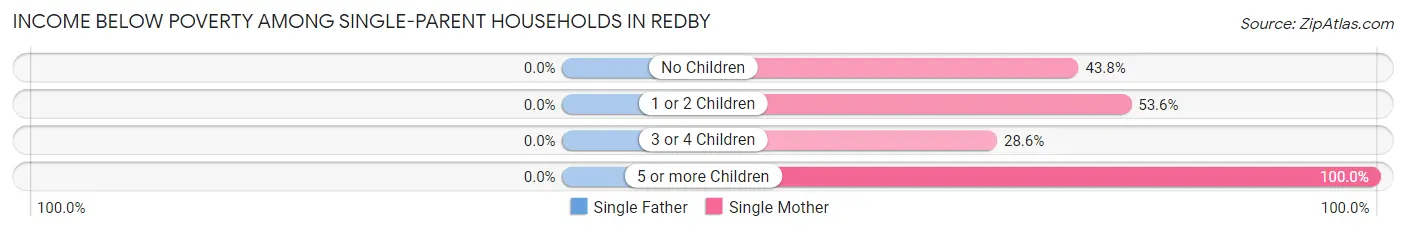
| Children | Single Father | Single Mother |
| No Children | 0 (0.0%) | 21 (43.8%) |
| 1 or 2 Children | 0 (0.0%) | 15 (53.6%) |
| 3 or 4 Children | 0 (0.0%) | 14 (28.6%) |
| 5 or more Children | 0 (0.0%) | 20 (100.0%) |
| Total | 0 (0.0%) | 70 (48.3%) |
Income Below Poverty Among Married-Couple vs Single-Parent Households in Redby
The poverty data for Redby shows that 2 of the married-couple family households (33.3%) and 70 of the single-parent households (33.7%) are living below the poverty level. Within the married-couple family households, those with no children have the highest poverty rate, with 2 households (100.0%) falling below the poverty line. Among the single-parent households, those with 5 or more children have the highest poverty rate, with 20 household (100.0%) living below poverty.
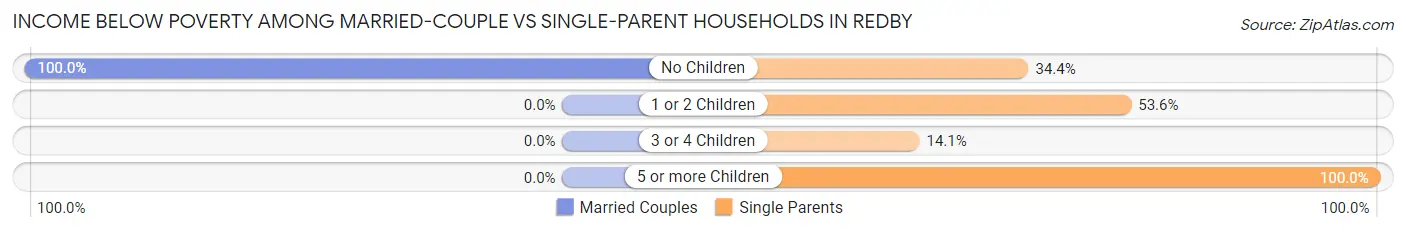
| Children | Married-Couple Families | Single-Parent Households |
| No Children | 2 (100.0%) | 21 (34.4%) |
| 1 or 2 Children | 0 (0.0%) | 15 (53.6%) |
| 3 or 4 Children | 0 (0.0%) | 14 (14.1%) |
| 5 or more Children | 0 (0.0%) | 20 (100.0%) |
| Total | 2 (33.3%) | 70 (33.7%) |
Race in Redby
The most populous races in Redby are Native / Alaskan (1,166 | 95.0%), White / Caucasian (33 | 2.7%), and Two or more Races (27 | 2.2%).
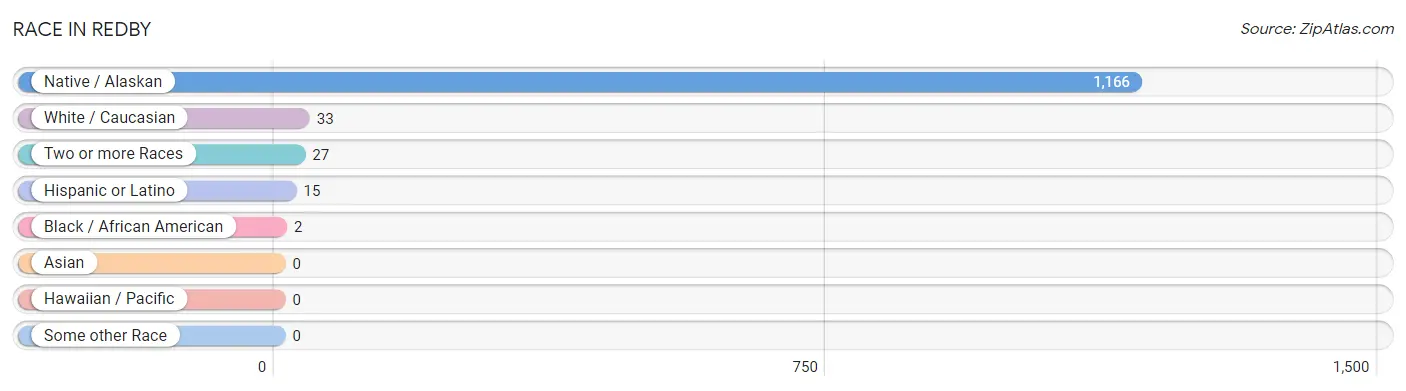
| Race | # Population | % Population |
| Asian | 0 | 0.0% |
| Black / African American | 2 | 0.2% |
| Hawaiian / Pacific | 0 | 0.0% |
| Hispanic or Latino | 15 | 1.2% |
| Native / Alaskan | 1,166 | 95.0% |
| White / Caucasian | 33 | 2.7% |
| Two or more Races | 27 | 2.2% |
| Some other Race | 0 | 0.0% |
| Total | 1,228 | 100.0% |
Ancestry in Redby
The most populous ancestries reported in Redby are Chippewa (783 | 63.8%), French (214 | 17.4%), Polish (70 | 5.7%), German (43 | 3.5%), and Mexican (15 | 1.2%), together accounting for 91.6% of all Redby residents.
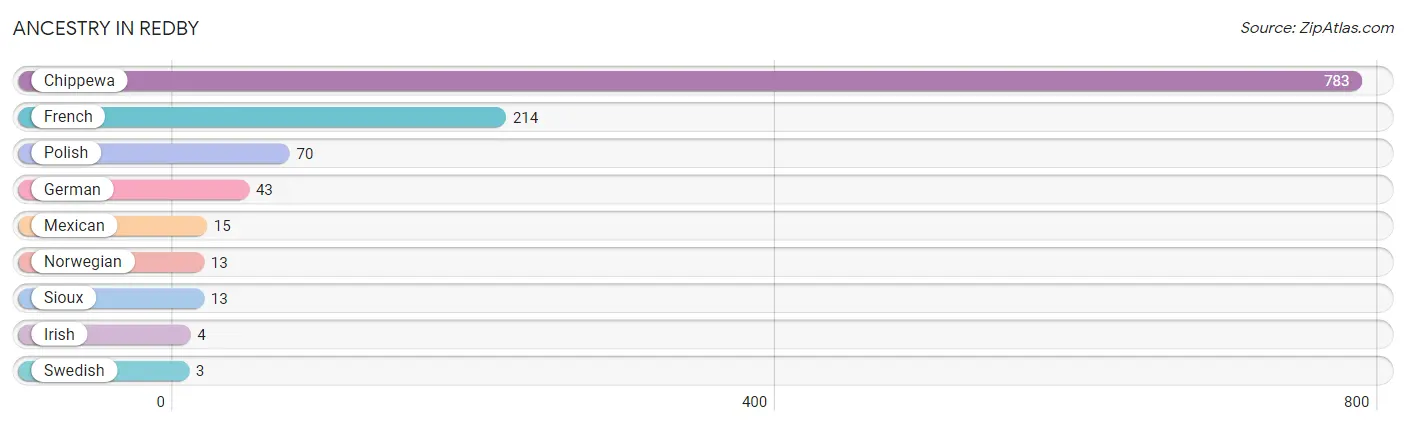
| Ancestry | # Population | % Population |
| Chippewa | 783 | 63.8% |
| French | 214 | 17.4% |
| German | 43 | 3.5% |
| Irish | 4 | 0.3% |
| Mexican | 15 | 1.2% |
| Norwegian | 13 | 1.1% |
| Polish | 70 | 5.7% |
| Sioux | 13 | 1.1% |
| Swedish | 3 | 0.2% | View All 9 Rows |
Immigrants in Redby

| Immigration Origin | # Population | % Population | View All 0 Rows |
Sex and Age in Redby
Sex and Age in Redby
The most populous age groups in Redby are 10 to 14 Years (89 | 14.2%) for men and 30 to 34 Years (147 | 24.4%) for women.
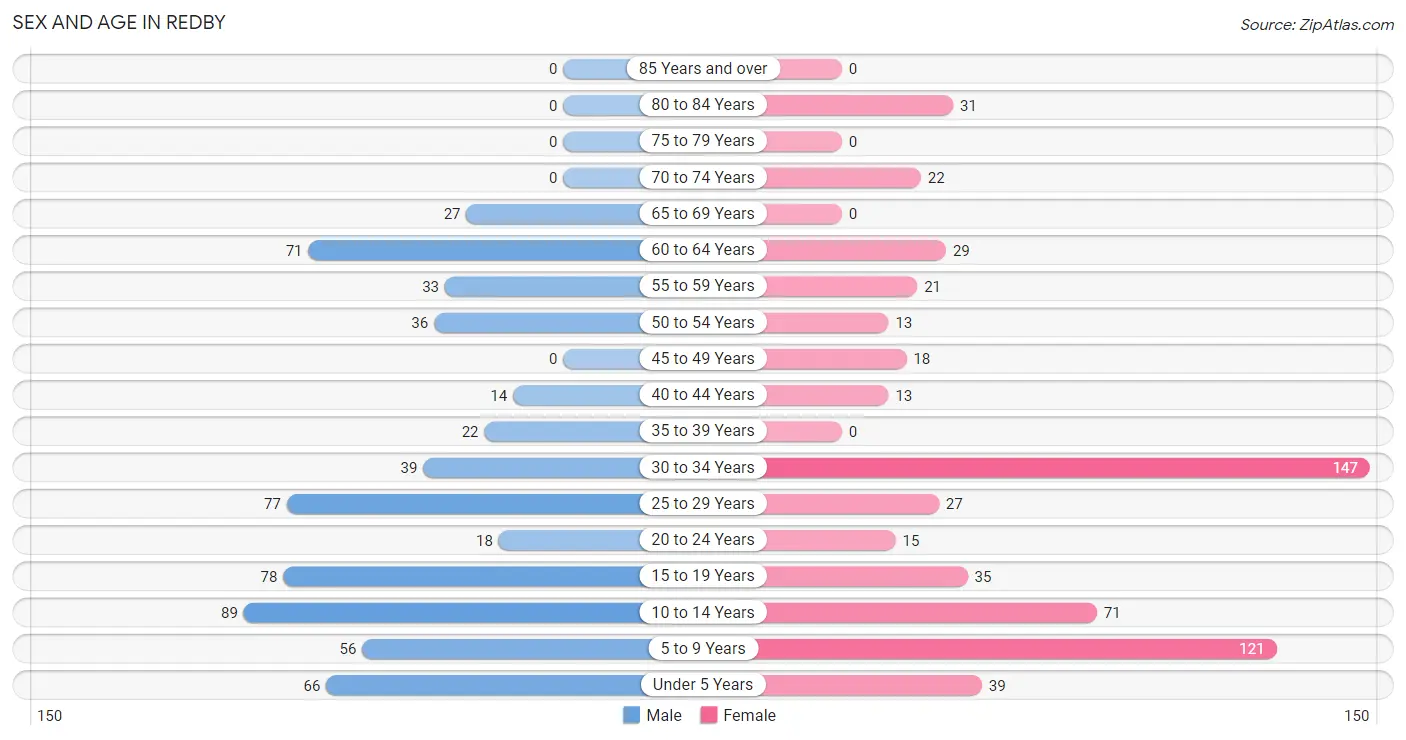
| Age Bracket | Male | Female |
| Under 5 Years | 66 (10.5%) | 39 (6.5%) |
| 5 to 9 Years | 56 (8.9%) | 121 (20.1%) |
| 10 to 14 Years | 89 (14.2%) | 71 (11.8%) |
| 15 to 19 Years | 78 (12.5%) | 35 (5.8%) |
| 20 to 24 Years | 18 (2.9%) | 15 (2.5%) |
| 25 to 29 Years | 77 (12.3%) | 27 (4.5%) |
| 30 to 34 Years | 39 (6.2%) | 147 (24.4%) |
| 35 to 39 Years | 22 (3.5%) | 0 (0.0%) |
| 40 to 44 Years | 14 (2.2%) | 13 (2.2%) |
| 45 to 49 Years | 0 (0.0%) | 18 (3.0%) |
| 50 to 54 Years | 36 (5.8%) | 13 (2.2%) |
| 55 to 59 Years | 33 (5.3%) | 21 (3.5%) |
| 60 to 64 Years | 71 (11.3%) | 29 (4.8%) |
| 65 to 69 Years | 27 (4.3%) | 0 (0.0%) |
| 70 to 74 Years | 0 (0.0%) | 22 (3.6%) |
| 75 to 79 Years | 0 (0.0%) | 0 (0.0%) |
| 80 to 84 Years | 0 (0.0%) | 31 (5.1%) |
| 85 Years and over | 0 (0.0%) | 0 (0.0%) |
| Total | 626 (100.0%) | 602 (100.0%) |
Families and Households in Redby
Median Family Size in Redby
The median family size in Redby is 4.86 persons per family, with married-couple families (6 | 2.8%) accounting for the largest median family size of 11 persons per family. On the other hand, single male/father families (63 | 29.4%) represent the smallest median family size with 4.10 persons per family.
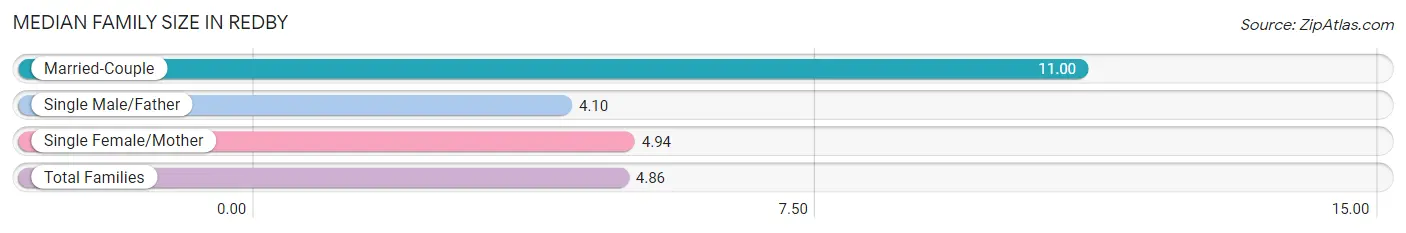
| Family Type | # Families | Family Size |
| Married-Couple | 6 (2.8%) | 11.00 |
| Single Male/Father | 63 (29.4%) | 4.10 |
| Single Female/Mother | 145 (67.8%) | 4.94 |
| Total Families | 214 (100.0%) | 4.86 |
Median Household Size in Redby
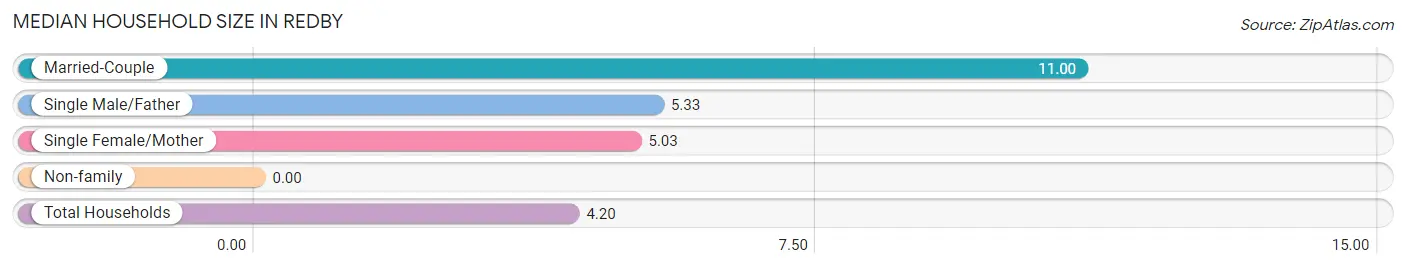
| Household Type | # Households | Household Size |
| Married-Couple | 6 (2.1%) | 11.00 |
| Single Male/Father | 63 (22.0%) | 5.33 |
| Single Female/Mother | 145 (50.5%) | 5.03 |
| Non-family | 73 (25.4%) | - |
| Total Households | 287 (100.0%) | 4.20 |
Household Size by Marriage Status in Redby
Out of a total of 287 households in Redby, 214 (74.6%) are family households, while 73 (25.4%) are nonfamily households. The most numerous type of family households are 7+ person households, comprising 70, and the most common type of nonfamily households are 1-person households, comprising 73.
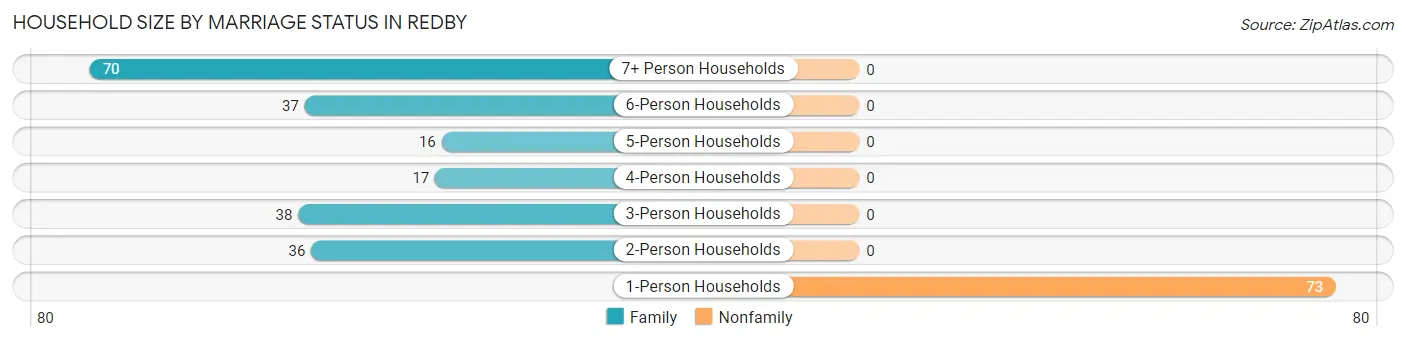
| Household Size | Family Households | Nonfamily Households |
| 1-Person Households | - | 73 (25.4%) |
| 2-Person Households | 36 (12.5%) | 0 (0.0%) |
| 3-Person Households | 38 (13.2%) | 0 (0.0%) |
| 4-Person Households | 17 (5.9%) | 0 (0.0%) |
| 5-Person Households | 16 (5.6%) | 0 (0.0%) |
| 6-Person Households | 37 (12.9%) | 0 (0.0%) |
| 7+ Person Households | 70 (24.4%) | 0 (0.0%) |
| Total | 214 (74.6%) | 73 (25.4%) |
Female Fertility in Redby
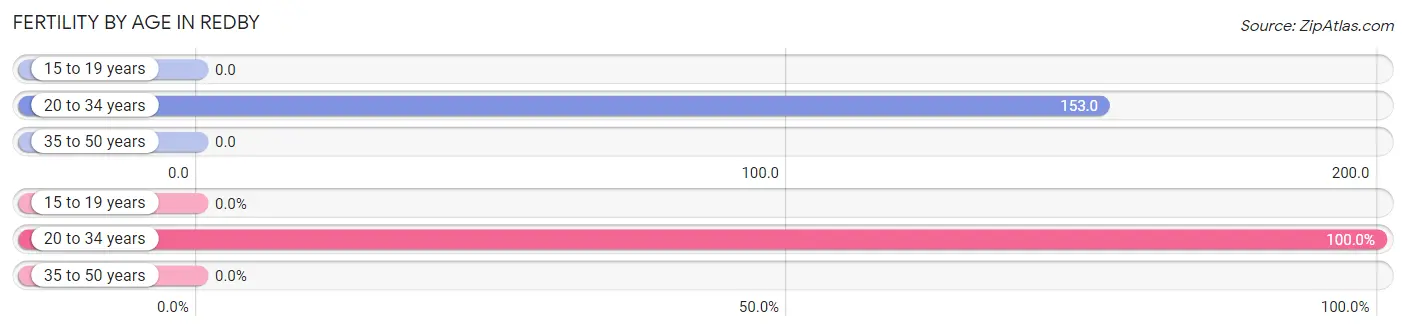
Fertility by Age in Redby
Average fertility rate in Redby is 114.0 births per 1,000 women. Women in the age bracket of 20 to 34 years have the highest fertility rate with 153.0 births per 1,000 women. Women in the age bracket of 20 to 34 years acount for 100.0% of all women with births.
| Age Bracket | Women with Births | Births / 1,000 Women |
| 15 to 19 years | 0 (0.0%) | 0.0 |
| 20 to 34 years | 29 (100.0%) | 153.0 |
| 35 to 50 years | 0 (0.0%) | 0.0 |
| Total | 29 (100.0%) | 114.0 |
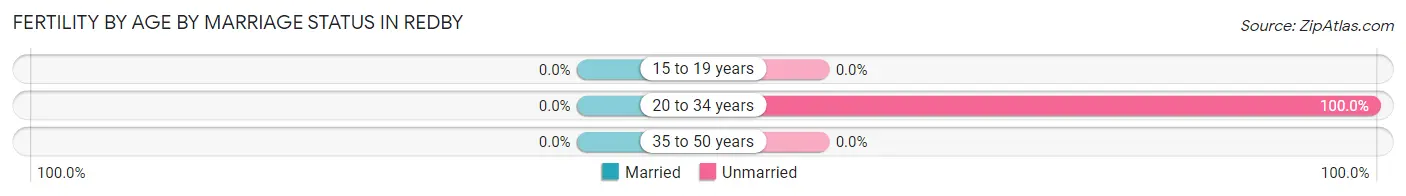
Fertility by Age by Marriage Status in Redby
| Age Bracket | Married | Unmarried |
| 15 to 19 years | 0 (0.0%) | 0 (0.0%) |
| 20 to 34 years | 0 (0.0%) | 29 (100.0%) |
| 35 to 50 years | 0 (0.0%) | 0 (0.0%) |
| Total | 0 (0.0%) | 29 (100.0%) |
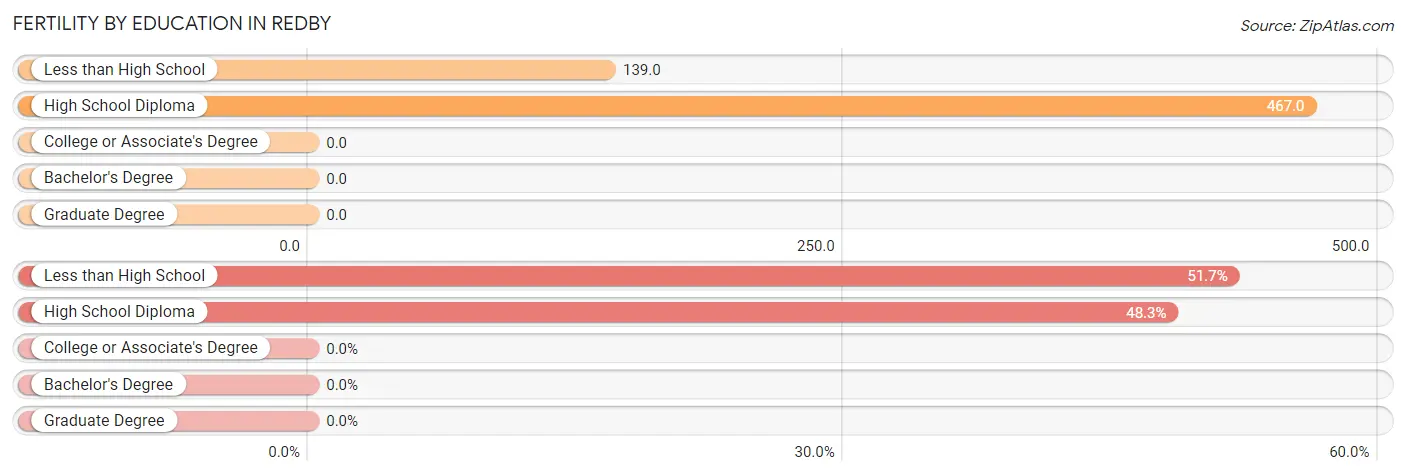
Fertility by Education in Redby
| Educational Attainment | Women with Births | Births / 1,000 Women |
| Less than High School | 15 (51.7%) | 139.0 |
| High School Diploma | 14 (48.3%) | 467.0 |
| College or Associate's Degree | 0 (0.0%) | 0.0 |
| Bachelor's Degree | 0 (0.0%) | 0.0 |
| Graduate Degree | 0 (0.0%) | 0.0 |
| Total | 29 (100.0%) | 114.0 |
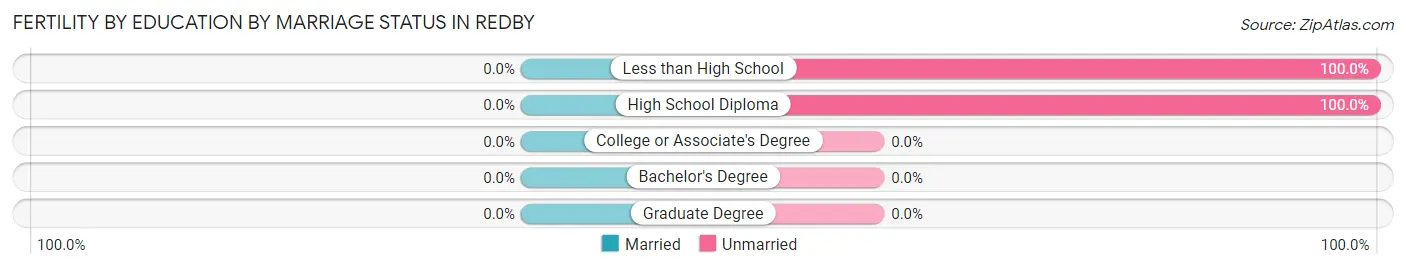
Fertility by Education by Marriage Status in Redby
| Educational Attainment | Married | Unmarried |
| Less than High School | 0 (0.0%) | 15 (100.0%) |
| High School Diploma | 0 (0.0%) | 14 (100.0%) |
| College or Associate's Degree | 0 (0.0%) | 0 (0.0%) |
| Bachelor's Degree | 0 (0.0%) | 0 (0.0%) |
| Graduate Degree | 0 (0.0%) | 0 (0.0%) |
| Total | 0 (0.0%) | 29 (100.0%) |
Employment Characteristics in Redby
Employment by Class of Employer in Redby
Among the 348 employed individuals in Redby, local government employees (242 | 69.5%), federal government employees (61 | 17.5%), and private company employees (27 | 7.8%) make up the most common classes of employment.
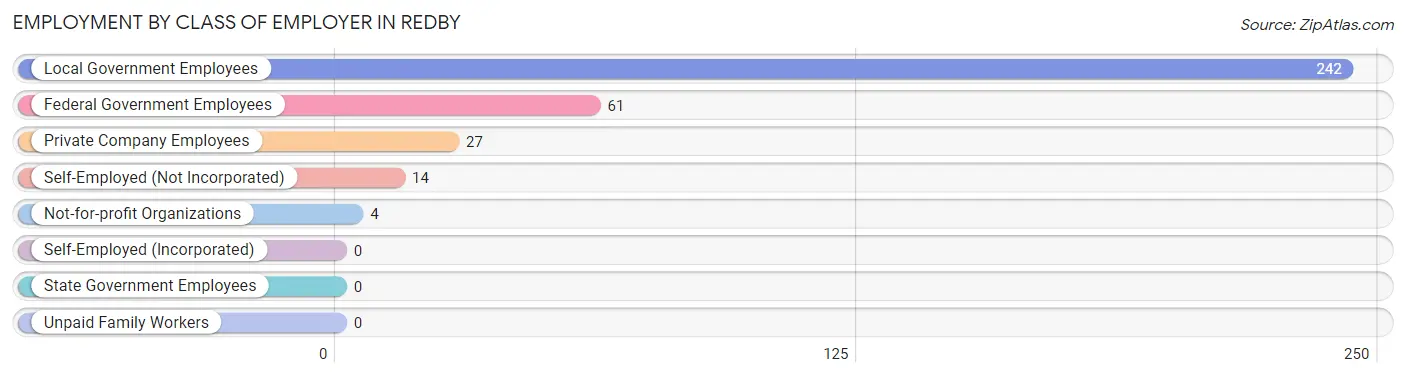
| Employer Class | # Employees | % Employees |
| Private Company Employees | 27 | 7.8% |
| Self-Employed (Incorporated) | 0 | 0.0% |
| Self-Employed (Not Incorporated) | 14 | 4.0% |
| Not-for-profit Organizations | 4 | 1.1% |
| Local Government Employees | 242 | 69.5% |
| State Government Employees | 0 | 0.0% |
| Federal Government Employees | 61 | 17.5% |
| Unpaid Family Workers | 0 | 0.0% |
| Total | 348 | 100.0% |
Employment Status by Age in Redby
According to the labor force statistics for Redby, out of the total population over 16 years of age (736), 56.3% or 414 individuals are in the labor force, with 15.9% or 66 of them unemployed. The age group with the highest labor force participation rate is 20 to 24 years, with 100.0% or 33 individuals in the labor force. Within the labor force, the 20 to 24 years age range has the highest percentage of unemployed individuals, with 45.5% or 15 of them being unemployed.
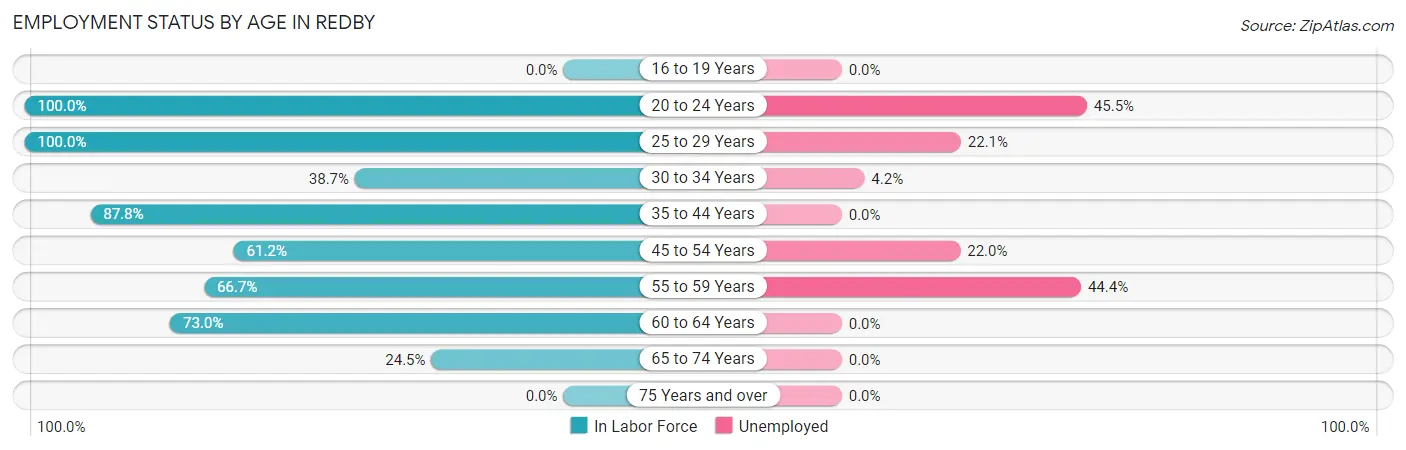
| Age Bracket | In Labor Force | Unemployed |
| 16 to 19 Years | 0 (0.0%) | 0 (0.0%) |
| 20 to 24 Years | 33 (100.0%) | 15 (45.5%) |
| 25 to 29 Years | 104 (100.0%) | 23 (22.1%) |
| 30 to 34 Years | 72 (38.7%) | 3 (4.2%) |
| 35 to 44 Years | 43 (87.8%) | 0 (0.0%) |
| 45 to 54 Years | 41 (61.2%) | 9 (22.0%) |
| 55 to 59 Years | 36 (66.7%) | 16 (44.4%) |
| 60 to 64 Years | 73 (73.0%) | 0 (0.0%) |
| 65 to 74 Years | 12 (24.5%) | 0 (0.0%) |
| 75 Years and over | 0 (0.0%) | 0 (0.0%) |
| Total | 414 (56.3%) | 66 (15.9%) |
Employment Status by Educational Attainment in Redby
According to labor force statistics for Redby, 65.9% of individuals (369) out of the total population between 25 and 64 years of age (560) are in the labor force, with 13.8% or 51 of them being unemployed. The group with the highest labor force participation rate are those with the educational attainment of bachelor's degree or higher, with 100.0% or 28 individuals in the labor force. Within the labor force, individuals with less than high school education have the highest percentage of unemployment, with 100.0% or 23 of them being unemployed.
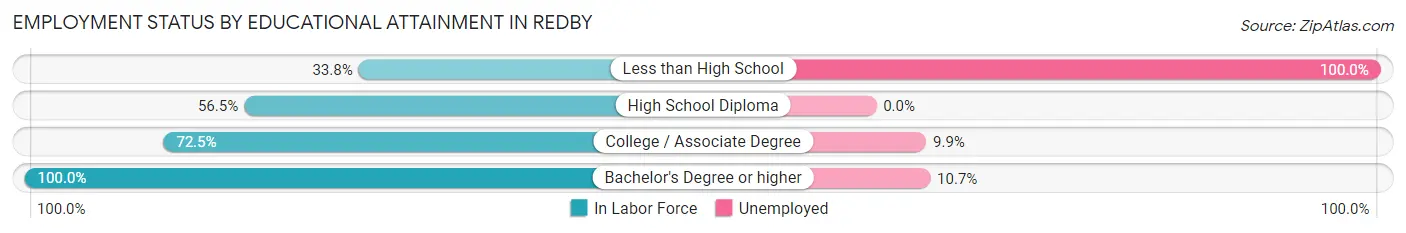
| Educational Attainment | In Labor Force | Unemployed |
| Less than High School | 23 (33.8%) | 68 (100.0%) |
| High School Diploma | 65 (56.5%) | 0 (0.0%) |
| College / Associate Degree | 253 (72.5%) | 35 (9.9%) |
| Bachelor's Degree or higher | 28 (100.0%) | 3 (10.7%) |
| Total | 369 (65.9%) | 77 (13.8%) |
Employment Occupations by Sex in Redby
Management, Business, Science and Arts Occupations
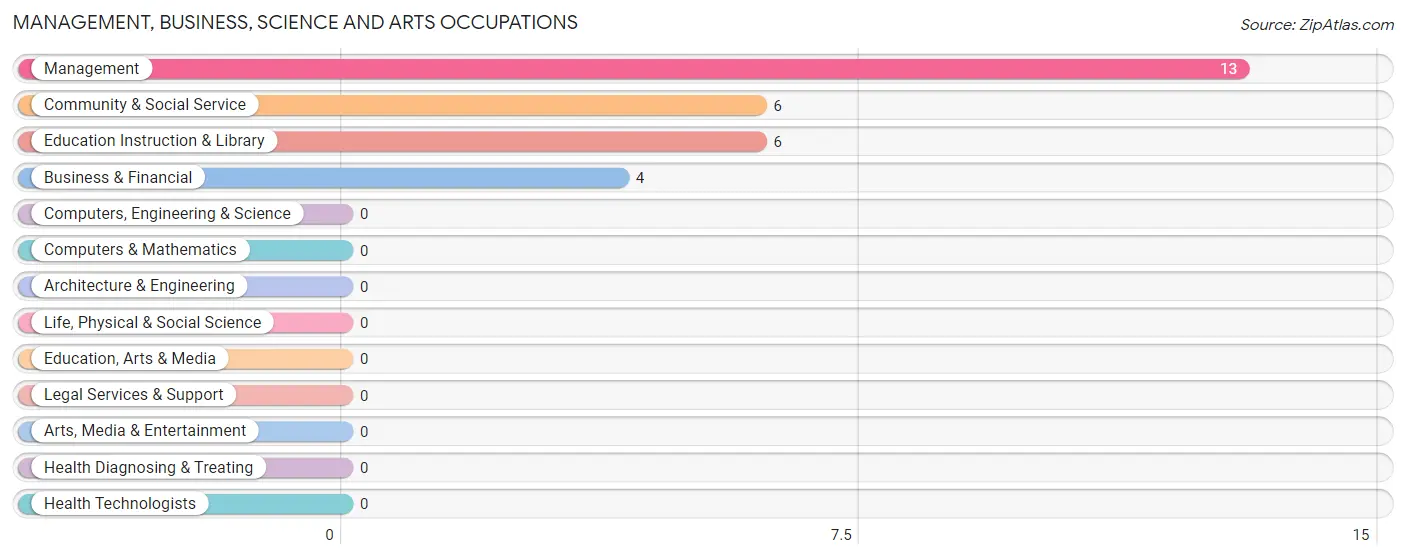
The most common Management, Business, Science and Arts occupations in Redby are Management (13 | 3.7%), Community & Social Service (6 | 1.7%), Education Instruction & Library (6 | 1.7%), and Business & Financial (4 | 1.1%).
Management, Business, Science and Arts Occupations by Sex
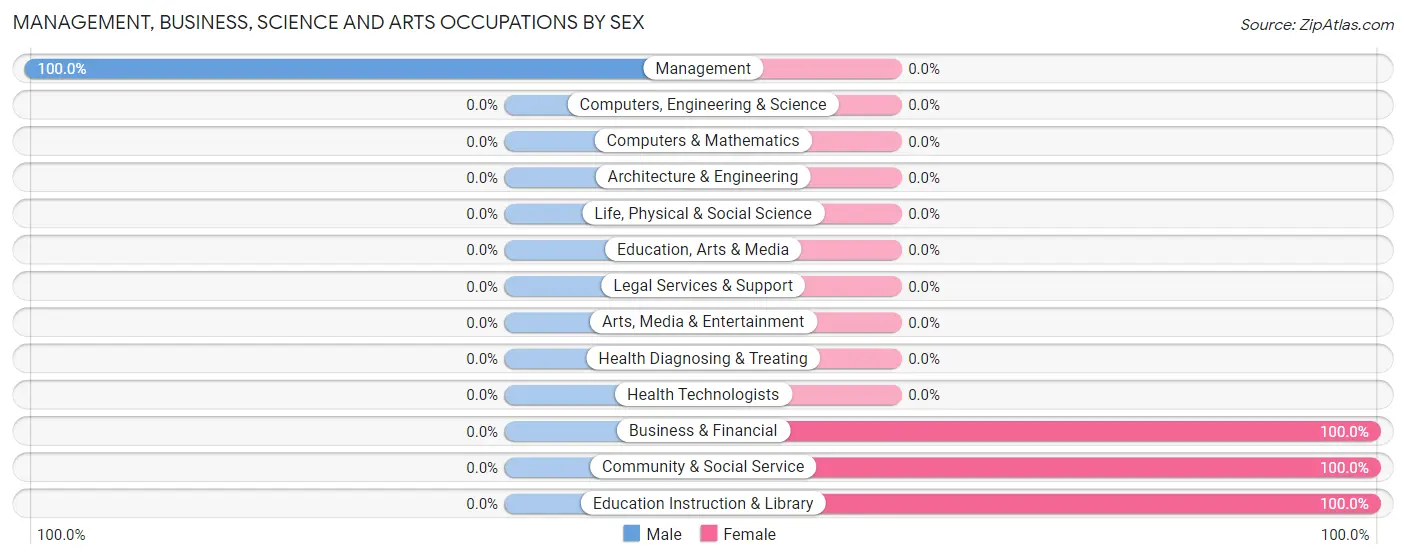
| Occupation | Male | Female |
| Management | 13 (100.0%) | 0 (0.0%) |
| Business & Financial | 0 (0.0%) | 4 (100.0%) |
| Computers, Engineering & Science | 0 (0.0%) | 0 (0.0%) |
| Computers & Mathematics | 0 (0.0%) | 0 (0.0%) |
| Architecture & Engineering | 0 (0.0%) | 0 (0.0%) |
| Life, Physical & Social Science | 0 (0.0%) | 0 (0.0%) |
| Community & Social Service | 0 (0.0%) | 6 (100.0%) |
| Education, Arts & Media | 0 (0.0%) | 0 (0.0%) |
| Legal Services & Support | 0 (0.0%) | 0 (0.0%) |
| Education Instruction & Library | 0 (0.0%) | 6 (100.0%) |
| Arts, Media & Entertainment | 0 (0.0%) | 0 (0.0%) |
| Health Diagnosing & Treating | 0 (0.0%) | 0 (0.0%) |
| Health Technologists | 0 (0.0%) | 0 (0.0%) |
| Total (Category) | 13 (56.5%) | 10 (43.5%) |
| Total (Overall) | 218 (62.6%) | 130 (37.4%) |
Services Occupations
The most common Services occupations in Redby are Cleaning & Maintenance (40 | 11.5%), Food Preparation & Serving (19 | 5.5%), Security & Protection (16 | 4.6%), Law Enforcement (16 | 4.6%), and Healthcare Support (14 | 4.0%).
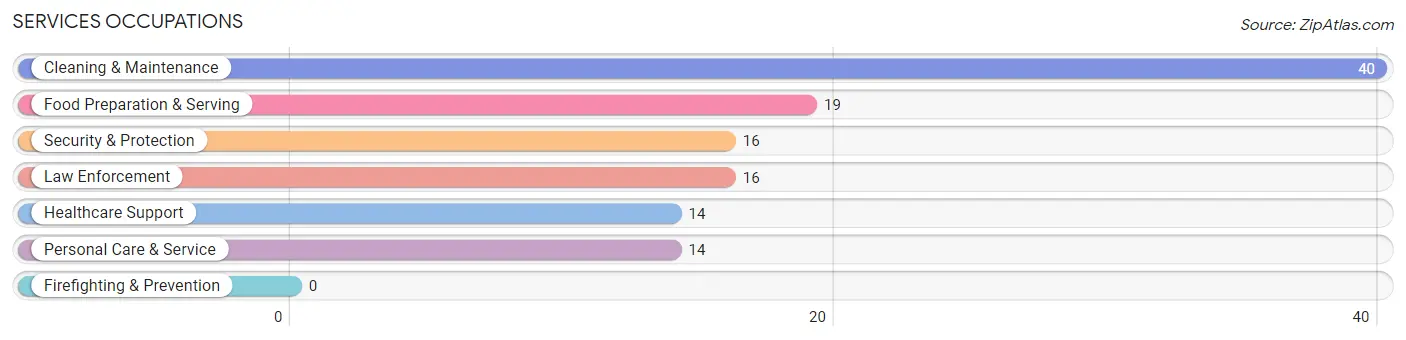
Services Occupations by Sex
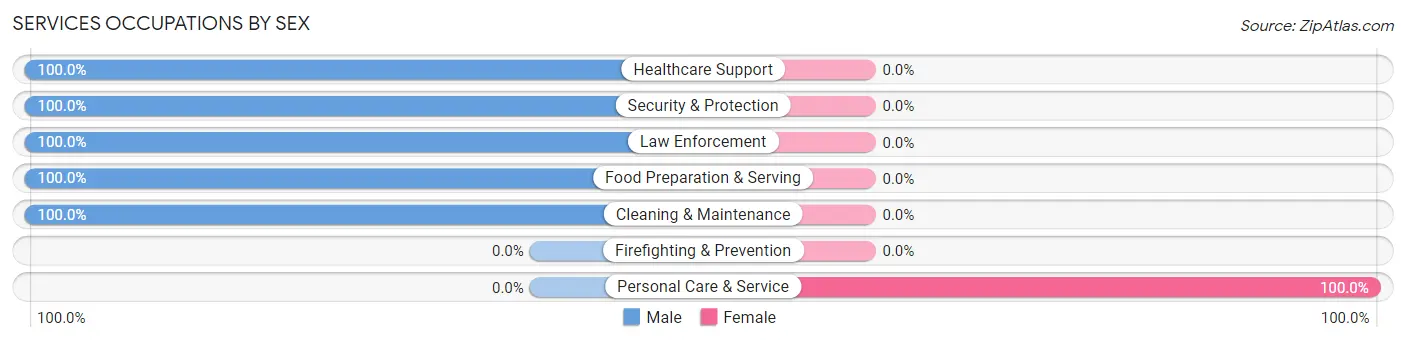
| Occupation | Male | Female |
| Healthcare Support | 14 (100.0%) | 0 (0.0%) |
| Security & Protection | 16 (100.0%) | 0 (0.0%) |
| Firefighting & Prevention | 0 (0.0%) | 0 (0.0%) |
| Law Enforcement | 16 (100.0%) | 0 (0.0%) |
| Food Preparation & Serving | 19 (100.0%) | 0 (0.0%) |
| Cleaning & Maintenance | 40 (100.0%) | 0 (0.0%) |
| Personal Care & Service | 0 (0.0%) | 14 (100.0%) |
| Total (Category) | 89 (86.4%) | 14 (13.6%) |
| Total (Overall) | 218 (62.6%) | 130 (37.4%) |
Sales and Office Occupations
The most common Sales and Office occupations in Redby are Office & Administration (167 | 48.0%), and Sales & Related (13 | 3.7%).
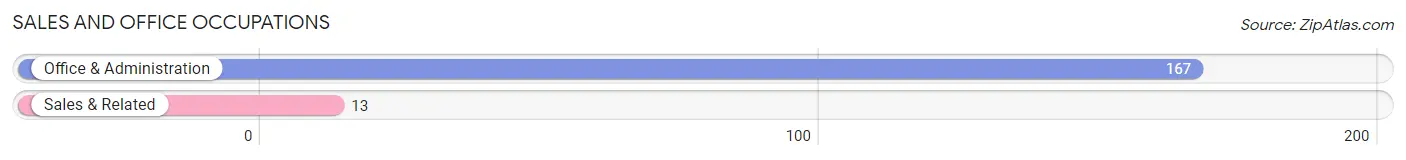
Sales and Office Occupations by Sex
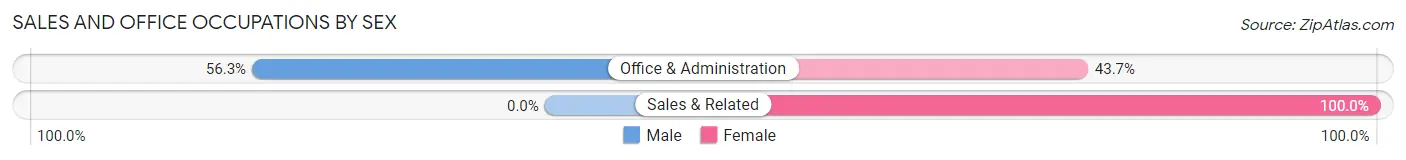
| Occupation | Male | Female |
| Sales & Related | 0 (0.0%) | 13 (100.0%) |
| Office & Administration | 94 (56.3%) | 73 (43.7%) |
| Total (Category) | 94 (52.2%) | 86 (47.8%) |
| Total (Overall) | 218 (62.6%) | 130 (37.4%) |
Natural Resources, Construction and Maintenance Occupations
The most common Natural Resources, Construction and Maintenance occupations in Redby are , and Farming, Fishing & Forestry (8 | 2.3%).
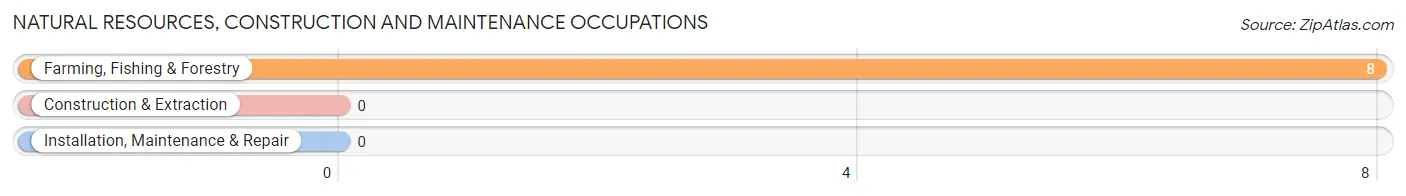
Natural Resources, Construction and Maintenance Occupations by Sex
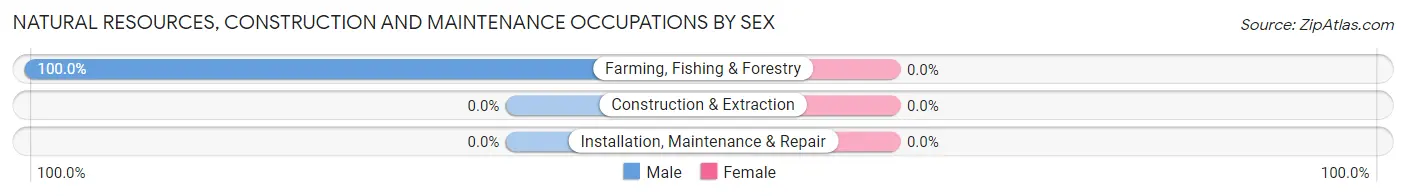
| Occupation | Male | Female |
| Farming, Fishing & Forestry | 8 (100.0%) | 0 (0.0%) |
| Construction & Extraction | 0 (0.0%) | 0 (0.0%) |
| Installation, Maintenance & Repair | 0 (0.0%) | 0 (0.0%) |
| Total (Category) | 8 (100.0%) | 0 (0.0%) |
| Total (Overall) | 218 (62.6%) | 130 (37.4%) |
Production, Transportation and Moving Occupations
The most common Production, Transportation and Moving occupations in Redby are Transportation (20 | 5.8%), and Material Moving (14 | 4.0%).
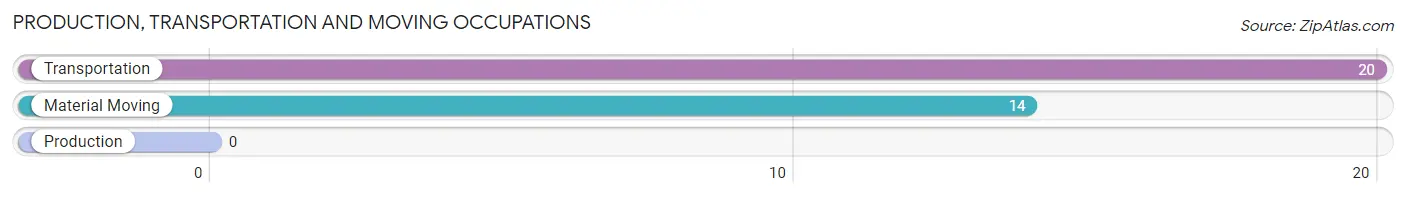
Production, Transportation and Moving Occupations by Sex
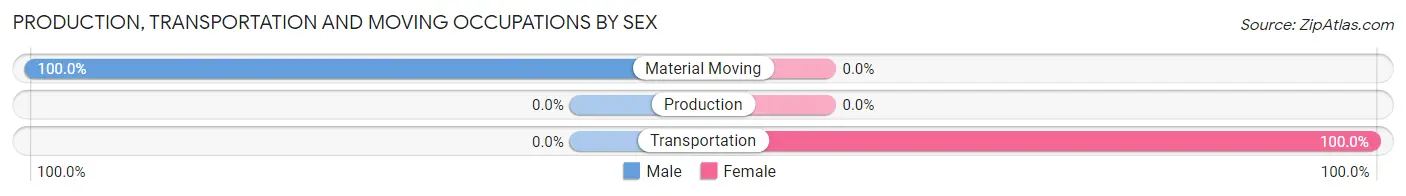
| Occupation | Male | Female |
| Production | 0 (0.0%) | 0 (0.0%) |
| Transportation | 0 (0.0%) | 20 (100.0%) |
| Material Moving | 14 (100.0%) | 0 (0.0%) |
| Total (Category) | 14 (41.2%) | 20 (58.8%) |
| Total (Overall) | 218 (62.6%) | 130 (37.4%) |
Employment Industries by Sex in Redby
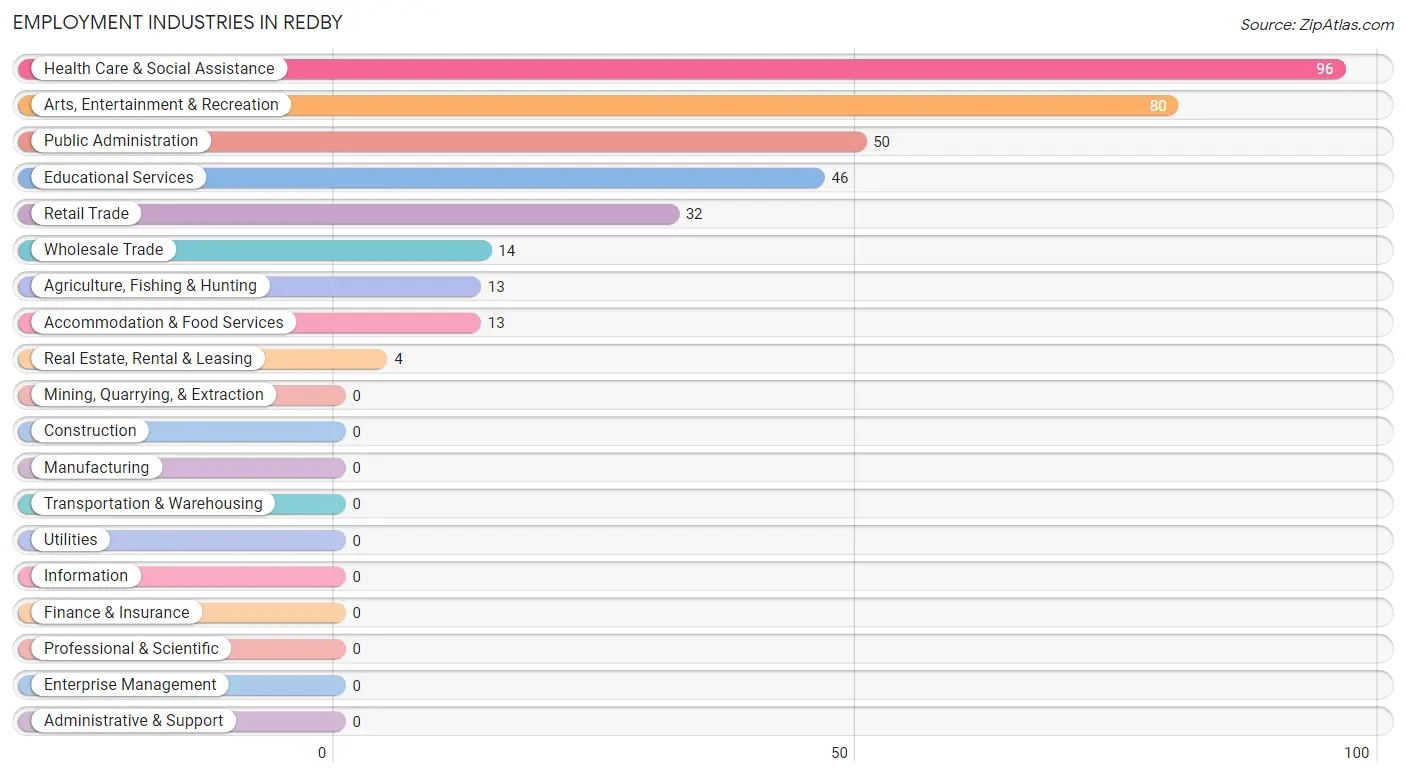
Employment Industries in Redby
The major employment industries in Redby include Health Care & Social Assistance (96 | 27.6%), Arts, Entertainment & Recreation (80 | 23.0%), Public Administration (50 | 14.4%), Educational Services (46 | 13.2%), and Retail Trade (32 | 9.2%).
Employment Industries by Sex in Redby
The Redby industries that see more men than women are Agriculture, Fishing & Hunting (100.0%), Wholesale Trade (100.0%), and Accommodation & Food Services (100.0%), whereas the industries that tend to have a higher number of women are Real Estate, Rental & Leasing (100.0%), Health Care & Social Assistance (71.9%), and Public Administration (52.0%).
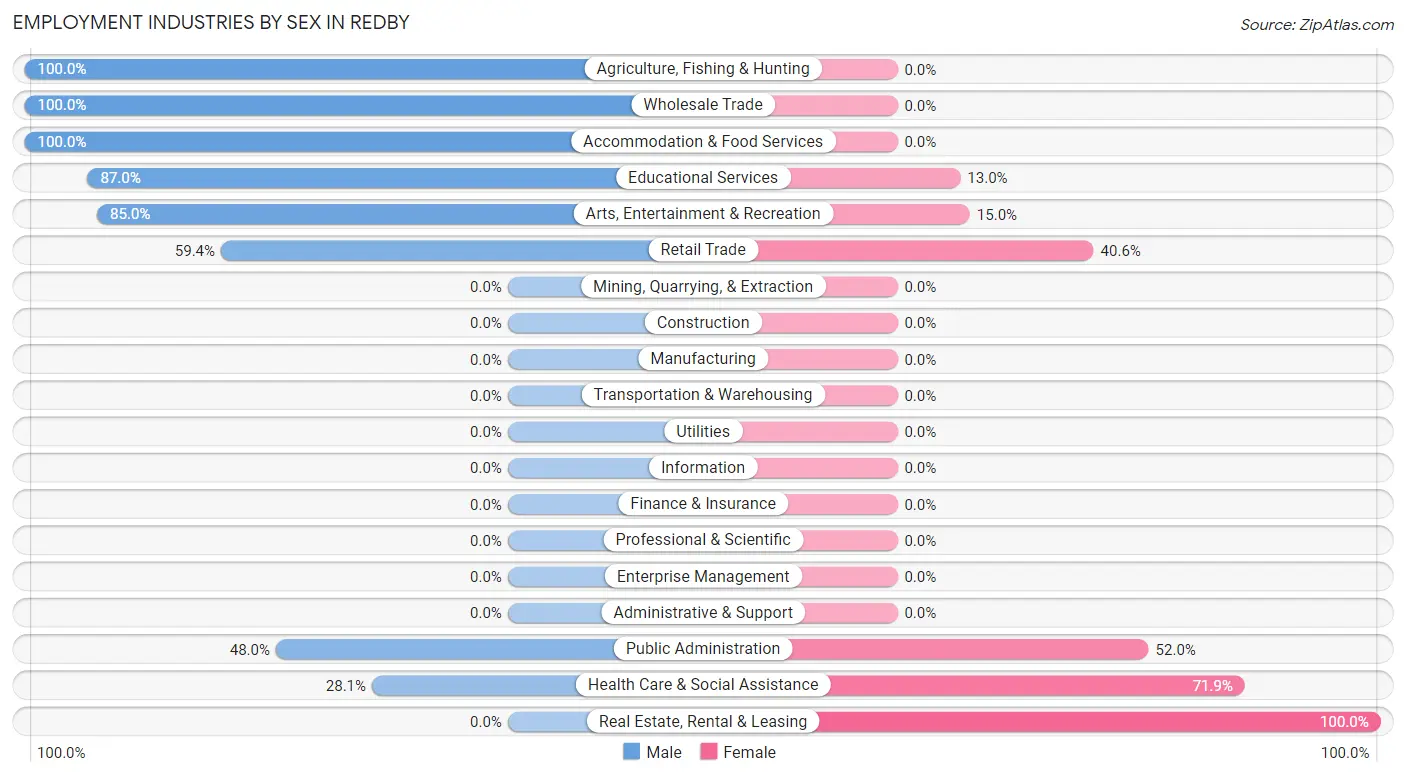
| Industry | Male | Female |
| Agriculture, Fishing & Hunting | 13 (100.0%) | 0 (0.0%) |
| Mining, Quarrying, & Extraction | 0 (0.0%) | 0 (0.0%) |
| Construction | 0 (0.0%) | 0 (0.0%) |
| Manufacturing | 0 (0.0%) | 0 (0.0%) |
| Wholesale Trade | 14 (100.0%) | 0 (0.0%) |
| Retail Trade | 19 (59.4%) | 13 (40.6%) |
| Transportation & Warehousing | 0 (0.0%) | 0 (0.0%) |
| Utilities | 0 (0.0%) | 0 (0.0%) |
| Information | 0 (0.0%) | 0 (0.0%) |
| Finance & Insurance | 0 (0.0%) | 0 (0.0%) |
| Real Estate, Rental & Leasing | 0 (0.0%) | 4 (100.0%) |
| Professional & Scientific | 0 (0.0%) | 0 (0.0%) |
| Enterprise Management | 0 (0.0%) | 0 (0.0%) |
| Administrative & Support | 0 (0.0%) | 0 (0.0%) |
| Educational Services | 40 (87.0%) | 6 (13.0%) |
| Health Care & Social Assistance | 27 (28.1%) | 69 (71.9%) |
| Arts, Entertainment & Recreation | 68 (85.0%) | 12 (15.0%) |
| Accommodation & Food Services | 13 (100.0%) | 0 (0.0%) |
| Public Administration | 24 (48.0%) | 26 (52.0%) |
| Total | 218 (62.6%) | 130 (37.4%) |
Education in Redby
School Enrollment in Redby
The most common levels of schooling among the 456 students in Redby are elementary school (143 | 31.4%), middle school (137 | 30.0%), and high school (101 | 22.2%).
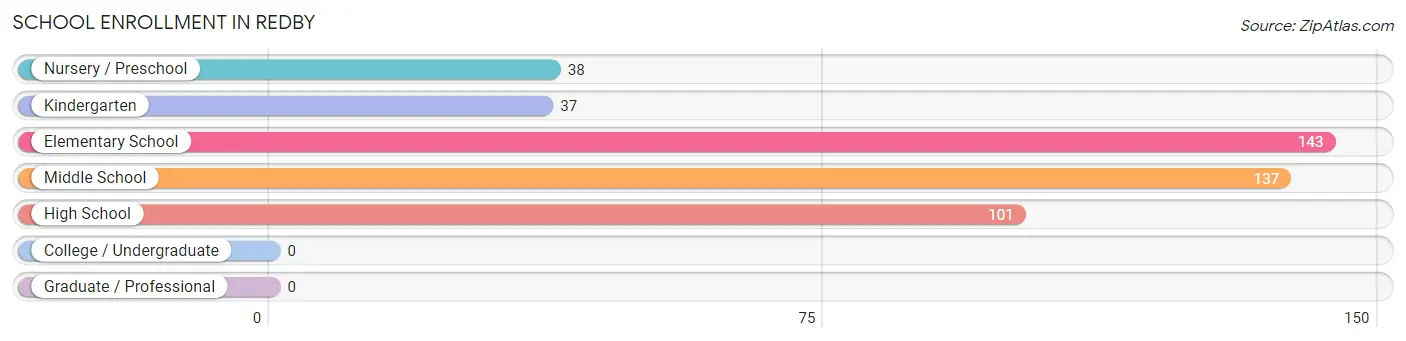
| School Level | # Students | % Students |
| Nursery / Preschool | 38 | 8.3% |
| Kindergarten | 37 | 8.1% |
| Elementary School | 143 | 31.4% |
| Middle School | 137 | 30.0% |
| High School | 101 | 22.2% |
| College / Undergraduate | 0 | 0.0% |
| Graduate / Professional | 0 | 0.0% |
| Total | 456 | 100.0% |
School Enrollment by Age by Funding Source in Redby
Out of a total of 456 students who are enrolled in schools in Redby, 18 (3.9%) attend a private institution, while the remaining 438 (96.1%) are enrolled in public schools. The age group of 5 to 9 year old has the highest likelihood of being enrolled in private schools, with 16 (9.0% in the age bracket) enrolled. Conversely, the age group of 3 to 4 year olds has the lowest likelihood of being enrolled in a private school, with 17 (100.0% in the age bracket) attending a public institution.
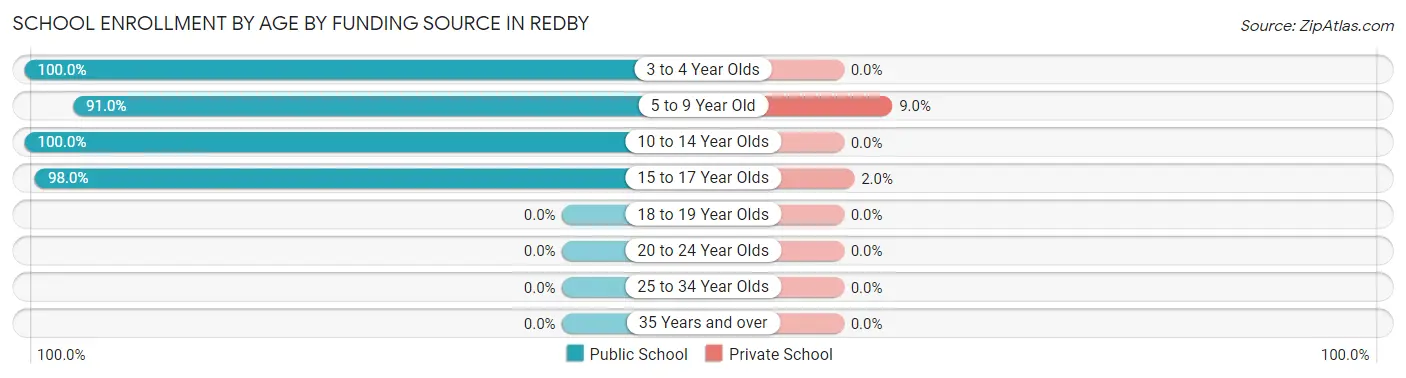
| Age Bracket | Public School | Private School |
| 3 to 4 Year Olds | 17 (100.0%) | 0 (0.0%) |
| 5 to 9 Year Old | 161 (91.0%) | 16 (9.0%) |
| 10 to 14 Year Olds | 160 (100.0%) | 0 (0.0%) |
| 15 to 17 Year Olds | 100 (98.0%) | 2 (2.0%) |
| 18 to 19 Year Olds | 0 (0.0%) | 0 (0.0%) |
| 20 to 24 Year Olds | 0 (0.0%) | 0 (0.0%) |
| 25 to 34 Year Olds | 0 (0.0%) | 0 (0.0%) |
| 35 Years and over | 0 (0.0%) | 0 (0.0%) |
| Total | 438 (96.1%) | 18 (3.9%) |
Educational Attainment by Field of Study in Redby
Education (25 | 89.3%), and engineering (3 | 10.7%) are the most common fields of study among 28 individuals in Redby who have obtained a bachelor's degree or higher.
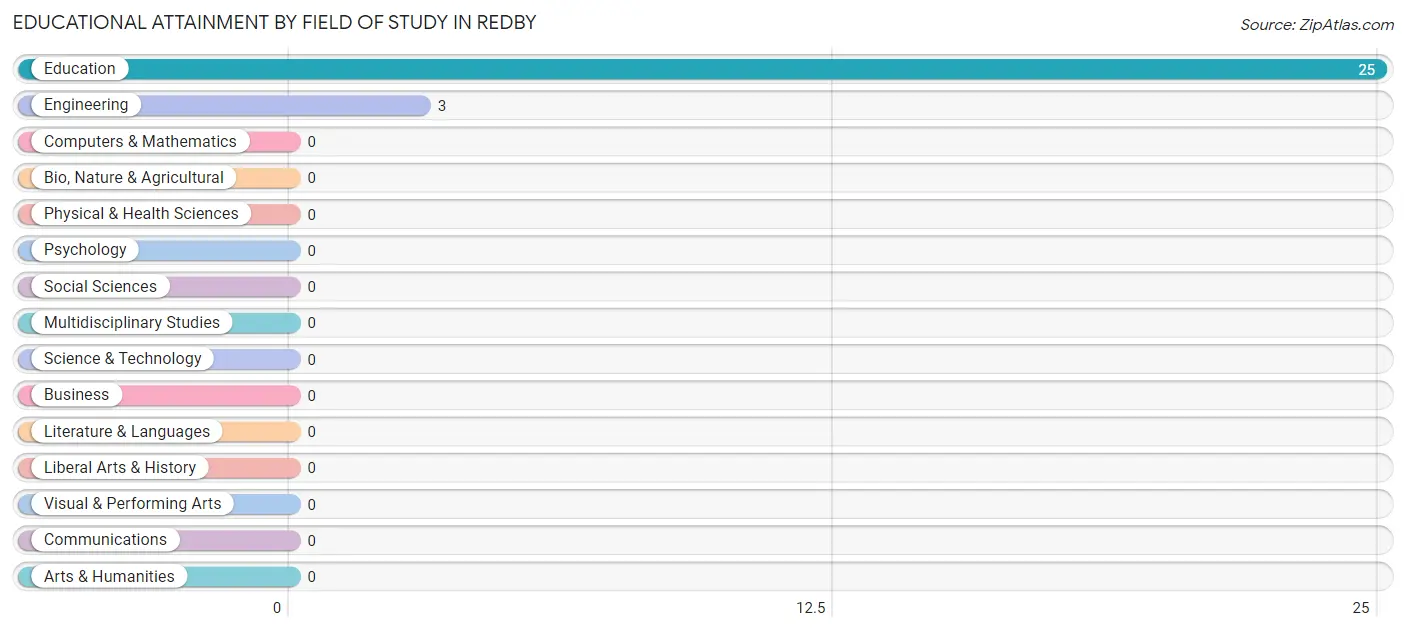
| Field of Study | # Graduates | % Graduates |
| Computers & Mathematics | 0 | 0.0% |
| Bio, Nature & Agricultural | 0 | 0.0% |
| Physical & Health Sciences | 0 | 0.0% |
| Psychology | 0 | 0.0% |
| Social Sciences | 0 | 0.0% |
| Engineering | 3 | 10.7% |
| Multidisciplinary Studies | 0 | 0.0% |
| Science & Technology | 0 | 0.0% |
| Business | 0 | 0.0% |
| Education | 25 | 89.3% |
| Literature & Languages | 0 | 0.0% |
| Liberal Arts & History | 0 | 0.0% |
| Visual & Performing Arts | 0 | 0.0% |
| Communications | 0 | 0.0% |
| Arts & Humanities | 0 | 0.0% |
| Total | 28 | 100.0% |
Transportation & Commute in Redby
Vehicle Availability by Sex in Redby
The most prevalent vehicle ownership categories in Redby are males with 3 vehicles (103, accounting for 47.2%) and females with 3 vehicles (25, making up 79.2%).
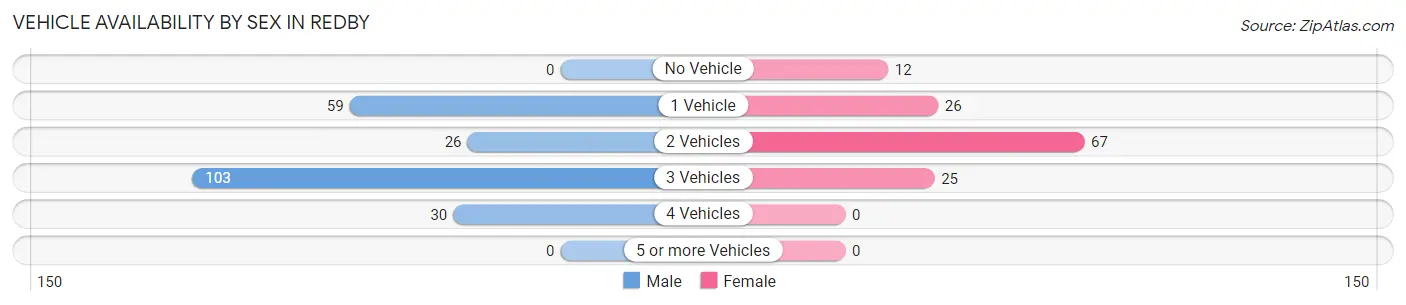
| Vehicles Available | Male | Female |
| No Vehicle | 0 (0.0%) | 12 (9.2%) |
| 1 Vehicle | 59 (27.1%) | 26 (20.0%) |
| 2 Vehicles | 26 (11.9%) | 67 (51.5%) |
| 3 Vehicles | 103 (47.2%) | 25 (19.2%) |
| 4 Vehicles | 30 (13.8%) | 0 (0.0%) |
| 5 or more Vehicles | 0 (0.0%) | 0 (0.0%) |
| Total | 218 (100.0%) | 130 (100.0%) |
Commute Time in Redby
The most frequently occuring commute durations in Redby are 10 to 14 minutes (96 commuters, 28.7%), 20 to 24 minutes (67 commuters, 20.1%), and 15 to 19 minutes (63 commuters, 18.9%).
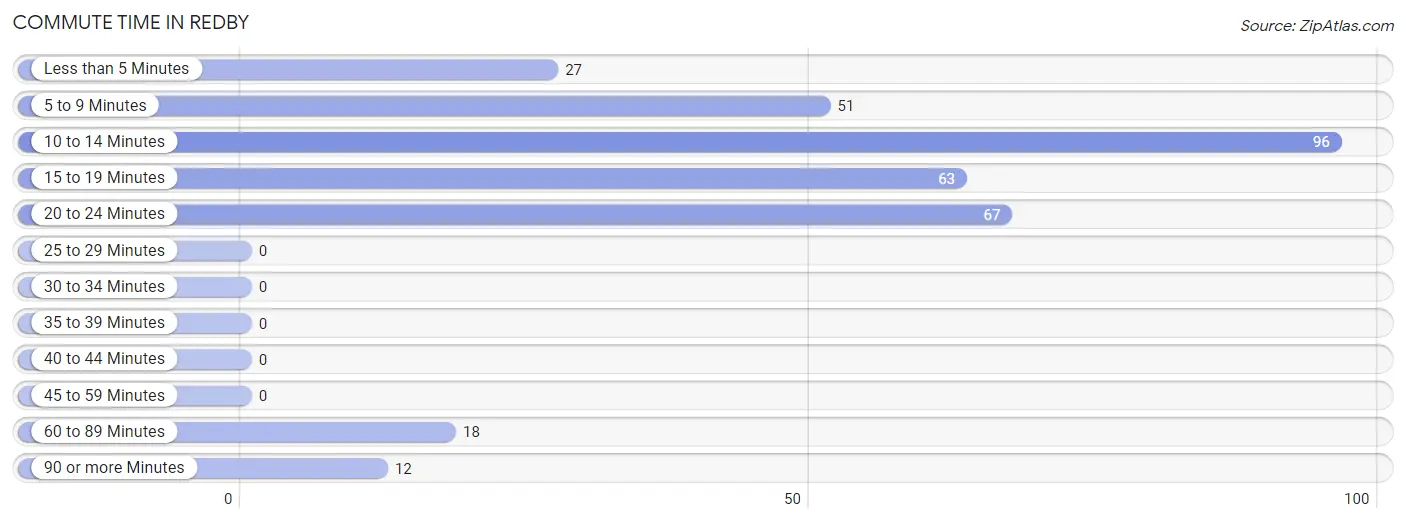
| Commute Time | # Commuters | % Commuters |
| Less than 5 Minutes | 27 | 8.1% |
| 5 to 9 Minutes | 51 | 15.3% |
| 10 to 14 Minutes | 96 | 28.7% |
| 15 to 19 Minutes | 63 | 18.9% |
| 20 to 24 Minutes | 67 | 20.1% |
| 25 to 29 Minutes | 0 | 0.0% |
| 30 to 34 Minutes | 0 | 0.0% |
| 35 to 39 Minutes | 0 | 0.0% |
| 40 to 44 Minutes | 0 | 0.0% |
| 45 to 59 Minutes | 0 | 0.0% |
| 60 to 89 Minutes | 18 | 5.4% |
| 90 or more Minutes | 12 | 3.6% |
Commute Time by Sex in Redby
The most common commute times in Redby are 10 to 14 minutes (53 commuters, 24.3%) for males and 10 to 14 minutes (43 commuters, 37.1%) for females.
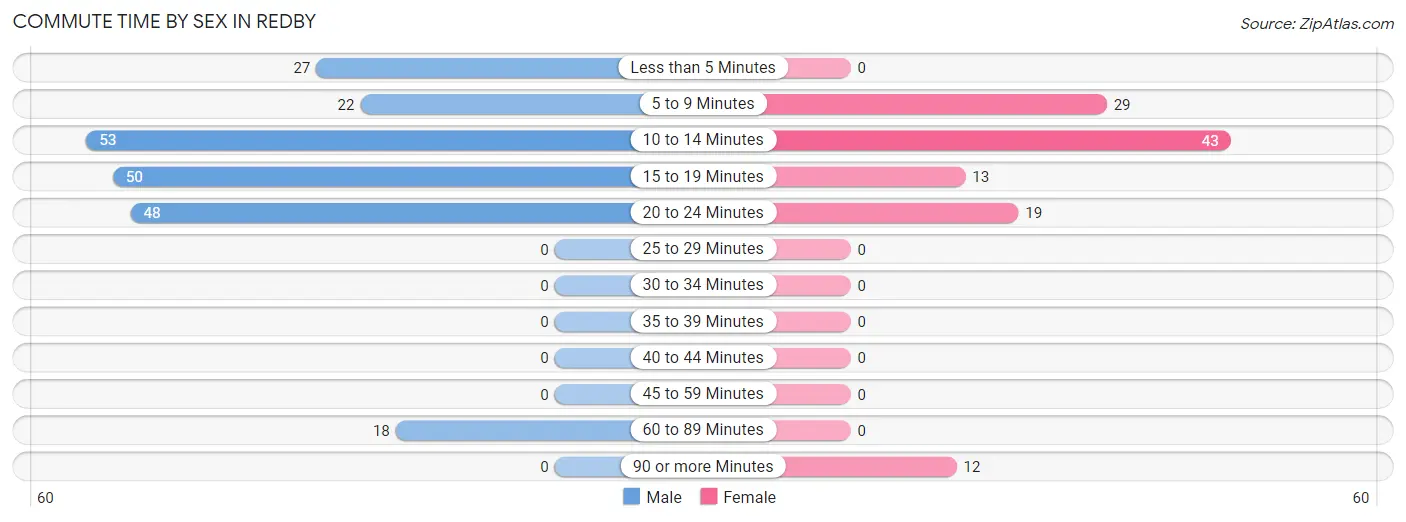
| Commute Time | Male | Female |
| Less than 5 Minutes | 27 (12.4%) | 0 (0.0%) |
| 5 to 9 Minutes | 22 (10.1%) | 29 (25.0%) |
| 10 to 14 Minutes | 53 (24.3%) | 43 (37.1%) |
| 15 to 19 Minutes | 50 (22.9%) | 13 (11.2%) |
| 20 to 24 Minutes | 48 (22.0%) | 19 (16.4%) |
| 25 to 29 Minutes | 0 (0.0%) | 0 (0.0%) |
| 30 to 34 Minutes | 0 (0.0%) | 0 (0.0%) |
| 35 to 39 Minutes | 0 (0.0%) | 0 (0.0%) |
| 40 to 44 Minutes | 0 (0.0%) | 0 (0.0%) |
| 45 to 59 Minutes | 0 (0.0%) | 0 (0.0%) |
| 60 to 89 Minutes | 18 (8.3%) | 0 (0.0%) |
| 90 or more Minutes | 0 (0.0%) | 12 (10.3%) |
Time of Departure to Work by Sex in Redby
The most frequent times of departure to work in Redby are 12:00 AM to 4:59 AM (68, 31.2%) for males and 7:30 AM to 7:59 AM (58, 50.0%) for females.
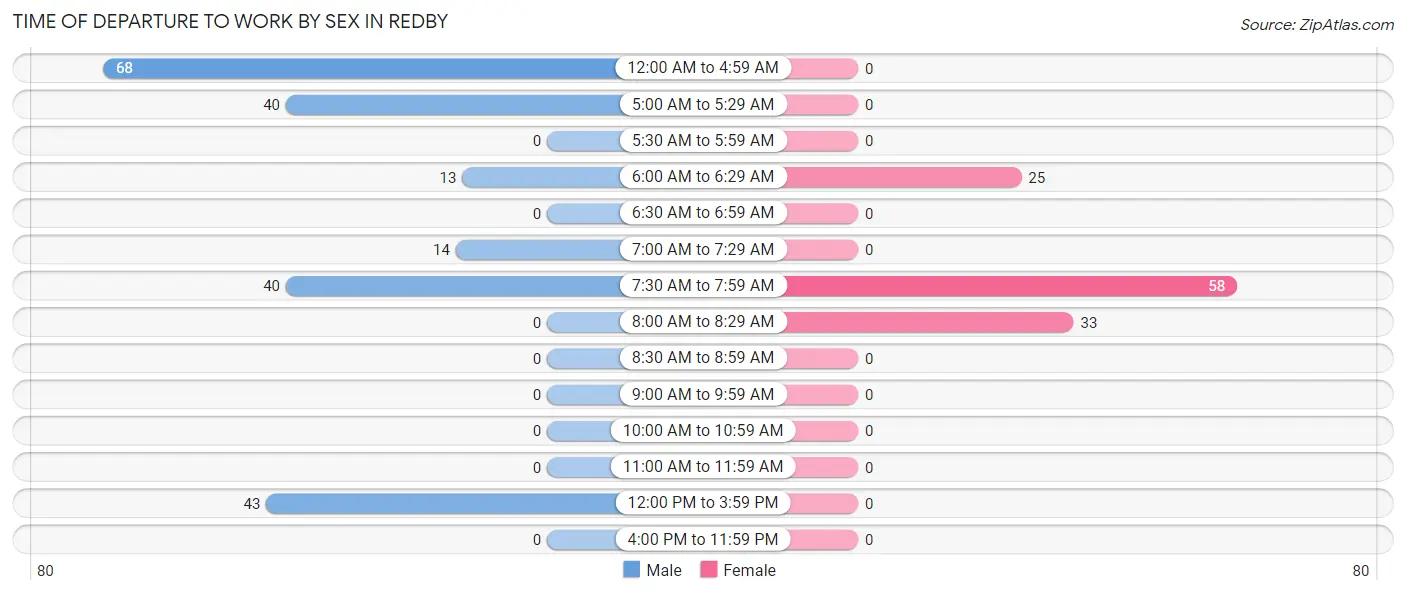
| Time of Departure | Male | Female |
| 12:00 AM to 4:59 AM | 68 (31.2%) | 0 (0.0%) |
| 5:00 AM to 5:29 AM | 40 (18.3%) | 0 (0.0%) |
| 5:30 AM to 5:59 AM | 0 (0.0%) | 0 (0.0%) |
| 6:00 AM to 6:29 AM | 13 (6.0%) | 25 (21.5%) |
| 6:30 AM to 6:59 AM | 0 (0.0%) | 0 (0.0%) |
| 7:00 AM to 7:29 AM | 14 (6.4%) | 0 (0.0%) |
| 7:30 AM to 7:59 AM | 40 (18.3%) | 58 (50.0%) |
| 8:00 AM to 8:29 AM | 0 (0.0%) | 33 (28.4%) |
| 8:30 AM to 8:59 AM | 0 (0.0%) | 0 (0.0%) |
| 9:00 AM to 9:59 AM | 0 (0.0%) | 0 (0.0%) |
| 10:00 AM to 10:59 AM | 0 (0.0%) | 0 (0.0%) |
| 11:00 AM to 11:59 AM | 0 (0.0%) | 0 (0.0%) |
| 12:00 PM to 3:59 PM | 43 (19.7%) | 0 (0.0%) |
| 4:00 PM to 11:59 PM | 0 (0.0%) | 0 (0.0%) |
| Total | 218 (100.0%) | 116 (100.0%) |
Housing Occupancy in Redby
Occupancy by Ownership in Redby
Of the total 287 dwellings in Redby, owner-occupied units account for 202 (70.4%), while renter-occupied units make up 85 (29.6%).
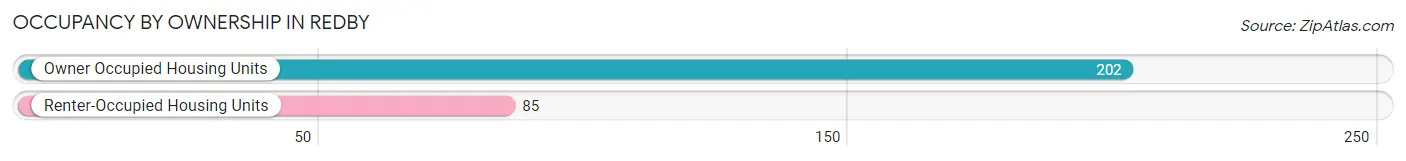
| Occupancy | # Housing Units | % Housing Units |
| Owner Occupied Housing Units | 202 | 70.4% |
| Renter-Occupied Housing Units | 85 | 29.6% |
| Total Occupied Housing Units | 287 | 100.0% |
Occupancy by Household Size in Redby
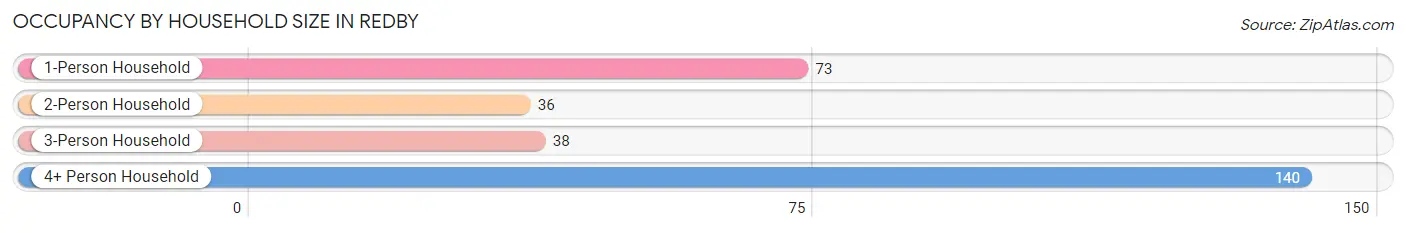
| Household Size | # Housing Units | % Housing Units |
| 1-Person Household | 73 | 25.4% |
| 2-Person Household | 36 | 12.5% |
| 3-Person Household | 38 | 13.2% |
| 4+ Person Household | 140 | 48.8% |
| Total Housing Units | 287 | 100.0% |
Occupancy by Ownership by Household Size in Redby
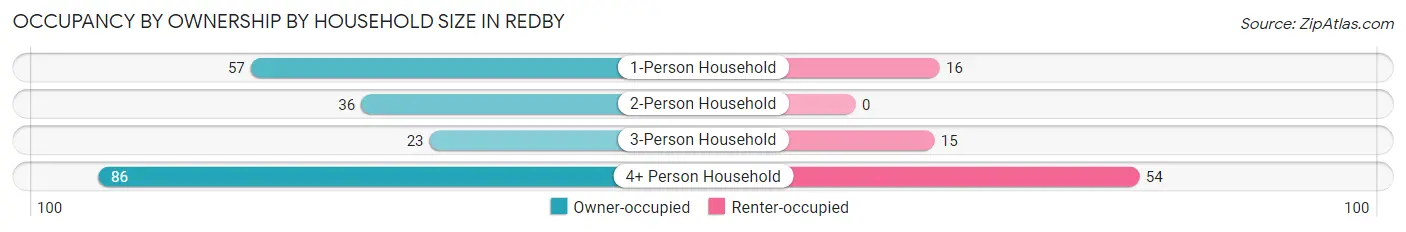
| Household Size | Owner-occupied | Renter-occupied |
| 1-Person Household | 57 (78.1%) | 16 (21.9%) |
| 2-Person Household | 36 (100.0%) | 0 (0.0%) |
| 3-Person Household | 23 (60.5%) | 15 (39.5%) |
| 4+ Person Household | 86 (61.4%) | 54 (38.6%) |
| Total Housing Units | 202 (70.4%) | 85 (29.6%) |
Occupancy by Educational Attainment in Redby
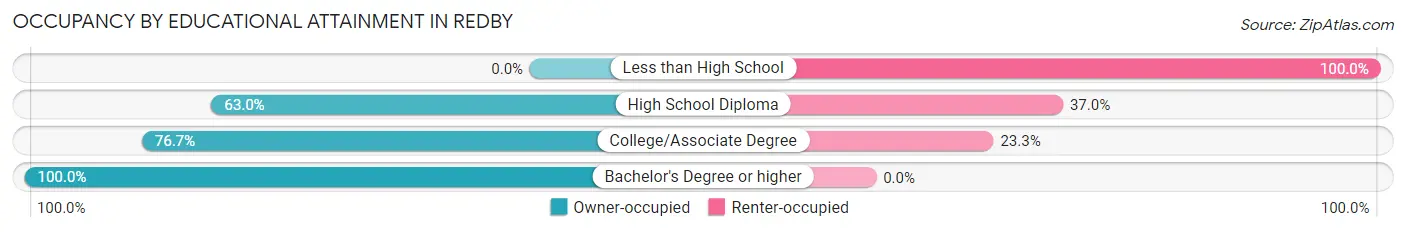
| Household Size | Owner-occupied | Renter-occupied |
| Less than High School | 0 (0.0%) | 15 (100.0%) |
| High School Diploma | 51 (63.0%) | 30 (37.0%) |
| College/Associate Degree | 132 (76.7%) | 40 (23.3%) |
| Bachelor's Degree or higher | 19 (100.0%) | 0 (0.0%) |
Occupancy by Age of Householder in Redby
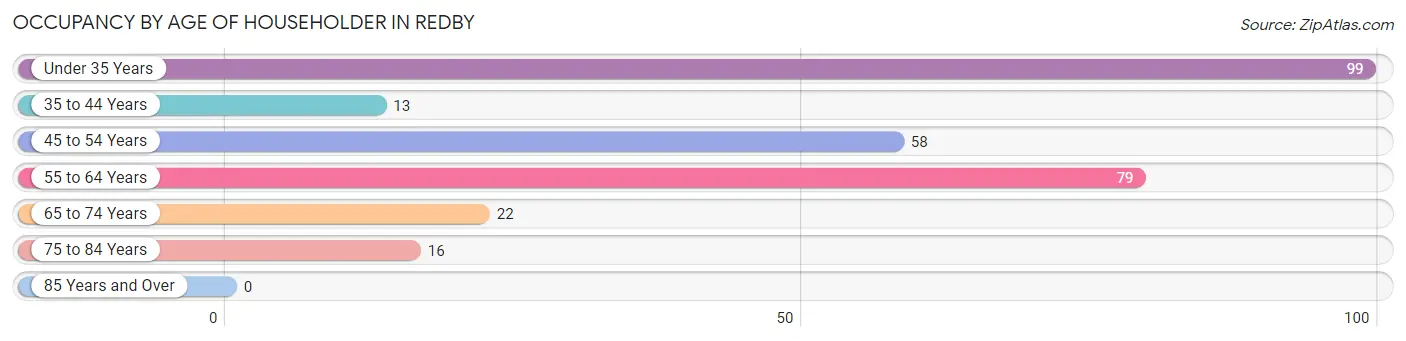
| Age Bracket | # Households | % Households |
| Under 35 Years | 99 | 34.5% |
| 35 to 44 Years | 13 | 4.5% |
| 45 to 54 Years | 58 | 20.2% |
| 55 to 64 Years | 79 | 27.5% |
| 65 to 74 Years | 22 | 7.7% |
| 75 to 84 Years | 16 | 5.6% |
| 85 Years and Over | 0 | 0.0% |
| Total | 287 | 100.0% |
Housing Finances in Redby
Median Income by Occupancy in Redby
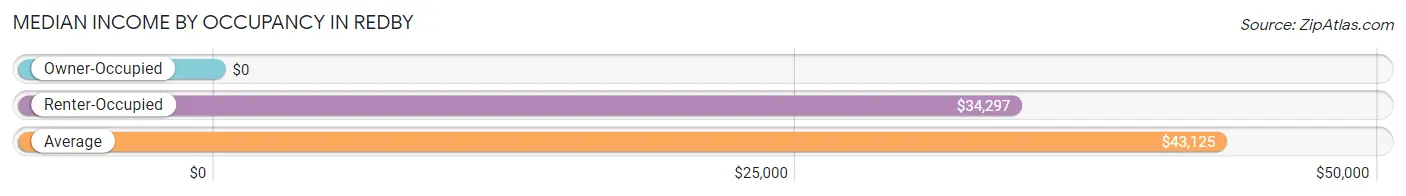
| Occupancy Type | # Households | Median Income |
| Owner-Occupied | 202 (70.4%) | $0 |
| Renter-Occupied | 85 (29.6%) | $34,297 |
| Average | 287 (100.0%) | $43,125 |
Occupancy by Householder Income Bracket in Redby
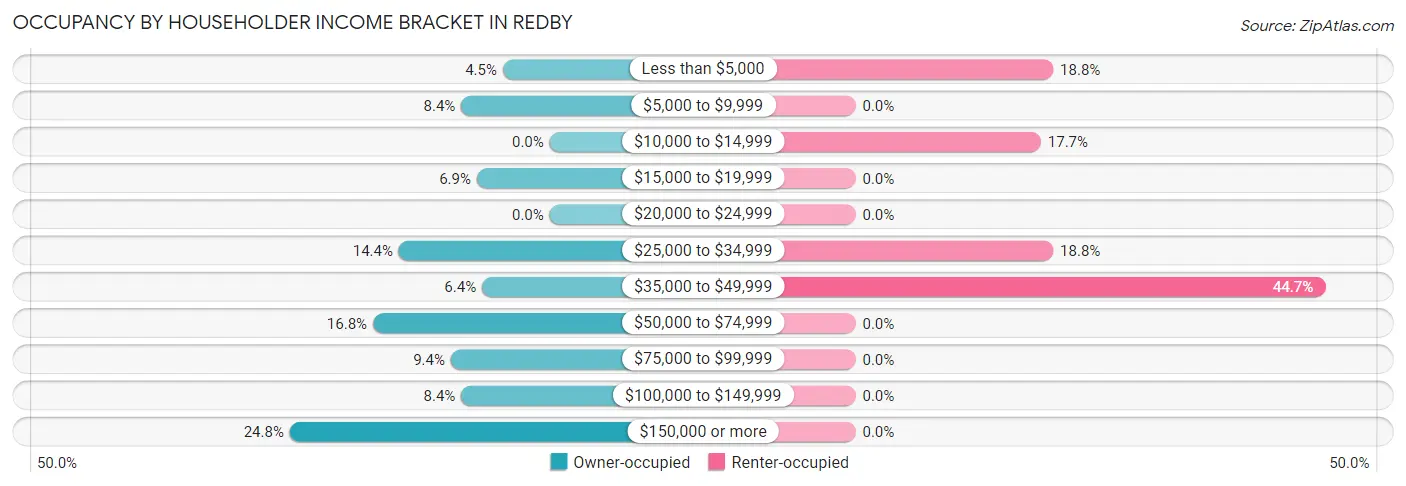
| Income Bracket | Owner-occupied | Renter-occupied |
| Less than $5,000 | 9 (4.5%) | 16 (18.8%) |
| $5,000 to $9,999 | 17 (8.4%) | 0 (0.0%) |
| $10,000 to $14,999 | 0 (0.0%) | 15 (17.6%) |
| $15,000 to $19,999 | 14 (6.9%) | 0 (0.0%) |
| $20,000 to $24,999 | 0 (0.0%) | 0 (0.0%) |
| $25,000 to $34,999 | 29 (14.4%) | 16 (18.8%) |
| $35,000 to $49,999 | 13 (6.4%) | 38 (44.7%) |
| $50,000 to $74,999 | 34 (16.8%) | 0 (0.0%) |
| $75,000 to $99,999 | 19 (9.4%) | 0 (0.0%) |
| $100,000 to $149,999 | 17 (8.4%) | 0 (0.0%) |
| $150,000 or more | 50 (24.7%) | 0 (0.0%) |
| Total | 202 (100.0%) | 85 (100.0%) |
Monthly Housing Cost Tiers in Redby
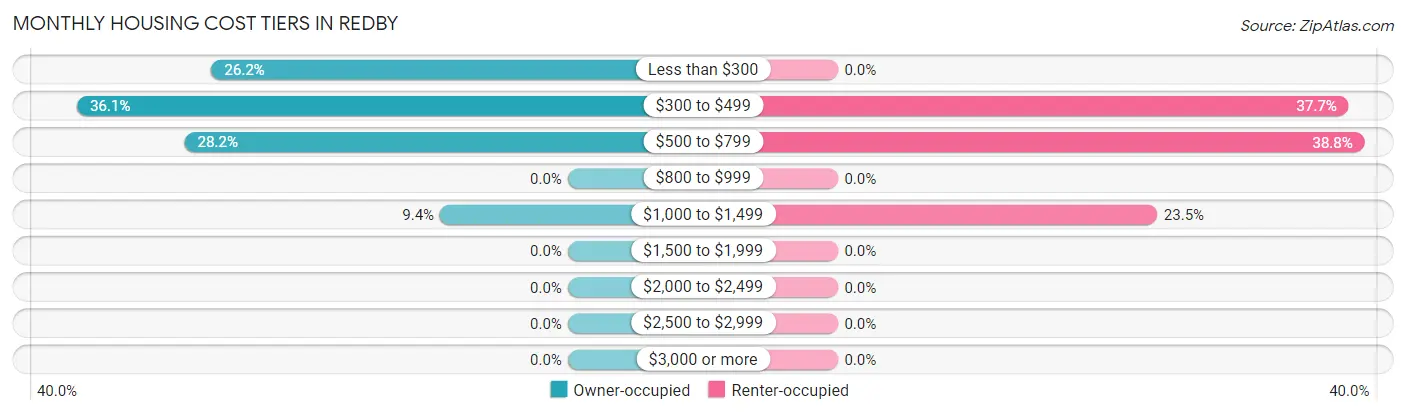
| Monthly Cost | Owner-occupied | Renter-occupied |
| Less than $300 | 53 (26.2%) | 0 (0.0%) |
| $300 to $499 | 73 (36.1%) | 32 (37.7%) |
| $500 to $799 | 57 (28.2%) | 33 (38.8%) |
| $800 to $999 | 0 (0.0%) | 0 (0.0%) |
| $1,000 to $1,499 | 19 (9.4%) | 20 (23.5%) |
| $1,500 to $1,999 | 0 (0.0%) | 0 (0.0%) |
| $2,000 to $2,499 | 0 (0.0%) | 0 (0.0%) |
| $2,500 to $2,999 | 0 (0.0%) | 0 (0.0%) |
| $3,000 or more | 0 (0.0%) | 0 (0.0%) |
| Total | 202 (100.0%) | 85 (100.0%) |
Physical Housing Characteristics in Redby
Housing Structures in Redby
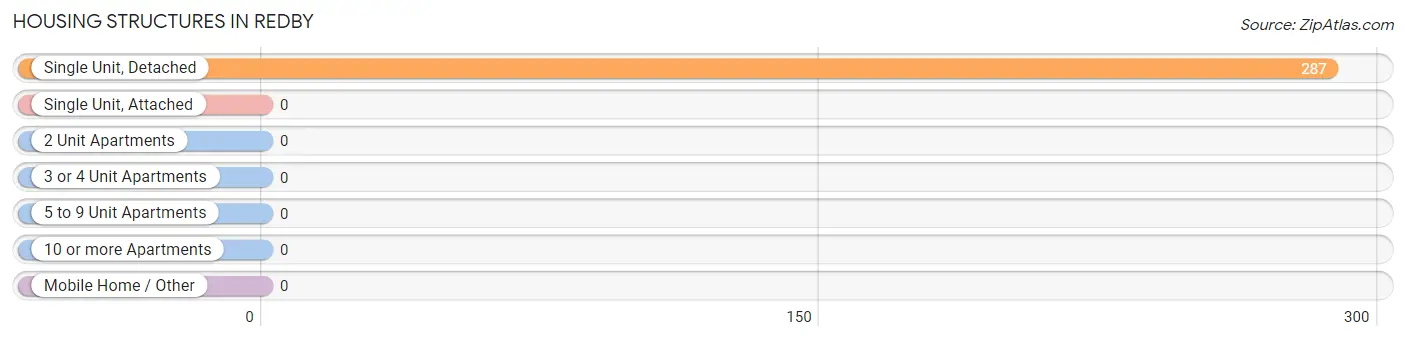
| Structure Type | # Housing Units | % Housing Units |
| Single Unit, Detached | 287 | 100.0% |
| Single Unit, Attached | 0 | 0.0% |
| 2 Unit Apartments | 0 | 0.0% |
| 3 or 4 Unit Apartments | 0 | 0.0% |
| 5 to 9 Unit Apartments | 0 | 0.0% |
| 10 or more Apartments | 0 | 0.0% |
| Mobile Home / Other | 0 | 0.0% |
| Total | 287 | 100.0% |
Housing Structures by Occupancy in Redby
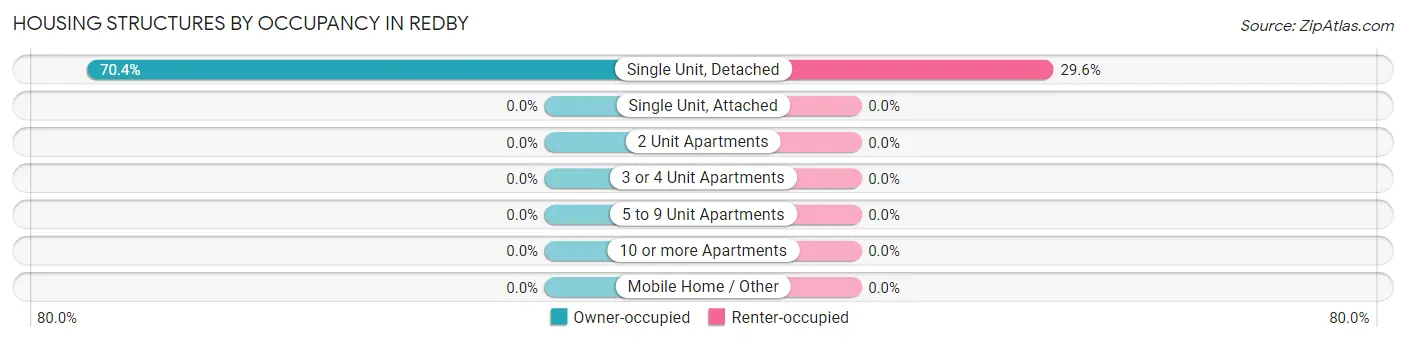
| Structure Type | Owner-occupied | Renter-occupied |
| Single Unit, Detached | 202 (70.4%) | 85 (29.6%) |
| Single Unit, Attached | 0 (0.0%) | 0 (0.0%) |
| 2 Unit Apartments | 0 (0.0%) | 0 (0.0%) |
| 3 or 4 Unit Apartments | 0 (0.0%) | 0 (0.0%) |
| 5 to 9 Unit Apartments | 0 (0.0%) | 0 (0.0%) |
| 10 or more Apartments | 0 (0.0%) | 0 (0.0%) |
| Mobile Home / Other | 0 (0.0%) | 0 (0.0%) |
| Total | 202 (70.4%) | 85 (29.6%) |
Housing Structures by Number of Rooms in Redby
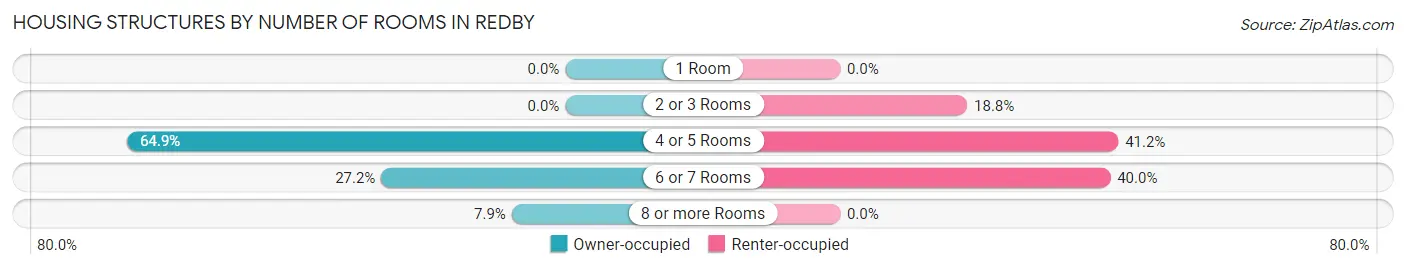
| Number of Rooms | Owner-occupied | Renter-occupied |
| 1 Room | 0 (0.0%) | 0 (0.0%) |
| 2 or 3 Rooms | 0 (0.0%) | 16 (18.8%) |
| 4 or 5 Rooms | 131 (64.8%) | 35 (41.2%) |
| 6 or 7 Rooms | 55 (27.2%) | 34 (40.0%) |
| 8 or more Rooms | 16 (7.9%) | 0 (0.0%) |
| Total | 202 (100.0%) | 85 (100.0%) |
Housing Structure by Heating Type in Redby
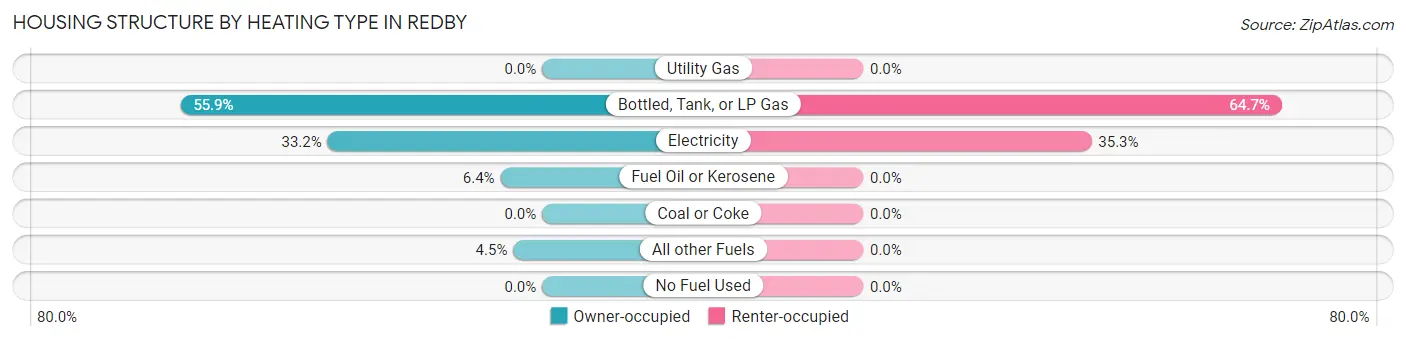
| Heating Type | Owner-occupied | Renter-occupied |
| Utility Gas | 0 (0.0%) | 0 (0.0%) |
| Bottled, Tank, or LP Gas | 113 (55.9%) | 55 (64.7%) |
| Electricity | 67 (33.2%) | 30 (35.3%) |
| Fuel Oil or Kerosene | 13 (6.4%) | 0 (0.0%) |
| Coal or Coke | 0 (0.0%) | 0 (0.0%) |
| All other Fuels | 9 (4.5%) | 0 (0.0%) |
| No Fuel Used | 0 (0.0%) | 0 (0.0%) |
| Total | 202 (100.0%) | 85 (100.0%) |
Household Vehicle Usage in Redby
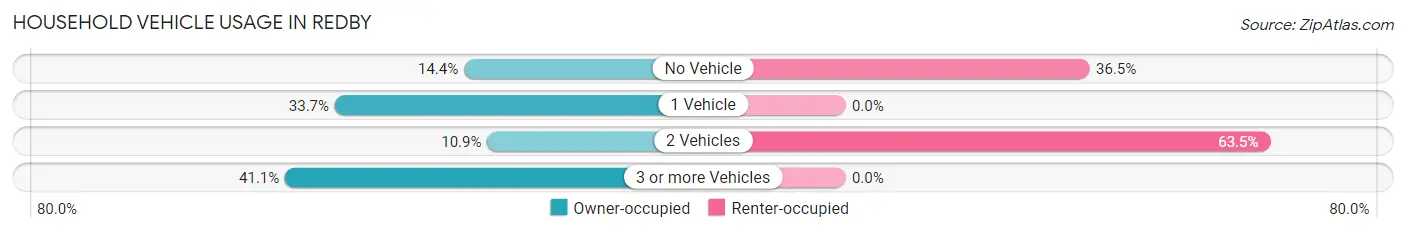
| Vehicles per Household | Owner-occupied | Renter-occupied |
| No Vehicle | 29 (14.4%) | 31 (36.5%) |
| 1 Vehicle | 68 (33.7%) | 0 (0.0%) |
| 2 Vehicles | 22 (10.9%) | 54 (63.5%) |
| 3 or more Vehicles | 83 (41.1%) | 0 (0.0%) |
| Total | 202 (100.0%) | 85 (100.0%) |
Real Estate & Mortgages in Redby
Real Estate and Mortgage Overview in Redby
| Characteristic | Without Mortgage | With Mortgage |
| Housing Units | 183 | 19 |
| Median Property Value | $88,800 | $0 |
| Median Household Income | - | - |
| Monthly Housing Costs | $431 | $0 |
| Real Estate Taxes | - | - |
Property Value by Mortgage Status in Redby
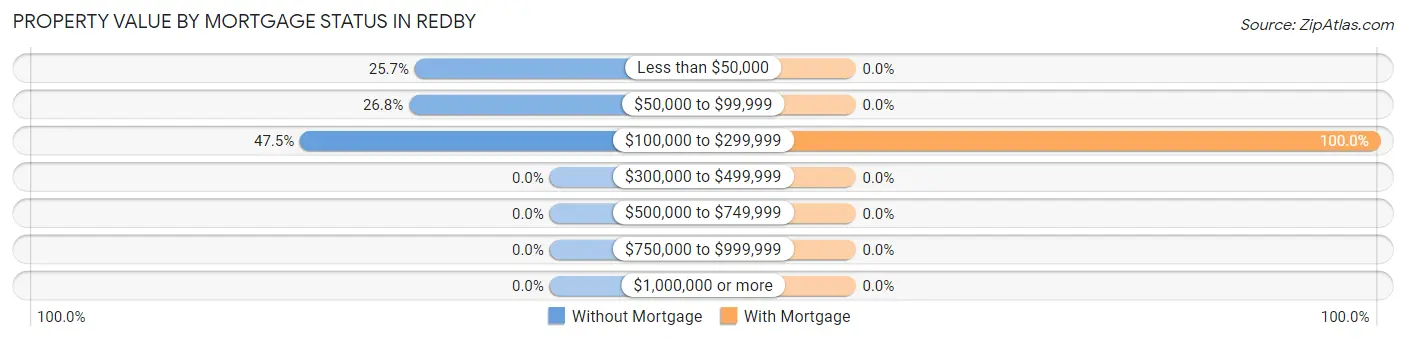
| Property Value | Without Mortgage | With Mortgage |
| Less than $50,000 | 47 (25.7%) | 0 (0.0%) |
| $50,000 to $99,999 | 49 (26.8%) | 0 (0.0%) |
| $100,000 to $299,999 | 87 (47.5%) | 19 (100.0%) |
| $300,000 to $499,999 | 0 (0.0%) | 0 (0.0%) |
| $500,000 to $749,999 | 0 (0.0%) | 0 (0.0%) |
| $750,000 to $999,999 | 0 (0.0%) | 0 (0.0%) |
| $1,000,000 or more | 0 (0.0%) | 0 (0.0%) |
| Total | 183 (100.0%) | 19 (100.0%) |
Household Income by Mortgage Status in Redby
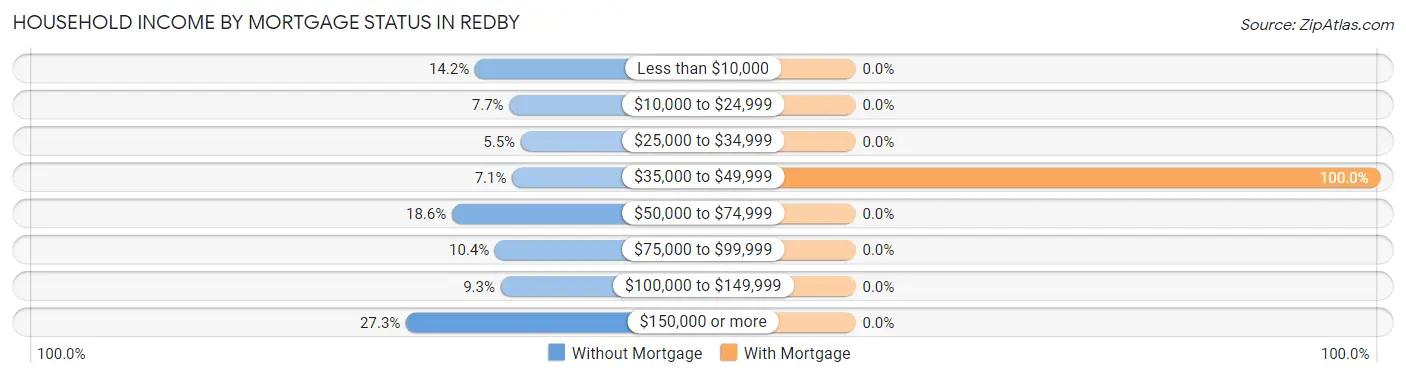
| Household Income | Without Mortgage | With Mortgage |
| Less than $10,000 | 26 (14.2%) | 0 (0.0%) |
| $10,000 to $24,999 | 14 (7.6%) | 0 (0.0%) |
| $25,000 to $34,999 | 10 (5.5%) | 0 (0.0%) |
| $35,000 to $49,999 | 13 (7.1%) | 19 (100.0%) |
| $50,000 to $74,999 | 34 (18.6%) | 0 (0.0%) |
| $75,000 to $99,999 | 19 (10.4%) | 0 (0.0%) |
| $100,000 to $149,999 | 17 (9.3%) | 0 (0.0%) |
| $150,000 or more | 50 (27.3%) | 0 (0.0%) |
| Total | 183 (100.0%) | 19 (100.0%) |
Property Value to Household Income Ratio in Redby
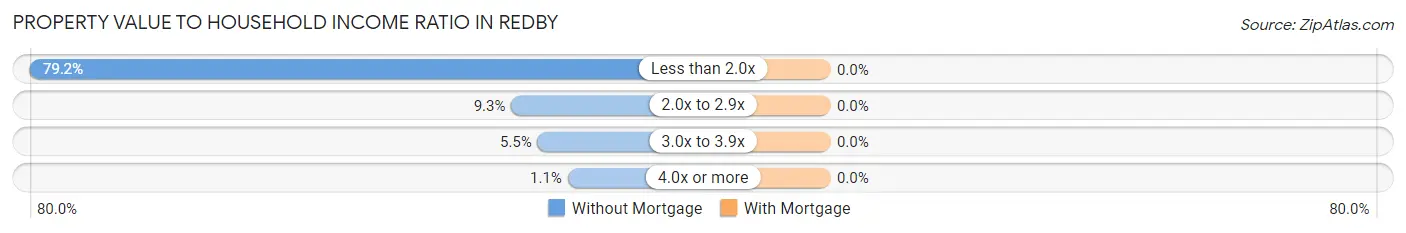
| Value-to-Income Ratio | Without Mortgage | With Mortgage |
| Less than 2.0x | 145 (79.2%) | 0 (0.0%) |
| 2.0x to 2.9x | 17 (9.3%) | 0 (0.0%) |
| 3.0x to 3.9x | 10 (5.5%) | 0 (0.0%) |
| 4.0x or more | 2 (1.1%) | 0 (0.0%) |
| Total | 183 (100.0%) | 19 (100.0%) |
Real Estate Taxes by Mortgage Status in Redby
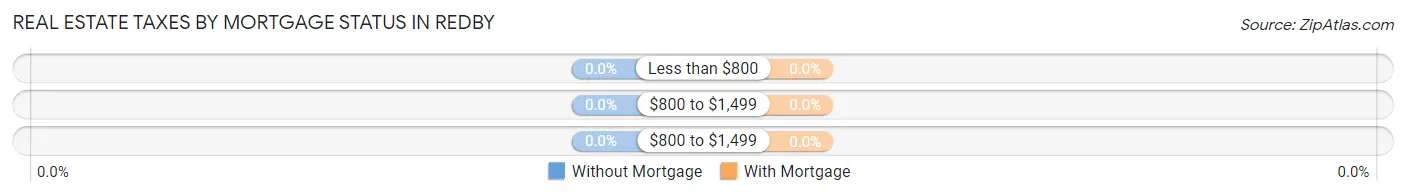
| Property Taxes | Without Mortgage | With Mortgage |
| Less than $800 | 0 (0.0%) | 0 (0.0%) |
| $800 to $1,499 | 0 (0.0%) | 0 (0.0%) |
| $800 to $1,499 | 0 (0.0%) | 0 (0.0%) |
| Total | 183 (100.0%) | 19 (100.0%) |
Health & Disability in Redby
Health Insurance Coverage by Age in Redby
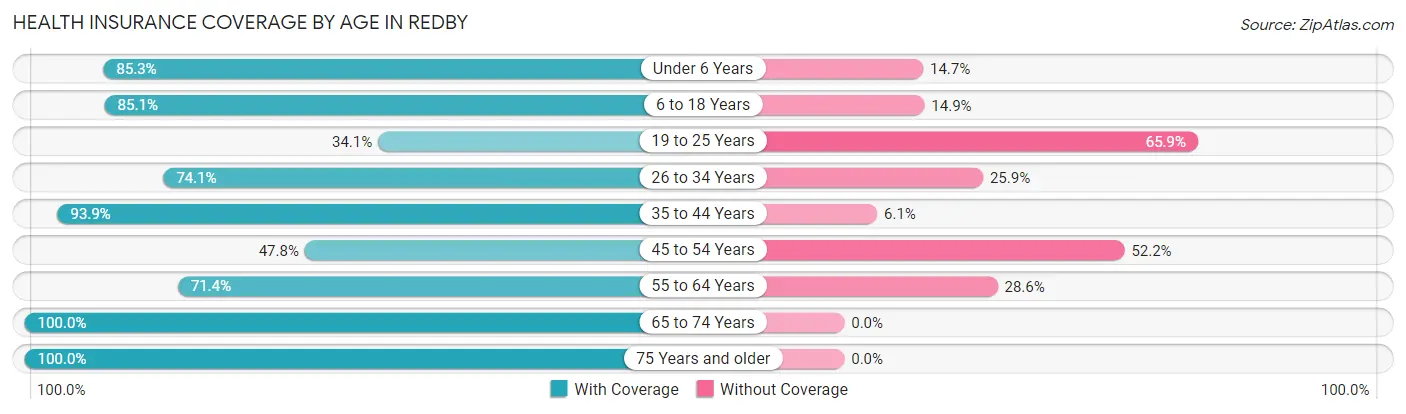
| Age Bracket | With Coverage | Without Coverage |
| Under 6 Years | 122 (85.3%) | 21 (14.7%) |
| 6 to 18 Years | 336 (85.1%) | 59 (14.9%) |
| 19 to 25 Years | 15 (34.1%) | 29 (65.9%) |
| 26 to 34 Years | 215 (74.1%) | 75 (25.9%) |
| 35 to 44 Years | 46 (93.9%) | 3 (6.1%) |
| 45 to 54 Years | 32 (47.8%) | 35 (52.2%) |
| 55 to 64 Years | 110 (71.4%) | 44 (28.6%) |
| 65 to 74 Years | 49 (100.0%) | 0 (0.0%) |
| 75 Years and older | 31 (100.0%) | 0 (0.0%) |
| Total | 956 (78.2%) | 266 (21.8%) |
Health Insurance Coverage by Citizenship Status in Redby
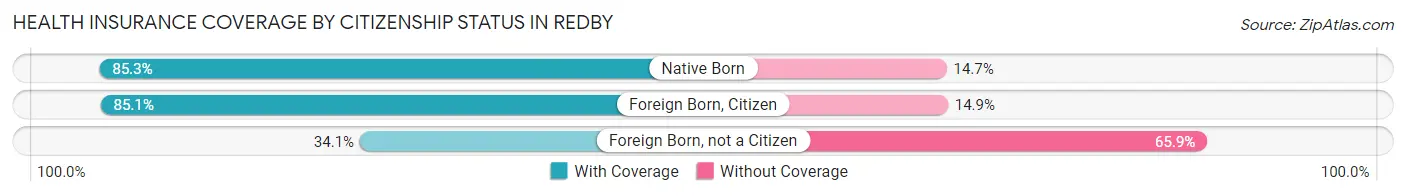
| Citizenship Status | With Coverage | Without Coverage |
| Native Born | 122 (85.3%) | 21 (14.7%) |
| Foreign Born, Citizen | 336 (85.1%) | 59 (14.9%) |
| Foreign Born, not a Citizen | 15 (34.1%) | 29 (65.9%) |
Health Insurance Coverage by Household Income in Redby
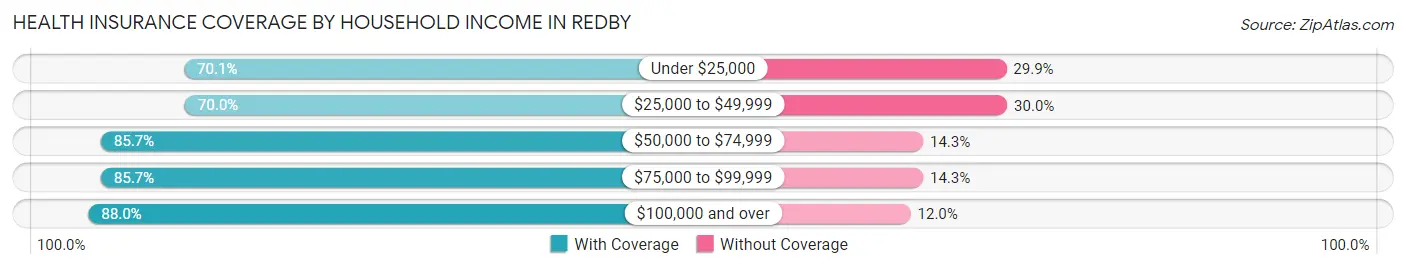
| Household Income | With Coverage | Without Coverage |
| Under $25,000 | 136 (70.1%) | 58 (29.9%) |
| $25,000 to $49,999 | 312 (70.0%) | 134 (30.0%) |
| $50,000 to $74,999 | 48 (85.7%) | 8 (14.3%) |
| $75,000 to $99,999 | 78 (85.7%) | 13 (14.3%) |
| $100,000 and over | 368 (88.0%) | 50 (12.0%) |
Public vs Private Health Insurance Coverage by Age in Redby
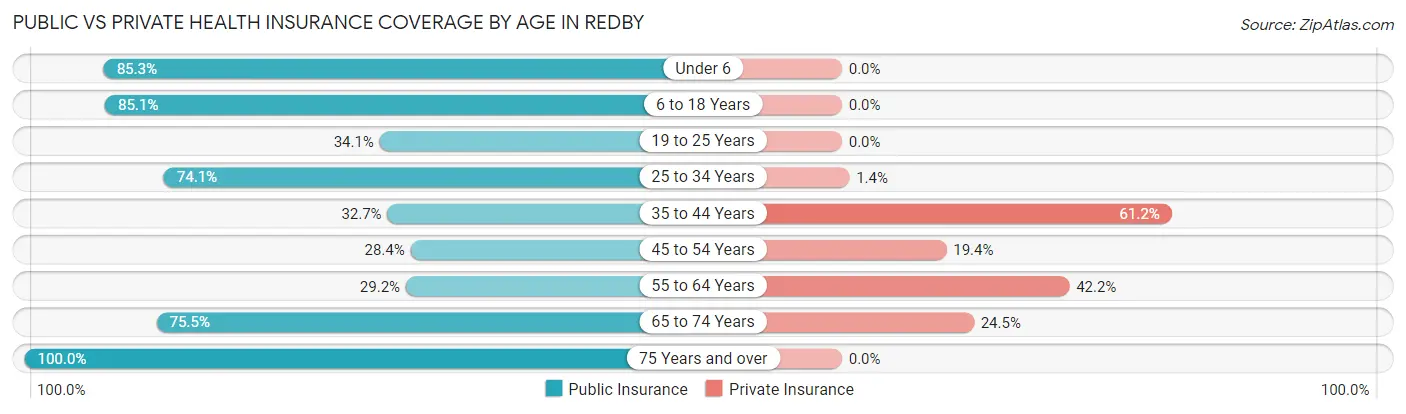
| Age Bracket | Public Insurance | Private Insurance |
| Under 6 | 122 (85.3%) | 0 (0.0%) |
| 6 to 18 Years | 336 (85.1%) | 0 (0.0%) |
| 19 to 25 Years | 15 (34.1%) | 0 (0.0%) |
| 25 to 34 Years | 215 (74.1%) | 4 (1.4%) |
| 35 to 44 Years | 16 (32.7%) | 30 (61.2%) |
| 45 to 54 Years | 19 (28.4%) | 13 (19.4%) |
| 55 to 64 Years | 45 (29.2%) | 65 (42.2%) |
| 65 to 74 Years | 37 (75.5%) | 12 (24.5%) |
| 75 Years and over | 31 (100.0%) | 0 (0.0%) |
| Total | 836 (68.4%) | 124 (10.2%) |
Disability Status by Sex by Age in Redby
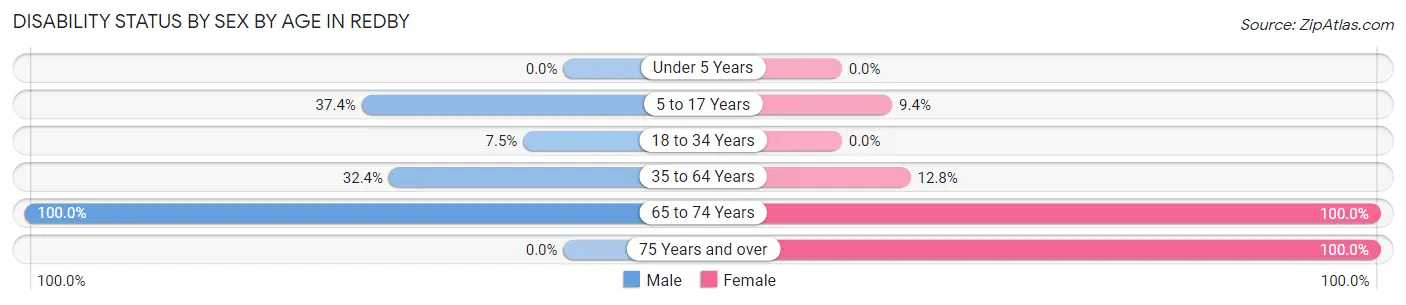
| Age Bracket | Male | Female |
| Under 5 Years | 0 (0.0%) | 0 (0.0%) |
| 5 to 17 Years | 82 (37.4%) | 20 (9.3%) |
| 18 to 34 Years | 10 (7.5%) | 0 (0.0%) |
| 35 to 64 Years | 57 (32.4%) | 12 (12.8%) |
| 65 to 74 Years | 27 (100.0%) | 22 (100.0%) |
| 75 Years and over | 0 (0.0%) | 31 (100.0%) |
Disability Class by Sex by Age in Redby
Disability Class: Hearing Difficulty
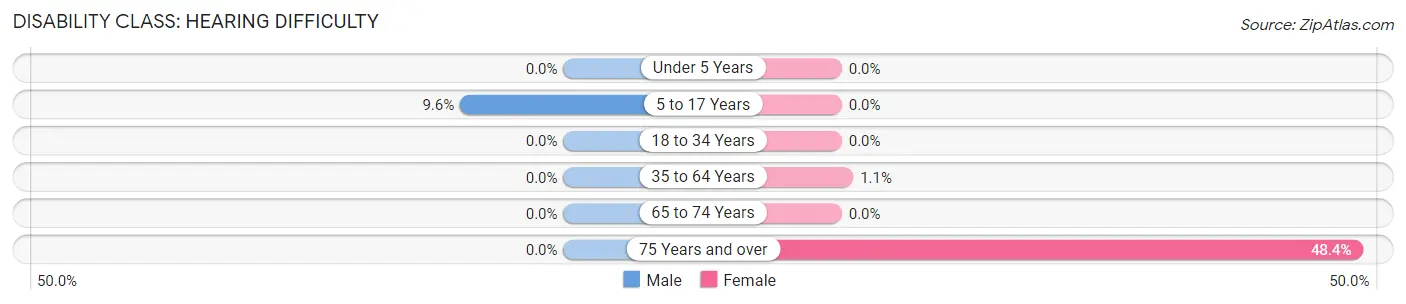
| Age Bracket | Male | Female |
| Under 5 Years | 0 (0.0%) | 0 (0.0%) |
| 5 to 17 Years | 21 (9.6%) | 0 (0.0%) |
| 18 to 34 Years | 0 (0.0%) | 0 (0.0%) |
| 35 to 64 Years | 0 (0.0%) | 1 (1.1%) |
| 65 to 74 Years | 0 (0.0%) | 0 (0.0%) |
| 75 Years and over | 0 (0.0%) | 15 (48.4%) |
Disability Class: Vision Difficulty
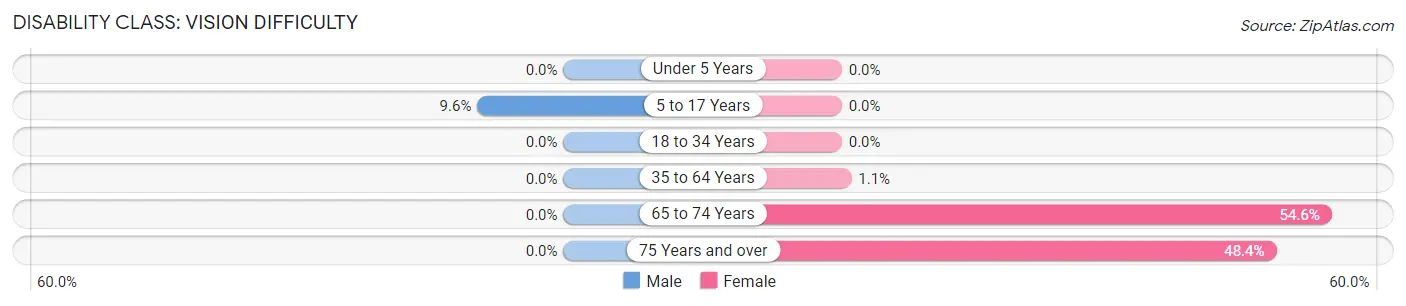
| Age Bracket | Male | Female |
| Under 5 Years | 0 (0.0%) | 0 (0.0%) |
| 5 to 17 Years | 21 (9.6%) | 0 (0.0%) |
| 18 to 34 Years | 0 (0.0%) | 0 (0.0%) |
| 35 to 64 Years | 0 (0.0%) | 1 (1.1%) |
| 65 to 74 Years | 0 (0.0%) | 12 (54.5%) |
| 75 Years and over | 0 (0.0%) | 15 (48.4%) |
Disability Class: Cognitive Difficulty
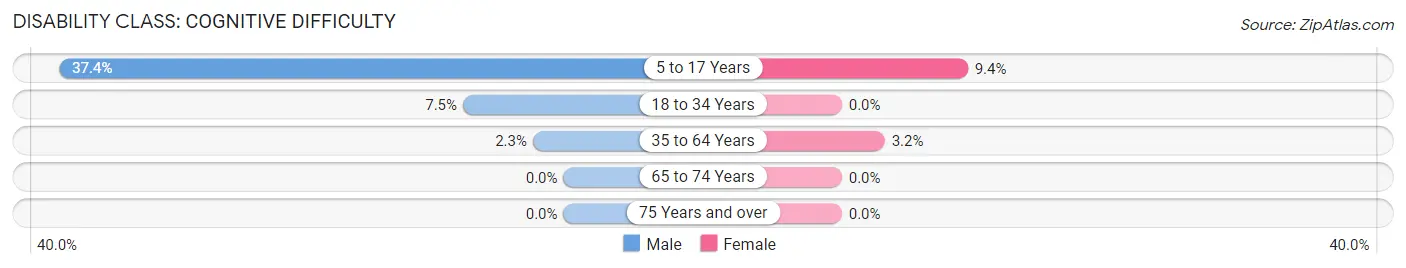
| Age Bracket | Male | Female |
| 5 to 17 Years | 82 (37.4%) | 20 (9.3%) |
| 18 to 34 Years | 10 (7.5%) | 0 (0.0%) |
| 35 to 64 Years | 4 (2.3%) | 3 (3.2%) |
| 65 to 74 Years | 0 (0.0%) | 0 (0.0%) |
| 75 Years and over | 0 (0.0%) | 0 (0.0%) |
Disability Class: Ambulatory Difficulty
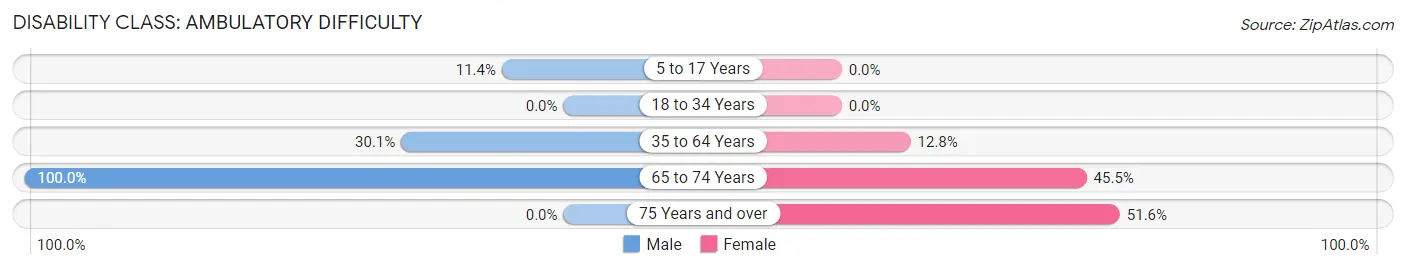
| Age Bracket | Male | Female |
| 5 to 17 Years | 25 (11.4%) | 0 (0.0%) |
| 18 to 34 Years | 0 (0.0%) | 0 (0.0%) |
| 35 to 64 Years | 53 (30.1%) | 12 (12.8%) |
| 65 to 74 Years | 27 (100.0%) | 10 (45.5%) |
| 75 Years and over | 0 (0.0%) | 16 (51.6%) |
Disability Class: Self-Care Difficulty
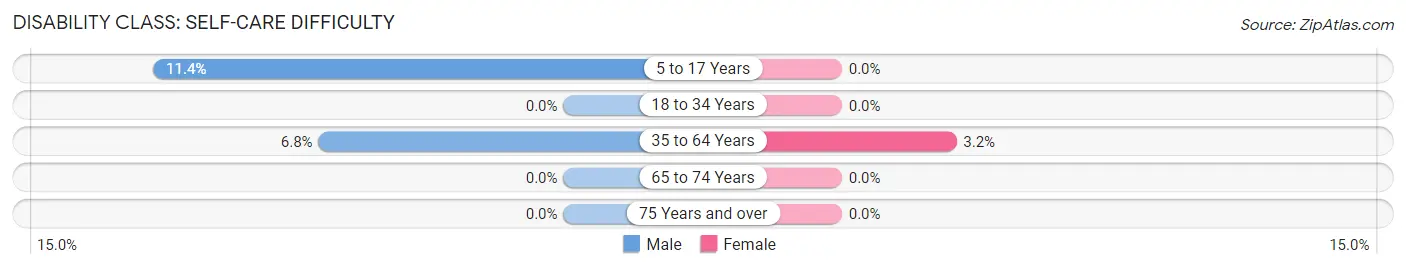
| Age Bracket | Male | Female |
| 5 to 17 Years | 25 (11.4%) | 0 (0.0%) |
| 18 to 34 Years | 0 (0.0%) | 0 (0.0%) |
| 35 to 64 Years | 12 (6.8%) | 3 (3.2%) |
| 65 to 74 Years | 0 (0.0%) | 0 (0.0%) |
| 75 Years and over | 0 (0.0%) | 0 (0.0%) |
Technology Access in Redby
Computing Device Access in Redby
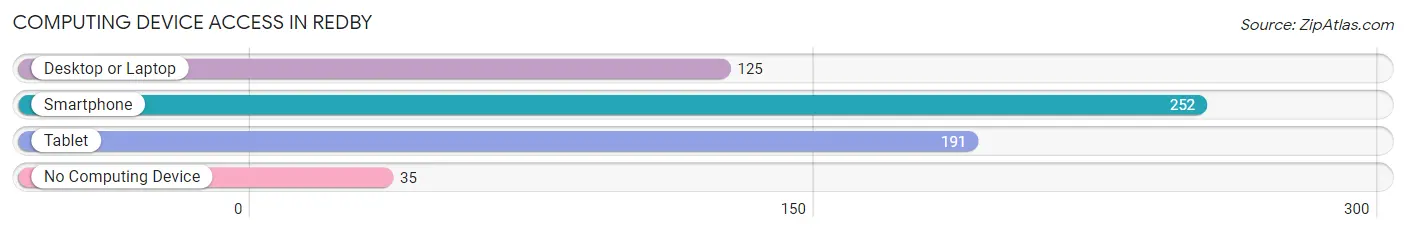
| Device Type | # Households | % Households |
| Desktop or Laptop | 125 | 43.5% |
| Smartphone | 252 | 87.8% |
| Tablet | 191 | 66.5% |
| No Computing Device | 35 | 12.2% |
| Total | 287 | 100.0% |
Internet Access in Redby
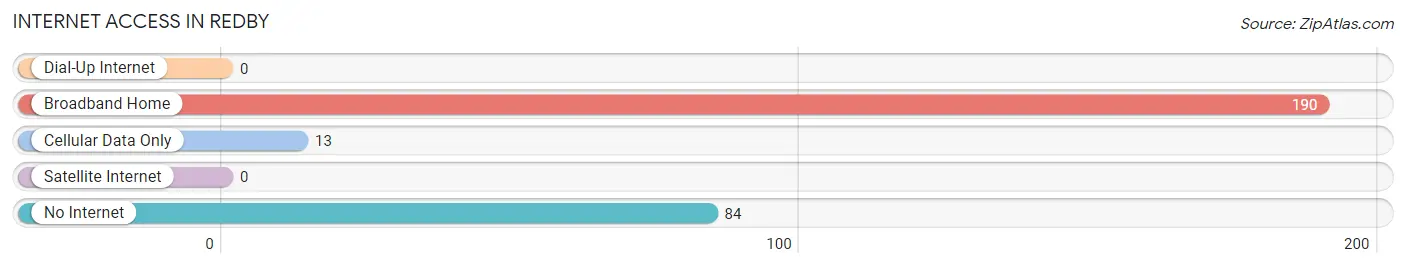
| Internet Type | # Households | % Households |
| Dial-Up Internet | 0 | 0.0% |
| Broadband Home | 190 | 66.2% |
| Cellular Data Only | 13 | 4.5% |
| Satellite Internet | 0 | 0.0% |
| No Internet | 84 | 29.3% |
| Total | 287 | 100.0% |
Redby Summary
Redby, Minnesota is a small unincorporated community located in Beltrami County, Minnesota. It is situated on the Red Lake Indian Reservation, which is home to the Red Lake Band of Chippewa Indians. The population of Redby was estimated to be around 1,000 in 2020.
History
The Red Lake Indian Reservation was established in 1863 by the United States government. The reservation was originally established for the Ojibwe people, who had been living in the area for centuries. The Red Lake Band of Chippewa Indians is the largest band of Ojibwe in the United States.
The community of Redby was established in the late 19th century. It was named after the nearby Red Lake, which was named by French fur traders in the area. The community was originally a trading post for the Ojibwe people, and it was also a popular destination for tourists.
Geography
Redby is located in northern Minnesota, in Beltrami County. It is situated on the Red Lake Indian Reservation, which covers an area of 1,854 square miles. The community is located on the western shore of Red Lake, which is the largest natural lake in Minnesota. The lake is approximately 20 miles long and 10 miles wide.
The terrain around Redby is mostly flat, with some rolling hills. The area is heavily forested, with a mix of deciduous and coniferous trees. The climate is humid continental, with cold winters and warm summers.
Economy
The economy of Redby is largely based on tourism and the timber industry. The Red Lake Indian Reservation is home to several tourist attractions, including the Red Lake National Wildlife Refuge, the Red Lake Casino, and the Red Lake Powwow. The timber industry is also important to the local economy, as the area is heavily forested.
The Red Lake Band of Chippewa Indians also operates several businesses in the area, including a gas station, a grocery store, and a casino. The tribe also operates a number of other businesses, including a hotel, a restaurant, and a convenience store.
Demographics
The population of Redby was estimated to be around 1,000 in 2020. The majority of the population is Native American, with the Red Lake Band of Chippewa Indians making up the majority of the population. The median age of the population is 33.5 years, and the median household income is $30,000.
Redby is a small, close-knit community. The people of Redby are proud of their heritage and culture, and they are committed to preserving their traditions and way of life. The community is also committed to preserving the environment, and they are actively involved in conservation efforts.
Common Questions
What is Per Capita Income in Redby?
Per Capita income in Redby is $13,280.
What is the Median Family Income in Redby?
Median Family Income in Redby is $45,962.
What is the Median Household income in Redby?
Median Household Income in Redby is $43,125.
What is Income or Wage Gap in Redby?
Income or Wage Gap in Redby is 18.4%.
Women in Redby earn 81.6 cents for every dollar earned by a man.
What is Inequality or Gini Index in Redby?
Inequality or Gini Index in Redby is 0.50.
What is the Total Population of Redby?
Total Population of Redby is 1,228.
What is the Total Male Population of Redby?
Total Male Population of Redby is 626.
What is the Total Female Population of Redby?
Total Female Population of Redby is 602.
What is the Ratio of Males per 100 Females in Redby?
There are 103.99 Males per 100 Females in Redby.
What is the Ratio of Females per 100 Males in Redby?
There are 96.17 Females per 100 Males in Redby.
What is the Median Population Age in Redby?
Median Population Age in Redby is 27.7 Years.
What is the Average Family Size in Redby
Average Family Size in Redby is 4.9 People.
What is the Average Household Size in Redby
Average Household Size in Redby is 4.2 People.
How Large is the Labor Force in Redby?
There are 414 People in the Labor Forcein in Redby.
What is the Percentage of People in the Labor Force in Redby?
56.3% of People are in the Labor Force in Redby.
What is the Unemployment Rate in Redby?
Unemployment Rate in Redby is 15.9%.