Badger, MN Map & Demographics
Badger Map
Badger Overview
$25,747
PER CAPITA INCOME
$63,750
AVG FAMILY INCOME
$46,500
AVG HOUSEHOLD INCOME
25.8%
WAGE / INCOME GAP [ % ]
74.2¢/ $1
WAGE / INCOME GAP [ $ ]
0.46
INEQUALITY / GINI INDEX
434
TOTAL POPULATION
268
MALE POPULATION
166
FEMALE POPULATION
161.45
MALES / 100 FEMALES
61.94
FEMALES / 100 MALES
38.8
MEDIAN AGE
3.7
AVG FAMILY SIZE
2.7
AVG HOUSEHOLD SIZE
239
LABOR FORCE [ PEOPLE ]
73.1%
PERCENT IN LABOR FORCE
7.9%
UNEMPLOYMENT RATE
Badger Zip Codes
Badger Area Codes
Income in Badger
Income Overview in Badger
Per Capita Income in Badger is $25,747, while median incomes of families and households are $63,750 and $46,500 respectively.
| Characteristic | Number | Measure |
| Per Capita Income | 434 | $25,747 |
| Median Family Income | 86 | $63,750 |
| Mean Family Income | 86 | $82,431 |
| Median Household Income | 162 | $46,500 |
| Mean Household Income | 162 | $60,459 |
| Income Deficit | 86 | $0 |
| Wage / Income Gap (%) | 434 | 25.75% |
| Wage / Income Gap ($) | 434 | 74.25¢ per $1 |
| Gini / Inequality Index | 434 | 0.46 |
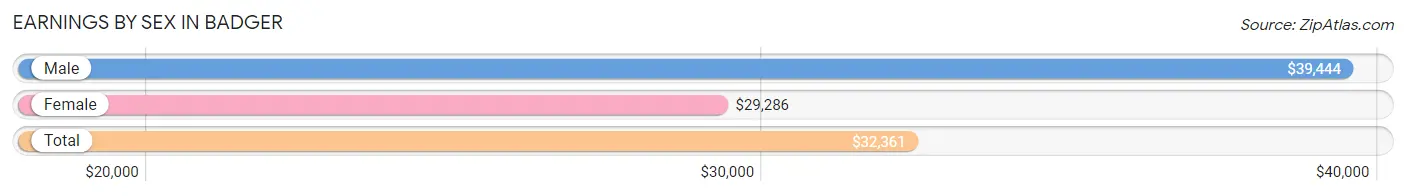
Earnings by Sex in Badger
Average Earnings in Badger are $32,361, $39,444 for men and $29,286 for women, a difference of 25.8%.
| Sex | Number | Average Earnings |
| Male | 152 (61.3%) | $39,444 |
| Female | 96 (38.7%) | $29,286 |
| Total | 248 (100.0%) | $32,361 |
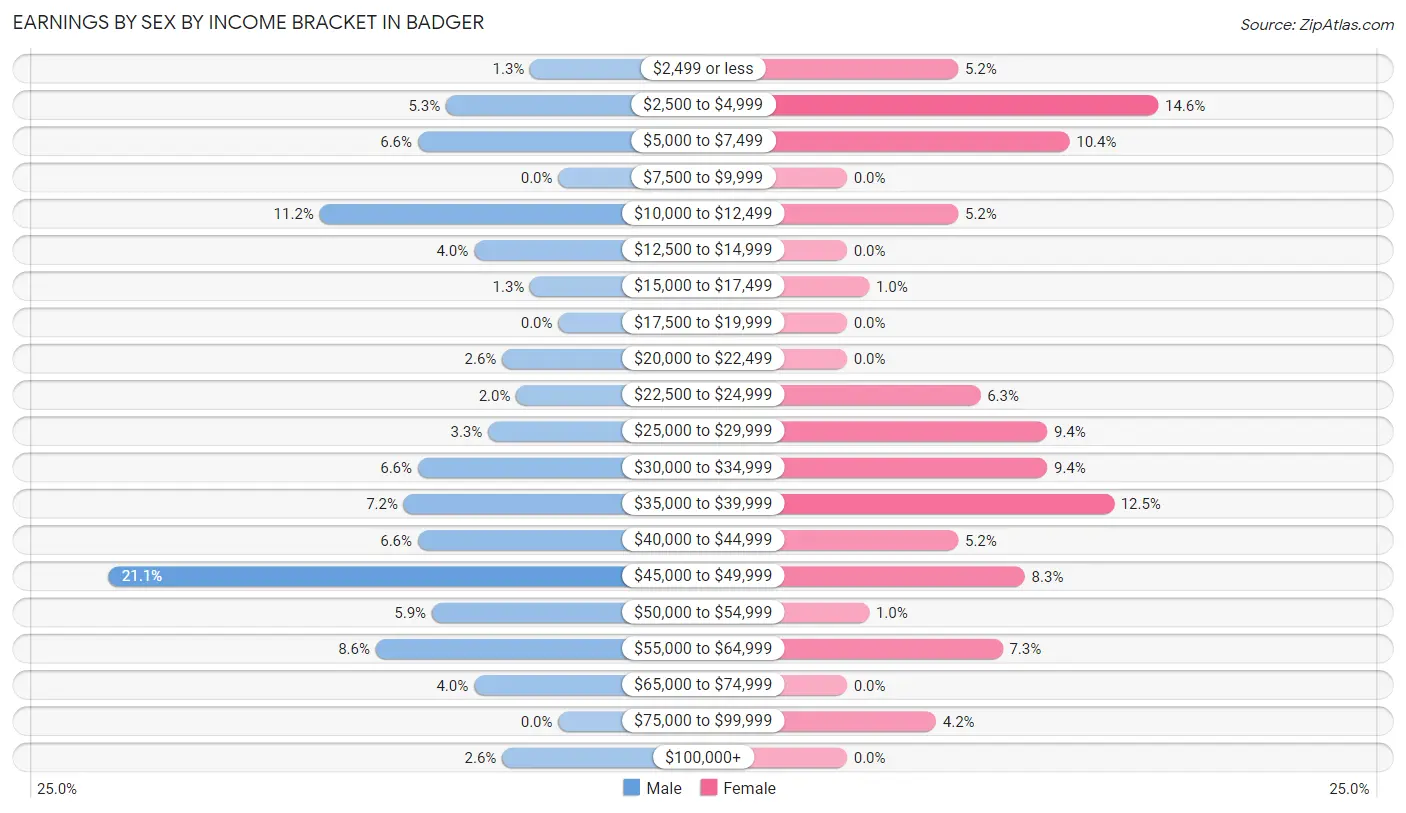
Earnings by Sex by Income Bracket in Badger
The most common earnings brackets in Badger are $45,000 to $49,999 for men (32 | 21.0%) and $2,500 to $4,999 for women (14 | 14.6%).
| Income | Male | Female |
| $2,499 or less | 2 (1.3%) | 5 (5.2%) |
| $2,500 to $4,999 | 8 (5.3%) | 14 (14.6%) |
| $5,000 to $7,499 | 10 (6.6%) | 10 (10.4%) |
| $7,500 to $9,999 | 0 (0.0%) | 0 (0.0%) |
| $10,000 to $12,499 | 17 (11.2%) | 5 (5.2%) |
| $12,500 to $14,999 | 6 (4.0%) | 0 (0.0%) |
| $15,000 to $17,499 | 2 (1.3%) | 1 (1.0%) |
| $17,500 to $19,999 | 0 (0.0%) | 0 (0.0%) |
| $20,000 to $22,499 | 4 (2.6%) | 0 (0.0%) |
| $22,500 to $24,999 | 3 (2.0%) | 6 (6.2%) |
| $25,000 to $29,999 | 5 (3.3%) | 9 (9.4%) |
| $30,000 to $34,999 | 10 (6.6%) | 9 (9.4%) |
| $35,000 to $39,999 | 11 (7.2%) | 12 (12.5%) |
| $40,000 to $44,999 | 10 (6.6%) | 5 (5.2%) |
| $45,000 to $49,999 | 32 (21.0%) | 8 (8.3%) |
| $50,000 to $54,999 | 9 (5.9%) | 1 (1.0%) |
| $55,000 to $64,999 | 13 (8.6%) | 7 (7.3%) |
| $65,000 to $74,999 | 6 (4.0%) | 0 (0.0%) |
| $75,000 to $99,999 | 0 (0.0%) | 4 (4.2%) |
| $100,000+ | 4 (2.6%) | 0 (0.0%) |
| Total | 152 (100.0%) | 96 (100.0%) |
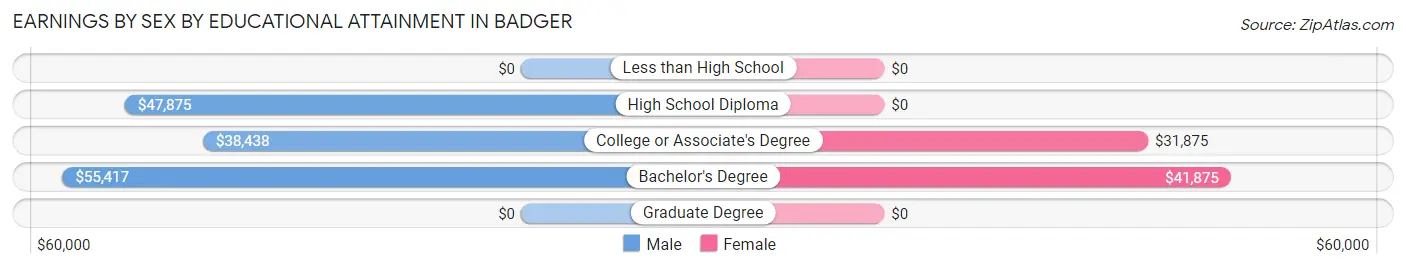
Earnings by Sex by Educational Attainment in Badger
Average earnings in Badger are $45,938 for men and $30,938 for women, a difference of 32.7%. Men with an educational attainment of bachelor's degree enjoy the highest average annual earnings of $55,417, while those with college or associate's degree education earn the least with $38,438. Women with an educational attainment of bachelor's degree earn the most with the average annual earnings of $41,875, while those with college or associate's degree education have the smallest earnings of $31,875.
| Educational Attainment | Male Income | Female Income |
| Less than High School | - | - |
| High School Diploma | $47,875 | $0 |
| College or Associate's Degree | $38,438 | $31,875 |
| Bachelor's Degree | $55,417 | $41,875 |
| Graduate Degree | - | - |
| Total | $45,938 | $30,938 |
Family Income in Badger
Family Income Brackets in Badger
According to the Badger family income data, there are 19 families falling into the $75,000 to $99,999 income range, which is the most common income bracket and makes up 22.1% of all families.
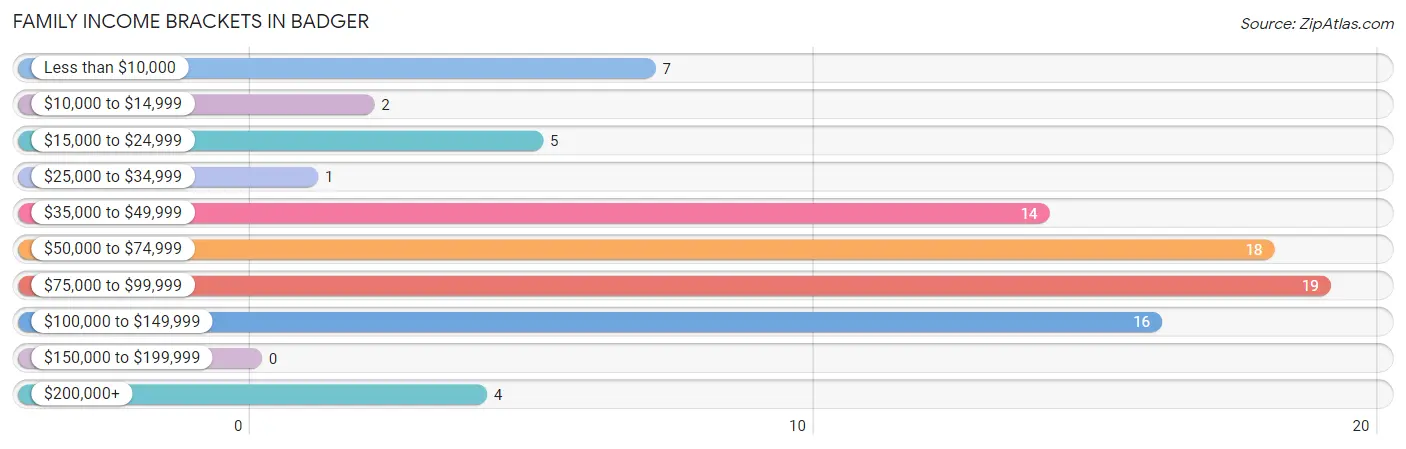
| Income Bracket | # Families | % Families |
| Less than $10,000 | 7 | 8.1% |
| $10,000 to $14,999 | 2 | 2.3% |
| $15,000 to $24,999 | 5 | 5.8% |
| $25,000 to $34,999 | 1 | 1.2% |
| $35,000 to $49,999 | 14 | 16.3% |
| $50,000 to $74,999 | 18 | 20.9% |
| $75,000 to $99,999 | 19 | 22.1% |
| $100,000 to $149,999 | 16 | 18.6% |
| $150,000 to $199,999 | 0 | 0.0% |
| $200,000+ | 4 | 4.7% |
Family Income by Famaliy Size in Badger
5-person families (16 | 18.6%) account for the highest median family income in Badger with $88,750 per family, while 2-person families (48 | 55.8%) have the highest median income of $30,750 per family member.
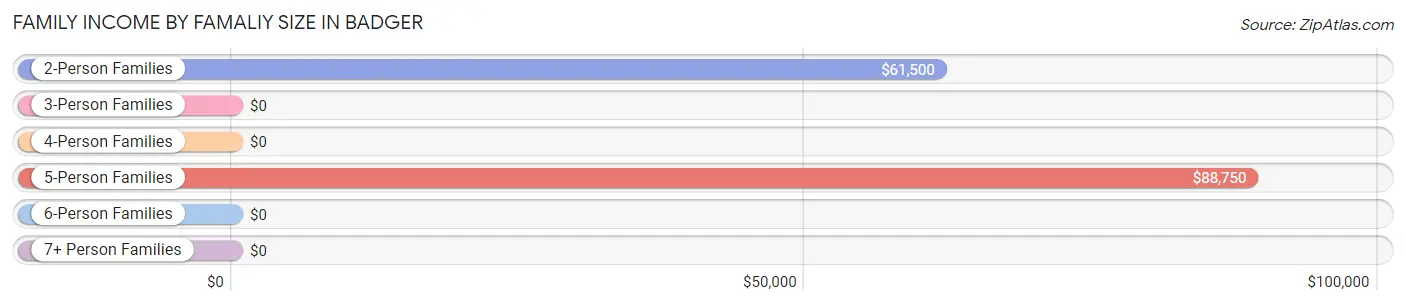
| Income Bracket | # Families | Median Income |
| 2-Person Families | 48 (55.8%) | $61,500 |
| 3-Person Families | 3 (3.5%) | $0 |
| 4-Person Families | 17 (19.8%) | $0 |
| 5-Person Families | 16 (18.6%) | $88,750 |
| 6-Person Families | 0 (0.0%) | $0 |
| 7+ Person Families | 2 (2.3%) | $0 |
| Total | 86 (100.0%) | $63,750 |
Family Income by Number of Earners in Badger
The median family income in Badger is $63,750, with families comprising 3+ earners (13) having the highest median family income of $132,917, while families with no earners (14) have the lowest median family income of $46,250, accounting for 15.1% and 16.3% of families, respectively.
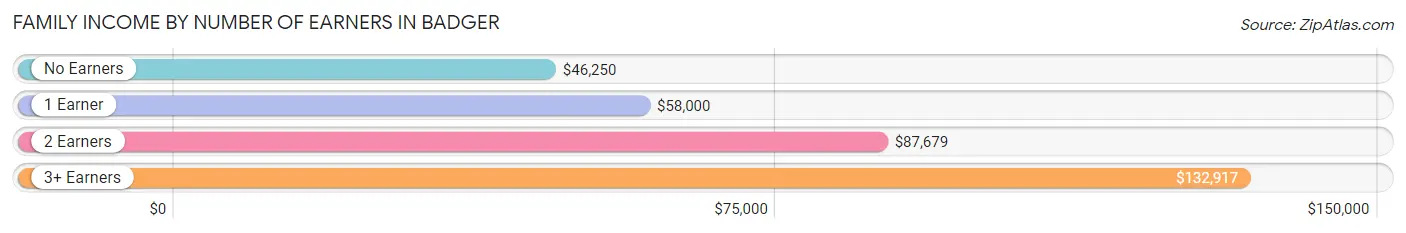
| Number of Earners | # Families | Median Income |
| No Earners | 14 (16.3%) | $46,250 |
| 1 Earner | 30 (34.9%) | $58,000 |
| 2 Earners | 29 (33.7%) | $87,679 |
| 3+ Earners | 13 (15.1%) | $132,917 |
| Total | 86 (100.0%) | $63,750 |
Household Income in Badger
Household Income Brackets in Badger
With 30 households falling in the category, the $75,000 to $99,999 income range is the most frequent in Badger, accounting for 18.5% of all households.
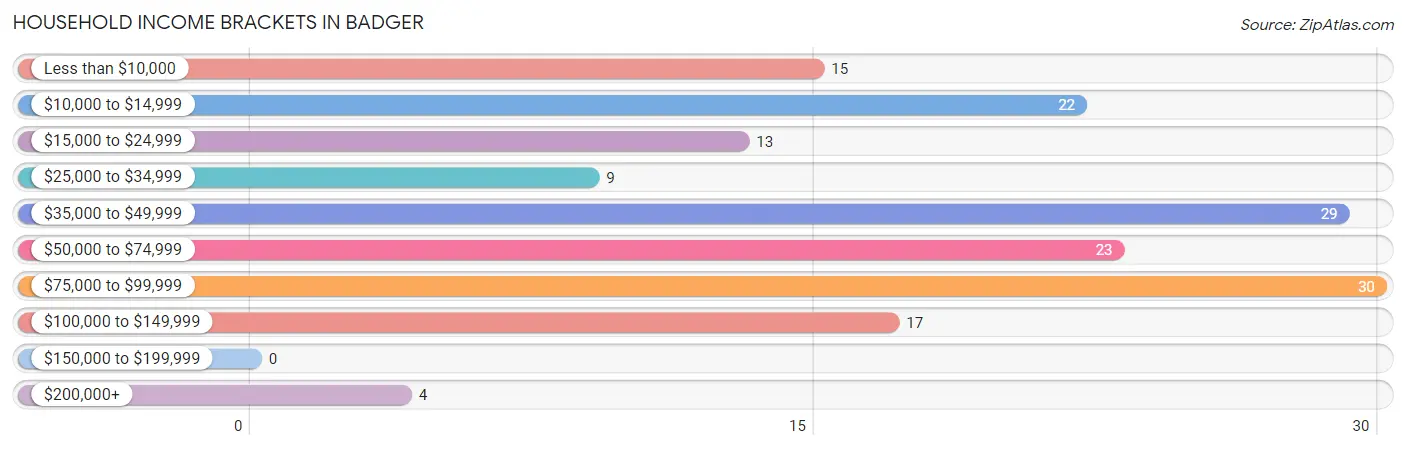
| Income Bracket | # Households | % Households |
| Less than $10,000 | 15 | 9.3% |
| $10,000 to $14,999 | 22 | 13.6% |
| $15,000 to $24,999 | 13 | 8.0% |
| $25,000 to $34,999 | 9 | 5.6% |
| $35,000 to $49,999 | 29 | 17.9% |
| $50,000 to $74,999 | 23 | 14.2% |
| $75,000 to $99,999 | 30 | 18.5% |
| $100,000 to $149,999 | 17 | 10.5% |
| $150,000 to $199,999 | 0 | 0.0% |
| $200,000+ | 4 | 2.5% |
Household Income by Householder Age in Badger
The median household income in Badger is $46,500, with the highest median household income of $80,625 found in the 25 to 44 years age bracket for the primary householder. A total of 46 households (28.4%) fall into this category. Meanwhile, the 15 to 24 years age bracket for the primary householder has the lowest median household income of $0, with 5 households (3.1%) in this group.
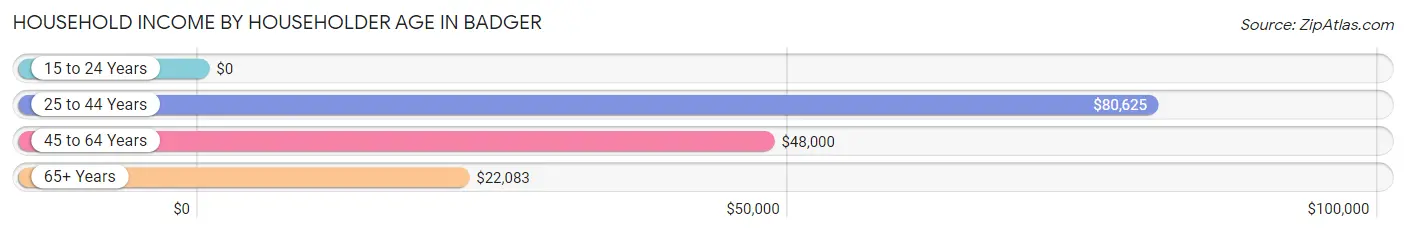
| Income Bracket | # Households | Median Income |
| 15 to 24 Years | 5 (3.1%) | $0 |
| 25 to 44 Years | 46 (28.4%) | $80,625 |
| 45 to 64 Years | 50 (30.9%) | $48,000 |
| 65+ Years | 61 (37.7%) | $22,083 |
| Total | 162 (100.0%) | $46,500 |
Poverty in Badger
Income Below Poverty by Sex and Age in Badger
With 22.3% poverty level for males and 18.7% for females among the residents of Badger, 65 to 74 year old males and 75 year old and over females are the most vulnerable to poverty, with 20 males (62.5%) and 8 females (44.4%) in their respective age groups living below the poverty level.
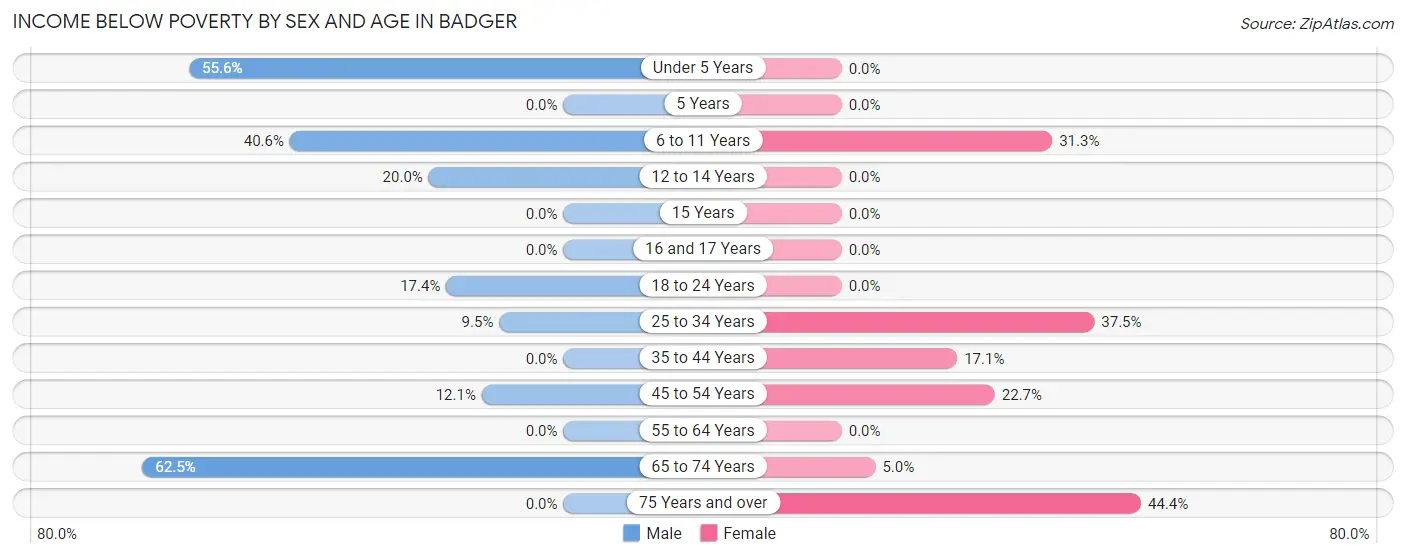
| Age Bracket | Male | Female |
| Under 5 Years | 10 (55.6%) | 0 (0.0%) |
| 5 Years | 0 (0.0%) | 0 (0.0%) |
| 6 to 11 Years | 13 (40.6%) | 5 (31.2%) |
| 12 to 14 Years | 5 (20.0%) | 0 (0.0%) |
| 15 Years | 0 (0.0%) | 0 (0.0%) |
| 16 and 17 Years | 0 (0.0%) | 0 (0.0%) |
| 18 to 24 Years | 4 (17.4%) | 0 (0.0%) |
| 25 to 34 Years | 2 (9.5%) | 6 (37.5%) |
| 35 to 44 Years | 0 (0.0%) | 6 (17.1%) |
| 45 to 54 Years | 4 (12.1%) | 5 (22.7%) |
| 55 to 64 Years | 0 (0.0%) | 0 (0.0%) |
| 65 to 74 Years | 20 (62.5%) | 1 (5.0%) |
| 75 Years and over | 0 (0.0%) | 8 (44.4%) |
| Total | 58 (22.3%) | 31 (18.7%) |
Income Above Poverty by Sex and Age in Badger
According to the poverty statistics in Badger, males aged 16 and 17 years and females aged 12 to 14 years are the age groups that are most secure financially, with 100.0% of males and 100.0% of females in these age groups living above the poverty line.
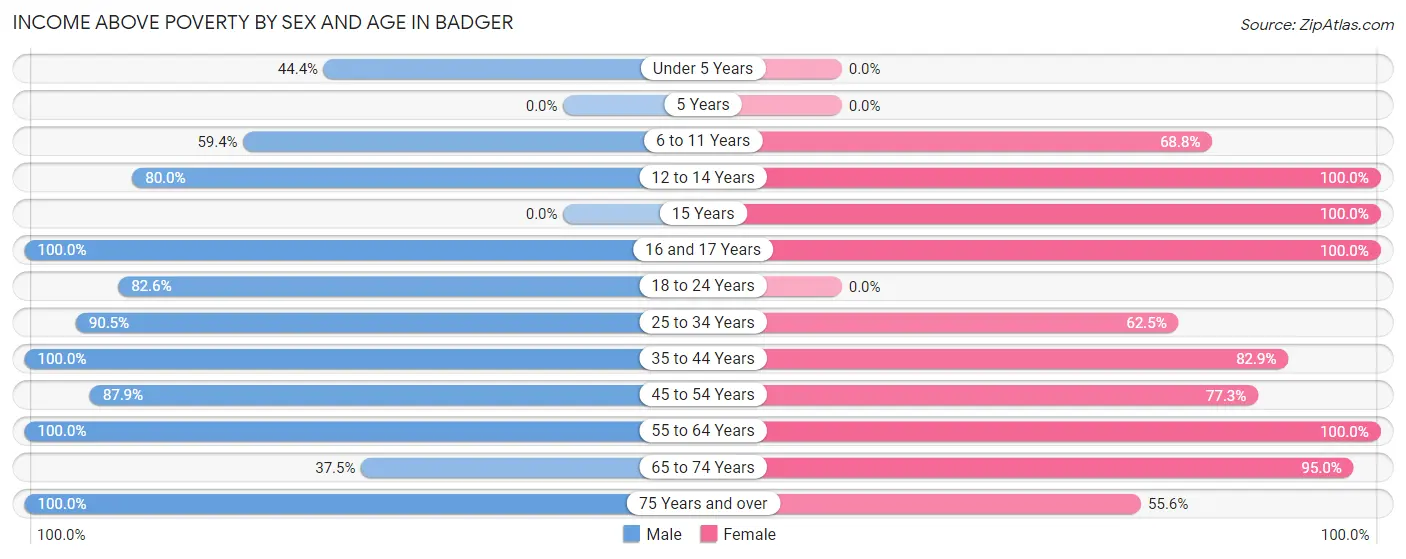
| Age Bracket | Male | Female |
| Under 5 Years | 8 (44.4%) | 0 (0.0%) |
| 5 Years | 0 (0.0%) | 0 (0.0%) |
| 6 to 11 Years | 19 (59.4%) | 11 (68.8%) |
| 12 to 14 Years | 20 (80.0%) | 4 (100.0%) |
| 15 Years | 0 (0.0%) | 4 (100.0%) |
| 16 and 17 Years | 10 (100.0%) | 21 (100.0%) |
| 18 to 24 Years | 19 (82.6%) | 0 (0.0%) |
| 25 to 34 Years | 19 (90.5%) | 10 (62.5%) |
| 35 to 44 Years | 16 (100.0%) | 29 (82.9%) |
| 45 to 54 Years | 29 (87.9%) | 17 (77.3%) |
| 55 to 64 Years | 37 (100.0%) | 10 (100.0%) |
| 65 to 74 Years | 12 (37.5%) | 19 (95.0%) |
| 75 Years and over | 13 (100.0%) | 10 (55.6%) |
| Total | 202 (77.7%) | 135 (81.3%) |
Income Below Poverty Among Married-Couple Families in Badger
The poverty statistics for married-couple families in Badger show that 8.6% or 5 of the total 58 families live below the poverty line. Families with 3 or 4 children have the highest poverty rate of 23.5%, comprising of 4 families. On the other hand, families with 1 or 2 children have the lowest poverty rate of 0.0%, which includes 0 families.
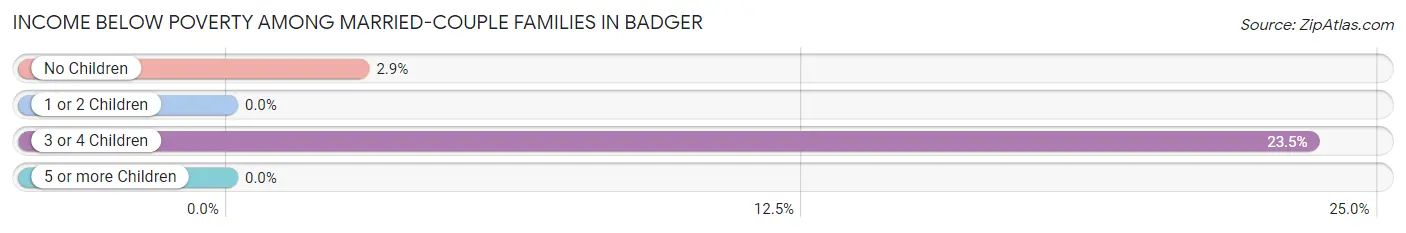
| Children | Above Poverty | Below Poverty |
| No Children | 34 (97.1%) | 1 (2.9%) |
| 1 or 2 Children | 6 (100.0%) | 0 (0.0%) |
| 3 or 4 Children | 13 (76.5%) | 4 (23.5%) |
| 5 or more Children | 0 (0.0%) | 0 (0.0%) |
| Total | 53 (91.4%) | 5 (8.6%) |
Income Below Poverty Among Single-Parent Households in Badger
According to the poverty data in Badger, 7.1% or 1 single-father households and 57.1% or 8 single-mother households are living below the poverty line. Among single-father households, those with 3 or 4 children have the highest poverty rate, with 1 households (100.0%) experiencing poverty. Likewise, among single-mother households, those with no children have the highest poverty rate, with 2 households (100.0%) falling below the poverty line.
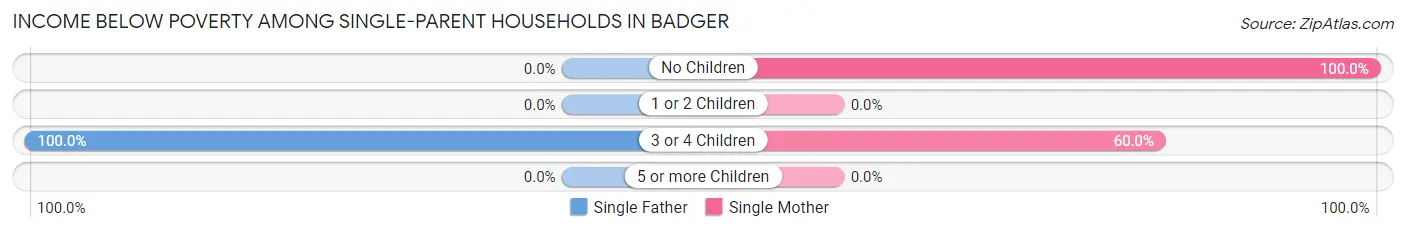
| Children | Single Father | Single Mother |
| No Children | 0 (0.0%) | 2 (100.0%) |
| 1 or 2 Children | 0 (0.0%) | 0 (0.0%) |
| 3 or 4 Children | 1 (100.0%) | 6 (60.0%) |
| 5 or more Children | 0 (0.0%) | 0 (0.0%) |
| Total | 1 (7.1%) | 8 (57.1%) |
Income Below Poverty Among Married-Couple vs Single-Parent Households in Badger
The poverty data for Badger shows that 5 of the married-couple family households (8.6%) and 9 of the single-parent households (32.1%) are living below the poverty level. Within the married-couple family households, those with 3 or 4 children have the highest poverty rate, with 4 households (23.5%) falling below the poverty line. Among the single-parent households, those with 3 or 4 children have the highest poverty rate, with 7 household (63.6%) living below poverty.
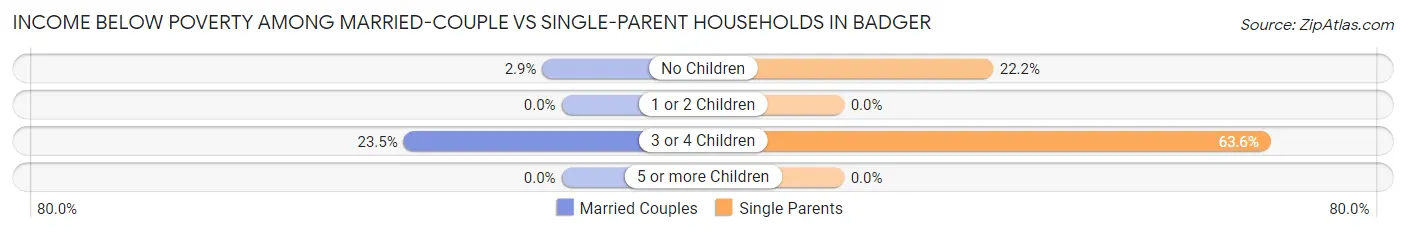
| Children | Married-Couple Families | Single-Parent Households |
| No Children | 1 (2.9%) | 2 (22.2%) |
| 1 or 2 Children | 0 (0.0%) | 0 (0.0%) |
| 3 or 4 Children | 4 (23.5%) | 7 (63.6%) |
| 5 or more Children | 0 (0.0%) | 0 (0.0%) |
| Total | 5 (8.6%) | 9 (32.1%) |
Race in Badger
The most populous races in Badger are White / Caucasian (421 | 97.0%), Two or more Races (11 | 2.5%), and Hispanic or Latino (8 | 1.8%).
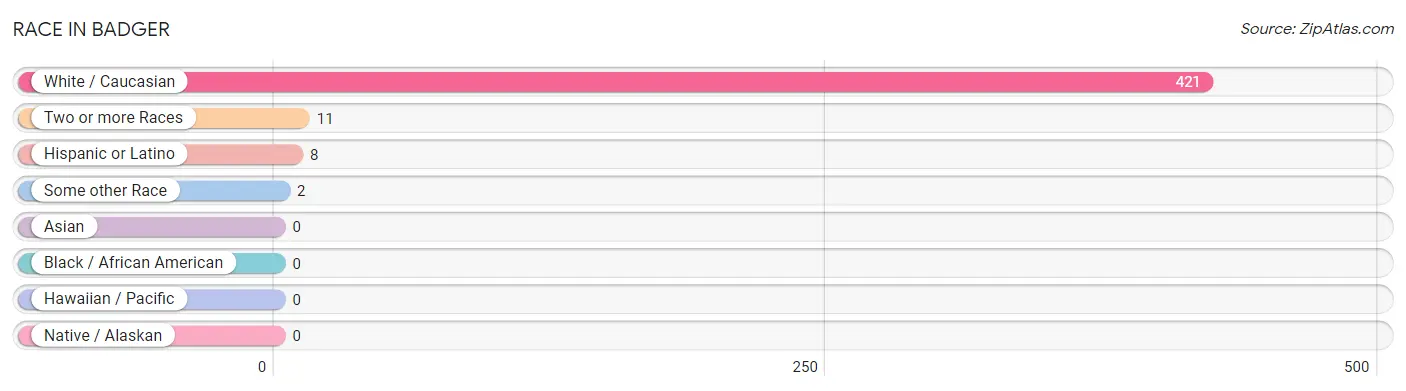
| Race | # Population | % Population |
| Asian | 0 | 0.0% |
| Black / African American | 0 | 0.0% |
| Hawaiian / Pacific | 0 | 0.0% |
| Hispanic or Latino | 8 | 1.8% |
| Native / Alaskan | 0 | 0.0% |
| White / Caucasian | 421 | 97.0% |
| Two or more Races | 11 | 2.5% |
| Some other Race | 2 | 0.5% |
| Total | 434 | 100.0% |
Ancestry in Badger
The most populous ancestries reported in Badger are Norwegian (109 | 25.1%), German (82 | 18.9%), Scandinavian (50 | 11.5%), Swedish (44 | 10.1%), and Irish (39 | 9.0%), together accounting for 74.7% of all Badger residents.
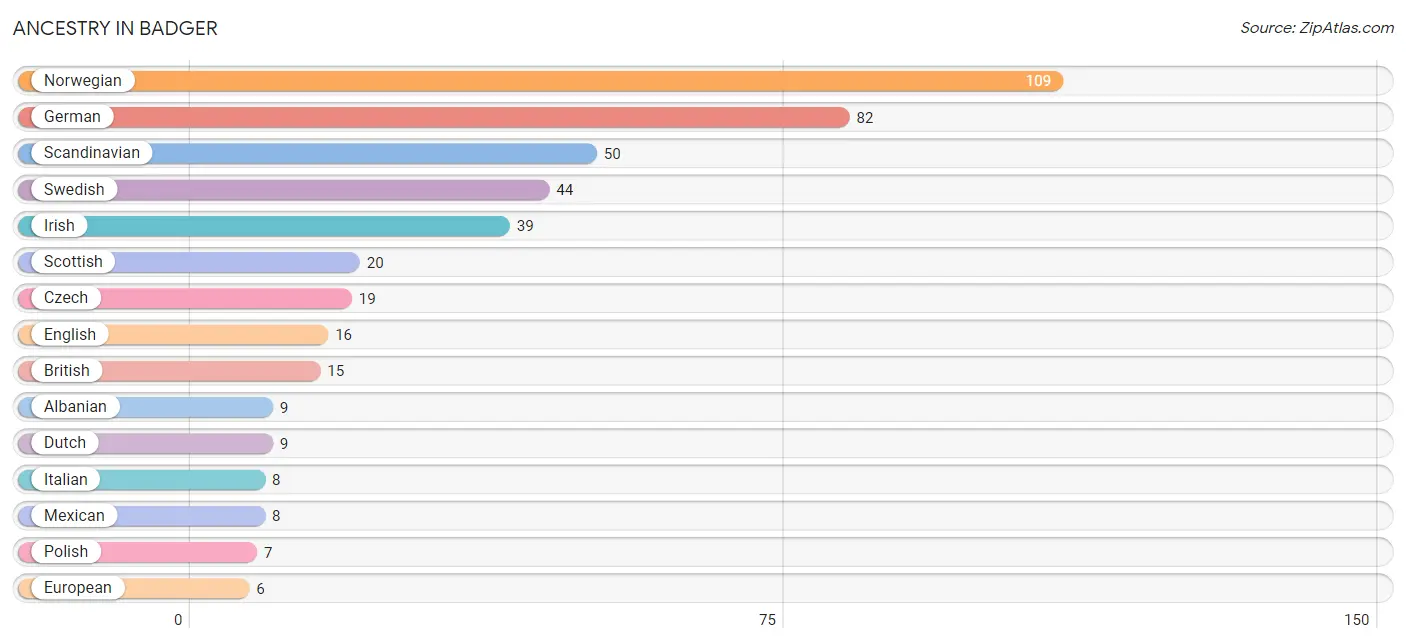
| Ancestry | # Population | % Population |
| Albanian | 9 | 2.1% |
| American | 4 | 0.9% |
| Austrian | 2 | 0.5% |
| British | 15 | 3.5% |
| Czech | 19 | 4.4% |
| Czechoslovakian | 4 | 0.9% |
| Dutch | 9 | 2.1% |
| English | 16 | 3.7% |
| European | 6 | 1.4% |
| Finnish | 3 | 0.7% |
| French | 1 | 0.2% |
| French Canadian | 2 | 0.5% |
| German | 82 | 18.9% |
| Irish | 39 | 9.0% |
| Italian | 8 | 1.8% |
| Mexican | 8 | 1.8% |
| Norwegian | 109 | 25.1% |
| Polish | 7 | 1.6% |
| Scandinavian | 50 | 11.5% |
| Scotch-Irish | 1 | 0.2% |
| Scottish | 20 | 4.6% |
| Swedish | 44 | 10.1% | View All 22 Rows |
Immigrants in Badger
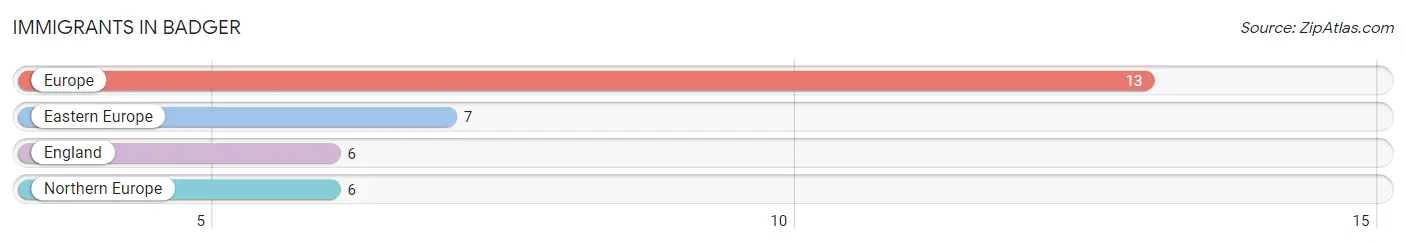
The most numerous immigrant groups reported in Badger came from Europe (13 | 3.0%), Eastern Europe (7 | 1.6%), England (6 | 1.4%), and Northern Europe (6 | 1.4%), together accounting for 7.4% of all Badger residents.
| Immigration Origin | # Population | % Population |
| Eastern Europe | 7 | 1.6% |
| England | 6 | 1.4% |
| Europe | 13 | 3.0% |
| Northern Europe | 6 | 1.4% | View All 4 Rows |
Sex and Age in Badger
Sex and Age in Badger
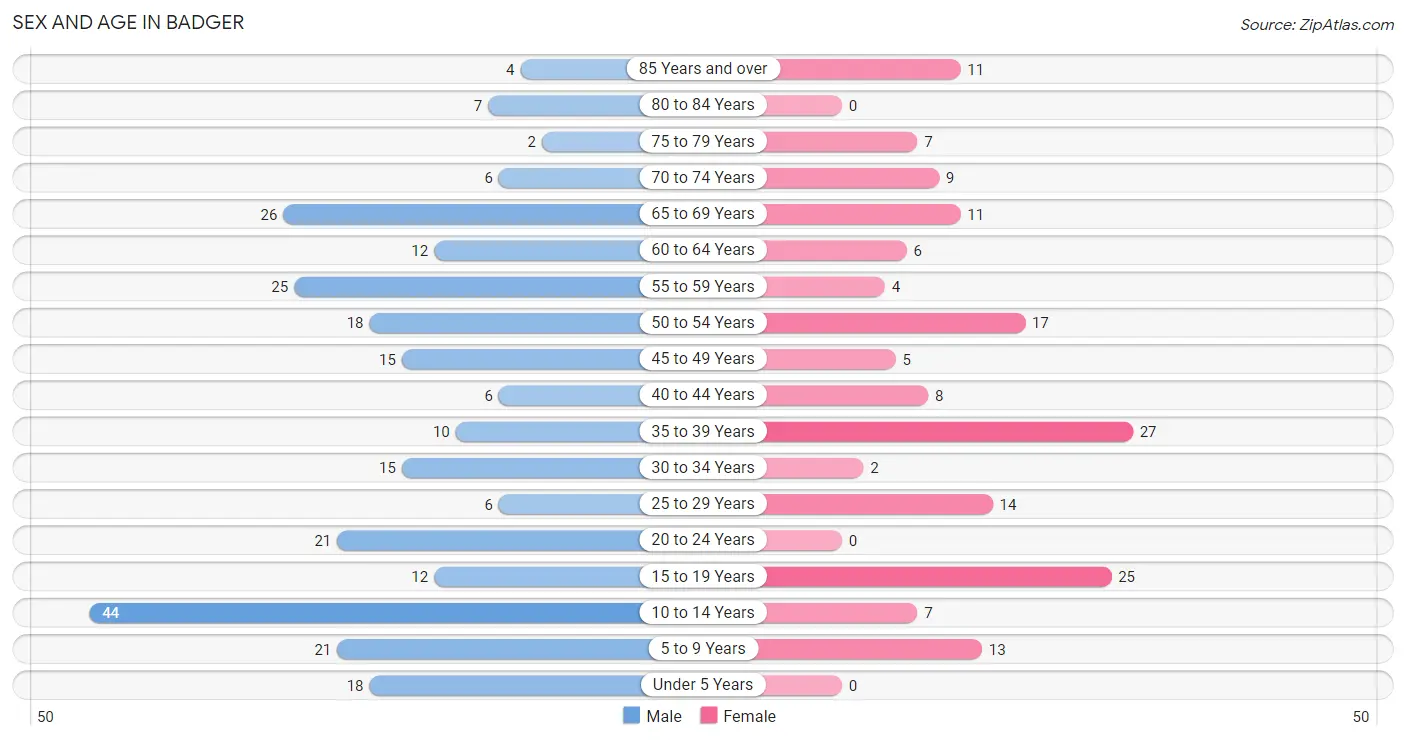
The most populous age groups in Badger are 10 to 14 Years (44 | 16.4%) for men and 35 to 39 Years (27 | 16.3%) for women.
| Age Bracket | Male | Female |
| Under 5 Years | 18 (6.7%) | 0 (0.0%) |
| 5 to 9 Years | 21 (7.8%) | 13 (7.8%) |
| 10 to 14 Years | 44 (16.4%) | 7 (4.2%) |
| 15 to 19 Years | 12 (4.5%) | 25 (15.1%) |
| 20 to 24 Years | 21 (7.8%) | 0 (0.0%) |
| 25 to 29 Years | 6 (2.2%) | 14 (8.4%) |
| 30 to 34 Years | 15 (5.6%) | 2 (1.2%) |
| 35 to 39 Years | 10 (3.7%) | 27 (16.3%) |
| 40 to 44 Years | 6 (2.2%) | 8 (4.8%) |
| 45 to 49 Years | 15 (5.6%) | 5 (3.0%) |
| 50 to 54 Years | 18 (6.7%) | 17 (10.2%) |
| 55 to 59 Years | 25 (9.3%) | 4 (2.4%) |
| 60 to 64 Years | 12 (4.5%) | 6 (3.6%) |
| 65 to 69 Years | 26 (9.7%) | 11 (6.6%) |
| 70 to 74 Years | 6 (2.2%) | 9 (5.4%) |
| 75 to 79 Years | 2 (0.7%) | 7 (4.2%) |
| 80 to 84 Years | 7 (2.6%) | 0 (0.0%) |
| 85 Years and over | 4 (1.5%) | 11 (6.6%) |
| Total | 268 (100.0%) | 166 (100.0%) |
Families and Households in Badger
Median Family Size in Badger
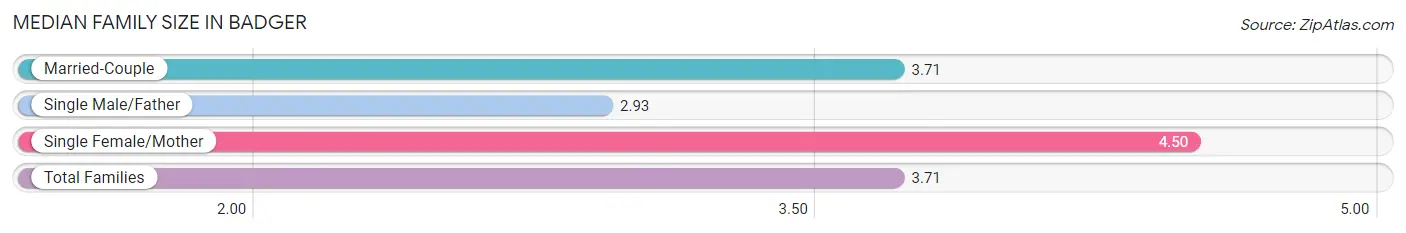
The median family size in Badger is 3.71 persons per family, with single female/mother families (14 | 16.3%) accounting for the largest median family size of 4.5 persons per family. On the other hand, single male/father families (14 | 16.3%) represent the smallest median family size with 2.93 persons per family.
| Family Type | # Families | Family Size |
| Married-Couple | 58 (67.4%) | 3.71 |
| Single Male/Father | 14 (16.3%) | 2.93 |
| Single Female/Mother | 14 (16.3%) | 4.50 |
| Total Families | 86 (100.0%) | 3.71 |
Median Household Size in Badger
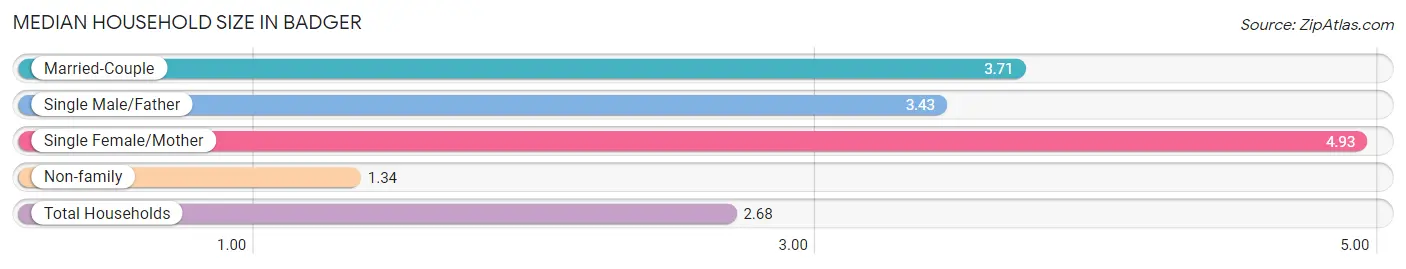
The median household size in Badger is 2.68 persons per household, with single female/mother households (14 | 8.6%) accounting for the largest median household size of 4.93 persons per household. non-family households (76 | 46.9%) represent the smallest median household size with 1.34 persons per household.
| Household Type | # Households | Household Size |
| Married-Couple | 58 (35.8%) | 3.71 |
| Single Male/Father | 14 (8.6%) | 3.43 |
| Single Female/Mother | 14 (8.6%) | 4.93 |
| Non-family | 76 (46.9%) | 1.34 |
| Total Households | 162 (100.0%) | 2.68 |
Household Size by Marriage Status in Badger
Out of a total of 162 households in Badger, 86 (53.1%) are family households, while 76 (46.9%) are nonfamily households. The most numerous type of family households are 2-person households, comprising 44, and the most common type of nonfamily households are 1-person households, comprising 65.
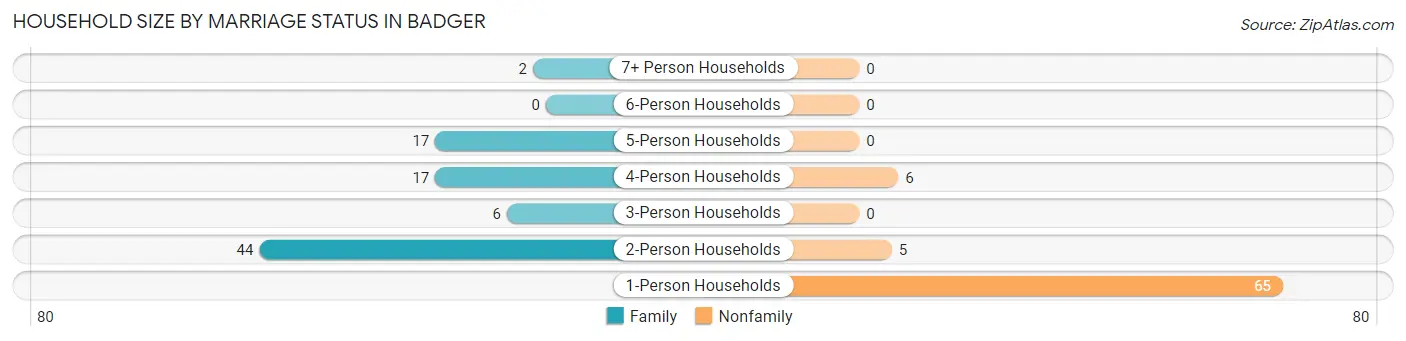
| Household Size | Family Households | Nonfamily Households |
| 1-Person Households | - | 65 (40.1%) |
| 2-Person Households | 44 (27.2%) | 5 (3.1%) |
| 3-Person Households | 6 (3.7%) | 0 (0.0%) |
| 4-Person Households | 17 (10.5%) | 6 (3.7%) |
| 5-Person Households | 17 (10.5%) | 0 (0.0%) |
| 6-Person Households | 0 (0.0%) | 0 (0.0%) |
| 7+ Person Households | 2 (1.2%) | 0 (0.0%) |
| Total | 86 (53.1%) | 76 (46.9%) |
Female Fertility in Badger
Fertility by Age in Badger
Average fertility rate in Badger is 73.0 births per 1,000 women. Women in the age bracket of 20 to 34 years have the highest fertility rate with 375.0 births per 1,000 women. Women in the age bracket of 20 to 34 years acount for 100.0% of all women with births.
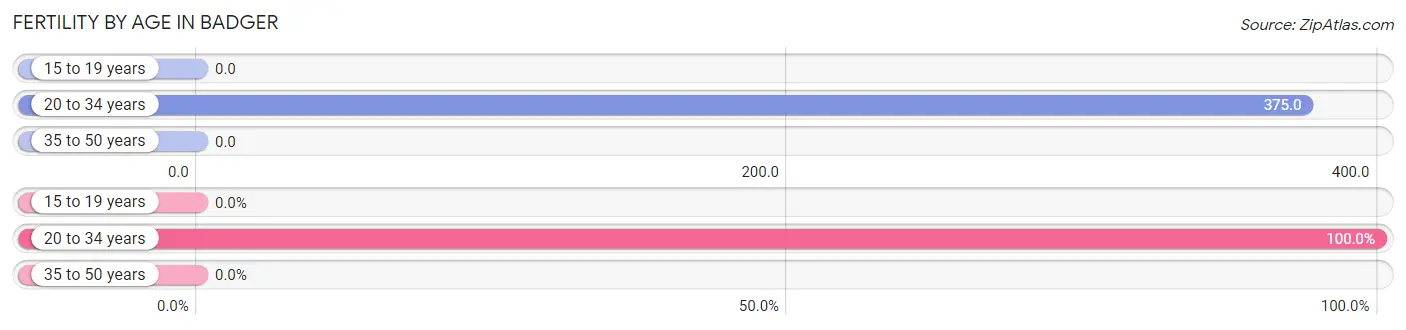
| Age Bracket | Women with Births | Births / 1,000 Women |
| 15 to 19 years | 0 (0.0%) | 0.0 |
| 20 to 34 years | 6 (100.0%) | 375.0 |
| 35 to 50 years | 0 (0.0%) | 0.0 |
| Total | 6 (100.0%) | 73.0 |
Fertility by Age by Marriage Status in Badger
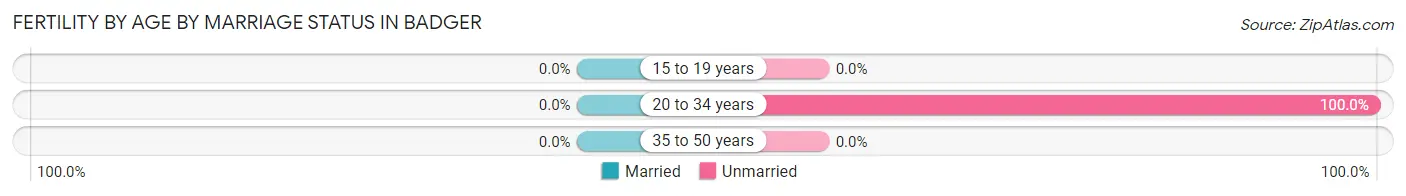
| Age Bracket | Married | Unmarried |
| 15 to 19 years | 0 (0.0%) | 0 (0.0%) |
| 20 to 34 years | 0 (0.0%) | 6 (100.0%) |
| 35 to 50 years | 0 (0.0%) | 0 (0.0%) |
| Total | 0 (0.0%) | 6 (100.0%) |
Fertility by Education in Badger
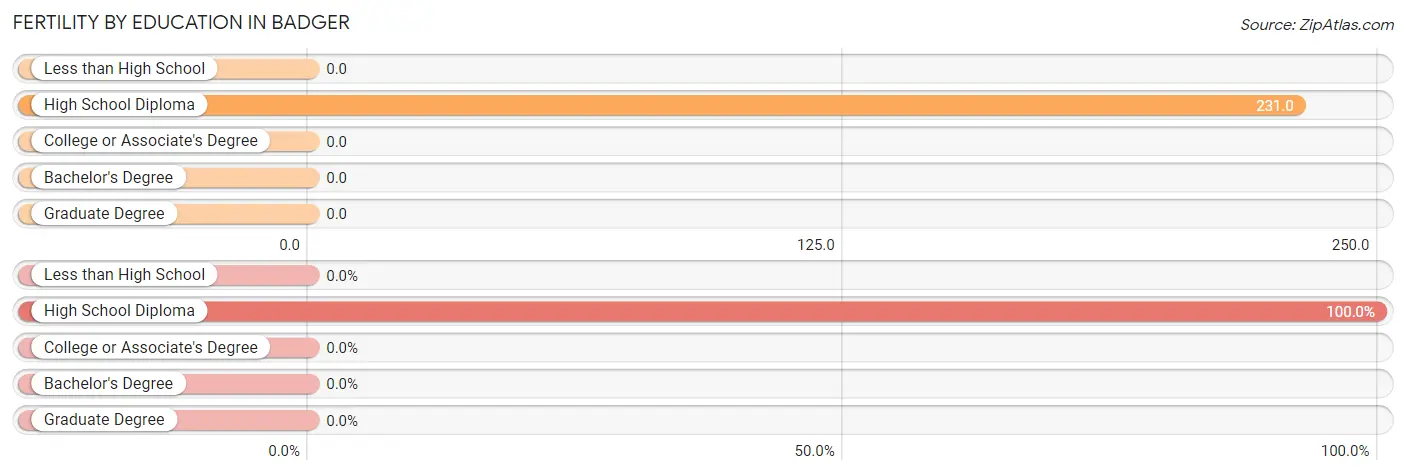
| Educational Attainment | Women with Births | Births / 1,000 Women |
| Less than High School | 0 (0.0%) | 0.0 |
| High School Diploma | 6 (100.0%) | 231.0 |
| College or Associate's Degree | 0 (0.0%) | 0.0 |
| Bachelor's Degree | 0 (0.0%) | 0.0 |
| Graduate Degree | 0 (0.0%) | 0.0 |
| Total | 6 (100.0%) | 73.0 |
Fertility by Education by Marriage Status in Badger
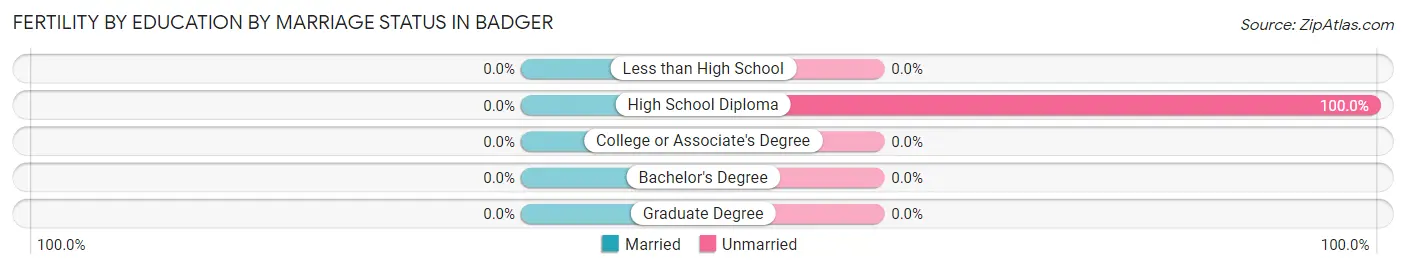
| Educational Attainment | Married | Unmarried |
| Less than High School | 0 (0.0%) | 0 (0.0%) |
| High School Diploma | 0 (0.0%) | 6 (100.0%) |
| College or Associate's Degree | 0 (0.0%) | 0 (0.0%) |
| Bachelor's Degree | 0 (0.0%) | 0 (0.0%) |
| Graduate Degree | 0 (0.0%) | 0 (0.0%) |
| Total | 0 (0.0%) | 6 (100.0%) |
Employment Characteristics in Badger
Employment by Class of Employer in Badger
Among the 220 employed individuals in Badger, private company employees (188 | 85.5%), not-for-profit organizations (11 | 5.0%), and local government employees (10 | 4.5%) make up the most common classes of employment.
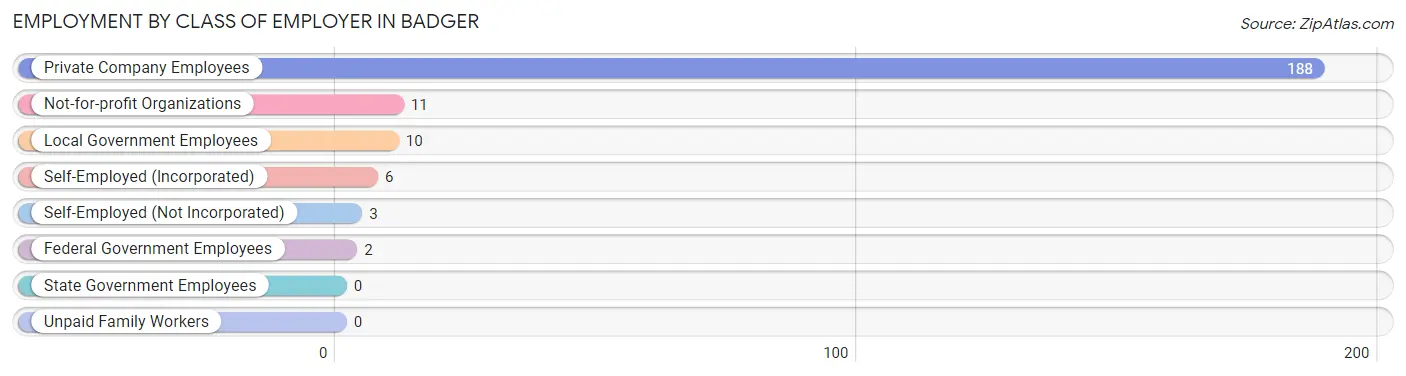
| Employer Class | # Employees | % Employees |
| Private Company Employees | 188 | 85.5% |
| Self-Employed (Incorporated) | 6 | 2.7% |
| Self-Employed (Not Incorporated) | 3 | 1.4% |
| Not-for-profit Organizations | 11 | 5.0% |
| Local Government Employees | 10 | 4.5% |
| State Government Employees | 0 | 0.0% |
| Federal Government Employees | 2 | 0.9% |
| Unpaid Family Workers | 0 | 0.0% |
| Total | 220 | 100.0% |
Employment Status by Age in Badger
According to the labor force statistics for Badger, out of the total population over 16 years of age (327), 73.1% or 239 individuals are in the labor force, with 7.9% or 19 of them unemployed. The age group with the highest labor force participation rate is 30 to 34 years, with 100.0% or 17 individuals in the labor force. Within the labor force, the 20 to 24 years age range has the highest percentage of unemployed individuals, with 50.0% or 10 of them being unemployed.
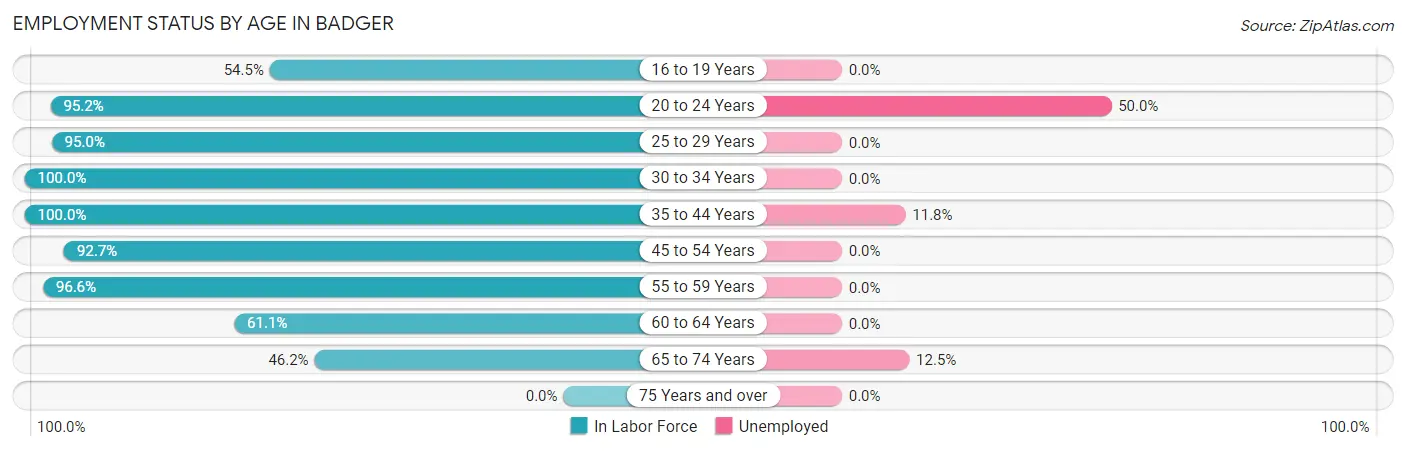
| Age Bracket | In Labor Force | Unemployed |
| 16 to 19 Years | 18 (54.5%) | 0 (0.0%) |
| 20 to 24 Years | 20 (95.2%) | 10 (50.0%) |
| 25 to 29 Years | 19 (95.0%) | 0 (0.0%) |
| 30 to 34 Years | 17 (100.0%) | 0 (0.0%) |
| 35 to 44 Years | 51 (100.0%) | 6 (11.8%) |
| 45 to 54 Years | 51 (92.7%) | 0 (0.0%) |
| 55 to 59 Years | 28 (96.6%) | 0 (0.0%) |
| 60 to 64 Years | 11 (61.1%) | 0 (0.0%) |
| 65 to 74 Years | 24 (46.2%) | 3 (12.5%) |
| 75 Years and over | 0 (0.0%) | 0 (0.0%) |
| Total | 239 (73.1%) | 19 (7.9%) |
Employment Status by Educational Attainment in Badger
According to labor force statistics for Badger, 93.2% of individuals (177) out of the total population between 25 and 64 years of age (190) are in the labor force, with 3.4% or 6 of them being unemployed. The group with the highest labor force participation rate are those with the educational attainment of college / associate degree, with 100.0% or 61 individuals in the labor force. Within the labor force, individuals with high school diploma education have the highest percentage of unemployment, with 6.7% or 6 of them being unemployed.
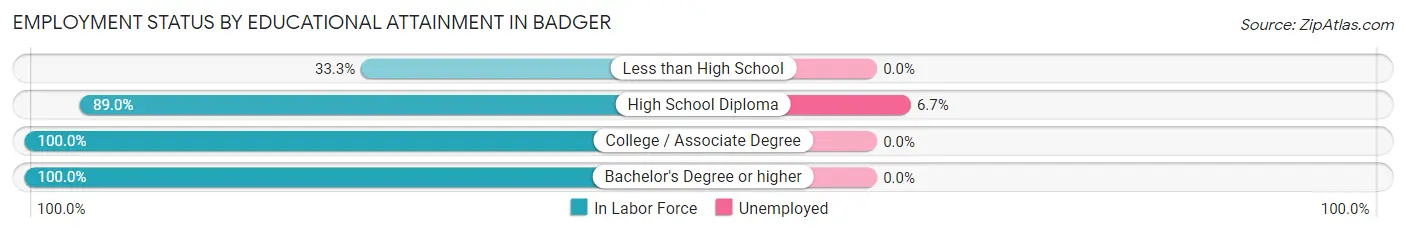
| Educational Attainment | In Labor Force | Unemployed |
| Less than High School | 1 (33.3%) | 0 (0.0%) |
| High School Diploma | 89 (89.0%) | 7 (6.7%) |
| College / Associate Degree | 61 (100.0%) | 0 (0.0%) |
| Bachelor's Degree or higher | 26 (100.0%) | 0 (0.0%) |
| Total | 177 (93.2%) | 6 (3.4%) |
Employment Occupations by Sex in Badger
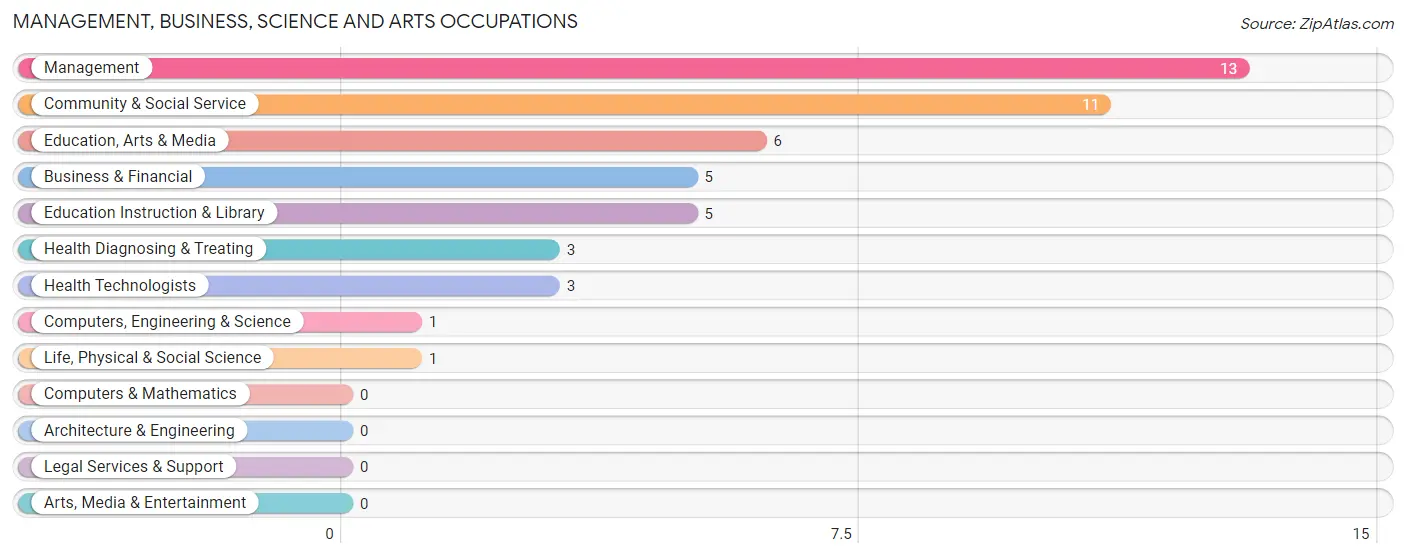
Management, Business, Science and Arts Occupations
The most common Management, Business, Science and Arts occupations in Badger are Management (13 | 5.9%), Community & Social Service (11 | 5.0%), Education, Arts & Media (6 | 2.7%), Business & Financial (5 | 2.3%), and Education Instruction & Library (5 | 2.3%).
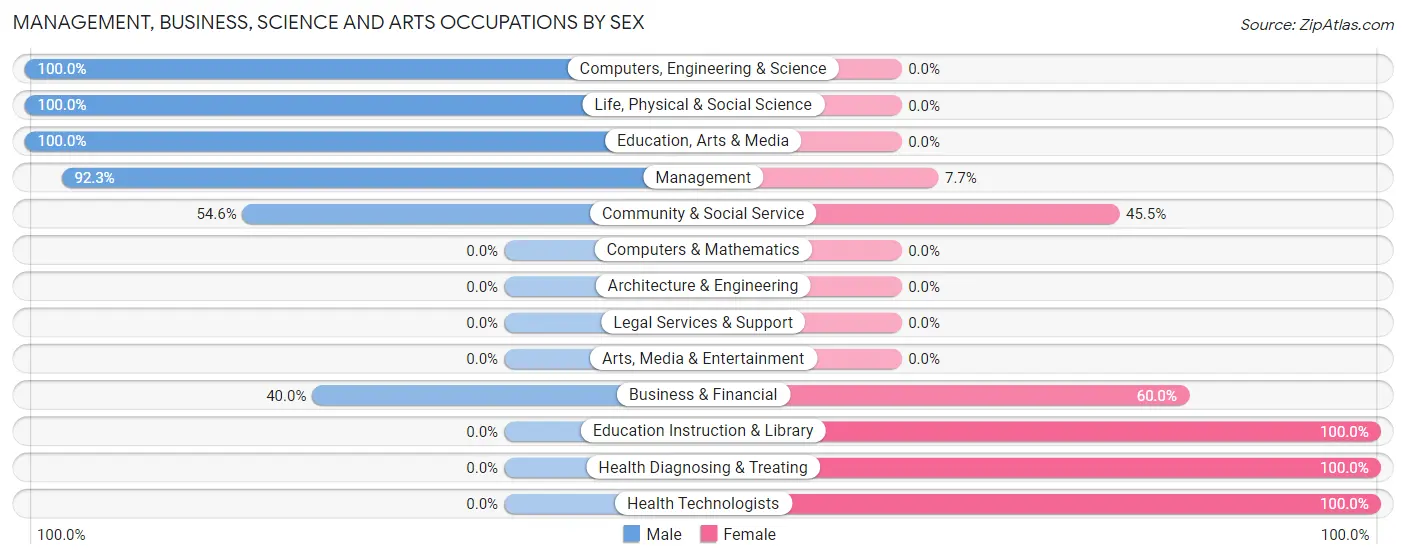
Management, Business, Science and Arts Occupations by Sex
Within the Management, Business, Science and Arts occupations in Badger, the most male-oriented occupations are Computers, Engineering & Science (100.0%), Life, Physical & Social Science (100.0%), and Education, Arts & Media (100.0%), while the most female-oriented occupations are Education Instruction & Library (100.0%), Health Diagnosing & Treating (100.0%), and Health Technologists (100.0%).
| Occupation | Male | Female |
| Management | 12 (92.3%) | 1 (7.7%) |
| Business & Financial | 2 (40.0%) | 3 (60.0%) |
| Computers, Engineering & Science | 1 (100.0%) | 0 (0.0%) |
| Computers & Mathematics | 0 (0.0%) | 0 (0.0%) |
| Architecture & Engineering | 0 (0.0%) | 0 (0.0%) |
| Life, Physical & Social Science | 1 (100.0%) | 0 (0.0%) |
| Community & Social Service | 6 (54.5%) | 5 (45.5%) |
| Education, Arts & Media | 6 (100.0%) | 0 (0.0%) |
| Legal Services & Support | 0 (0.0%) | 0 (0.0%) |
| Education Instruction & Library | 0 (0.0%) | 5 (100.0%) |
| Arts, Media & Entertainment | 0 (0.0%) | 0 (0.0%) |
| Health Diagnosing & Treating | 0 (0.0%) | 3 (100.0%) |
| Health Technologists | 0 (0.0%) | 3 (100.0%) |
| Total (Category) | 21 (63.6%) | 12 (36.4%) |
| Total (Overall) | 138 (62.7%) | 82 (37.3%) |
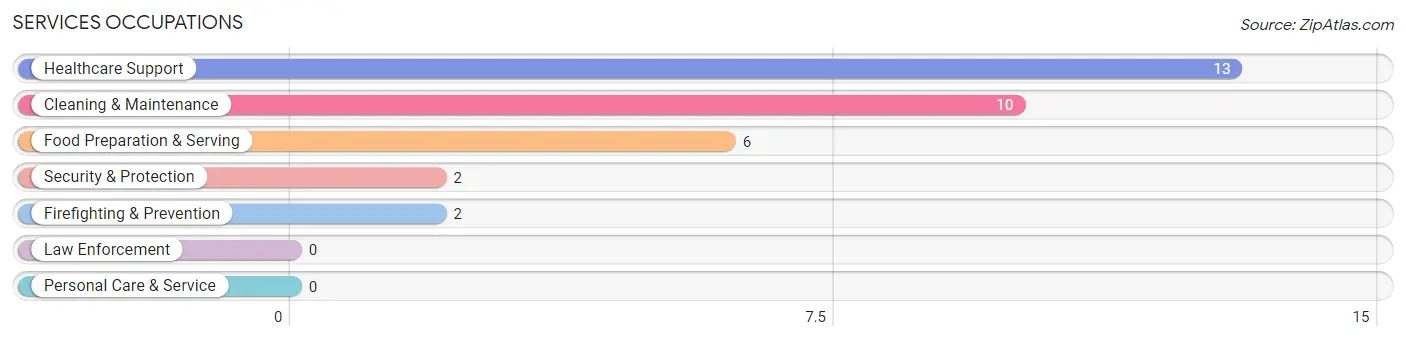
Services Occupations
The most common Services occupations in Badger are Healthcare Support (13 | 5.9%), Cleaning & Maintenance (10 | 4.5%), Food Preparation & Serving (6 | 2.7%), Security & Protection (2 | 0.9%), and Firefighting & Prevention (2 | 0.9%).
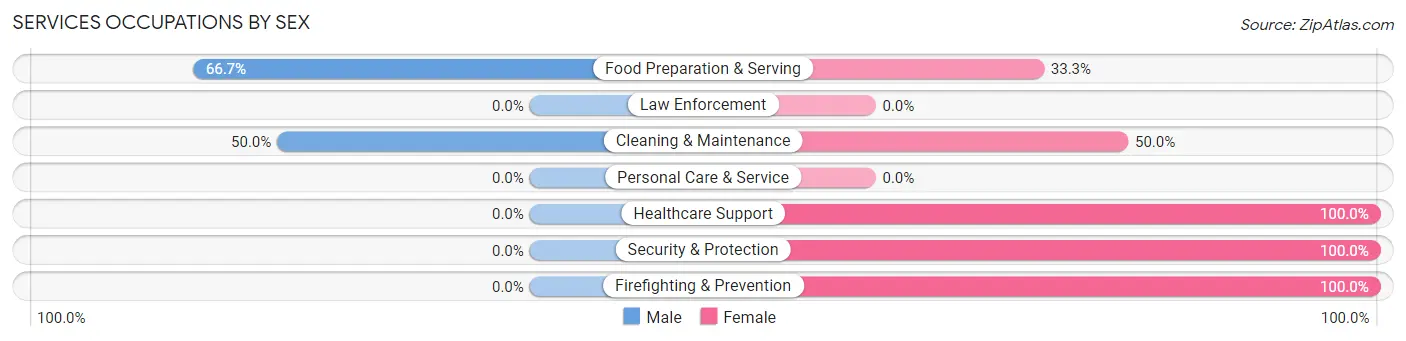
Services Occupations by Sex
Within the Services occupations in Badger, the most male-oriented occupations are Food Preparation & Serving (66.7%), and Cleaning & Maintenance (50.0%), while the most female-oriented occupations are Healthcare Support (100.0%), Security & Protection (100.0%), and Firefighting & Prevention (100.0%).
| Occupation | Male | Female |
| Healthcare Support | 0 (0.0%) | 13 (100.0%) |
| Security & Protection | 0 (0.0%) | 2 (100.0%) |
| Firefighting & Prevention | 0 (0.0%) | 2 (100.0%) |
| Law Enforcement | 0 (0.0%) | 0 (0.0%) |
| Food Preparation & Serving | 4 (66.7%) | 2 (33.3%) |
| Cleaning & Maintenance | 5 (50.0%) | 5 (50.0%) |
| Personal Care & Service | 0 (0.0%) | 0 (0.0%) |
| Total (Category) | 9 (29.0%) | 22 (71.0%) |
| Total (Overall) | 138 (62.7%) | 82 (37.3%) |
Sales and Office Occupations
The most common Sales and Office occupations in Badger are Sales & Related (20 | 9.1%), and Office & Administration (16 | 7.3%).
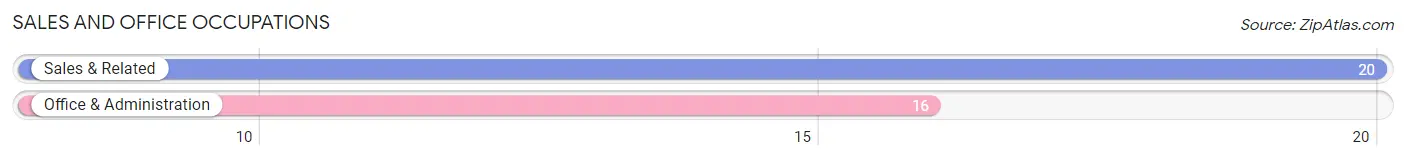
Sales and Office Occupations by Sex
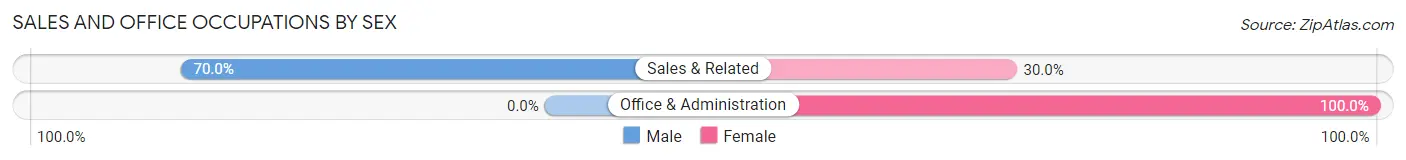
| Occupation | Male | Female |
| Sales & Related | 14 (70.0%) | 6 (30.0%) |
| Office & Administration | 0 (0.0%) | 16 (100.0%) |
| Total (Category) | 14 (38.9%) | 22 (61.1%) |
| Total (Overall) | 138 (62.7%) | 82 (37.3%) |
Natural Resources, Construction and Maintenance Occupations
The most common Natural Resources, Construction and Maintenance occupations in Badger are Construction & Extraction (15 | 6.8%), and Installation, Maintenance & Repair (2 | 0.9%).
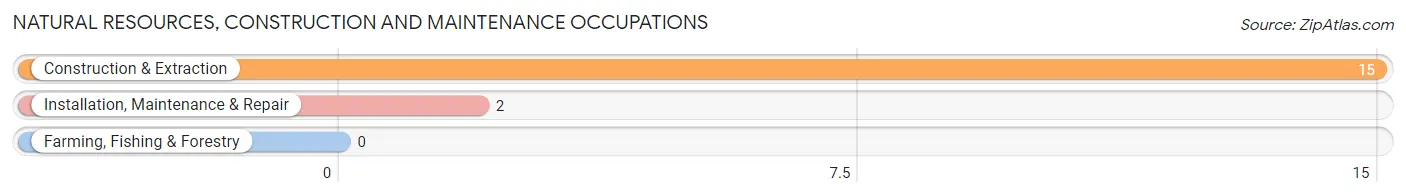
Natural Resources, Construction and Maintenance Occupations by Sex
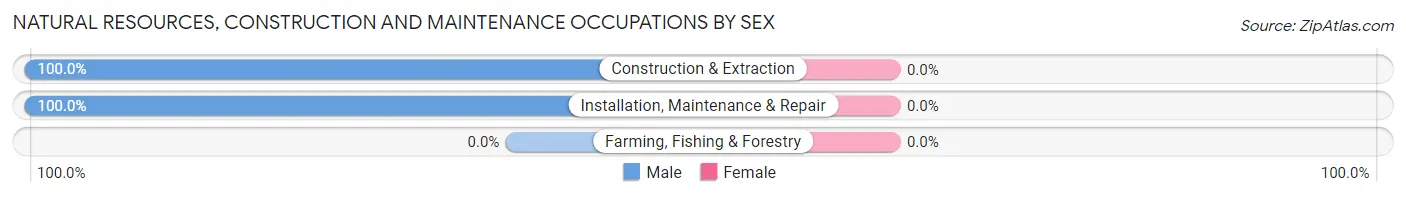
| Occupation | Male | Female |
| Farming, Fishing & Forestry | 0 (0.0%) | 0 (0.0%) |
| Construction & Extraction | 15 (100.0%) | 0 (0.0%) |
| Installation, Maintenance & Repair | 2 (100.0%) | 0 (0.0%) |
| Total (Category) | 17 (100.0%) | 0 (0.0%) |
| Total (Overall) | 138 (62.7%) | 82 (37.3%) |
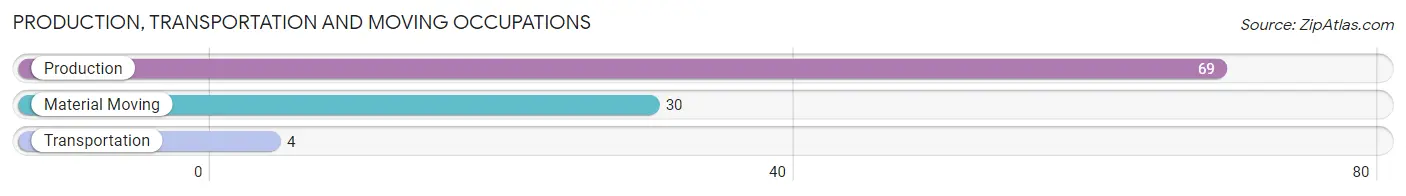
Production, Transportation and Moving Occupations
The most common Production, Transportation and Moving occupations in Badger are Production (69 | 31.4%), Material Moving (30 | 13.6%), and Transportation (4 | 1.8%).
Production, Transportation and Moving Occupations by Sex
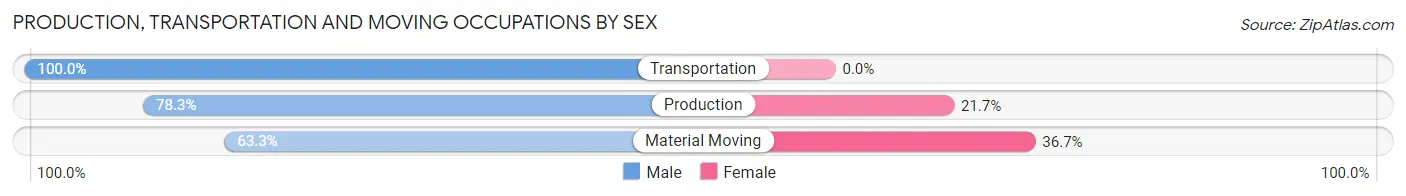
| Occupation | Male | Female |
| Production | 54 (78.3%) | 15 (21.7%) |
| Transportation | 4 (100.0%) | 0 (0.0%) |
| Material Moving | 19 (63.3%) | 11 (36.7%) |
| Total (Category) | 77 (74.8%) | 26 (25.2%) |
| Total (Overall) | 138 (62.7%) | 82 (37.3%) |
Employment Industries by Sex in Badger
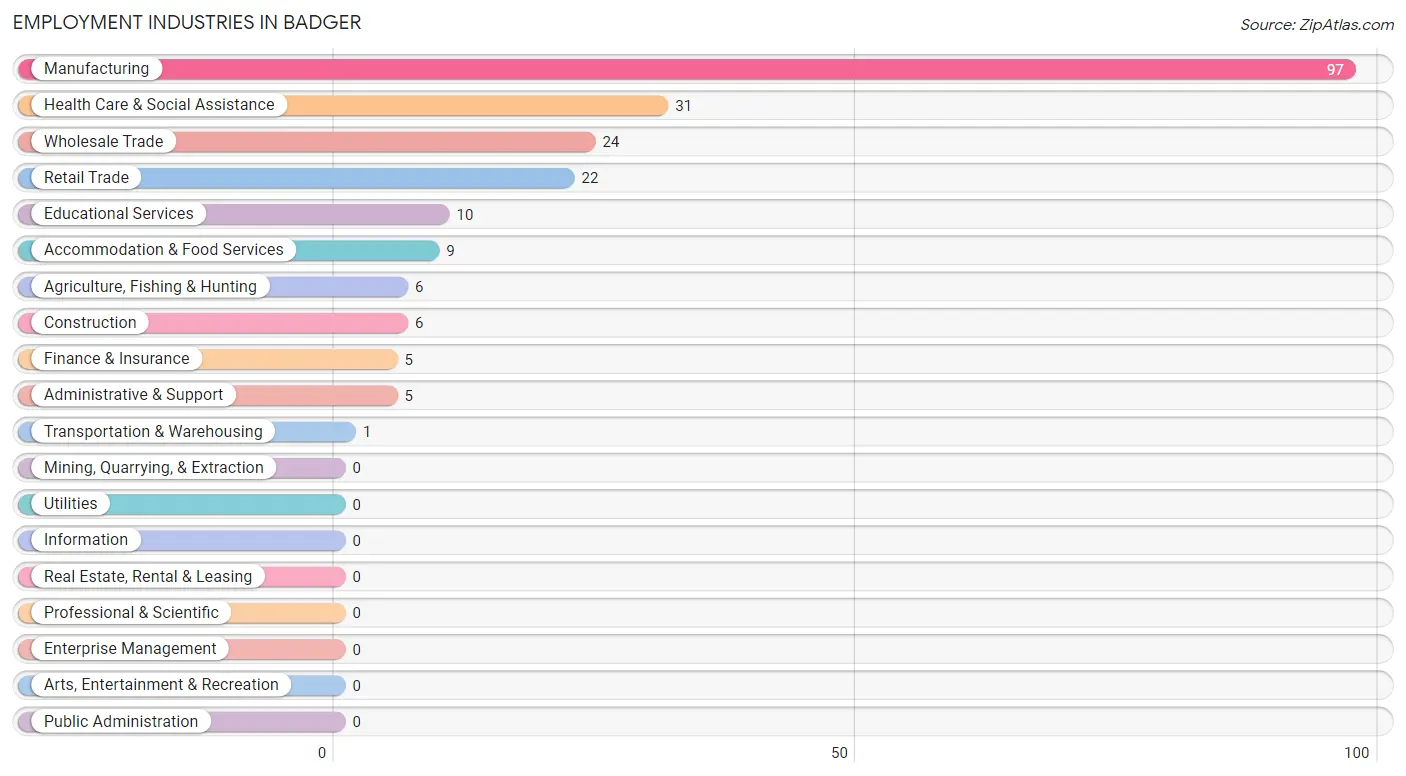
Employment Industries in Badger
The major employment industries in Badger include Manufacturing (97 | 44.1%), Health Care & Social Assistance (31 | 14.1%), Wholesale Trade (24 | 10.9%), Retail Trade (22 | 10.0%), and Educational Services (10 | 4.5%).
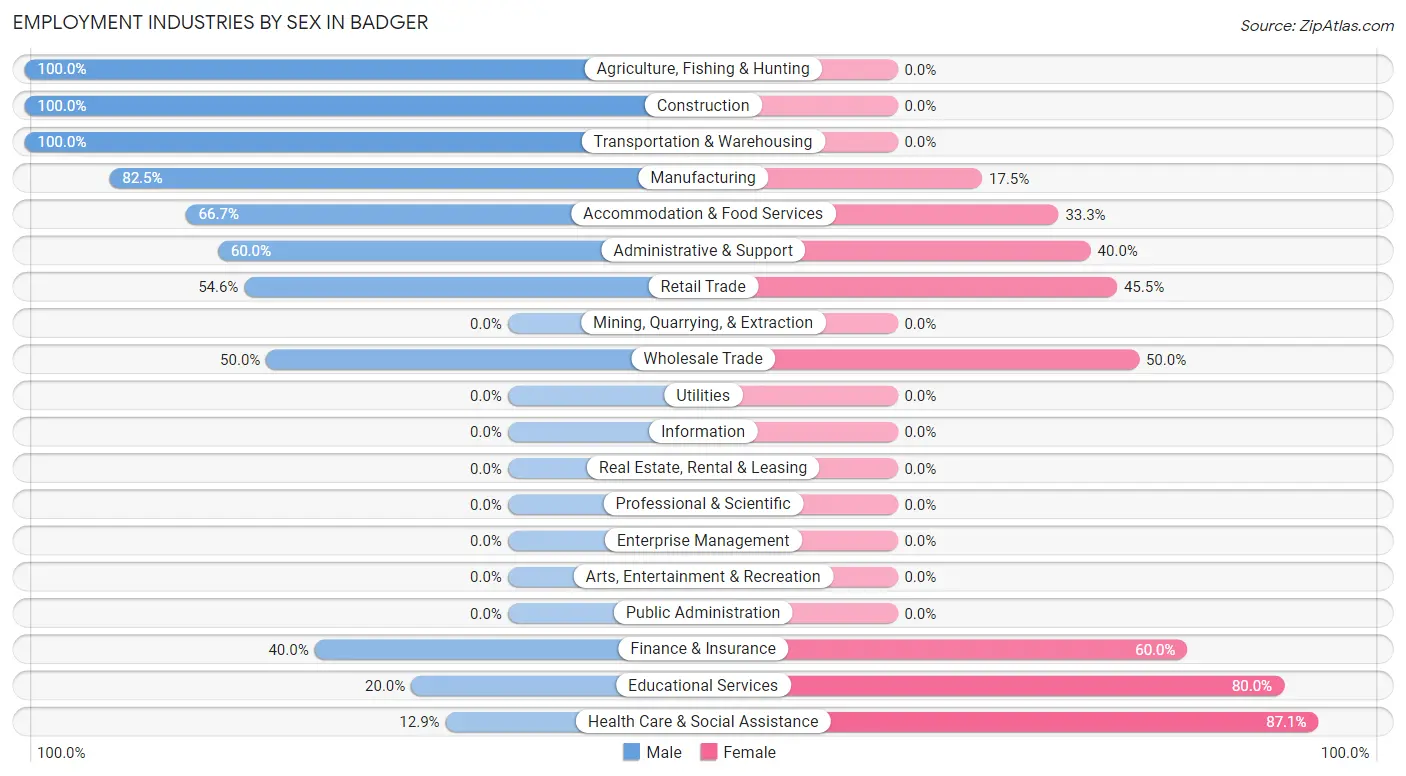
Employment Industries by Sex in Badger
The Badger industries that see more men than women are Agriculture, Fishing & Hunting (100.0%), Construction (100.0%), and Transportation & Warehousing (100.0%), whereas the industries that tend to have a higher number of women are Health Care & Social Assistance (87.1%), Educational Services (80.0%), and Finance & Insurance (60.0%).
| Industry | Male | Female |
| Agriculture, Fishing & Hunting | 6 (100.0%) | 0 (0.0%) |
| Mining, Quarrying, & Extraction | 0 (0.0%) | 0 (0.0%) |
| Construction | 6 (100.0%) | 0 (0.0%) |
| Manufacturing | 80 (82.5%) | 17 (17.5%) |
| Wholesale Trade | 12 (50.0%) | 12 (50.0%) |
| Retail Trade | 12 (54.5%) | 10 (45.5%) |
| Transportation & Warehousing | 1 (100.0%) | 0 (0.0%) |
| Utilities | 0 (0.0%) | 0 (0.0%) |
| Information | 0 (0.0%) | 0 (0.0%) |
| Finance & Insurance | 2 (40.0%) | 3 (60.0%) |
| Real Estate, Rental & Leasing | 0 (0.0%) | 0 (0.0%) |
| Professional & Scientific | 0 (0.0%) | 0 (0.0%) |
| Enterprise Management | 0 (0.0%) | 0 (0.0%) |
| Administrative & Support | 3 (60.0%) | 2 (40.0%) |
| Educational Services | 2 (20.0%) | 8 (80.0%) |
| Health Care & Social Assistance | 4 (12.9%) | 27 (87.1%) |
| Arts, Entertainment & Recreation | 0 (0.0%) | 0 (0.0%) |
| Accommodation & Food Services | 6 (66.7%) | 3 (33.3%) |
| Public Administration | 0 (0.0%) | 0 (0.0%) |
| Total | 138 (62.7%) | 82 (37.3%) |
Education in Badger
School Enrollment in Badger
The most common levels of schooling among the 122 students in Badger are middle school (48 | 39.3%), high school (36 | 29.5%), and elementary school (28 | 23.0%).
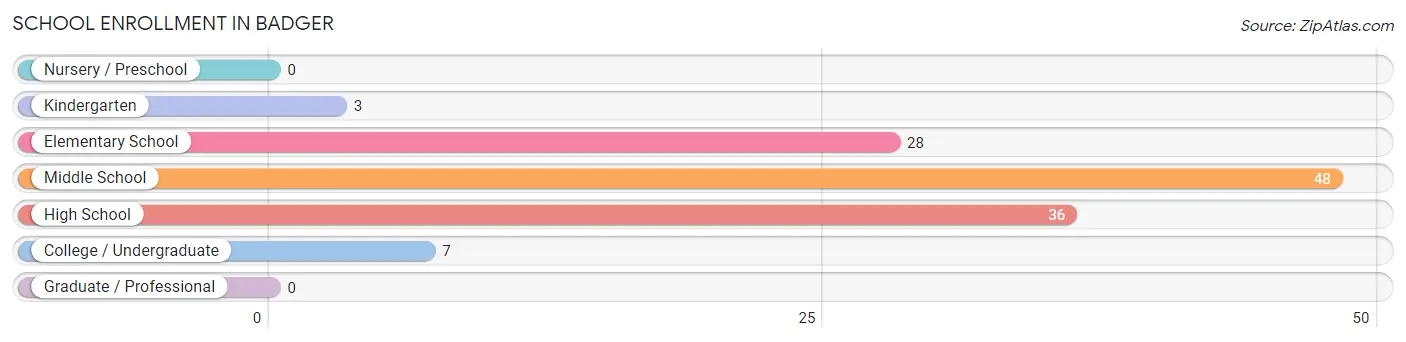
| School Level | # Students | % Students |
| Nursery / Preschool | 0 | 0.0% |
| Kindergarten | 3 | 2.5% |
| Elementary School | 28 | 23.0% |
| Middle School | 48 | 39.3% |
| High School | 36 | 29.5% |
| College / Undergraduate | 7 | 5.7% |
| Graduate / Professional | 0 | 0.0% |
| Total | 122 | 100.0% |
School Enrollment by Age by Funding Source in Badger
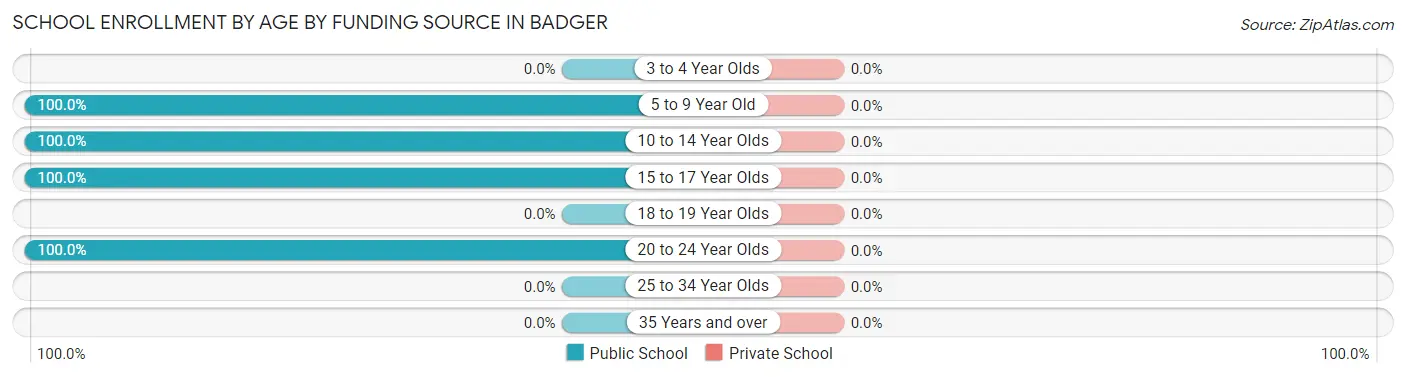
| Age Bracket | Public School | Private School |
| 3 to 4 Year Olds | 0 (0.0%) | 0 (0.0%) |
| 5 to 9 Year Old | 29 (100.0%) | 0 (0.0%) |
| 10 to 14 Year Olds | 51 (100.0%) | 0 (0.0%) |
| 15 to 17 Year Olds | 35 (100.0%) | 0 (0.0%) |
| 18 to 19 Year Olds | 0 (0.0%) | 0 (0.0%) |
| 20 to 24 Year Olds | 7 (100.0%) | 0 (0.0%) |
| 25 to 34 Year Olds | 0 (0.0%) | 0 (0.0%) |
| 35 Years and over | 0 (0.0%) | 0 (0.0%) |
| Total | 122 (100.0%) | 0 (0.0%) |
Educational Attainment by Field of Study in Badger
Education (14 | 38.9%), liberal arts & history (6 | 16.7%), engineering (5 | 13.9%), business (5 | 13.9%), and arts & humanities (4 | 11.1%) are the most common fields of study among 36 individuals in Badger who have obtained a bachelor's degree or higher.
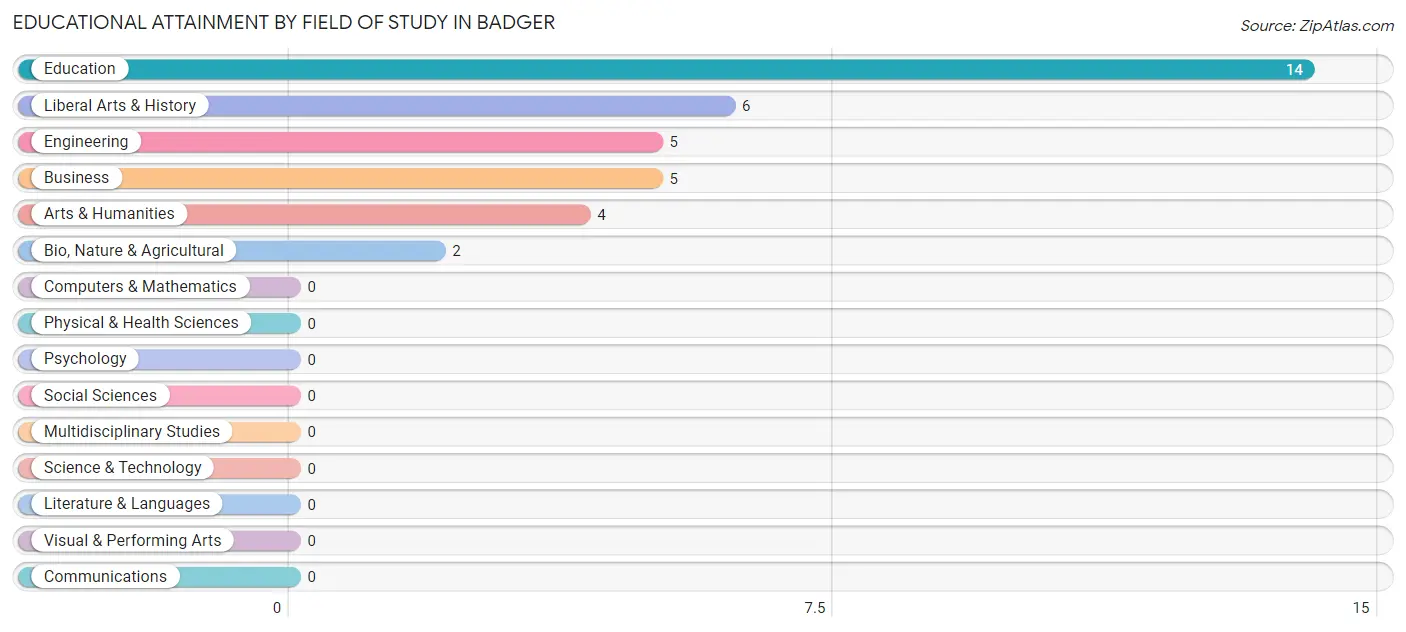
| Field of Study | # Graduates | % Graduates |
| Computers & Mathematics | 0 | 0.0% |
| Bio, Nature & Agricultural | 2 | 5.6% |
| Physical & Health Sciences | 0 | 0.0% |
| Psychology | 0 | 0.0% |
| Social Sciences | 0 | 0.0% |
| Engineering | 5 | 13.9% |
| Multidisciplinary Studies | 0 | 0.0% |
| Science & Technology | 0 | 0.0% |
| Business | 5 | 13.9% |
| Education | 14 | 38.9% |
| Literature & Languages | 0 | 0.0% |
| Liberal Arts & History | 6 | 16.7% |
| Visual & Performing Arts | 0 | 0.0% |
| Communications | 0 | 0.0% |
| Arts & Humanities | 4 | 11.1% |
| Total | 36 | 100.0% |
Transportation & Commute in Badger
Vehicle Availability by Sex in Badger
The most prevalent vehicle ownership categories in Badger are males with 2 vehicles (49, accounting for 35.5%) and females with 2 vehicles (28, making up 59.8%).
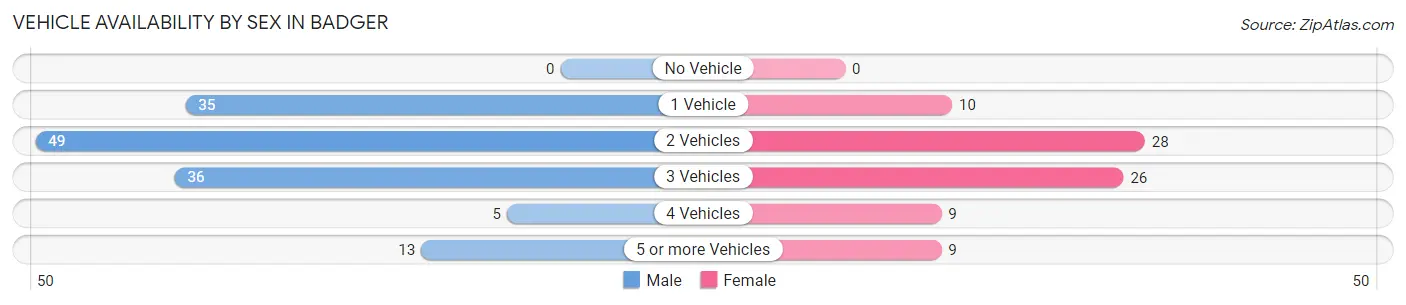
| Vehicles Available | Male | Female |
| No Vehicle | 0 (0.0%) | 0 (0.0%) |
| 1 Vehicle | 35 (25.4%) | 10 (12.2%) |
| 2 Vehicles | 49 (35.5%) | 28 (34.2%) |
| 3 Vehicles | 36 (26.1%) | 26 (31.7%) |
| 4 Vehicles | 5 (3.6%) | 9 (11.0%) |
| 5 or more Vehicles | 13 (9.4%) | 9 (11.0%) |
| Total | 138 (100.0%) | 82 (100.0%) |
Commute Time in Badger
The most frequently occuring commute durations in Badger are 15 to 19 minutes (94 commuters, 44.3%), 20 to 24 minutes (39 commuters, 18.4%), and 10 to 14 minutes (17 commuters, 8.0%).
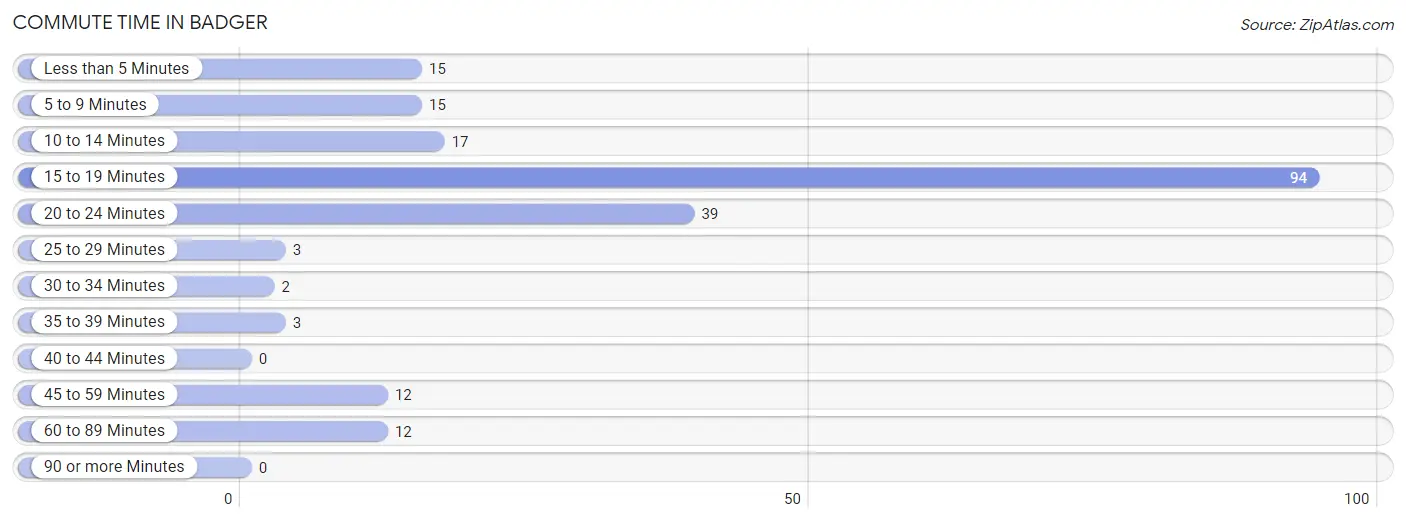
| Commute Time | # Commuters | % Commuters |
| Less than 5 Minutes | 15 | 7.1% |
| 5 to 9 Minutes | 15 | 7.1% |
| 10 to 14 Minutes | 17 | 8.0% |
| 15 to 19 Minutes | 94 | 44.3% |
| 20 to 24 Minutes | 39 | 18.4% |
| 25 to 29 Minutes | 3 | 1.4% |
| 30 to 34 Minutes | 2 | 0.9% |
| 35 to 39 Minutes | 3 | 1.4% |
| 40 to 44 Minutes | 0 | 0.0% |
| 45 to 59 Minutes | 12 | 5.7% |
| 60 to 89 Minutes | 12 | 5.7% |
| 90 or more Minutes | 0 | 0.0% |
Commute Time by Sex in Badger
The most common commute times in Badger are 15 to 19 minutes (67 commuters, 49.3%) for males and 15 to 19 minutes (27 commuters, 35.5%) for females.
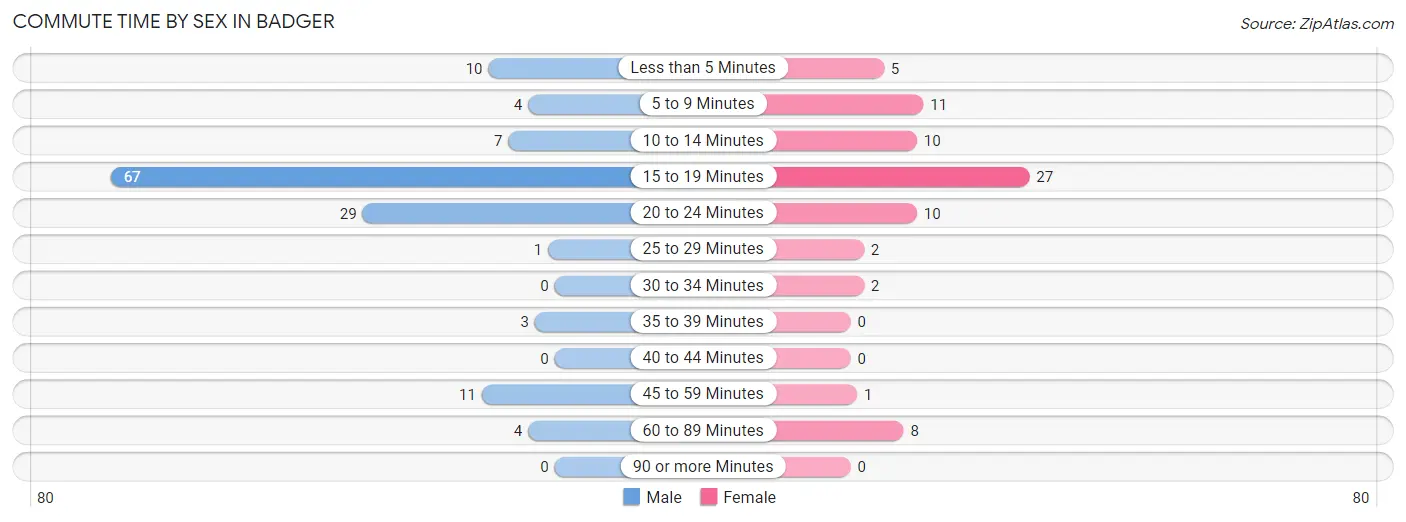
| Commute Time | Male | Female |
| Less than 5 Minutes | 10 (7.3%) | 5 (6.6%) |
| 5 to 9 Minutes | 4 (2.9%) | 11 (14.5%) |
| 10 to 14 Minutes | 7 (5.1%) | 10 (13.2%) |
| 15 to 19 Minutes | 67 (49.3%) | 27 (35.5%) |
| 20 to 24 Minutes | 29 (21.3%) | 10 (13.2%) |
| 25 to 29 Minutes | 1 (0.7%) | 2 (2.6%) |
| 30 to 34 Minutes | 0 (0.0%) | 2 (2.6%) |
| 35 to 39 Minutes | 3 (2.2%) | 0 (0.0%) |
| 40 to 44 Minutes | 0 (0.0%) | 0 (0.0%) |
| 45 to 59 Minutes | 11 (8.1%) | 1 (1.3%) |
| 60 to 89 Minutes | 4 (2.9%) | 8 (10.5%) |
| 90 or more Minutes | 0 (0.0%) | 0 (0.0%) |
Time of Departure to Work by Sex in Badger
The most frequent times of departure to work in Badger are 5:30 AM to 5:59 AM (29, 21.3%) for males and 7:30 AM to 7:59 AM (17, 22.4%) for females.
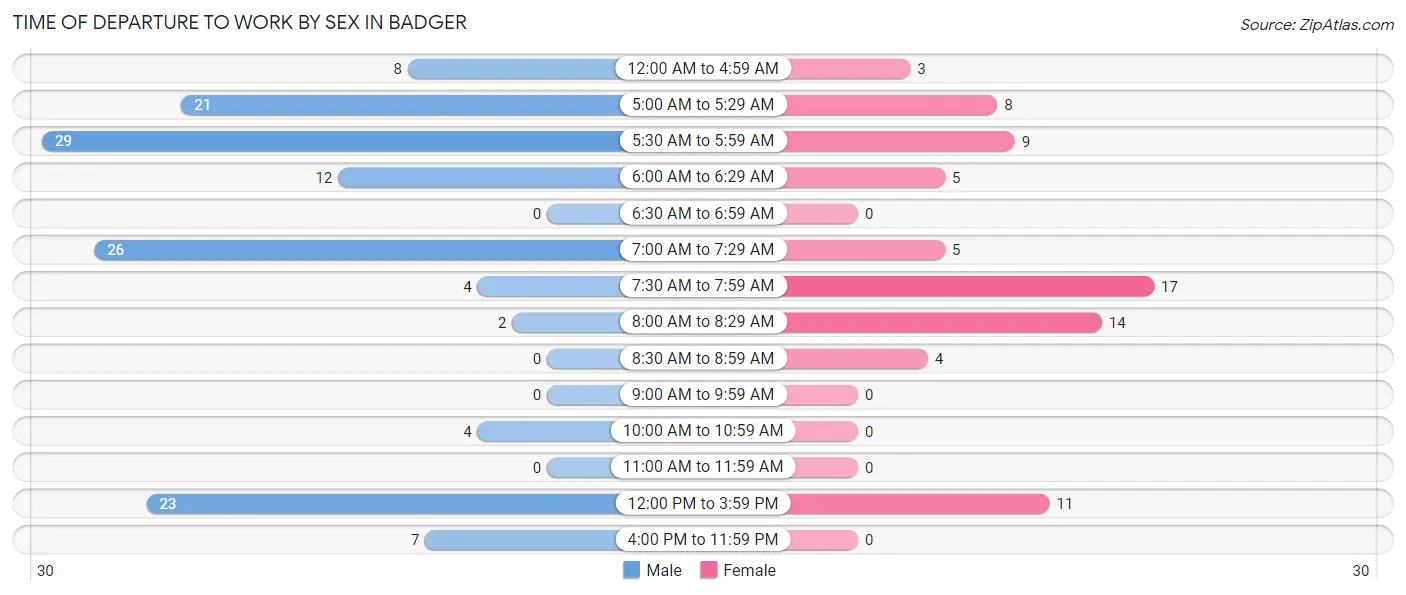
| Time of Departure | Male | Female |
| 12:00 AM to 4:59 AM | 8 (5.9%) | 3 (4.0%) |
| 5:00 AM to 5:29 AM | 21 (15.4%) | 8 (10.5%) |
| 5:30 AM to 5:59 AM | 29 (21.3%) | 9 (11.8%) |
| 6:00 AM to 6:29 AM | 12 (8.8%) | 5 (6.6%) |
| 6:30 AM to 6:59 AM | 0 (0.0%) | 0 (0.0%) |
| 7:00 AM to 7:29 AM | 26 (19.1%) | 5 (6.6%) |
| 7:30 AM to 7:59 AM | 4 (2.9%) | 17 (22.4%) |
| 8:00 AM to 8:29 AM | 2 (1.5%) | 14 (18.4%) |
| 8:30 AM to 8:59 AM | 0 (0.0%) | 4 (5.3%) |
| 9:00 AM to 9:59 AM | 0 (0.0%) | 0 (0.0%) |
| 10:00 AM to 10:59 AM | 4 (2.9%) | 0 (0.0%) |
| 11:00 AM to 11:59 AM | 0 (0.0%) | 0 (0.0%) |
| 12:00 PM to 3:59 PM | 23 (16.9%) | 11 (14.5%) |
| 4:00 PM to 11:59 PM | 7 (5.1%) | 0 (0.0%) |
| Total | 136 (100.0%) | 76 (100.0%) |
Housing Occupancy in Badger
Occupancy by Ownership in Badger
Of the total 162 dwellings in Badger, owner-occupied units account for 115 (71.0%), while renter-occupied units make up 47 (29.0%).
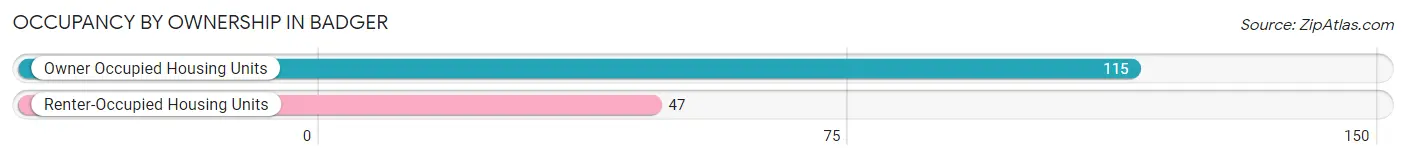
| Occupancy | # Housing Units | % Housing Units |
| Owner Occupied Housing Units | 115 | 71.0% |
| Renter-Occupied Housing Units | 47 | 29.0% |
| Total Occupied Housing Units | 162 | 100.0% |
Occupancy by Household Size in Badger
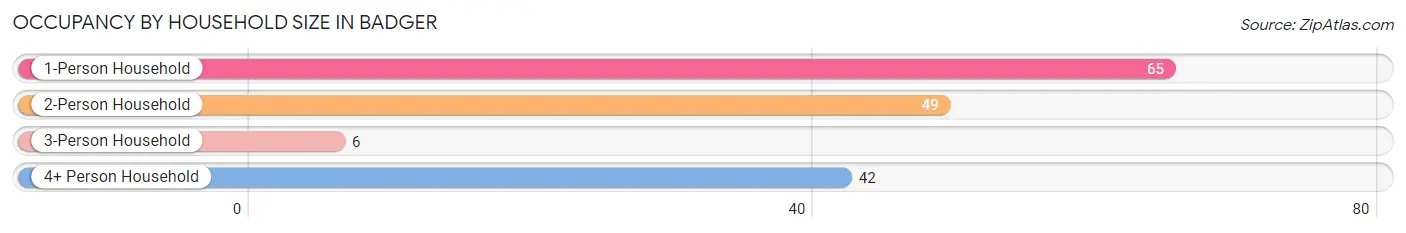
| Household Size | # Housing Units | % Housing Units |
| 1-Person Household | 65 | 40.1% |
| 2-Person Household | 49 | 30.2% |
| 3-Person Household | 6 | 3.7% |
| 4+ Person Household | 42 | 25.9% |
| Total Housing Units | 162 | 100.0% |
Occupancy by Ownership by Household Size in Badger
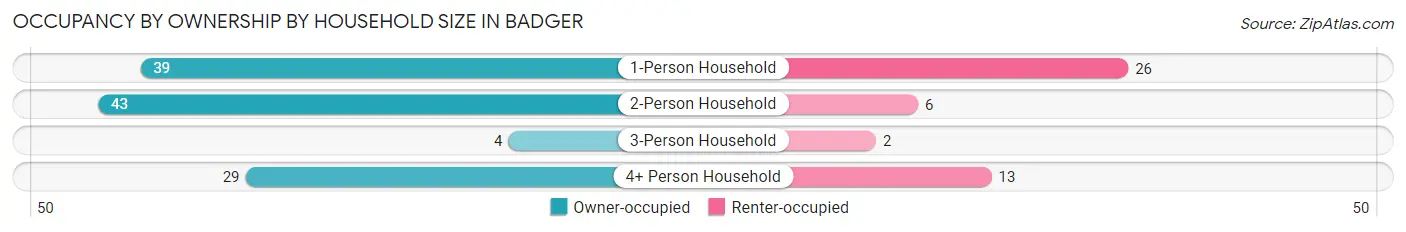
| Household Size | Owner-occupied | Renter-occupied |
| 1-Person Household | 39 (60.0%) | 26 (40.0%) |
| 2-Person Household | 43 (87.8%) | 6 (12.2%) |
| 3-Person Household | 4 (66.7%) | 2 (33.3%) |
| 4+ Person Household | 29 (69.1%) | 13 (30.9%) |
| Total Housing Units | 115 (71.0%) | 47 (29.0%) |
Occupancy by Educational Attainment in Badger
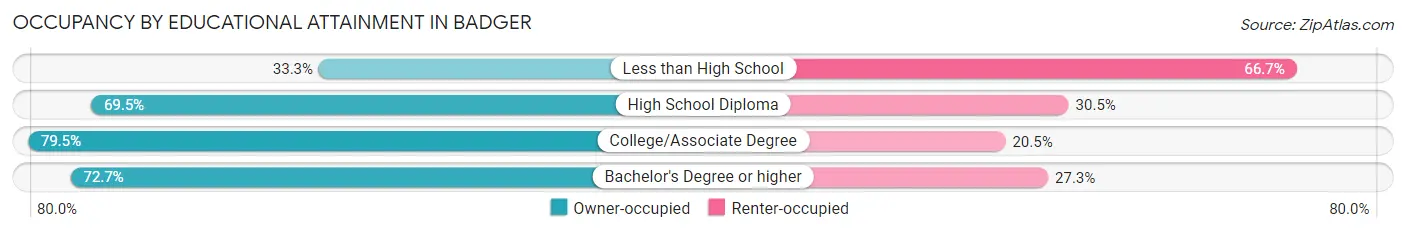
| Household Size | Owner-occupied | Renter-occupied |
| Less than High School | 2 (33.3%) | 4 (66.7%) |
| High School Diploma | 66 (69.5%) | 29 (30.5%) |
| College/Associate Degree | 31 (79.5%) | 8 (20.5%) |
| Bachelor's Degree or higher | 16 (72.7%) | 6 (27.3%) |
Occupancy by Age of Householder in Badger
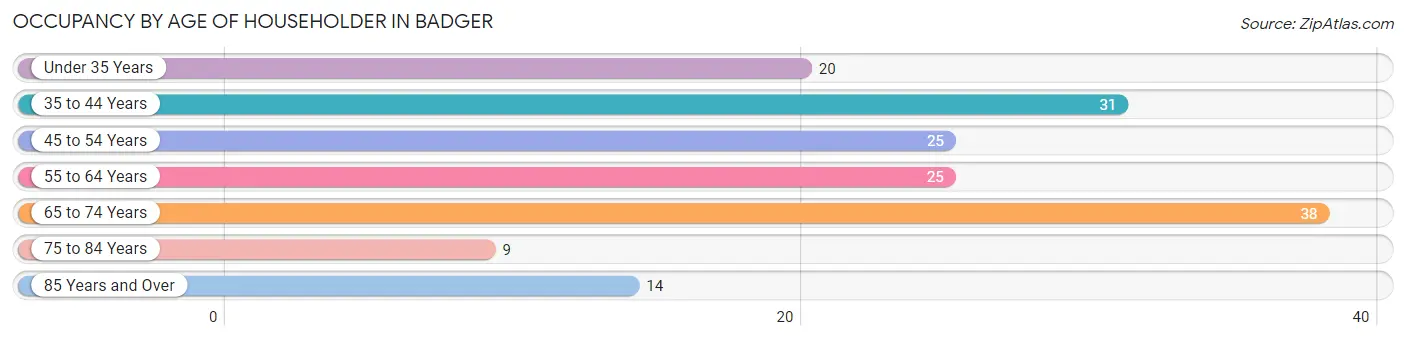
| Age Bracket | # Households | % Households |
| Under 35 Years | 20 | 12.3% |
| 35 to 44 Years | 31 | 19.1% |
| 45 to 54 Years | 25 | 15.4% |
| 55 to 64 Years | 25 | 15.4% |
| 65 to 74 Years | 38 | 23.5% |
| 75 to 84 Years | 9 | 5.6% |
| 85 Years and Over | 14 | 8.6% |
| Total | 162 | 100.0% |
Housing Finances in Badger
Median Income by Occupancy in Badger
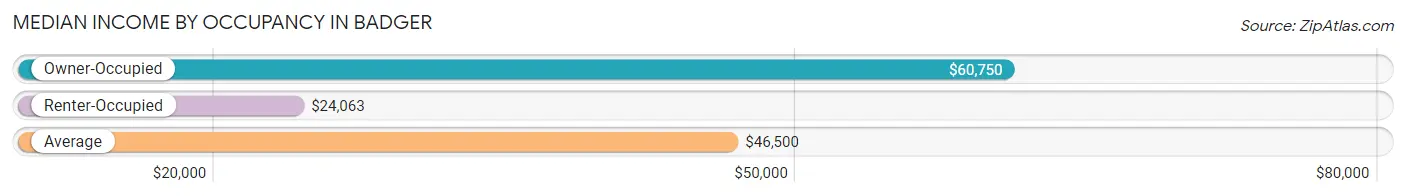
| Occupancy Type | # Households | Median Income |
| Owner-Occupied | 115 (71.0%) | $60,750 |
| Renter-Occupied | 47 (29.0%) | $24,063 |
| Average | 162 (100.0%) | $46,500 |
Occupancy by Householder Income Bracket in Badger
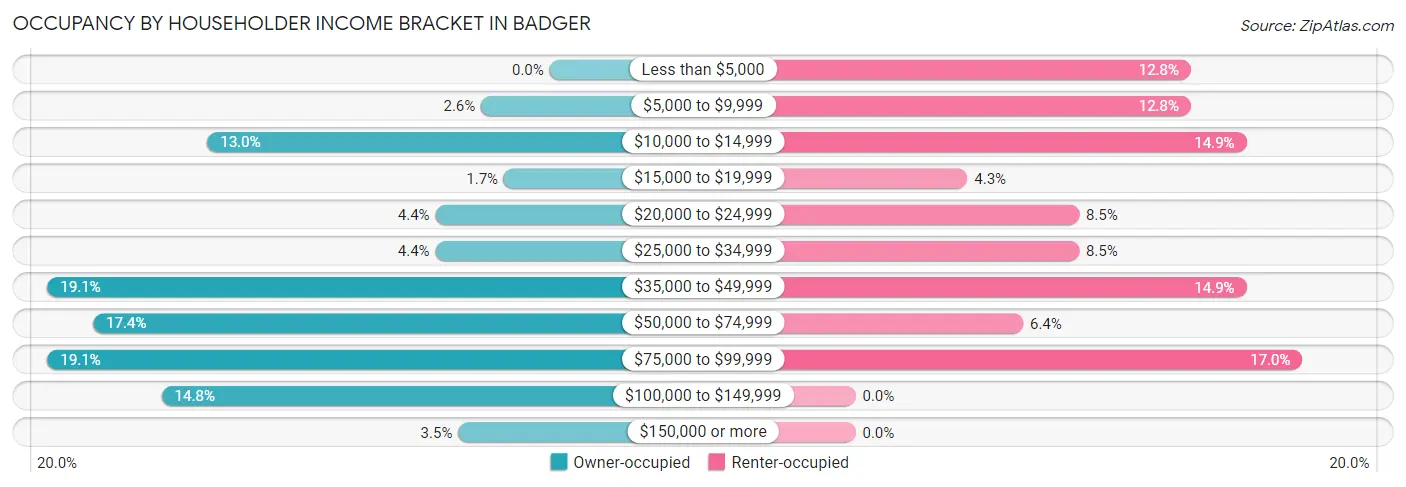
| Income Bracket | Owner-occupied | Renter-occupied |
| Less than $5,000 | 0 (0.0%) | 6 (12.8%) |
| $5,000 to $9,999 | 3 (2.6%) | 6 (12.8%) |
| $10,000 to $14,999 | 15 (13.0%) | 7 (14.9%) |
| $15,000 to $19,999 | 2 (1.7%) | 2 (4.3%) |
| $20,000 to $24,999 | 5 (4.3%) | 4 (8.5%) |
| $25,000 to $34,999 | 5 (4.3%) | 4 (8.5%) |
| $35,000 to $49,999 | 22 (19.1%) | 7 (14.9%) |
| $50,000 to $74,999 | 20 (17.4%) | 3 (6.4%) |
| $75,000 to $99,999 | 22 (19.1%) | 8 (17.0%) |
| $100,000 to $149,999 | 17 (14.8%) | 0 (0.0%) |
| $150,000 or more | 4 (3.5%) | 0 (0.0%) |
| Total | 115 (100.0%) | 47 (100.0%) |
Monthly Housing Cost Tiers in Badger
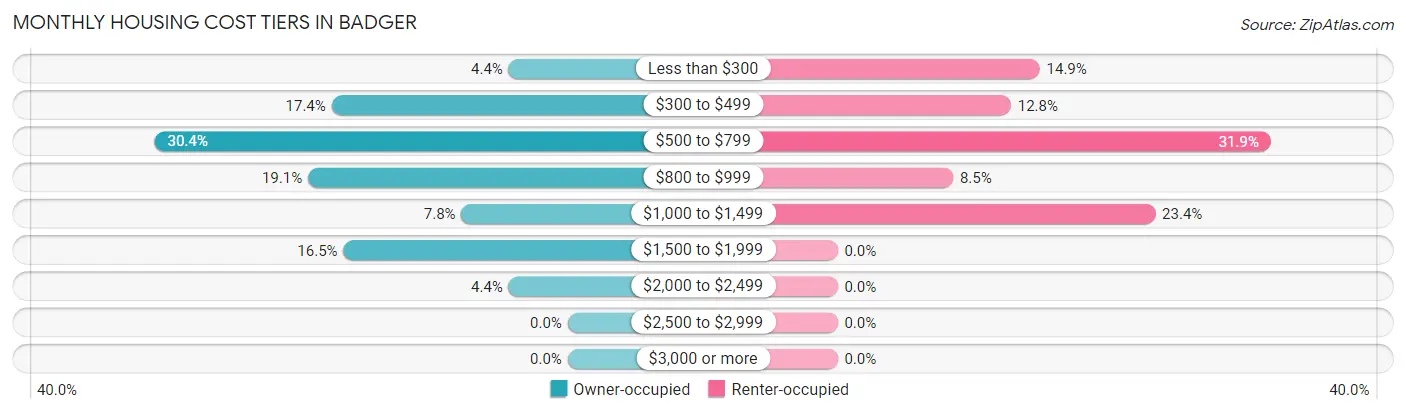
| Monthly Cost | Owner-occupied | Renter-occupied |
| Less than $300 | 5 (4.3%) | 7 (14.9%) |
| $300 to $499 | 20 (17.4%) | 6 (12.8%) |
| $500 to $799 | 35 (30.4%) | 15 (31.9%) |
| $800 to $999 | 22 (19.1%) | 4 (8.5%) |
| $1,000 to $1,499 | 9 (7.8%) | 11 (23.4%) |
| $1,500 to $1,999 | 19 (16.5%) | 0 (0.0%) |
| $2,000 to $2,499 | 5 (4.3%) | 0 (0.0%) |
| $2,500 to $2,999 | 0 (0.0%) | 0 (0.0%) |
| $3,000 or more | 0 (0.0%) | 0 (0.0%) |
| Total | 115 (100.0%) | 47 (100.0%) |
Physical Housing Characteristics in Badger
Housing Structures in Badger
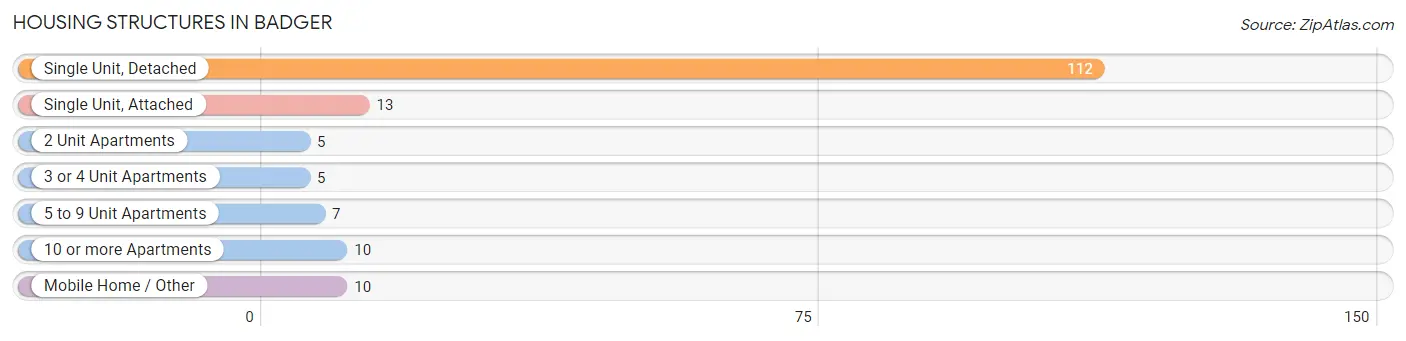
| Structure Type | # Housing Units | % Housing Units |
| Single Unit, Detached | 112 | 69.1% |
| Single Unit, Attached | 13 | 8.0% |
| 2 Unit Apartments | 5 | 3.1% |
| 3 or 4 Unit Apartments | 5 | 3.1% |
| 5 to 9 Unit Apartments | 7 | 4.3% |
| 10 or more Apartments | 10 | 6.2% |
| Mobile Home / Other | 10 | 6.2% |
| Total | 162 | 100.0% |
Housing Structures by Occupancy in Badger
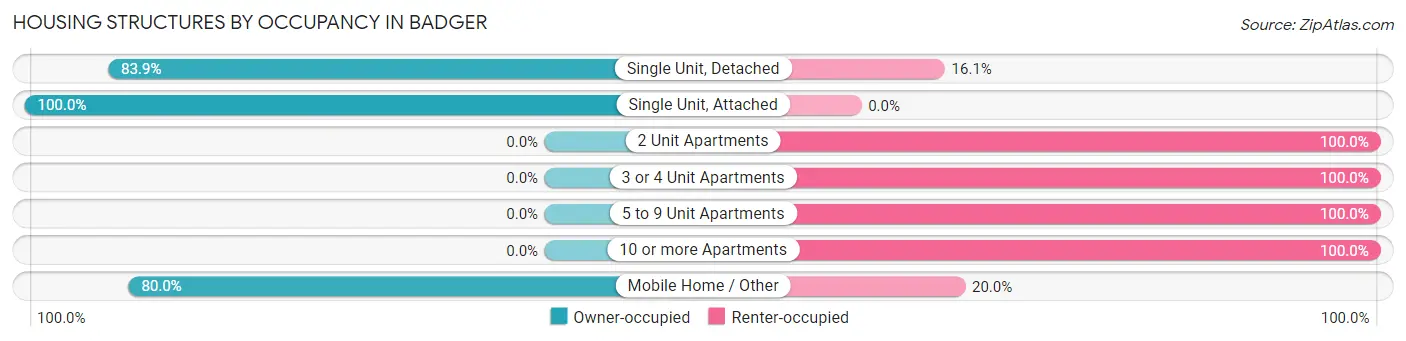
| Structure Type | Owner-occupied | Renter-occupied |
| Single Unit, Detached | 94 (83.9%) | 18 (16.1%) |
| Single Unit, Attached | 13 (100.0%) | 0 (0.0%) |
| 2 Unit Apartments | 0 (0.0%) | 5 (100.0%) |
| 3 or 4 Unit Apartments | 0 (0.0%) | 5 (100.0%) |
| 5 to 9 Unit Apartments | 0 (0.0%) | 7 (100.0%) |
| 10 or more Apartments | 0 (0.0%) | 10 (100.0%) |
| Mobile Home / Other | 8 (80.0%) | 2 (20.0%) |
| Total | 115 (71.0%) | 47 (29.0%) |
Housing Structures by Number of Rooms in Badger
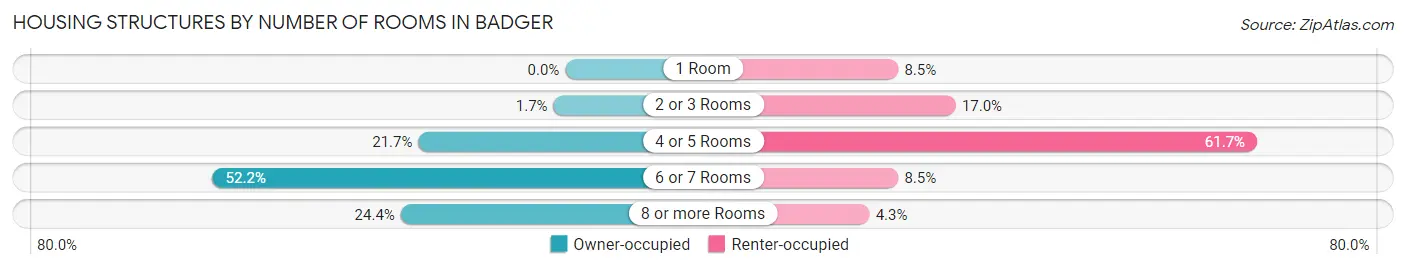
| Number of Rooms | Owner-occupied | Renter-occupied |
| 1 Room | 0 (0.0%) | 4 (8.5%) |
| 2 or 3 Rooms | 2 (1.7%) | 8 (17.0%) |
| 4 or 5 Rooms | 25 (21.7%) | 29 (61.7%) |
| 6 or 7 Rooms | 60 (52.2%) | 4 (8.5%) |
| 8 or more Rooms | 28 (24.3%) | 2 (4.3%) |
| Total | 115 (100.0%) | 47 (100.0%) |
Housing Structure by Heating Type in Badger
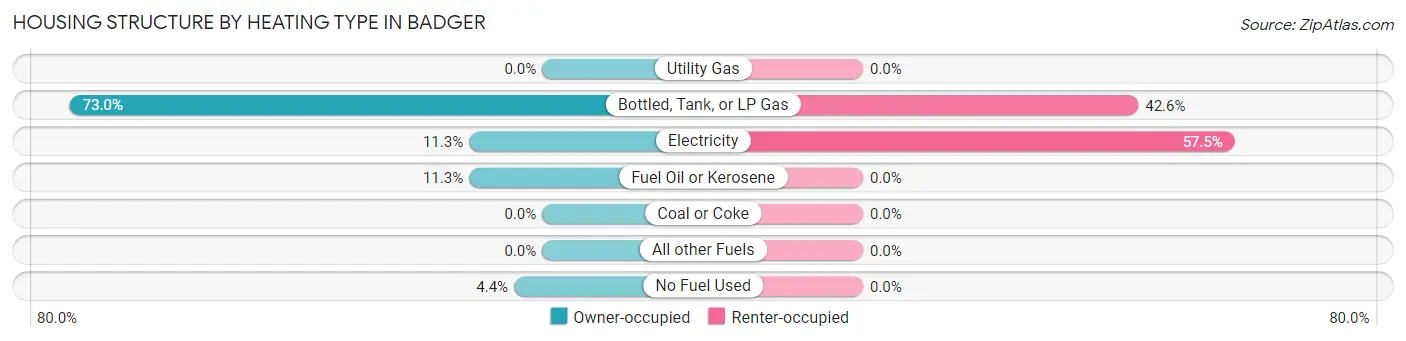
| Heating Type | Owner-occupied | Renter-occupied |
| Utility Gas | 0 (0.0%) | 0 (0.0%) |
| Bottled, Tank, or LP Gas | 84 (73.0%) | 20 (42.5%) |
| Electricity | 13 (11.3%) | 27 (57.5%) |
| Fuel Oil or Kerosene | 13 (11.3%) | 0 (0.0%) |
| Coal or Coke | 0 (0.0%) | 0 (0.0%) |
| All other Fuels | 0 (0.0%) | 0 (0.0%) |
| No Fuel Used | 5 (4.3%) | 0 (0.0%) |
| Total | 115 (100.0%) | 47 (100.0%) |
Household Vehicle Usage in Badger
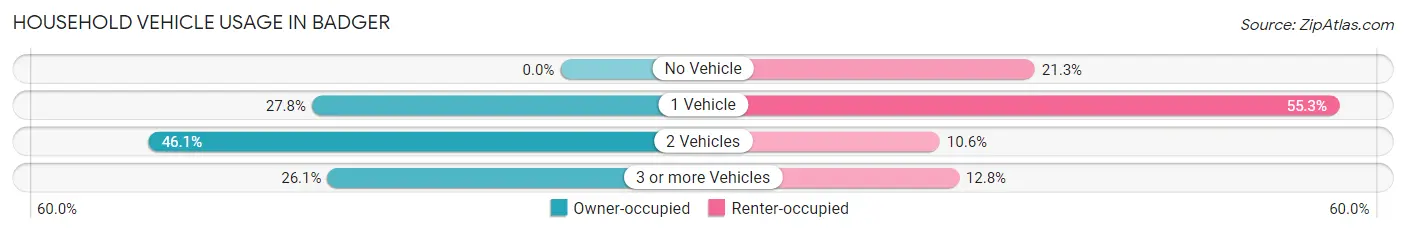
| Vehicles per Household | Owner-occupied | Renter-occupied |
| No Vehicle | 0 (0.0%) | 10 (21.3%) |
| 1 Vehicle | 32 (27.8%) | 26 (55.3%) |
| 2 Vehicles | 53 (46.1%) | 5 (10.6%) |
| 3 or more Vehicles | 30 (26.1%) | 6 (12.8%) |
| Total | 115 (100.0%) | 47 (100.0%) |
Real Estate & Mortgages in Badger
Real Estate and Mortgage Overview in Badger
| Characteristic | Without Mortgage | With Mortgage |
| Housing Units | 49 | 66 |
| Median Property Value | $78,100 | $97,500 |
| Median Household Income | $37,813 | $4 |
| Monthly Housing Costs | $497 | $0 |
| Real Estate Taxes | $971 | $0 |
Property Value by Mortgage Status in Badger
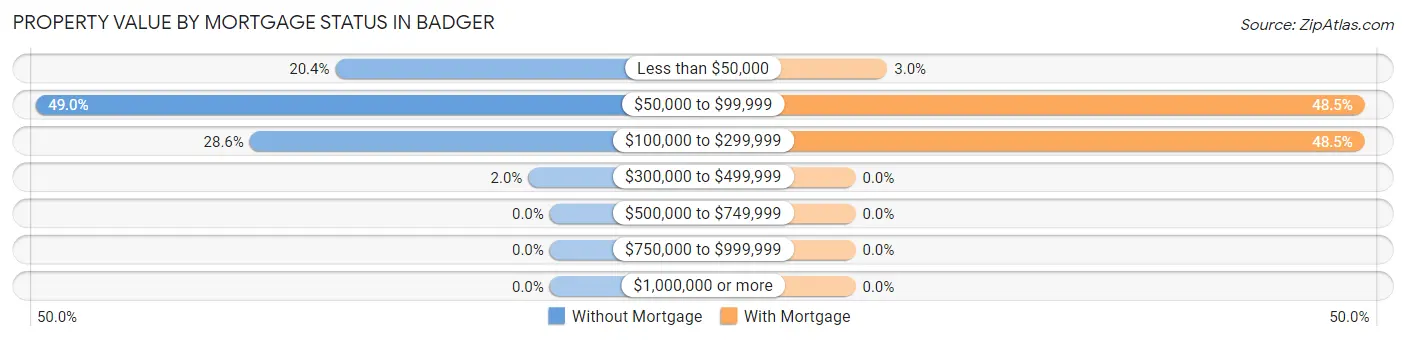
| Property Value | Without Mortgage | With Mortgage |
| Less than $50,000 | 10 (20.4%) | 2 (3.0%) |
| $50,000 to $99,999 | 24 (49.0%) | 32 (48.5%) |
| $100,000 to $299,999 | 14 (28.6%) | 32 (48.5%) |
| $300,000 to $499,999 | 1 (2.0%) | 0 (0.0%) |
| $500,000 to $749,999 | 0 (0.0%) | 0 (0.0%) |
| $750,000 to $999,999 | 0 (0.0%) | 0 (0.0%) |
| $1,000,000 or more | 0 (0.0%) | 0 (0.0%) |
| Total | 49 (100.0%) | 66 (100.0%) |
Household Income by Mortgage Status in Badger
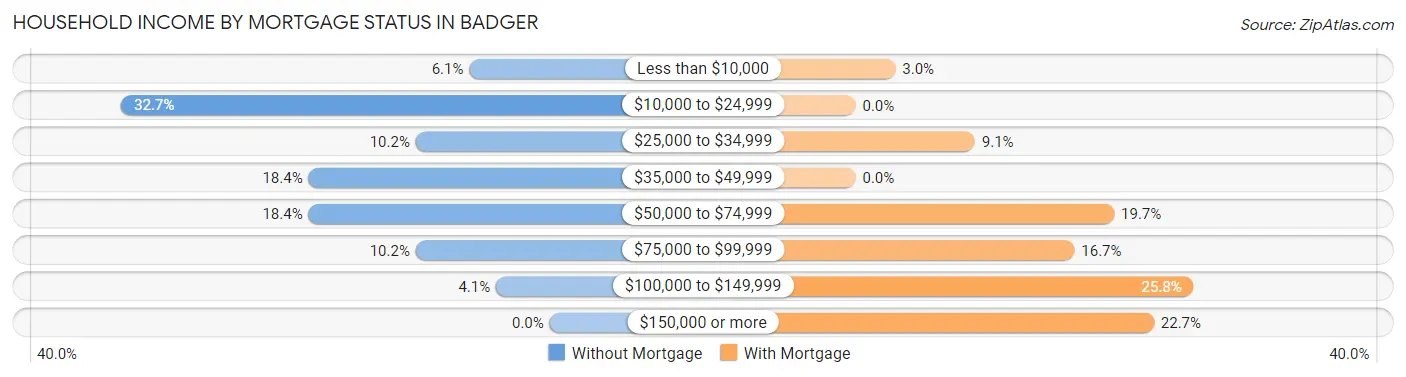
| Household Income | Without Mortgage | With Mortgage |
| Less than $10,000 | 3 (6.1%) | 2 (3.0%) |
| $10,000 to $24,999 | 16 (32.7%) | 0 (0.0%) |
| $25,000 to $34,999 | 5 (10.2%) | 6 (9.1%) |
| $35,000 to $49,999 | 9 (18.4%) | 0 (0.0%) |
| $50,000 to $74,999 | 9 (18.4%) | 13 (19.7%) |
| $75,000 to $99,999 | 5 (10.2%) | 11 (16.7%) |
| $100,000 to $149,999 | 2 (4.1%) | 17 (25.8%) |
| $150,000 or more | 0 (0.0%) | 15 (22.7%) |
| Total | 49 (100.0%) | 66 (100.0%) |
Property Value to Household Income Ratio in Badger
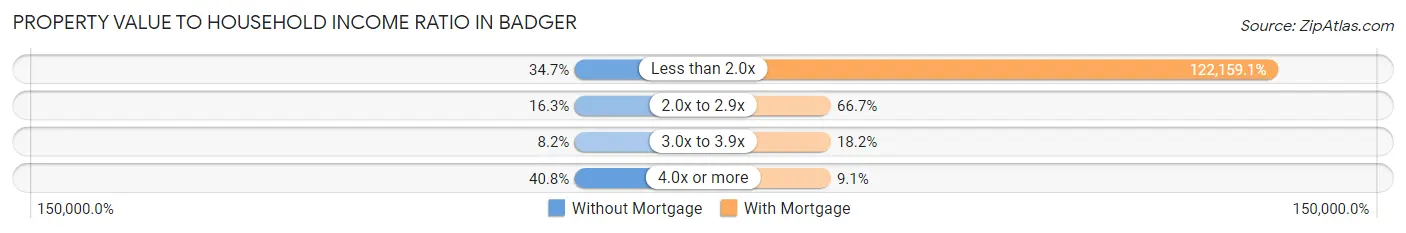
| Value-to-Income Ratio | Without Mortgage | With Mortgage |
| Less than 2.0x | 17 (34.7%) | 80,625 (122,159.1%) |
| 2.0x to 2.9x | 8 (16.3%) | 44 (66.7%) |
| 3.0x to 3.9x | 4 (8.2%) | 12 (18.2%) |
| 4.0x or more | 20 (40.8%) | 6 (9.1%) |
| Total | 49 (100.0%) | 66 (100.0%) |
Real Estate Taxes by Mortgage Status in Badger
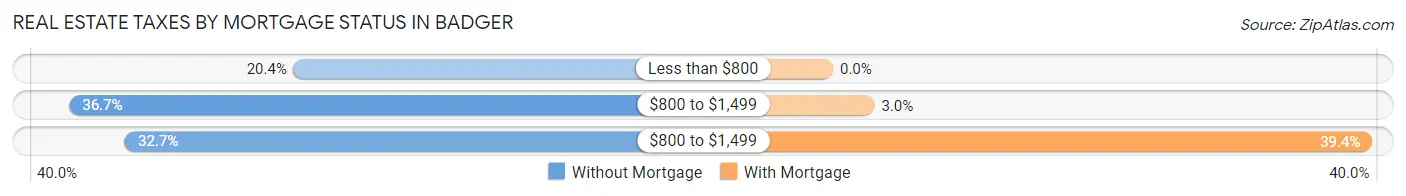
| Property Taxes | Without Mortgage | With Mortgage |
| Less than $800 | 10 (20.4%) | 0 (0.0%) |
| $800 to $1,499 | 18 (36.7%) | 2 (3.0%) |
| $800 to $1,499 | 16 (32.7%) | 26 (39.4%) |
| Total | 49 (100.0%) | 66 (100.0%) |
Health & Disability in Badger
Health Insurance Coverage by Age in Badger
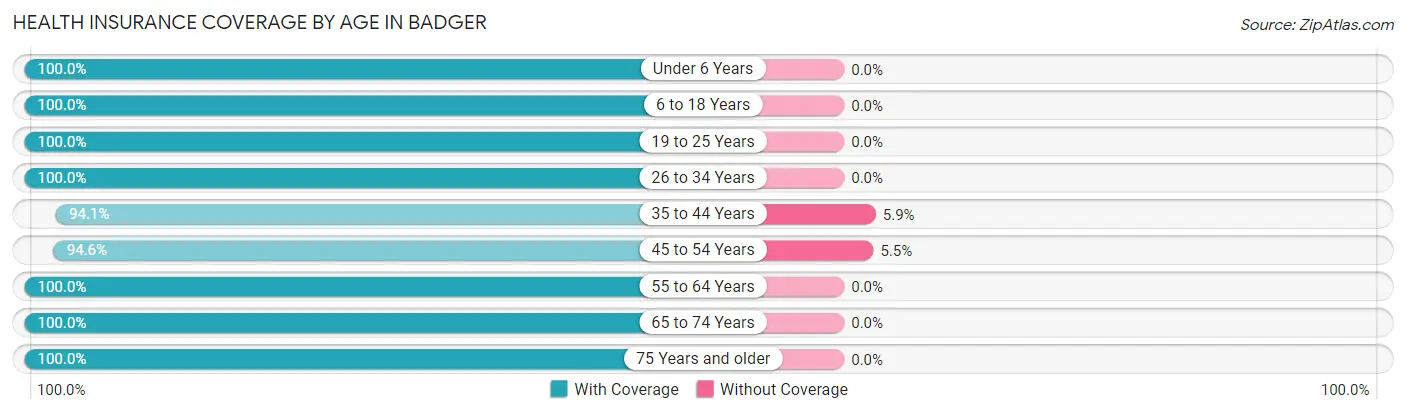
| Age Bracket | With Coverage | Without Coverage |
| Under 6 Years | 18 (100.0%) | 0 (0.0%) |
| 6 to 18 Years | 120 (100.0%) | 0 (0.0%) |
| 19 to 25 Years | 25 (100.0%) | 0 (0.0%) |
| 26 to 34 Years | 35 (100.0%) | 0 (0.0%) |
| 35 to 44 Years | 48 (94.1%) | 3 (5.9%) |
| 45 to 54 Years | 52 (94.6%) | 3 (5.4%) |
| 55 to 64 Years | 47 (100.0%) | 0 (0.0%) |
| 65 to 74 Years | 52 (100.0%) | 0 (0.0%) |
| 75 Years and older | 31 (100.0%) | 0 (0.0%) |
| Total | 428 (98.6%) | 6 (1.4%) |
Health Insurance Coverage by Citizenship Status in Badger
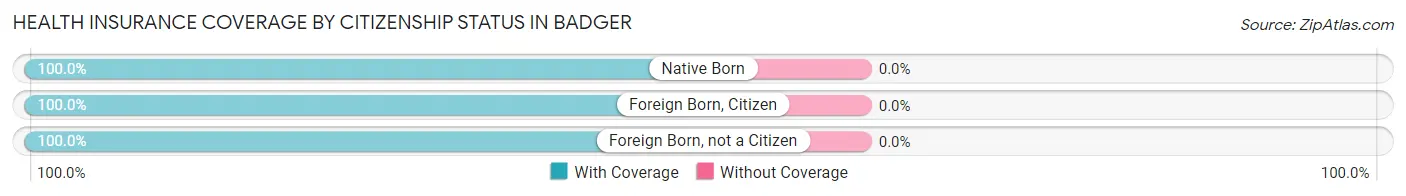
| Citizenship Status | With Coverage | Without Coverage |
| Native Born | 18 (100.0%) | 0 (0.0%) |
| Foreign Born, Citizen | 120 (100.0%) | 0 (0.0%) |
| Foreign Born, not a Citizen | 25 (100.0%) | 0 (0.0%) |
Health Insurance Coverage by Household Income in Badger
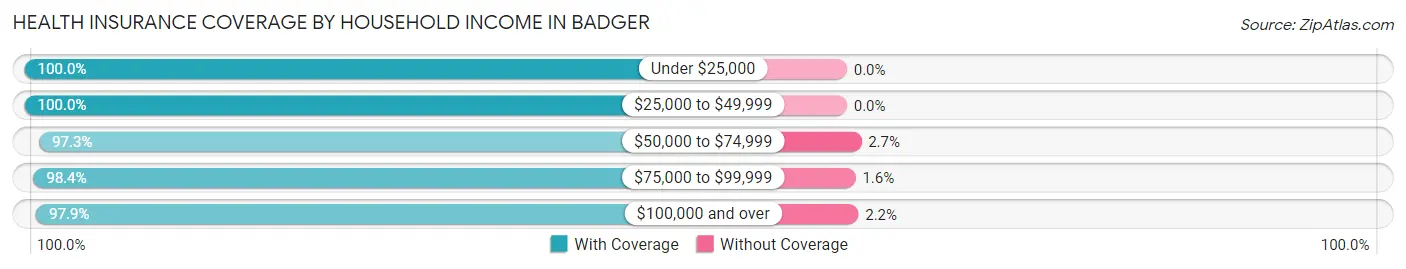
| Household Income | With Coverage | Without Coverage |
| Under $25,000 | 91 (100.0%) | 0 (0.0%) |
| $25,000 to $49,999 | 53 (100.0%) | 0 (0.0%) |
| $50,000 to $74,999 | 72 (97.3%) | 2 (2.7%) |
| $75,000 to $99,999 | 121 (98.4%) | 2 (1.6%) |
| $100,000 and over | 91 (97.9%) | 2 (2.1%) |
Public vs Private Health Insurance Coverage by Age in Badger
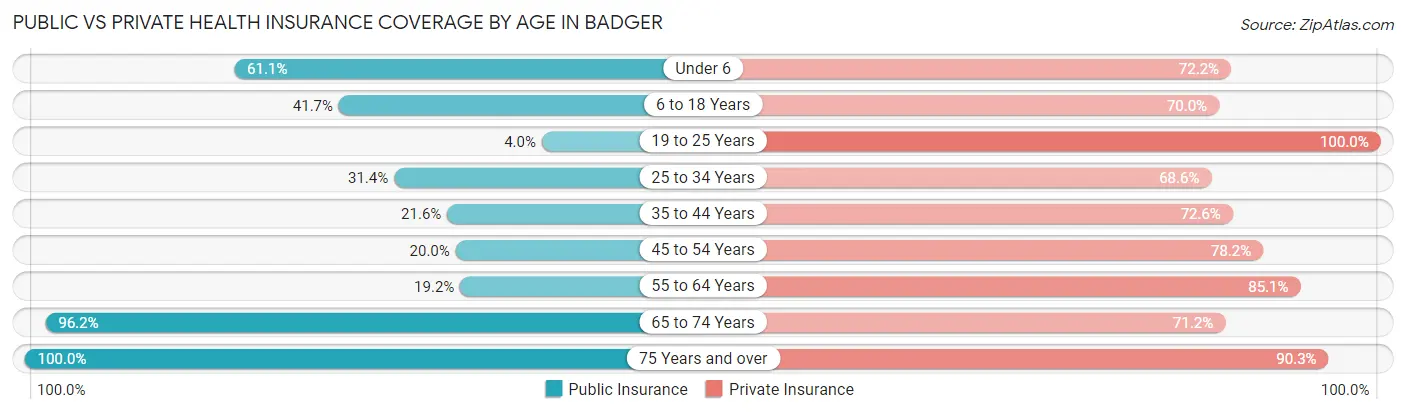
| Age Bracket | Public Insurance | Private Insurance |
| Under 6 | 11 (61.1%) | 13 (72.2%) |
| 6 to 18 Years | 50 (41.7%) | 84 (70.0%) |
| 19 to 25 Years | 1 (4.0%) | 25 (100.0%) |
| 25 to 34 Years | 11 (31.4%) | 24 (68.6%) |
| 35 to 44 Years | 11 (21.6%) | 37 (72.6%) |
| 45 to 54 Years | 11 (20.0%) | 43 (78.2%) |
| 55 to 64 Years | 9 (19.2%) | 40 (85.1%) |
| 65 to 74 Years | 50 (96.2%) | 37 (71.2%) |
| 75 Years and over | 31 (100.0%) | 28 (90.3%) |
| Total | 185 (42.6%) | 331 (76.3%) |
Disability Status by Sex by Age in Badger
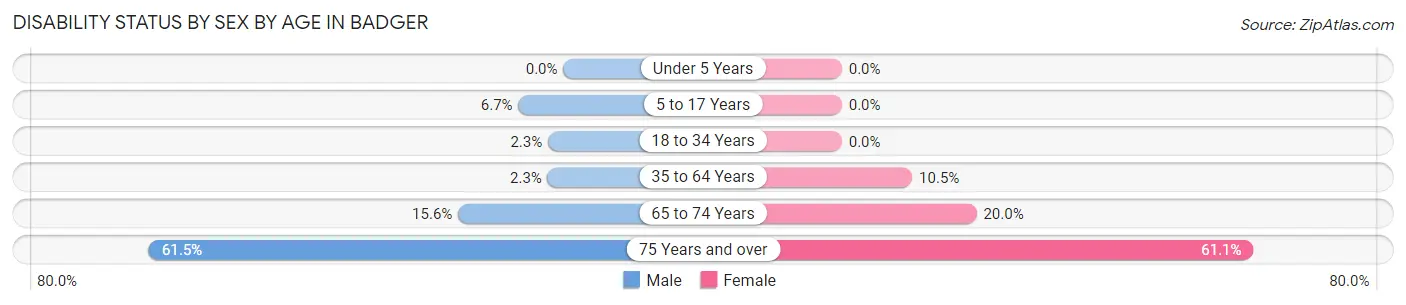
| Age Bracket | Male | Female |
| Under 5 Years | 0 (0.0%) | 0 (0.0%) |
| 5 to 17 Years | 5 (6.7%) | 0 (0.0%) |
| 18 to 34 Years | 1 (2.3%) | 0 (0.0%) |
| 35 to 64 Years | 2 (2.3%) | 7 (10.4%) |
| 65 to 74 Years | 5 (15.6%) | 4 (20.0%) |
| 75 Years and over | 8 (61.5%) | 11 (61.1%) |
Disability Class by Sex by Age in Badger
Disability Class: Hearing Difficulty
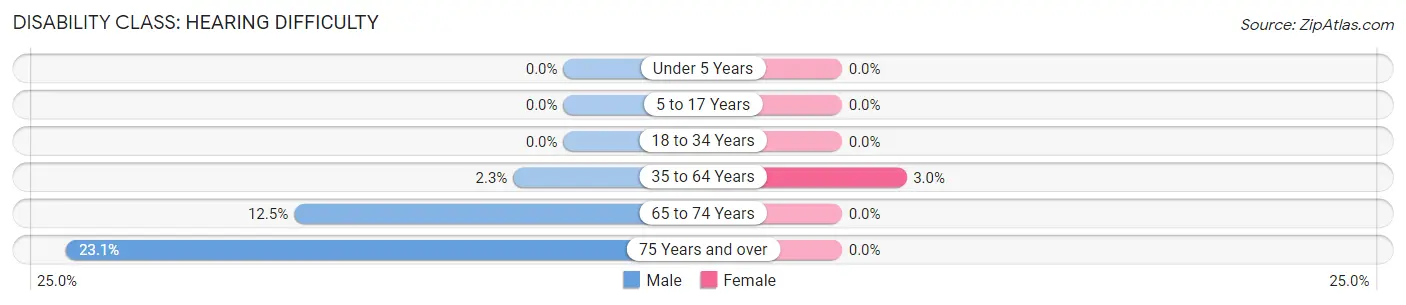
| Age Bracket | Male | Female |
| Under 5 Years | 0 (0.0%) | 0 (0.0%) |
| 5 to 17 Years | 0 (0.0%) | 0 (0.0%) |
| 18 to 34 Years | 0 (0.0%) | 0 (0.0%) |
| 35 to 64 Years | 2 (2.3%) | 2 (3.0%) |
| 65 to 74 Years | 4 (12.5%) | 0 (0.0%) |
| 75 Years and over | 3 (23.1%) | 0 (0.0%) |
Disability Class: Vision Difficulty
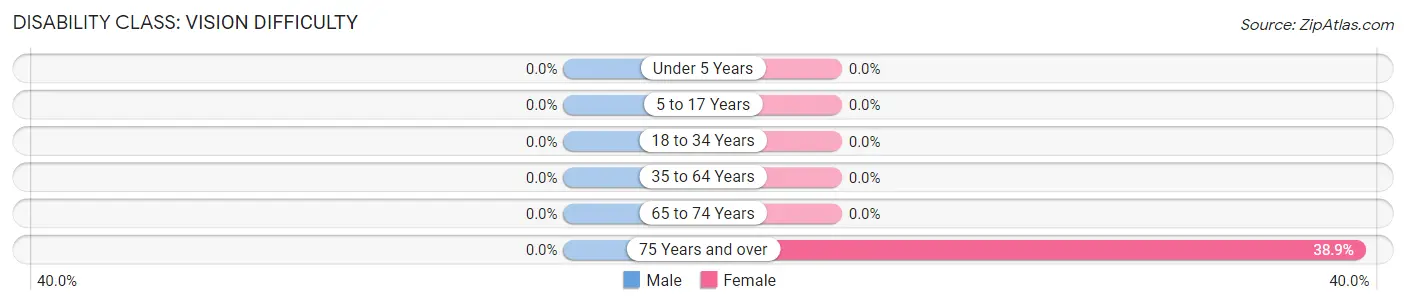
| Age Bracket | Male | Female |
| Under 5 Years | 0 (0.0%) | 0 (0.0%) |
| 5 to 17 Years | 0 (0.0%) | 0 (0.0%) |
| 18 to 34 Years | 0 (0.0%) | 0 (0.0%) |
| 35 to 64 Years | 0 (0.0%) | 0 (0.0%) |
| 65 to 74 Years | 0 (0.0%) | 0 (0.0%) |
| 75 Years and over | 0 (0.0%) | 7 (38.9%) |
Disability Class: Cognitive Difficulty
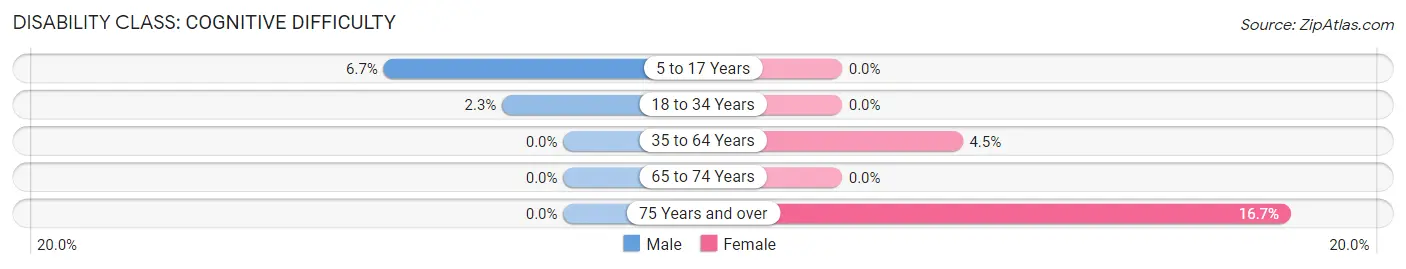
| Age Bracket | Male | Female |
| 5 to 17 Years | 5 (6.7%) | 0 (0.0%) |
| 18 to 34 Years | 1 (2.3%) | 0 (0.0%) |
| 35 to 64 Years | 0 (0.0%) | 3 (4.5%) |
| 65 to 74 Years | 0 (0.0%) | 0 (0.0%) |
| 75 Years and over | 0 (0.0%) | 3 (16.7%) |
Disability Class: Ambulatory Difficulty
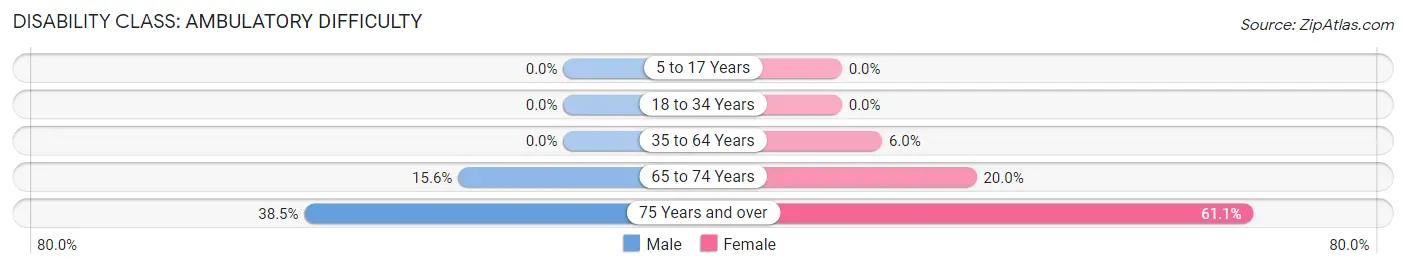
| Age Bracket | Male | Female |
| 5 to 17 Years | 0 (0.0%) | 0 (0.0%) |
| 18 to 34 Years | 0 (0.0%) | 0 (0.0%) |
| 35 to 64 Years | 0 (0.0%) | 4 (6.0%) |
| 65 to 74 Years | 5 (15.6%) | 4 (20.0%) |
| 75 Years and over | 5 (38.5%) | 11 (61.1%) |
Disability Class: Self-Care Difficulty
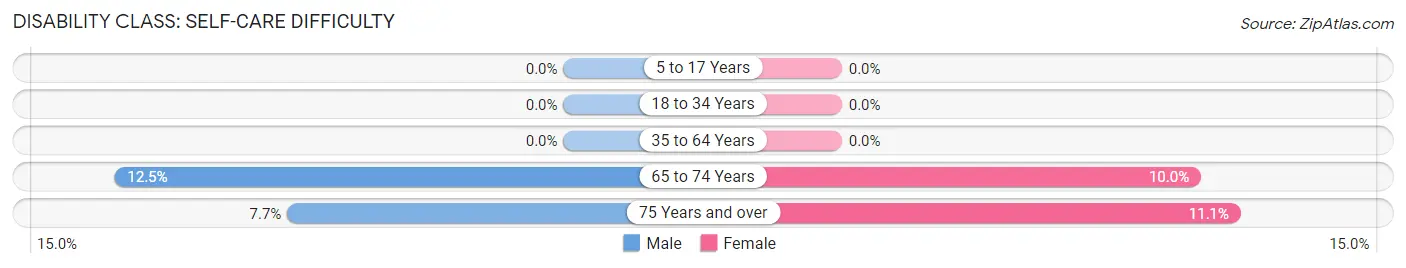
| Age Bracket | Male | Female |
| 5 to 17 Years | 0 (0.0%) | 0 (0.0%) |
| 18 to 34 Years | 0 (0.0%) | 0 (0.0%) |
| 35 to 64 Years | 0 (0.0%) | 0 (0.0%) |
| 65 to 74 Years | 4 (12.5%) | 2 (10.0%) |
| 75 Years and over | 1 (7.7%) | 2 (11.1%) |
Technology Access in Badger
Computing Device Access in Badger
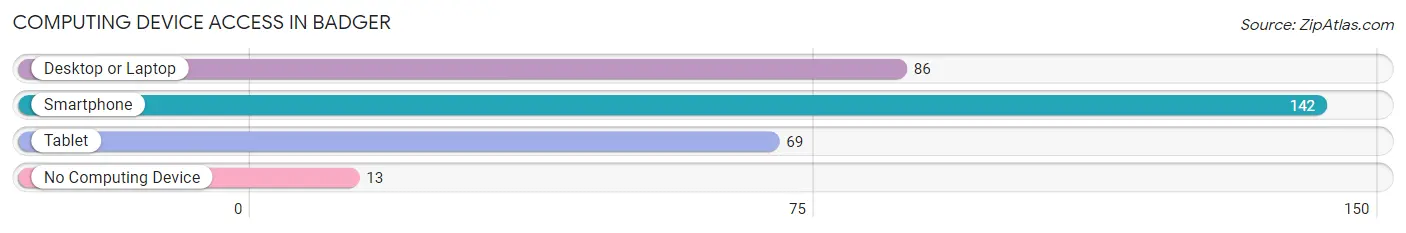
| Device Type | # Households | % Households |
| Desktop or Laptop | 86 | 53.1% |
| Smartphone | 142 | 87.6% |
| Tablet | 69 | 42.6% |
| No Computing Device | 13 | 8.0% |
| Total | 162 | 100.0% |
Internet Access in Badger
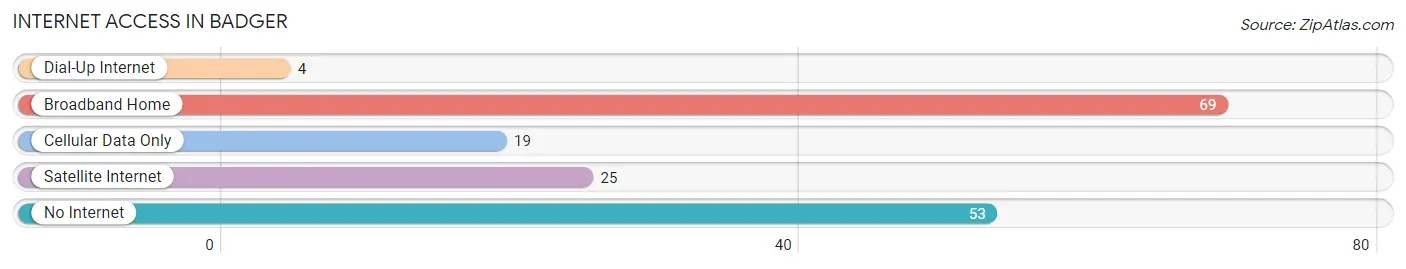
| Internet Type | # Households | % Households |
| Dial-Up Internet | 4 | 2.5% |
| Broadband Home | 69 | 42.6% |
| Cellular Data Only | 19 | 11.7% |
| Satellite Internet | 25 | 15.4% |
| No Internet | 53 | 32.7% |
| Total | 162 | 100.0% |
Badger Summary
Badger, Minnesota is a small city located in the northwestern corner of the state, near the border of North Dakota. It is part of the Red River Valley region, and is situated on the banks of the Red River of the North. The city has a population of just over 1,000 people, and is the county seat of Marshall County.
History
The area that is now Badger was first settled in the late 1800s by Norwegian immigrants. The city was officially incorporated in 1887, and was named after the badger, a small mammal native to the area. The city was originally a farming community, and the main crops grown were wheat, oats, and barley.
In the early 1900s, the city began to grow and develop. The railroad arrived in 1906, and the city was connected to the rest of the state. This allowed for the growth of industry and commerce in the area. The city also became a center for education, with the opening of a high school in 1910.
Geography
Badger is located in the northwestern corner of Minnesota, near the border of North Dakota. It is part of the Red River Valley region, and is situated on the banks of the Red River of the North. The city has a total area of 1.2 square miles, all of which is land.
The city is located in a flat, open area, with no major hills or mountains. The terrain is mostly flat, with some rolling hills in the area. The climate is humid continental, with cold winters and warm summers.
Economy
The economy of Badger is largely based on agriculture. The main crops grown in the area are wheat, oats, and barley. The city also has a small manufacturing sector, with a few small factories located in the area.
The city also has a small tourism industry, with visitors coming to the area to enjoy the natural beauty of the Red River Valley. The city also has a few small businesses, such as restaurants, shops, and other services.
Demographics
As of the 2010 census, the population of Badger was 1,072. The racial makeup of the city was 97.2% White, 0.7% African American, 0.3% Native American, 0.2% Asian, 0.1% Pacific Islander, and 1.5% from other races. The median household income was $41,250, and the median family income was $48,750.
The city has a small but diverse population. The majority of the population is of Norwegian descent, but there are also people of German, Irish, and other European backgrounds. The city also has a small Hispanic population, as well as a few Native American residents.
Conclusion
Badger, Minnesota is a small city located in the northwestern corner of the state, near the border of North Dakota. It is part of the Red River Valley region, and is situated on the banks of the Red River of the North. The city has a population of just over 1,000 people, and is the county seat of Marshall County. The economy of Badger is largely based on agriculture, with the main crops grown in the area being wheat, oats, and barley. The city also has a small manufacturing sector, with a few small factories located in the area. The city also has a small tourism industry, with visitors coming to the area to enjoy the natural beauty of the Red River Valley. The city has a small but diverse population, with the majority of the population being of Norwegian descent.
Common Questions
What is Per Capita Income in Badger?
Per Capita income in Badger is $25,747.
What is the Median Family Income in Badger?
Median Family Income in Badger is $63,750.
What is the Median Household income in Badger?
Median Household Income in Badger is $46,500.
What is Income or Wage Gap in Badger?
Income or Wage Gap in Badger is 25.8%.
Women in Badger earn 74.2 cents for every dollar earned by a man.
What is Inequality or Gini Index in Badger?
Inequality or Gini Index in Badger is 0.46.
What is the Total Population of Badger?
Total Population of Badger is 434.
What is the Total Male Population of Badger?
Total Male Population of Badger is 268.
What is the Total Female Population of Badger?
Total Female Population of Badger is 166.
What is the Ratio of Males per 100 Females in Badger?
There are 161.45 Males per 100 Females in Badger.
What is the Ratio of Females per 100 Males in Badger?
There are 61.94 Females per 100 Males in Badger.
What is the Median Population Age in Badger?
Median Population Age in Badger is 38.8 Years.
What is the Average Family Size in Badger
Average Family Size in Badger is 3.7 People.
What is the Average Household Size in Badger
Average Household Size in Badger is 2.7 People.
How Large is the Labor Force in Badger?
There are 239 People in the Labor Forcein in Badger.
What is the Percentage of People in the Labor Force in Badger?
73.1% of People are in the Labor Force in Badger.
What is the Unemployment Rate in Badger?
Unemployment Rate in Badger is 7.9%.