Ponemah, MN Map & Demographics
Ponemah Map
Ponemah Overview
$12,392
PER CAPITA INCOME
$41,397
AVG FAMILY INCOME
$74,196
AVG HOUSEHOLD INCOME
0.41
INEQUALITY / GINI INDEX
852
TOTAL POPULATION
522
MALE POPULATION
330
FEMALE POPULATION
158.18
MALES / 100 FEMALES
63.22
FEMALES / 100 MALES
17.9
MEDIAN AGE
5.0
AVG FAMILY SIZE
5.6
AVG HOUSEHOLD SIZE
280
LABOR FORCE [ PEOPLE ]
59.1%
PERCENT IN LABOR FORCE
20.2%
UNEMPLOYMENT RATE
Ponemah Zip Codes
Ponemah Area Codes
Income in Ponemah
Income Overview in Ponemah
Per Capita Income in Ponemah is $12,392, while median incomes of families and households are $41,397 and $74,196 respectively.
| Characteristic | Number | Measure |
| Per Capita Income | 852 | $12,392 |
| Median Family Income | 151 | $41,397 |
| Mean Family Income | 151 | $43,780 |
| Median Household Income | 151 | $74,196 |
| Mean Household Income | 151 | $63,772 |
| Income Deficit | 151 | $0 |
| Wage / Income Gap (%) | 852 | 0.00% |
| Wage / Income Gap ($) | 852 | 100.00¢ per $1 |
| Gini / Inequality Index | 852 | 0.41 |
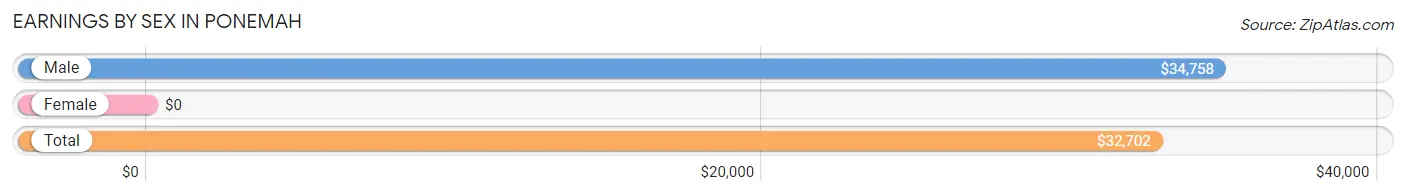
Earnings by Sex in Ponemah
| Sex | Number | Average Earnings |
| Male | 168 (62.9%) | $34,758 |
| Female | 99 (37.1%) | $0 |
| Total | 267 (100.0%) | $32,702 |
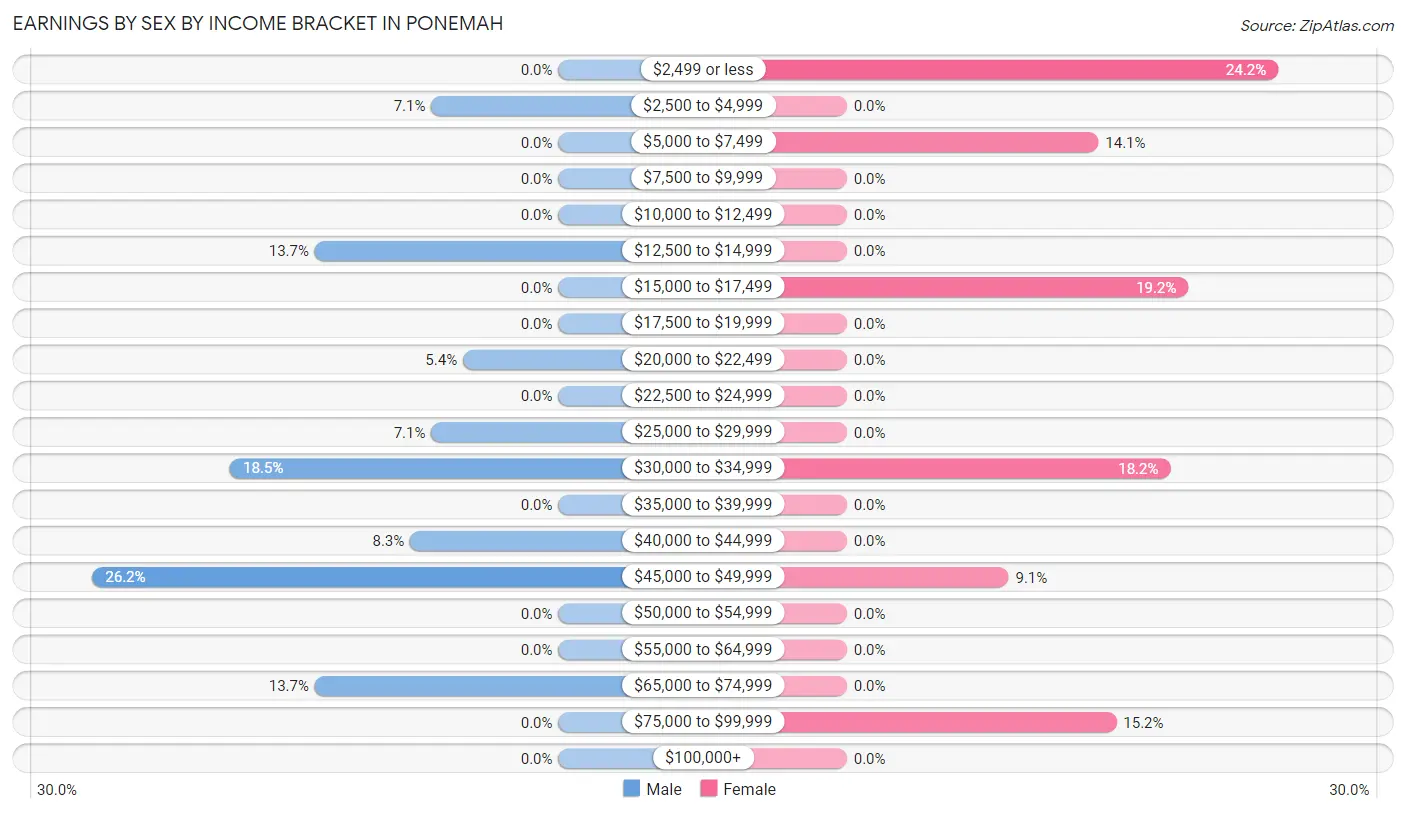
Earnings by Sex by Income Bracket in Ponemah
The most common earnings brackets in Ponemah are $45,000 to $49,999 for men (44 | 26.2%) and $2,499 or less for women (24 | 24.2%).
| Income | Male | Female |
| $2,499 or less | 0 (0.0%) | 24 (24.2%) |
| $2,500 to $4,999 | 12 (7.1%) | 0 (0.0%) |
| $5,000 to $7,499 | 0 (0.0%) | 14 (14.1%) |
| $7,500 to $9,999 | 0 (0.0%) | 0 (0.0%) |
| $10,000 to $12,499 | 0 (0.0%) | 0 (0.0%) |
| $12,500 to $14,999 | 23 (13.7%) | 0 (0.0%) |
| $15,000 to $17,499 | 0 (0.0%) | 19 (19.2%) |
| $17,500 to $19,999 | 0 (0.0%) | 0 (0.0%) |
| $20,000 to $22,499 | 9 (5.4%) | 0 (0.0%) |
| $22,500 to $24,999 | 0 (0.0%) | 0 (0.0%) |
| $25,000 to $29,999 | 12 (7.1%) | 0 (0.0%) |
| $30,000 to $34,999 | 31 (18.4%) | 18 (18.2%) |
| $35,000 to $39,999 | 0 (0.0%) | 0 (0.0%) |
| $40,000 to $44,999 | 14 (8.3%) | 0 (0.0%) |
| $45,000 to $49,999 | 44 (26.2%) | 9 (9.1%) |
| $50,000 to $54,999 | 0 (0.0%) | 0 (0.0%) |
| $55,000 to $64,999 | 0 (0.0%) | 0 (0.0%) |
| $65,000 to $74,999 | 23 (13.7%) | 0 (0.0%) |
| $75,000 to $99,999 | 0 (0.0%) | 15 (15.1%) |
| $100,000+ | 0 (0.0%) | 0 (0.0%) |
| Total | 168 (100.0%) | 99 (100.0%) |
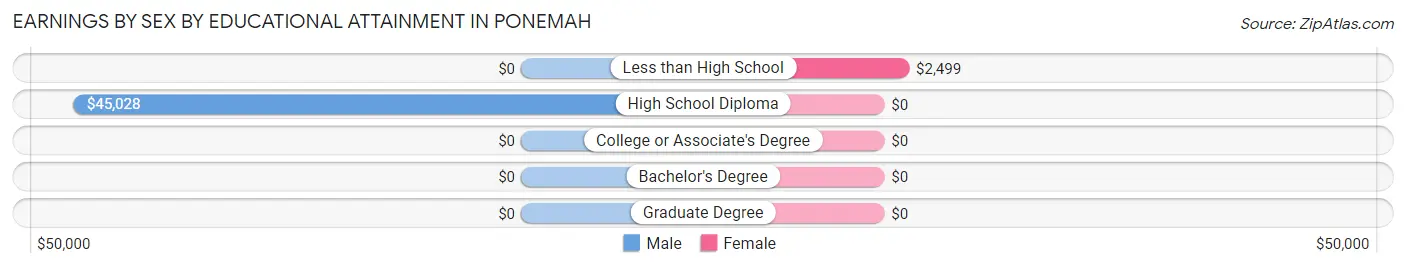
Earnings by Sex by Educational Attainment in Ponemah
| Educational Attainment | Male Income | Female Income |
| Less than High School | - | - |
| High School Diploma | $45,028 | $0 |
| College or Associate's Degree | - | - |
| Bachelor's Degree | - | - |
| Graduate Degree | - | - |
| Total | $40,268 | $0 |
Family Income in Ponemah
Family Income Brackets in Ponemah
According to the Ponemah family income data, there are 63 families falling into the $35,000 to $49,999 income range, which is the most common income bracket and makes up 41.7% of all families.
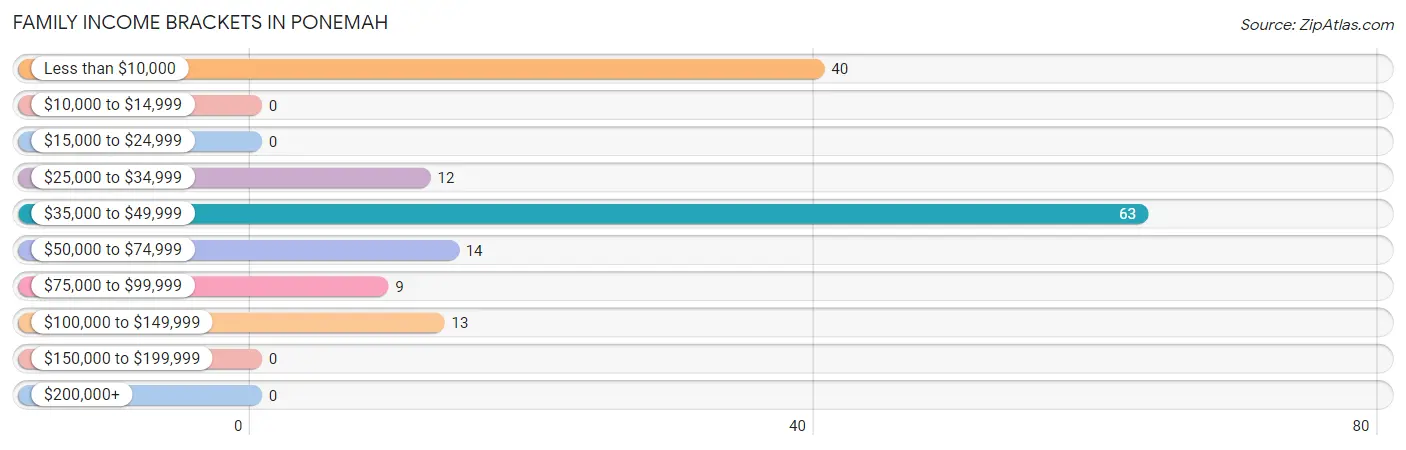
| Income Bracket | # Families | % Families |
| Less than $10,000 | 40 | 26.5% |
| $10,000 to $14,999 | 0 | 0.0% |
| $15,000 to $24,999 | 0 | 0.0% |
| $25,000 to $34,999 | 12 | 7.9% |
| $35,000 to $49,999 | 63 | 41.7% |
| $50,000 to $74,999 | 14 | 9.3% |
| $75,000 to $99,999 | 9 | 6.0% |
| $100,000 to $149,999 | 13 | 8.6% |
| $150,000 to $199,999 | 0 | 0.0% |
| $200,000+ | 0 | 0.0% |
Family Income by Famaliy Size in Ponemah
4-person families (49 | 32.5%) account for the highest median family income in Ponemah with $48,086 per family, while 4-person families (49 | 32.5%) have the highest median income of $12,022 per family member.
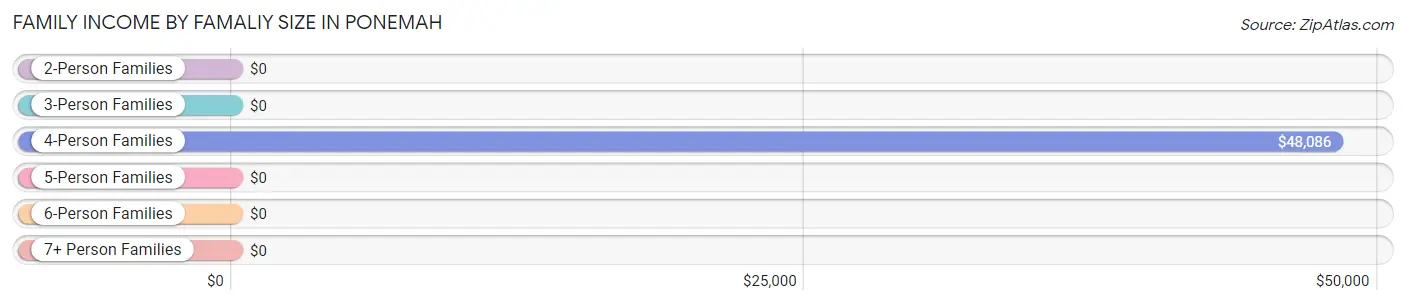
| Income Bracket | # Families | Median Income |
| 2-Person Families | 38 (25.2%) | $0 |
| 3-Person Families | 14 (9.3%) | $0 |
| 4-Person Families | 49 (32.5%) | $48,086 |
| 5-Person Families | 36 (23.8%) | $0 |
| 6-Person Families | 14 (9.3%) | $0 |
| 7+ Person Families | 0 (0.0%) | $0 |
| Total | 151 (100.0%) | $41,397 |
Family Income by Number of Earners in Ponemah
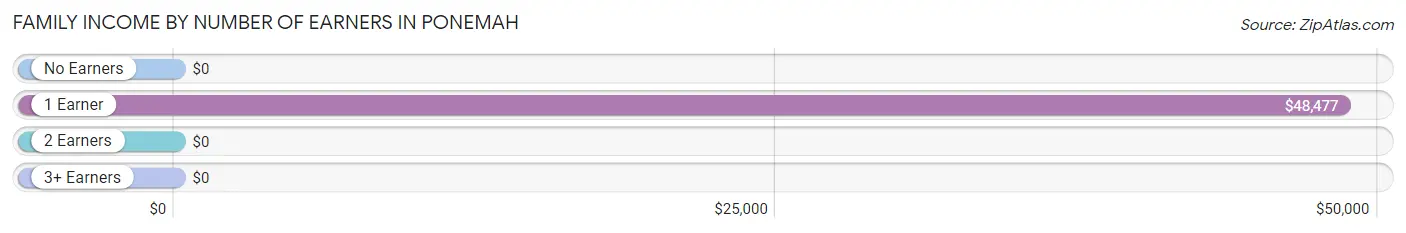
| Number of Earners | # Families | Median Income |
| No Earners | 31 (20.5%) | $0 |
| 1 Earner | 67 (44.4%) | $48,477 |
| 2 Earners | 53 (35.1%) | $0 |
| 3+ Earners | 0 (0.0%) | $0 |
| Total | 151 (100.0%) | $41,397 |
Household Income in Ponemah
Household Income Brackets in Ponemah
With 41 households falling in the category, the $75,000 to $99,999 income range is the most frequent in Ponemah, accounting for 27.2% of all households.
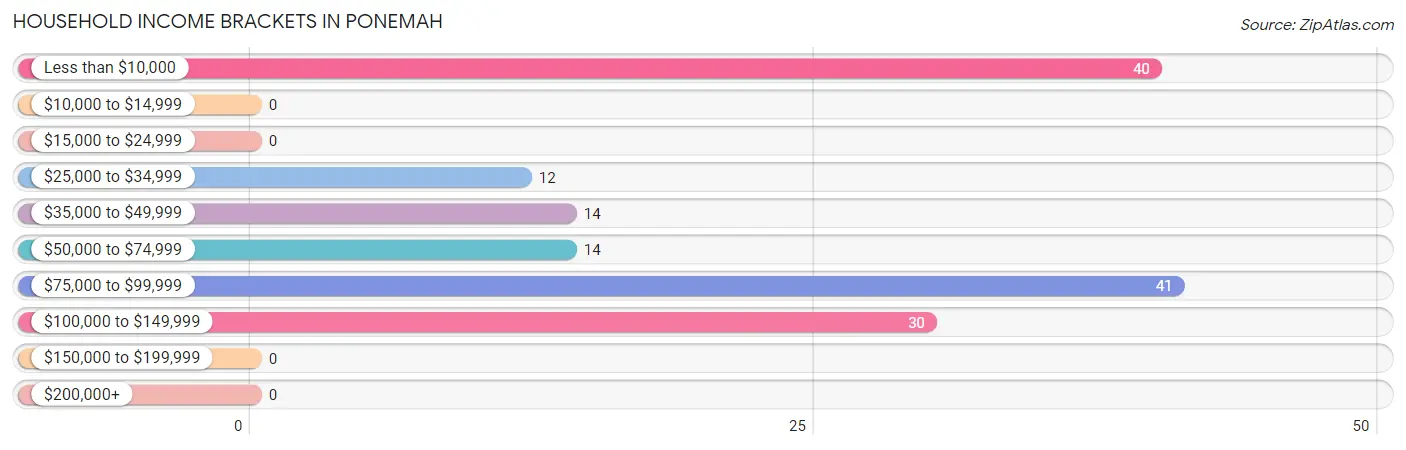
| Income Bracket | # Households | % Households |
| Less than $10,000 | 40 | 26.5% |
| $10,000 to $14,999 | 0 | 0.0% |
| $15,000 to $24,999 | 0 | 0.0% |
| $25,000 to $34,999 | 12 | 7.9% |
| $35,000 to $49,999 | 14 | 9.3% |
| $50,000 to $74,999 | 14 | 9.3% |
| $75,000 to $99,999 | 41 | 27.2% |
| $100,000 to $149,999 | 30 | 19.9% |
| $150,000 to $199,999 | 0 | 0.0% |
| $200,000+ | 0 | 0.0% |
Household Income by Householder Age in Ponemah
The median household income in Ponemah is $74,196, with the highest median household income of $76,161 found in the 65+ years age bracket for the primary householder. A total of 41 households (27.2%) fall into this category.
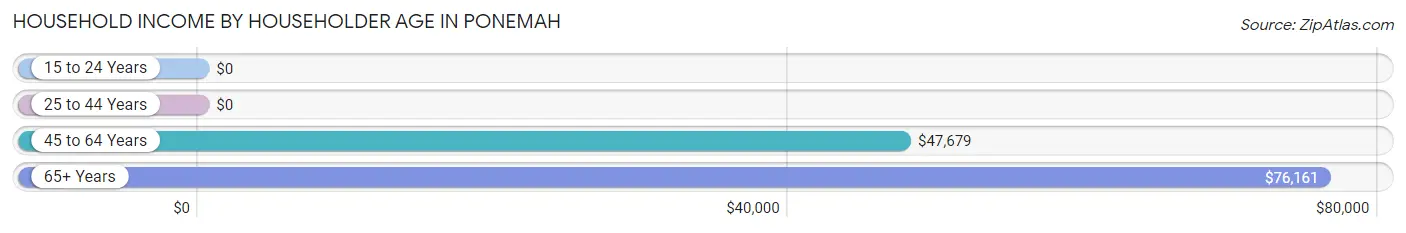
| Income Bracket | # Households | Median Income |
| 15 to 24 Years | 0 (0.0%) | $0 |
| 25 to 44 Years | 32 (21.2%) | $0 |
| 45 to 64 Years | 78 (51.7%) | $47,679 |
| 65+ Years | 41 (27.2%) | $76,161 |
| Total | 151 (100.0%) | $74,196 |
Poverty in Ponemah
Income Below Poverty by Sex and Age in Ponemah
With 25.1% poverty level for males and 40.6% for females among the residents of Ponemah, under 5 year old males and under 5 year old females are the most vulnerable to poverty, with 58 males (100.0%) and 34 females (100.0%) in their respective age groups living below the poverty level.
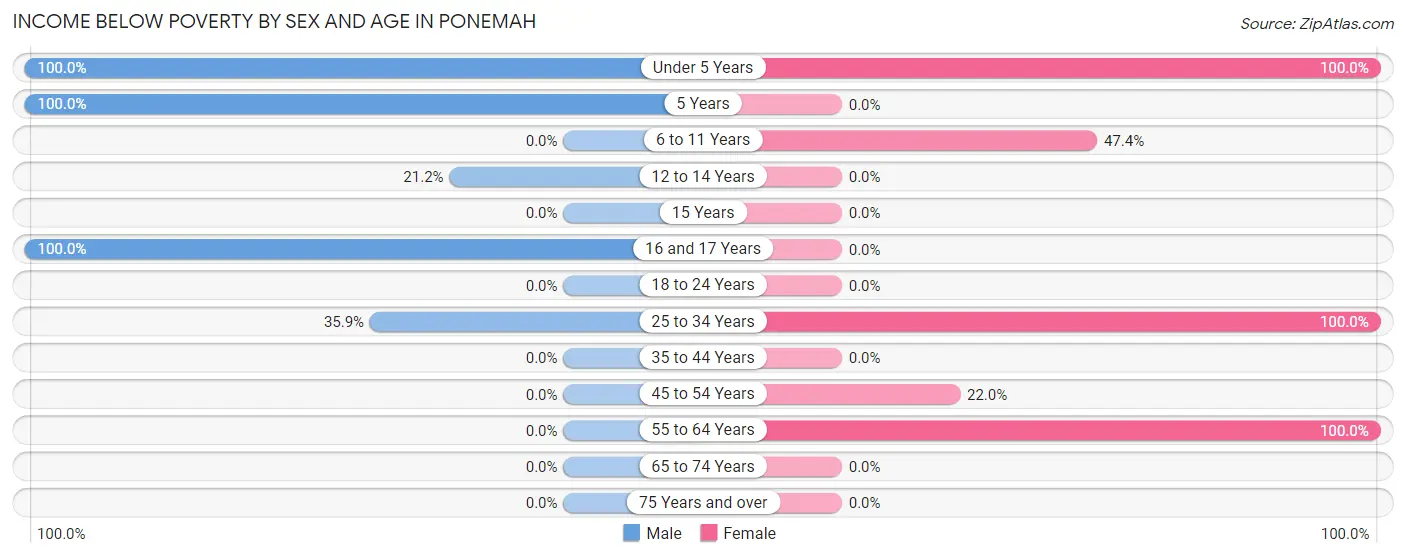
| Age Bracket | Male | Female |
| Under 5 Years | 58 (100.0%) | 34 (100.0%) |
| 5 Years | 15 (100.0%) | 0 (0.0%) |
| 6 to 11 Years | 0 (0.0%) | 18 (47.4%) |
| 12 to 14 Years | 33 (21.1%) | 0 (0.0%) |
| 15 Years | 0 (0.0%) | 0 (0.0%) |
| 16 and 17 Years | 11 (100.0%) | 0 (0.0%) |
| 18 to 24 Years | 0 (0.0%) | 0 (0.0%) |
| 25 to 34 Years | 14 (35.9%) | 56 (100.0%) |
| 35 to 44 Years | 0 (0.0%) | 0 (0.0%) |
| 45 to 54 Years | 0 (0.0%) | 9 (22.0%) |
| 55 to 64 Years | 0 (0.0%) | 17 (100.0%) |
| 65 to 74 Years | 0 (0.0%) | 0 (0.0%) |
| 75 Years and over | 0 (0.0%) | 0 (0.0%) |
| Total | 131 (25.1%) | 134 (40.6%) |
Income Above Poverty by Sex and Age in Ponemah
According to the poverty statistics in Ponemah, males aged 6 to 11 years and females aged 15 years are the age groups that are most secure financially, with 100.0% of males and 100.0% of females in these age groups living above the poverty line.
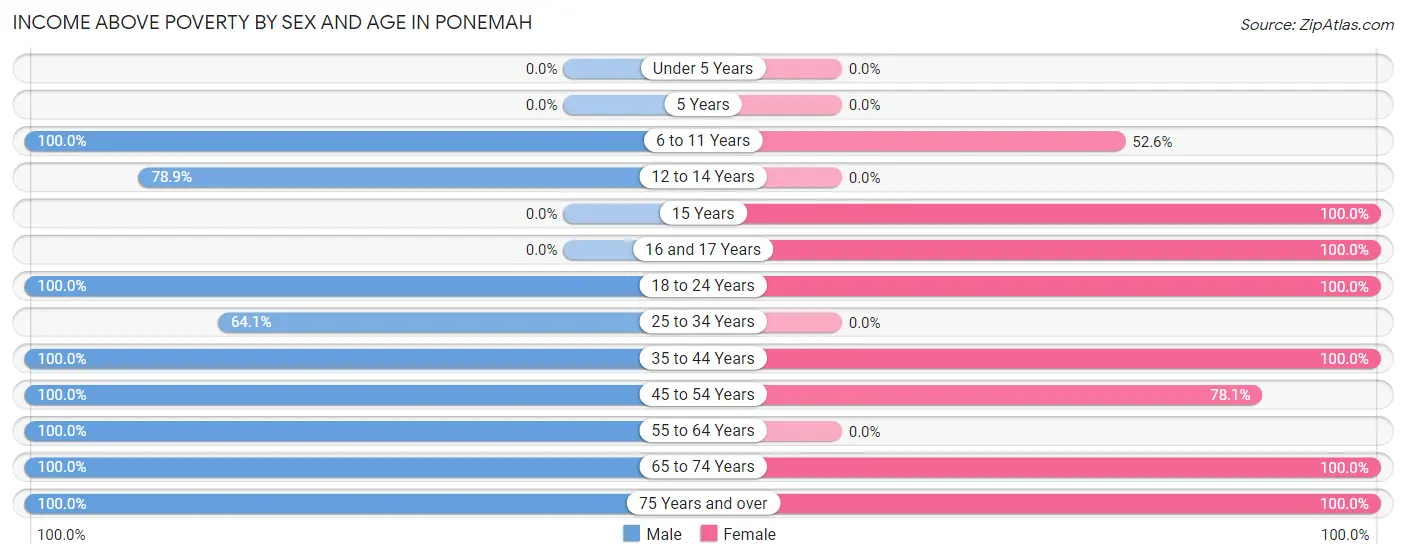
| Age Bracket | Male | Female |
| Under 5 Years | 0 (0.0%) | 0 (0.0%) |
| 5 Years | 0 (0.0%) | 0 (0.0%) |
| 6 to 11 Years | 57 (100.0%) | 20 (52.6%) |
| 12 to 14 Years | 123 (78.8%) | 0 (0.0%) |
| 15 Years | 0 (0.0%) | 20 (100.0%) |
| 16 and 17 Years | 0 (0.0%) | 40 (100.0%) |
| 18 to 24 Years | 72 (100.0%) | 11 (100.0%) |
| 25 to 34 Years | 25 (64.1%) | 0 (0.0%) |
| 35 to 44 Years | 30 (100.0%) | 18 (100.0%) |
| 45 to 54 Years | 43 (100.0%) | 32 (78.0%) |
| 55 to 64 Years | 14 (100.0%) | 0 (0.0%) |
| 65 to 74 Years | 14 (100.0%) | 22 (100.0%) |
| 75 Years and over | 13 (100.0%) | 33 (100.0%) |
| Total | 391 (74.9%) | 196 (59.4%) |
Income Below Poverty Among Married-Couple Families in Ponemah
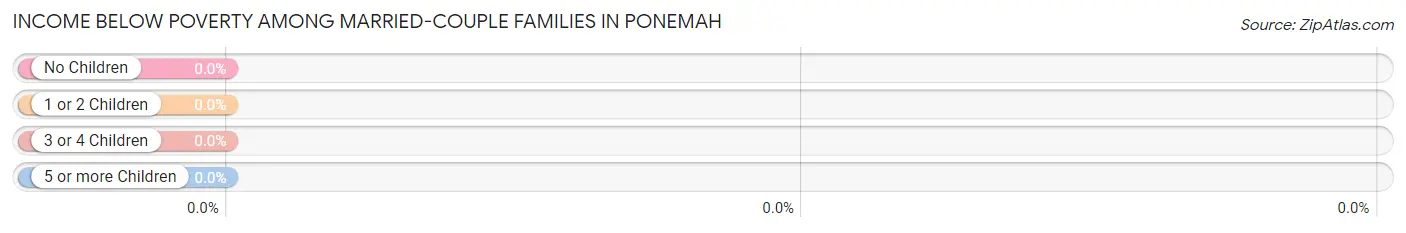
| Children | Above Poverty | Below Poverty |
| No Children | 22 (100.0%) | 0 (0.0%) |
| 1 or 2 Children | 0 (0.0%) | 0 (0.0%) |
| 3 or 4 Children | 14 (100.0%) | 0 (0.0%) |
| 5 or more Children | 0 (0.0%) | 0 (0.0%) |
| Total | 36 (100.0%) | 0 (0.0%) |
Income Below Poverty Among Single-Parent Households in Ponemah
According to the poverty data in Ponemah, 24.6% or 14 single-father households and 44.8% or 26 single-mother households are living below the poverty line. Among single-father households, those with 5 or more children have the highest poverty rate, with 14 households (100.0%) experiencing poverty. Likewise, among single-mother households, those with 3 or 4 children have the highest poverty rate, with 9 households (100.0%) falling below the poverty line.
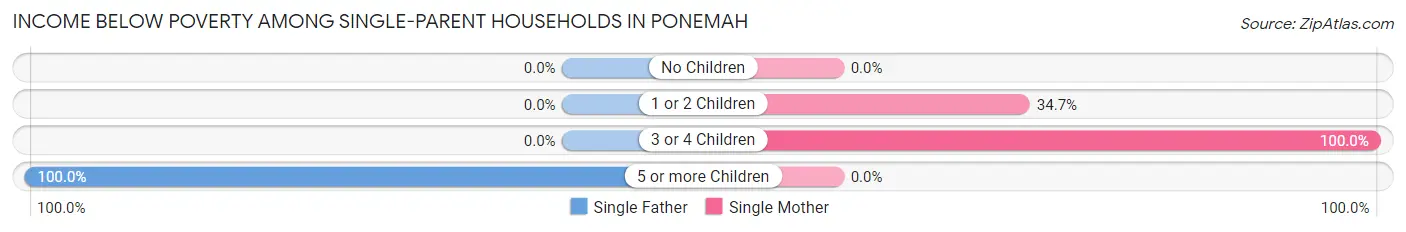
| Children | Single Father | Single Mother |
| No Children | 0 (0.0%) | 0 (0.0%) |
| 1 or 2 Children | 0 (0.0%) | 17 (34.7%) |
| 3 or 4 Children | 0 (0.0%) | 9 (100.0%) |
| 5 or more Children | 14 (100.0%) | 0 (0.0%) |
| Total | 14 (24.6%) | 26 (44.8%) |
Income Below Poverty Among Married-Couple vs Single-Parent Households in Ponemah
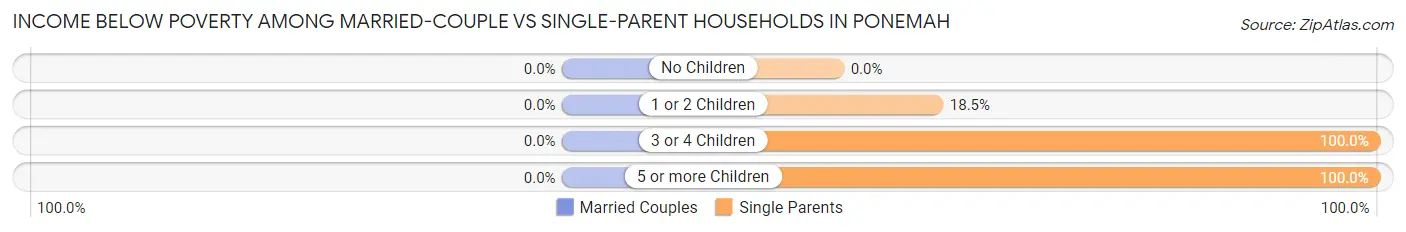
| Children | Married-Couple Families | Single-Parent Households |
| No Children | 0 (0.0%) | 0 (0.0%) |
| 1 or 2 Children | 0 (0.0%) | 17 (18.5%) |
| 3 or 4 Children | 0 (0.0%) | 9 (100.0%) |
| 5 or more Children | 0 (0.0%) | 14 (100.0%) |
| Total | 0 (0.0%) | 40 (34.8%) |
Race in Ponemah
The most populous races in Ponemah are Native / Alaskan (843 | 98.9%), and White / Caucasian (9 | 1.1%).
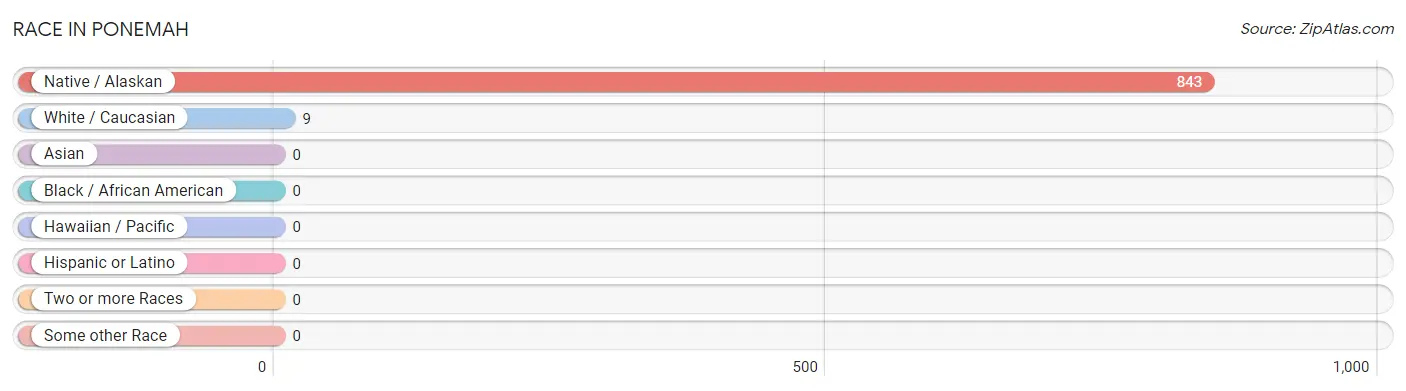
| Race | # Population | % Population |
| Asian | 0 | 0.0% |
| Black / African American | 0 | 0.0% |
| Hawaiian / Pacific | 0 | 0.0% |
| Hispanic or Latino | 0 | 0.0% |
| Native / Alaskan | 843 | 98.9% |
| White / Caucasian | 9 | 1.1% |
| Two or more Races | 0 | 0.0% |
| Some other Race | 0 | 0.0% |
| Total | 852 | 100.0% |
Ancestry in Ponemah
The most populous ancestries reported in Ponemah are , and Chippewa (830 | 97.4%), together accounting for 97.4% of all Ponemah residents.

| Ancestry | # Population | % Population |
| Chippewa | 830 | 97.4% | View All 1 Rows |
Immigrants in Ponemah

| Immigration Origin | # Population | % Population | View All 0 Rows |
Sex and Age in Ponemah
Sex and Age in Ponemah
The most populous age groups in Ponemah are 10 to 14 Years (195 | 37.4%) for men and 15 to 19 Years (60 | 18.2%) for women.
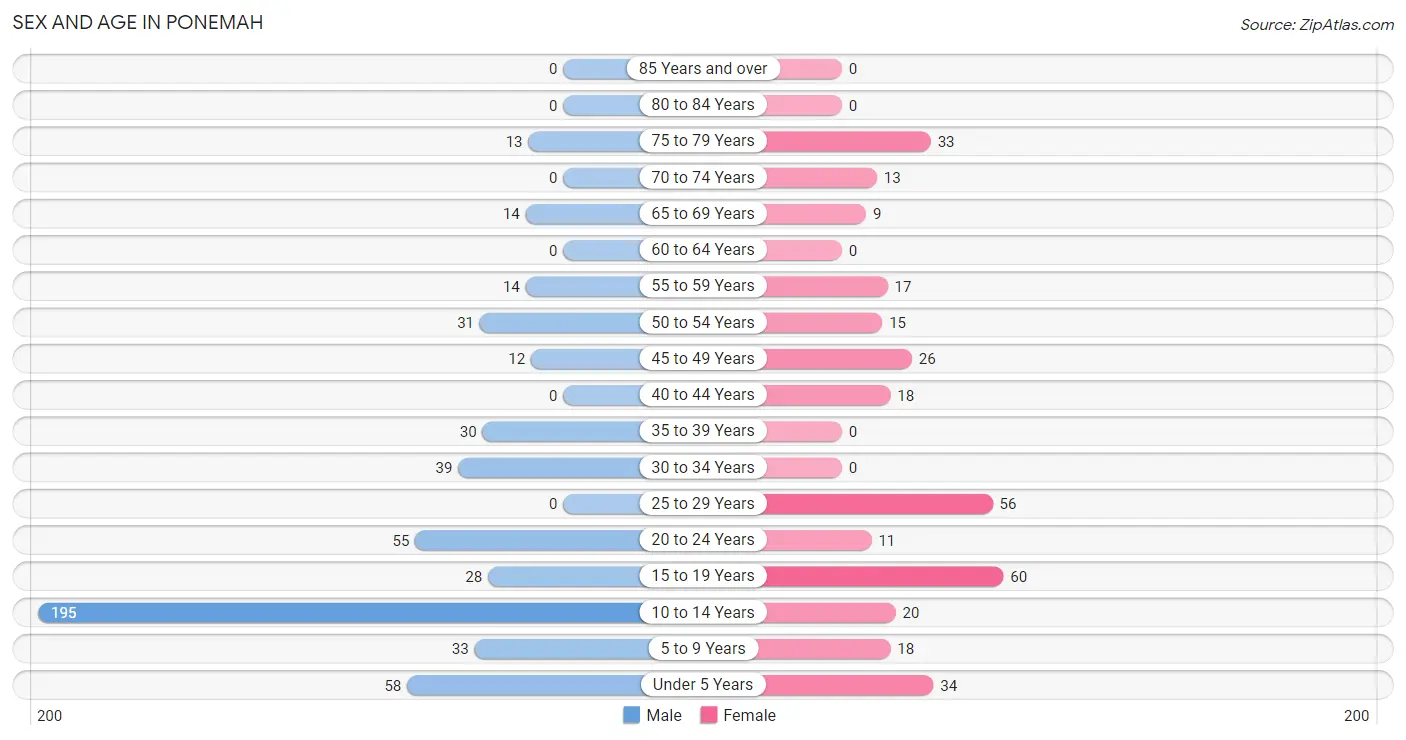
| Age Bracket | Male | Female |
| Under 5 Years | 58 (11.1%) | 34 (10.3%) |
| 5 to 9 Years | 33 (6.3%) | 18 (5.4%) |
| 10 to 14 Years | 195 (37.4%) | 20 (6.1%) |
| 15 to 19 Years | 28 (5.4%) | 60 (18.2%) |
| 20 to 24 Years | 55 (10.5%) | 11 (3.3%) |
| 25 to 29 Years | 0 (0.0%) | 56 (17.0%) |
| 30 to 34 Years | 39 (7.5%) | 0 (0.0%) |
| 35 to 39 Years | 30 (5.8%) | 0 (0.0%) |
| 40 to 44 Years | 0 (0.0%) | 18 (5.4%) |
| 45 to 49 Years | 12 (2.3%) | 26 (7.9%) |
| 50 to 54 Years | 31 (5.9%) | 15 (4.5%) |
| 55 to 59 Years | 14 (2.7%) | 17 (5.1%) |
| 60 to 64 Years | 0 (0.0%) | 0 (0.0%) |
| 65 to 69 Years | 14 (2.7%) | 9 (2.7%) |
| 70 to 74 Years | 0 (0.0%) | 13 (3.9%) |
| 75 to 79 Years | 13 (2.5%) | 33 (10.0%) |
| 80 to 84 Years | 0 (0.0%) | 0 (0.0%) |
| 85 Years and over | 0 (0.0%) | 0 (0.0%) |
| Total | 522 (100.0%) | 330 (100.0%) |
Families and Households in Ponemah
Median Family Size in Ponemah
The median family size in Ponemah is 5.02 persons per family, with married-couple families (36 | 23.8%) accounting for the largest median family size of 5.81 persons per family. On the other hand, single female/mother families (58 | 38.4%) represent the smallest median family size with 3.97 persons per family.
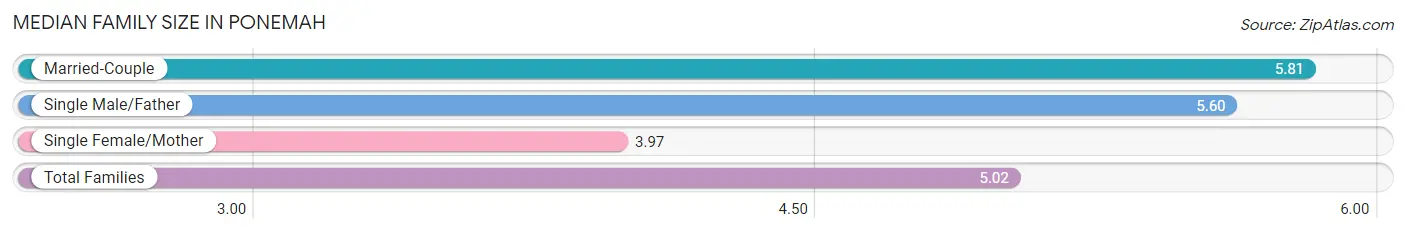
| Family Type | # Families | Family Size |
| Married-Couple | 36 (23.8%) | 5.81 |
| Single Male/Father | 57 (37.8%) | 5.60 |
| Single Female/Mother | 58 (38.4%) | 3.97 |
| Total Families | 151 (100.0%) | 5.02 |
Median Household Size in Ponemah
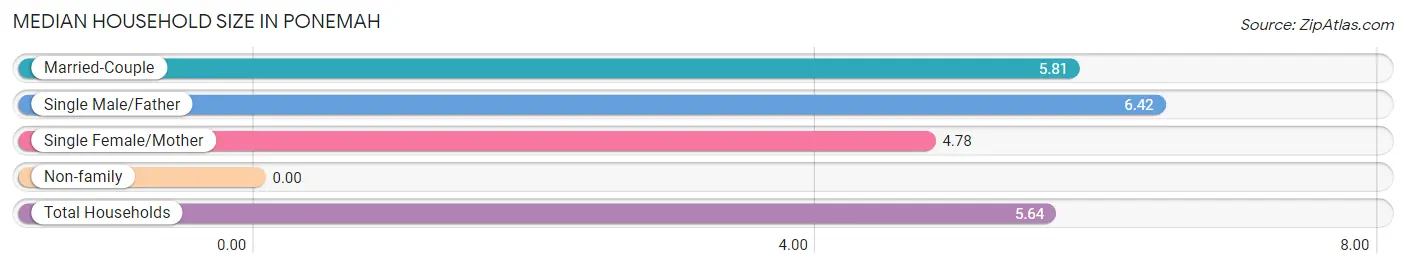
| Household Type | # Households | Household Size |
| Married-Couple | 36 (23.8%) | 5.81 |
| Single Male/Father | 57 (37.8%) | 6.42 |
| Single Female/Mother | 58 (38.4%) | 4.78 |
| Non-family | 0 (0.0%) | - |
| Total Households | 151 (100.0%) | 5.64 |
Household Size by Marriage Status in Ponemah
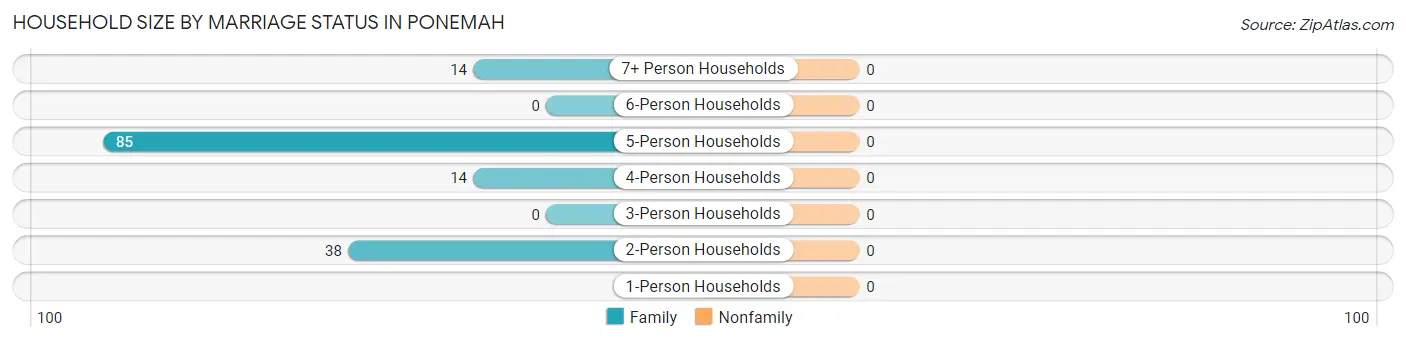
| Household Size | Family Households | Nonfamily Households |
| 1-Person Households | - | 0 (0.0%) |
| 2-Person Households | 38 (25.2%) | 0 (0.0%) |
| 3-Person Households | 0 (0.0%) | 0 (0.0%) |
| 4-Person Households | 14 (9.3%) | 0 (0.0%) |
| 5-Person Households | 85 (56.3%) | 0 (0.0%) |
| 6-Person Households | 0 (0.0%) | 0 (0.0%) |
| 7+ Person Households | 14 (9.3%) | 0 (0.0%) |
| Total | 151 (100.0%) | 0 (0.0%) |
Female Fertility in Ponemah
Fertility by Age in Ponemah
Average fertility rate in Ponemah is 140.0 births per 1,000 women. Women in the age bracket of 20 to 34 years have the highest fertility rate with 358.0 births per 1,000 women. Women in the age bracket of 20 to 34 years acount for 100.0% of all women with births.
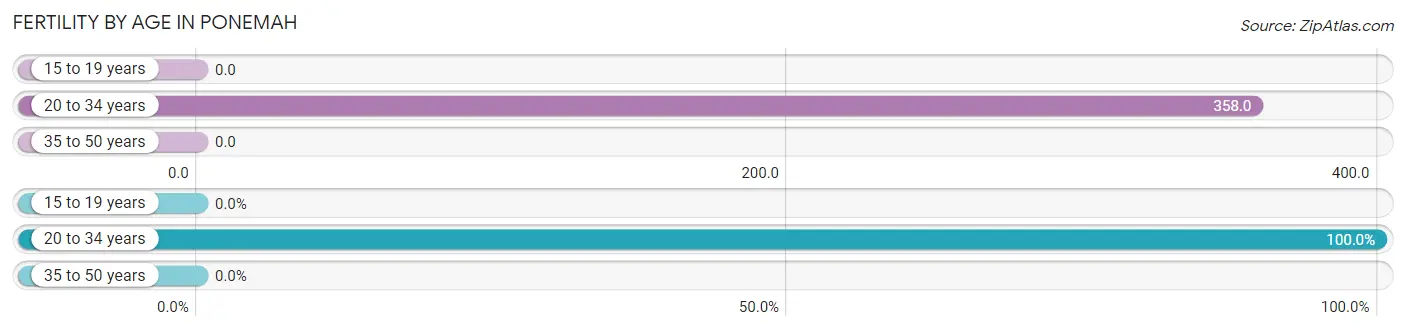
| Age Bracket | Women with Births | Births / 1,000 Women |
| 15 to 19 years | 0 (0.0%) | 0.0 |
| 20 to 34 years | 24 (100.0%) | 358.0 |
| 35 to 50 years | 0 (0.0%) | 0.0 |
| Total | 24 (100.0%) | 140.0 |
Fertility by Age by Marriage Status in Ponemah
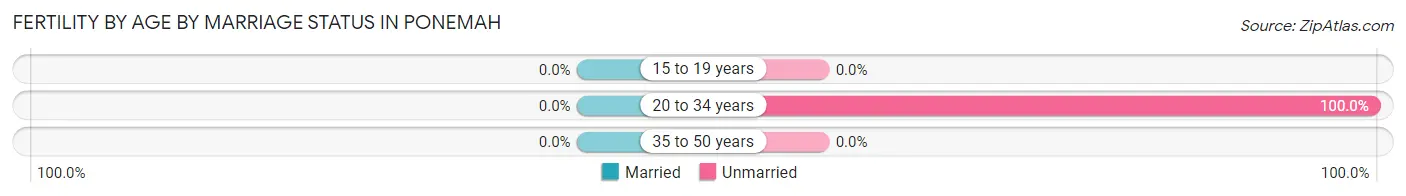
| Age Bracket | Married | Unmarried |
| 15 to 19 years | 0 (0.0%) | 0 (0.0%) |
| 20 to 34 years | 0 (0.0%) | 24 (100.0%) |
| 35 to 50 years | 0 (0.0%) | 0 (0.0%) |
| Total | 0 (0.0%) | 24 (100.0%) |
Fertility by Education in Ponemah
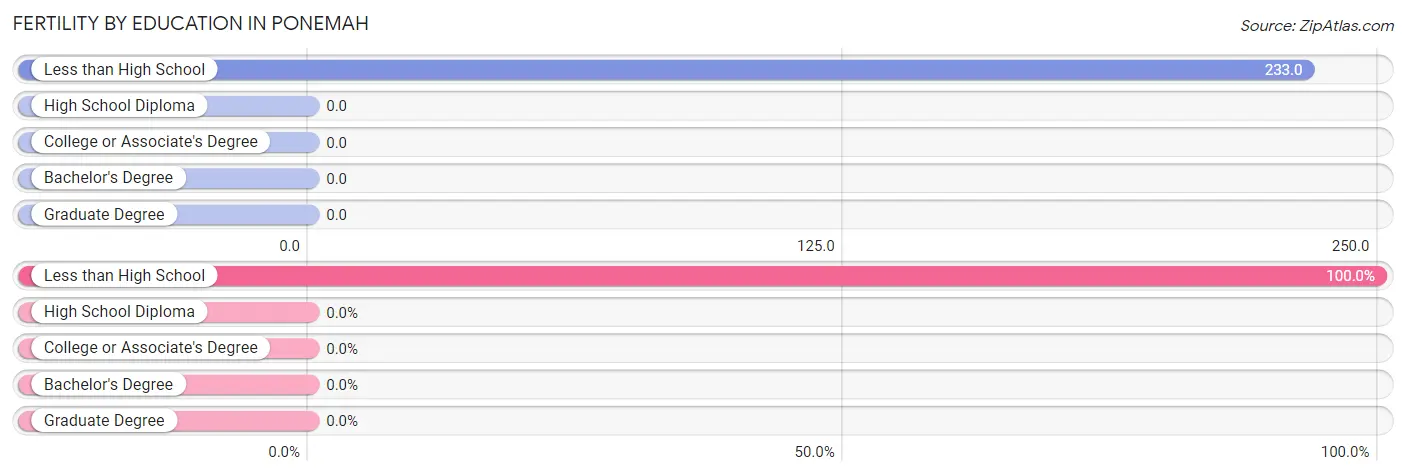
| Educational Attainment | Women with Births | Births / 1,000 Women |
| Less than High School | 24 (100.0%) | 233.0 |
| High School Diploma | 0 (0.0%) | 0.0 |
| College or Associate's Degree | 0 (0.0%) | 0.0 |
| Bachelor's Degree | 0 (0.0%) | 0.0 |
| Graduate Degree | 0 (0.0%) | 0.0 |
| Total | 24 (100.0%) | 140.0 |
Fertility by Education by Marriage Status in Ponemah
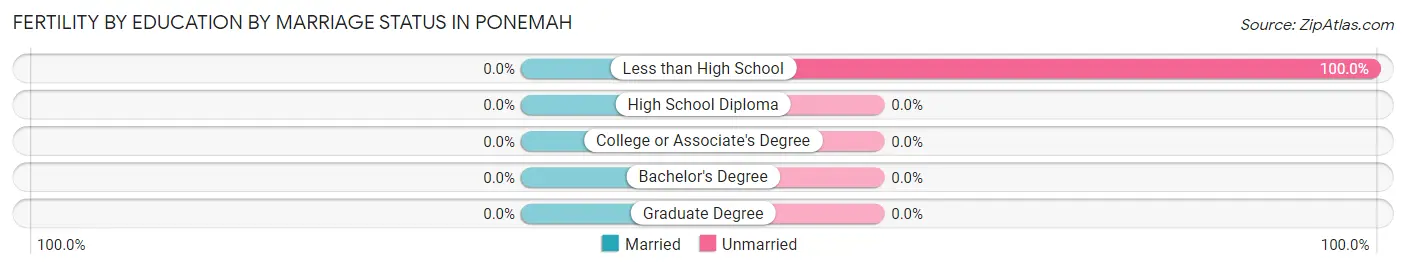
| Educational Attainment | Married | Unmarried |
| Less than High School | 0 (0.0%) | 24 (100.0%) |
| High School Diploma | 0 (0.0%) | 0 (0.0%) |
| College or Associate's Degree | 0 (0.0%) | 0 (0.0%) |
| Bachelor's Degree | 0 (0.0%) | 0 (0.0%) |
| Graduate Degree | 0 (0.0%) | 0 (0.0%) |
| Total | 0 (0.0%) | 24 (100.0%) |
Employment Characteristics in Ponemah
Employment by Class of Employer in Ponemah
Among the 214 employed individuals in Ponemah, local government employees (137 | 64.0%), private company employees (45 | 21.0%), and federal government employees (23 | 10.7%) make up the most common classes of employment.
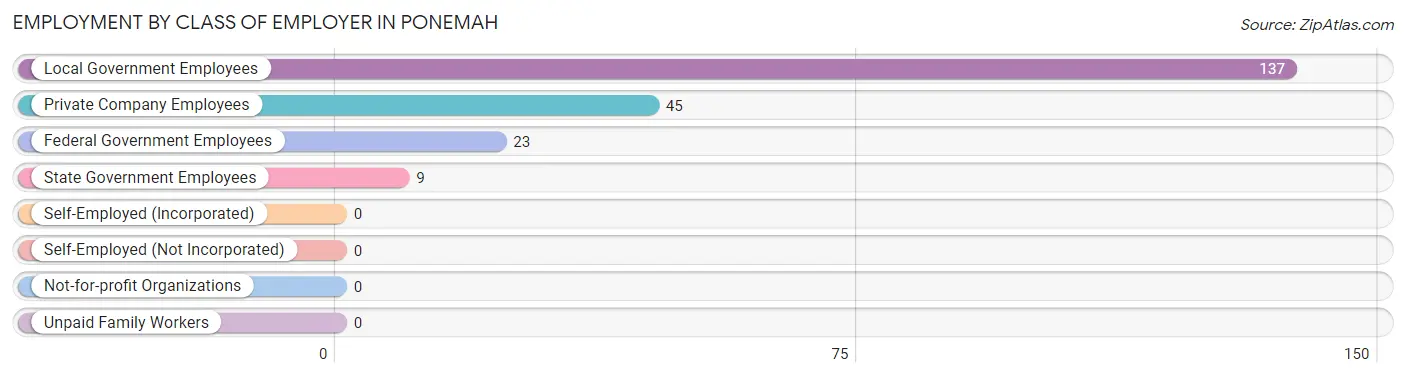
| Employer Class | # Employees | % Employees |
| Private Company Employees | 45 | 21.0% |
| Self-Employed (Incorporated) | 0 | 0.0% |
| Self-Employed (Not Incorporated) | 0 | 0.0% |
| Not-for-profit Organizations | 0 | 0.0% |
| Local Government Employees | 137 | 64.0% |
| State Government Employees | 9 | 4.2% |
| Federal Government Employees | 23 | 10.7% |
| Unpaid Family Workers | 0 | 0.0% |
| Total | 214 | 100.0% |
Employment Status by Age in Ponemah
According to the labor force statistics for Ponemah, out of the total population over 16 years of age (474), 59.1% or 280 individuals are in the labor force, with 20.2% or 57 of them unemployed. The age group with the highest labor force participation rate is 20 to 24 years, with 100.0% or 66 individuals in the labor force. Within the labor force, the 30 to 34 years age range has the highest percentage of unemployed individuals, with 100.0% or 25 of them being unemployed.
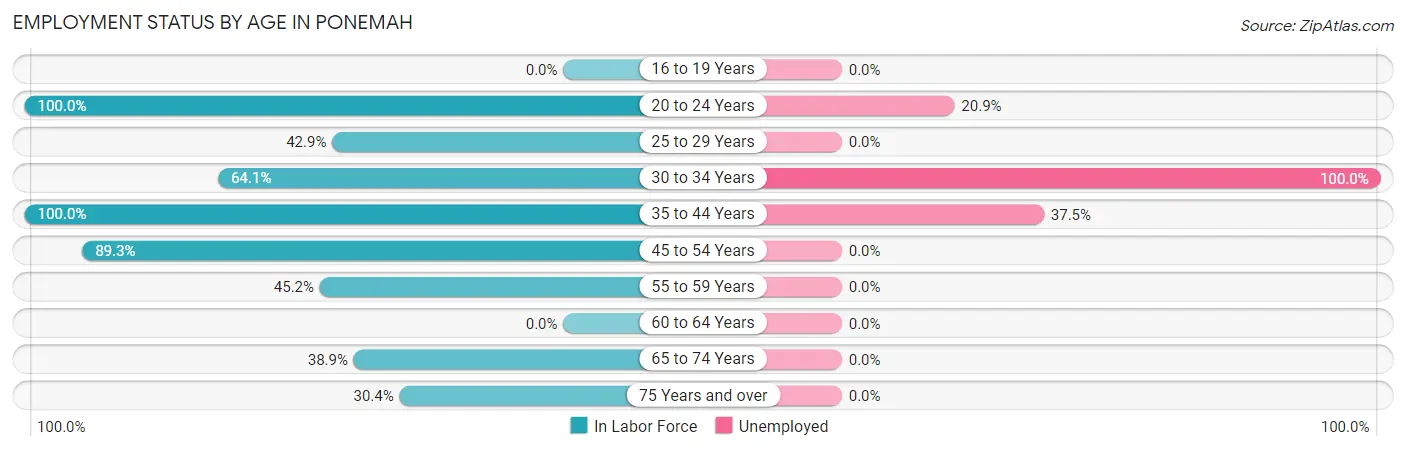
| Age Bracket | In Labor Force | Unemployed |
| 16 to 19 Years | 0 (0.0%) | 0 (0.0%) |
| 20 to 24 Years | 66 (100.0%) | 14 (20.9%) |
| 25 to 29 Years | 24 (42.9%) | 0 (0.0%) |
| 30 to 34 Years | 25 (64.1%) | 25 (100.0%) |
| 35 to 44 Years | 48 (100.0%) | 18 (37.5%) |
| 45 to 54 Years | 75 (89.3%) | 0 (0.0%) |
| 55 to 59 Years | 14 (45.2%) | 0 (0.0%) |
| 60 to 64 Years | 0 (0.0%) | 0 (0.0%) |
| 65 to 74 Years | 14 (38.9%) | 0 (0.0%) |
| 75 Years and over | 14 (30.4%) | 0 (0.0%) |
| Total | 280 (59.1%) | 57 (20.2%) |
Employment Status by Educational Attainment in Ponemah
According to labor force statistics for Ponemah, 72.1% of individuals (186) out of the total population between 25 and 64 years of age (258) are in the labor force, with 23.1% or 43 of them being unemployed. The group with the highest labor force participation rate are those with the educational attainment of high school diploma, with 93.5% or 129 individuals in the labor force. Within the labor force, individuals with college / associate degree education have the highest percentage of unemployment, with 100.0% or 12 of them being unemployed.
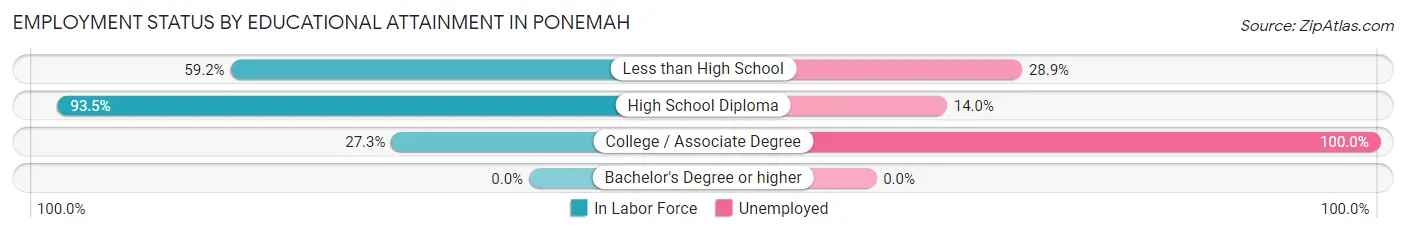
| Educational Attainment | In Labor Force | Unemployed |
| Less than High School | 45 (59.2%) | 22 (28.9%) |
| High School Diploma | 129 (93.5%) | 19 (14.0%) |
| College / Associate Degree | 12 (27.3%) | 44 (100.0%) |
| Bachelor's Degree or higher | 0 (0.0%) | 0 (0.0%) |
| Total | 186 (72.1%) | 60 (23.1%) |
Employment Occupations by Sex in Ponemah
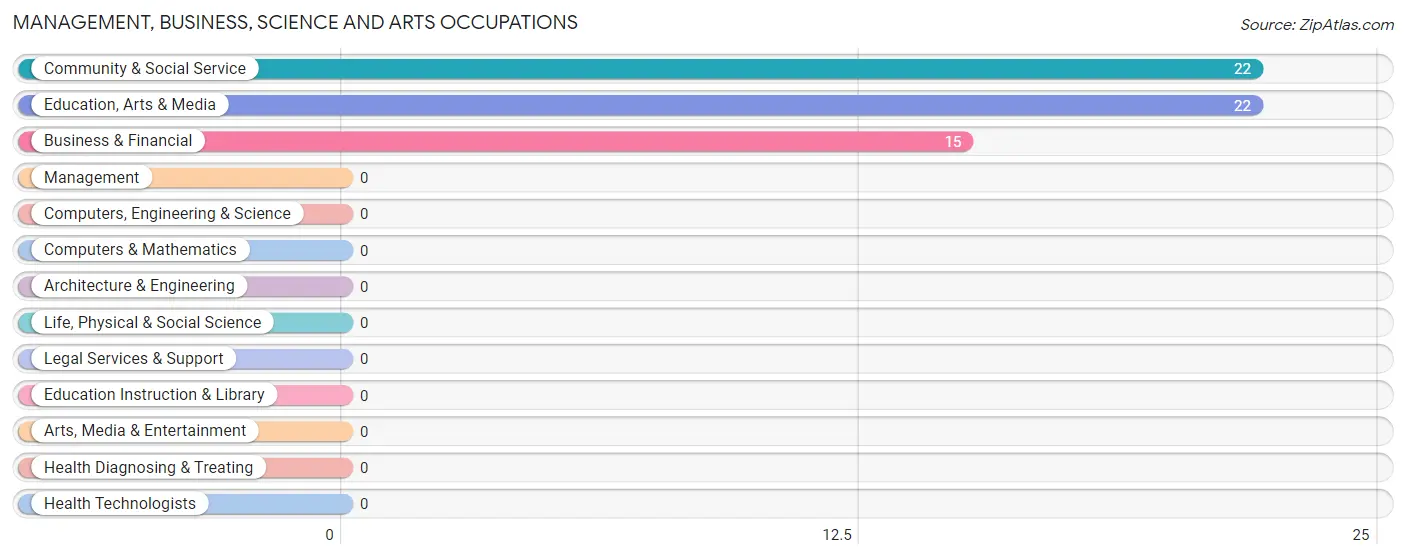
Management, Business, Science and Arts Occupations
The most common Management, Business, Science and Arts occupations in Ponemah are Community & Social Service (22 | 10.7%), Education, Arts & Media (22 | 10.7%), and Business & Financial (15 | 7.3%).
Management, Business, Science and Arts Occupations by Sex
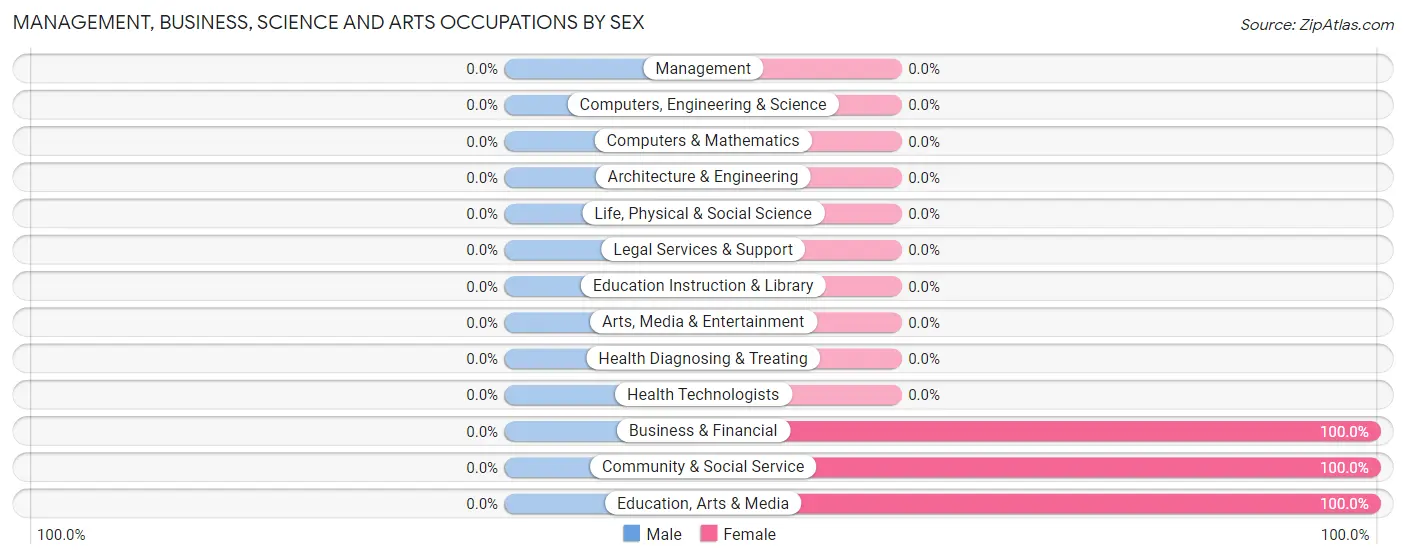
| Occupation | Male | Female |
| Management | 0 (0.0%) | 0 (0.0%) |
| Business & Financial | 0 (0.0%) | 15 (100.0%) |
| Computers, Engineering & Science | 0 (0.0%) | 0 (0.0%) |
| Computers & Mathematics | 0 (0.0%) | 0 (0.0%) |
| Architecture & Engineering | 0 (0.0%) | 0 (0.0%) |
| Life, Physical & Social Science | 0 (0.0%) | 0 (0.0%) |
| Community & Social Service | 0 (0.0%) | 22 (100.0%) |
| Education, Arts & Media | 0 (0.0%) | 22 (100.0%) |
| Legal Services & Support | 0 (0.0%) | 0 (0.0%) |
| Education Instruction & Library | 0 (0.0%) | 0 (0.0%) |
| Arts, Media & Entertainment | 0 (0.0%) | 0 (0.0%) |
| Health Diagnosing & Treating | 0 (0.0%) | 0 (0.0%) |
| Health Technologists | 0 (0.0%) | 0 (0.0%) |
| Total (Category) | 0 (0.0%) | 37 (100.0%) |
| Total (Overall) | 124 (60.5%) | 81 (39.5%) |
Services Occupations
The most common Services occupations in Ponemah are Security & Protection (78 | 38.1%), Firefighting & Prevention (55 | 26.8%), Law Enforcement (23 | 11.2%), and Cleaning & Maintenance (14 | 6.8%).

Services Occupations by Sex
Within the Services occupations in Ponemah, the most male-oriented occupations are Law Enforcement (100.0%), Cleaning & Maintenance (100.0%), and Security & Protection (85.9%), while the most female-oriented occupations are Firefighting & Prevention (20.0%), and Security & Protection (14.1%).
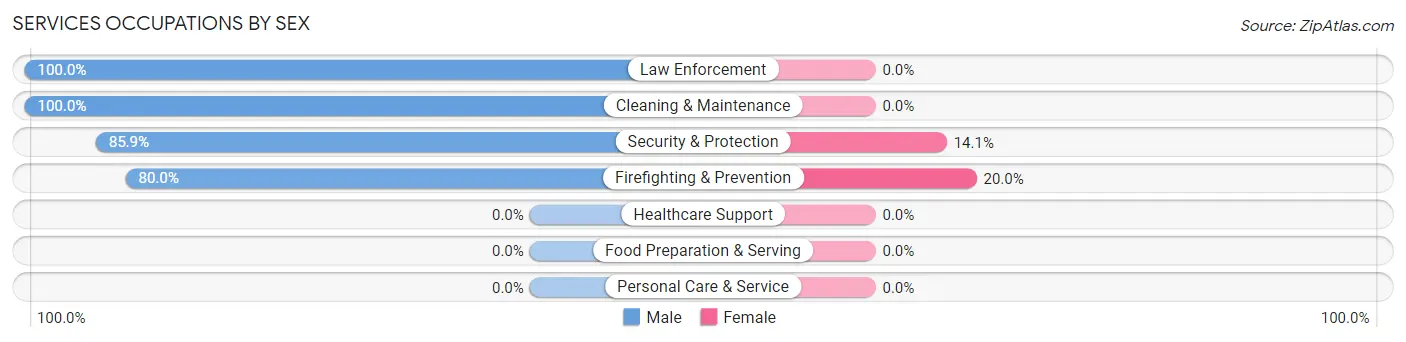
| Occupation | Male | Female |
| Healthcare Support | 0 (0.0%) | 0 (0.0%) |
| Security & Protection | 67 (85.9%) | 11 (14.1%) |
| Firefighting & Prevention | 44 (80.0%) | 11 (20.0%) |
| Law Enforcement | 23 (100.0%) | 0 (0.0%) |
| Food Preparation & Serving | 0 (0.0%) | 0 (0.0%) |
| Cleaning & Maintenance | 14 (100.0%) | 0 (0.0%) |
| Personal Care & Service | 0 (0.0%) | 0 (0.0%) |
| Total (Category) | 81 (88.0%) | 11 (12.0%) |
| Total (Overall) | 124 (60.5%) | 81 (39.5%) |
Sales and Office Occupations
The most common Sales and Office occupations in Ponemah are , and Office & Administration (35 | 17.1%).
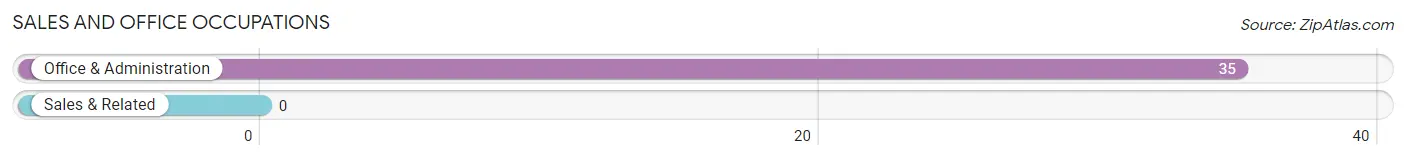
Sales and Office Occupations by Sex
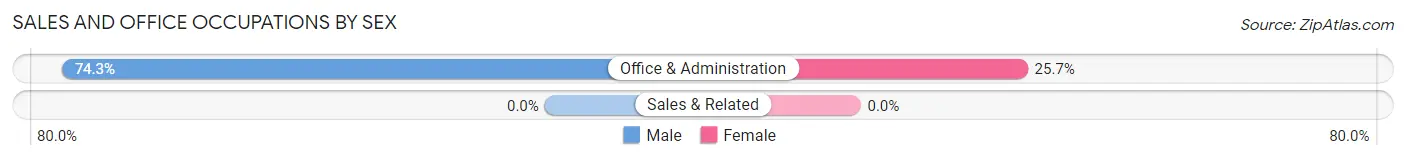
| Occupation | Male | Female |
| Sales & Related | 0 (0.0%) | 0 (0.0%) |
| Office & Administration | 26 (74.3%) | 9 (25.7%) |
| Total (Category) | 26 (74.3%) | 9 (25.7%) |
| Total (Overall) | 124 (60.5%) | 81 (39.5%) |
Natural Resources, Construction and Maintenance Occupations
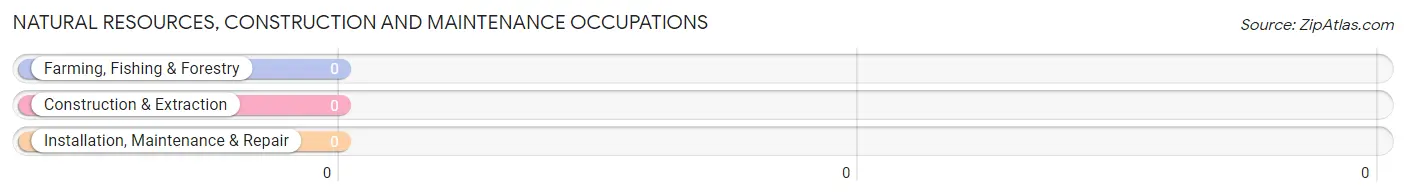
Natural Resources, Construction and Maintenance Occupations by Sex
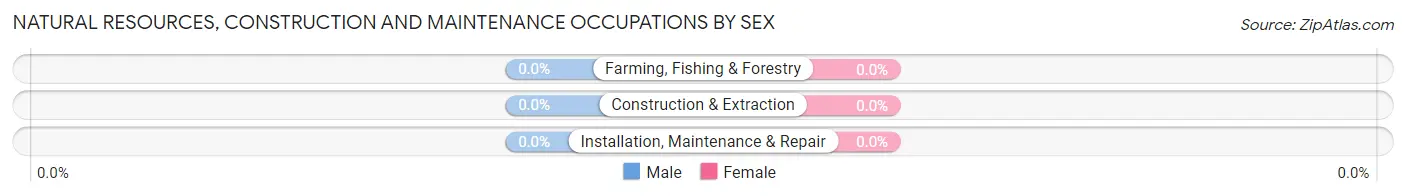
| Occupation | Male | Female |
| Farming, Fishing & Forestry | 0 (0.0%) | 0 (0.0%) |
| Construction & Extraction | 0 (0.0%) | 0 (0.0%) |
| Installation, Maintenance & Repair | 0 (0.0%) | 0 (0.0%) |
| Total (Category) | 0 (0.0%) | 0 (0.0%) |
| Total (Overall) | 124 (60.5%) | 81 (39.5%) |
Production, Transportation and Moving Occupations
The most common Production, Transportation and Moving occupations in Ponemah are Production (24 | 11.7%), and Transportation (17 | 8.3%).
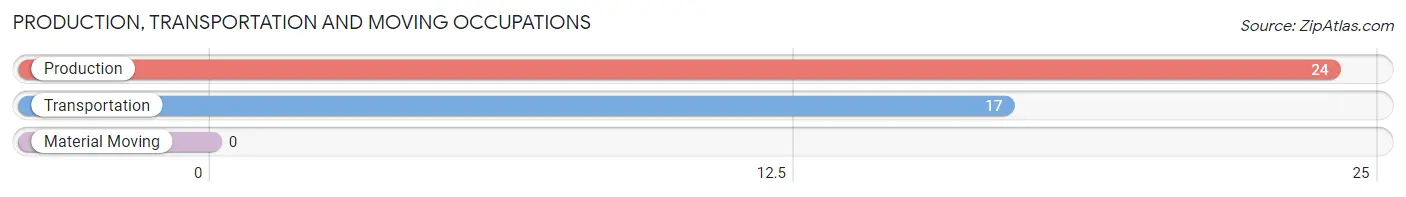
Production, Transportation and Moving Occupations by Sex

| Occupation | Male | Female |
| Production | 0 (0.0%) | 24 (100.0%) |
| Transportation | 17 (100.0%) | 0 (0.0%) |
| Material Moving | 0 (0.0%) | 0 (0.0%) |
| Total (Category) | 17 (41.5%) | 24 (58.5%) |
| Total (Overall) | 124 (60.5%) | 81 (39.5%) |
Employment Industries by Sex in Ponemah
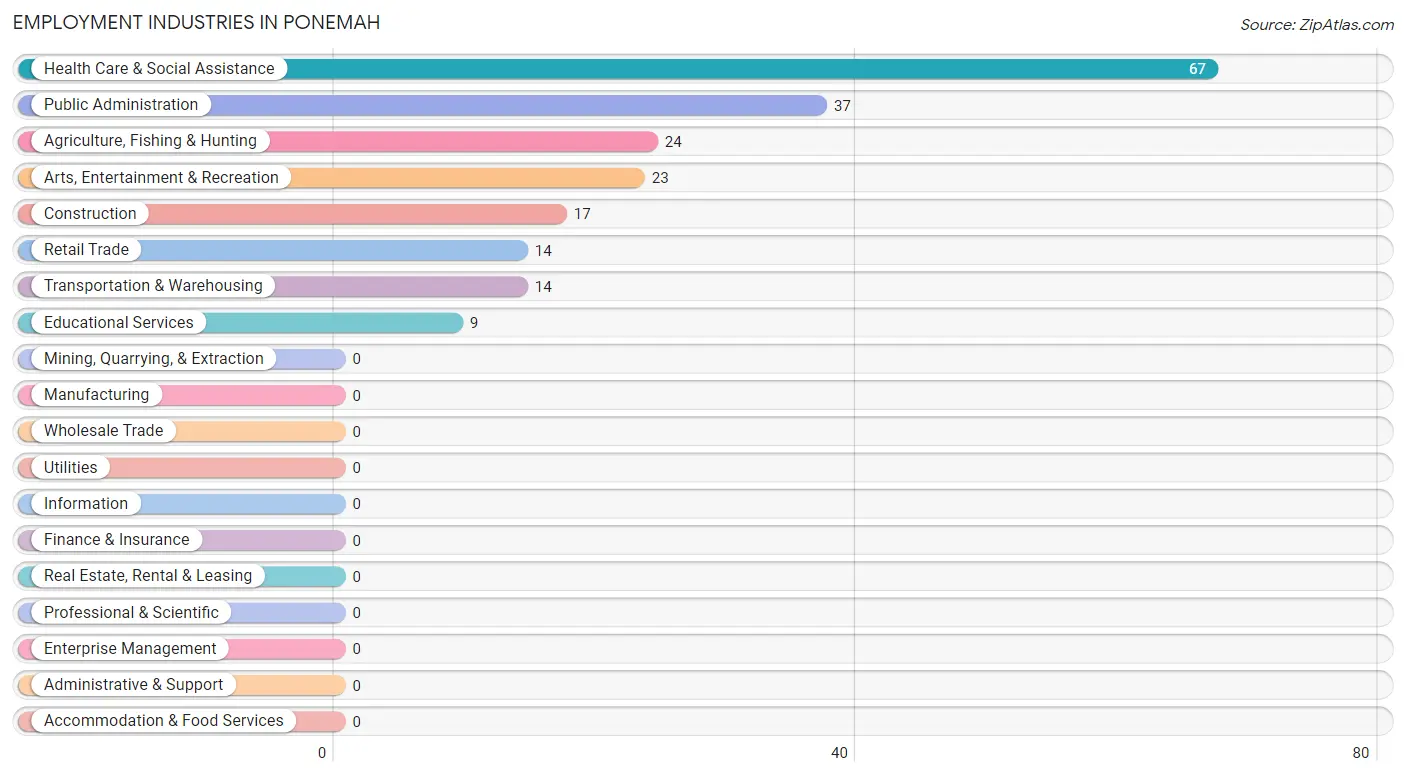
Employment Industries in Ponemah
The major employment industries in Ponemah include Health Care & Social Assistance (67 | 32.7%), Public Administration (37 | 18.0%), Agriculture, Fishing & Hunting (24 | 11.7%), Arts, Entertainment & Recreation (23 | 11.2%), and Construction (17 | 8.3%).
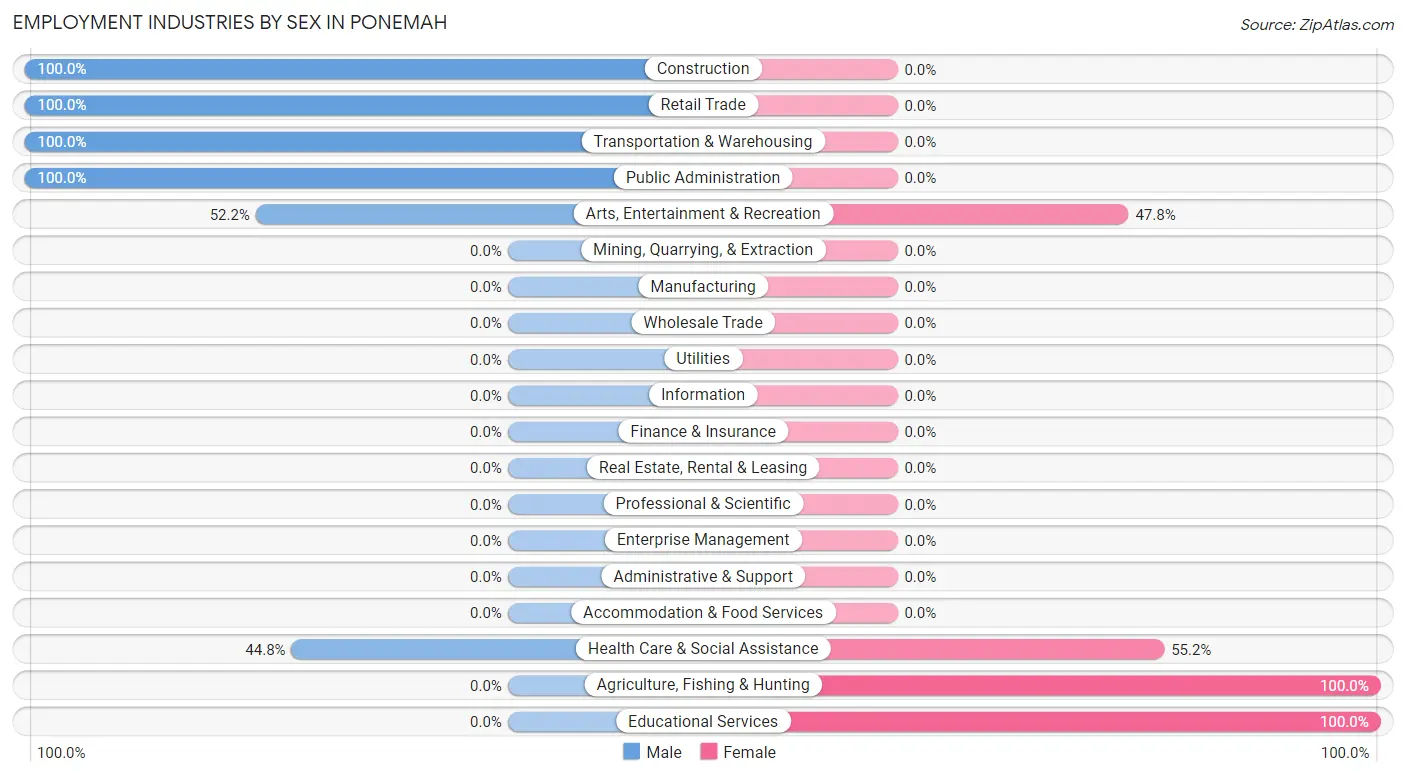
Employment Industries by Sex in Ponemah
The Ponemah industries that see more men than women are Construction (100.0%), Retail Trade (100.0%), and Transportation & Warehousing (100.0%), whereas the industries that tend to have a higher number of women are Agriculture, Fishing & Hunting (100.0%), Educational Services (100.0%), and Health Care & Social Assistance (55.2%).
| Industry | Male | Female |
| Agriculture, Fishing & Hunting | 0 (0.0%) | 24 (100.0%) |
| Mining, Quarrying, & Extraction | 0 (0.0%) | 0 (0.0%) |
| Construction | 17 (100.0%) | 0 (0.0%) |
| Manufacturing | 0 (0.0%) | 0 (0.0%) |
| Wholesale Trade | 0 (0.0%) | 0 (0.0%) |
| Retail Trade | 14 (100.0%) | 0 (0.0%) |
| Transportation & Warehousing | 14 (100.0%) | 0 (0.0%) |
| Utilities | 0 (0.0%) | 0 (0.0%) |
| Information | 0 (0.0%) | 0 (0.0%) |
| Finance & Insurance | 0 (0.0%) | 0 (0.0%) |
| Real Estate, Rental & Leasing | 0 (0.0%) | 0 (0.0%) |
| Professional & Scientific | 0 (0.0%) | 0 (0.0%) |
| Enterprise Management | 0 (0.0%) | 0 (0.0%) |
| Administrative & Support | 0 (0.0%) | 0 (0.0%) |
| Educational Services | 0 (0.0%) | 9 (100.0%) |
| Health Care & Social Assistance | 30 (44.8%) | 37 (55.2%) |
| Arts, Entertainment & Recreation | 12 (52.2%) | 11 (47.8%) |
| Accommodation & Food Services | 0 (0.0%) | 0 (0.0%) |
| Public Administration | 37 (100.0%) | 0 (0.0%) |
| Total | 124 (60.5%) | 81 (39.5%) |
Education in Ponemah
School Enrollment in Ponemah
The most common levels of schooling among the 366 students in Ponemah are middle school (174 | 47.5%), high school (88 | 24.0%), and elementary school (57 | 15.6%).
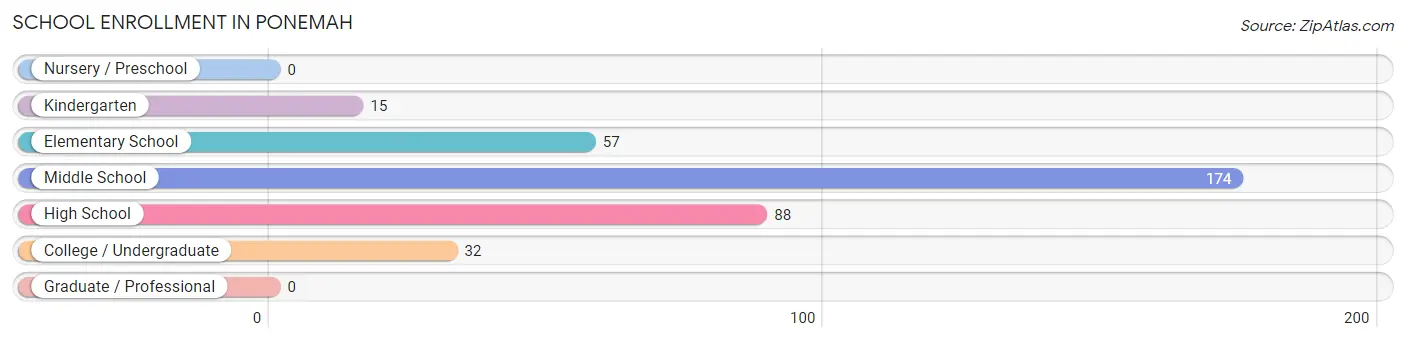
| School Level | # Students | % Students |
| Nursery / Preschool | 0 | 0.0% |
| Kindergarten | 15 | 4.1% |
| Elementary School | 57 | 15.6% |
| Middle School | 174 | 47.5% |
| High School | 88 | 24.0% |
| College / Undergraduate | 32 | 8.7% |
| Graduate / Professional | 0 | 0.0% |
| Total | 366 | 100.0% |
School Enrollment by Age by Funding Source in Ponemah
Out of a total of 366 students who are enrolled in schools in Ponemah, 18 (4.9%) attend a private institution, while the remaining 348 (95.1%) are enrolled in public schools. The age group of 5 to 9 year old has the highest likelihood of being enrolled in private schools, with 18 (35.3% in the age bracket) enrolled. Conversely, the age group of 10 to 14 year olds has the lowest likelihood of being enrolled in a private school, with 195 (100.0% in the age bracket) attending a public institution.
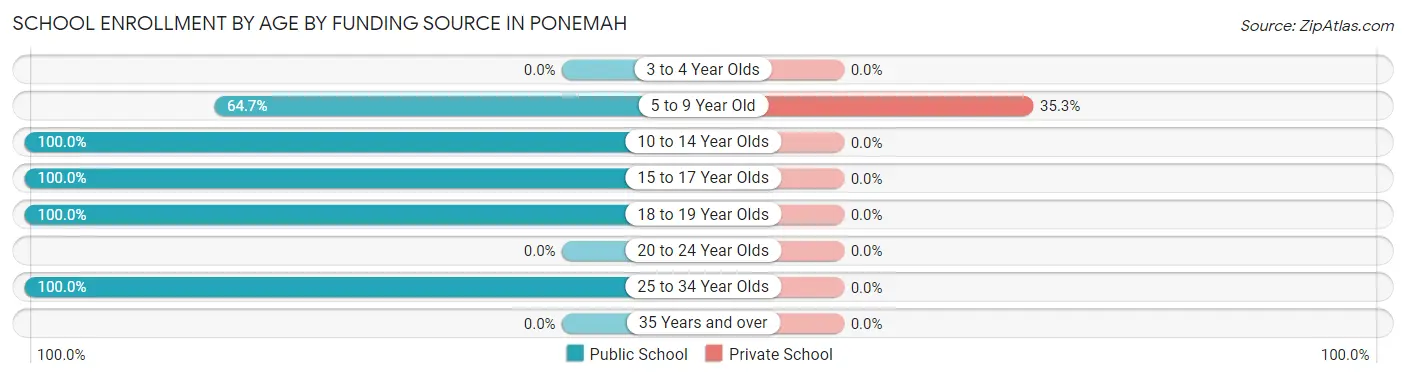
| Age Bracket | Public School | Private School |
| 3 to 4 Year Olds | 0 (0.0%) | 0 (0.0%) |
| 5 to 9 Year Old | 33 (64.7%) | 18 (35.3%) |
| 10 to 14 Year Olds | 195 (100.0%) | 0 (0.0%) |
| 15 to 17 Year Olds | 71 (100.0%) | 0 (0.0%) |
| 18 to 19 Year Olds | 17 (100.0%) | 0 (0.0%) |
| 20 to 24 Year Olds | 0 (0.0%) | 0 (0.0%) |
| 25 to 34 Year Olds | 32 (100.0%) | 0 (0.0%) |
| 35 Years and over | 0 (0.0%) | 0 (0.0%) |
| Total | 348 (95.1%) | 18 (4.9%) |
Educational Attainment by Field of Study in Ponemah
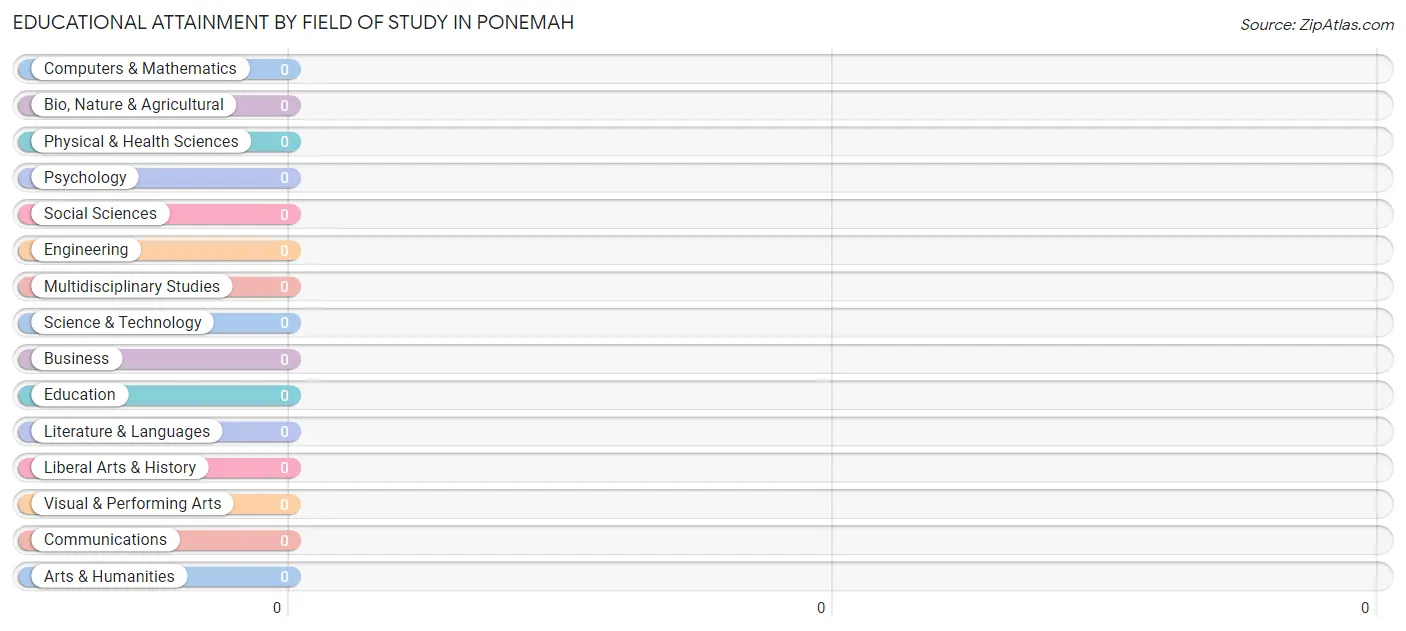
| Field of Study | # Graduates | % Graduates |
| Computers & Mathematics | 0 | 0.0% |
| Bio, Nature & Agricultural | 0 | 0.0% |
| Physical & Health Sciences | 0 | 0.0% |
| Psychology | 0 | 0.0% |
| Social Sciences | 0 | 0.0% |
| Engineering | 0 | 0.0% |
| Multidisciplinary Studies | 0 | 0.0% |
| Science & Technology | 0 | 0.0% |
| Business | 0 | 0.0% |
| Education | 0 | 0.0% |
| Literature & Languages | 0 | 0.0% |
| Liberal Arts & History | 0 | 0.0% |
| Visual & Performing Arts | 0 | 0.0% |
| Communications | 0 | 0.0% |
| Arts & Humanities | 0 | 0.0% |
| Total | 0 | 0.0% |
Transportation & Commute in Ponemah
Vehicle Availability by Sex in Ponemah
The most prevalent vehicle ownership categories in Ponemah are males with 5 or more vehicles (46, accounting for 31.3%) and females with 5 or more vehicles (0, making up 68.7%).
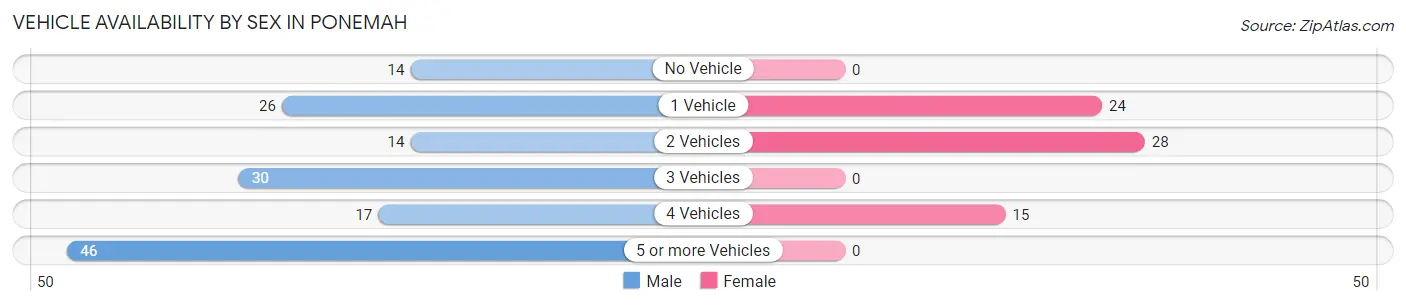
| Vehicles Available | Male | Female |
| No Vehicle | 14 (9.5%) | 0 (0.0%) |
| 1 Vehicle | 26 (17.7%) | 24 (35.8%) |
| 2 Vehicles | 14 (9.5%) | 28 (41.8%) |
| 3 Vehicles | 30 (20.4%) | 0 (0.0%) |
| 4 Vehicles | 17 (11.6%) | 15 (22.4%) |
| 5 or more Vehicles | 46 (31.3%) | 0 (0.0%) |
| Total | 147 (100.0%) | 67 (100.0%) |
Commute Time in Ponemah
The most frequently occuring commute durations in Ponemah are 45 to 59 minutes (108 commuters, 50.5%), 90 or more minutes (31 commuters, 14.5%), and 5 to 9 minutes (28 commuters, 13.1%).
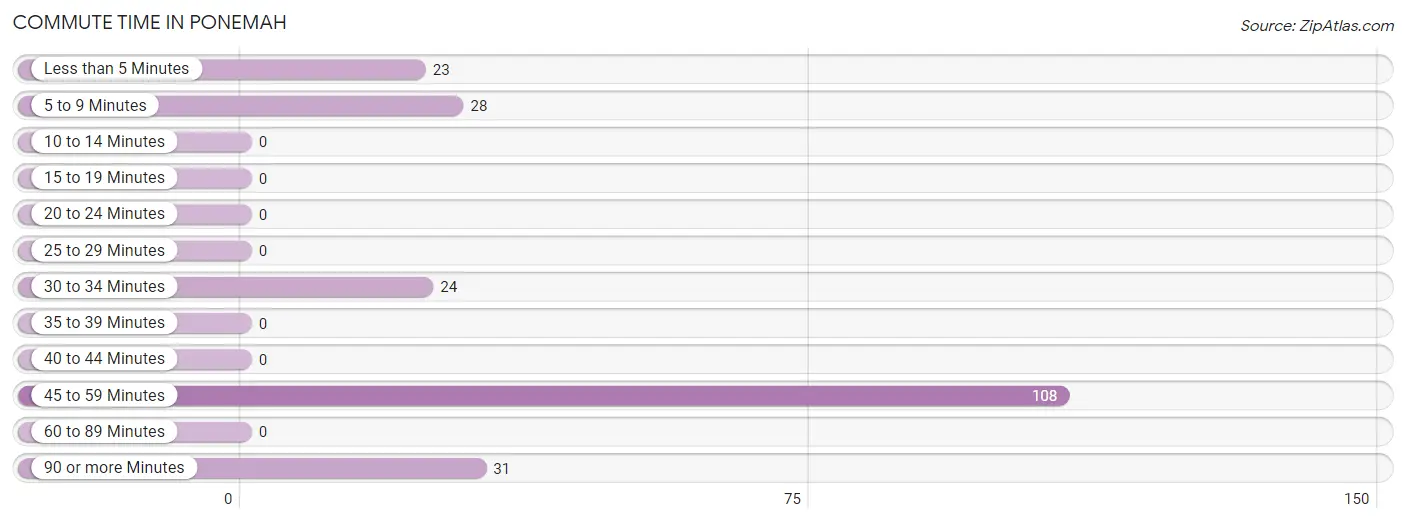
| Commute Time | # Commuters | % Commuters |
| Less than 5 Minutes | 23 | 10.7% |
| 5 to 9 Minutes | 28 | 13.1% |
| 10 to 14 Minutes | 0 | 0.0% |
| 15 to 19 Minutes | 0 | 0.0% |
| 20 to 24 Minutes | 0 | 0.0% |
| 25 to 29 Minutes | 0 | 0.0% |
| 30 to 34 Minutes | 24 | 11.2% |
| 35 to 39 Minutes | 0 | 0.0% |
| 40 to 44 Minutes | 0 | 0.0% |
| 45 to 59 Minutes | 108 | 50.5% |
| 60 to 89 Minutes | 0 | 0.0% |
| 90 or more Minutes | 31 | 14.5% |
Commute Time by Sex in Ponemah
The most common commute times in Ponemah are 45 to 59 minutes (93 commuters, 63.3%) for males and 30 to 34 minutes (24 commuters, 35.8%) for females.
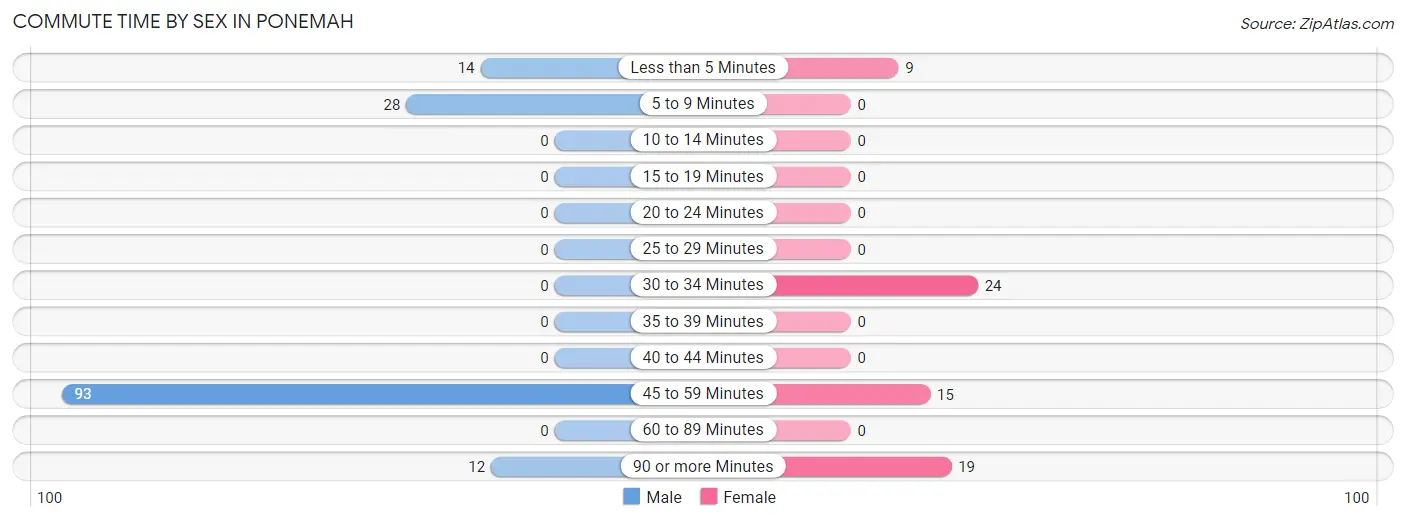
| Commute Time | Male | Female |
| Less than 5 Minutes | 14 (9.5%) | 9 (13.4%) |
| 5 to 9 Minutes | 28 (19.1%) | 0 (0.0%) |
| 10 to 14 Minutes | 0 (0.0%) | 0 (0.0%) |
| 15 to 19 Minutes | 0 (0.0%) | 0 (0.0%) |
| 20 to 24 Minutes | 0 (0.0%) | 0 (0.0%) |
| 25 to 29 Minutes | 0 (0.0%) | 0 (0.0%) |
| 30 to 34 Minutes | 0 (0.0%) | 24 (35.8%) |
| 35 to 39 Minutes | 0 (0.0%) | 0 (0.0%) |
| 40 to 44 Minutes | 0 (0.0%) | 0 (0.0%) |
| 45 to 59 Minutes | 93 (63.3%) | 15 (22.4%) |
| 60 to 89 Minutes | 0 (0.0%) | 0 (0.0%) |
| 90 or more Minutes | 12 (8.2%) | 19 (28.4%) |
Time of Departure to Work by Sex in Ponemah
The most frequent times of departure to work in Ponemah are 7:00 AM to 7:29 AM (46, 31.3%) for males and 7:30 AM to 7:59 AM (24, 35.8%) for females.
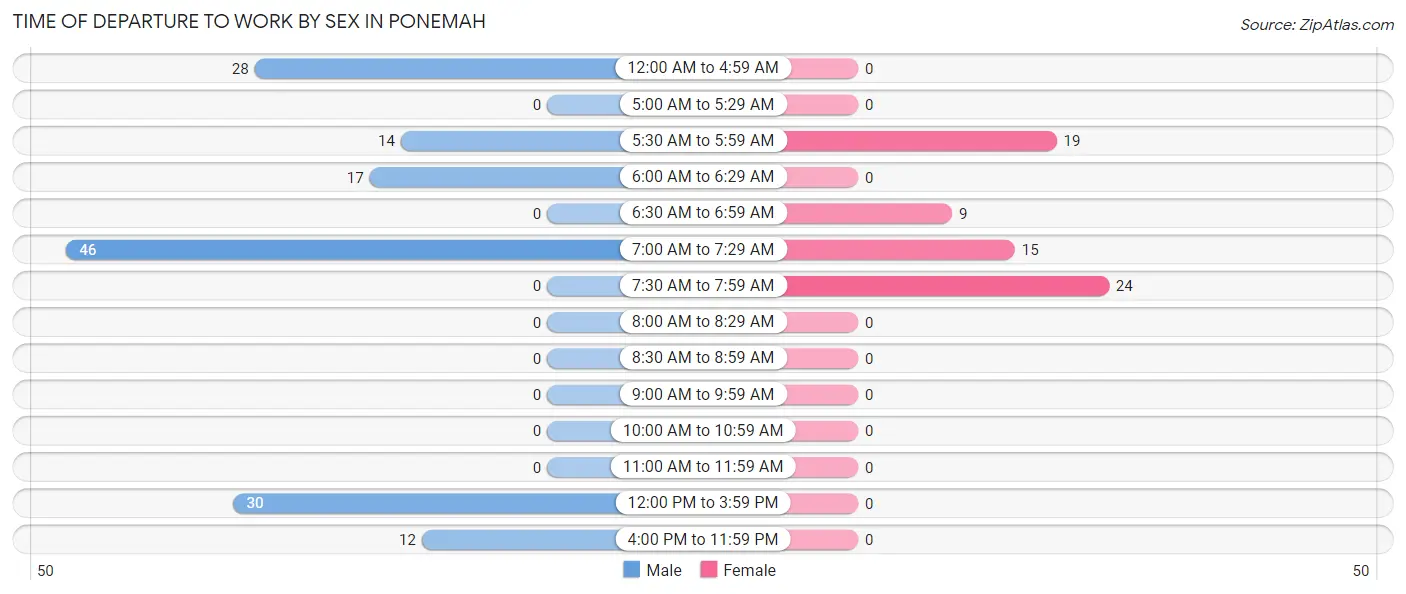
| Time of Departure | Male | Female |
| 12:00 AM to 4:59 AM | 28 (19.1%) | 0 (0.0%) |
| 5:00 AM to 5:29 AM | 0 (0.0%) | 0 (0.0%) |
| 5:30 AM to 5:59 AM | 14 (9.5%) | 19 (28.4%) |
| 6:00 AM to 6:29 AM | 17 (11.6%) | 0 (0.0%) |
| 6:30 AM to 6:59 AM | 0 (0.0%) | 9 (13.4%) |
| 7:00 AM to 7:29 AM | 46 (31.3%) | 15 (22.4%) |
| 7:30 AM to 7:59 AM | 0 (0.0%) | 24 (35.8%) |
| 8:00 AM to 8:29 AM | 0 (0.0%) | 0 (0.0%) |
| 8:30 AM to 8:59 AM | 0 (0.0%) | 0 (0.0%) |
| 9:00 AM to 9:59 AM | 0 (0.0%) | 0 (0.0%) |
| 10:00 AM to 10:59 AM | 0 (0.0%) | 0 (0.0%) |
| 11:00 AM to 11:59 AM | 0 (0.0%) | 0 (0.0%) |
| 12:00 PM to 3:59 PM | 30 (20.4%) | 0 (0.0%) |
| 4:00 PM to 11:59 PM | 12 (8.2%) | 0 (0.0%) |
| Total | 147 (100.0%) | 67 (100.0%) |
Housing Occupancy in Ponemah
Occupancy by Ownership in Ponemah
Of the total 151 dwellings in Ponemah, owner-occupied units account for 67 (44.4%), while renter-occupied units make up 84 (55.6%).
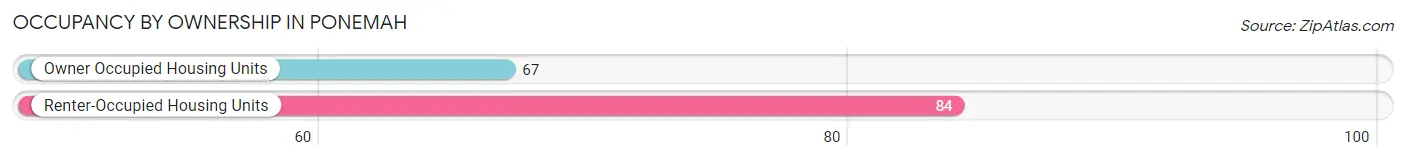
| Occupancy | # Housing Units | % Housing Units |
| Owner Occupied Housing Units | 67 | 44.4% |
| Renter-Occupied Housing Units | 84 | 55.6% |
| Total Occupied Housing Units | 151 | 100.0% |
Occupancy by Household Size in Ponemah
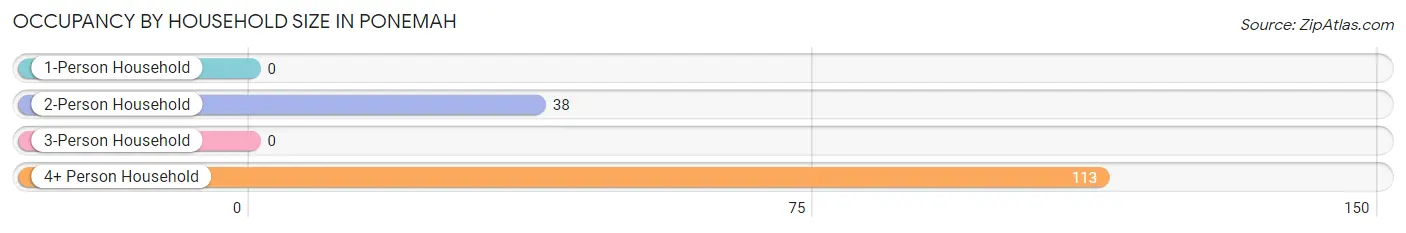
| Household Size | # Housing Units | % Housing Units |
| 1-Person Household | 0 | 0.0% |
| 2-Person Household | 38 | 25.2% |
| 3-Person Household | 0 | 0.0% |
| 4+ Person Household | 113 | 74.8% |
| Total Housing Units | 151 | 100.0% |
Occupancy by Ownership by Household Size in Ponemah
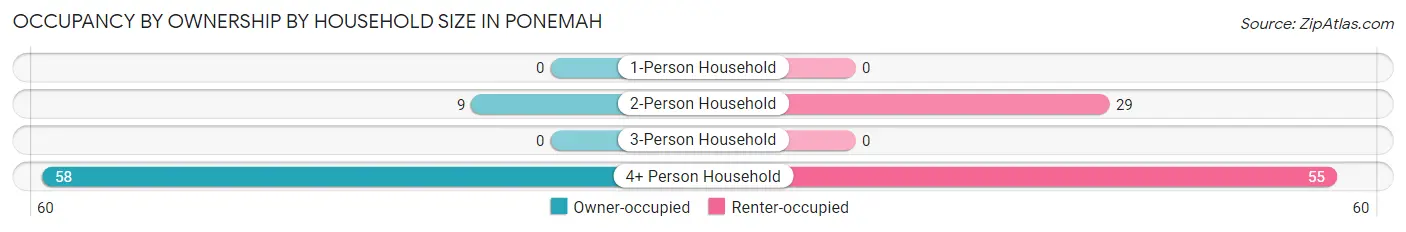
| Household Size | Owner-occupied | Renter-occupied |
| 1-Person Household | 0 (0.0%) | 0 (0.0%) |
| 2-Person Household | 9 (23.7%) | 29 (76.3%) |
| 3-Person Household | 0 (0.0%) | 0 (0.0%) |
| 4+ Person Household | 58 (51.3%) | 55 (48.7%) |
| Total Housing Units | 67 (44.4%) | 84 (55.6%) |
Occupancy by Educational Attainment in Ponemah
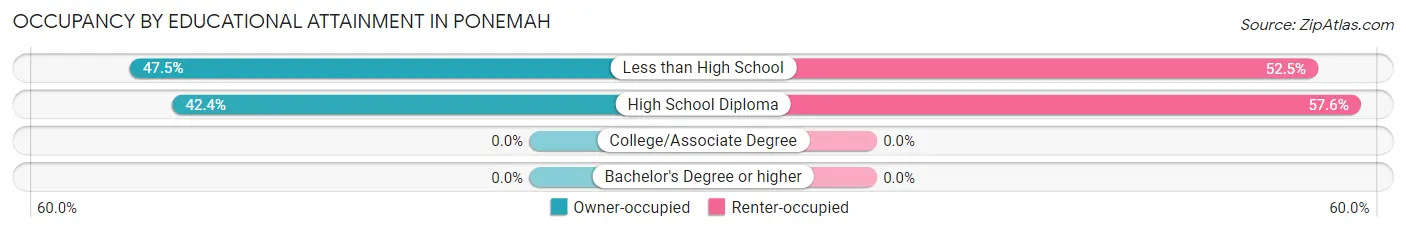
| Household Size | Owner-occupied | Renter-occupied |
| Less than High School | 28 (47.5%) | 31 (52.5%) |
| High School Diploma | 39 (42.4%) | 53 (57.6%) |
| College/Associate Degree | 0 (0.0%) | 0 (0.0%) |
| Bachelor's Degree or higher | 0 (0.0%) | 0 (0.0%) |
Occupancy by Age of Householder in Ponemah
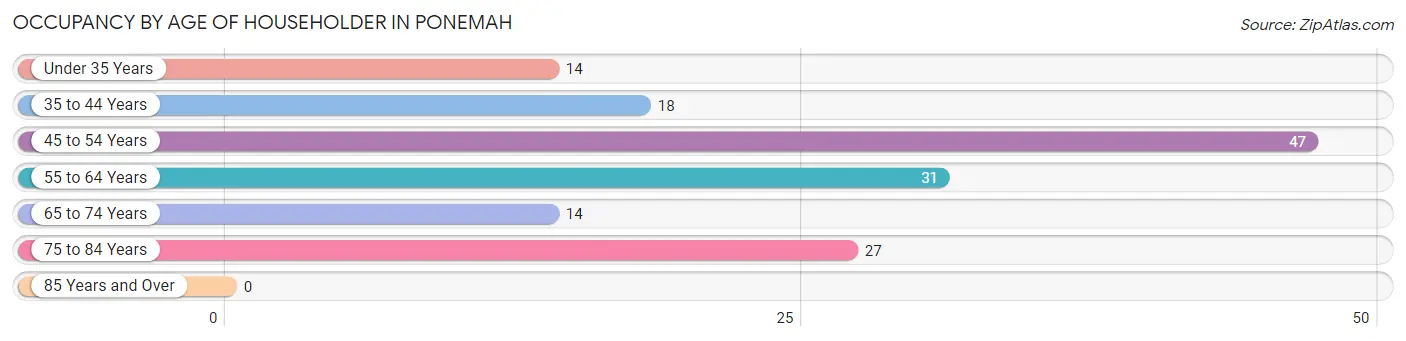
| Age Bracket | # Households | % Households |
| Under 35 Years | 14 | 9.3% |
| 35 to 44 Years | 18 | 11.9% |
| 45 to 54 Years | 47 | 31.1% |
| 55 to 64 Years | 31 | 20.5% |
| 65 to 74 Years | 14 | 9.3% |
| 75 to 84 Years | 27 | 17.9% |
| 85 Years and Over | 0 | 0.0% |
| Total | 151 | 100.0% |
Housing Finances in Ponemah
Median Income by Occupancy in Ponemah
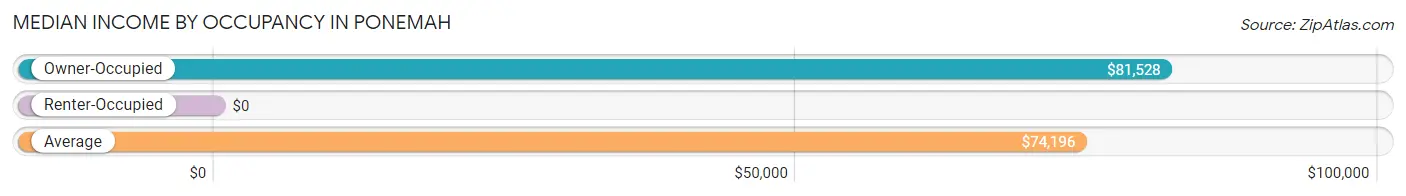
| Occupancy Type | # Households | Median Income |
| Owner-Occupied | 67 (44.4%) | $81,528 |
| Renter-Occupied | 84 (55.6%) | $0 |
| Average | 151 (100.0%) | $74,196 |
Occupancy by Householder Income Bracket in Ponemah
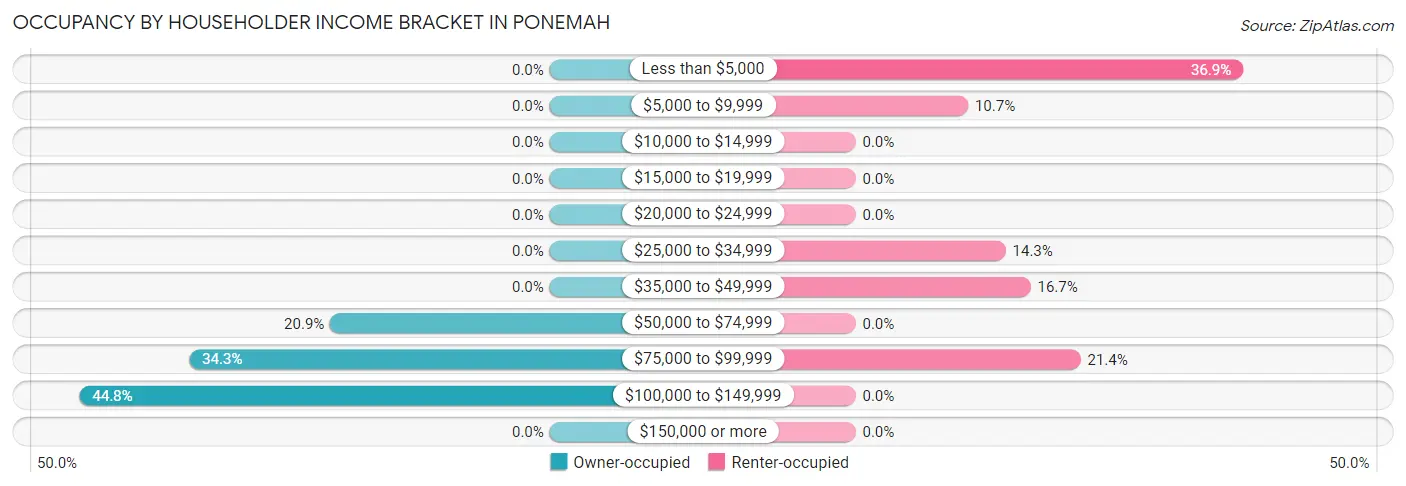
| Income Bracket | Owner-occupied | Renter-occupied |
| Less than $5,000 | 0 (0.0%) | 31 (36.9%) |
| $5,000 to $9,999 | 0 (0.0%) | 9 (10.7%) |
| $10,000 to $14,999 | 0 (0.0%) | 0 (0.0%) |
| $15,000 to $19,999 | 0 (0.0%) | 0 (0.0%) |
| $20,000 to $24,999 | 0 (0.0%) | 0 (0.0%) |
| $25,000 to $34,999 | 0 (0.0%) | 12 (14.3%) |
| $35,000 to $49,999 | 0 (0.0%) | 14 (16.7%) |
| $50,000 to $74,999 | 14 (20.9%) | 0 (0.0%) |
| $75,000 to $99,999 | 23 (34.3%) | 18 (21.4%) |
| $100,000 to $149,999 | 30 (44.8%) | 0 (0.0%) |
| $150,000 or more | 0 (0.0%) | 0 (0.0%) |
| Total | 67 (100.0%) | 84 (100.0%) |
Monthly Housing Cost Tiers in Ponemah
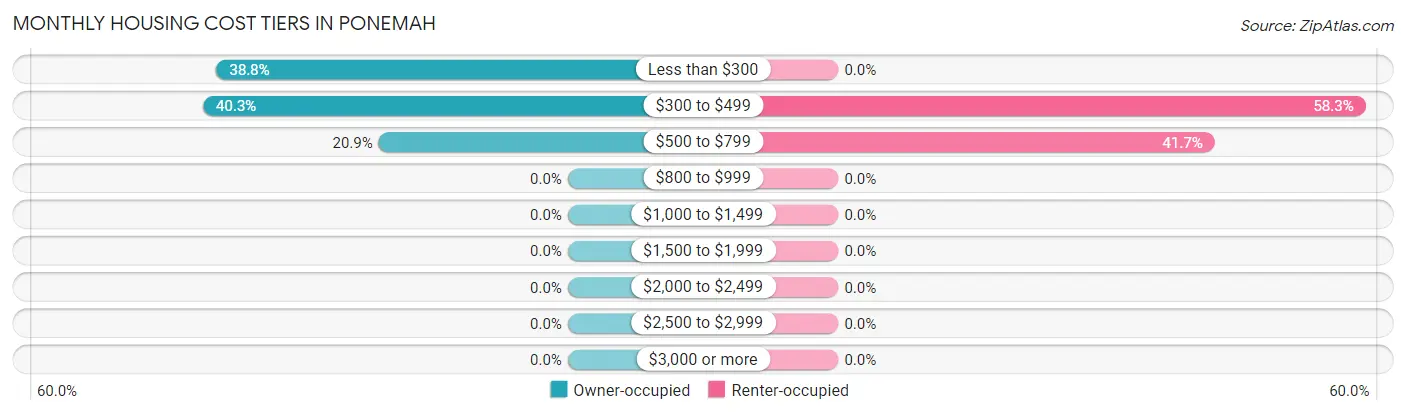
| Monthly Cost | Owner-occupied | Renter-occupied |
| Less than $300 | 26 (38.8%) | 0 (0.0%) |
| $300 to $499 | 27 (40.3%) | 49 (58.3%) |
| $500 to $799 | 14 (20.9%) | 35 (41.7%) |
| $800 to $999 | 0 (0.0%) | 0 (0.0%) |
| $1,000 to $1,499 | 0 (0.0%) | 0 (0.0%) |
| $1,500 to $1,999 | 0 (0.0%) | 0 (0.0%) |
| $2,000 to $2,499 | 0 (0.0%) | 0 (0.0%) |
| $2,500 to $2,999 | 0 (0.0%) | 0 (0.0%) |
| $3,000 or more | 0 (0.0%) | 0 (0.0%) |
| Total | 67 (100.0%) | 84 (100.0%) |
Physical Housing Characteristics in Ponemah
Housing Structures in Ponemah
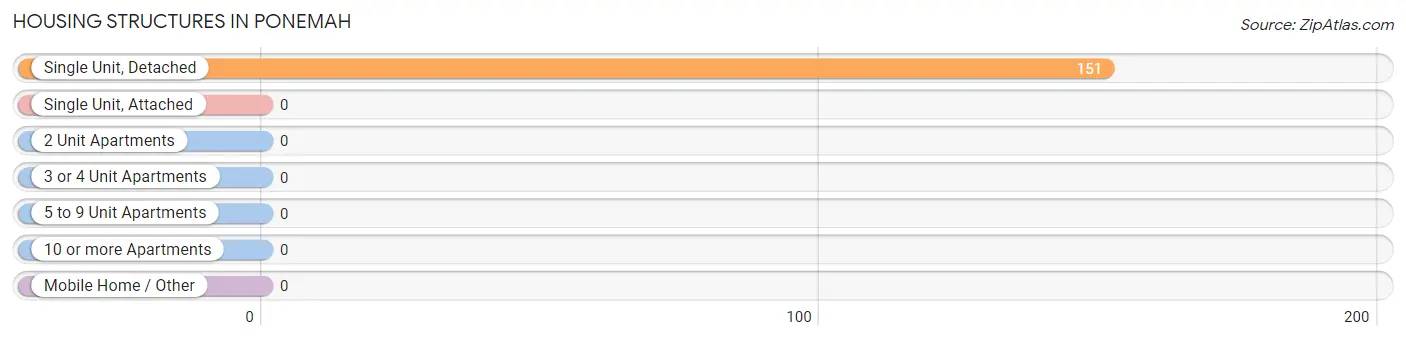
| Structure Type | # Housing Units | % Housing Units |
| Single Unit, Detached | 151 | 100.0% |
| Single Unit, Attached | 0 | 0.0% |
| 2 Unit Apartments | 0 | 0.0% |
| 3 or 4 Unit Apartments | 0 | 0.0% |
| 5 to 9 Unit Apartments | 0 | 0.0% |
| 10 or more Apartments | 0 | 0.0% |
| Mobile Home / Other | 0 | 0.0% |
| Total | 151 | 100.0% |
Housing Structures by Occupancy in Ponemah
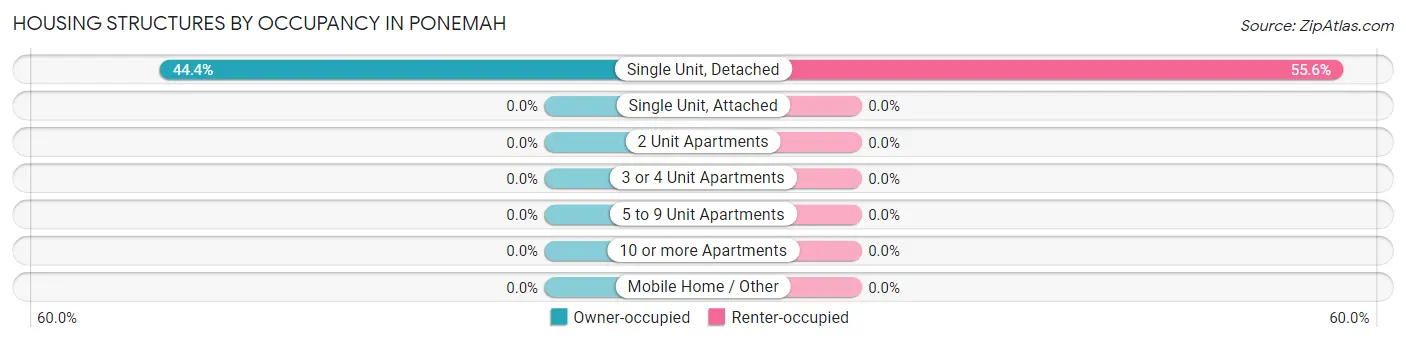
| Structure Type | Owner-occupied | Renter-occupied |
| Single Unit, Detached | 67 (44.4%) | 84 (55.6%) |
| Single Unit, Attached | 0 (0.0%) | 0 (0.0%) |
| 2 Unit Apartments | 0 (0.0%) | 0 (0.0%) |
| 3 or 4 Unit Apartments | 0 (0.0%) | 0 (0.0%) |
| 5 to 9 Unit Apartments | 0 (0.0%) | 0 (0.0%) |
| 10 or more Apartments | 0 (0.0%) | 0 (0.0%) |
| Mobile Home / Other | 0 (0.0%) | 0 (0.0%) |
| Total | 67 (44.4%) | 84 (55.6%) |
Housing Structures by Number of Rooms in Ponemah
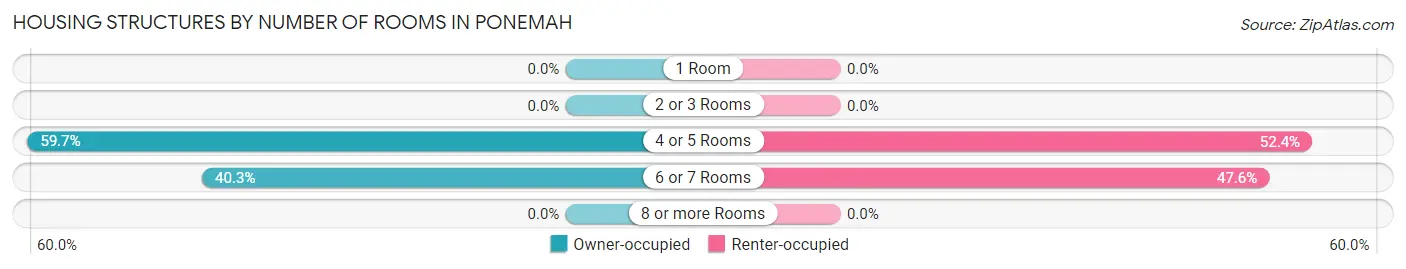
| Number of Rooms | Owner-occupied | Renter-occupied |
| 1 Room | 0 (0.0%) | 0 (0.0%) |
| 2 or 3 Rooms | 0 (0.0%) | 0 (0.0%) |
| 4 or 5 Rooms | 40 (59.7%) | 44 (52.4%) |
| 6 or 7 Rooms | 27 (40.3%) | 40 (47.6%) |
| 8 or more Rooms | 0 (0.0%) | 0 (0.0%) |
| Total | 67 (100.0%) | 84 (100.0%) |
Housing Structure by Heating Type in Ponemah
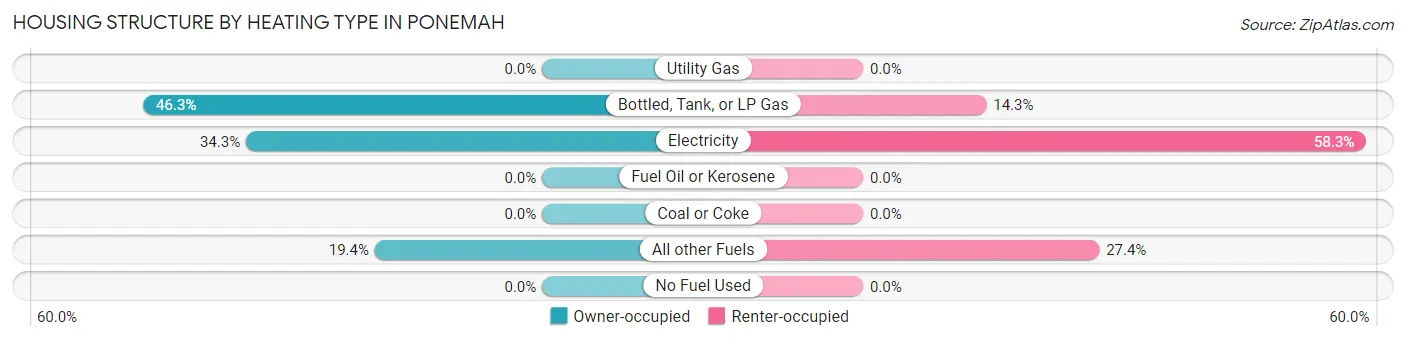
| Heating Type | Owner-occupied | Renter-occupied |
| Utility Gas | 0 (0.0%) | 0 (0.0%) |
| Bottled, Tank, or LP Gas | 31 (46.3%) | 12 (14.3%) |
| Electricity | 23 (34.3%) | 49 (58.3%) |
| Fuel Oil or Kerosene | 0 (0.0%) | 0 (0.0%) |
| Coal or Coke | 0 (0.0%) | 0 (0.0%) |
| All other Fuels | 13 (19.4%) | 23 (27.4%) |
| No Fuel Used | 0 (0.0%) | 0 (0.0%) |
| Total | 67 (100.0%) | 84 (100.0%) |
Household Vehicle Usage in Ponemah
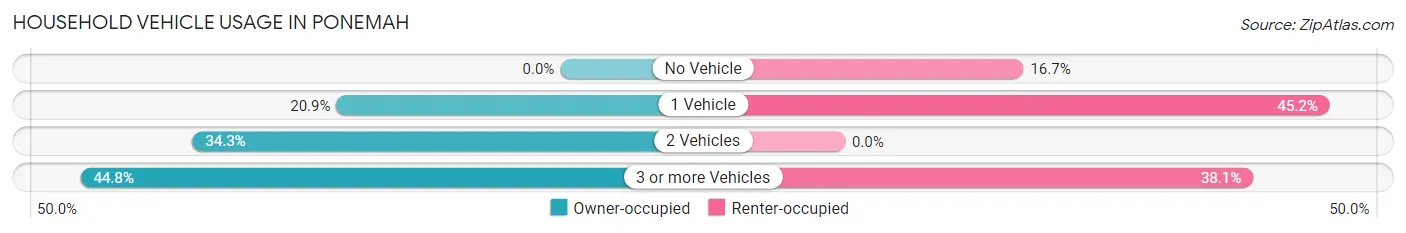
| Vehicles per Household | Owner-occupied | Renter-occupied |
| No Vehicle | 0 (0.0%) | 14 (16.7%) |
| 1 Vehicle | 14 (20.9%) | 38 (45.2%) |
| 2 Vehicles | 23 (34.3%) | 0 (0.0%) |
| 3 or more Vehicles | 30 (44.8%) | 32 (38.1%) |
| Total | 67 (100.0%) | 84 (100.0%) |
Real Estate & Mortgages in Ponemah
Real Estate and Mortgage Overview in Ponemah
| Characteristic | Without Mortgage | With Mortgage |
| Housing Units | 67 | 0 |
| Median Property Value | $102,700 | $0 |
| Median Household Income | $81,528 | $0 |
| Monthly Housing Costs | $377 | $0 |
| Real Estate Taxes | - | - |
Property Value by Mortgage Status in Ponemah
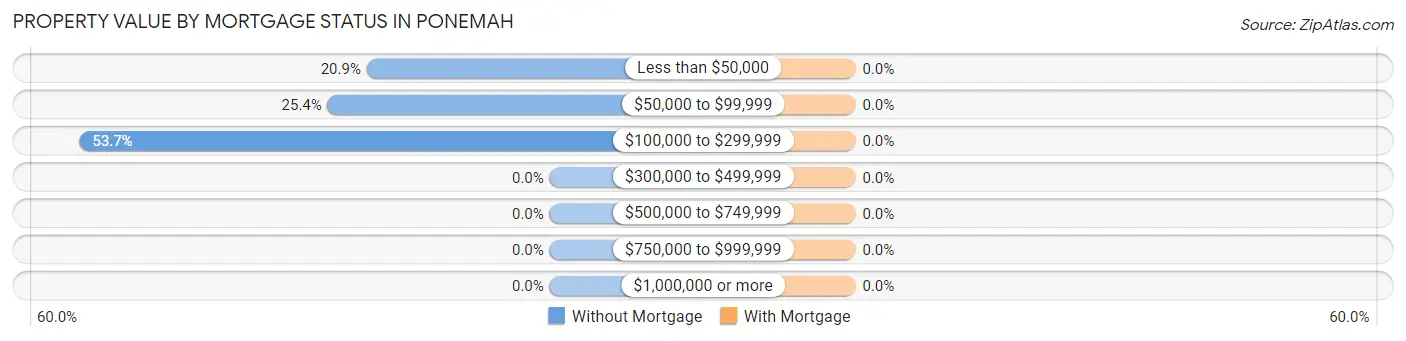
| Property Value | Without Mortgage | With Mortgage |
| Less than $50,000 | 14 (20.9%) | 0 (0.0%) |
| $50,000 to $99,999 | 17 (25.4%) | 0 (0.0%) |
| $100,000 to $299,999 | 36 (53.7%) | 0 (0.0%) |
| $300,000 to $499,999 | 0 (0.0%) | 0 (0.0%) |
| $500,000 to $749,999 | 0 (0.0%) | 0 (0.0%) |
| $750,000 to $999,999 | 0 (0.0%) | 0 (0.0%) |
| $1,000,000 or more | 0 (0.0%) | 0 (0.0%) |
| Total | 67 (100.0%) | 0 (0.0%) |
Household Income by Mortgage Status in Ponemah
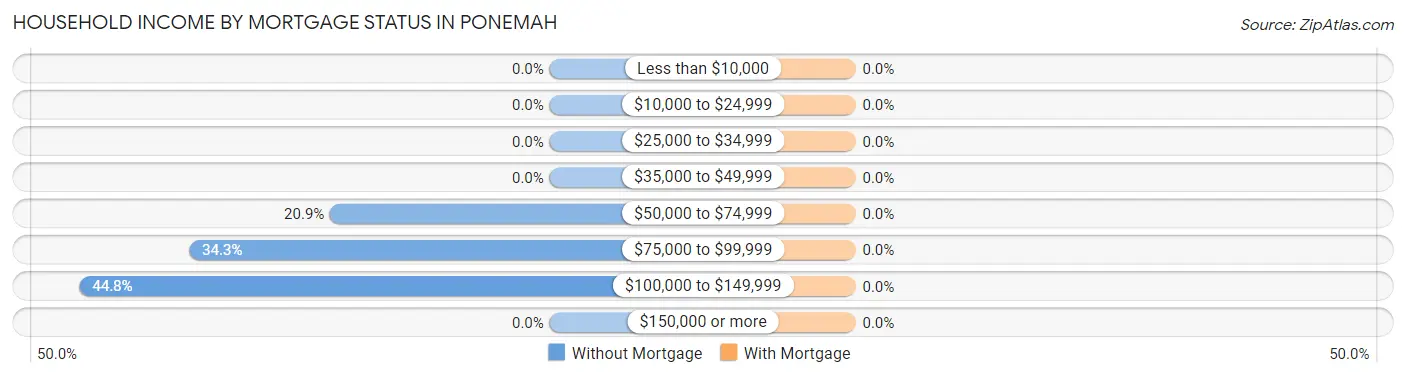
| Household Income | Without Mortgage | With Mortgage |
| Less than $10,000 | 0 (0.0%) | 0 (0.0%) |
| $10,000 to $24,999 | 0 (0.0%) | 0 (0.0%) |
| $25,000 to $34,999 | 0 (0.0%) | 0 (0.0%) |
| $35,000 to $49,999 | 0 (0.0%) | 0 (0.0%) |
| $50,000 to $74,999 | 14 (20.9%) | 0 (0.0%) |
| $75,000 to $99,999 | 23 (34.3%) | 0 (0.0%) |
| $100,000 to $149,999 | 30 (44.8%) | 0 (0.0%) |
| $150,000 or more | 0 (0.0%) | 0 (0.0%) |
| Total | 67 (100.0%) | 0 (0.0%) |
Property Value to Household Income Ratio in Ponemah
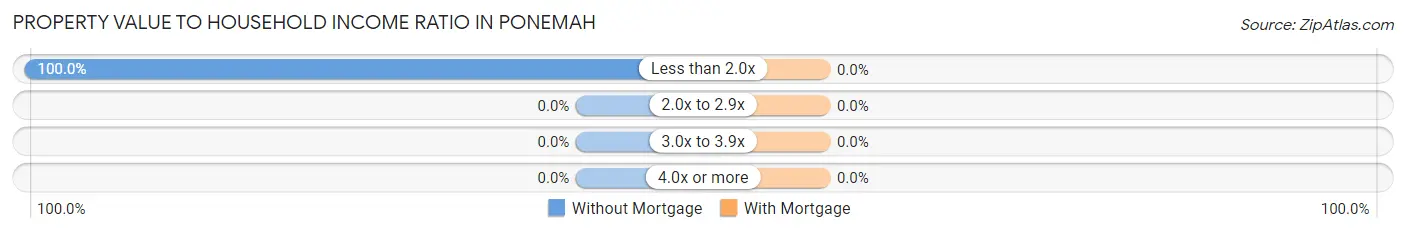
| Value-to-Income Ratio | Without Mortgage | With Mortgage |
| Less than 2.0x | 67 (100.0%) | 0 (0.0%) |
| 2.0x to 2.9x | 0 (0.0%) | 0 (0.0%) |
| 3.0x to 3.9x | 0 (0.0%) | 0 (0.0%) |
| 4.0x or more | 0 (0.0%) | 0 (0.0%) |
| Total | 67 (100.0%) | 0 (0.0%) |
Real Estate Taxes by Mortgage Status in Ponemah
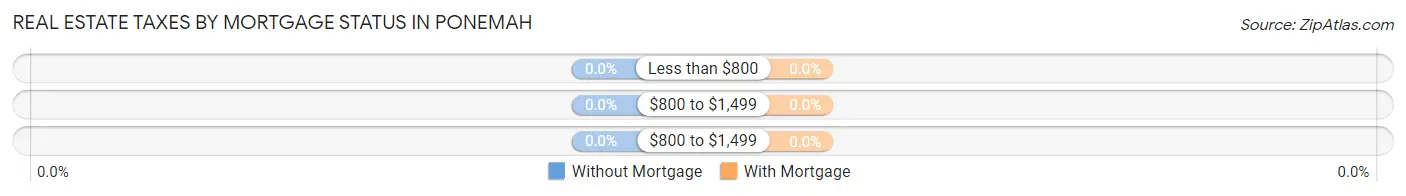
| Property Taxes | Without Mortgage | With Mortgage |
| Less than $800 | 0 (0.0%) | 0 (0.0%) |
| $800 to $1,499 | 0 (0.0%) | 0 (0.0%) |
| $800 to $1,499 | 0 (0.0%) | 0 (0.0%) |
| Total | 67 (100.0%) | 0 (0.0%) |
Health & Disability in Ponemah
Health Insurance Coverage by Age in Ponemah
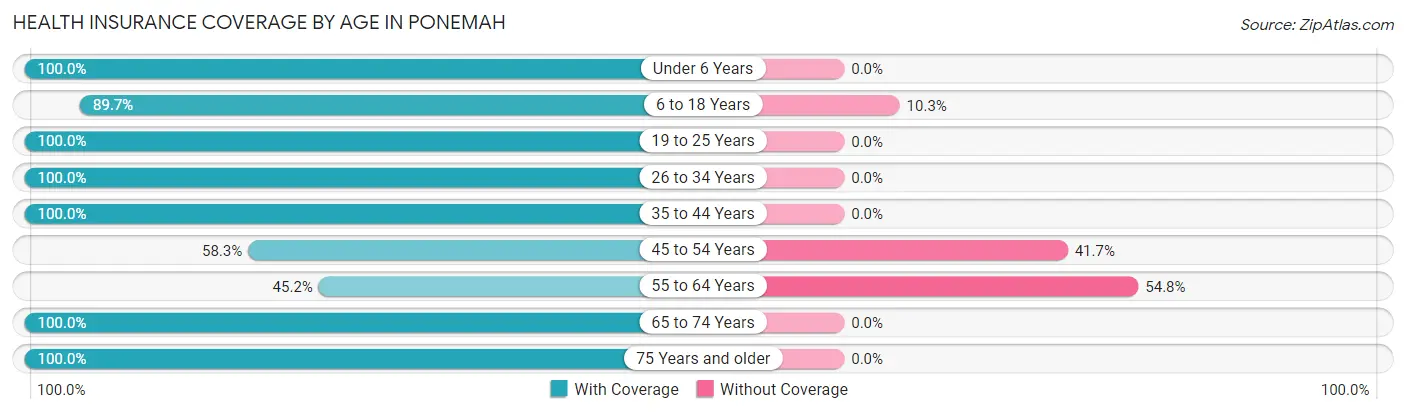
| Age Bracket | With Coverage | Without Coverage |
| Under 6 Years | 107 (100.0%) | 0 (0.0%) |
| 6 to 18 Years | 304 (89.7%) | 35 (10.3%) |
| 19 to 25 Years | 43 (100.0%) | 0 (0.0%) |
| 26 to 34 Years | 95 (100.0%) | 0 (0.0%) |
| 35 to 44 Years | 48 (100.0%) | 0 (0.0%) |
| 45 to 54 Years | 49 (58.3%) | 35 (41.7%) |
| 55 to 64 Years | 14 (45.2%) | 17 (54.8%) |
| 65 to 74 Years | 36 (100.0%) | 0 (0.0%) |
| 75 Years and older | 46 (100.0%) | 0 (0.0%) |
| Total | 742 (89.5%) | 87 (10.5%) |
Health Insurance Coverage by Citizenship Status in Ponemah
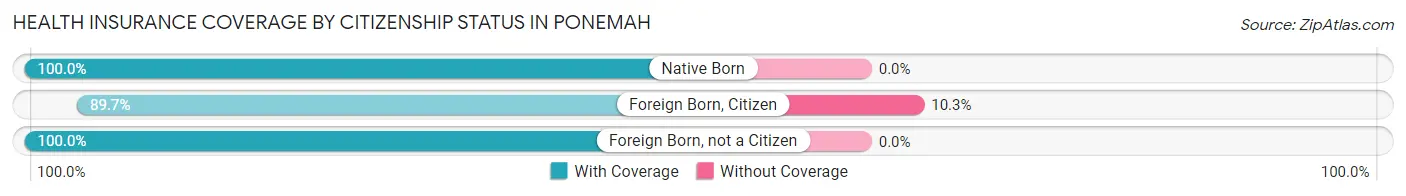
| Citizenship Status | With Coverage | Without Coverage |
| Native Born | 107 (100.0%) | 0 (0.0%) |
| Foreign Born, Citizen | 304 (89.7%) | 35 (10.3%) |
| Foreign Born, not a Citizen | 43 (100.0%) | 0 (0.0%) |
Health Insurance Coverage by Household Income in Ponemah
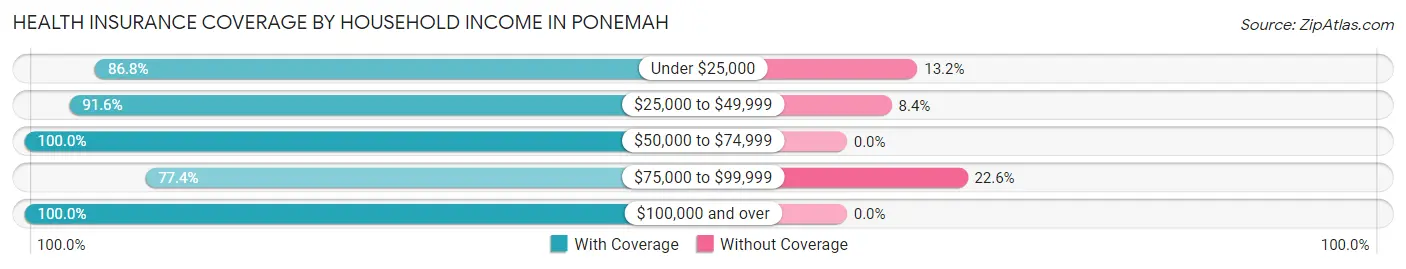
| Household Income | With Coverage | Without Coverage |
| Under $25,000 | 230 (86.8%) | 35 (13.2%) |
| $25,000 to $49,999 | 131 (91.6%) | 12 (8.4%) |
| $50,000 to $74,999 | 91 (100.0%) | 0 (0.0%) |
| $75,000 to $99,999 | 137 (77.4%) | 40 (22.6%) |
| $100,000 and over | 153 (100.0%) | 0 (0.0%) |
Public vs Private Health Insurance Coverage by Age in Ponemah
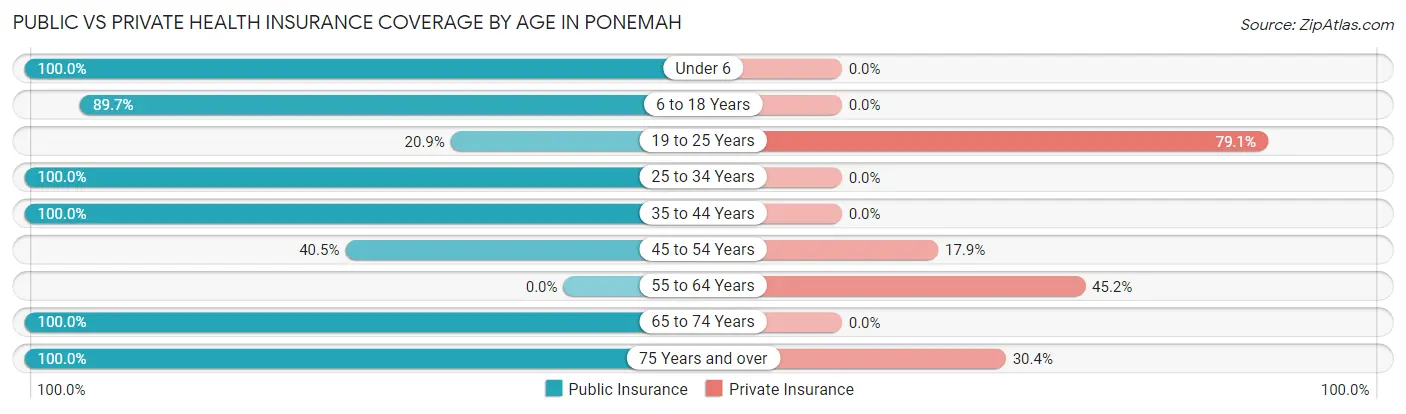
| Age Bracket | Public Insurance | Private Insurance |
| Under 6 | 107 (100.0%) | 0 (0.0%) |
| 6 to 18 Years | 304 (89.7%) | 0 (0.0%) |
| 19 to 25 Years | 9 (20.9%) | 34 (79.1%) |
| 25 to 34 Years | 95 (100.0%) | 0 (0.0%) |
| 35 to 44 Years | 48 (100.0%) | 0 (0.0%) |
| 45 to 54 Years | 34 (40.5%) | 15 (17.9%) |
| 55 to 64 Years | 0 (0.0%) | 14 (45.2%) |
| 65 to 74 Years | 36 (100.0%) | 0 (0.0%) |
| 75 Years and over | 46 (100.0%) | 14 (30.4%) |
| Total | 679 (81.9%) | 77 (9.3%) |
Disability Status by Sex by Age in Ponemah
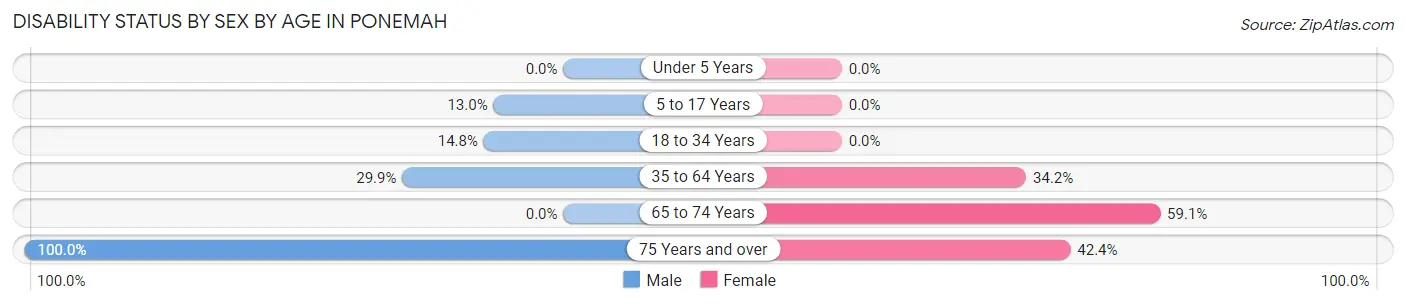
| Age Bracket | Male | Female |
| Under 5 Years | 0 (0.0%) | 0 (0.0%) |
| 5 to 17 Years | 31 (13.0%) | 0 (0.0%) |
| 18 to 34 Years | 13 (14.8%) | 0 (0.0%) |
| 35 to 64 Years | 26 (29.9%) | 26 (34.2%) |
| 65 to 74 Years | 0 (0.0%) | 13 (59.1%) |
| 75 Years and over | 13 (100.0%) | 14 (42.4%) |
Disability Class by Sex by Age in Ponemah
Disability Class: Hearing Difficulty
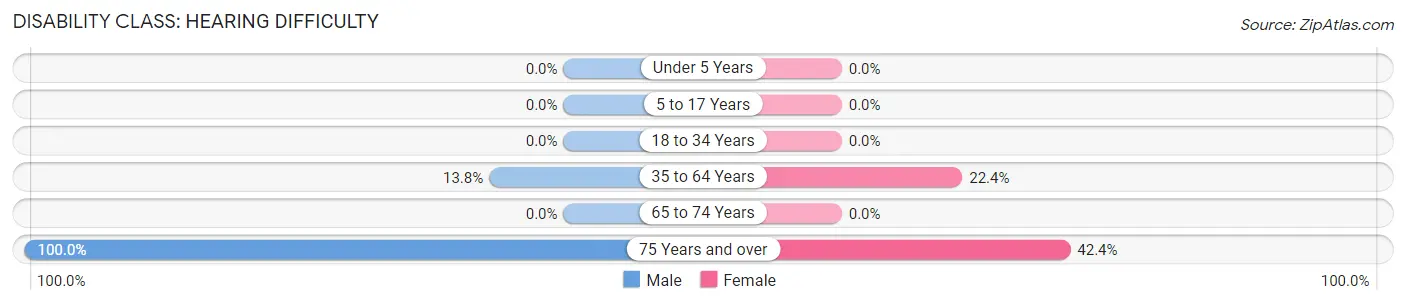
| Age Bracket | Male | Female |
| Under 5 Years | 0 (0.0%) | 0 (0.0%) |
| 5 to 17 Years | 0 (0.0%) | 0 (0.0%) |
| 18 to 34 Years | 0 (0.0%) | 0 (0.0%) |
| 35 to 64 Years | 12 (13.8%) | 17 (22.4%) |
| 65 to 74 Years | 0 (0.0%) | 0 (0.0%) |
| 75 Years and over | 13 (100.0%) | 14 (42.4%) |
Disability Class: Vision Difficulty
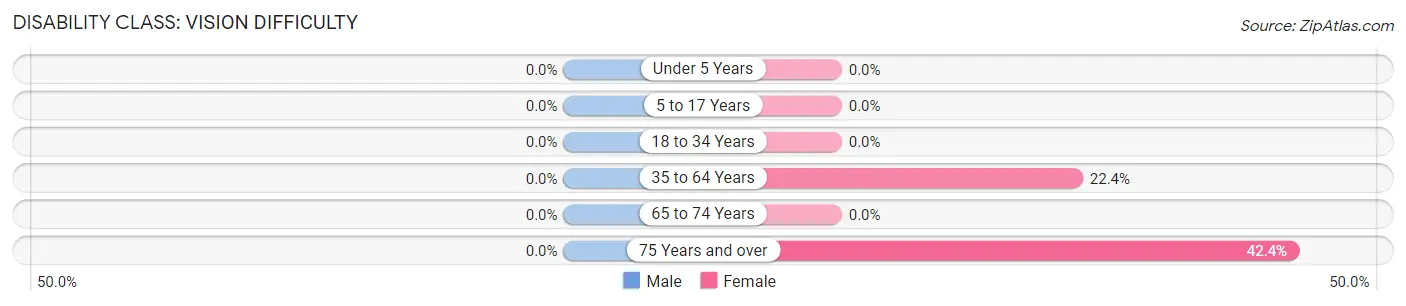
| Age Bracket | Male | Female |
| Under 5 Years | 0 (0.0%) | 0 (0.0%) |
| 5 to 17 Years | 0 (0.0%) | 0 (0.0%) |
| 18 to 34 Years | 0 (0.0%) | 0 (0.0%) |
| 35 to 64 Years | 0 (0.0%) | 17 (22.4%) |
| 65 to 74 Years | 0 (0.0%) | 0 (0.0%) |
| 75 Years and over | 0 (0.0%) | 14 (42.4%) |
Disability Class: Cognitive Difficulty
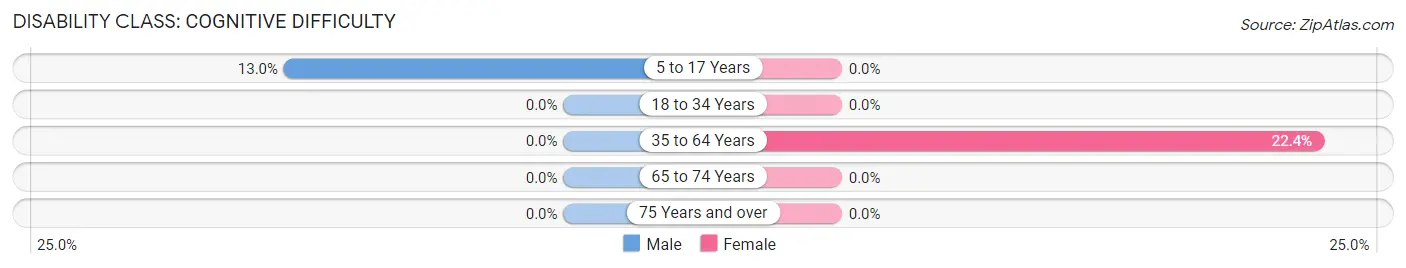
| Age Bracket | Male | Female |
| 5 to 17 Years | 31 (13.0%) | 0 (0.0%) |
| 18 to 34 Years | 0 (0.0%) | 0 (0.0%) |
| 35 to 64 Years | 0 (0.0%) | 17 (22.4%) |
| 65 to 74 Years | 0 (0.0%) | 0 (0.0%) |
| 75 Years and over | 0 (0.0%) | 0 (0.0%) |
Disability Class: Ambulatory Difficulty
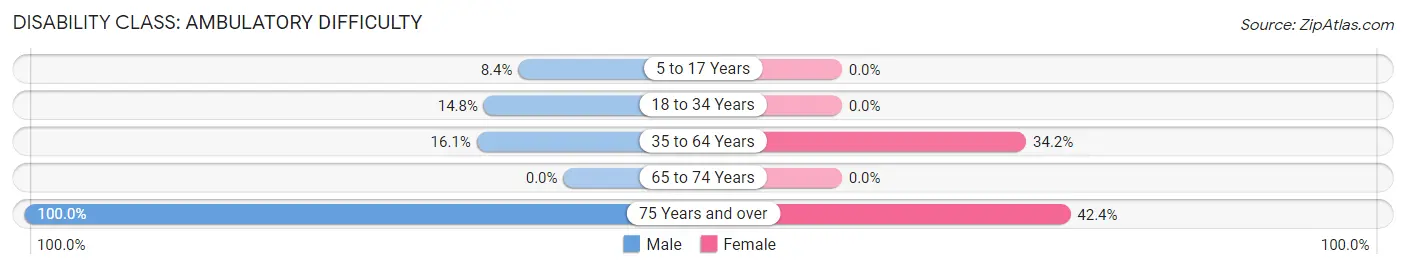
| Age Bracket | Male | Female |
| 5 to 17 Years | 20 (8.4%) | 0 (0.0%) |
| 18 to 34 Years | 13 (14.8%) | 0 (0.0%) |
| 35 to 64 Years | 14 (16.1%) | 26 (34.2%) |
| 65 to 74 Years | 0 (0.0%) | 0 (0.0%) |
| 75 Years and over | 13 (100.0%) | 14 (42.4%) |
Disability Class: Self-Care Difficulty
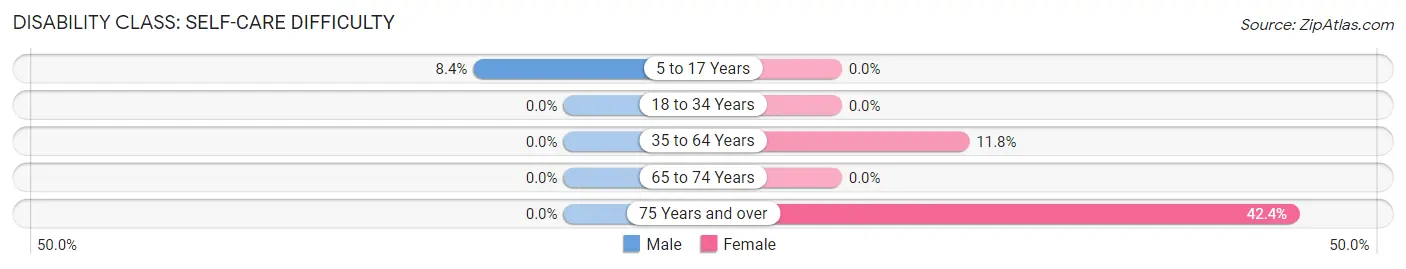
| Age Bracket | Male | Female |
| 5 to 17 Years | 20 (8.4%) | 0 (0.0%) |
| 18 to 34 Years | 0 (0.0%) | 0 (0.0%) |
| 35 to 64 Years | 0 (0.0%) | 9 (11.8%) |
| 65 to 74 Years | 0 (0.0%) | 0 (0.0%) |
| 75 Years and over | 0 (0.0%) | 14 (42.4%) |
Technology Access in Ponemah
Computing Device Access in Ponemah
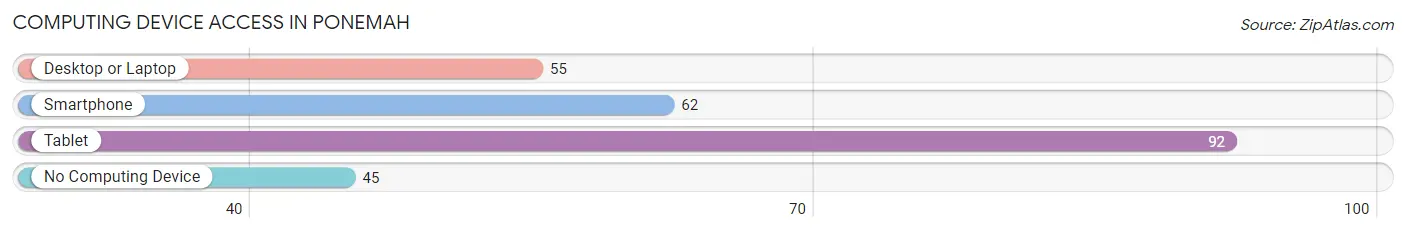
| Device Type | # Households | % Households |
| Desktop or Laptop | 55 | 36.4% |
| Smartphone | 62 | 41.1% |
| Tablet | 92 | 60.9% |
| No Computing Device | 45 | 29.8% |
| Total | 151 | 100.0% |
Internet Access in Ponemah
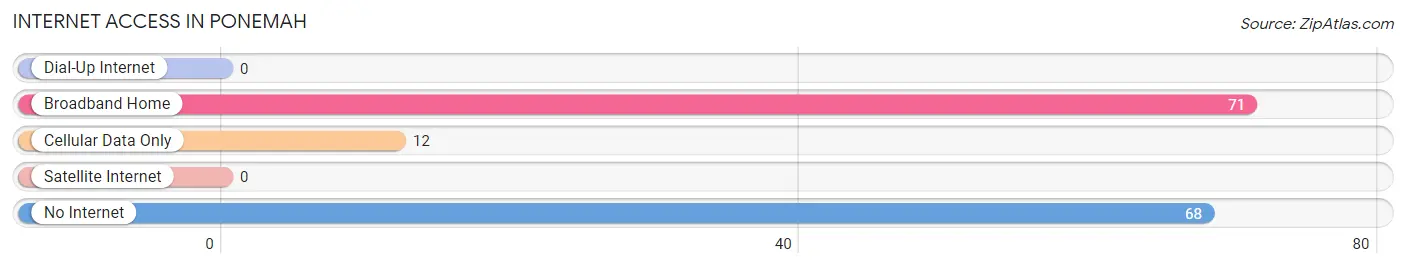
| Internet Type | # Households | % Households |
| Dial-Up Internet | 0 | 0.0% |
| Broadband Home | 71 | 47.0% |
| Cellular Data Only | 12 | 8.0% |
| Satellite Internet | 0 | 0.0% |
| No Internet | 68 | 45.0% |
| Total | 151 | 100.0% |
Ponemah Summary
Ponemah is a small unincorporated community located in the Red Lake Indian Reservation in Beltrami County, Minnesota. It is located on the western shore of Red Lake, the largest natural lake in the state. The population of Ponemah was estimated to be around 500 in 2020.
History
Ponemah is an Ojibwe word meaning “place of the setting sun”. The area was first settled by the Ojibwe people in the late 1800s. The first permanent settlement was established in 1883 when the Red Lake Indian Agency was established. The agency was responsible for the administration of the Red Lake Indian Reservation.
The first school in Ponemah was established in 1885. The school was run by the Bureau of Indian Affairs and was the first school in the area to offer education to Native American children. The school was later replaced by the Ponemah School in 1910. The school was operated by the Red Lake Band of Chippewa Indians until it closed in the late 1970s.
The first post office in Ponemah was established in 1887. The post office was located in the Ponemah Trading Post, which was owned by the Red Lake Band of Chippewa Indians. The post office was closed in the late 1970s.
Geography
Ponemah is located on the western shore of Red Lake, the largest natural lake in Minnesota. The lake is approximately 25 miles long and 10 miles wide. The lake is fed by the Red Lake River and is connected to the Mississippi River by the Red Lake River.
The area around Ponemah is mostly flat with some rolling hills. The terrain is mostly covered in pine and hardwood forests. The area is also home to a variety of wildlife, including deer, bear, and moose.
Economy
The economy of Ponemah is largely based on tourism and fishing. The area is popular for its fishing, hunting, and camping opportunities. The Red Lake Indian Reservation is also home to several casinos, which attract visitors from all over the region.
The Red Lake Band of Chippewa Indians also operates several businesses in the area, including a gas station, convenience store, and restaurant. The tribe also operates a fish hatchery and a fish processing plant.
Demographics
The population of Ponemah was estimated to be around 500 in 2020. The majority of the population is Native American, with the Red Lake Band of Chippewa Indians making up the majority of the population. The median age of the population is 33. The median household income is $25,000. The poverty rate is estimated to be around 40%.
Common Questions
What is Per Capita Income in Ponemah?
Per Capita income in Ponemah is $12,392.
What is the Median Family Income in Ponemah?
Median Family Income in Ponemah is $41,397.
What is the Median Household income in Ponemah?
Median Household Income in Ponemah is $74,196.
What is Inequality or Gini Index in Ponemah?
Inequality or Gini Index in Ponemah is 0.41.
What is the Total Population of Ponemah?
Total Population of Ponemah is 852.
What is the Total Male Population of Ponemah?
Total Male Population of Ponemah is 522.
What is the Total Female Population of Ponemah?
Total Female Population of Ponemah is 330.
What is the Ratio of Males per 100 Females in Ponemah?
There are 158.18 Males per 100 Females in Ponemah.
What is the Ratio of Females per 100 Males in Ponemah?
There are 63.22 Females per 100 Males in Ponemah.
What is the Median Population Age in Ponemah?
Median Population Age in Ponemah is 17.9 Years.
What is the Average Family Size in Ponemah
Average Family Size in Ponemah is 5.0 People.
What is the Average Household Size in Ponemah
Average Household Size in Ponemah is 5.6 People.
How Large is the Labor Force in Ponemah?
There are 280 People in the Labor Forcein in Ponemah.
What is the Percentage of People in the Labor Force in Ponemah?
59.1% of People are in the Labor Force in Ponemah.
What is the Unemployment Rate in Ponemah?
Unemployment Rate in Ponemah is 20.2%.