Nett Lake, MN Map & Demographics
Nett Lake Map
Nett Lake Overview
$19,564
PER CAPITA INCOME
14.0%
WAGE / INCOME GAP [ % ]
86.0¢/ $1
WAGE / INCOME GAP [ $ ]
0.38
INEQUALITY / GINI INDEX
203
TOTAL POPULATION
86
MALE POPULATION
117
FEMALE POPULATION
73.50
MALES / 100 FEMALES
136.05
FEMALES / 100 MALES
42.4
MEDIAN AGE
2.5
AVG FAMILY SIZE
2.2
AVG HOUSEHOLD SIZE
67
LABOR FORCE [ PEOPLE ]
43.8%
PERCENT IN LABOR FORCE
9.0%
UNEMPLOYMENT RATE
Nett Lake Zip Codes
Nett Lake Area Codes
Income in Nett Lake
Income Overview in Nett Lake
| Characteristic | Number | Measure |
| Per Capita Income | 203 | $19,564 |
| Median Family Income | 69 | $0 |
| Mean Family Income | 69 | $55,074 |
| Median Household Income | 92 | $0 |
| Mean Household Income | 92 | $53,470 |
| Income Deficit | 69 | $0 |
| Wage / Income Gap (%) | 203 | 13.98% |
| Wage / Income Gap ($) | 203 | 86.02¢ per $1 |
| Gini / Inequality Index | 203 | 0.38 |
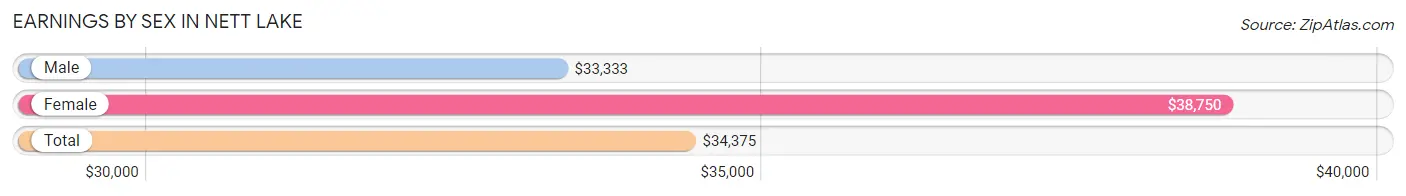
Earnings by Sex in Nett Lake
Average Earnings in Nett Lake are $34,375, $33,333 for men and $38,750 for women, a difference of 14.0%.
| Sex | Number | Average Earnings |
| Male | 38 (57.6%) | $33,333 |
| Female | 28 (42.4%) | $38,750 |
| Total | 66 (100.0%) | $34,375 |
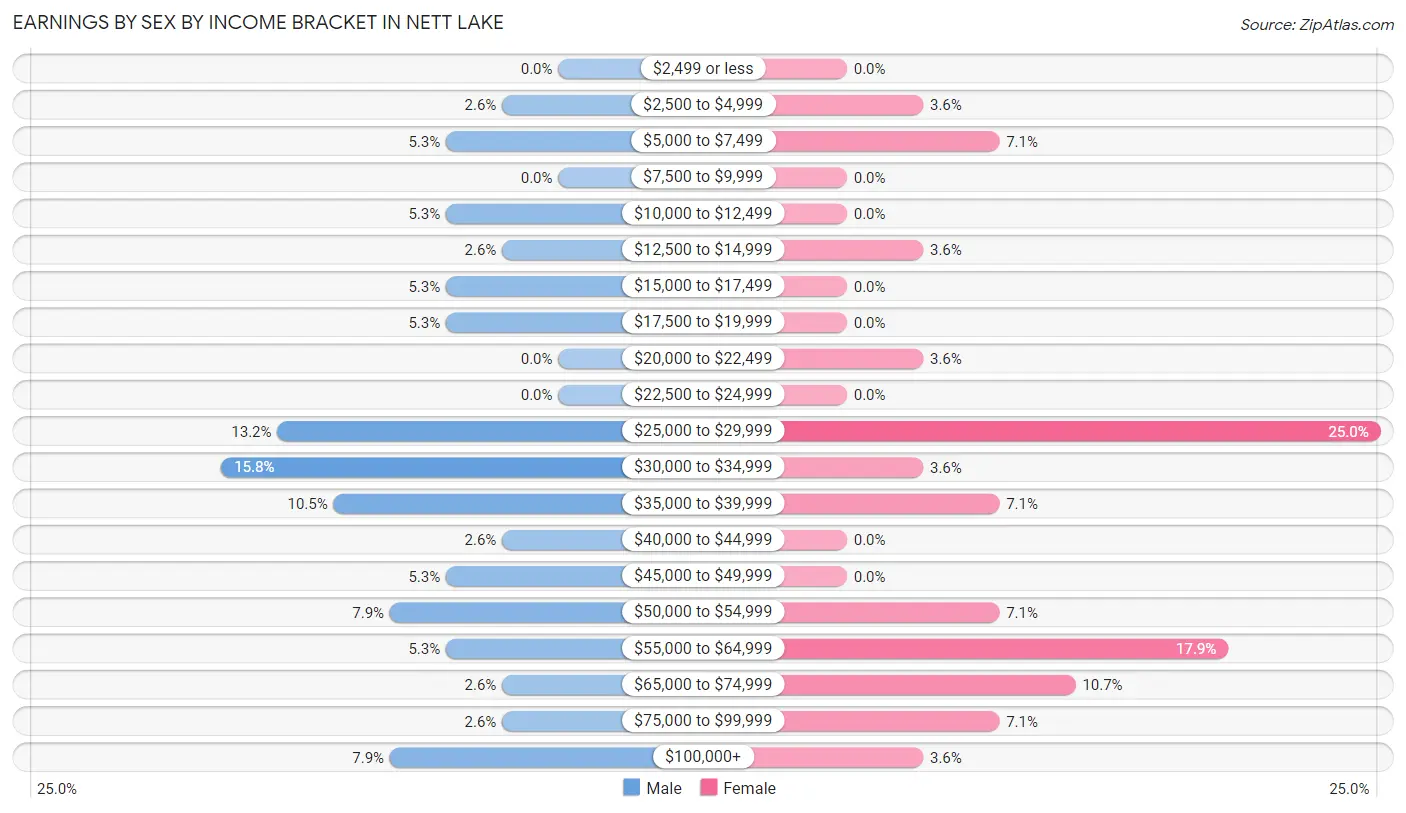
Earnings by Sex by Income Bracket in Nett Lake
The most common earnings brackets in Nett Lake are $30,000 to $34,999 for men (6 | 15.8%) and $25,000 to $29,999 for women (7 | 25.0%).
| Income | Male | Female |
| $2,499 or less | 0 (0.0%) | 0 (0.0%) |
| $2,500 to $4,999 | 1 (2.6%) | 1 (3.6%) |
| $5,000 to $7,499 | 2 (5.3%) | 2 (7.1%) |
| $7,500 to $9,999 | 0 (0.0%) | 0 (0.0%) |
| $10,000 to $12,499 | 2 (5.3%) | 0 (0.0%) |
| $12,500 to $14,999 | 1 (2.6%) | 1 (3.6%) |
| $15,000 to $17,499 | 2 (5.3%) | 0 (0.0%) |
| $17,500 to $19,999 | 2 (5.3%) | 0 (0.0%) |
| $20,000 to $22,499 | 0 (0.0%) | 1 (3.6%) |
| $22,500 to $24,999 | 0 (0.0%) | 0 (0.0%) |
| $25,000 to $29,999 | 5 (13.2%) | 7 (25.0%) |
| $30,000 to $34,999 | 6 (15.8%) | 1 (3.6%) |
| $35,000 to $39,999 | 4 (10.5%) | 2 (7.1%) |
| $40,000 to $44,999 | 1 (2.6%) | 0 (0.0%) |
| $45,000 to $49,999 | 2 (5.3%) | 0 (0.0%) |
| $50,000 to $54,999 | 3 (7.9%) | 2 (7.1%) |
| $55,000 to $64,999 | 2 (5.3%) | 5 (17.9%) |
| $65,000 to $74,999 | 1 (2.6%) | 3 (10.7%) |
| $75,000 to $99,999 | 1 (2.6%) | 2 (7.1%) |
| $100,000+ | 3 (7.9%) | 1 (3.6%) |
| Total | 38 (100.0%) | 28 (100.0%) |
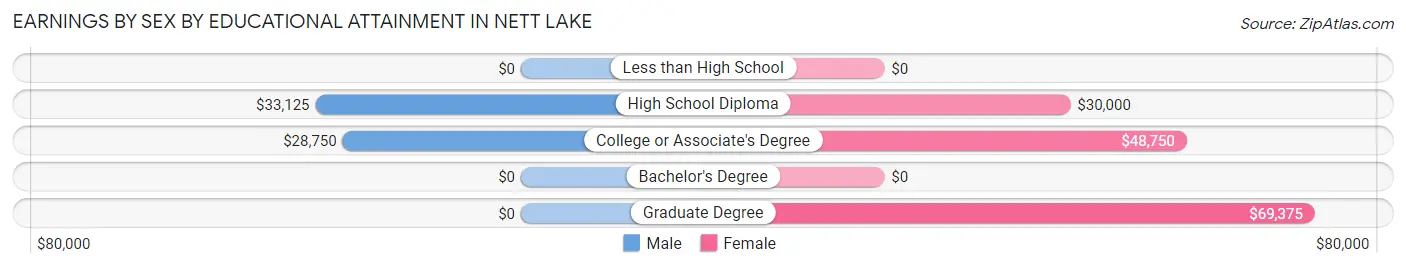
Earnings by Sex by Educational Attainment in Nett Lake
Average earnings in Nett Lake are $33,333 for men and $46,250 for women, a difference of 27.9%. Men with an educational attainment of high school diploma enjoy the highest average annual earnings of $33,125, while those with college or associate's degree education earn the least with $28,750. Women with an educational attainment of graduate degree earn the most with the average annual earnings of $69,375, while those with high school diploma education have the smallest earnings of $30,000.
| Educational Attainment | Male Income | Female Income |
| Less than High School | - | - |
| High School Diploma | $33,125 | $30,000 |
| College or Associate's Degree | $28,750 | $48,750 |
| Bachelor's Degree | - | - |
| Graduate Degree | - | - |
| Total | $33,333 | $46,250 |
Family Income in Nett Lake
Family Income Brackets in Nett Lake
According to the Nett Lake family income data, there are 30 families falling into the $25,000 to $34,999 income range, which is the most common income bracket and makes up 43.5% of all families.
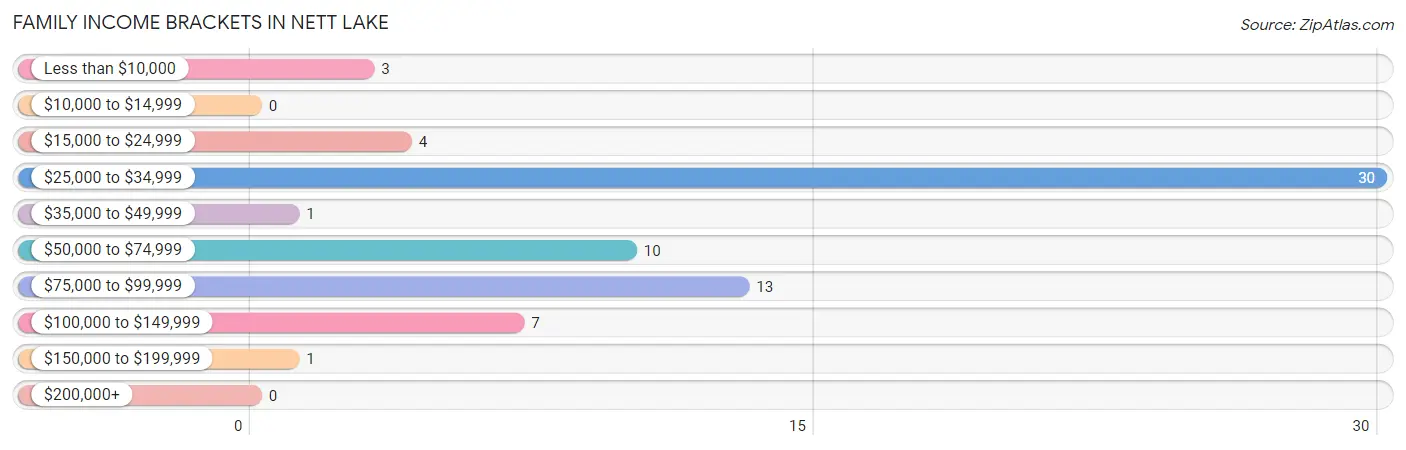
| Income Bracket | # Families | % Families |
| Less than $10,000 | 3 | 4.3% |
| $10,000 to $14,999 | 0 | 0.0% |
| $15,000 to $24,999 | 4 | 5.8% |
| $25,000 to $34,999 | 30 | 43.5% |
| $35,000 to $49,999 | 1 | 1.4% |
| $50,000 to $74,999 | 10 | 14.5% |
| $75,000 to $99,999 | 13 | 18.8% |
| $100,000 to $149,999 | 7 | 10.1% |
| $150,000 to $199,999 | 1 | 1.4% |
| $200,000+ | 0 | 0.0% |
Family Income by Famaliy Size in Nett Lake
5-person families (19 | 27.5%) account for the highest median family income in Nett Lake with $79,432 per family, while 5-person families (19 | 27.5%) have the highest median income of $15,886 per family member.
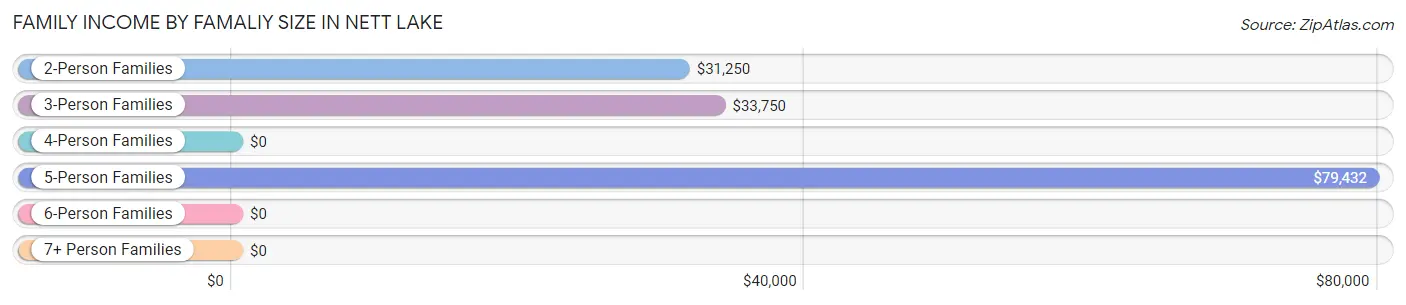
| Income Bracket | # Families | Median Income |
| 2-Person Families | 13 (18.8%) | $31,250 |
| 3-Person Families | 31 (44.9%) | $33,750 |
| 4-Person Families | 4 (5.8%) | $0 |
| 5-Person Families | 19 (27.5%) | $79,432 |
| 6-Person Families | 0 (0.0%) | $0 |
| 7+ Person Families | 2 (2.9%) | $0 |
| Total | 69 (100.0%) | $0 |
Family Income by Number of Earners in Nett Lake
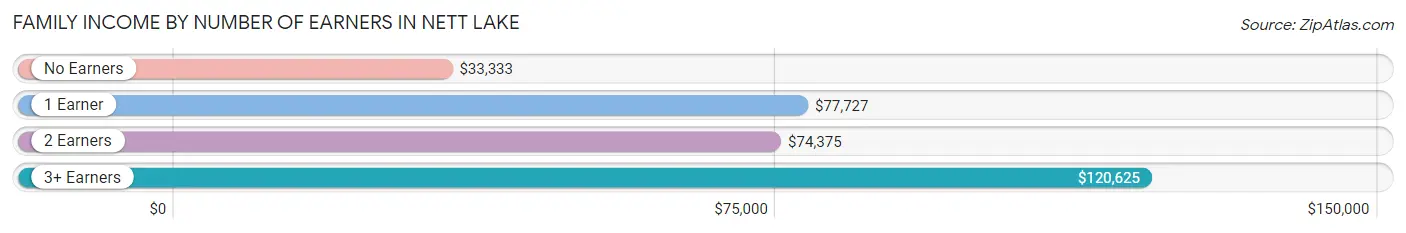
| Number of Earners | # Families | Median Income |
| No Earners | 32 (46.4%) | $33,333 |
| 1 Earner | 24 (34.8%) | $77,727 |
| 2 Earners | 8 (11.6%) | $74,375 |
| 3+ Earners | 5 (7.2%) | $120,625 |
| Total | 69 (100.0%) | $0 |
Household Income in Nett Lake
Household Income Brackets in Nett Lake
With 33 households falling in the category, the $25,000 to $34,999 income range is the most frequent in Nett Lake, accounting for 35.9% of all households.
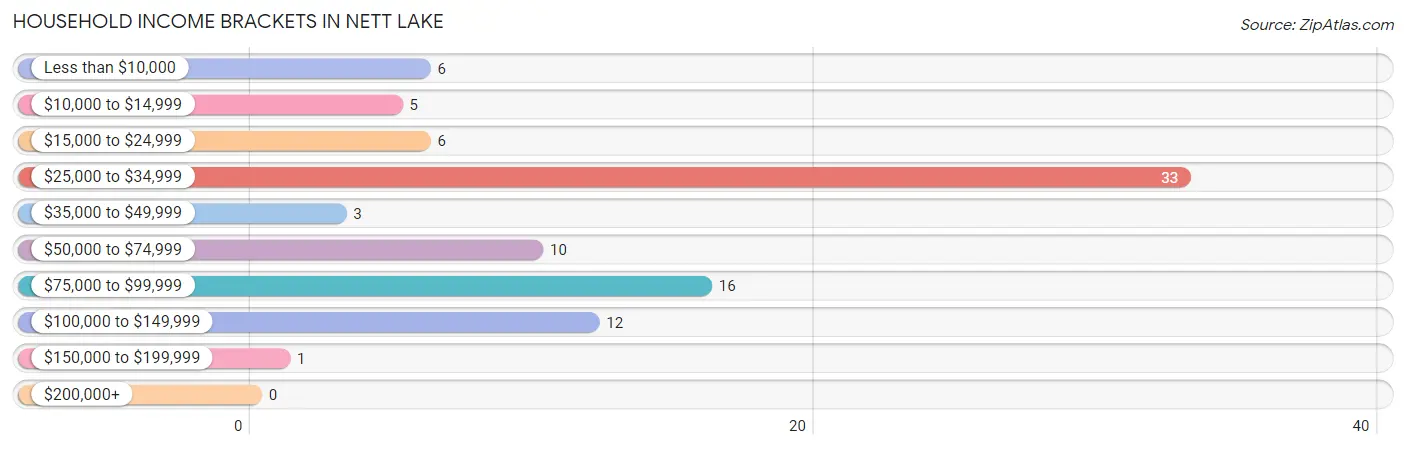
| Income Bracket | # Households | % Households |
| Less than $10,000 | 6 | 6.5% |
| $10,000 to $14,999 | 5 | 5.4% |
| $15,000 to $24,999 | 6 | 6.5% |
| $25,000 to $34,999 | 33 | 35.9% |
| $35,000 to $49,999 | 3 | 3.3% |
| $50,000 to $74,999 | 10 | 10.9% |
| $75,000 to $99,999 | 16 | 17.4% |
| $100,000 to $149,999 | 12 | 13.0% |
| $150,000 to $199,999 | 1 | 1.1% |
| $200,000+ | 0 | 0.0% |
Household Income by Householder Age in Nett Lake
The median household income in Nett Lake is $0, with the highest median household income of $32,083 found in the 45 to 64 years age bracket for the primary householder. A total of 23 households (25.0%) fall into this category. Meanwhile, the 15 to 24 years age bracket for the primary householder has the lowest median household income of $0, with 2 households (2.2%) in this group.
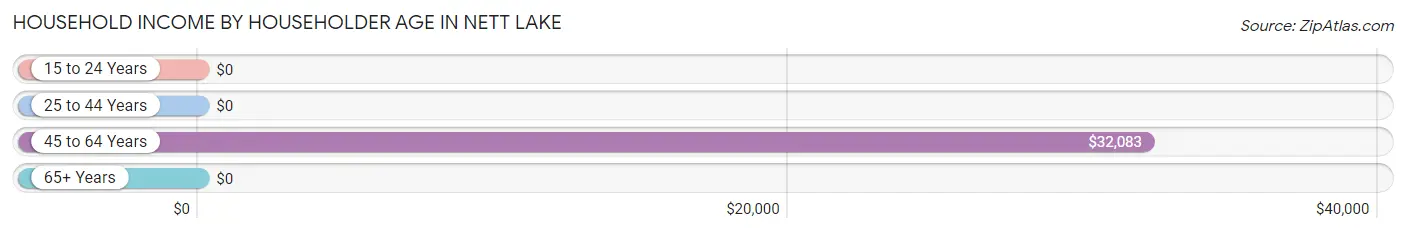
| Income Bracket | # Households | Median Income |
| 15 to 24 Years | 2 (2.2%) | $0 |
| 25 to 44 Years | 18 (19.6%) | $0 |
| 45 to 64 Years | 23 (25.0%) | $32,083 |
| 65+ Years | 49 (53.3%) | $0 |
| Total | 92 (100.0%) | $0 |
Poverty in Nett Lake
Income Below Poverty by Sex and Age in Nett Lake
With 19.8% poverty level for males and 19.7% for females among the residents of Nett Lake, 75 year old and over males and 18 to 24 year old females are the most vulnerable to poverty, with 1 males (100.0%) and 3 females (60.0%) in their respective age groups living below the poverty level.
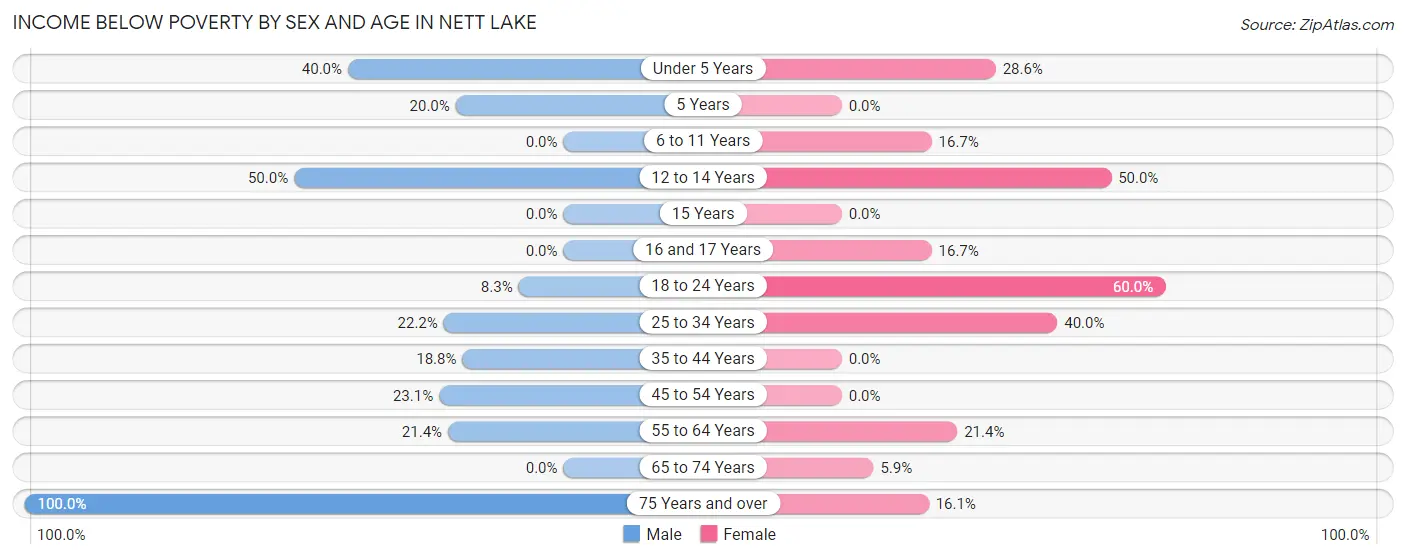
| Age Bracket | Male | Female |
| Under 5 Years | 2 (40.0%) | 2 (28.6%) |
| 5 Years | 1 (20.0%) | 0 (0.0%) |
| 6 to 11 Years | 0 (0.0%) | 2 (16.7%) |
| 12 to 14 Years | 1 (50.0%) | 4 (50.0%) |
| 15 Years | 0 (0.0%) | 0 (0.0%) |
| 16 and 17 Years | 0 (0.0%) | 1 (16.7%) |
| 18 to 24 Years | 1 (8.3%) | 3 (60.0%) |
| 25 to 34 Years | 2 (22.2%) | 2 (40.0%) |
| 35 to 44 Years | 3 (18.8%) | 0 (0.0%) |
| 45 to 54 Years | 3 (23.1%) | 0 (0.0%) |
| 55 to 64 Years | 3 (21.4%) | 3 (21.4%) |
| 65 to 74 Years | 0 (0.0%) | 1 (5.9%) |
| 75 Years and over | 1 (100.0%) | 5 (16.1%) |
| Total | 17 (19.8%) | 23 (19.7%) |
Income Above Poverty by Sex and Age in Nett Lake
According to the poverty statistics in Nett Lake, males aged 6 to 11 years and females aged 5 years are the age groups that are most secure financially, with 100.0% of males and 100.0% of females in these age groups living above the poverty line.
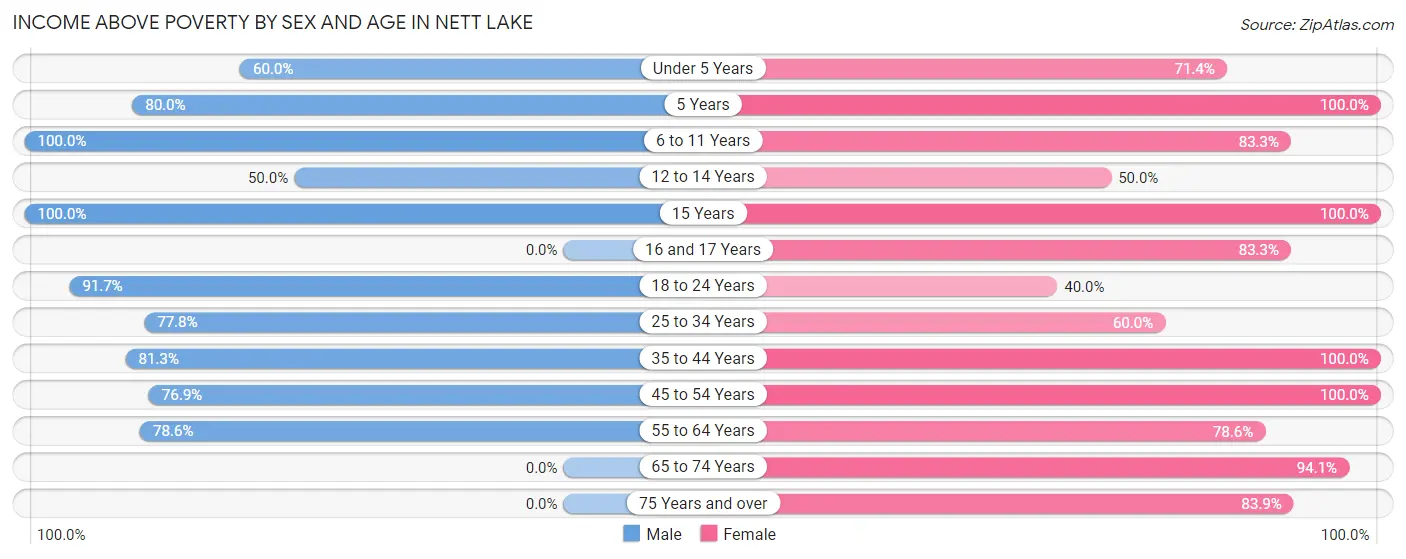
| Age Bracket | Male | Female |
| Under 5 Years | 3 (60.0%) | 5 (71.4%) |
| 5 Years | 4 (80.0%) | 1 (100.0%) |
| 6 to 11 Years | 8 (100.0%) | 10 (83.3%) |
| 12 to 14 Years | 1 (50.0%) | 4 (50.0%) |
| 15 Years | 1 (100.0%) | 1 (100.0%) |
| 16 and 17 Years | 0 (0.0%) | 5 (83.3%) |
| 18 to 24 Years | 11 (91.7%) | 2 (40.0%) |
| 25 to 34 Years | 7 (77.8%) | 3 (60.0%) |
| 35 to 44 Years | 13 (81.2%) | 6 (100.0%) |
| 45 to 54 Years | 10 (76.9%) | 4 (100.0%) |
| 55 to 64 Years | 11 (78.6%) | 11 (78.6%) |
| 65 to 74 Years | 0 (0.0%) | 16 (94.1%) |
| 75 Years and over | 0 (0.0%) | 26 (83.9%) |
| Total | 69 (80.2%) | 94 (80.3%) |
Income Below Poverty Among Married-Couple Families in Nett Lake
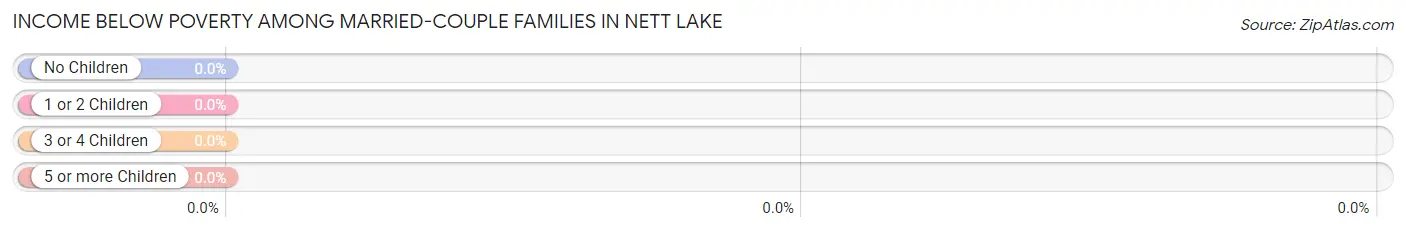
| Children | Above Poverty | Below Poverty |
| No Children | 6 (100.0%) | 0 (0.0%) |
| 1 or 2 Children | 3 (100.0%) | 0 (0.0%) |
| 3 or 4 Children | 2 (100.0%) | 0 (0.0%) |
| 5 or more Children | 0 (0.0%) | 0 (0.0%) |
| Total | 11 (100.0%) | 0 (0.0%) |
Income Below Poverty Among Single-Parent Households in Nett Lake
According to the poverty data in Nett Lake, 50.0% or 1 single-father households and 14.3% or 8 single-mother households are living below the poverty line. Among single-father households, those with 1 or 2 children have the highest poverty rate, with 1 households (100.0%) experiencing poverty. Likewise, among single-mother households, those with 5 or more children have the highest poverty rate, with 2 households (100.0%) falling below the poverty line.
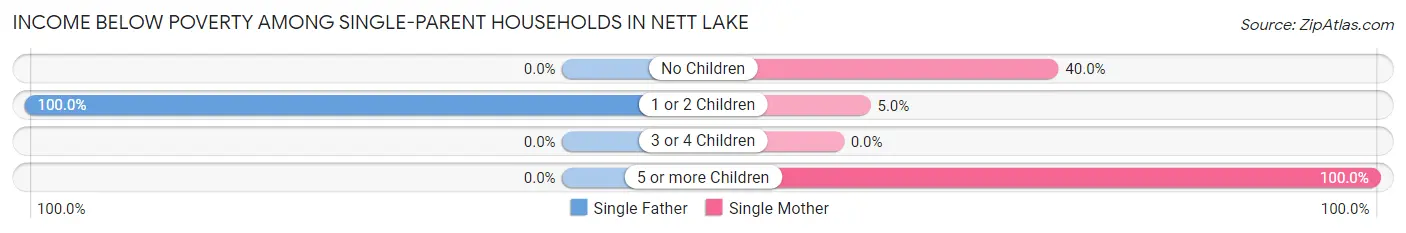
| Children | Single Father | Single Mother |
| No Children | 0 (0.0%) | 4 (40.0%) |
| 1 or 2 Children | 1 (100.0%) | 2 (5.0%) |
| 3 or 4 Children | 0 (0.0%) | 0 (0.0%) |
| 5 or more Children | 0 (0.0%) | 2 (100.0%) |
| Total | 1 (50.0%) | 8 (14.3%) |
Income Below Poverty Among Married-Couple vs Single-Parent Households in Nett Lake
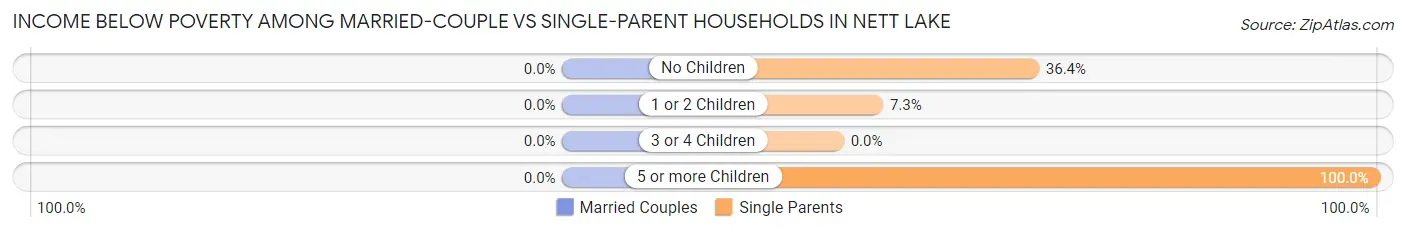
| Children | Married-Couple Families | Single-Parent Households |
| No Children | 0 (0.0%) | 4 (36.4%) |
| 1 or 2 Children | 0 (0.0%) | 3 (7.3%) |
| 3 or 4 Children | 0 (0.0%) | 0 (0.0%) |
| 5 or more Children | 0 (0.0%) | 2 (100.0%) |
| Total | 0 (0.0%) | 9 (15.5%) |
Race in Nett Lake
The most populous races in Nett Lake are Native / Alaskan (193 | 95.1%), White / Caucasian (7 | 3.5%), and Hispanic or Latino (2 | 1.0%).
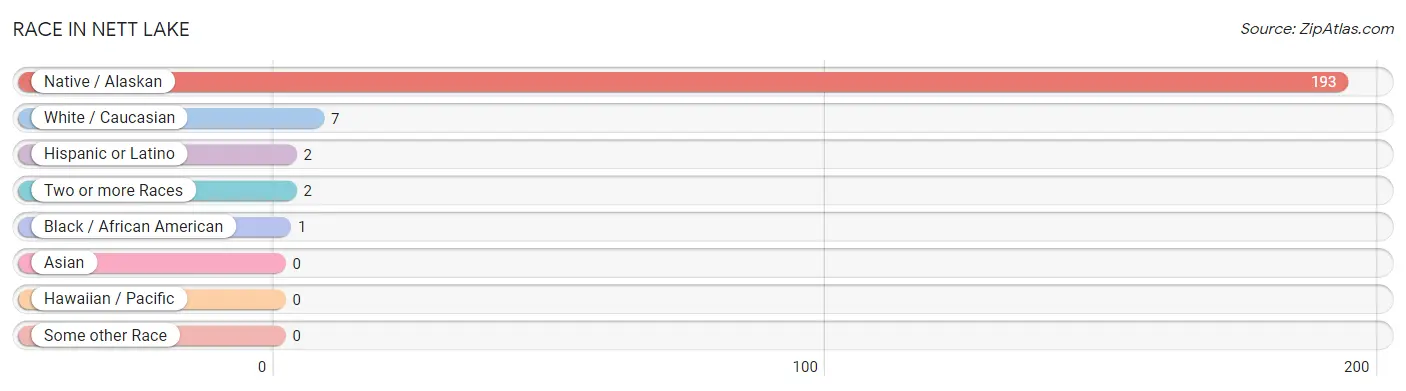
| Race | # Population | % Population |
| Asian | 0 | 0.0% |
| Black / African American | 1 | 0.5% |
| Hawaiian / Pacific | 0 | 0.0% |
| Hispanic or Latino | 2 | 1.0% |
| Native / Alaskan | 193 | 95.1% |
| White / Caucasian | 7 | 3.5% |
| Two or more Races | 2 | 1.0% |
| Some other Race | 0 | 0.0% |
| Total | 203 | 100.0% |
Ancestry in Nett Lake
The most populous ancestries reported in Nett Lake are Chippewa (185 | 91.1%), German (4 | 2.0%), Irish (3 | 1.5%), Central American (2 | 1.0%), and Costa Rican (2 | 1.0%), together accounting for 96.6% of all Nett Lake residents.
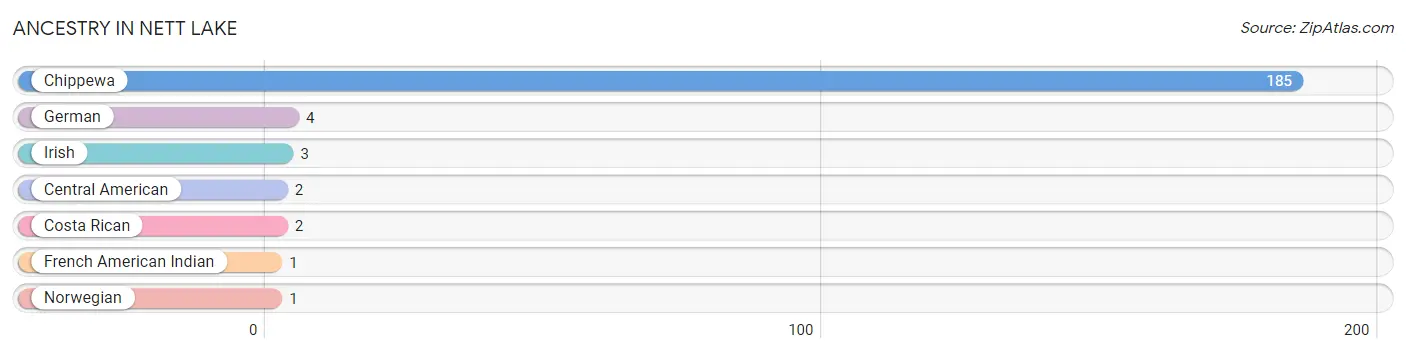
| Ancestry | # Population | % Population |
| Central American | 2 | 1.0% |
| Chippewa | 185 | 91.1% |
| Costa Rican | 2 | 1.0% |
| French American Indian | 1 | 0.5% |
| German | 4 | 2.0% |
| Irish | 3 | 1.5% |
| Norwegian | 1 | 0.5% | View All 7 Rows |
Immigrants in Nett Lake
The most numerous immigrant groups reported in Nett Lake came from Canada (8 | 3.9%), Central America (2 | 1.0%), Costa Rica (2 | 1.0%), Latin America (2 | 1.0%), and Asia (1 | 0.5%), together accounting for 7.4% of all Nett Lake residents.
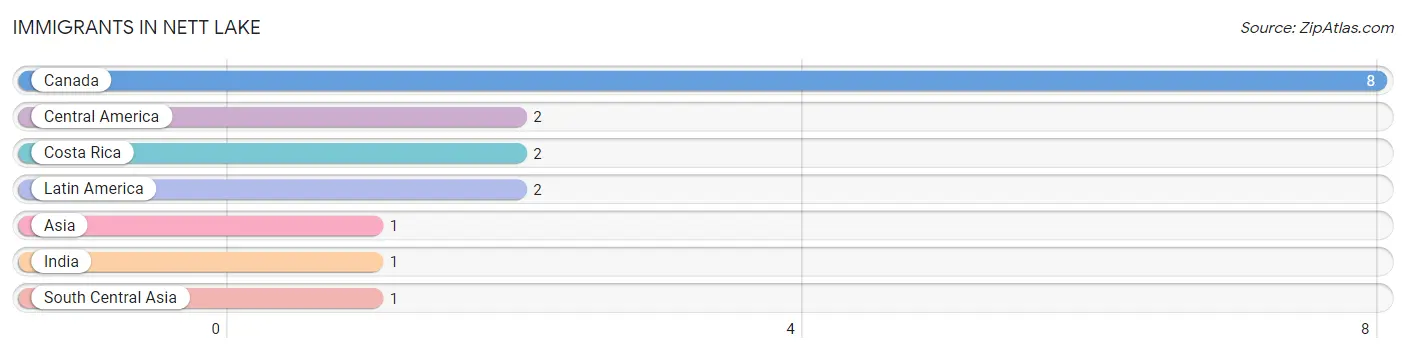
| Immigration Origin | # Population | % Population |
| Asia | 1 | 0.5% |
| Canada | 8 | 3.9% |
| Central America | 2 | 1.0% |
| Costa Rica | 2 | 1.0% |
| India | 1 | 0.5% |
| Latin America | 2 | 1.0% |
| South Central Asia | 1 | 0.5% | View All 7 Rows |
Sex and Age in Nett Lake
Sex and Age in Nett Lake
The most populous age groups in Nett Lake are 40 to 44 Years (10 | 11.6%) for men and 75 to 79 Years (23 | 19.7%) for women.
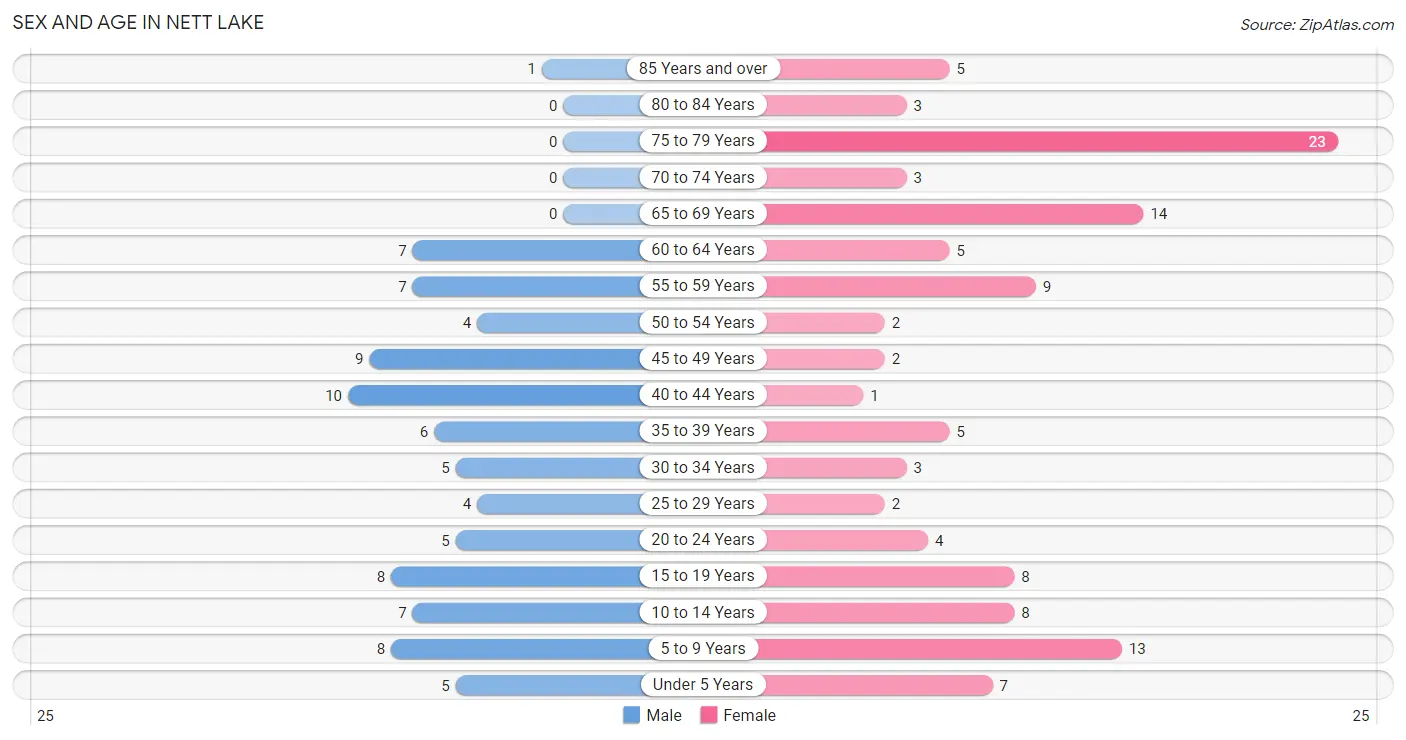
| Age Bracket | Male | Female |
| Under 5 Years | 5 (5.8%) | 7 (6.0%) |
| 5 to 9 Years | 8 (9.3%) | 13 (11.1%) |
| 10 to 14 Years | 7 (8.1%) | 8 (6.8%) |
| 15 to 19 Years | 8 (9.3%) | 8 (6.8%) |
| 20 to 24 Years | 5 (5.8%) | 4 (3.4%) |
| 25 to 29 Years | 4 (4.6%) | 2 (1.7%) |
| 30 to 34 Years | 5 (5.8%) | 3 (2.6%) |
| 35 to 39 Years | 6 (7.0%) | 5 (4.3%) |
| 40 to 44 Years | 10 (11.6%) | 1 (0.9%) |
| 45 to 49 Years | 9 (10.5%) | 2 (1.7%) |
| 50 to 54 Years | 4 (4.6%) | 2 (1.7%) |
| 55 to 59 Years | 7 (8.1%) | 9 (7.7%) |
| 60 to 64 Years | 7 (8.1%) | 5 (4.3%) |
| 65 to 69 Years | 0 (0.0%) | 14 (12.0%) |
| 70 to 74 Years | 0 (0.0%) | 3 (2.6%) |
| 75 to 79 Years | 0 (0.0%) | 23 (19.7%) |
| 80 to 84 Years | 0 (0.0%) | 3 (2.6%) |
| 85 Years and over | 1 (1.2%) | 5 (4.3%) |
| Total | 86 (100.0%) | 117 (100.0%) |
Families and Households in Nett Lake
Median Family Size in Nett Lake
The median family size in Nett Lake is 2.48 persons per family, with single male/father families (2 | 2.9%) accounting for the largest median family size of 3.5 persons per family. On the other hand, single female/mother families (56 | 81.2%) represent the smallest median family size with 2.27 persons per family.
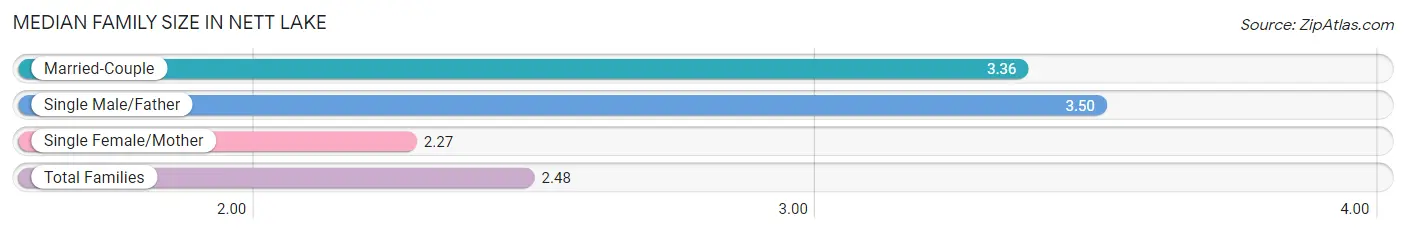
| Family Type | # Families | Family Size |
| Married-Couple | 11 (15.9%) | 3.36 |
| Single Male/Father | 2 (2.9%) | 3.50 |
| Single Female/Mother | 56 (81.2%) | 2.27 |
| Total Families | 69 (100.0%) | 2.48 |
Median Household Size in Nett Lake
The median household size in Nett Lake is 2.21 persons per household, with single male/father households (2 | 2.2%) accounting for the largest median household size of 3.5 persons per household. non-family households (23 | 25.0%) represent the smallest median household size with 1.09 persons per household.
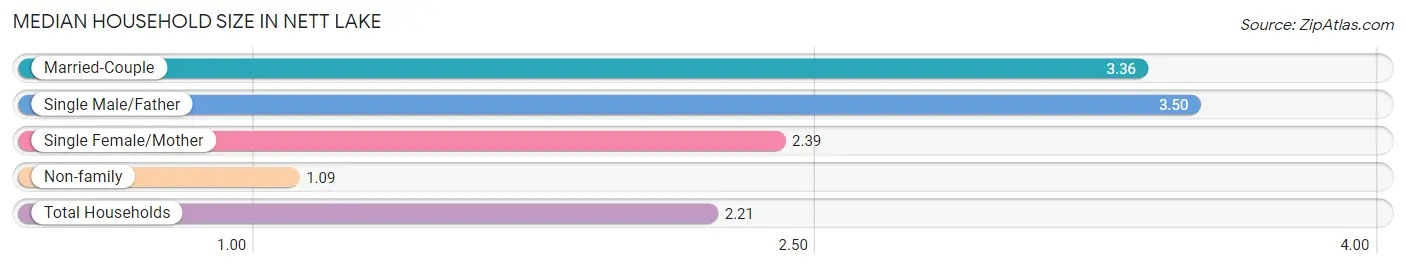
| Household Type | # Households | Household Size |
| Married-Couple | 11 (12.0%) | 3.36 |
| Single Male/Father | 2 (2.2%) | 3.50 |
| Single Female/Mother | 56 (60.9%) | 2.39 |
| Non-family | 23 (25.0%) | 1.09 |
| Total Households | 92 (100.0%) | 2.21 |
Household Size by Marriage Status in Nett Lake
Out of a total of 92 households in Nett Lake, 69 (75.0%) are family households, while 23 (25.0%) are nonfamily households. The most numerous type of family households are 3-person households, comprising 30, and the most common type of nonfamily households are 1-person households, comprising 20.
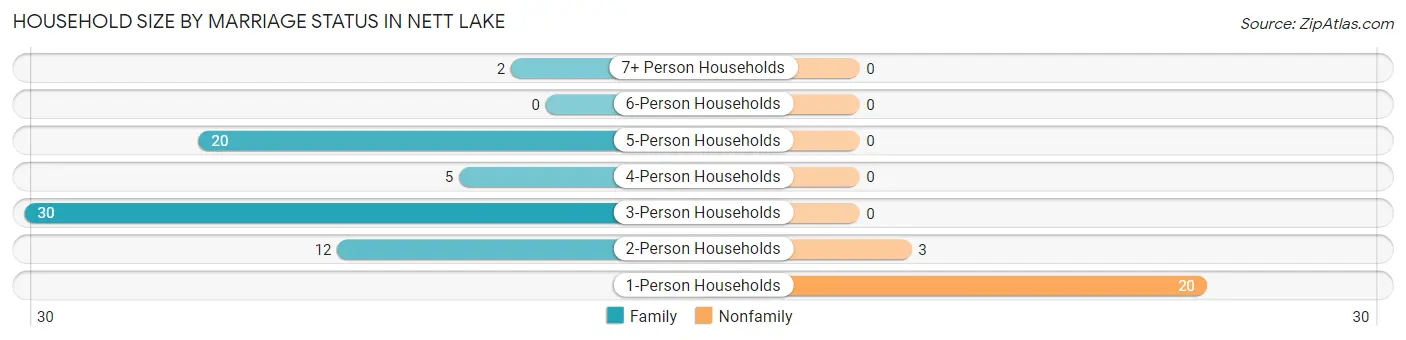
| Household Size | Family Households | Nonfamily Households |
| 1-Person Households | - | 20 (21.7%) |
| 2-Person Households | 12 (13.0%) | 3 (3.3%) |
| 3-Person Households | 30 (32.6%) | 0 (0.0%) |
| 4-Person Households | 5 (5.4%) | 0 (0.0%) |
| 5-Person Households | 20 (21.7%) | 0 (0.0%) |
| 6-Person Households | 0 (0.0%) | 0 (0.0%) |
| 7+ Person Households | 2 (2.2%) | 0 (0.0%) |
| Total | 69 (75.0%) | 23 (25.0%) |
Female Fertility in Nett Lake
Fertility by Age in Nett Lake
| Age Bracket | Women with Births | Births / 1,000 Women |
| 15 to 19 years | 0 (0.0%) | 0.0 |
| 20 to 34 years | 0 (0.0%) | 0.0 |
| 35 to 50 years | 0 (0.0%) | 0.0 |
| Total | 0 (0.0%) | 0.0 |
Fertility by Age by Marriage Status in Nett Lake
| Age Bracket | Married | Unmarried |
| 15 to 19 years | 0 (0.0%) | 0 (0.0%) |
| 20 to 34 years | 0 (0.0%) | 0 (0.0%) |
| 35 to 50 years | 0 (0.0%) | 0 (0.0%) |
| Total | 0 (0.0%) | 0 (0.0%) |
Fertility by Education in Nett Lake
| Educational Attainment | Women with Births | Births / 1,000 Women |
| Less than High School | 0 (0.0%) | 0.0 |
| High School Diploma | 0 (0.0%) | 0.0 |
| College or Associate's Degree | 0 (0.0%) | 0.0 |
| Bachelor's Degree | 0 (0.0%) | 0.0 |
| Graduate Degree | 0 (0.0%) | 0.0 |
| Total | 0 (0.0%) | 0.0 |
Fertility by Education by Marriage Status in Nett Lake
| Educational Attainment | Married | Unmarried |
| Less than High School | 0 (0.0%) | 0 (0.0%) |
| High School Diploma | 0 (0.0%) | 0 (0.0%) |
| College or Associate's Degree | 0 (0.0%) | 0 (0.0%) |
| Bachelor's Degree | 0 (0.0%) | 0 (0.0%) |
| Graduate Degree | 0 (0.0%) | 0 (0.0%) |
| Total | 0 (0.0%) | 0 (0.0%) |
Employment Characteristics in Nett Lake
Employment by Class of Employer in Nett Lake
Among the 61 employed individuals in Nett Lake, federal government employees (27 | 44.3%), private company employees (19 | 31.1%), and local government employees (12 | 19.7%) make up the most common classes of employment.
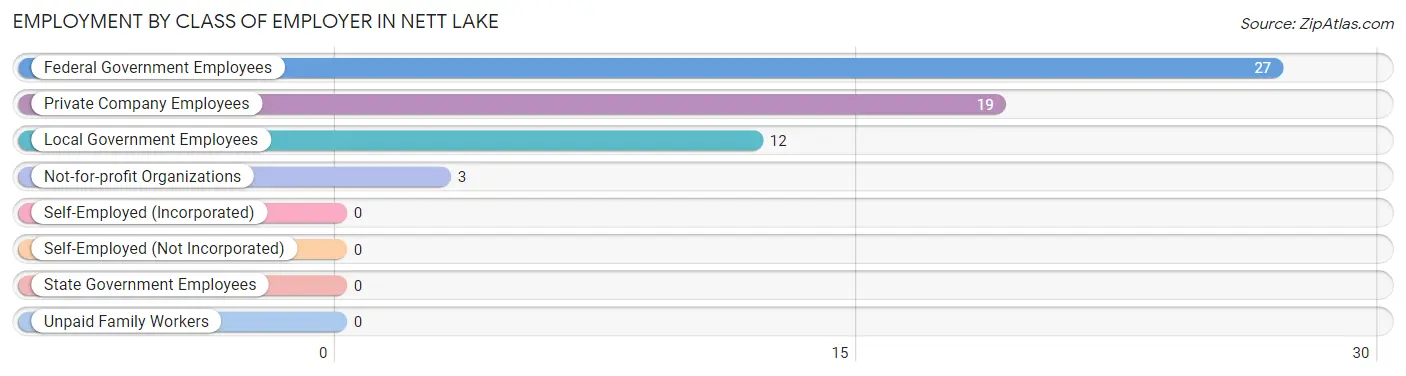
| Employer Class | # Employees | % Employees |
| Private Company Employees | 19 | 31.1% |
| Self-Employed (Incorporated) | 0 | 0.0% |
| Self-Employed (Not Incorporated) | 0 | 0.0% |
| Not-for-profit Organizations | 3 | 4.9% |
| Local Government Employees | 12 | 19.7% |
| State Government Employees | 0 | 0.0% |
| Federal Government Employees | 27 | 44.3% |
| Unpaid Family Workers | 0 | 0.0% |
| Total | 61 | 100.0% |
Employment Status by Age in Nett Lake
According to the labor force statistics for Nett Lake, out of the total population over 16 years of age (153), 43.8% or 67 individuals are in the labor force, with 9.0% or 6 of them unemployed. The age group with the highest labor force participation rate is 25 to 29 years, with 100.0% or 6 individuals in the labor force. Within the labor force, the 20 to 24 years age range has the highest percentage of unemployed individuals, with 33.3% or 2 of them being unemployed.
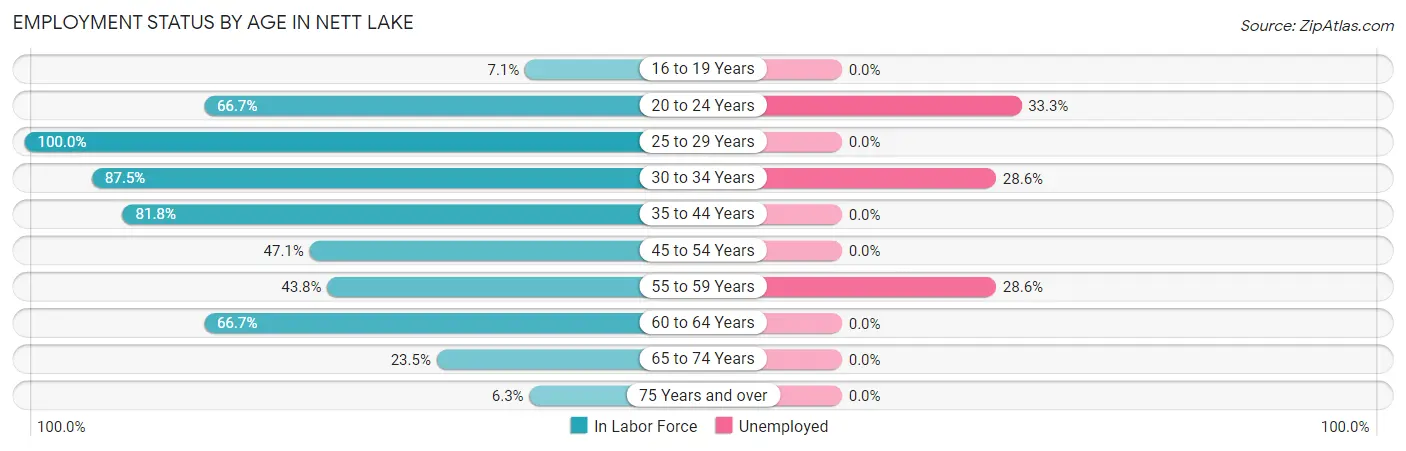
| Age Bracket | In Labor Force | Unemployed |
| 16 to 19 Years | 1 (7.1%) | 0 (0.0%) |
| 20 to 24 Years | 6 (66.7%) | 2 (33.3%) |
| 25 to 29 Years | 6 (100.0%) | 0 (0.0%) |
| 30 to 34 Years | 7 (87.5%) | 2 (28.6%) |
| 35 to 44 Years | 18 (81.8%) | 0 (0.0%) |
| 45 to 54 Years | 8 (47.1%) | 0 (0.0%) |
| 55 to 59 Years | 7 (43.8%) | 2 (28.6%) |
| 60 to 64 Years | 8 (66.7%) | 0 (0.0%) |
| 65 to 74 Years | 4 (23.5%) | 0 (0.0%) |
| 75 Years and over | 2 (6.3%) | 0 (0.0%) |
| Total | 67 (43.8%) | 6 (9.0%) |
Employment Status by Educational Attainment in Nett Lake
According to labor force statistics for Nett Lake, 66.7% of individuals (54) out of the total population between 25 and 64 years of age (81) are in the labor force, with 7.4% or 4 of them being unemployed. The group with the highest labor force participation rate are those with the educational attainment of bachelor's degree or higher, with 100.0% or 9 individuals in the labor force. Within the labor force, individuals with college / associate degree education have the highest percentage of unemployment, with 15.4% or 4 of them being unemployed.
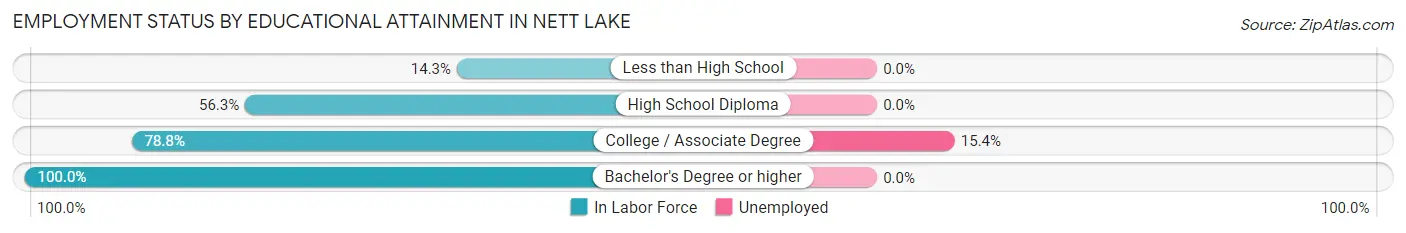
| Educational Attainment | In Labor Force | Unemployed |
| Less than High School | 1 (14.3%) | 0 (0.0%) |
| High School Diploma | 18 (56.3%) | 0 (0.0%) |
| College / Associate Degree | 26 (78.8%) | 5 (15.4%) |
| Bachelor's Degree or higher | 9 (100.0%) | 0 (0.0%) |
| Total | 54 (66.7%) | 6 (7.4%) |
Employment Occupations by Sex in Nett Lake
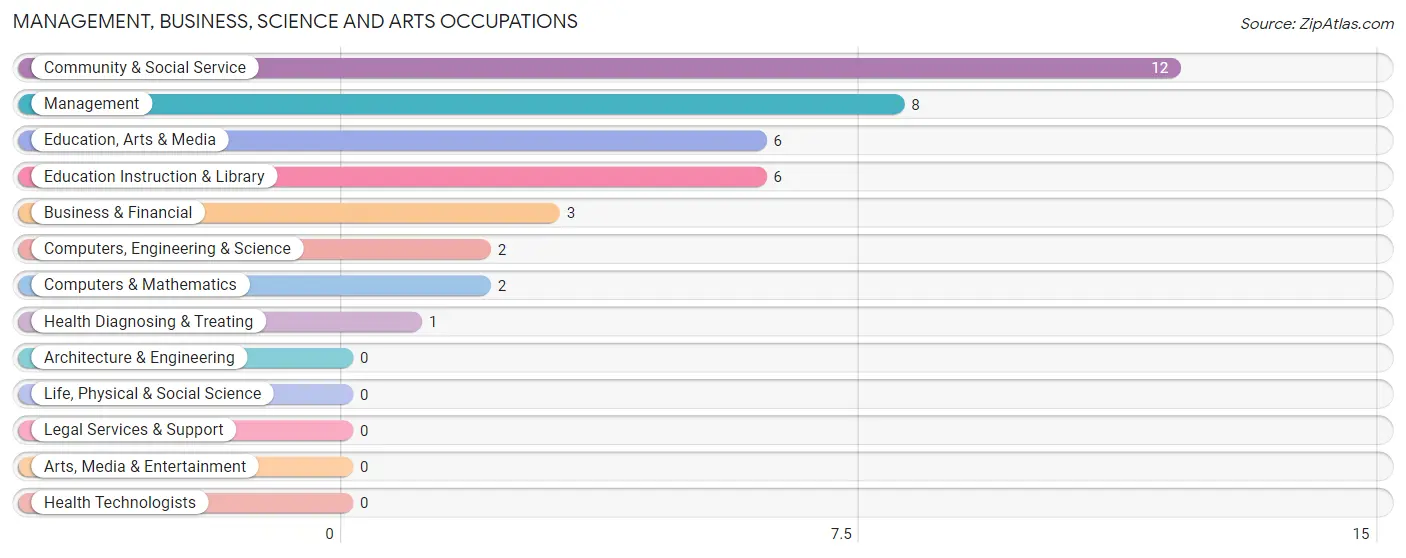
Management, Business, Science and Arts Occupations
The most common Management, Business, Science and Arts occupations in Nett Lake are Community & Social Service (12 | 19.7%), Management (8 | 13.1%), Education, Arts & Media (6 | 9.8%), Education Instruction & Library (6 | 9.8%), and Business & Financial (3 | 4.9%).
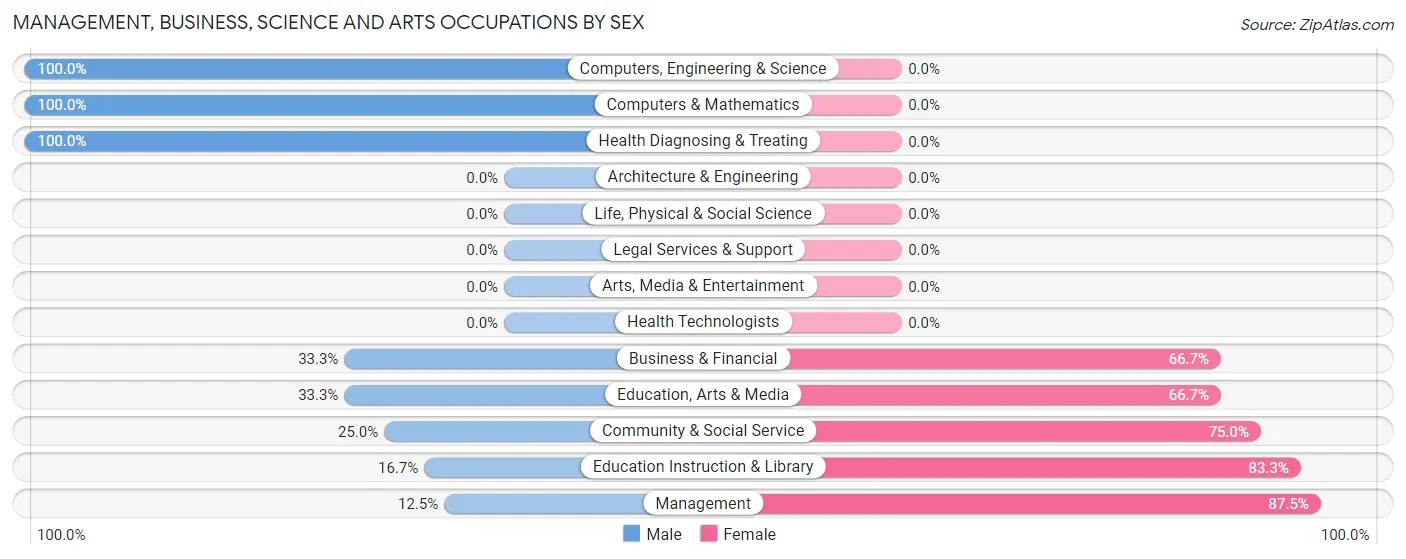
Management, Business, Science and Arts Occupations by Sex
Within the Management, Business, Science and Arts occupations in Nett Lake, the most male-oriented occupations are Computers, Engineering & Science (100.0%), Computers & Mathematics (100.0%), and Health Diagnosing & Treating (100.0%), while the most female-oriented occupations are Management (87.5%), Education Instruction & Library (83.3%), and Community & Social Service (75.0%).
| Occupation | Male | Female |
| Management | 1 (12.5%) | 7 (87.5%) |
| Business & Financial | 1 (33.3%) | 2 (66.7%) |
| Computers, Engineering & Science | 2 (100.0%) | 0 (0.0%) |
| Computers & Mathematics | 2 (100.0%) | 0 (0.0%) |
| Architecture & Engineering | 0 (0.0%) | 0 (0.0%) |
| Life, Physical & Social Science | 0 (0.0%) | 0 (0.0%) |
| Community & Social Service | 3 (25.0%) | 9 (75.0%) |
| Education, Arts & Media | 2 (33.3%) | 4 (66.7%) |
| Legal Services & Support | 0 (0.0%) | 0 (0.0%) |
| Education Instruction & Library | 1 (16.7%) | 5 (83.3%) |
| Arts, Media & Entertainment | 0 (0.0%) | 0 (0.0%) |
| Health Diagnosing & Treating | 1 (100.0%) | 0 (0.0%) |
| Health Technologists | 0 (0.0%) | 0 (0.0%) |
| Total (Category) | 8 (30.8%) | 18 (69.2%) |
| Total (Overall) | 37 (60.7%) | 24 (39.3%) |
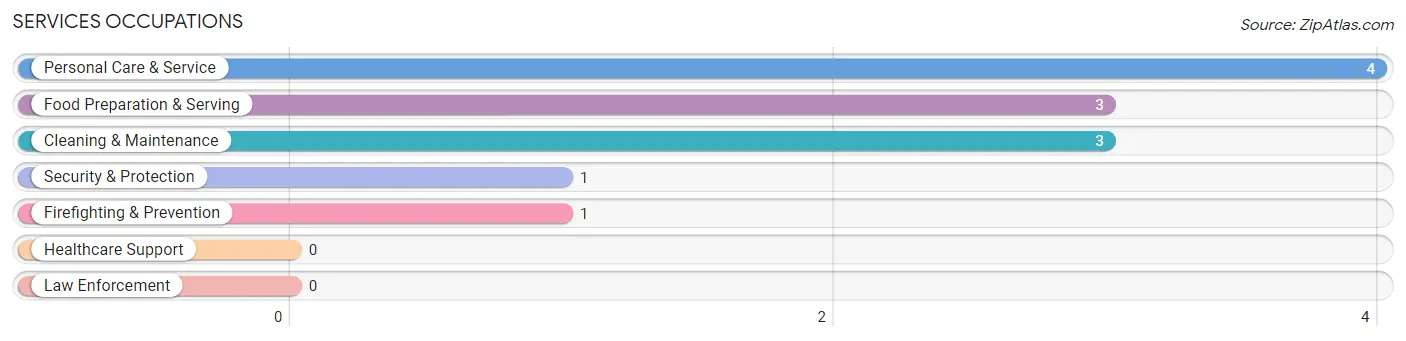
Services Occupations
The most common Services occupations in Nett Lake are Personal Care & Service (4 | 6.6%), Food Preparation & Serving (3 | 4.9%), Cleaning & Maintenance (3 | 4.9%), Security & Protection (1 | 1.6%), and Firefighting & Prevention (1 | 1.6%).
Services Occupations by Sex
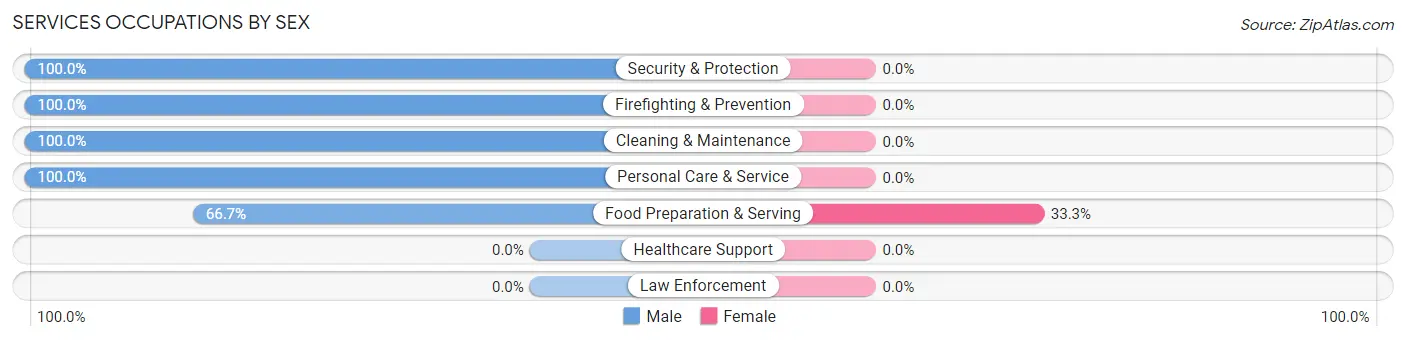
| Occupation | Male | Female |
| Healthcare Support | 0 (0.0%) | 0 (0.0%) |
| Security & Protection | 1 (100.0%) | 0 (0.0%) |
| Firefighting & Prevention | 1 (100.0%) | 0 (0.0%) |
| Law Enforcement | 0 (0.0%) | 0 (0.0%) |
| Food Preparation & Serving | 2 (66.7%) | 1 (33.3%) |
| Cleaning & Maintenance | 3 (100.0%) | 0 (0.0%) |
| Personal Care & Service | 4 (100.0%) | 0 (0.0%) |
| Total (Category) | 10 (90.9%) | 1 (9.1%) |
| Total (Overall) | 37 (60.7%) | 24 (39.3%) |
Sales and Office Occupations
The most common Sales and Office occupations in Nett Lake are Sales & Related (7 | 11.5%), and Office & Administration (4 | 6.6%).
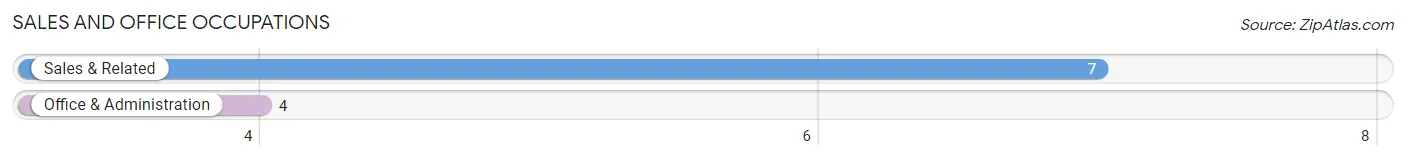
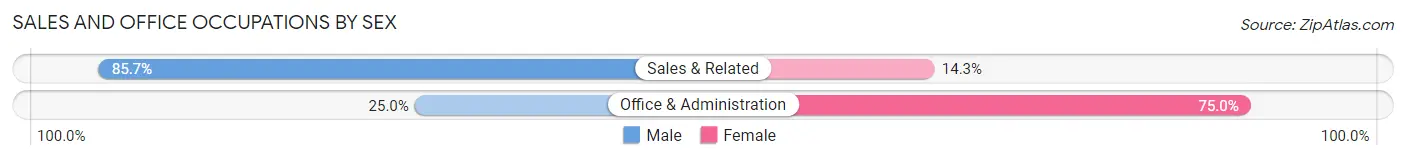
Sales and Office Occupations by Sex
| Occupation | Male | Female |
| Sales & Related | 6 (85.7%) | 1 (14.3%) |
| Office & Administration | 1 (25.0%) | 3 (75.0%) |
| Total (Category) | 7 (63.6%) | 4 (36.4%) |
| Total (Overall) | 37 (60.7%) | 24 (39.3%) |
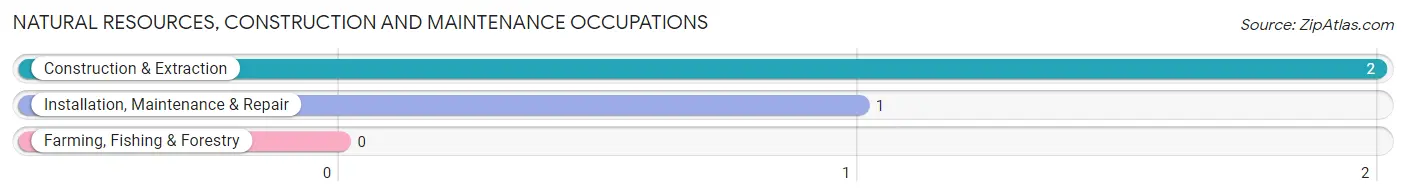
Natural Resources, Construction and Maintenance Occupations
The most common Natural Resources, Construction and Maintenance occupations in Nett Lake are Construction & Extraction (2 | 3.3%), and Installation, Maintenance & Repair (1 | 1.6%).
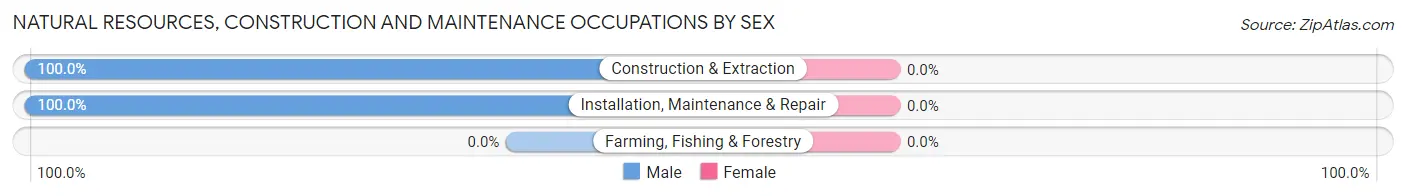
Natural Resources, Construction and Maintenance Occupations by Sex
| Occupation | Male | Female |
| Farming, Fishing & Forestry | 0 (0.0%) | 0 (0.0%) |
| Construction & Extraction | 2 (100.0%) | 0 (0.0%) |
| Installation, Maintenance & Repair | 1 (100.0%) | 0 (0.0%) |
| Total (Category) | 3 (100.0%) | 0 (0.0%) |
| Total (Overall) | 37 (60.7%) | 24 (39.3%) |
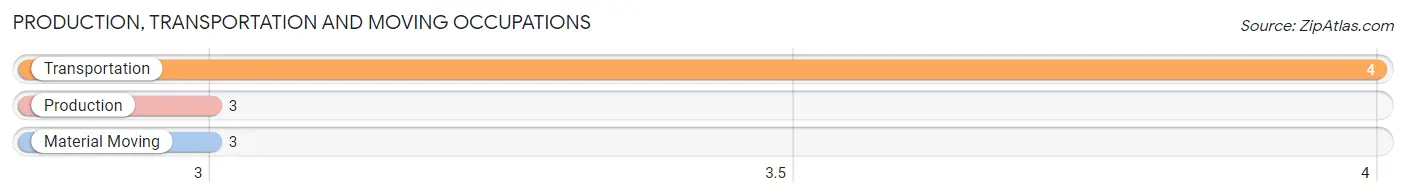
Production, Transportation and Moving Occupations
The most common Production, Transportation and Moving occupations in Nett Lake are Transportation (4 | 6.6%), Production (3 | 4.9%), and Material Moving (3 | 4.9%).
Production, Transportation and Moving Occupations by Sex
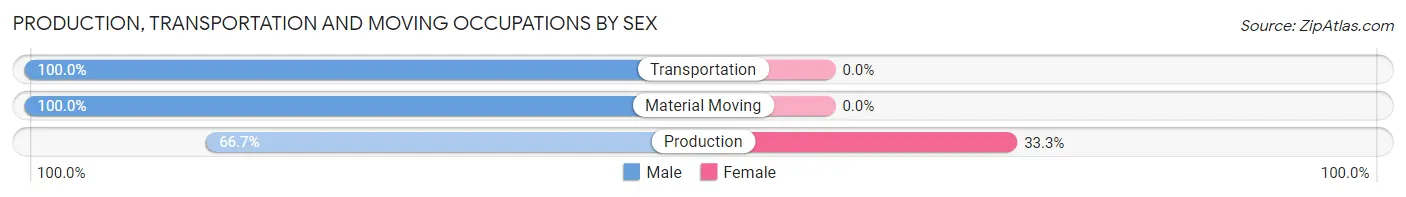
| Occupation | Male | Female |
| Production | 2 (66.7%) | 1 (33.3%) |
| Transportation | 4 (100.0%) | 0 (0.0%) |
| Material Moving | 3 (100.0%) | 0 (0.0%) |
| Total (Category) | 9 (90.0%) | 1 (10.0%) |
| Total (Overall) | 37 (60.7%) | 24 (39.3%) |
Employment Industries by Sex in Nett Lake
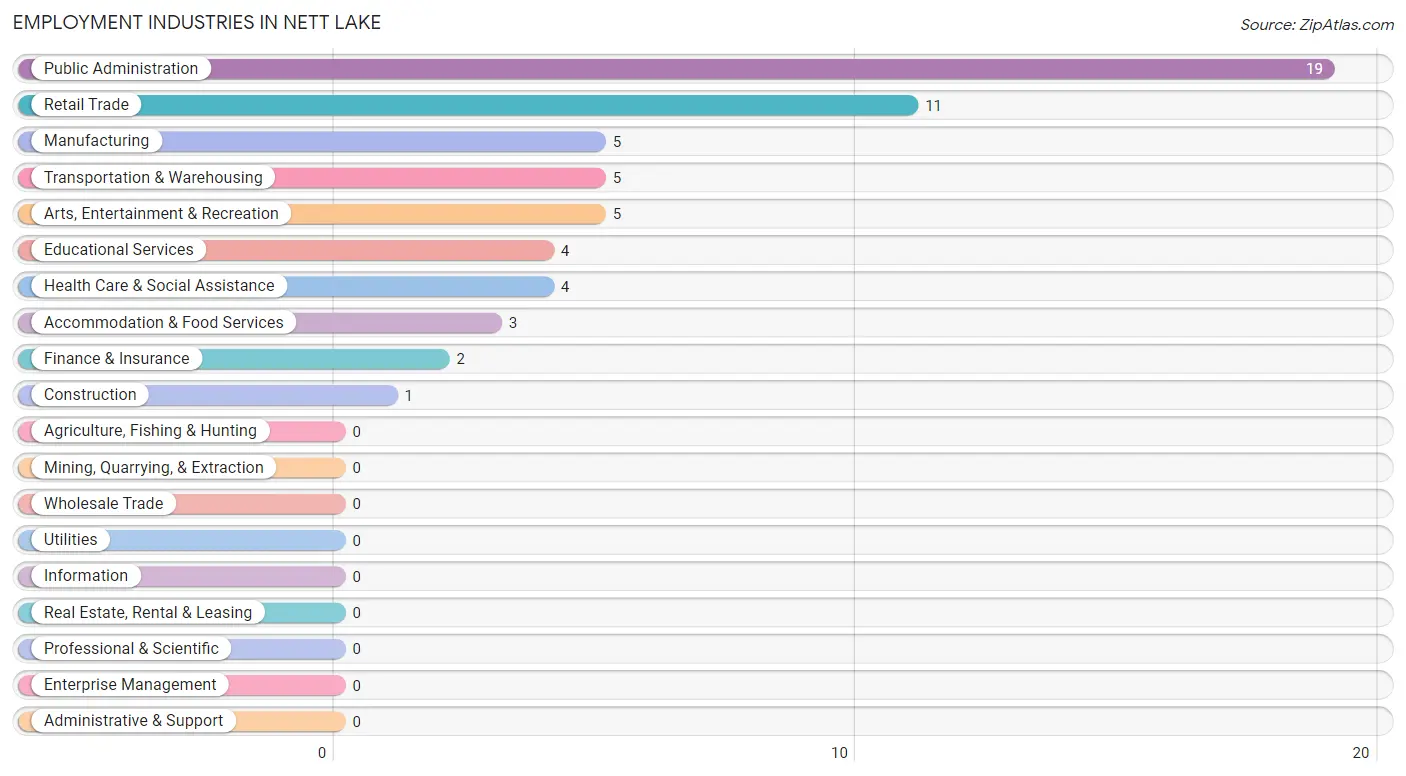
Employment Industries in Nett Lake
The major employment industries in Nett Lake include Public Administration (19 | 31.1%), Retail Trade (11 | 18.0%), Manufacturing (5 | 8.2%), Transportation & Warehousing (5 | 8.2%), and Arts, Entertainment & Recreation (5 | 8.2%).
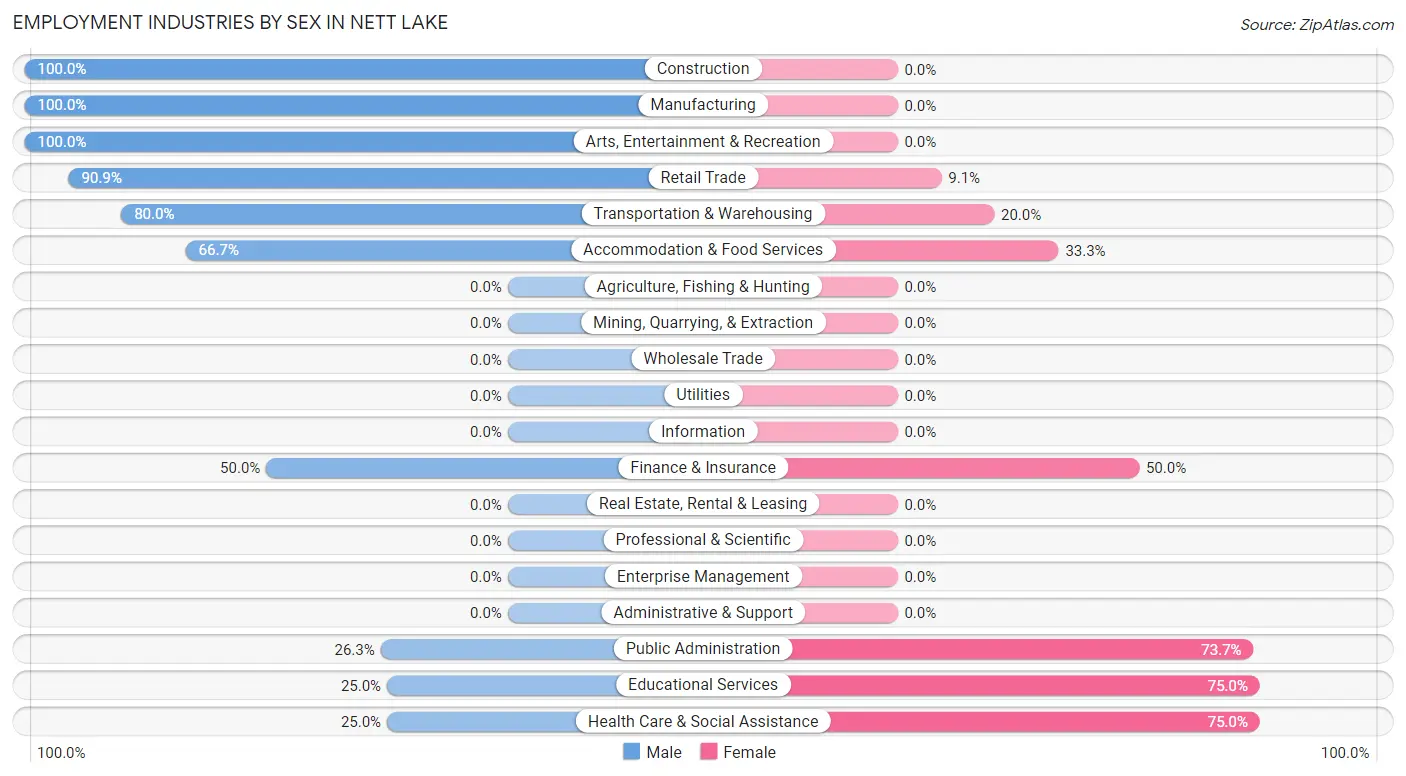
Employment Industries by Sex in Nett Lake
The Nett Lake industries that see more men than women are Construction (100.0%), Manufacturing (100.0%), and Arts, Entertainment & Recreation (100.0%), whereas the industries that tend to have a higher number of women are Educational Services (75.0%), Health Care & Social Assistance (75.0%), and Public Administration (73.7%).
| Industry | Male | Female |
| Agriculture, Fishing & Hunting | 0 (0.0%) | 0 (0.0%) |
| Mining, Quarrying, & Extraction | 0 (0.0%) | 0 (0.0%) |
| Construction | 1 (100.0%) | 0 (0.0%) |
| Manufacturing | 5 (100.0%) | 0 (0.0%) |
| Wholesale Trade | 0 (0.0%) | 0 (0.0%) |
| Retail Trade | 10 (90.9%) | 1 (9.1%) |
| Transportation & Warehousing | 4 (80.0%) | 1 (20.0%) |
| Utilities | 0 (0.0%) | 0 (0.0%) |
| Information | 0 (0.0%) | 0 (0.0%) |
| Finance & Insurance | 1 (50.0%) | 1 (50.0%) |
| Real Estate, Rental & Leasing | 0 (0.0%) | 0 (0.0%) |
| Professional & Scientific | 0 (0.0%) | 0 (0.0%) |
| Enterprise Management | 0 (0.0%) | 0 (0.0%) |
| Administrative & Support | 0 (0.0%) | 0 (0.0%) |
| Educational Services | 1 (25.0%) | 3 (75.0%) |
| Health Care & Social Assistance | 1 (25.0%) | 3 (75.0%) |
| Arts, Entertainment & Recreation | 5 (100.0%) | 0 (0.0%) |
| Accommodation & Food Services | 2 (66.7%) | 1 (33.3%) |
| Public Administration | 5 (26.3%) | 14 (73.7%) |
| Total | 37 (60.7%) | 24 (39.3%) |
Education in Nett Lake
School Enrollment in Nett Lake
The most common levels of schooling among the 53 students in Nett Lake are middle school (20 | 37.7%), high school (16 | 30.2%), and elementary school (9 | 17.0%).
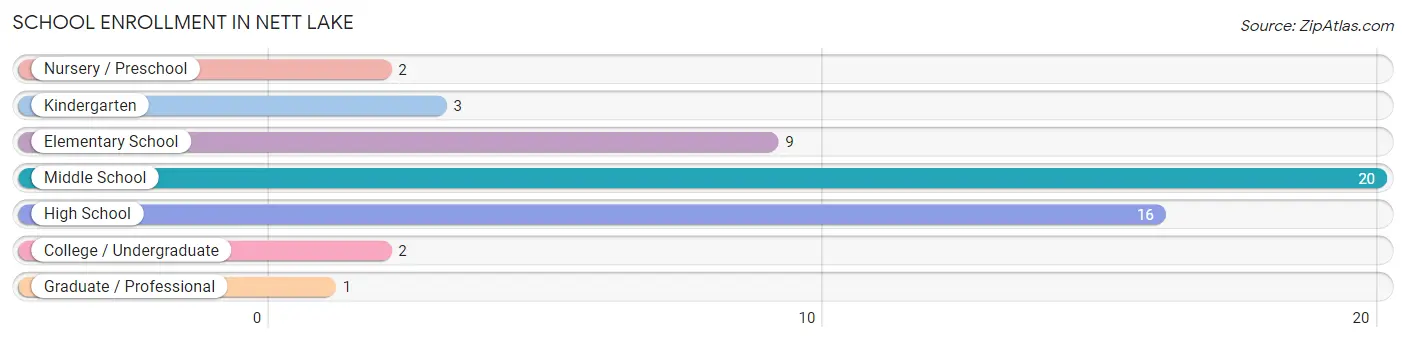
| School Level | # Students | % Students |
| Nursery / Preschool | 2 | 3.8% |
| Kindergarten | 3 | 5.7% |
| Elementary School | 9 | 17.0% |
| Middle School | 20 | 37.7% |
| High School | 16 | 30.2% |
| College / Undergraduate | 2 | 3.8% |
| Graduate / Professional | 1 | 1.9% |
| Total | 53 | 100.0% |
School Enrollment by Age by Funding Source in Nett Lake
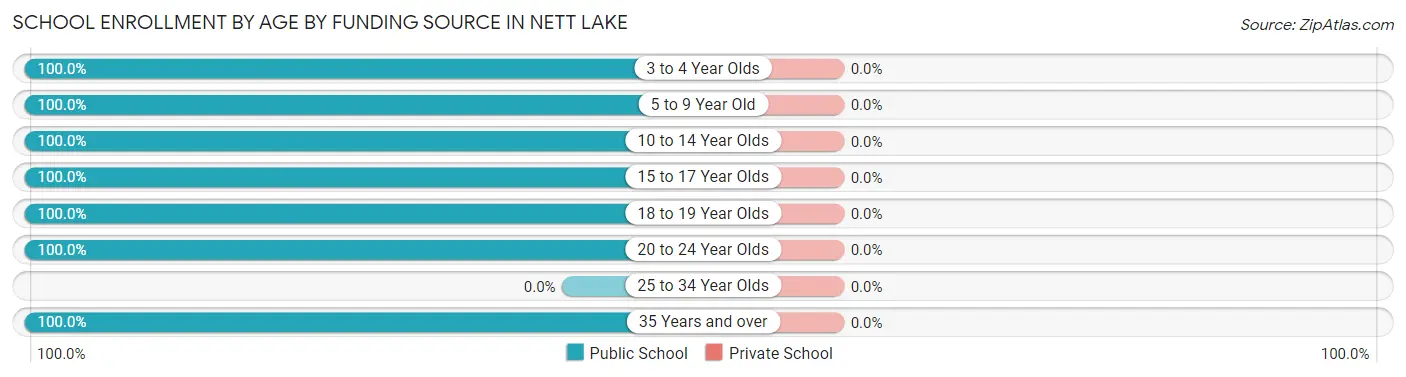
| Age Bracket | Public School | Private School |
| 3 to 4 Year Olds | 1 (100.0%) | 0 (0.0%) |
| 5 to 9 Year Old | 19 (100.0%) | 0 (0.0%) |
| 10 to 14 Year Olds | 15 (100.0%) | 0 (0.0%) |
| 15 to 17 Year Olds | 8 (100.0%) | 0 (0.0%) |
| 18 to 19 Year Olds | 5 (100.0%) | 0 (0.0%) |
| 20 to 24 Year Olds | 2 (100.0%) | 0 (0.0%) |
| 25 to 34 Year Olds | 0 (0.0%) | 0 (0.0%) |
| 35 Years and over | 3 (100.0%) | 0 (0.0%) |
| Total | 53 (100.0%) | 0 (0.0%) |
Educational Attainment by Field of Study in Nett Lake
Computers & mathematics (2 | 20.0%), education (2 | 20.0%), communications (2 | 20.0%), business (1 | 10.0%), and literature & languages (1 | 10.0%) are the most common fields of study among 10 individuals in Nett Lake who have obtained a bachelor's degree or higher.
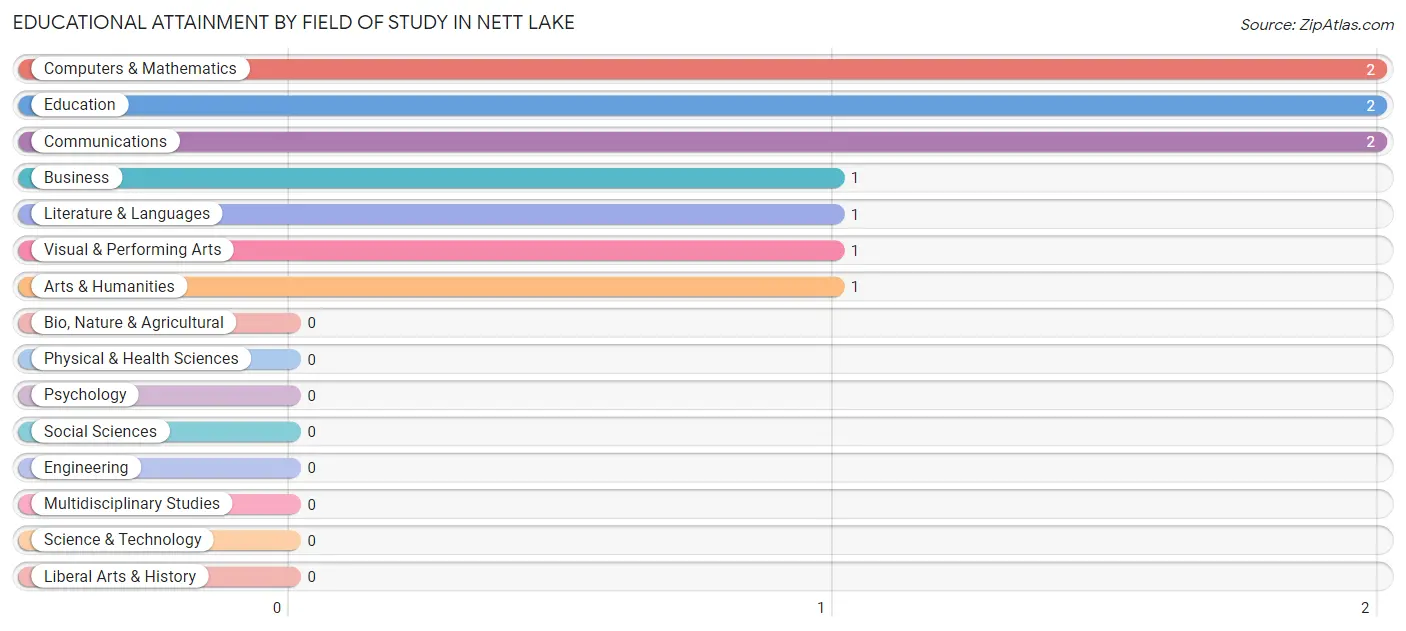
| Field of Study | # Graduates | % Graduates |
| Computers & Mathematics | 2 | 20.0% |
| Bio, Nature & Agricultural | 0 | 0.0% |
| Physical & Health Sciences | 0 | 0.0% |
| Psychology | 0 | 0.0% |
| Social Sciences | 0 | 0.0% |
| Engineering | 0 | 0.0% |
| Multidisciplinary Studies | 0 | 0.0% |
| Science & Technology | 0 | 0.0% |
| Business | 1 | 10.0% |
| Education | 2 | 20.0% |
| Literature & Languages | 1 | 10.0% |
| Liberal Arts & History | 0 | 0.0% |
| Visual & Performing Arts | 1 | 10.0% |
| Communications | 2 | 20.0% |
| Arts & Humanities | 1 | 10.0% |
| Total | 10 | 100.0% |
Transportation & Commute in Nett Lake
Vehicle Availability by Sex in Nett Lake
The most prevalent vehicle ownership categories in Nett Lake are males with 1 vehicle (14, accounting for 37.8%) and females with 1 vehicle (6, making up 58.3%).
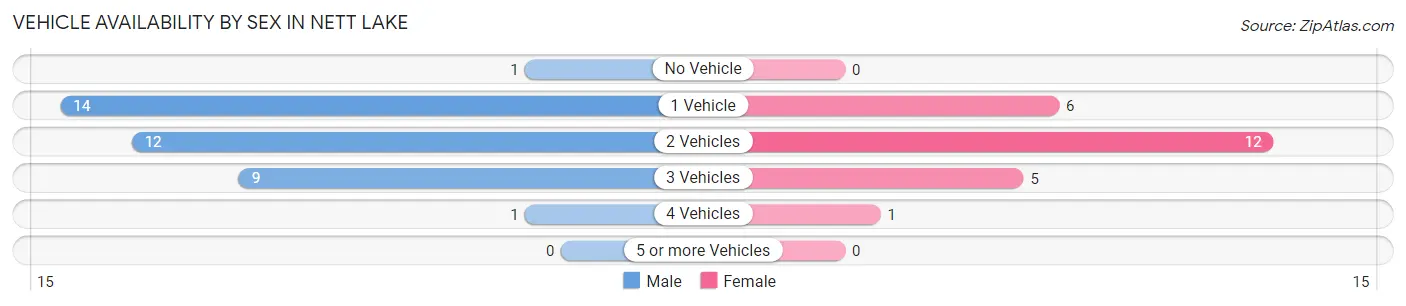
| Vehicles Available | Male | Female |
| No Vehicle | 1 (2.7%) | 0 (0.0%) |
| 1 Vehicle | 14 (37.8%) | 6 (25.0%) |
| 2 Vehicles | 12 (32.4%) | 12 (50.0%) |
| 3 Vehicles | 9 (24.3%) | 5 (20.8%) |
| 4 Vehicles | 1 (2.7%) | 1 (4.2%) |
| 5 or more Vehicles | 0 (0.0%) | 0 (0.0%) |
| Total | 37 (100.0%) | 24 (100.0%) |
Commute Time in Nett Lake
The most frequently occuring commute durations in Nett Lake are less than 5 minutes (25 commuters, 42.4%), 5 to 9 minutes (12 commuters, 20.3%), and 15 to 19 minutes (6 commuters, 10.2%).
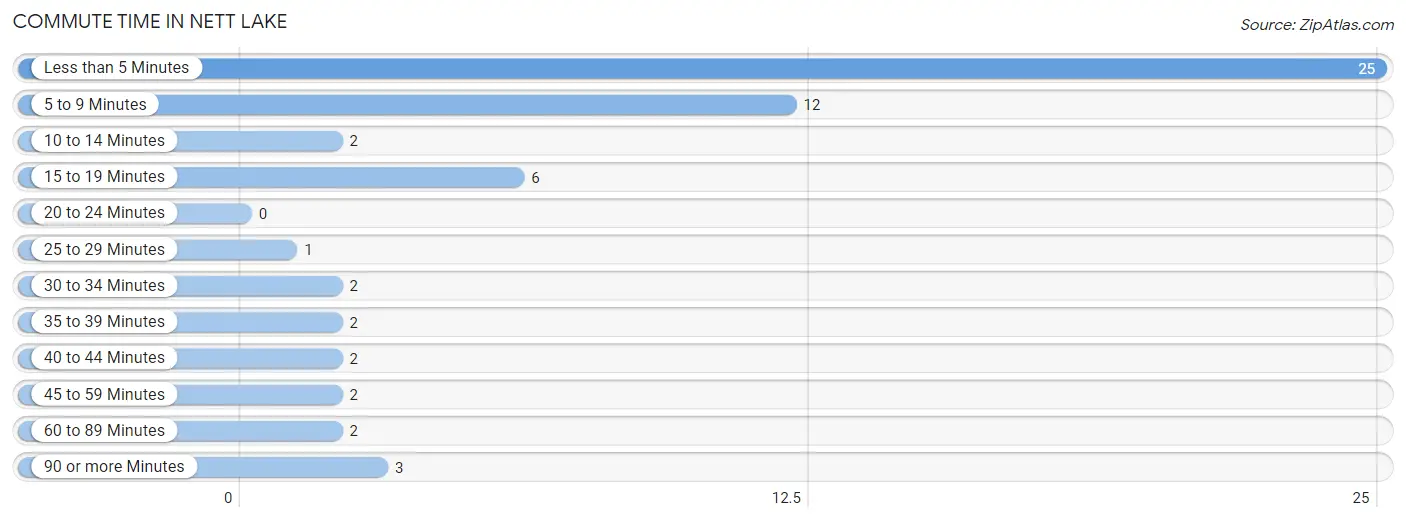
| Commute Time | # Commuters | % Commuters |
| Less than 5 Minutes | 25 | 42.4% |
| 5 to 9 Minutes | 12 | 20.3% |
| 10 to 14 Minutes | 2 | 3.4% |
| 15 to 19 Minutes | 6 | 10.2% |
| 20 to 24 Minutes | 0 | 0.0% |
| 25 to 29 Minutes | 1 | 1.7% |
| 30 to 34 Minutes | 2 | 3.4% |
| 35 to 39 Minutes | 2 | 3.4% |
| 40 to 44 Minutes | 2 | 3.4% |
| 45 to 59 Minutes | 2 | 3.4% |
| 60 to 89 Minutes | 2 | 3.4% |
| 90 or more Minutes | 3 | 5.1% |
Commute Time by Sex in Nett Lake
The most common commute times in Nett Lake are less than 5 minutes (16 commuters, 45.7%) for males and less than 5 minutes (9 commuters, 37.5%) for females.
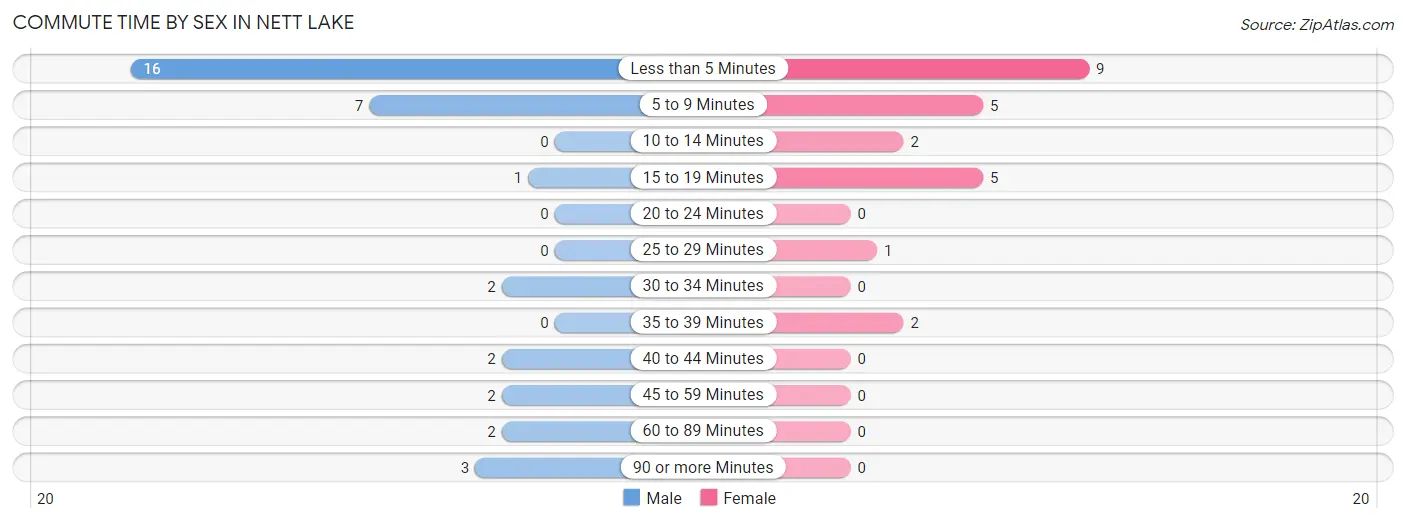
| Commute Time | Male | Female |
| Less than 5 Minutes | 16 (45.7%) | 9 (37.5%) |
| 5 to 9 Minutes | 7 (20.0%) | 5 (20.8%) |
| 10 to 14 Minutes | 0 (0.0%) | 2 (8.3%) |
| 15 to 19 Minutes | 1 (2.9%) | 5 (20.8%) |
| 20 to 24 Minutes | 0 (0.0%) | 0 (0.0%) |
| 25 to 29 Minutes | 0 (0.0%) | 1 (4.2%) |
| 30 to 34 Minutes | 2 (5.7%) | 0 (0.0%) |
| 35 to 39 Minutes | 0 (0.0%) | 2 (8.3%) |
| 40 to 44 Minutes | 2 (5.7%) | 0 (0.0%) |
| 45 to 59 Minutes | 2 (5.7%) | 0 (0.0%) |
| 60 to 89 Minutes | 2 (5.7%) | 0 (0.0%) |
| 90 or more Minutes | 3 (8.6%) | 0 (0.0%) |
Time of Departure to Work by Sex in Nett Lake
The most frequent times of departure to work in Nett Lake are 12:00 PM to 3:59 PM (9, 25.7%) for males and 7:30 AM to 7:59 AM (11, 45.8%) for females.
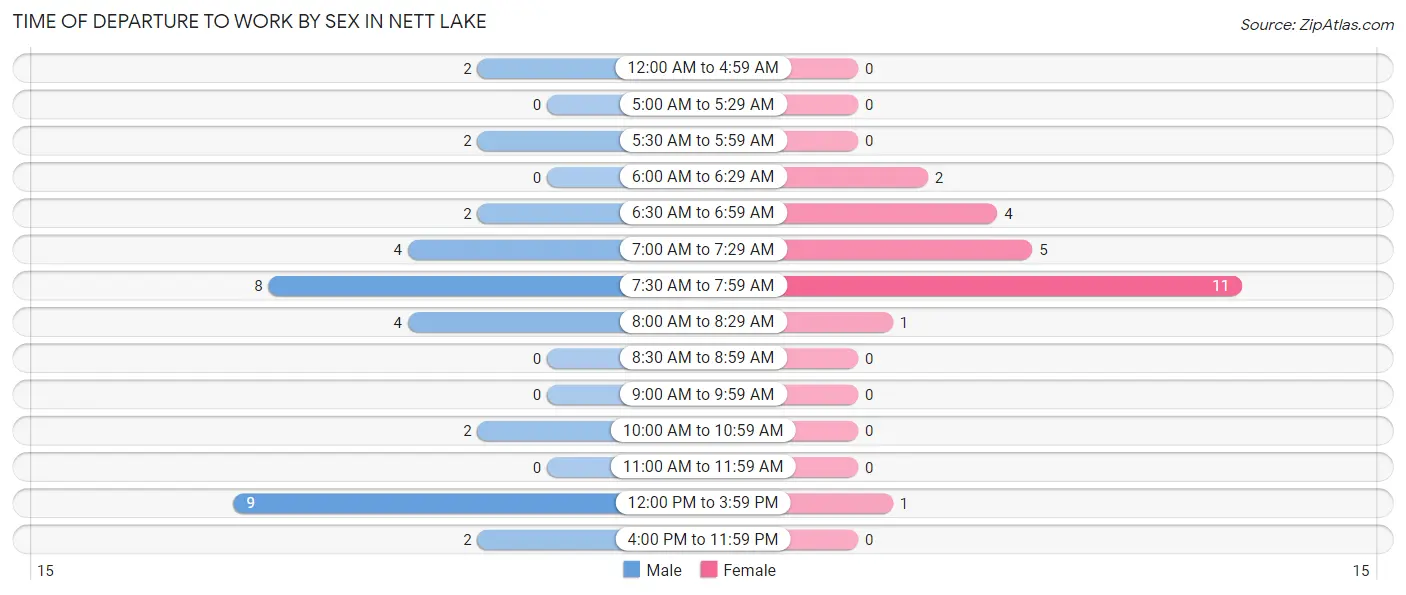
| Time of Departure | Male | Female |
| 12:00 AM to 4:59 AM | 2 (5.7%) | 0 (0.0%) |
| 5:00 AM to 5:29 AM | 0 (0.0%) | 0 (0.0%) |
| 5:30 AM to 5:59 AM | 2 (5.7%) | 0 (0.0%) |
| 6:00 AM to 6:29 AM | 0 (0.0%) | 2 (8.3%) |
| 6:30 AM to 6:59 AM | 2 (5.7%) | 4 (16.7%) |
| 7:00 AM to 7:29 AM | 4 (11.4%) | 5 (20.8%) |
| 7:30 AM to 7:59 AM | 8 (22.9%) | 11 (45.8%) |
| 8:00 AM to 8:29 AM | 4 (11.4%) | 1 (4.2%) |
| 8:30 AM to 8:59 AM | 0 (0.0%) | 0 (0.0%) |
| 9:00 AM to 9:59 AM | 0 (0.0%) | 0 (0.0%) |
| 10:00 AM to 10:59 AM | 2 (5.7%) | 0 (0.0%) |
| 11:00 AM to 11:59 AM | 0 (0.0%) | 0 (0.0%) |
| 12:00 PM to 3:59 PM | 9 (25.7%) | 1 (4.2%) |
| 4:00 PM to 11:59 PM | 2 (5.7%) | 0 (0.0%) |
| Total | 35 (100.0%) | 24 (100.0%) |
Housing Occupancy in Nett Lake
Occupancy by Ownership in Nett Lake
Of the total 92 dwellings in Nett Lake, owner-occupied units account for 36 (39.1%), while renter-occupied units make up 56 (60.9%).
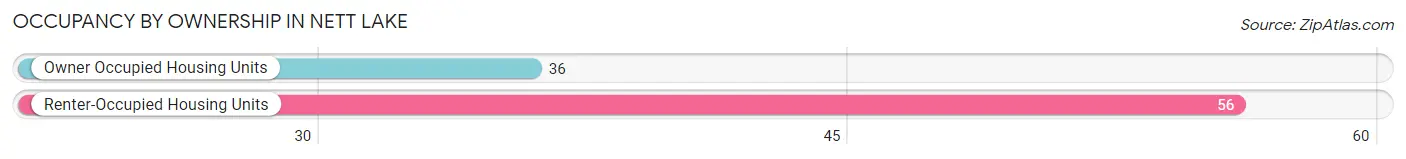
| Occupancy | # Housing Units | % Housing Units |
| Owner Occupied Housing Units | 36 | 39.1% |
| Renter-Occupied Housing Units | 56 | 60.9% |
| Total Occupied Housing Units | 92 | 100.0% |
Occupancy by Household Size in Nett Lake
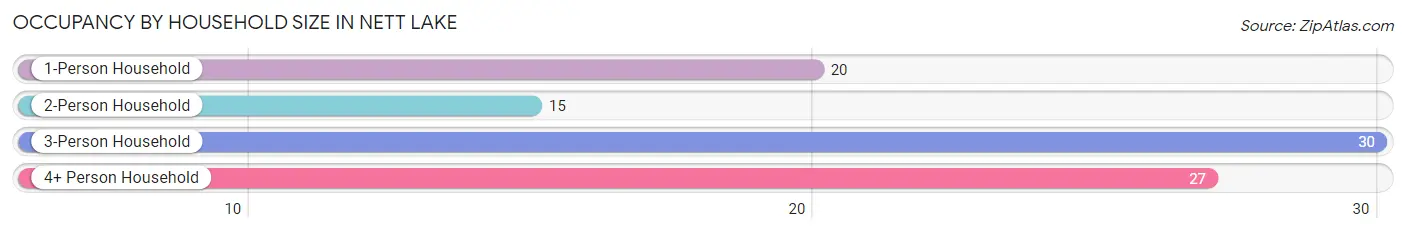
| Household Size | # Housing Units | % Housing Units |
| 1-Person Household | 20 | 21.7% |
| 2-Person Household | 15 | 16.3% |
| 3-Person Household | 30 | 32.6% |
| 4+ Person Household | 27 | 29.3% |
| Total Housing Units | 92 | 100.0% |
Occupancy by Ownership by Household Size in Nett Lake
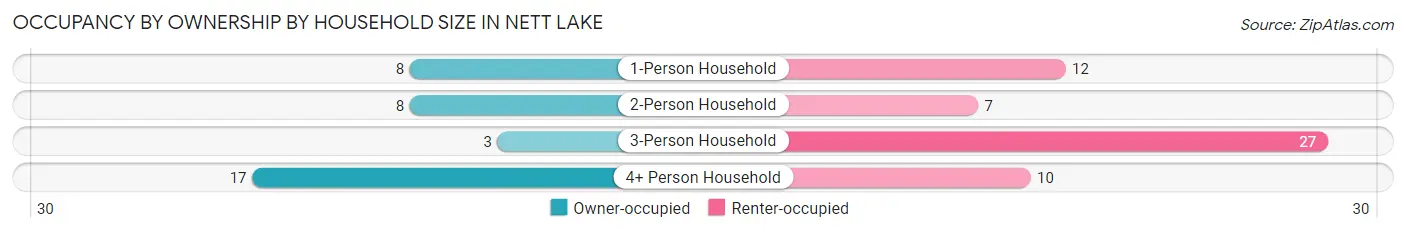
| Household Size | Owner-occupied | Renter-occupied |
| 1-Person Household | 8 (40.0%) | 12 (60.0%) |
| 2-Person Household | 8 (53.3%) | 7 (46.7%) |
| 3-Person Household | 3 (10.0%) | 27 (90.0%) |
| 4+ Person Household | 17 (63.0%) | 10 (37.0%) |
| Total Housing Units | 36 (39.1%) | 56 (60.9%) |
Occupancy by Educational Attainment in Nett Lake
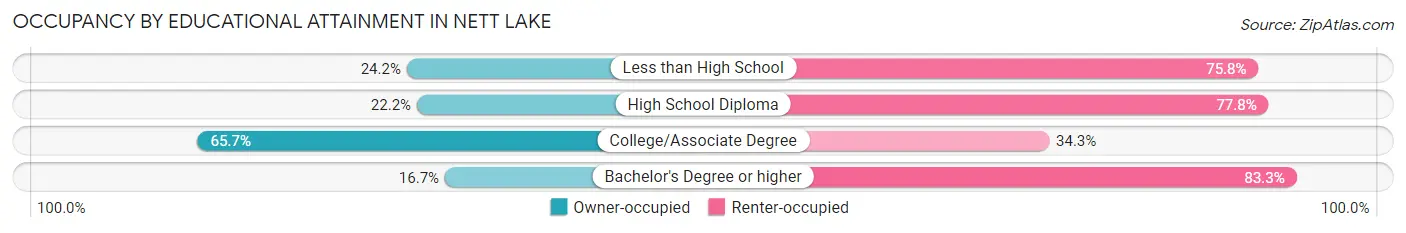
| Household Size | Owner-occupied | Renter-occupied |
| Less than High School | 8 (24.2%) | 25 (75.8%) |
| High School Diploma | 4 (22.2%) | 14 (77.8%) |
| College/Associate Degree | 23 (65.7%) | 12 (34.3%) |
| Bachelor's Degree or higher | 1 (16.7%) | 5 (83.3%) |
Occupancy by Age of Householder in Nett Lake
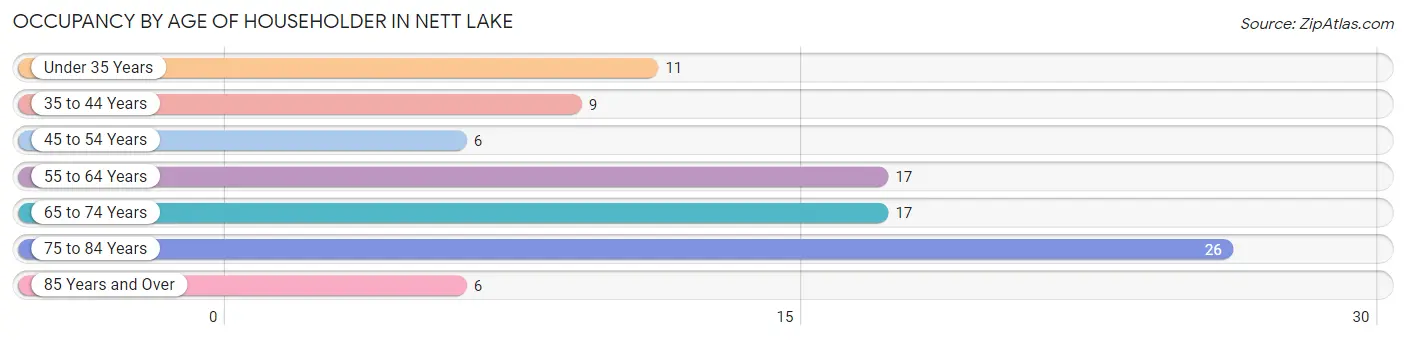
| Age Bracket | # Households | % Households |
| Under 35 Years | 11 | 12.0% |
| 35 to 44 Years | 9 | 9.8% |
| 45 to 54 Years | 6 | 6.5% |
| 55 to 64 Years | 17 | 18.5% |
| 65 to 74 Years | 17 | 18.5% |
| 75 to 84 Years | 26 | 28.3% |
| 85 Years and Over | 6 | 6.5% |
| Total | 92 | 100.0% |
Housing Finances in Nett Lake
Median Income by Occupancy in Nett Lake
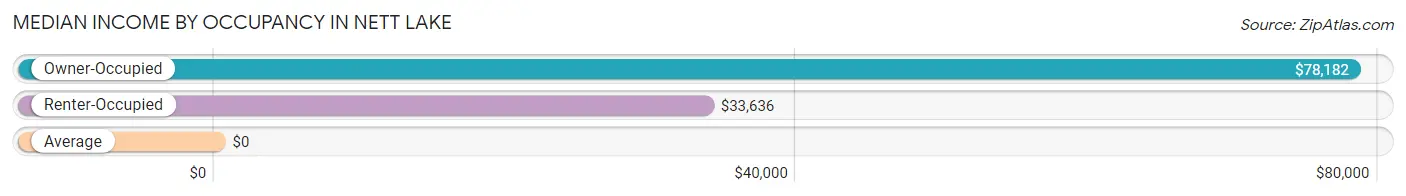
| Occupancy Type | # Households | Median Income |
| Owner-Occupied | 36 (39.1%) | $78,182 |
| Renter-Occupied | 56 (60.9%) | $33,636 |
| Average | 92 (100.0%) | $0 |
Occupancy by Householder Income Bracket in Nett Lake
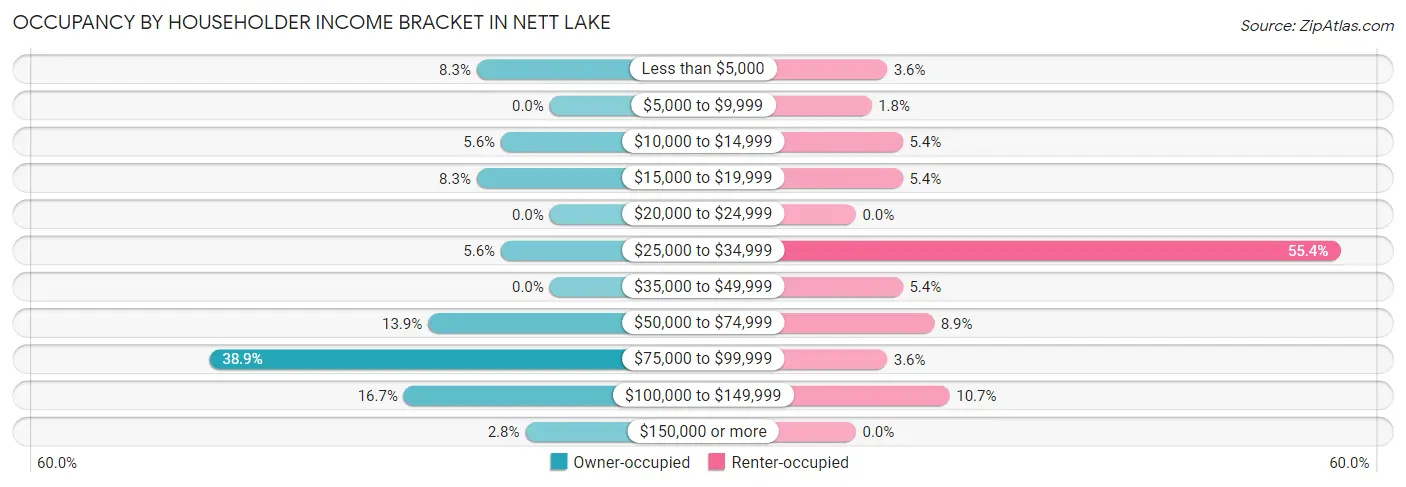
| Income Bracket | Owner-occupied | Renter-occupied |
| Less than $5,000 | 3 (8.3%) | 2 (3.6%) |
| $5,000 to $9,999 | 0 (0.0%) | 1 (1.8%) |
| $10,000 to $14,999 | 2 (5.6%) | 3 (5.4%) |
| $15,000 to $19,999 | 3 (8.3%) | 3 (5.4%) |
| $20,000 to $24,999 | 0 (0.0%) | 0 (0.0%) |
| $25,000 to $34,999 | 2 (5.6%) | 31 (55.4%) |
| $35,000 to $49,999 | 0 (0.0%) | 3 (5.4%) |
| $50,000 to $74,999 | 5 (13.9%) | 5 (8.9%) |
| $75,000 to $99,999 | 14 (38.9%) | 2 (3.6%) |
| $100,000 to $149,999 | 6 (16.7%) | 6 (10.7%) |
| $150,000 or more | 1 (2.8%) | 0 (0.0%) |
| Total | 36 (100.0%) | 56 (100.0%) |
Monthly Housing Cost Tiers in Nett Lake
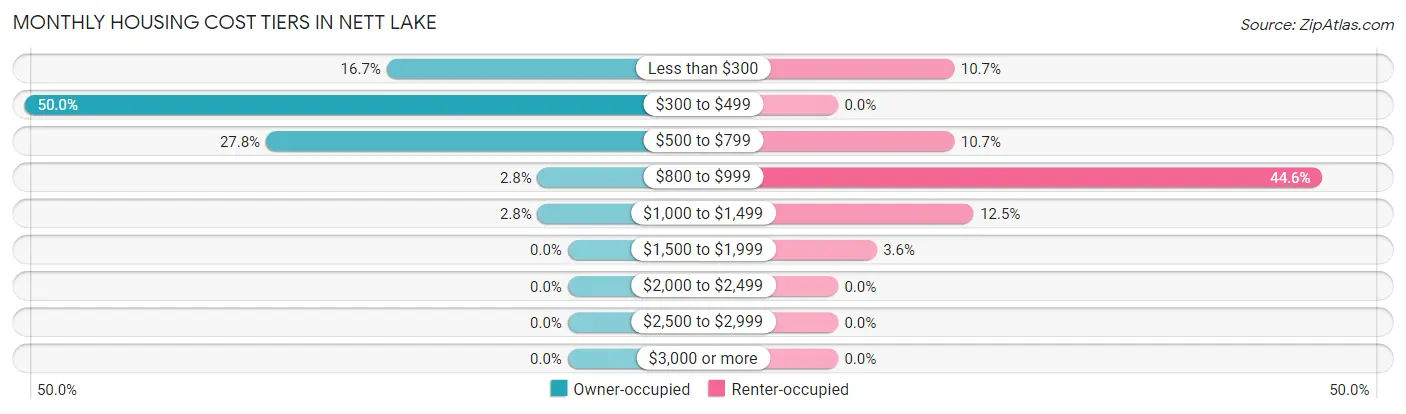
| Monthly Cost | Owner-occupied | Renter-occupied |
| Less than $300 | 6 (16.7%) | 6 (10.7%) |
| $300 to $499 | 18 (50.0%) | 0 (0.0%) |
| $500 to $799 | 10 (27.8%) | 6 (10.7%) |
| $800 to $999 | 1 (2.8%) | 25 (44.6%) |
| $1,000 to $1,499 | 1 (2.8%) | 7 (12.5%) |
| $1,500 to $1,999 | 0 (0.0%) | 2 (3.6%) |
| $2,000 to $2,499 | 0 (0.0%) | 0 (0.0%) |
| $2,500 to $2,999 | 0 (0.0%) | 0 (0.0%) |
| $3,000 or more | 0 (0.0%) | 0 (0.0%) |
| Total | 36 (100.0%) | 56 (100.0%) |
Physical Housing Characteristics in Nett Lake
Housing Structures in Nett Lake
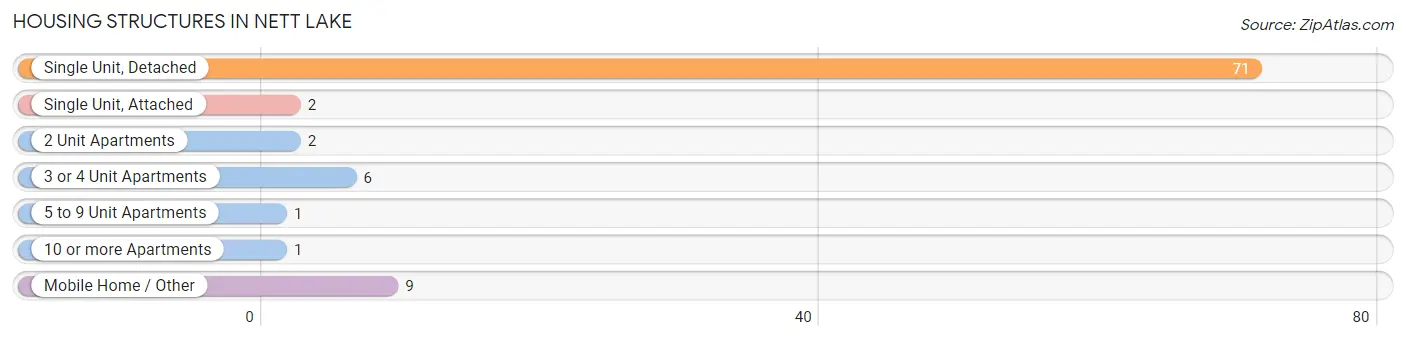
| Structure Type | # Housing Units | % Housing Units |
| Single Unit, Detached | 71 | 77.2% |
| Single Unit, Attached | 2 | 2.2% |
| 2 Unit Apartments | 2 | 2.2% |
| 3 or 4 Unit Apartments | 6 | 6.5% |
| 5 to 9 Unit Apartments | 1 | 1.1% |
| 10 or more Apartments | 1 | 1.1% |
| Mobile Home / Other | 9 | 9.8% |
| Total | 92 | 100.0% |
Housing Structures by Occupancy in Nett Lake
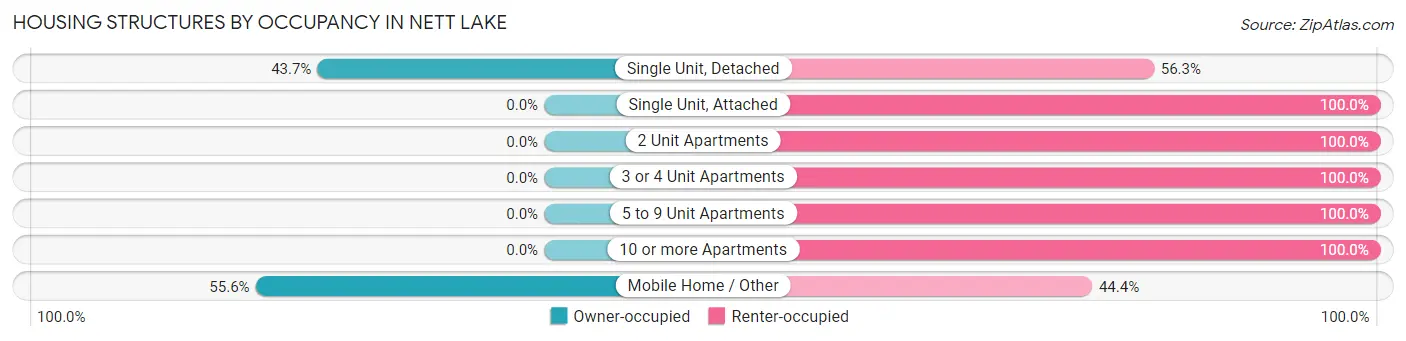
| Structure Type | Owner-occupied | Renter-occupied |
| Single Unit, Detached | 31 (43.7%) | 40 (56.3%) |
| Single Unit, Attached | 0 (0.0%) | 2 (100.0%) |
| 2 Unit Apartments | 0 (0.0%) | 2 (100.0%) |
| 3 or 4 Unit Apartments | 0 (0.0%) | 6 (100.0%) |
| 5 to 9 Unit Apartments | 0 (0.0%) | 1 (100.0%) |
| 10 or more Apartments | 0 (0.0%) | 1 (100.0%) |
| Mobile Home / Other | 5 (55.6%) | 4 (44.4%) |
| Total | 36 (39.1%) | 56 (60.9%) |
Housing Structures by Number of Rooms in Nett Lake
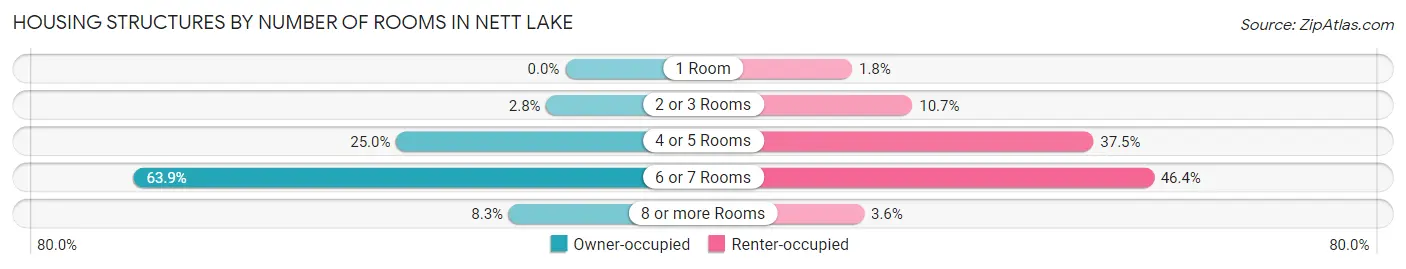
| Number of Rooms | Owner-occupied | Renter-occupied |
| 1 Room | 0 (0.0%) | 1 (1.8%) |
| 2 or 3 Rooms | 1 (2.8%) | 6 (10.7%) |
| 4 or 5 Rooms | 9 (25.0%) | 21 (37.5%) |
| 6 or 7 Rooms | 23 (63.9%) | 26 (46.4%) |
| 8 or more Rooms | 3 (8.3%) | 2 (3.6%) |
| Total | 36 (100.0%) | 56 (100.0%) |
Housing Structure by Heating Type in Nett Lake
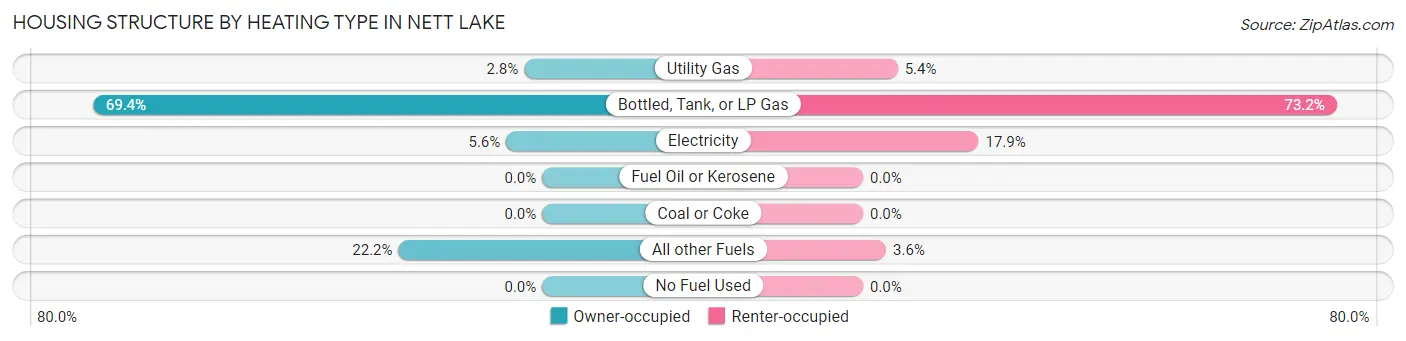
| Heating Type | Owner-occupied | Renter-occupied |
| Utility Gas | 1 (2.8%) | 3 (5.4%) |
| Bottled, Tank, or LP Gas | 25 (69.4%) | 41 (73.2%) |
| Electricity | 2 (5.6%) | 10 (17.9%) |
| Fuel Oil or Kerosene | 0 (0.0%) | 0 (0.0%) |
| Coal or Coke | 0 (0.0%) | 0 (0.0%) |
| All other Fuels | 8 (22.2%) | 2 (3.6%) |
| No Fuel Used | 0 (0.0%) | 0 (0.0%) |
| Total | 36 (100.0%) | 56 (100.0%) |
Household Vehicle Usage in Nett Lake
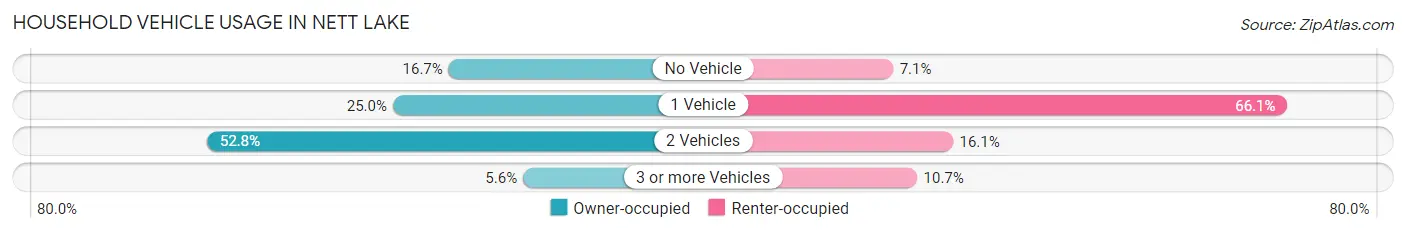
| Vehicles per Household | Owner-occupied | Renter-occupied |
| No Vehicle | 6 (16.7%) | 4 (7.1%) |
| 1 Vehicle | 9 (25.0%) | 37 (66.1%) |
| 2 Vehicles | 19 (52.8%) | 9 (16.1%) |
| 3 or more Vehicles | 2 (5.6%) | 6 (10.7%) |
| Total | 36 (100.0%) | 56 (100.0%) |
Real Estate & Mortgages in Nett Lake
Real Estate and Mortgage Overview in Nett Lake
| Characteristic | Without Mortgage | With Mortgage |
| Housing Units | 32 | 4 |
| Median Property Value | - | - |
| Median Household Income | $78,182 | $0 |
| Monthly Housing Costs | $390 | $0 |
| Real Estate Taxes | - | - |
Property Value by Mortgage Status in Nett Lake
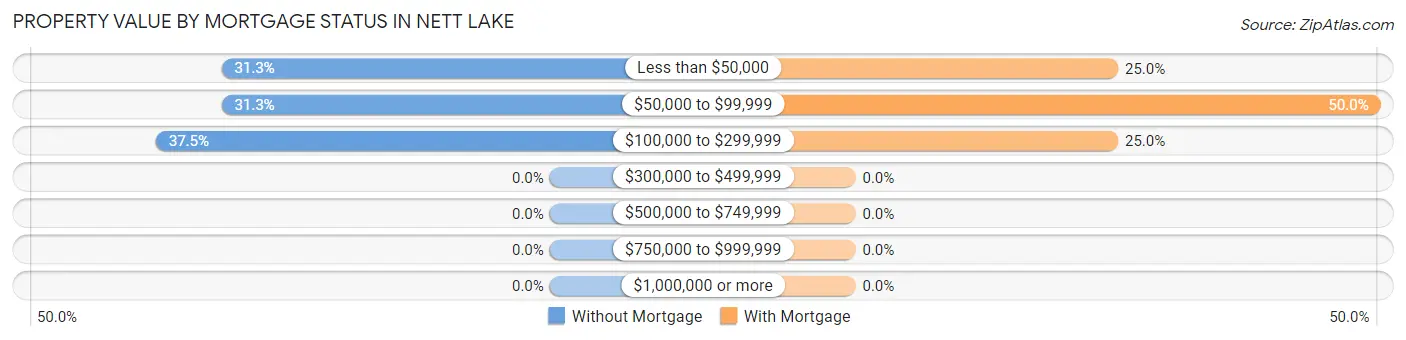
| Property Value | Without Mortgage | With Mortgage |
| Less than $50,000 | 10 (31.2%) | 1 (25.0%) |
| $50,000 to $99,999 | 10 (31.2%) | 2 (50.0%) |
| $100,000 to $299,999 | 12 (37.5%) | 1 (25.0%) |
| $300,000 to $499,999 | 0 (0.0%) | 0 (0.0%) |
| $500,000 to $749,999 | 0 (0.0%) | 0 (0.0%) |
| $750,000 to $999,999 | 0 (0.0%) | 0 (0.0%) |
| $1,000,000 or more | 0 (0.0%) | 0 (0.0%) |
| Total | 32 (100.0%) | 4 (100.0%) |
Household Income by Mortgage Status in Nett Lake
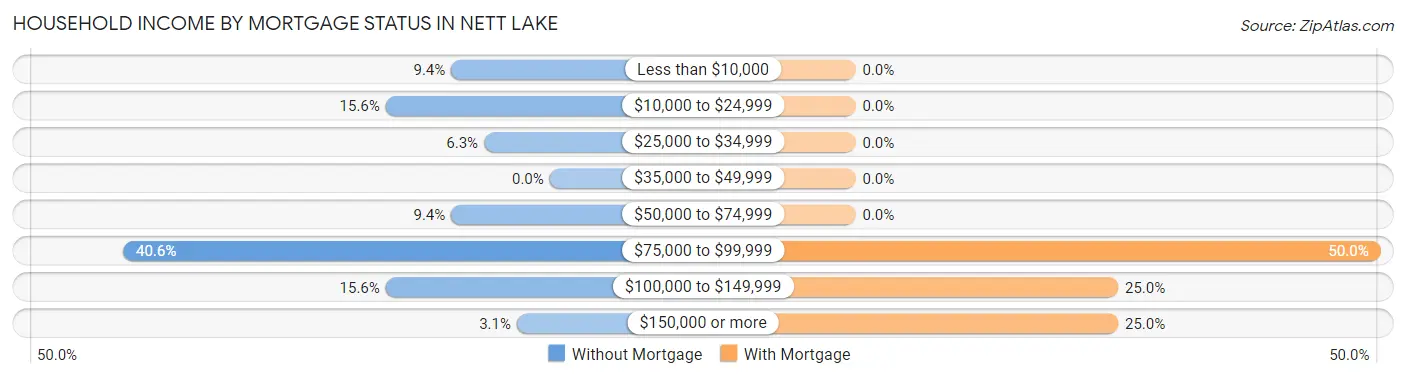
| Household Income | Without Mortgage | With Mortgage |
| Less than $10,000 | 3 (9.4%) | 0 (0.0%) |
| $10,000 to $24,999 | 5 (15.6%) | 0 (0.0%) |
| $25,000 to $34,999 | 2 (6.2%) | 0 (0.0%) |
| $35,000 to $49,999 | 0 (0.0%) | 0 (0.0%) |
| $50,000 to $74,999 | 3 (9.4%) | 0 (0.0%) |
| $75,000 to $99,999 | 13 (40.6%) | 2 (50.0%) |
| $100,000 to $149,999 | 5 (15.6%) | 1 (25.0%) |
| $150,000 or more | 1 (3.1%) | 1 (25.0%) |
| Total | 32 (100.0%) | 4 (100.0%) |
Property Value to Household Income Ratio in Nett Lake
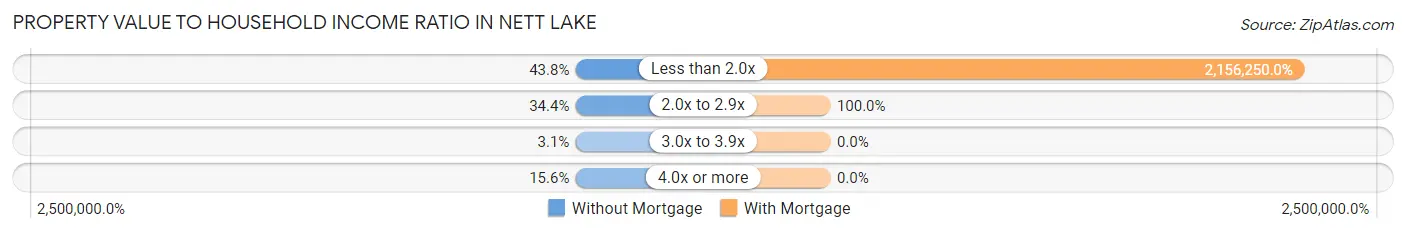
| Value-to-Income Ratio | Without Mortgage | With Mortgage |
| Less than 2.0x | 14 (43.8%) | 86,250 (2,156,250.0%) |
| 2.0x to 2.9x | 11 (34.4%) | 4 (100.0%) |
| 3.0x to 3.9x | 1 (3.1%) | 0 (0.0%) |
| 4.0x or more | 5 (15.6%) | 0 (0.0%) |
| Total | 32 (100.0%) | 4 (100.0%) |
Real Estate Taxes by Mortgage Status in Nett Lake
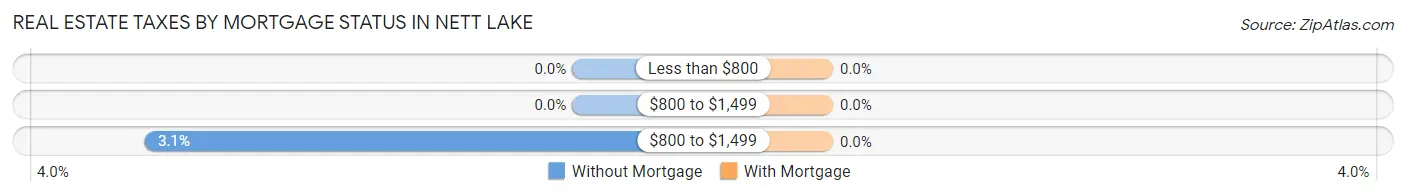
| Property Taxes | Without Mortgage | With Mortgage |
| Less than $800 | 0 (0.0%) | 0 (0.0%) |
| $800 to $1,499 | 0 (0.0%) | 0 (0.0%) |
| $800 to $1,499 | 1 (3.1%) | 0 (0.0%) |
| Total | 32 (100.0%) | 4 (100.0%) |
Health & Disability in Nett Lake
Health Insurance Coverage by Age in Nett Lake
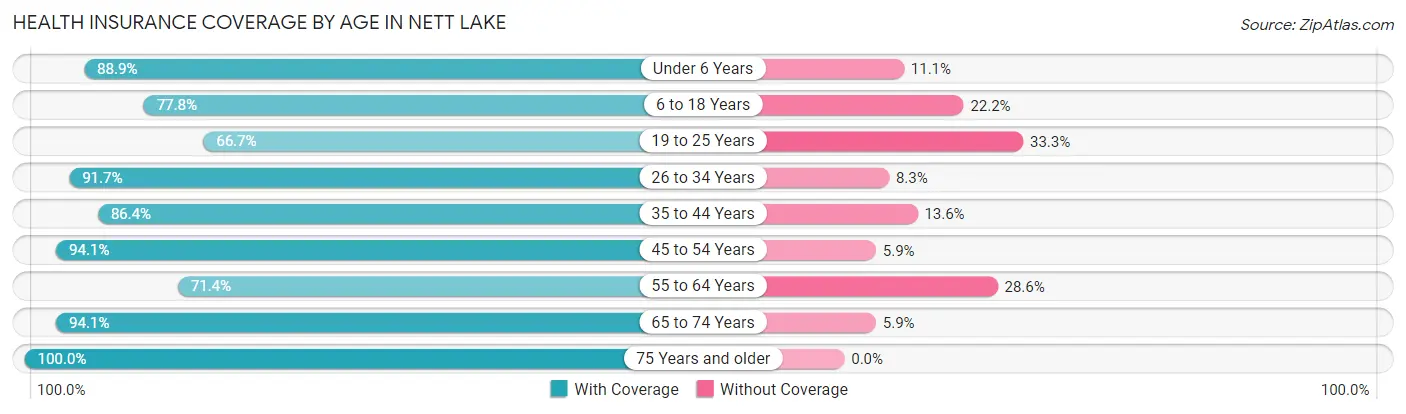
| Age Bracket | With Coverage | Without Coverage |
| Under 6 Years | 16 (88.9%) | 2 (11.1%) |
| 6 to 18 Years | 35 (77.8%) | 10 (22.2%) |
| 19 to 25 Years | 8 (66.7%) | 4 (33.3%) |
| 26 to 34 Years | 11 (91.7%) | 1 (8.3%) |
| 35 to 44 Years | 19 (86.4%) | 3 (13.6%) |
| 45 to 54 Years | 16 (94.1%) | 1 (5.9%) |
| 55 to 64 Years | 20 (71.4%) | 8 (28.6%) |
| 65 to 74 Years | 16 (94.1%) | 1 (5.9%) |
| 75 Years and older | 32 (100.0%) | 0 (0.0%) |
| Total | 173 (85.2%) | 30 (14.8%) |
Health Insurance Coverage by Citizenship Status in Nett Lake
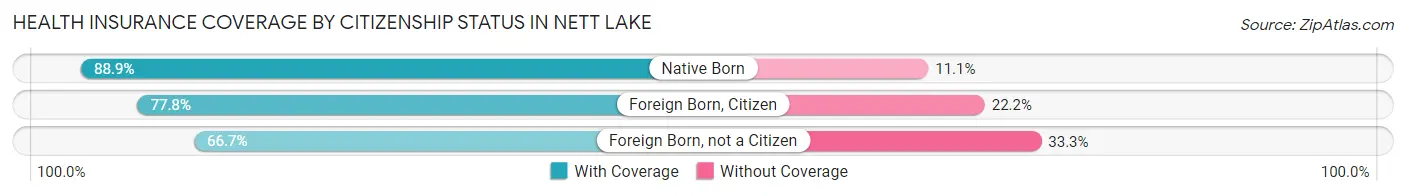
| Citizenship Status | With Coverage | Without Coverage |
| Native Born | 16 (88.9%) | 2 (11.1%) |
| Foreign Born, Citizen | 35 (77.8%) | 10 (22.2%) |
| Foreign Born, not a Citizen | 8 (66.7%) | 4 (33.3%) |
Health Insurance Coverage by Household Income in Nett Lake
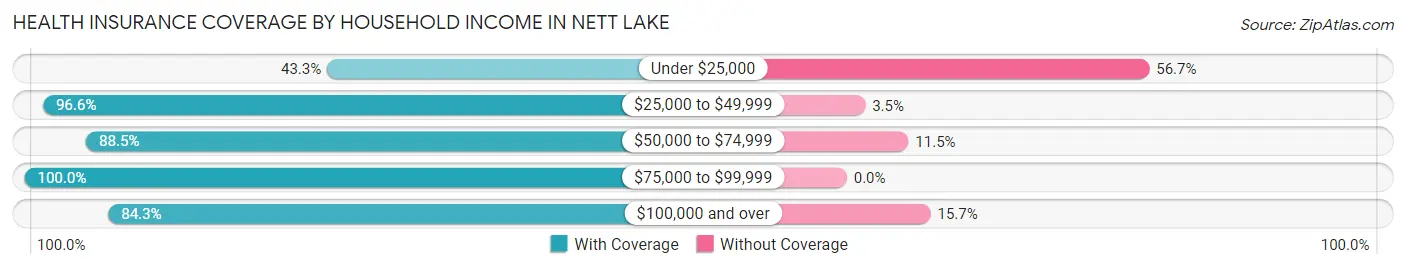
| Household Income | With Coverage | Without Coverage |
| Under $25,000 | 13 (43.3%) | 17 (56.7%) |
| $25,000 to $49,999 | 56 (96.6%) | 2 (3.5%) |
| $50,000 to $74,999 | 23 (88.5%) | 3 (11.5%) |
| $75,000 to $99,999 | 38 (100.0%) | 0 (0.0%) |
| $100,000 and over | 43 (84.3%) | 8 (15.7%) |
Public vs Private Health Insurance Coverage by Age in Nett Lake
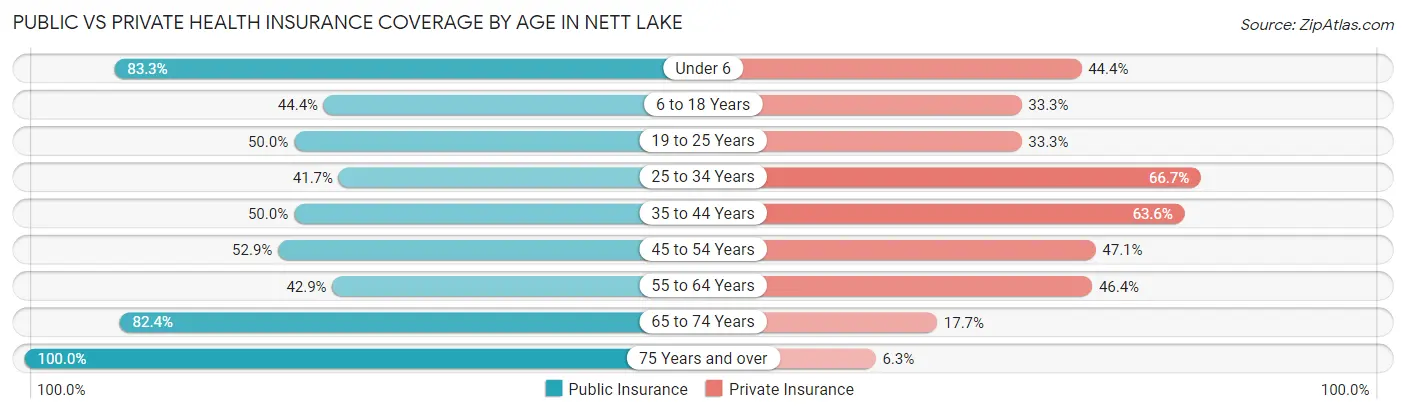
| Age Bracket | Public Insurance | Private Insurance |
| Under 6 | 15 (83.3%) | 8 (44.4%) |
| 6 to 18 Years | 20 (44.4%) | 15 (33.3%) |
| 19 to 25 Years | 6 (50.0%) | 4 (33.3%) |
| 25 to 34 Years | 5 (41.7%) | 8 (66.7%) |
| 35 to 44 Years | 11 (50.0%) | 14 (63.6%) |
| 45 to 54 Years | 9 (52.9%) | 8 (47.1%) |
| 55 to 64 Years | 12 (42.9%) | 13 (46.4%) |
| 65 to 74 Years | 14 (82.4%) | 3 (17.6%) |
| 75 Years and over | 32 (100.0%) | 2 (6.2%) |
| Total | 124 (61.1%) | 75 (36.9%) |
Disability Status by Sex by Age in Nett Lake
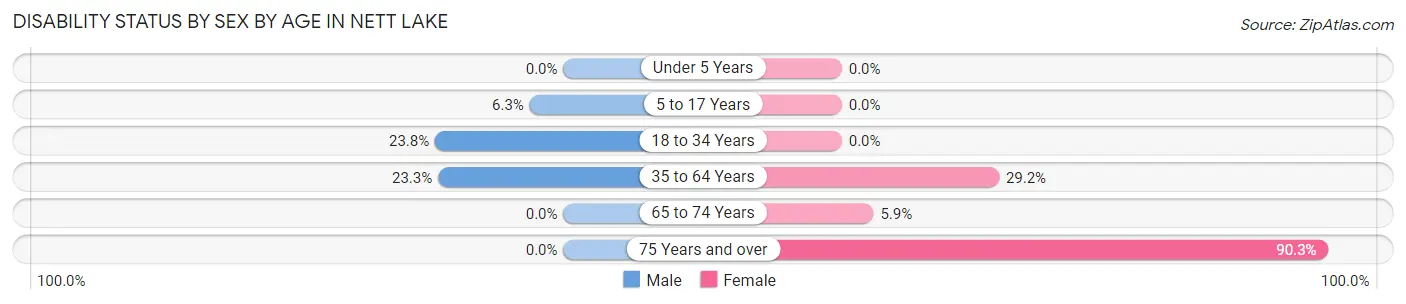
| Age Bracket | Male | Female |
| Under 5 Years | 0 (0.0%) | 0 (0.0%) |
| 5 to 17 Years | 1 (6.2%) | 0 (0.0%) |
| 18 to 34 Years | 5 (23.8%) | 0 (0.0%) |
| 35 to 64 Years | 10 (23.3%) | 7 (29.2%) |
| 65 to 74 Years | 0 (0.0%) | 1 (5.9%) |
| 75 Years and over | 0 (0.0%) | 28 (90.3%) |
Disability Class by Sex by Age in Nett Lake
Disability Class: Hearing Difficulty
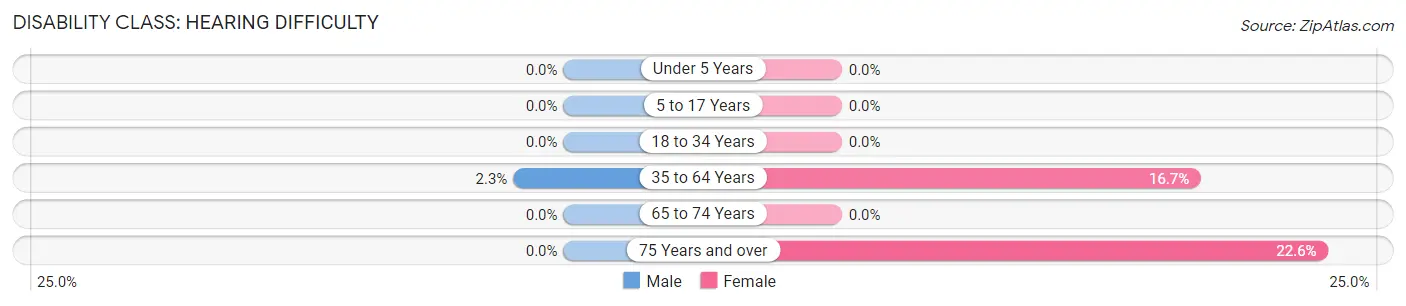
| Age Bracket | Male | Female |
| Under 5 Years | 0 (0.0%) | 0 (0.0%) |
| 5 to 17 Years | 0 (0.0%) | 0 (0.0%) |
| 18 to 34 Years | 0 (0.0%) | 0 (0.0%) |
| 35 to 64 Years | 1 (2.3%) | 4 (16.7%) |
| 65 to 74 Years | 0 (0.0%) | 0 (0.0%) |
| 75 Years and over | 0 (0.0%) | 7 (22.6%) |
Disability Class: Vision Difficulty
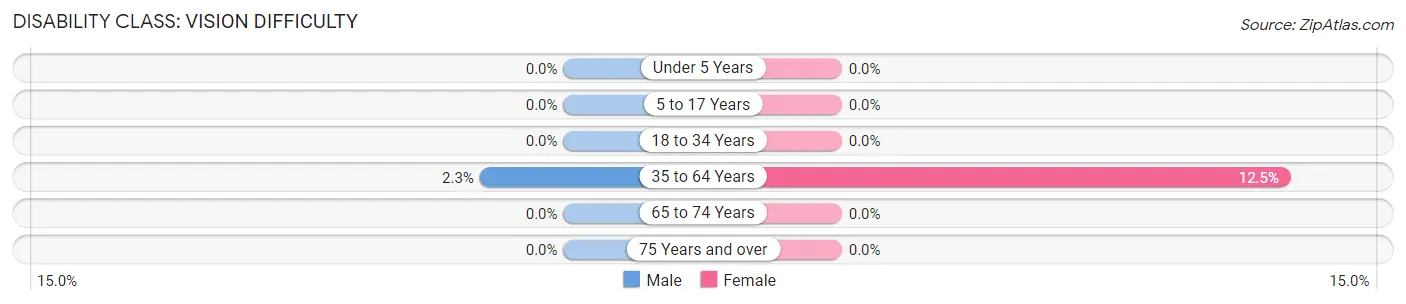
| Age Bracket | Male | Female |
| Under 5 Years | 0 (0.0%) | 0 (0.0%) |
| 5 to 17 Years | 0 (0.0%) | 0 (0.0%) |
| 18 to 34 Years | 0 (0.0%) | 0 (0.0%) |
| 35 to 64 Years | 1 (2.3%) | 3 (12.5%) |
| 65 to 74 Years | 0 (0.0%) | 0 (0.0%) |
| 75 Years and over | 0 (0.0%) | 0 (0.0%) |
Disability Class: Cognitive Difficulty
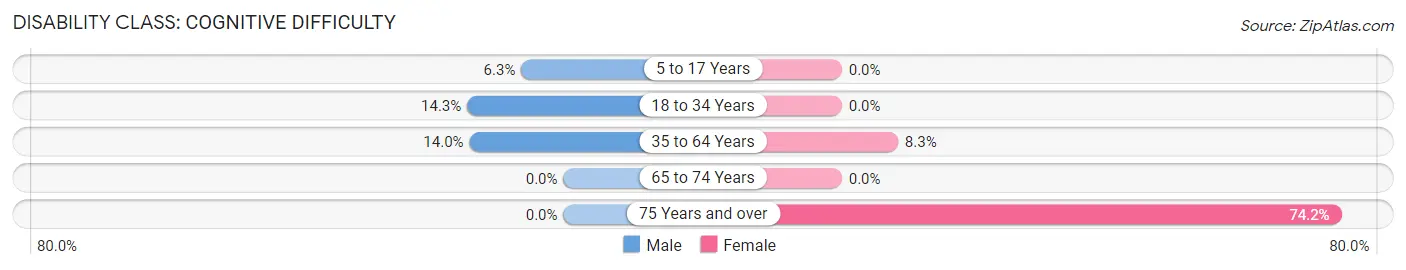
| Age Bracket | Male | Female |
| 5 to 17 Years | 1 (6.2%) | 0 (0.0%) |
| 18 to 34 Years | 3 (14.3%) | 0 (0.0%) |
| 35 to 64 Years | 6 (14.0%) | 2 (8.3%) |
| 65 to 74 Years | 0 (0.0%) | 0 (0.0%) |
| 75 Years and over | 0 (0.0%) | 23 (74.2%) |
Disability Class: Ambulatory Difficulty
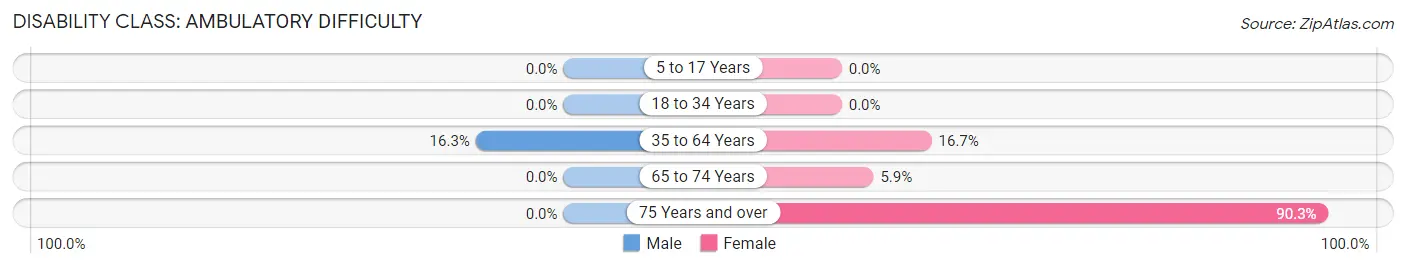
| Age Bracket | Male | Female |
| 5 to 17 Years | 0 (0.0%) | 0 (0.0%) |
| 18 to 34 Years | 0 (0.0%) | 0 (0.0%) |
| 35 to 64 Years | 7 (16.3%) | 4 (16.7%) |
| 65 to 74 Years | 0 (0.0%) | 1 (5.9%) |
| 75 Years and over | 0 (0.0%) | 28 (90.3%) |
Disability Class: Self-Care Difficulty
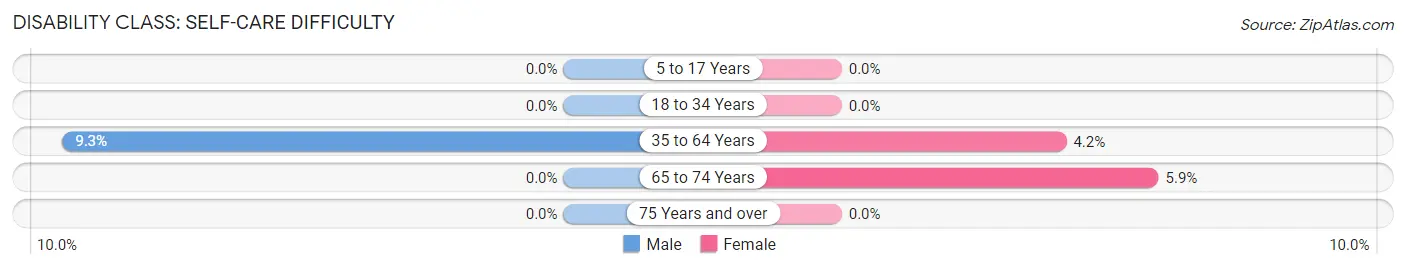
| Age Bracket | Male | Female |
| 5 to 17 Years | 0 (0.0%) | 0 (0.0%) |
| 18 to 34 Years | 0 (0.0%) | 0 (0.0%) |
| 35 to 64 Years | 4 (9.3%) | 1 (4.2%) |
| 65 to 74 Years | 0 (0.0%) | 1 (5.9%) |
| 75 Years and over | 0 (0.0%) | 0 (0.0%) |
Technology Access in Nett Lake
Computing Device Access in Nett Lake
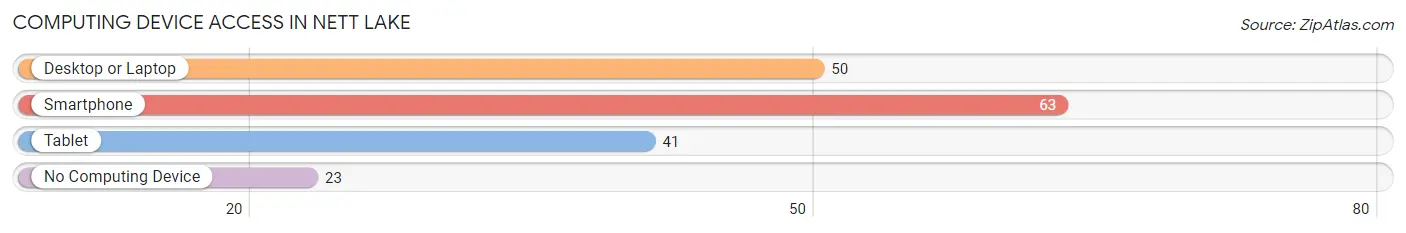
| Device Type | # Households | % Households |
| Desktop or Laptop | 50 | 54.3% |
| Smartphone | 63 | 68.5% |
| Tablet | 41 | 44.6% |
| No Computing Device | 23 | 25.0% |
| Total | 92 | 100.0% |
Internet Access in Nett Lake
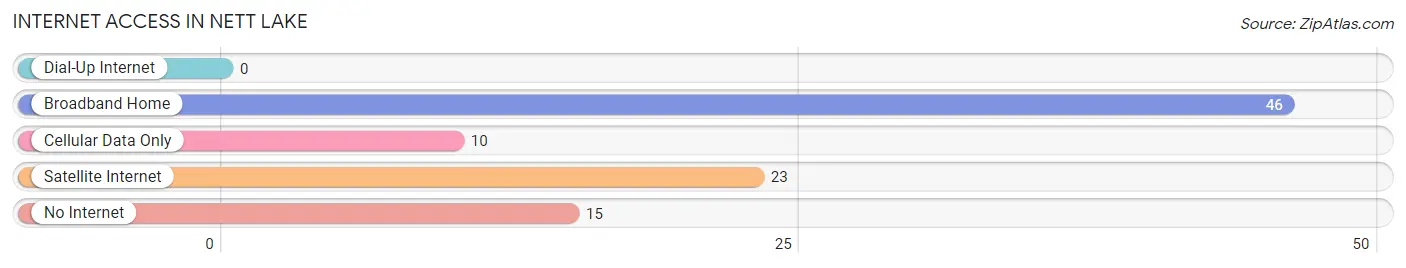
| Internet Type | # Households | % Households |
| Dial-Up Internet | 0 | 0.0% |
| Broadband Home | 46 | 50.0% |
| Cellular Data Only | 10 | 10.9% |
| Satellite Internet | 23 | 25.0% |
| No Internet | 15 | 16.3% |
| Total | 92 | 100.0% |
Nett Lake Summary
Nett Lake is a small unincorporated community located in northern Minnesota, in the United States. It is located in the Bois Forte Indian Reservation, which is home to the Bois Forte Band of Chippewa. The community is located on the south shore of Nett Lake, a small lake in the Vermilion River watershed.
History
The Bois Forte Band of Chippewa have lived in the area for centuries, and the community of Nett Lake was established in the late 19th century. The community was named after the lake, which was named after a Chippewa chief named Nett. The community was originally a logging and fishing village, and it was home to a number of small businesses, including a general store, a post office, and a sawmill.
In the early 20th century, the community began to grow, and it became a popular destination for tourists. The community was home to a number of resorts, and it was a popular spot for fishing and hunting. In the 1950s, the community was connected to the rest of the state by a road, and it became a popular destination for snowmobilers.
Geography
Nett Lake is located in northern Minnesota, in the Bois Forte Indian Reservation. The community is located on the south shore of Nett Lake, a small lake in the Vermilion River watershed. The lake is approximately 1.5 miles long and 0.5 miles wide, and it is surrounded by dense forests. The lake is a popular destination for fishing and boating, and it is home to a variety of fish species, including walleye, northern pike, and smallmouth bass.
The community is located approximately 25 miles north of the city of Duluth, and it is approximately 75 miles south of the Canadian border. The area is known for its rugged beauty, and it is home to a variety of wildlife, including moose, deer, and black bears.
Economy
The economy of Nett Lake is largely based on tourism and recreation. The community is home to a number of resorts, and it is a popular destination for fishing, hunting, and snowmobiling. The community is also home to a number of small businesses, including a general store, a post office, and a sawmill.
Demographics
As of the 2010 census, the population of Nett Lake was 545. The population is primarily Native American, and the majority of the population is of the Bois Forte Band of Chippewa. The median household income in the community is $25,000, and the median age is 35. The community is served by the Bois Forte Tribal School, which is a K-12 school.
Common Questions
What is Per Capita Income in Nett Lake?
Per Capita income in Nett Lake is $19,564.
What is Income or Wage Gap in Nett Lake?
Income or Wage Gap in Nett Lake is 14.0%.
Women in Nett Lake earn 86.0 cents for every dollar earned by a man.
What is Inequality or Gini Index in Nett Lake?
Inequality or Gini Index in Nett Lake is 0.38.
What is the Total Population of Nett Lake?
Total Population of Nett Lake is 203.
What is the Total Male Population of Nett Lake?
Total Male Population of Nett Lake is 86.
What is the Total Female Population of Nett Lake?
Total Female Population of Nett Lake is 117.
What is the Ratio of Males per 100 Females in Nett Lake?
There are 73.50 Males per 100 Females in Nett Lake.
What is the Ratio of Females per 100 Males in Nett Lake?
There are 136.05 Females per 100 Males in Nett Lake.
What is the Median Population Age in Nett Lake?
Median Population Age in Nett Lake is 42.4 Years.
What is the Average Family Size in Nett Lake
Average Family Size in Nett Lake is 2.5 People.
What is the Average Household Size in Nett Lake
Average Household Size in Nett Lake is 2.2 People.
How Large is the Labor Force in Nett Lake?
There are 67 People in the Labor Forcein in Nett Lake.
What is the Percentage of People in the Labor Force in Nett Lake?
43.8% of People are in the Labor Force in Nett Lake.
What is the Unemployment Rate in Nett Lake?
Unemployment Rate in Nett Lake is 9.0%.