Center City, MN Map & Demographics
Center City Map
Center City Overview
$38,920
PER CAPITA INCOME
$92,344
AVG FAMILY INCOME
$87,656
AVG HOUSEHOLD INCOME
22.0%
WAGE / INCOME GAP [ % ]
78.0¢/ $1
WAGE / INCOME GAP [ $ ]
0.35
INEQUALITY / GINI INDEX
624
TOTAL POPULATION
335
MALE POPULATION
289
FEMALE POPULATION
115.92
MALES / 100 FEMALES
86.27
FEMALES / 100 MALES
48.3
MEDIAN AGE
2.9
AVG FAMILY SIZE
2.4
AVG HOUSEHOLD SIZE
317
LABOR FORCE [ PEOPLE ]
60.7%
PERCENT IN LABOR FORCE
9.1%
UNEMPLOYMENT RATE
Center City Zip Codes
Center City Area Codes
Income in Center City
Income Overview in Center City
Per Capita Income in Center City is $38,920, while median incomes of families and households are $92,344 and $87,656 respectively.
| Characteristic | Number | Measure |
| Per Capita Income | 624 | $38,920 |
| Median Family Income | 169 | $92,344 |
| Mean Family Income | 169 | $108,786 |
| Median Household Income | 244 | $87,656 |
| Mean Household Income | 244 | $95,079 |
| Income Deficit | 169 | $0 |
| Wage / Income Gap (%) | 624 | 22.02% |
| Wage / Income Gap ($) | 624 | 77.98¢ per $1 |
| Gini / Inequality Index | 624 | 0.35 |
Earnings by Sex in Center City
Average Earnings in Center City are $52,500, $54,500 for men and $42,500 for women, a difference of 22.0%.
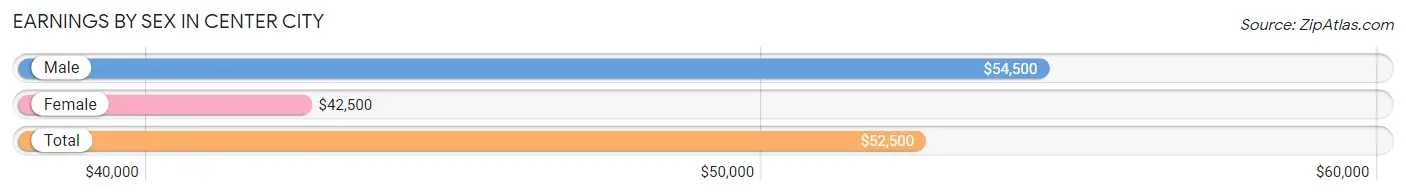
| Sex | Number | Average Earnings |
| Male | 168 (51.5%) | $54,500 |
| Female | 158 (48.5%) | $42,500 |
| Total | 326 (100.0%) | $52,500 |
Earnings by Sex by Income Bracket in Center City
The most common earnings brackets in Center City are $75,000 to $99,999 for men (34 | 20.2%) and $55,000 to $64,999 for women (30 | 19.0%).
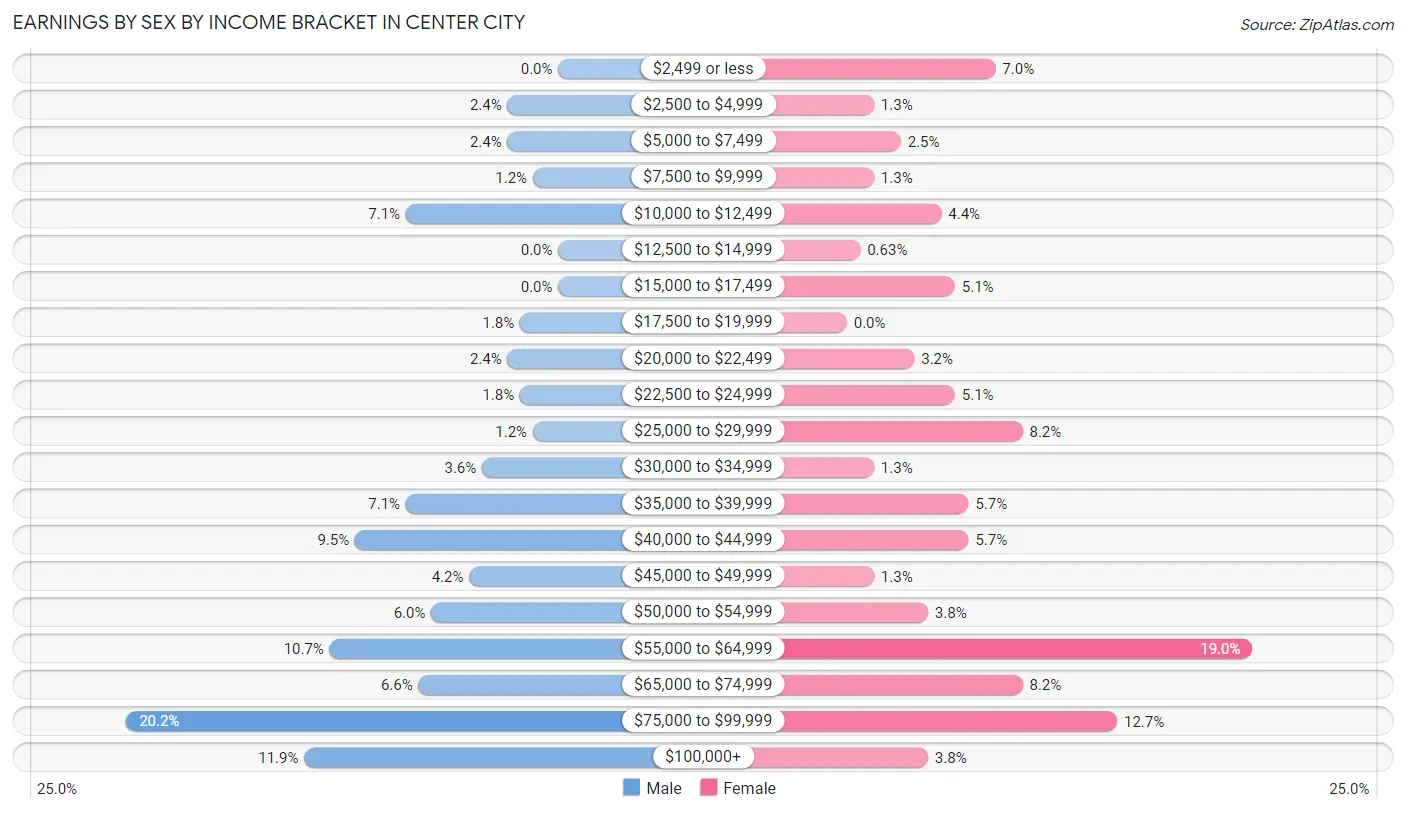
| Income | Male | Female |
| $2,499 or less | 0 (0.0%) | 11 (7.0%) |
| $2,500 to $4,999 | 4 (2.4%) | 2 (1.3%) |
| $5,000 to $7,499 | 4 (2.4%) | 4 (2.5%) |
| $7,500 to $9,999 | 2 (1.2%) | 2 (1.3%) |
| $10,000 to $12,499 | 12 (7.1%) | 7 (4.4%) |
| $12,500 to $14,999 | 0 (0.0%) | 1 (0.6%) |
| $15,000 to $17,499 | 0 (0.0%) | 8 (5.1%) |
| $17,500 to $19,999 | 3 (1.8%) | 0 (0.0%) |
| $20,000 to $22,499 | 4 (2.4%) | 5 (3.2%) |
| $22,500 to $24,999 | 3 (1.8%) | 8 (5.1%) |
| $25,000 to $29,999 | 2 (1.2%) | 13 (8.2%) |
| $30,000 to $34,999 | 6 (3.6%) | 2 (1.3%) |
| $35,000 to $39,999 | 12 (7.1%) | 9 (5.7%) |
| $40,000 to $44,999 | 16 (9.5%) | 9 (5.7%) |
| $45,000 to $49,999 | 7 (4.2%) | 2 (1.3%) |
| $50,000 to $54,999 | 10 (5.9%) | 6 (3.8%) |
| $55,000 to $64,999 | 18 (10.7%) | 30 (19.0%) |
| $65,000 to $74,999 | 11 (6.6%) | 13 (8.2%) |
| $75,000 to $99,999 | 34 (20.2%) | 20 (12.7%) |
| $100,000+ | 20 (11.9%) | 6 (3.8%) |
| Total | 168 (100.0%) | 158 (100.0%) |
Earnings by Sex by Educational Attainment in Center City
Average earnings in Center City are $61,375 for men and $53,750 for women, a difference of 12.4%. Men with an educational attainment of graduate degree enjoy the highest average annual earnings of $118,750, while those with high school diploma education earn the least with $56,875. Women with an educational attainment of graduate degree earn the most with the average annual earnings of $75,417, while those with college or associate's degree education have the smallest earnings of $36,389.
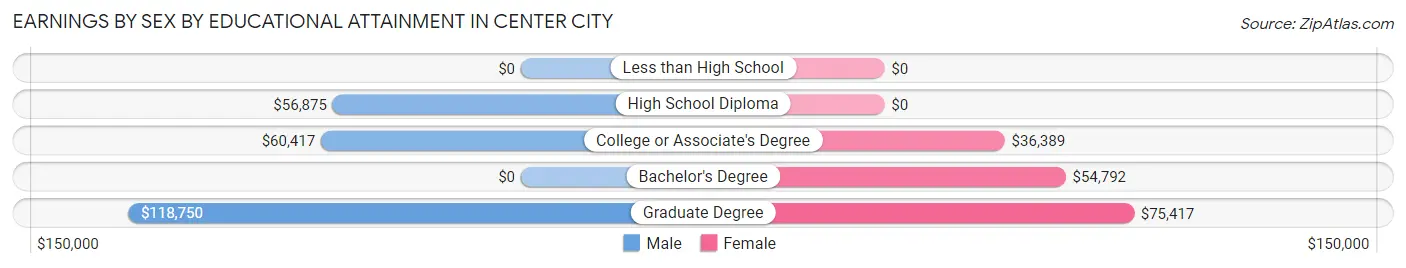
| Educational Attainment | Male Income | Female Income |
| Less than High School | - | - |
| High School Diploma | $56,875 | $0 |
| College or Associate's Degree | $60,417 | $36,389 |
| Bachelor's Degree | - | - |
| Graduate Degree | $118,750 | $75,417 |
| Total | $61,375 | $53,750 |
Family Income in Center City
Family Income Brackets in Center City
According to the Center City family income data, there are 52 families falling into the $100,000 to $149,999 income range, which is the most common income bracket and makes up 30.8% of all families.
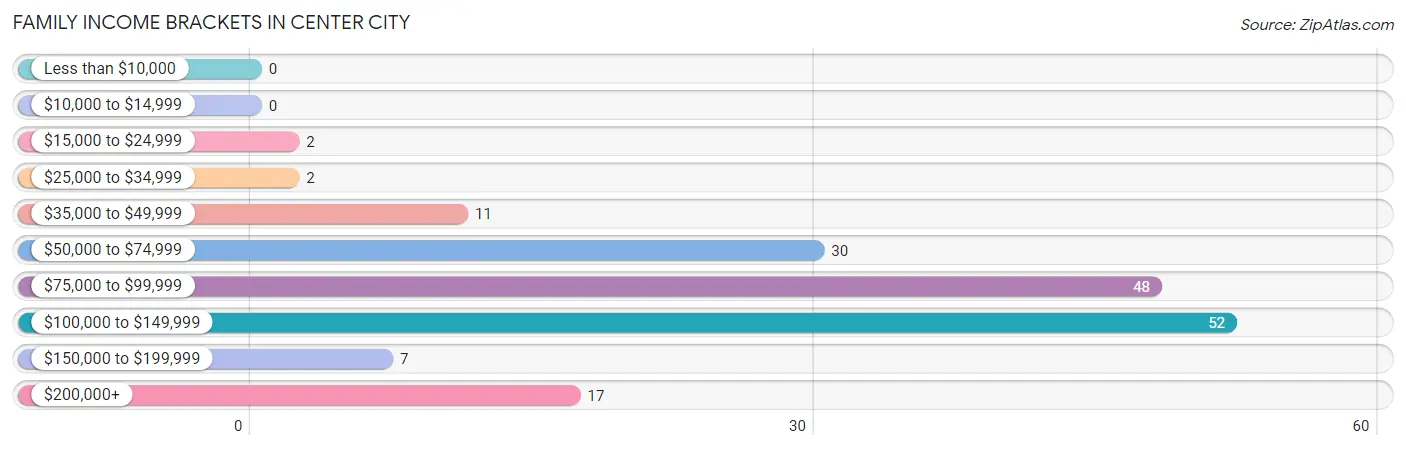
| Income Bracket | # Families | % Families |
| Less than $10,000 | 0 | 0.0% |
| $10,000 to $14,999 | 0 | 0.0% |
| $15,000 to $24,999 | 2 | 1.2% |
| $25,000 to $34,999 | 2 | 1.2% |
| $35,000 to $49,999 | 11 | 6.5% |
| $50,000 to $74,999 | 30 | 17.8% |
| $75,000 to $99,999 | 48 | 28.4% |
| $100,000 to $149,999 | 52 | 30.8% |
| $150,000 to $199,999 | 7 | 4.1% |
| $200,000+ | 17 | 10.1% |
Family Income by Famaliy Size in Center City
4-person families (25 | 14.8%) account for the highest median family income in Center City with $119,792 per family, while 2-person families (100 | 59.2%) have the highest median income of $44,062 per family member.
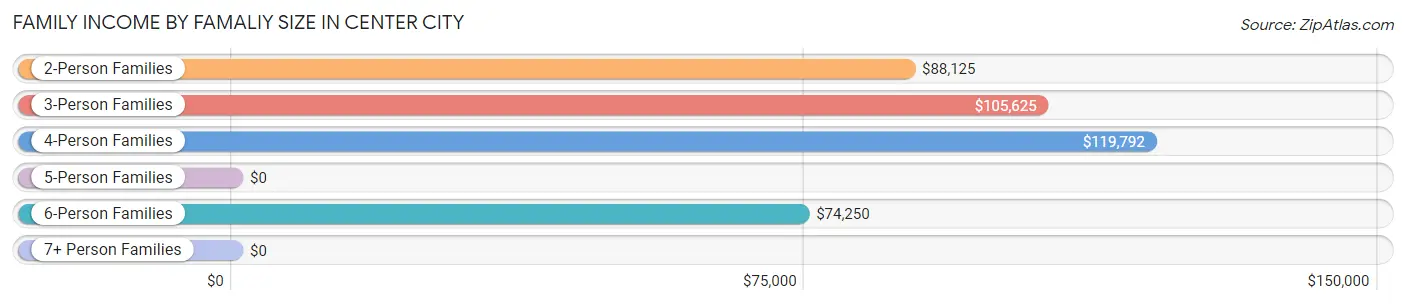
| Income Bracket | # Families | Median Income |
| 2-Person Families | 100 (59.2%) | $88,125 |
| 3-Person Families | 27 (16.0%) | $105,625 |
| 4-Person Families | 25 (14.8%) | $119,792 |
| 5-Person Families | 2 (1.2%) | $0 |
| 6-Person Families | 13 (7.7%) | $74,250 |
| 7+ Person Families | 2 (1.2%) | $0 |
| Total | 169 (100.0%) | $92,344 |
Family Income by Number of Earners in Center City
The median family income in Center City is $92,344, with families comprising 3+ earners (26) having the highest median family income of $123,750, while families with 1 earner (43) have the lowest median family income of $76,875, accounting for 15.4% and 25.4% of families, respectively.
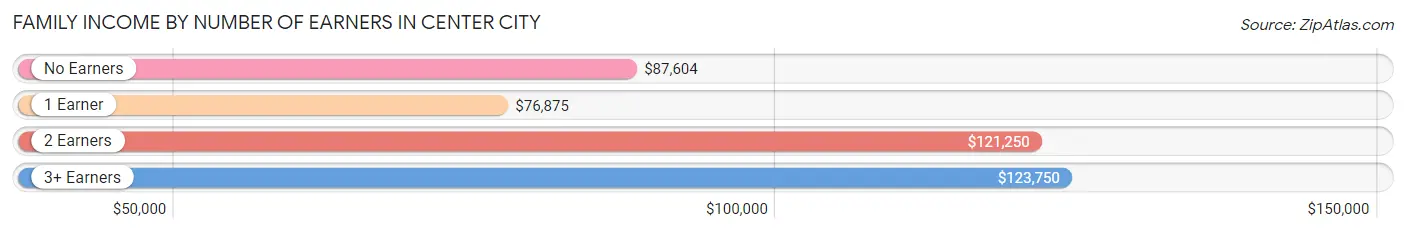
| Number of Earners | # Families | Median Income |
| No Earners | 35 (20.7%) | $87,604 |
| 1 Earner | 43 (25.4%) | $76,875 |
| 2 Earners | 65 (38.5%) | $121,250 |
| 3+ Earners | 26 (15.4%) | $123,750 |
| Total | 169 (100.0%) | $92,344 |
Household Income in Center City
Household Income Brackets in Center City
With 58 households falling in the category, the $100,000 to $149,999 income range is the most frequent in Center City, accounting for 23.8% of all households. In contrast, only 4 households (1.6%) fall into the $10,000 to $14,999 income bracket, making it the least populous group.
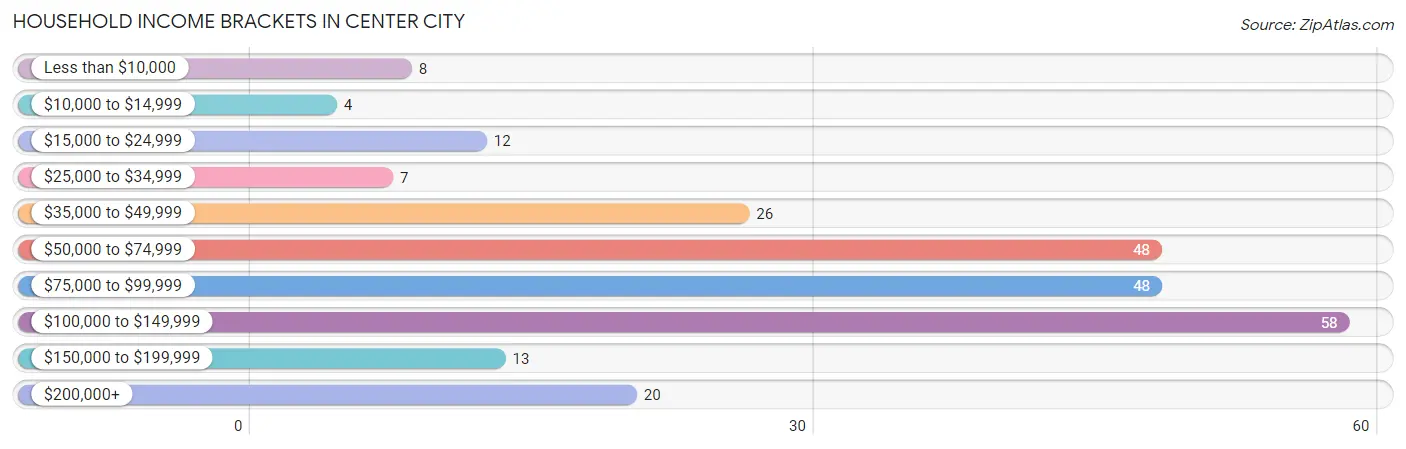
| Income Bracket | # Households | % Households |
| Less than $10,000 | 8 | 3.3% |
| $10,000 to $14,999 | 4 | 1.6% |
| $15,000 to $24,999 | 12 | 4.9% |
| $25,000 to $34,999 | 7 | 2.9% |
| $35,000 to $49,999 | 26 | 10.7% |
| $50,000 to $74,999 | 48 | 19.7% |
| $75,000 to $99,999 | 48 | 19.7% |
| $100,000 to $149,999 | 58 | 23.8% |
| $150,000 to $199,999 | 13 | 5.3% |
| $200,000+ | 20 | 8.2% |
Household Income by Householder Age in Center City
The median household income in Center City is $87,656, with the highest median household income of $118,750 found in the 25 to 44 years age bracket for the primary householder. A total of 56 households (23.0%) fall into this category. Meanwhile, the 15 to 24 years age bracket for the primary householder has the lowest median household income of $0, with 11 households (4.5%) in this group.
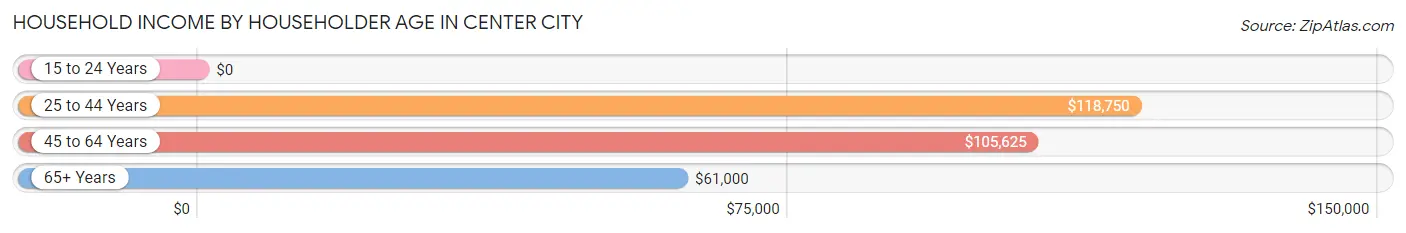
| Income Bracket | # Households | Median Income |
| 15 to 24 Years | 11 (4.5%) | $0 |
| 25 to 44 Years | 56 (23.0%) | $118,750 |
| 45 to 64 Years | 85 (34.8%) | $105,625 |
| 65+ Years | 92 (37.7%) | $61,000 |
| Total | 244 (100.0%) | $87,656 |
Poverty in Center City
Income Below Poverty by Sex and Age in Center City
With 3.6% poverty level for males and 3.1% for females among the residents of Center City, 65 to 74 year old males and 75 year old and over females are the most vulnerable to poverty, with 5 males (11.6%) and 5 females (13.2%) in their respective age groups living below the poverty level.
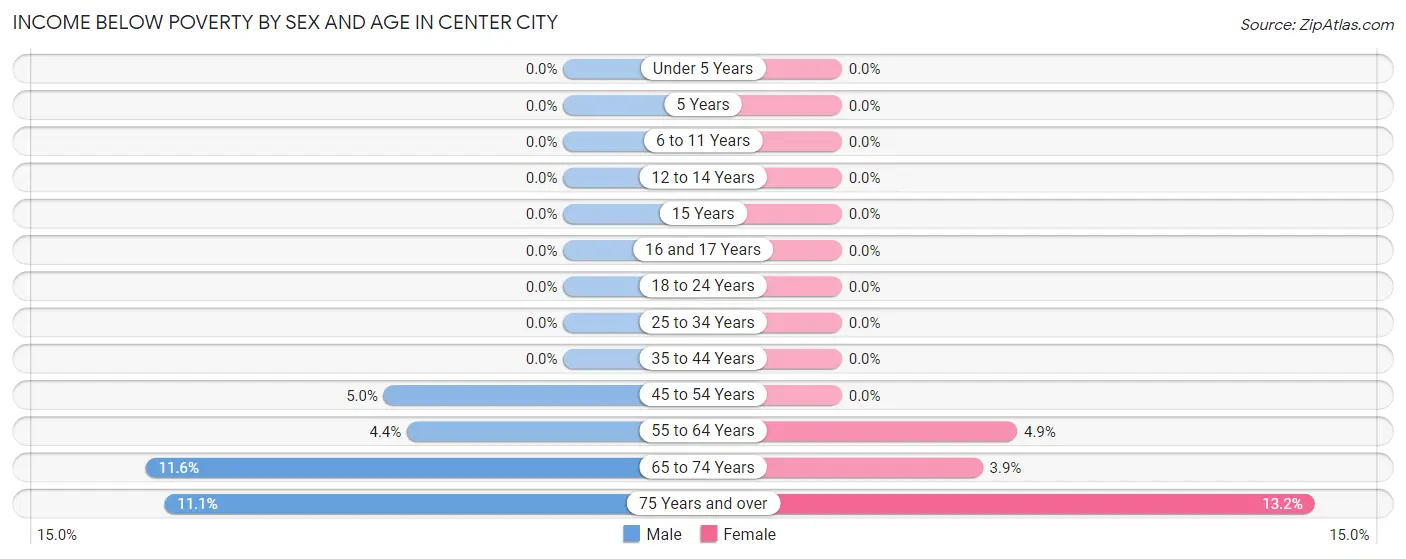
| Age Bracket | Male | Female |
| Under 5 Years | 0 (0.0%) | 0 (0.0%) |
| 5 Years | 0 (0.0%) | 0 (0.0%) |
| 6 to 11 Years | 0 (0.0%) | 0 (0.0%) |
| 12 to 14 Years | 0 (0.0%) | 0 (0.0%) |
| 15 Years | 0 (0.0%) | 0 (0.0%) |
| 16 and 17 Years | 0 (0.0%) | 0 (0.0%) |
| 18 to 24 Years | 0 (0.0%) | 0 (0.0%) |
| 25 to 34 Years | 0 (0.0%) | 0 (0.0%) |
| 35 to 44 Years | 0 (0.0%) | 0 (0.0%) |
| 45 to 54 Years | 2 (5.0%) | 0 (0.0%) |
| 55 to 64 Years | 2 (4.3%) | 2 (4.9%) |
| 65 to 74 Years | 5 (11.6%) | 2 (3.9%) |
| 75 Years and over | 2 (11.1%) | 5 (13.2%) |
| Total | 11 (3.6%) | 9 (3.1%) |
Income Above Poverty by Sex and Age in Center City
According to the poverty statistics in Center City, males aged under 5 years and females aged under 5 years are the age groups that are most secure financially, with 100.0% of males and 100.0% of females in these age groups living above the poverty line.
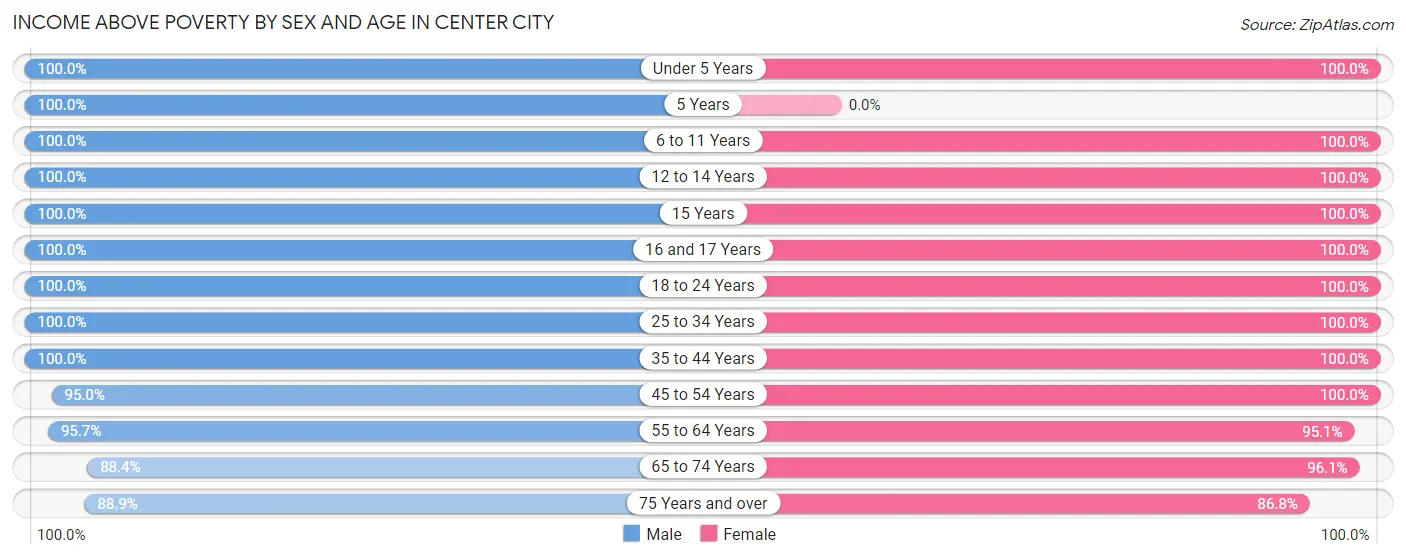
| Age Bracket | Male | Female |
| Under 5 Years | 13 (100.0%) | 8 (100.0%) |
| 5 Years | 14 (100.0%) | 0 (0.0%) |
| 6 to 11 Years | 21 (100.0%) | 18 (100.0%) |
| 12 to 14 Years | 14 (100.0%) | 10 (100.0%) |
| 15 Years | 2 (100.0%) | 2 (100.0%) |
| 16 and 17 Years | 5 (100.0%) | 8 (100.0%) |
| 18 to 24 Years | 19 (100.0%) | 9 (100.0%) |
| 25 to 34 Years | 40 (100.0%) | 39 (100.0%) |
| 35 to 44 Years | 30 (100.0%) | 34 (100.0%) |
| 45 to 54 Years | 38 (95.0%) | 31 (100.0%) |
| 55 to 64 Years | 44 (95.7%) | 39 (95.1%) |
| 65 to 74 Years | 38 (88.4%) | 49 (96.1%) |
| 75 Years and over | 16 (88.9%) | 33 (86.8%) |
| Total | 294 (96.4%) | 280 (96.9%) |
Income Below Poverty Among Married-Couple Families in Center City
The poverty statistics for married-couple families in Center City show that 1.4% or 2 of the total 145 families live below the poverty line. Families with no children have the highest poverty rate of 1.9%, comprising of 2 families. On the other hand, families with 1 or 2 children have the lowest poverty rate of 0.0%, which includes 0 families.
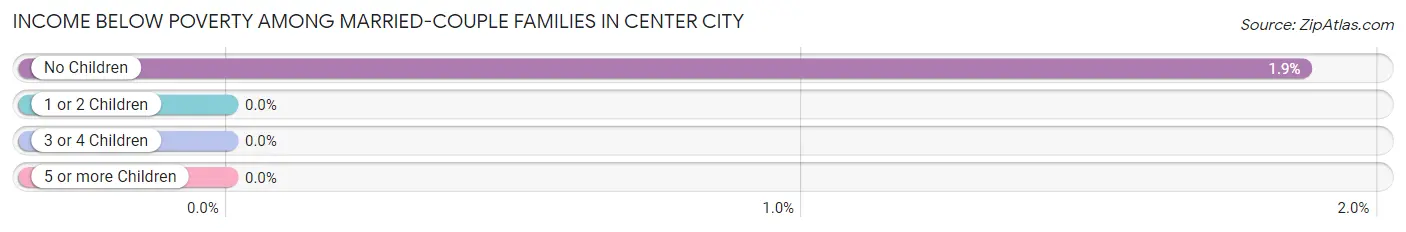
| Children | Above Poverty | Below Poverty |
| No Children | 105 (98.1%) | 2 (1.9%) |
| 1 or 2 Children | 21 (100.0%) | 0 (0.0%) |
| 3 or 4 Children | 15 (100.0%) | 0 (0.0%) |
| 5 or more Children | 2 (100.0%) | 0 (0.0%) |
| Total | 143 (98.6%) | 2 (1.4%) |
Income Below Poverty Among Single-Parent Households in Center City
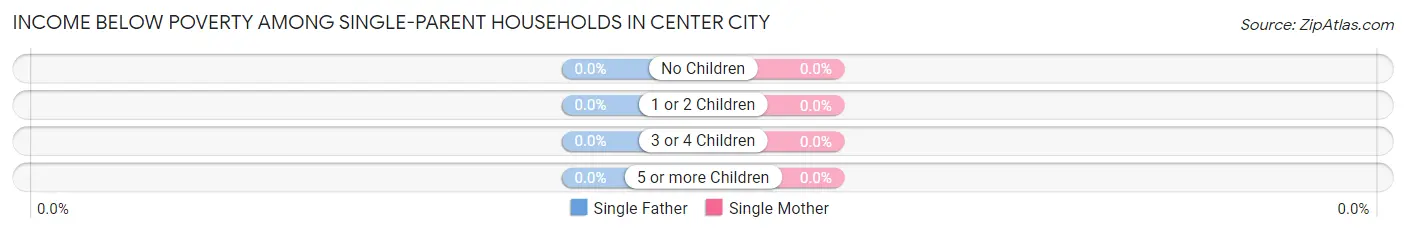
| Children | Single Father | Single Mother |
| No Children | 0 (0.0%) | 0 (0.0%) |
| 1 or 2 Children | 0 (0.0%) | 0 (0.0%) |
| 3 or 4 Children | 0 (0.0%) | 0 (0.0%) |
| 5 or more Children | 0 (0.0%) | 0 (0.0%) |
| Total | 0 (0.0%) | 0 (0.0%) |
Income Below Poverty Among Married-Couple vs Single-Parent Households in Center City
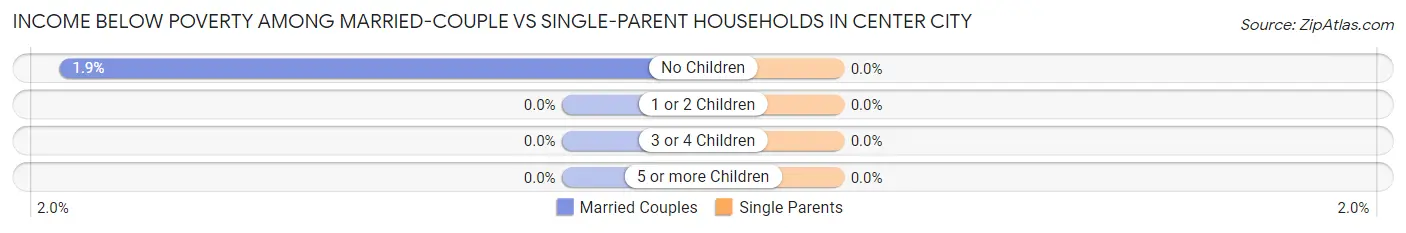
| Children | Married-Couple Families | Single-Parent Households |
| No Children | 2 (1.9%) | 0 (0.0%) |
| 1 or 2 Children | 0 (0.0%) | 0 (0.0%) |
| 3 or 4 Children | 0 (0.0%) | 0 (0.0%) |
| 5 or more Children | 0 (0.0%) | 0 (0.0%) |
| Total | 2 (1.4%) | 0 (0.0%) |
Race in Center City
The most populous races in Center City are White / Caucasian (583 | 93.4%), Hispanic or Latino (14 | 2.2%), and Asian (13 | 2.1%).
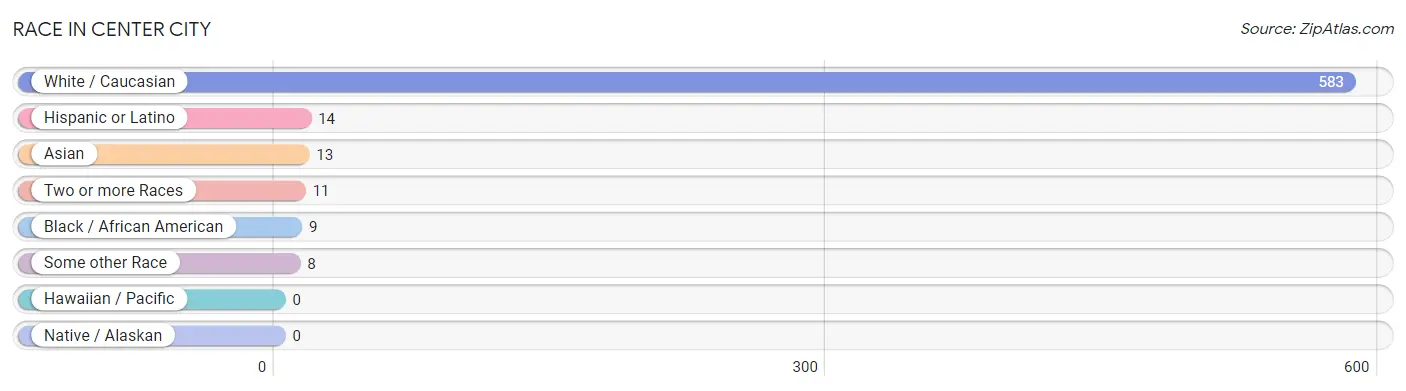
| Race | # Population | % Population |
| Asian | 13 | 2.1% |
| Black / African American | 9 | 1.4% |
| Hawaiian / Pacific | 0 | 0.0% |
| Hispanic or Latino | 14 | 2.2% |
| Native / Alaskan | 0 | 0.0% |
| White / Caucasian | 583 | 93.4% |
| Two or more Races | 11 | 1.8% |
| Some other Race | 8 | 1.3% |
| Total | 624 | 100.0% |
Ancestry in Center City
The most populous ancestries reported in Center City are German (157 | 25.2%), Swedish (114 | 18.3%), Norwegian (84 | 13.5%), Irish (51 | 8.2%), and Polish (33 | 5.3%), together accounting for 70.4% of all Center City residents.
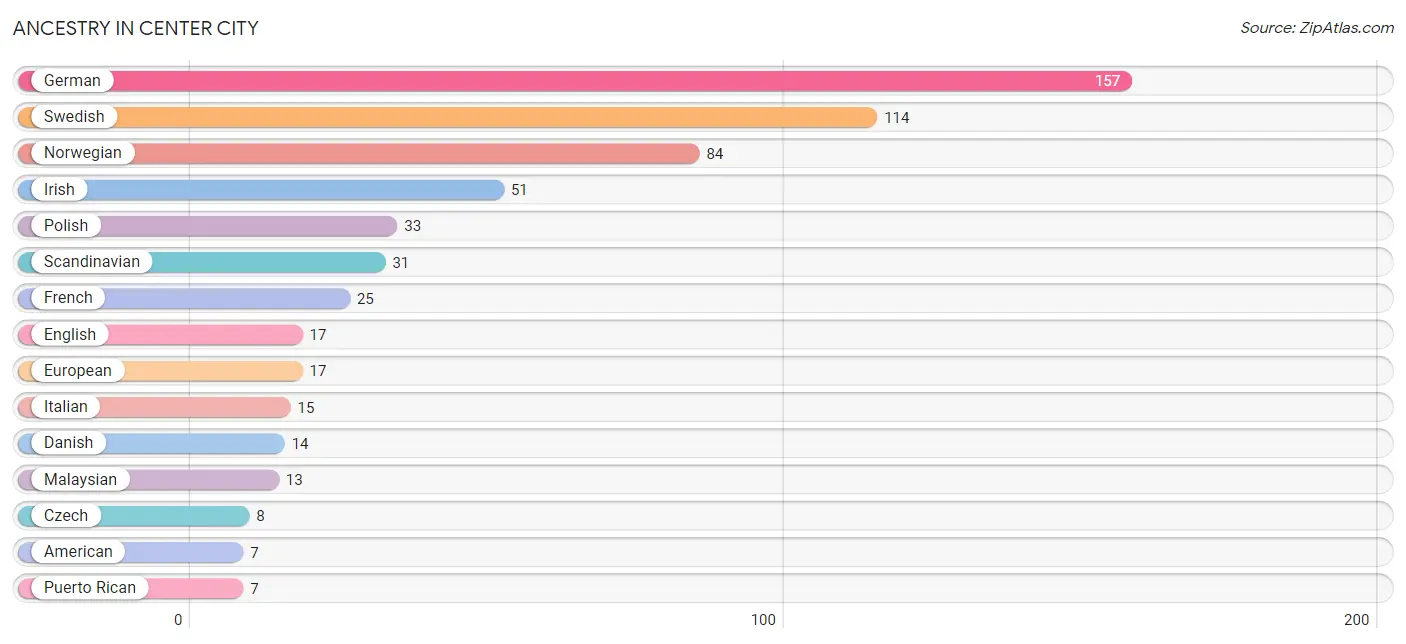
| Ancestry | # Population | % Population |
| American | 7 | 1.1% |
| Apache | 4 | 0.6% |
| Austrian | 3 | 0.5% |
| Comanche | 4 | 0.6% |
| Czech | 8 | 1.3% |
| Danish | 14 | 2.2% |
| Dominican | 3 | 0.5% |
| Dutch | 6 | 1.0% |
| Eastern European | 1 | 0.2% |
| English | 17 | 2.7% |
| European | 17 | 2.7% |
| Finnish | 2 | 0.3% |
| French | 25 | 4.0% |
| German | 157 | 25.2% |
| Irish | 51 | 8.2% |
| Italian | 15 | 2.4% |
| Malaysian | 13 | 2.1% |
| Mexican | 4 | 0.6% |
| Norwegian | 84 | 13.5% |
| Polish | 33 | 5.3% |
| Puerto Rican | 7 | 1.1% |
| Russian | 4 | 0.6% |
| Scandinavian | 31 | 5.0% |
| Scotch-Irish | 1 | 0.2% |
| Scottish | 6 | 1.0% |
| Slovak | 2 | 0.3% |
| Swedish | 114 | 18.3% |
| Ukrainian | 2 | 0.3% | View All 28 Rows |
Immigrants in Center City
The most numerous immigrant groups reported in Center City came from Asia (13 | 2.1%), Laos (13 | 2.1%), South Eastern Asia (13 | 2.1%), Caribbean (3 | 0.5%), and Dominican Republic (3 | 0.5%), together accounting for 7.2% of all Center City residents.
| Immigration Origin | # Population | % Population |
| Asia | 13 | 2.1% |
| Canada | 2 | 0.3% |
| Caribbean | 3 | 0.5% |
| Dominican Republic | 3 | 0.5% |
| Laos | 13 | 2.1% |
| Latin America | 3 | 0.5% |
| South Eastern Asia | 13 | 2.1% | View All 7 Rows |
Sex and Age in Center City
Sex and Age in Center City
The most populous age groups in Center City are 5 to 9 Years (33 | 9.9%) for men and 65 to 69 Years (31 | 10.7%) for women.
| Age Bracket | Male | Female |
| Under 5 Years | 13 (3.9%) | 8 (2.8%) |
| 5 to 9 Years | 33 (9.9%) | 16 (5.5%) |
| 10 to 14 Years | 16 (4.8%) | 12 (4.2%) |
| 15 to 19 Years | 10 (3.0%) | 12 (4.2%) |
| 20 to 24 Years | 25 (7.5%) | 7 (2.4%) |
| 25 to 29 Years | 20 (6.0%) | 13 (4.5%) |
| 30 to 34 Years | 24 (7.2%) | 26 (9.0%) |
| 35 to 39 Years | 16 (4.8%) | 13 (4.5%) |
| 40 to 44 Years | 18 (5.4%) | 21 (7.3%) |
| 45 to 49 Years | 26 (7.8%) | 6 (2.1%) |
| 50 to 54 Years | 27 (8.1%) | 25 (8.6%) |
| 55 to 59 Years | 29 (8.7%) | 25 (8.6%) |
| 60 to 64 Years | 17 (5.1%) | 16 (5.5%) |
| 65 to 69 Years | 25 (7.5%) | 31 (10.7%) |
| 70 to 74 Years | 18 (5.4%) | 20 (6.9%) |
| 75 to 79 Years | 10 (3.0%) | 14 (4.8%) |
| 80 to 84 Years | 4 (1.2%) | 12 (4.2%) |
| 85 Years and over | 4 (1.2%) | 12 (4.2%) |
| Total | 335 (100.0%) | 289 (100.0%) |
Families and Households in Center City
Median Family Size in Center City
The median family size in Center City is 2.89 persons per family, with married-couple families (145 | 85.8%) accounting for the largest median family size of 2.92 persons per family. On the other hand, single male/father families (11 | 6.5%) represent the smallest median family size with 2.55 persons per family.
| Family Type | # Families | Family Size |
| Married-Couple | 145 (85.8%) | 2.92 |
| Single Male/Father | 11 (6.5%) | 2.55 |
| Single Female/Mother | 13 (7.7%) | 2.92 |
| Total Families | 169 (100.0%) | 2.89 |
Median Household Size in Center City
The median household size in Center City is 2.43 persons per household, with single male/father households (11 | 4.5%) accounting for the largest median household size of 3.73 persons per household. non-family households (75 | 30.7%) represent the smallest median household size with 1.12 persons per household.
| Household Type | # Households | Household Size |
| Married-Couple | 145 (59.4%) | 2.97 |
| Single Male/Father | 11 (4.5%) | 3.73 |
| Single Female/Mother | 13 (5.3%) | 2.92 |
| Non-family | 75 (30.7%) | 1.12 |
| Total Households | 244 (100.0%) | 2.43 |
Household Size by Marriage Status in Center City
Out of a total of 244 households in Center City, 169 (69.3%) are family households, while 75 (30.7%) are nonfamily households. The most numerous type of family households are 2-person households, comprising 90, and the most common type of nonfamily households are 1-person households, comprising 69.
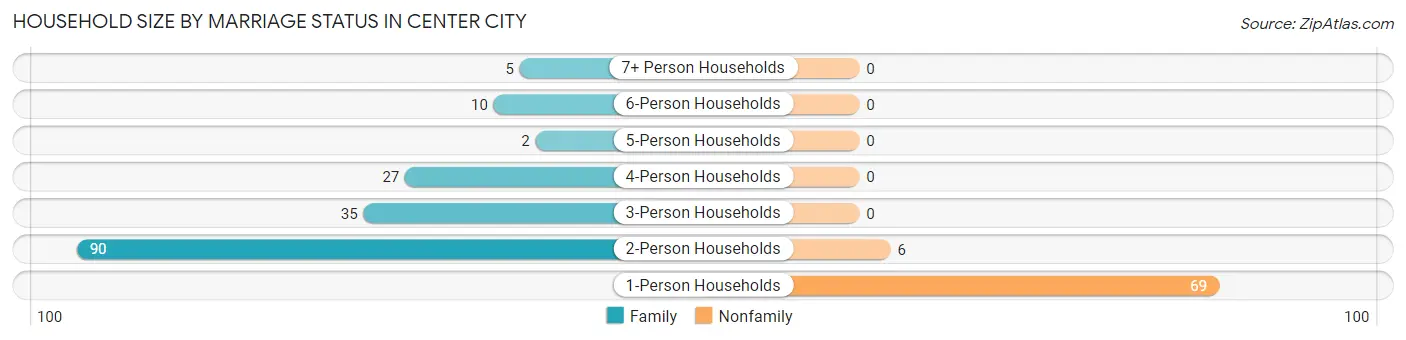
| Household Size | Family Households | Nonfamily Households |
| 1-Person Households | - | 69 (28.3%) |
| 2-Person Households | 90 (36.9%) | 6 (2.5%) |
| 3-Person Households | 35 (14.3%) | 0 (0.0%) |
| 4-Person Households | 27 (11.1%) | 0 (0.0%) |
| 5-Person Households | 2 (0.8%) | 0 (0.0%) |
| 6-Person Households | 10 (4.1%) | 0 (0.0%) |
| 7+ Person Households | 5 (2.1%) | 0 (0.0%) |
| Total | 169 (69.3%) | 75 (30.7%) |
Female Fertility in Center City
Fertility by Age in Center City
Average fertility rate in Center City is 48.0 births per 1,000 women. Women in the age bracket of 20 to 34 years have the highest fertility rate with 109.0 births per 1,000 women. Women in the age bracket of 20 to 34 years acount for 100.0% of all women with births.
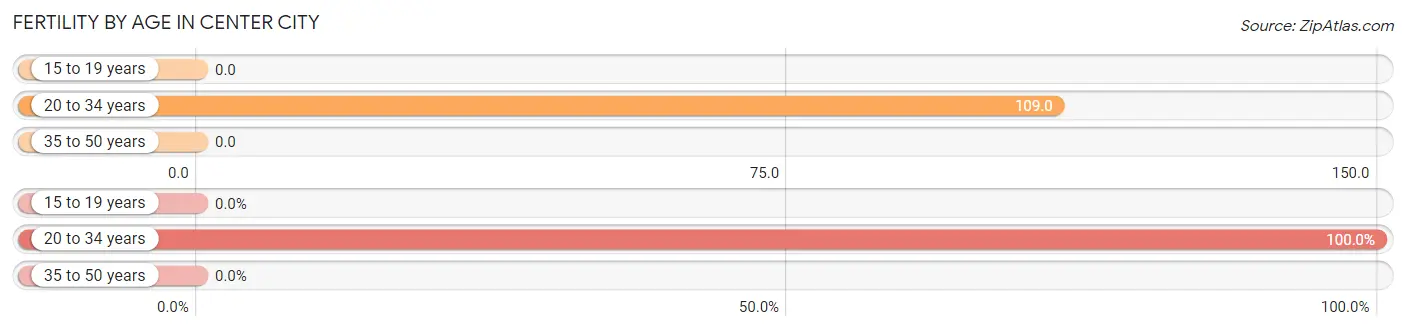
| Age Bracket | Women with Births | Births / 1,000 Women |
| 15 to 19 years | 0 (0.0%) | 0.0 |
| 20 to 34 years | 5 (100.0%) | 109.0 |
| 35 to 50 years | 0 (0.0%) | 0.0 |
| Total | 5 (100.0%) | 48.0 |
Fertility by Age by Marriage Status in Center City
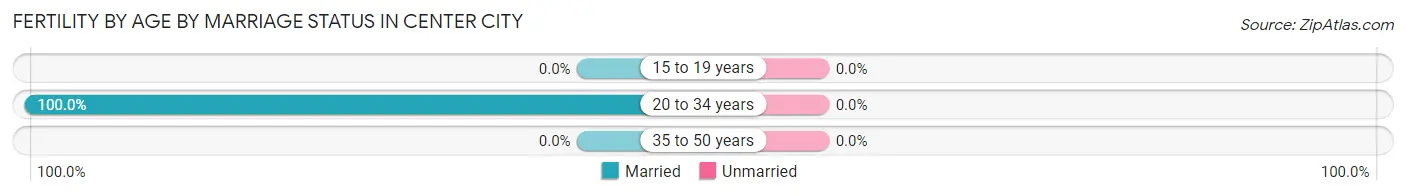
| Age Bracket | Married | Unmarried |
| 15 to 19 years | 0 (0.0%) | 0 (0.0%) |
| 20 to 34 years | 5 (100.0%) | 0 (0.0%) |
| 35 to 50 years | 0 (0.0%) | 0 (0.0%) |
| Total | 5 (100.0%) | 0 (0.0%) |
Fertility by Education in Center City
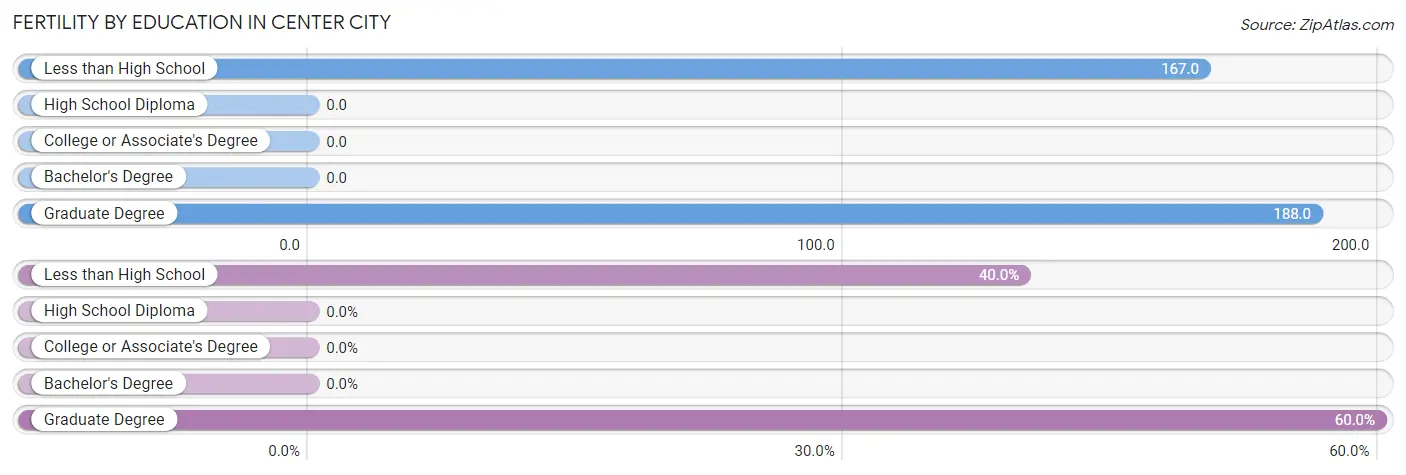
| Educational Attainment | Women with Births | Births / 1,000 Women |
| Less than High School | 2 (40.0%) | 167.0 |
| High School Diploma | 0 (0.0%) | 0.0 |
| College or Associate's Degree | 0 (0.0%) | 0.0 |
| Bachelor's Degree | 0 (0.0%) | 0.0 |
| Graduate Degree | 3 (60.0%) | 188.0 |
| Total | 5 (100.0%) | 48.0 |
Fertility by Education by Marriage Status in Center City
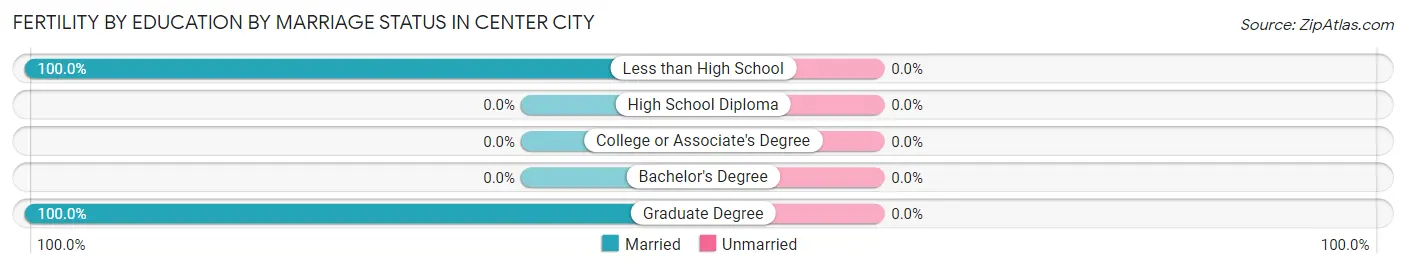
| Educational Attainment | Married | Unmarried |
| Less than High School | 2 (100.0%) | 0 (0.0%) |
| High School Diploma | 0 (0.0%) | 0 (0.0%) |
| College or Associate's Degree | 0 (0.0%) | 0 (0.0%) |
| Bachelor's Degree | 0 (0.0%) | 0 (0.0%) |
| Graduate Degree | 3 (100.0%) | 0 (0.0%) |
| Total | 5 (100.0%) | 0 (0.0%) |
Employment Characteristics in Center City
Employment by Class of Employer in Center City
Among the 273 employed individuals in Center City, private company employees (167 | 61.2%), not-for-profit organizations (28 | 10.3%), and local government employees (24 | 8.8%) make up the most common classes of employment.
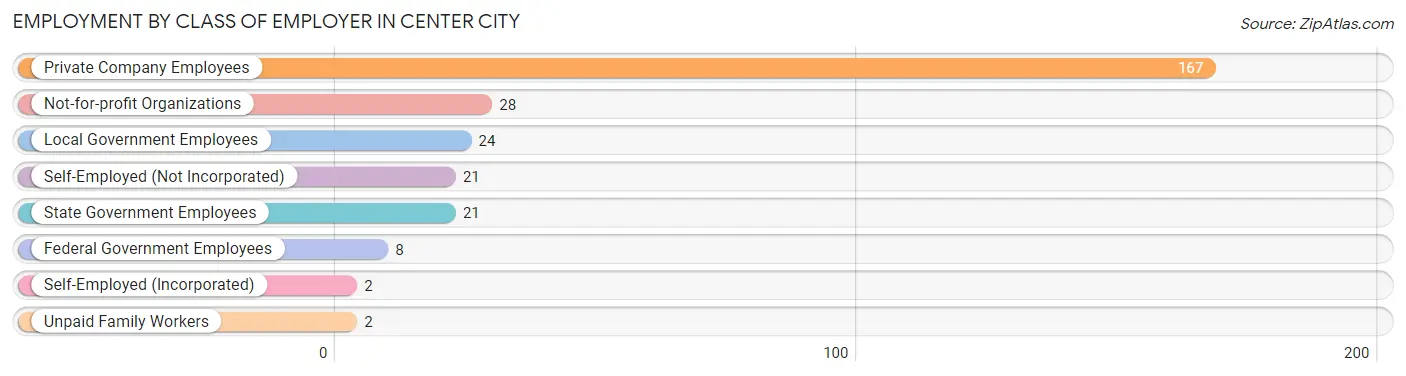
| Employer Class | # Employees | % Employees |
| Private Company Employees | 167 | 61.2% |
| Self-Employed (Incorporated) | 2 | 0.7% |
| Self-Employed (Not Incorporated) | 21 | 7.7% |
| Not-for-profit Organizations | 28 | 10.3% |
| Local Government Employees | 24 | 8.8% |
| State Government Employees | 21 | 7.7% |
| Federal Government Employees | 8 | 2.9% |
| Unpaid Family Workers | 2 | 0.7% |
| Total | 273 | 100.0% |
Employment Status by Age in Center City
According to the labor force statistics for Center City, out of the total population over 16 years of age (522), 60.7% or 317 individuals are in the labor force, with 9.1% or 29 of them unemployed. The age group with the highest labor force participation rate is 25 to 29 years, with 100.0% or 33 individuals in the labor force. Within the labor force, the 20 to 24 years age range has the highest percentage of unemployed individuals, with 47.8% or 11 of them being unemployed.
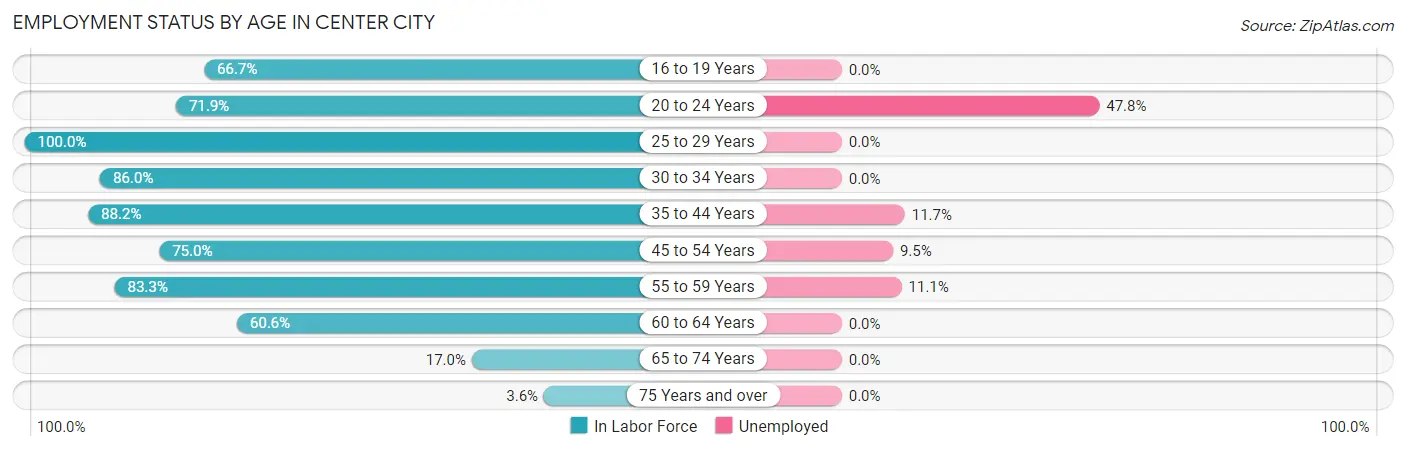
| Age Bracket | In Labor Force | Unemployed |
| 16 to 19 Years | 12 (66.7%) | 0 (0.0%) |
| 20 to 24 Years | 23 (71.9%) | 11 (47.8%) |
| 25 to 29 Years | 33 (100.0%) | 0 (0.0%) |
| 30 to 34 Years | 43 (86.0%) | 0 (0.0%) |
| 35 to 44 Years | 60 (88.2%) | 7 (11.7%) |
| 45 to 54 Years | 63 (75.0%) | 6 (9.5%) |
| 55 to 59 Years | 45 (83.3%) | 5 (11.1%) |
| 60 to 64 Years | 20 (60.6%) | 0 (0.0%) |
| 65 to 74 Years | 16 (17.0%) | 0 (0.0%) |
| 75 Years and over | 2 (3.6%) | 0 (0.0%) |
| Total | 317 (60.7%) | 29 (9.1%) |
Employment Status by Educational Attainment in Center City
According to labor force statistics for Center City, 82.0% of individuals (264) out of the total population between 25 and 64 years of age (322) are in the labor force, with 6.8% or 18 of them being unemployed. The group with the highest labor force participation rate are those with the educational attainment of college / associate degree, with 94.0% or 109 individuals in the labor force. Within the labor force, individuals with bachelor's degree or higher education have the highest percentage of unemployment, with 10.9% or 10 of them being unemployed.
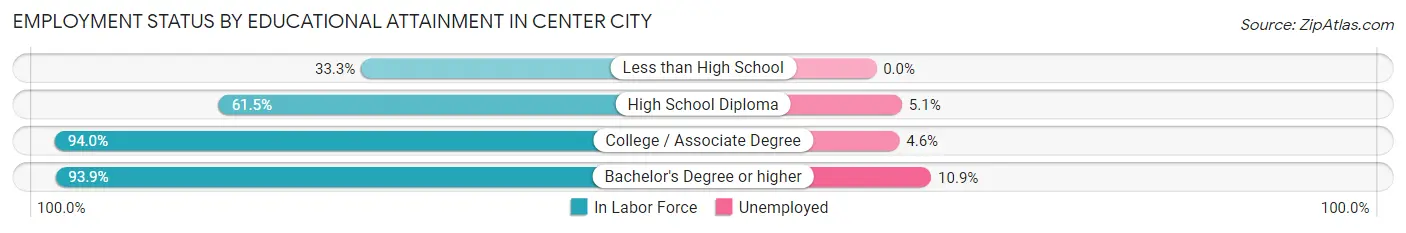
| Educational Attainment | In Labor Force | Unemployed |
| Less than High School | 4 (33.3%) | 0 (0.0%) |
| High School Diploma | 59 (61.5%) | 5 (5.1%) |
| College / Associate Degree | 109 (94.0%) | 5 (4.6%) |
| Bachelor's Degree or higher | 92 (93.9%) | 11 (10.9%) |
| Total | 264 (82.0%) | 22 (6.8%) |
Employment Occupations by Sex in Center City
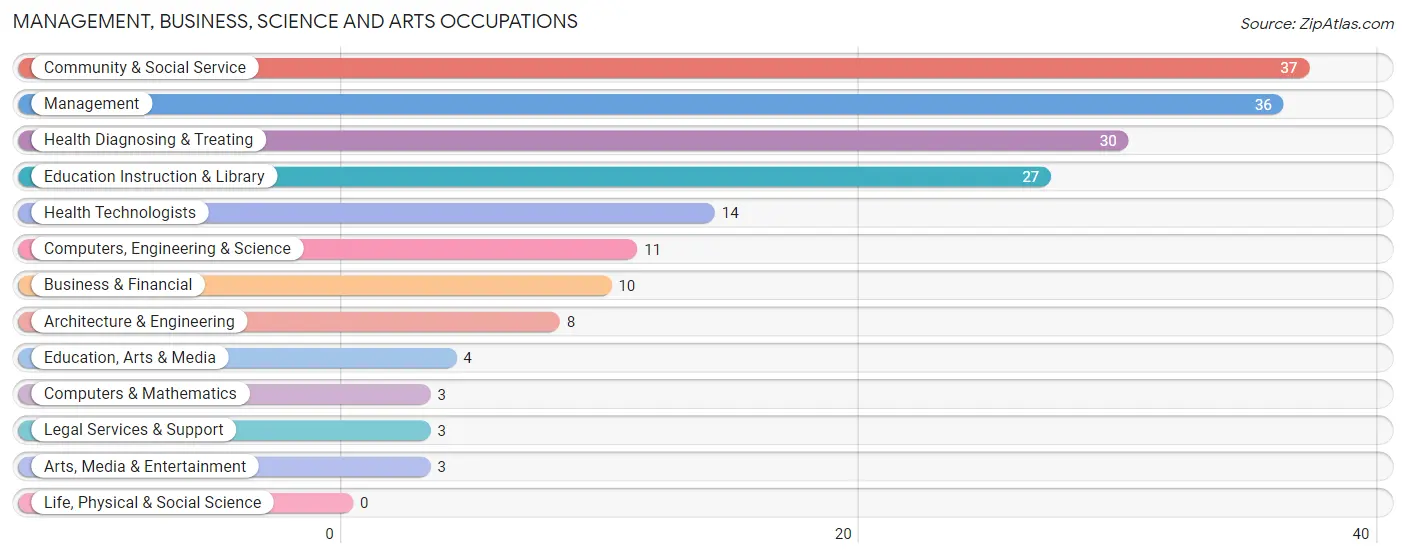
Management, Business, Science and Arts Occupations
The most common Management, Business, Science and Arts occupations in Center City are Community & Social Service (37 | 12.9%), Management (36 | 12.5%), Health Diagnosing & Treating (30 | 10.4%), Education Instruction & Library (27 | 9.4%), and Health Technologists (14 | 4.9%).
Management, Business, Science and Arts Occupations by Sex
Within the Management, Business, Science and Arts occupations in Center City, the most male-oriented occupations are Computers, Engineering & Science (100.0%), Computers & Mathematics (100.0%), and Architecture & Engineering (100.0%), while the most female-oriented occupations are Arts, Media & Entertainment (100.0%), Health Diagnosing & Treating (100.0%), and Health Technologists (100.0%).
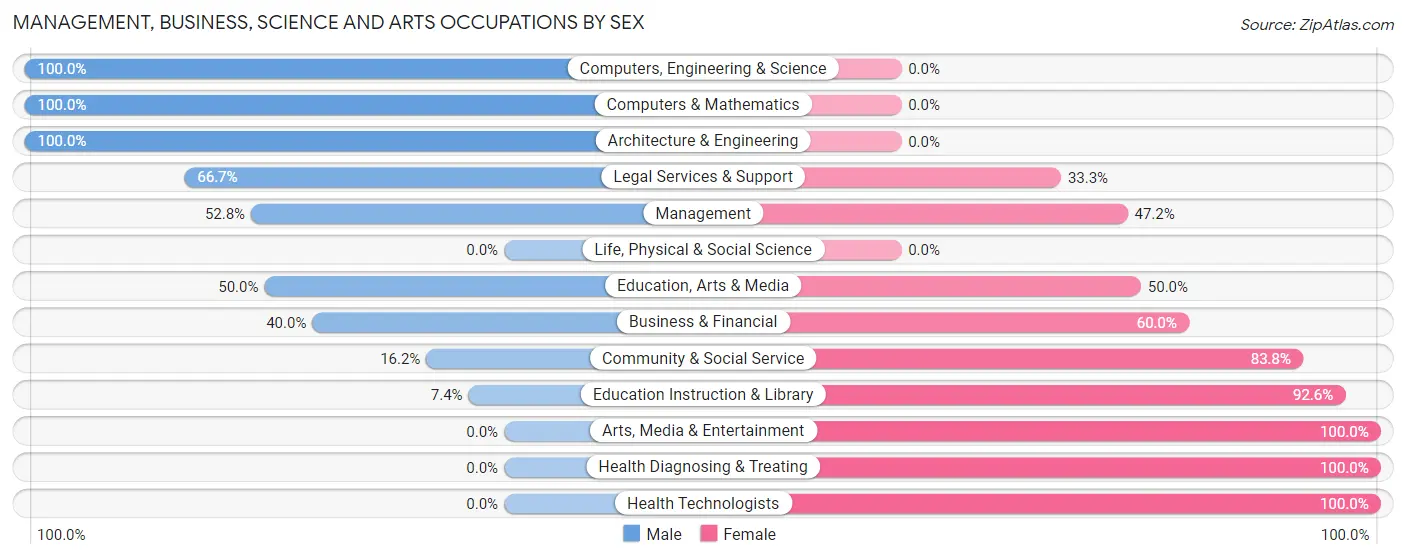
| Occupation | Male | Female |
| Management | 19 (52.8%) | 17 (47.2%) |
| Business & Financial | 4 (40.0%) | 6 (60.0%) |
| Computers, Engineering & Science | 11 (100.0%) | 0 (0.0%) |
| Computers & Mathematics | 3 (100.0%) | 0 (0.0%) |
| Architecture & Engineering | 8 (100.0%) | 0 (0.0%) |
| Life, Physical & Social Science | 0 (0.0%) | 0 (0.0%) |
| Community & Social Service | 6 (16.2%) | 31 (83.8%) |
| Education, Arts & Media | 2 (50.0%) | 2 (50.0%) |
| Legal Services & Support | 2 (66.7%) | 1 (33.3%) |
| Education Instruction & Library | 2 (7.4%) | 25 (92.6%) |
| Arts, Media & Entertainment | 0 (0.0%) | 3 (100.0%) |
| Health Diagnosing & Treating | 0 (0.0%) | 30 (100.0%) |
| Health Technologists | 0 (0.0%) | 14 (100.0%) |
| Total (Category) | 40 (32.3%) | 84 (67.7%) |
| Total (Overall) | 136 (47.2%) | 152 (52.8%) |
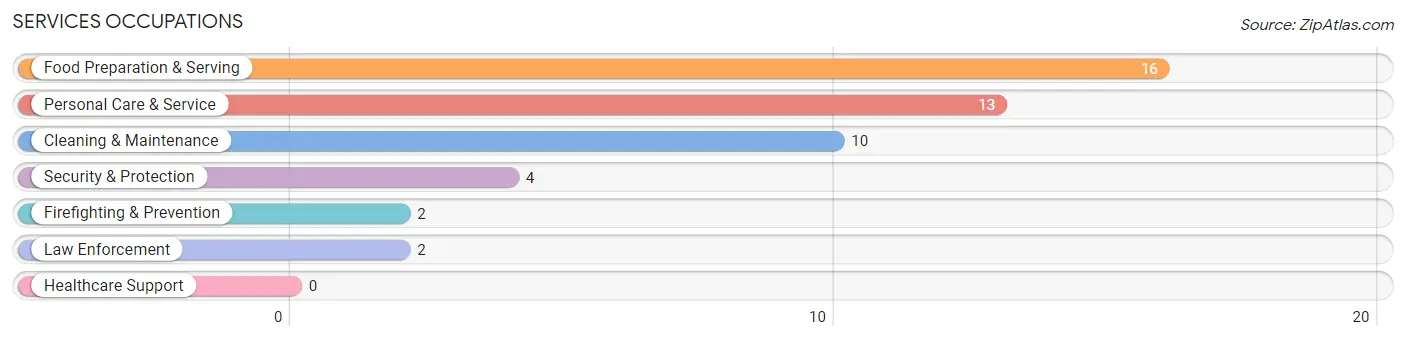
Services Occupations
The most common Services occupations in Center City are Food Preparation & Serving (16 | 5.6%), Personal Care & Service (13 | 4.5%), Cleaning & Maintenance (10 | 3.5%), Security & Protection (4 | 1.4%), and Firefighting & Prevention (2 | 0.7%).
Services Occupations by Sex
Within the Services occupations in Center City, the most male-oriented occupations are Security & Protection (100.0%), Firefighting & Prevention (100.0%), and Law Enforcement (100.0%), while the most female-oriented occupations are Personal Care & Service (100.0%), Food Preparation & Serving (50.0%), and Cleaning & Maintenance (30.0%).
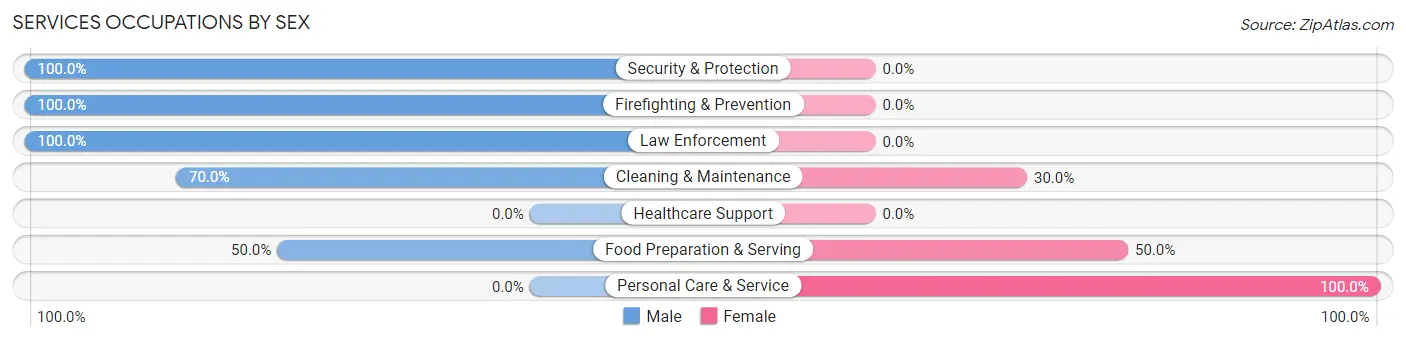
| Occupation | Male | Female |
| Healthcare Support | 0 (0.0%) | 0 (0.0%) |
| Security & Protection | 4 (100.0%) | 0 (0.0%) |
| Firefighting & Prevention | 2 (100.0%) | 0 (0.0%) |
| Law Enforcement | 2 (100.0%) | 0 (0.0%) |
| Food Preparation & Serving | 8 (50.0%) | 8 (50.0%) |
| Cleaning & Maintenance | 7 (70.0%) | 3 (30.0%) |
| Personal Care & Service | 0 (0.0%) | 13 (100.0%) |
| Total (Category) | 19 (44.2%) | 24 (55.8%) |
| Total (Overall) | 136 (47.2%) | 152 (52.8%) |
Sales and Office Occupations
The most common Sales and Office occupations in Center City are Office & Administration (37 | 12.9%), and Sales & Related (19 | 6.6%).
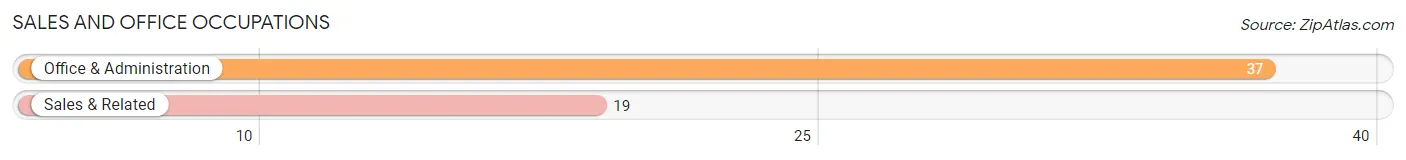
Sales and Office Occupations by Sex
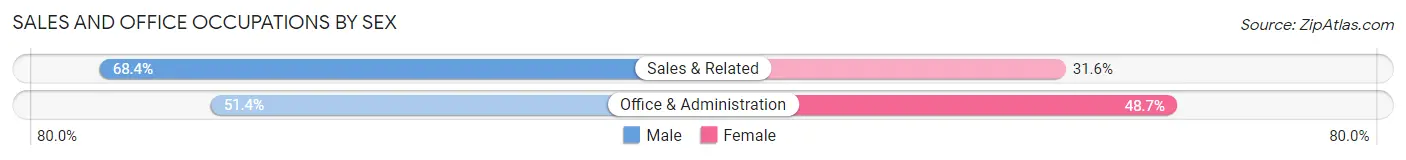
| Occupation | Male | Female |
| Sales & Related | 13 (68.4%) | 6 (31.6%) |
| Office & Administration | 19 (51.3%) | 18 (48.6%) |
| Total (Category) | 32 (57.1%) | 24 (42.9%) |
| Total (Overall) | 136 (47.2%) | 152 (52.8%) |
Natural Resources, Construction and Maintenance Occupations
The most common Natural Resources, Construction and Maintenance occupations in Center City are Construction & Extraction (16 | 5.6%), and Installation, Maintenance & Repair (11 | 3.8%).
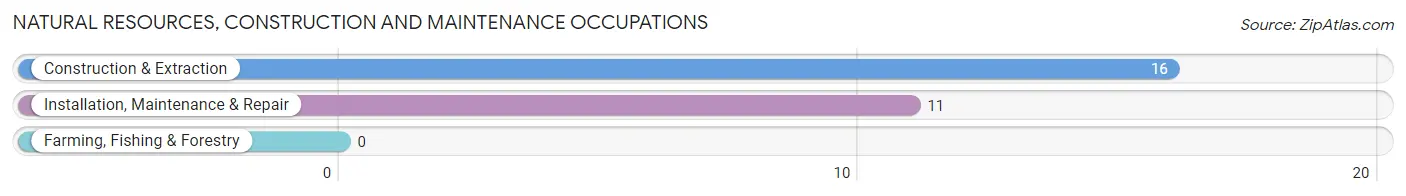
Natural Resources, Construction and Maintenance Occupations by Sex
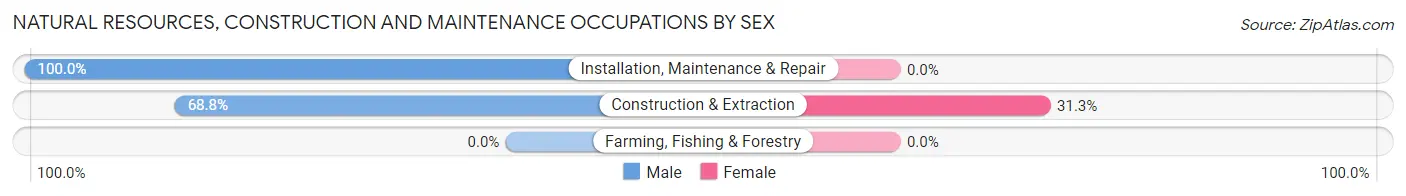
| Occupation | Male | Female |
| Farming, Fishing & Forestry | 0 (0.0%) | 0 (0.0%) |
| Construction & Extraction | 11 (68.8%) | 5 (31.2%) |
| Installation, Maintenance & Repair | 11 (100.0%) | 0 (0.0%) |
| Total (Category) | 22 (81.5%) | 5 (18.5%) |
| Total (Overall) | 136 (47.2%) | 152 (52.8%) |
Production, Transportation and Moving Occupations
The most common Production, Transportation and Moving occupations in Center City are Production (19 | 6.6%), Transportation (15 | 5.2%), and Material Moving (4 | 1.4%).
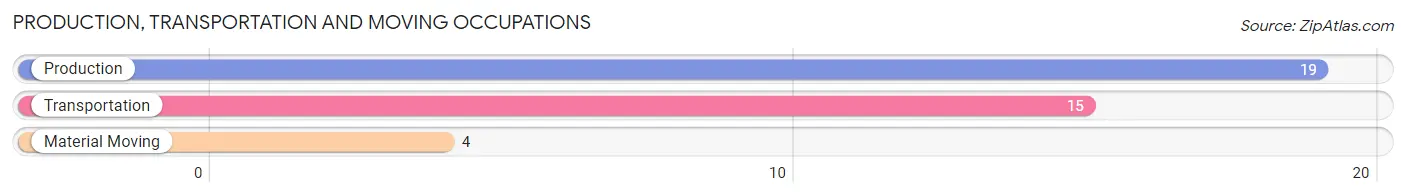
Production, Transportation and Moving Occupations by Sex
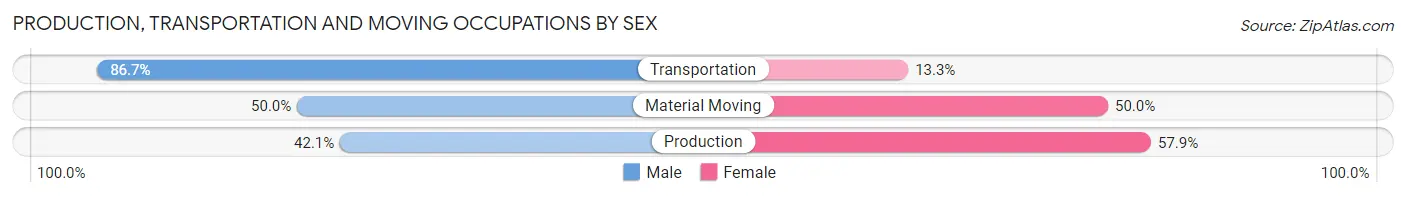
| Occupation | Male | Female |
| Production | 8 (42.1%) | 11 (57.9%) |
| Transportation | 13 (86.7%) | 2 (13.3%) |
| Material Moving | 2 (50.0%) | 2 (50.0%) |
| Total (Category) | 23 (60.5%) | 15 (39.5%) |
| Total (Overall) | 136 (47.2%) | 152 (52.8%) |
Employment Industries by Sex in Center City
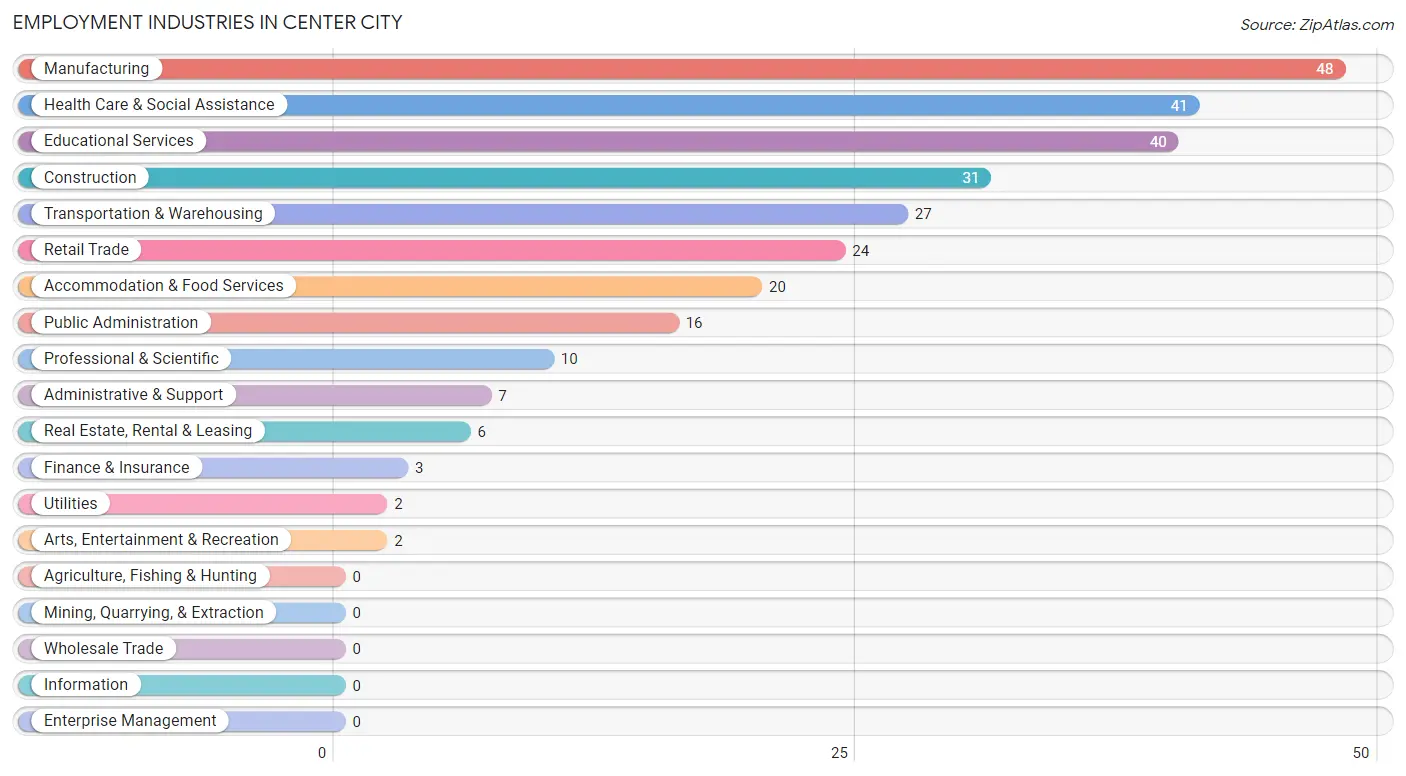
Employment Industries in Center City
The major employment industries in Center City include Manufacturing (48 | 16.7%), Health Care & Social Assistance (41 | 14.2%), Educational Services (40 | 13.9%), Construction (31 | 10.8%), and Transportation & Warehousing (27 | 9.4%).
Employment Industries by Sex in Center City
The Center City industries that see more men than women are Utilities (100.0%), Arts, Entertainment & Recreation (100.0%), and Public Administration (87.5%), whereas the industries that tend to have a higher number of women are Finance & Insurance (100.0%), Health Care & Social Assistance (92.7%), and Educational Services (75.0%).
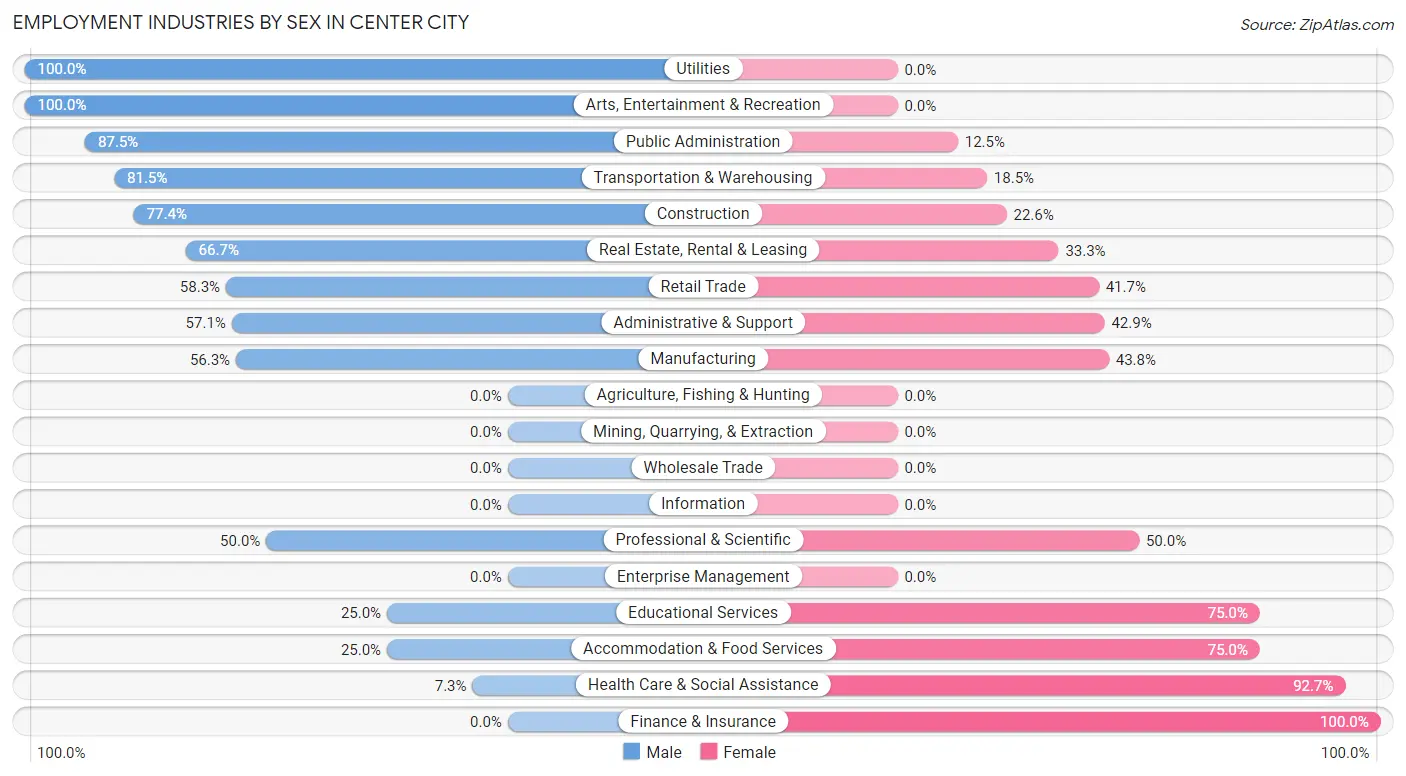
| Industry | Male | Female |
| Agriculture, Fishing & Hunting | 0 (0.0%) | 0 (0.0%) |
| Mining, Quarrying, & Extraction | 0 (0.0%) | 0 (0.0%) |
| Construction | 24 (77.4%) | 7 (22.6%) |
| Manufacturing | 27 (56.2%) | 21 (43.8%) |
| Wholesale Trade | 0 (0.0%) | 0 (0.0%) |
| Retail Trade | 14 (58.3%) | 10 (41.7%) |
| Transportation & Warehousing | 22 (81.5%) | 5 (18.5%) |
| Utilities | 2 (100.0%) | 0 (0.0%) |
| Information | 0 (0.0%) | 0 (0.0%) |
| Finance & Insurance | 0 (0.0%) | 3 (100.0%) |
| Real Estate, Rental & Leasing | 4 (66.7%) | 2 (33.3%) |
| Professional & Scientific | 5 (50.0%) | 5 (50.0%) |
| Enterprise Management | 0 (0.0%) | 0 (0.0%) |
| Administrative & Support | 4 (57.1%) | 3 (42.9%) |
| Educational Services | 10 (25.0%) | 30 (75.0%) |
| Health Care & Social Assistance | 3 (7.3%) | 38 (92.7%) |
| Arts, Entertainment & Recreation | 2 (100.0%) | 0 (0.0%) |
| Accommodation & Food Services | 5 (25.0%) | 15 (75.0%) |
| Public Administration | 14 (87.5%) | 2 (12.5%) |
| Total | 136 (47.2%) | 152 (52.8%) |
Education in Center City
School Enrollment in Center City
The most common levels of schooling among the 119 students in Center City are middle school (31 | 26.1%), elementary school (30 | 25.2%), and high school (22 | 18.5%).
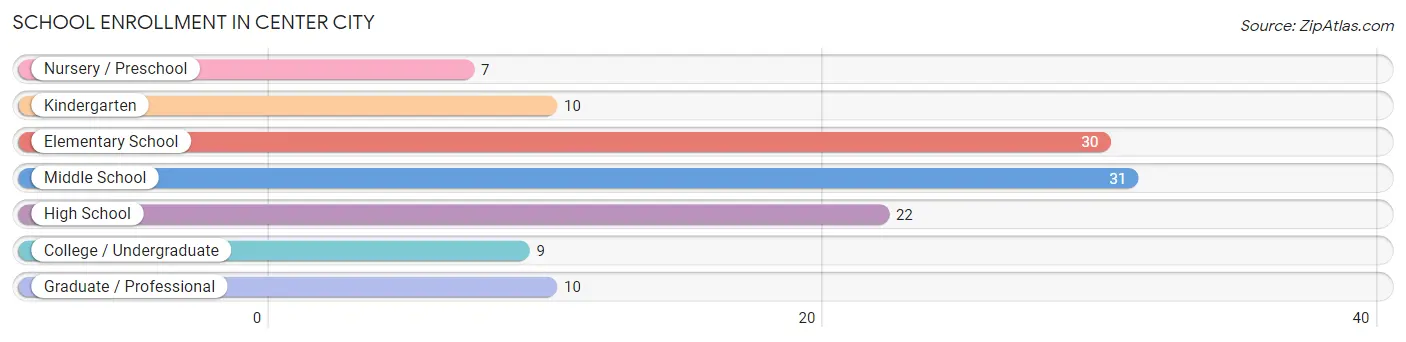
| School Level | # Students | % Students |
| Nursery / Preschool | 7 | 5.9% |
| Kindergarten | 10 | 8.4% |
| Elementary School | 30 | 25.2% |
| Middle School | 31 | 26.1% |
| High School | 22 | 18.5% |
| College / Undergraduate | 9 | 7.6% |
| Graduate / Professional | 10 | 8.4% |
| Total | 119 | 100.0% |
School Enrollment by Age by Funding Source in Center City
Out of a total of 119 students who are enrolled in schools in Center City, 9 (7.6%) attend a private institution, while the remaining 110 (92.4%) are enrolled in public schools. The age group of 25 to 34 year olds has the highest likelihood of being enrolled in private schools, with 2 (22.2% in the age bracket) enrolled. Conversely, the age group of 3 to 4 year olds has the lowest likelihood of being enrolled in a private school, with 1 (100.0% in the age bracket) attending a public institution.
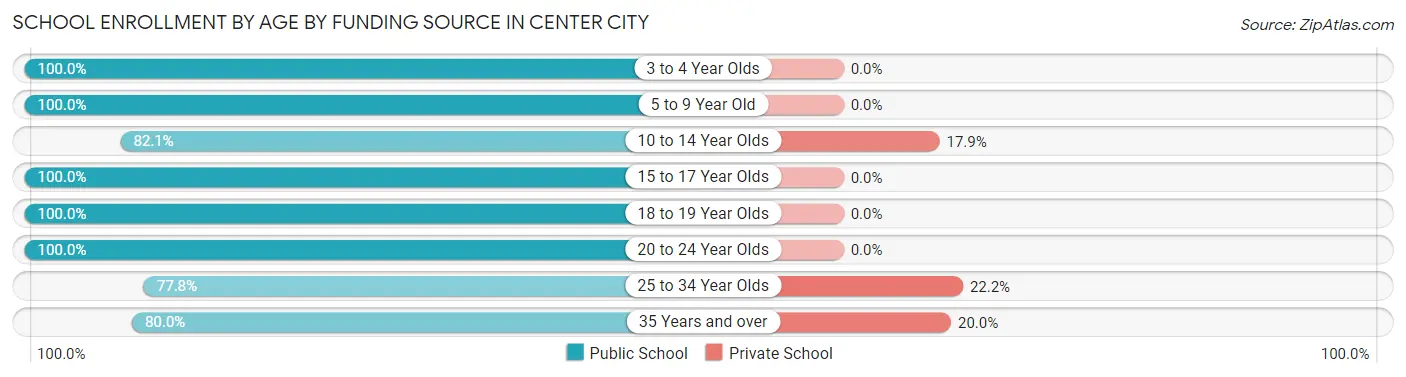
| Age Bracket | Public School | Private School |
| 3 to 4 Year Olds | 1 (100.0%) | 0 (0.0%) |
| 5 to 9 Year Old | 49 (100.0%) | 0 (0.0%) |
| 10 to 14 Year Olds | 23 (82.1%) | 5 (17.9%) |
| 15 to 17 Year Olds | 17 (100.0%) | 0 (0.0%) |
| 18 to 19 Year Olds | 3 (100.0%) | 0 (0.0%) |
| 20 to 24 Year Olds | 2 (100.0%) | 0 (0.0%) |
| 25 to 34 Year Olds | 7 (77.8%) | 2 (22.2%) |
| 35 Years and over | 8 (80.0%) | 2 (20.0%) |
| Total | 110 (92.4%) | 9 (7.6%) |
Educational Attainment by Field of Study in Center City
Education (40 | 27.2%), bio, nature & agricultural (16 | 10.9%), science & technology (15 | 10.2%), business (15 | 10.2%), and social sciences (12 | 8.2%) are the most common fields of study among 147 individuals in Center City who have obtained a bachelor's degree or higher.
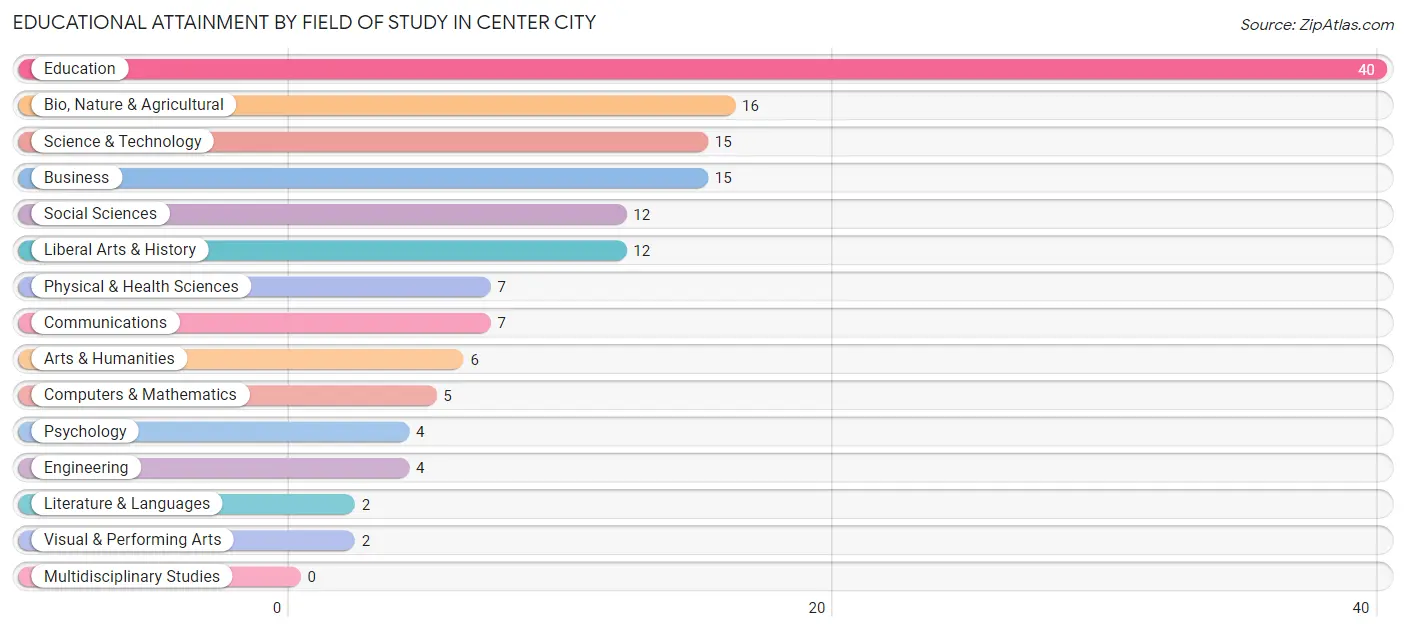
| Field of Study | # Graduates | % Graduates |
| Computers & Mathematics | 5 | 3.4% |
| Bio, Nature & Agricultural | 16 | 10.9% |
| Physical & Health Sciences | 7 | 4.8% |
| Psychology | 4 | 2.7% |
| Social Sciences | 12 | 8.2% |
| Engineering | 4 | 2.7% |
| Multidisciplinary Studies | 0 | 0.0% |
| Science & Technology | 15 | 10.2% |
| Business | 15 | 10.2% |
| Education | 40 | 27.2% |
| Literature & Languages | 2 | 1.4% |
| Liberal Arts & History | 12 | 8.2% |
| Visual & Performing Arts | 2 | 1.4% |
| Communications | 7 | 4.8% |
| Arts & Humanities | 6 | 4.1% |
| Total | 147 | 100.0% |
Transportation & Commute in Center City
Vehicle Availability by Sex in Center City
The most prevalent vehicle ownership categories in Center City are males with 3 vehicles (56, accounting for 41.2%) and females with 3 vehicles (49, making up 40.9%).
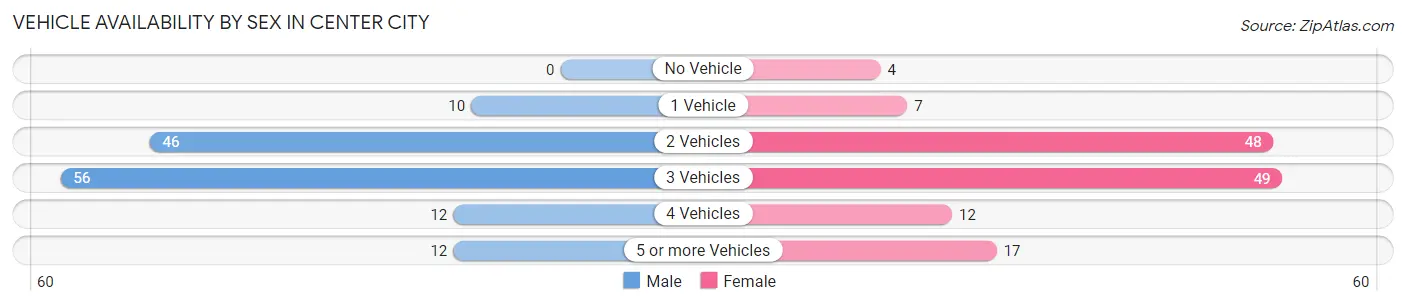
| Vehicles Available | Male | Female |
| No Vehicle | 0 (0.0%) | 4 (2.9%) |
| 1 Vehicle | 10 (7.3%) | 7 (5.1%) |
| 2 Vehicles | 46 (33.8%) | 48 (35.0%) |
| 3 Vehicles | 56 (41.2%) | 49 (35.8%) |
| 4 Vehicles | 12 (8.8%) | 12 (8.8%) |
| 5 or more Vehicles | 12 (8.8%) | 17 (12.4%) |
| Total | 136 (100.0%) | 137 (100.0%) |
Commute Time in Center City
The most frequently occuring commute durations in Center City are 45 to 59 minutes (62 commuters, 25.0%), 5 to 9 minutes (54 commuters, 21.8%), and 60 to 89 minutes (29 commuters, 11.7%).
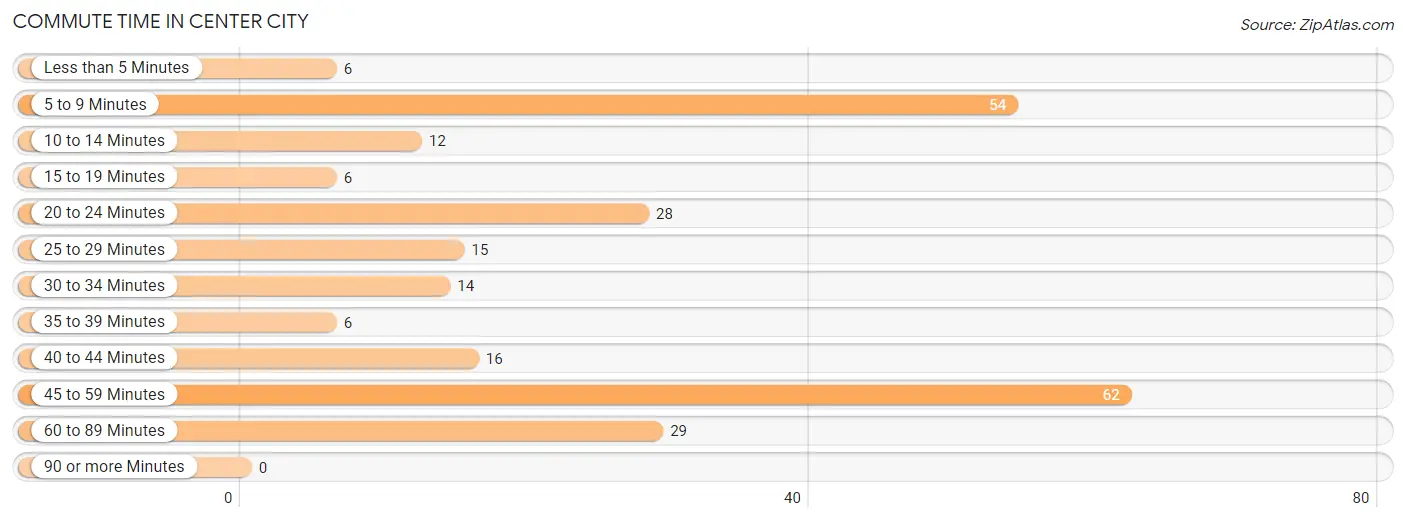
| Commute Time | # Commuters | % Commuters |
| Less than 5 Minutes | 6 | 2.4% |
| 5 to 9 Minutes | 54 | 21.8% |
| 10 to 14 Minutes | 12 | 4.8% |
| 15 to 19 Minutes | 6 | 2.4% |
| 20 to 24 Minutes | 28 | 11.3% |
| 25 to 29 Minutes | 15 | 6.0% |
| 30 to 34 Minutes | 14 | 5.7% |
| 35 to 39 Minutes | 6 | 2.4% |
| 40 to 44 Minutes | 16 | 6.5% |
| 45 to 59 Minutes | 62 | 25.0% |
| 60 to 89 Minutes | 29 | 11.7% |
| 90 or more Minutes | 0 | 0.0% |
Commute Time by Sex in Center City
The most common commute times in Center City are 45 to 59 minutes (50 commuters, 41.0%) for males and 5 to 9 minutes (27 commuters, 21.4%) for females.
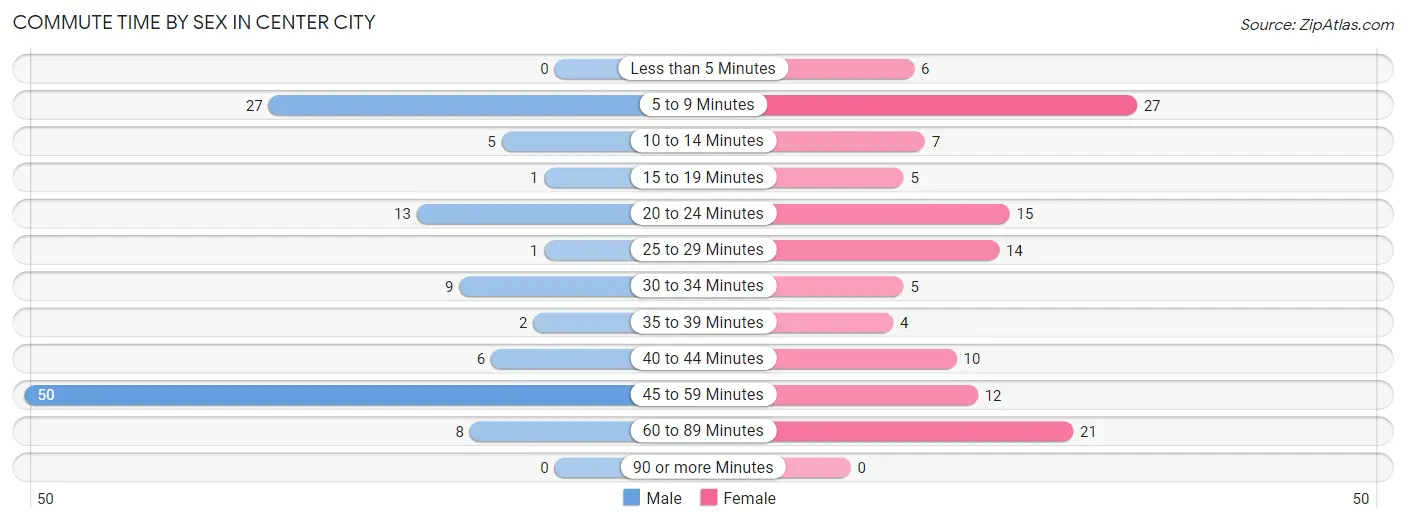
| Commute Time | Male | Female |
| Less than 5 Minutes | 0 (0.0%) | 6 (4.8%) |
| 5 to 9 Minutes | 27 (22.1%) | 27 (21.4%) |
| 10 to 14 Minutes | 5 (4.1%) | 7 (5.6%) |
| 15 to 19 Minutes | 1 (0.8%) | 5 (4.0%) |
| 20 to 24 Minutes | 13 (10.7%) | 15 (11.9%) |
| 25 to 29 Minutes | 1 (0.8%) | 14 (11.1%) |
| 30 to 34 Minutes | 9 (7.4%) | 5 (4.0%) |
| 35 to 39 Minutes | 2 (1.6%) | 4 (3.2%) |
| 40 to 44 Minutes | 6 (4.9%) | 10 (7.9%) |
| 45 to 59 Minutes | 50 (41.0%) | 12 (9.5%) |
| 60 to 89 Minutes | 8 (6.6%) | 21 (16.7%) |
| 90 or more Minutes | 0 (0.0%) | 0 (0.0%) |
Time of Departure to Work by Sex in Center City
The most frequent times of departure to work in Center City are 6:00 AM to 6:29 AM (20, 16.4%) for males and 6:30 AM to 6:59 AM (33, 26.2%) for females.
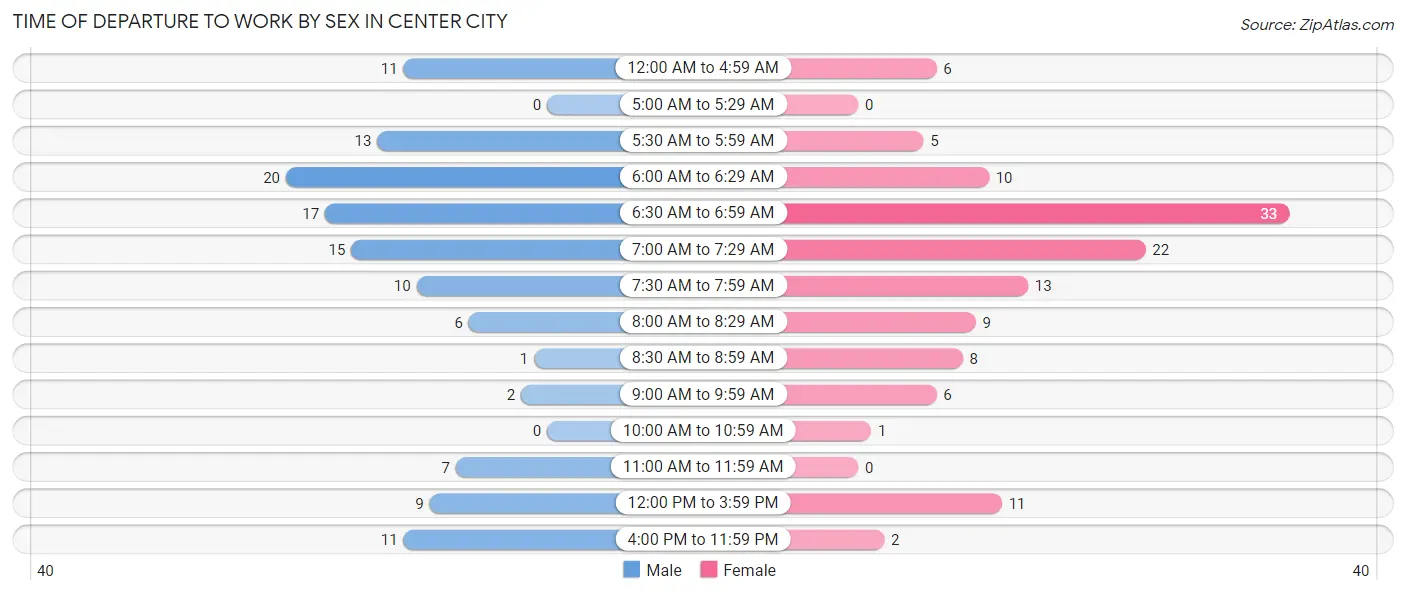
| Time of Departure | Male | Female |
| 12:00 AM to 4:59 AM | 11 (9.0%) | 6 (4.8%) |
| 5:00 AM to 5:29 AM | 0 (0.0%) | 0 (0.0%) |
| 5:30 AM to 5:59 AM | 13 (10.7%) | 5 (4.0%) |
| 6:00 AM to 6:29 AM | 20 (16.4%) | 10 (7.9%) |
| 6:30 AM to 6:59 AM | 17 (13.9%) | 33 (26.2%) |
| 7:00 AM to 7:29 AM | 15 (12.3%) | 22 (17.5%) |
| 7:30 AM to 7:59 AM | 10 (8.2%) | 13 (10.3%) |
| 8:00 AM to 8:29 AM | 6 (4.9%) | 9 (7.1%) |
| 8:30 AM to 8:59 AM | 1 (0.8%) | 8 (6.4%) |
| 9:00 AM to 9:59 AM | 2 (1.6%) | 6 (4.8%) |
| 10:00 AM to 10:59 AM | 0 (0.0%) | 1 (0.8%) |
| 11:00 AM to 11:59 AM | 7 (5.7%) | 0 (0.0%) |
| 12:00 PM to 3:59 PM | 9 (7.4%) | 11 (8.7%) |
| 4:00 PM to 11:59 PM | 11 (9.0%) | 2 (1.6%) |
| Total | 122 (100.0%) | 126 (100.0%) |
Housing Occupancy in Center City
Occupancy by Ownership in Center City
Of the total 244 dwellings in Center City, owner-occupied units account for 194 (79.5%), while renter-occupied units make up 50 (20.5%).
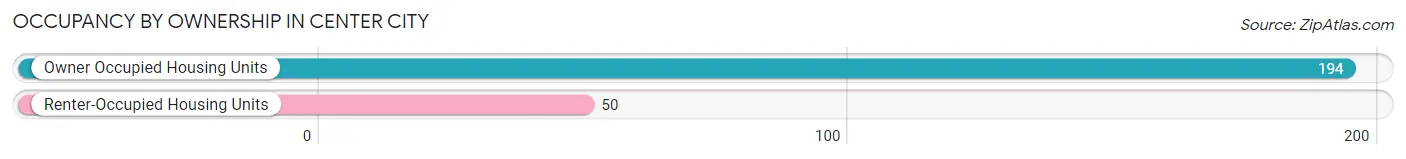
| Occupancy | # Housing Units | % Housing Units |
| Owner Occupied Housing Units | 194 | 79.5% |
| Renter-Occupied Housing Units | 50 | 20.5% |
| Total Occupied Housing Units | 244 | 100.0% |
Occupancy by Household Size in Center City
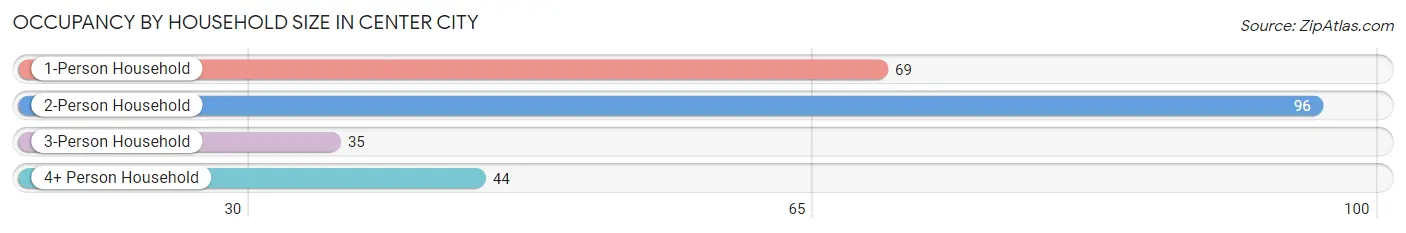
| Household Size | # Housing Units | % Housing Units |
| 1-Person Household | 69 | 28.3% |
| 2-Person Household | 96 | 39.3% |
| 3-Person Household | 35 | 14.3% |
| 4+ Person Household | 44 | 18.0% |
| Total Housing Units | 244 | 100.0% |
Occupancy by Ownership by Household Size in Center City
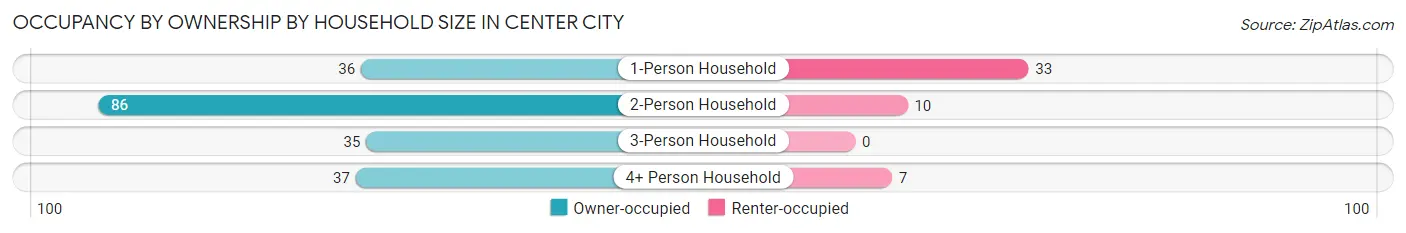
| Household Size | Owner-occupied | Renter-occupied |
| 1-Person Household | 36 (52.2%) | 33 (47.8%) |
| 2-Person Household | 86 (89.6%) | 10 (10.4%) |
| 3-Person Household | 35 (100.0%) | 0 (0.0%) |
| 4+ Person Household | 37 (84.1%) | 7 (15.9%) |
| Total Housing Units | 194 (79.5%) | 50 (20.5%) |
Occupancy by Educational Attainment in Center City
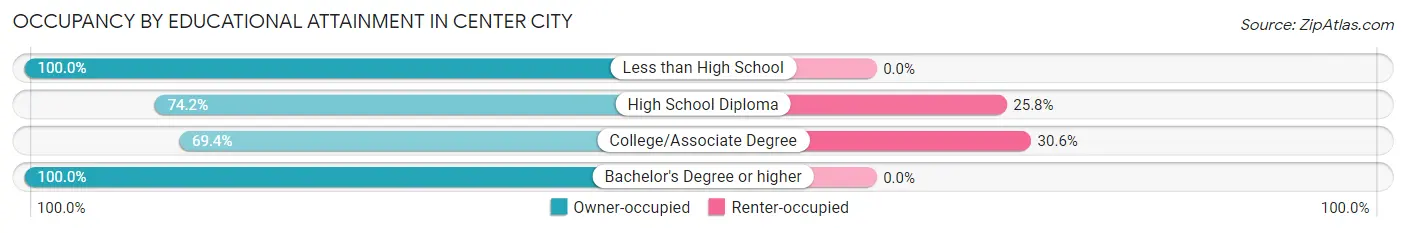
| Household Size | Owner-occupied | Renter-occupied |
| Less than High School | 10 (100.0%) | 0 (0.0%) |
| High School Diploma | 46 (74.2%) | 16 (25.8%) |
| College/Associate Degree | 77 (69.4%) | 34 (30.6%) |
| Bachelor's Degree or higher | 61 (100.0%) | 0 (0.0%) |
Occupancy by Age of Householder in Center City
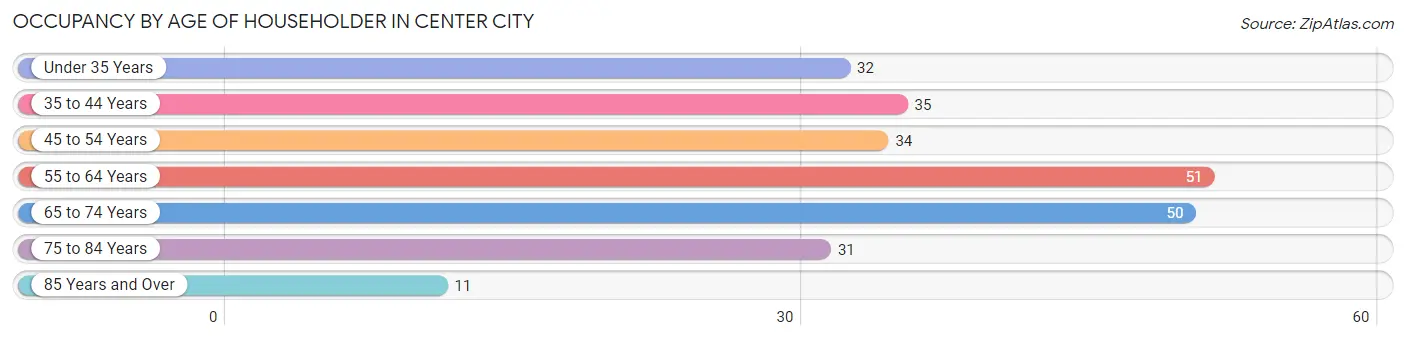
| Age Bracket | # Households | % Households |
| Under 35 Years | 32 | 13.1% |
| 35 to 44 Years | 35 | 14.3% |
| 45 to 54 Years | 34 | 13.9% |
| 55 to 64 Years | 51 | 20.9% |
| 65 to 74 Years | 50 | 20.5% |
| 75 to 84 Years | 31 | 12.7% |
| 85 Years and Over | 11 | 4.5% |
| Total | 244 | 100.0% |
Housing Finances in Center City
Median Income by Occupancy in Center City
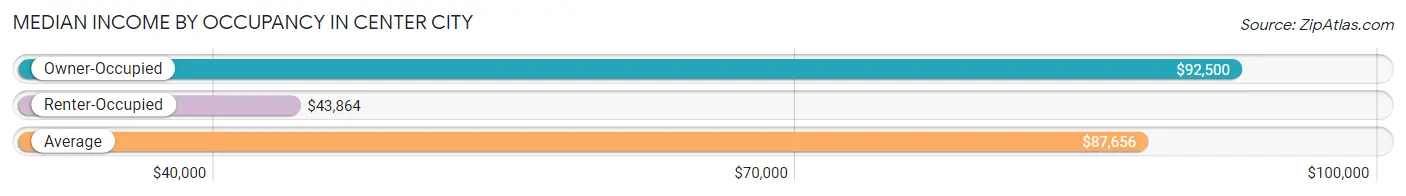
| Occupancy Type | # Households | Median Income |
| Owner-Occupied | 194 (79.5%) | $92,500 |
| Renter-Occupied | 50 (20.5%) | $43,864 |
| Average | 244 (100.0%) | $87,656 |
Occupancy by Householder Income Bracket in Center City
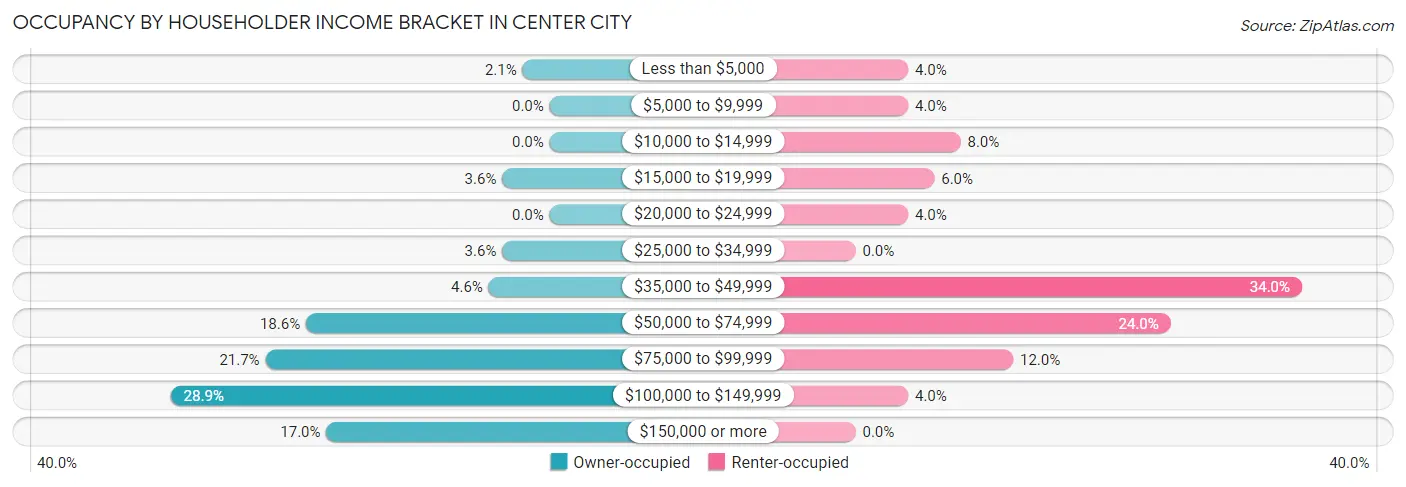
| Income Bracket | Owner-occupied | Renter-occupied |
| Less than $5,000 | 4 (2.1%) | 2 (4.0%) |
| $5,000 to $9,999 | 0 (0.0%) | 2 (4.0%) |
| $10,000 to $14,999 | 0 (0.0%) | 4 (8.0%) |
| $15,000 to $19,999 | 7 (3.6%) | 3 (6.0%) |
| $20,000 to $24,999 | 0 (0.0%) | 2 (4.0%) |
| $25,000 to $34,999 | 7 (3.6%) | 0 (0.0%) |
| $35,000 to $49,999 | 9 (4.6%) | 17 (34.0%) |
| $50,000 to $74,999 | 36 (18.6%) | 12 (24.0%) |
| $75,000 to $99,999 | 42 (21.6%) | 6 (12.0%) |
| $100,000 to $149,999 | 56 (28.9%) | 2 (4.0%) |
| $150,000 or more | 33 (17.0%) | 0 (0.0%) |
| Total | 194 (100.0%) | 50 (100.0%) |
Monthly Housing Cost Tiers in Center City
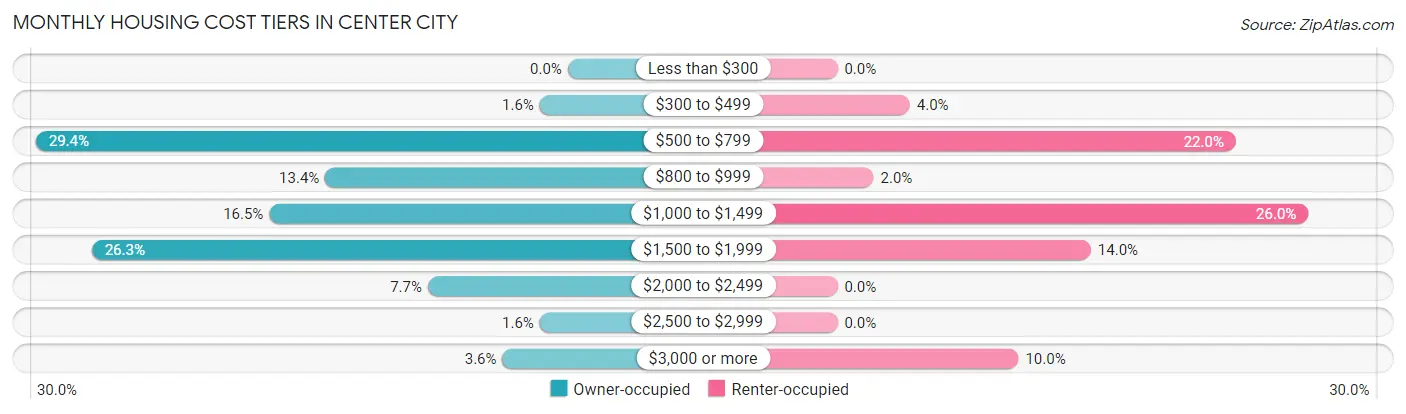
| Monthly Cost | Owner-occupied | Renter-occupied |
| Less than $300 | 0 (0.0%) | 0 (0.0%) |
| $300 to $499 | 3 (1.5%) | 2 (4.0%) |
| $500 to $799 | 57 (29.4%) | 11 (22.0%) |
| $800 to $999 | 26 (13.4%) | 1 (2.0%) |
| $1,000 to $1,499 | 32 (16.5%) | 13 (26.0%) |
| $1,500 to $1,999 | 51 (26.3%) | 7 (14.0%) |
| $2,000 to $2,499 | 15 (7.7%) | 0 (0.0%) |
| $2,500 to $2,999 | 3 (1.5%) | 0 (0.0%) |
| $3,000 or more | 7 (3.6%) | 5 (10.0%) |
| Total | 194 (100.0%) | 50 (100.0%) |
Physical Housing Characteristics in Center City
Housing Structures in Center City
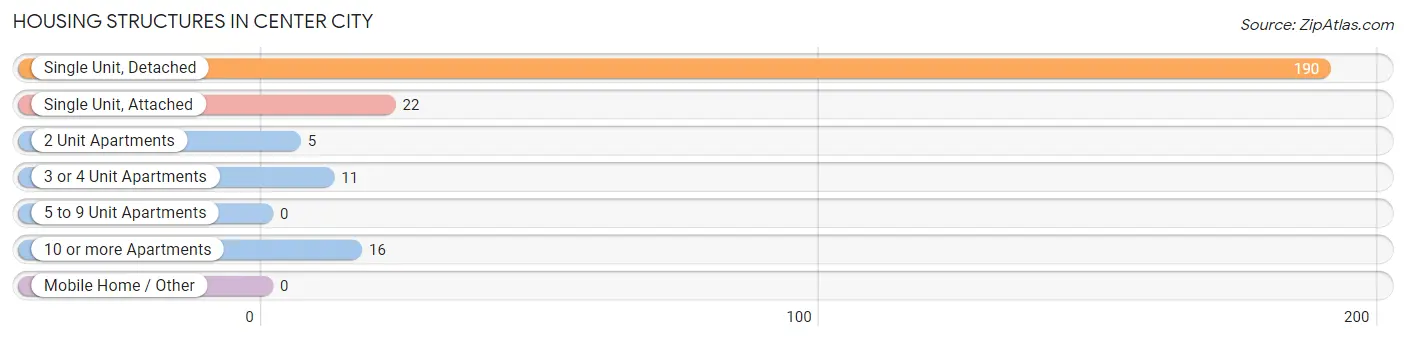
| Structure Type | # Housing Units | % Housing Units |
| Single Unit, Detached | 190 | 77.9% |
| Single Unit, Attached | 22 | 9.0% |
| 2 Unit Apartments | 5 | 2.1% |
| 3 or 4 Unit Apartments | 11 | 4.5% |
| 5 to 9 Unit Apartments | 0 | 0.0% |
| 10 or more Apartments | 16 | 6.6% |
| Mobile Home / Other | 0 | 0.0% |
| Total | 244 | 100.0% |
Housing Structures by Occupancy in Center City
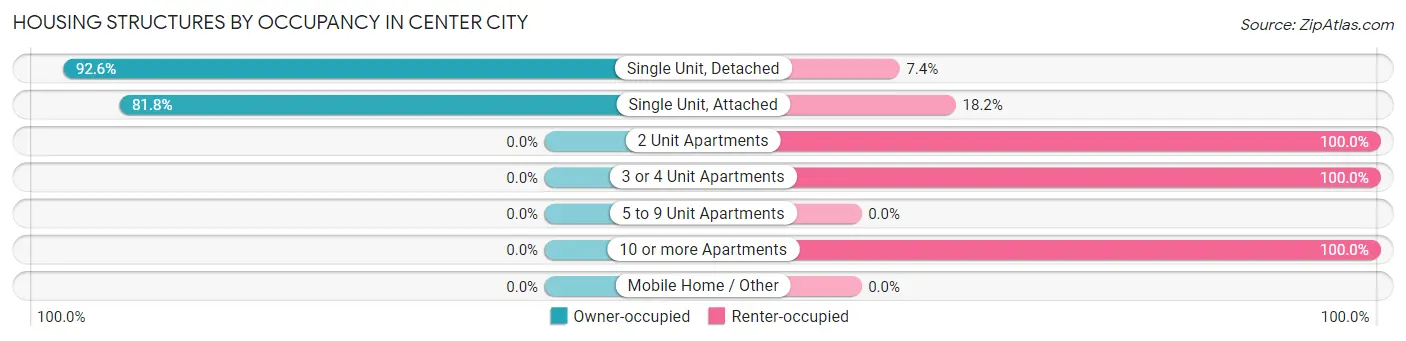
| Structure Type | Owner-occupied | Renter-occupied |
| Single Unit, Detached | 176 (92.6%) | 14 (7.4%) |
| Single Unit, Attached | 18 (81.8%) | 4 (18.2%) |
| 2 Unit Apartments | 0 (0.0%) | 5 (100.0%) |
| 3 or 4 Unit Apartments | 0 (0.0%) | 11 (100.0%) |
| 5 to 9 Unit Apartments | 0 (0.0%) | 0 (0.0%) |
| 10 or more Apartments | 0 (0.0%) | 16 (100.0%) |
| Mobile Home / Other | 0 (0.0%) | 0 (0.0%) |
| Total | 194 (79.5%) | 50 (20.5%) |
Housing Structures by Number of Rooms in Center City
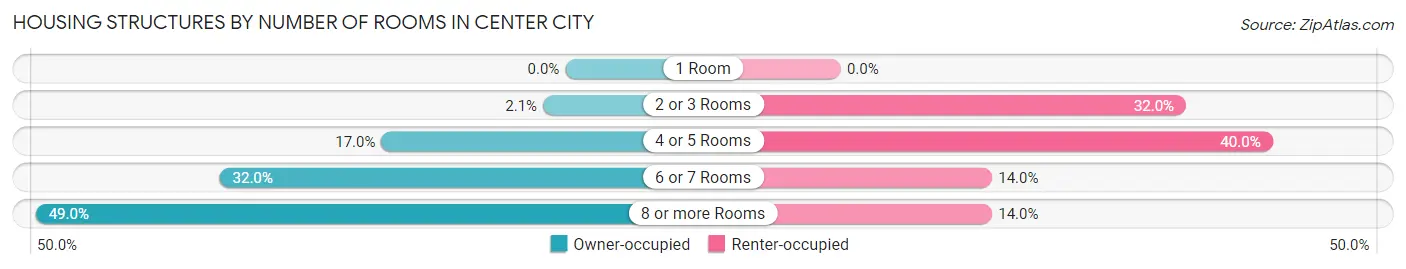
| Number of Rooms | Owner-occupied | Renter-occupied |
| 1 Room | 0 (0.0%) | 0 (0.0%) |
| 2 or 3 Rooms | 4 (2.1%) | 16 (32.0%) |
| 4 or 5 Rooms | 33 (17.0%) | 20 (40.0%) |
| 6 or 7 Rooms | 62 (32.0%) | 7 (14.0%) |
| 8 or more Rooms | 95 (49.0%) | 7 (14.0%) |
| Total | 194 (100.0%) | 50 (100.0%) |
Housing Structure by Heating Type in Center City
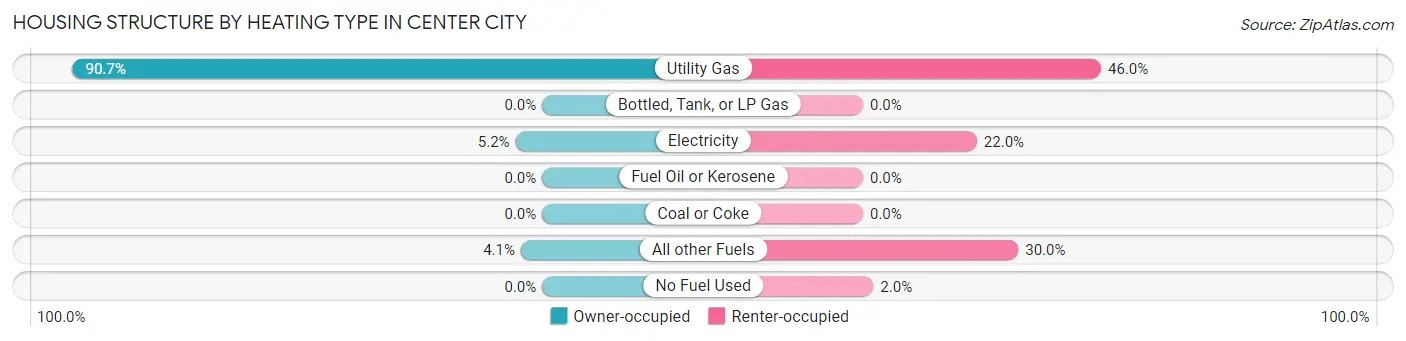
| Heating Type | Owner-occupied | Renter-occupied |
| Utility Gas | 176 (90.7%) | 23 (46.0%) |
| Bottled, Tank, or LP Gas | 0 (0.0%) | 0 (0.0%) |
| Electricity | 10 (5.1%) | 11 (22.0%) |
| Fuel Oil or Kerosene | 0 (0.0%) | 0 (0.0%) |
| Coal or Coke | 0 (0.0%) | 0 (0.0%) |
| All other Fuels | 8 (4.1%) | 15 (30.0%) |
| No Fuel Used | 0 (0.0%) | 1 (2.0%) |
| Total | 194 (100.0%) | 50 (100.0%) |
Household Vehicle Usage in Center City
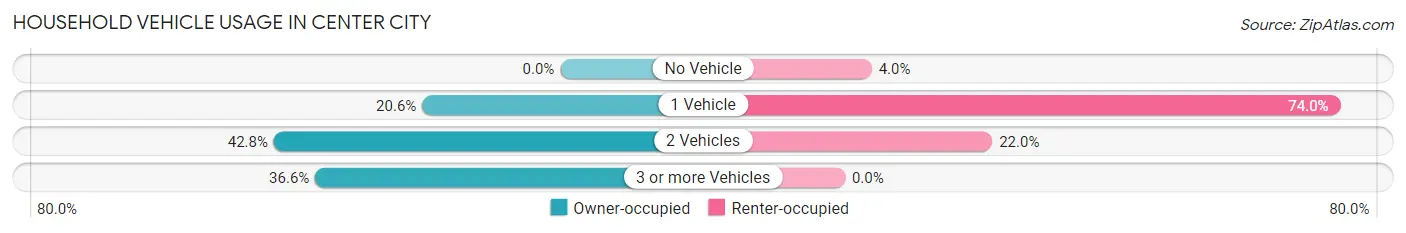
| Vehicles per Household | Owner-occupied | Renter-occupied |
| No Vehicle | 0 (0.0%) | 2 (4.0%) |
| 1 Vehicle | 40 (20.6%) | 37 (74.0%) |
| 2 Vehicles | 83 (42.8%) | 11 (22.0%) |
| 3 or more Vehicles | 71 (36.6%) | 0 (0.0%) |
| Total | 194 (100.0%) | 50 (100.0%) |
Real Estate & Mortgages in Center City
Real Estate and Mortgage Overview in Center City
| Characteristic | Without Mortgage | With Mortgage |
| Housing Units | 80 | 114 |
| Median Property Value | $338,900 | $288,600 |
| Median Household Income | $88,214 | $19 |
| Monthly Housing Costs | $748 | $7 |
| Real Estate Taxes | $3,724 | $4 |
Property Value by Mortgage Status in Center City
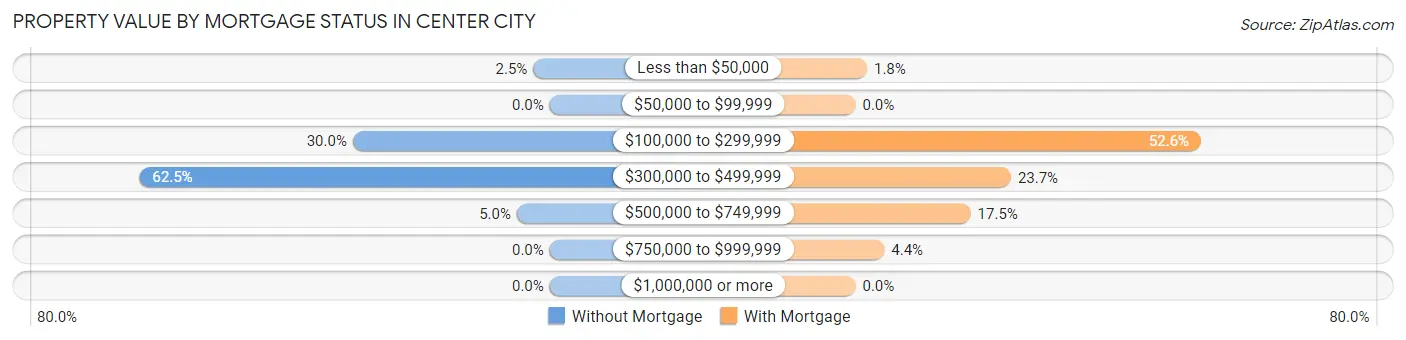
| Property Value | Without Mortgage | With Mortgage |
| Less than $50,000 | 2 (2.5%) | 2 (1.8%) |
| $50,000 to $99,999 | 0 (0.0%) | 0 (0.0%) |
| $100,000 to $299,999 | 24 (30.0%) | 60 (52.6%) |
| $300,000 to $499,999 | 50 (62.5%) | 27 (23.7%) |
| $500,000 to $749,999 | 4 (5.0%) | 20 (17.5%) |
| $750,000 to $999,999 | 0 (0.0%) | 5 (4.4%) |
| $1,000,000 or more | 0 (0.0%) | 0 (0.0%) |
| Total | 80 (100.0%) | 114 (100.0%) |
Household Income by Mortgage Status in Center City
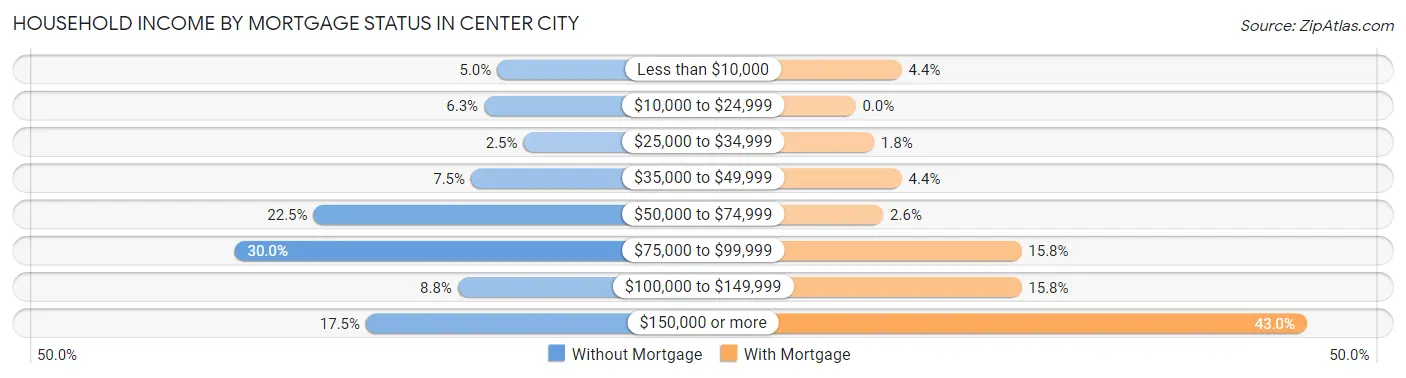
| Household Income | Without Mortgage | With Mortgage |
| Less than $10,000 | 4 (5.0%) | 5 (4.4%) |
| $10,000 to $24,999 | 5 (6.2%) | 0 (0.0%) |
| $25,000 to $34,999 | 2 (2.5%) | 2 (1.8%) |
| $35,000 to $49,999 | 6 (7.5%) | 5 (4.4%) |
| $50,000 to $74,999 | 18 (22.5%) | 3 (2.6%) |
| $75,000 to $99,999 | 24 (30.0%) | 18 (15.8%) |
| $100,000 to $149,999 | 7 (8.7%) | 18 (15.8%) |
| $150,000 or more | 14 (17.5%) | 49 (43.0%) |
| Total | 80 (100.0%) | 114 (100.0%) |
Property Value to Household Income Ratio in Center City
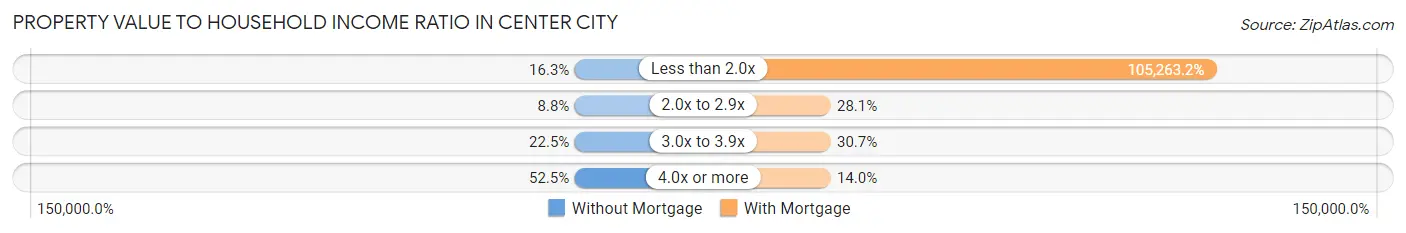
| Value-to-Income Ratio | Without Mortgage | With Mortgage |
| Less than 2.0x | 13 (16.3%) | 120,000 (105,263.2%) |
| 2.0x to 2.9x | 7 (8.7%) | 32 (28.1%) |
| 3.0x to 3.9x | 18 (22.5%) | 35 (30.7%) |
| 4.0x or more | 42 (52.5%) | 16 (14.0%) |
| Total | 80 (100.0%) | 114 (100.0%) |
Real Estate Taxes by Mortgage Status in Center City
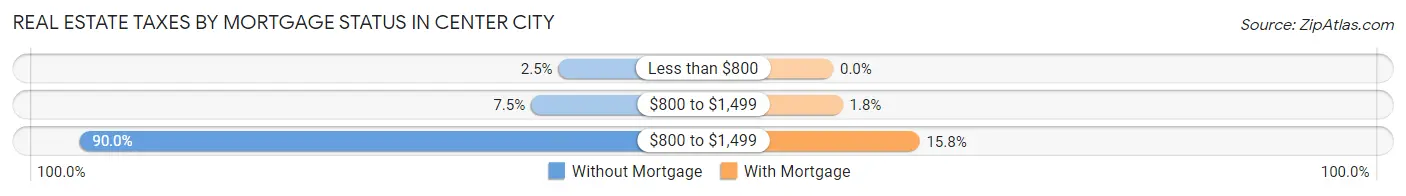
| Property Taxes | Without Mortgage | With Mortgage |
| Less than $800 | 2 (2.5%) | 0 (0.0%) |
| $800 to $1,499 | 6 (7.5%) | 2 (1.8%) |
| $800 to $1,499 | 72 (90.0%) | 18 (15.8%) |
| Total | 80 (100.0%) | 114 (100.0%) |
Health & Disability in Center City
Health Insurance Coverage by Age in Center City
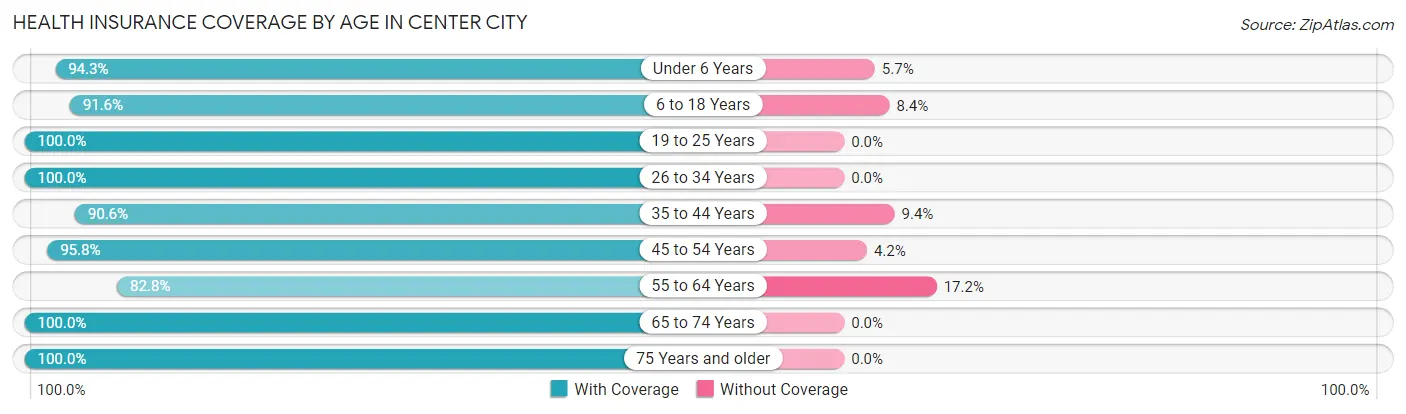
| Age Bracket | With Coverage | Without Coverage |
| Under 6 Years | 33 (94.3%) | 2 (5.7%) |
| 6 to 18 Years | 76 (91.6%) | 7 (8.4%) |
| 19 to 25 Years | 39 (100.0%) | 0 (0.0%) |
| 26 to 34 Years | 65 (100.0%) | 0 (0.0%) |
| 35 to 44 Years | 58 (90.6%) | 6 (9.4%) |
| 45 to 54 Years | 68 (95.8%) | 3 (4.2%) |
| 55 to 64 Years | 72 (82.8%) | 15 (17.2%) |
| 65 to 74 Years | 94 (100.0%) | 0 (0.0%) |
| 75 Years and older | 56 (100.0%) | 0 (0.0%) |
| Total | 561 (94.4%) | 33 (5.6%) |
Health Insurance Coverage by Citizenship Status in Center City
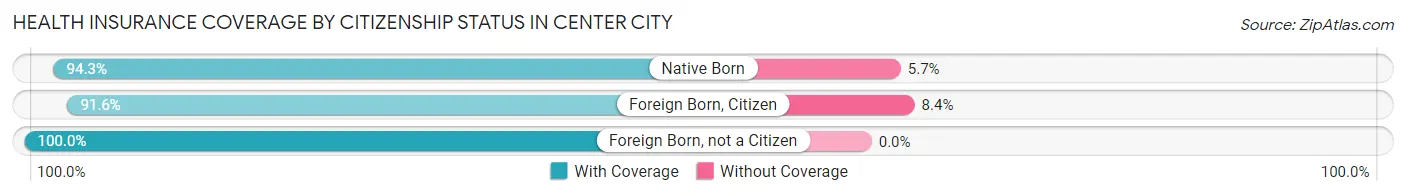
| Citizenship Status | With Coverage | Without Coverage |
| Native Born | 33 (94.3%) | 2 (5.7%) |
| Foreign Born, Citizen | 76 (91.6%) | 7 (8.4%) |
| Foreign Born, not a Citizen | 39 (100.0%) | 0 (0.0%) |
Health Insurance Coverage by Household Income in Center City
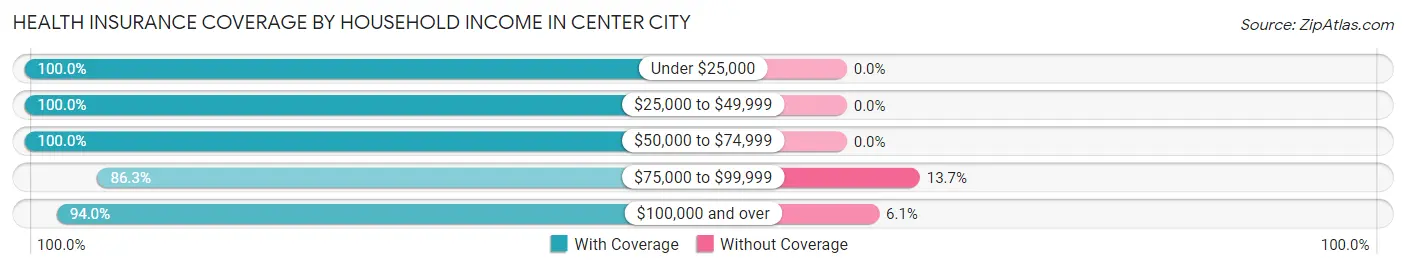
| Household Income | With Coverage | Without Coverage |
| Under $25,000 | 26 (100.0%) | 0 (0.0%) |
| $25,000 to $49,999 | 45 (100.0%) | 0 (0.0%) |
| $50,000 to $74,999 | 125 (100.0%) | 0 (0.0%) |
| $75,000 to $99,999 | 101 (86.3%) | 16 (13.7%) |
| $100,000 and over | 264 (94.0%) | 17 (6.0%) |
Public vs Private Health Insurance Coverage by Age in Center City
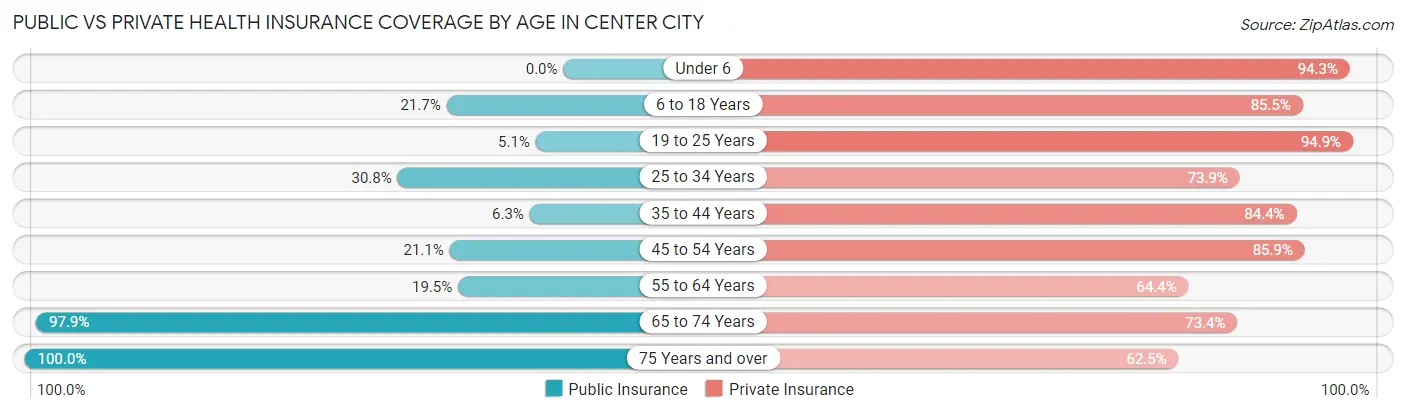
| Age Bracket | Public Insurance | Private Insurance |
| Under 6 | 0 (0.0%) | 33 (94.3%) |
| 6 to 18 Years | 18 (21.7%) | 71 (85.5%) |
| 19 to 25 Years | 2 (5.1%) | 37 (94.9%) |
| 25 to 34 Years | 20 (30.8%) | 48 (73.9%) |
| 35 to 44 Years | 4 (6.2%) | 54 (84.4%) |
| 45 to 54 Years | 15 (21.1%) | 61 (85.9%) |
| 55 to 64 Years | 17 (19.5%) | 56 (64.4%) |
| 65 to 74 Years | 92 (97.9%) | 69 (73.4%) |
| 75 Years and over | 56 (100.0%) | 35 (62.5%) |
| Total | 224 (37.7%) | 464 (78.1%) |
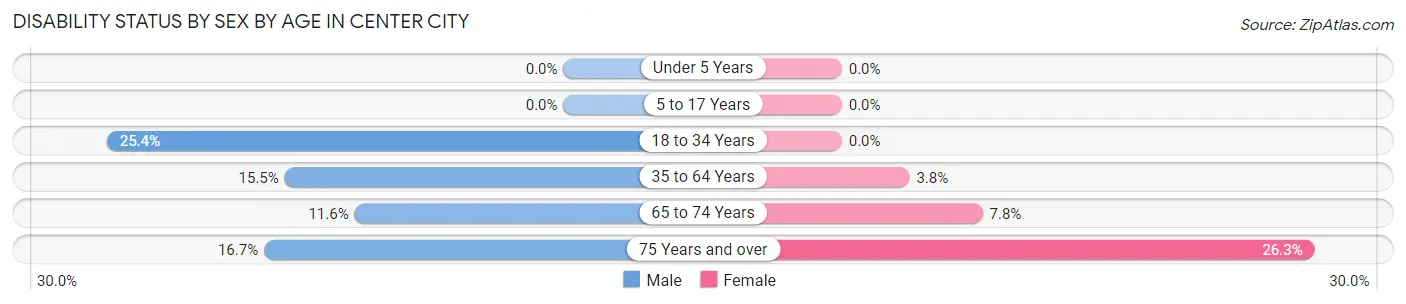
Disability Status by Sex by Age in Center City
| Age Bracket | Male | Female |
| Under 5 Years | 0 (0.0%) | 0 (0.0%) |
| 5 to 17 Years | 0 (0.0%) | 0 (0.0%) |
| 18 to 34 Years | 15 (25.4%) | 0 (0.0%) |
| 35 to 64 Years | 18 (15.5%) | 4 (3.8%) |
| 65 to 74 Years | 5 (11.6%) | 4 (7.8%) |
| 75 Years and over | 3 (16.7%) | 10 (26.3%) |
Disability Class by Sex by Age in Center City
Disability Class: Hearing Difficulty
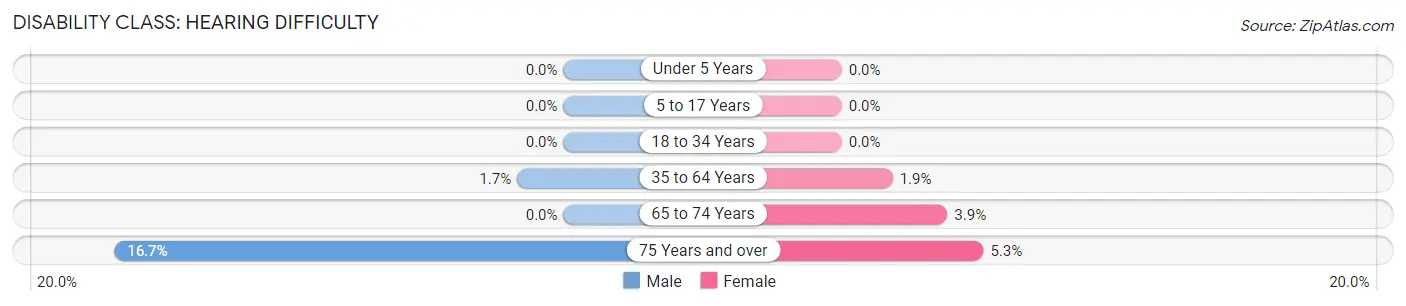
| Age Bracket | Male | Female |
| Under 5 Years | 0 (0.0%) | 0 (0.0%) |
| 5 to 17 Years | 0 (0.0%) | 0 (0.0%) |
| 18 to 34 Years | 0 (0.0%) | 0 (0.0%) |
| 35 to 64 Years | 2 (1.7%) | 2 (1.9%) |
| 65 to 74 Years | 0 (0.0%) | 2 (3.9%) |
| 75 Years and over | 3 (16.7%) | 2 (5.3%) |
Disability Class: Vision Difficulty
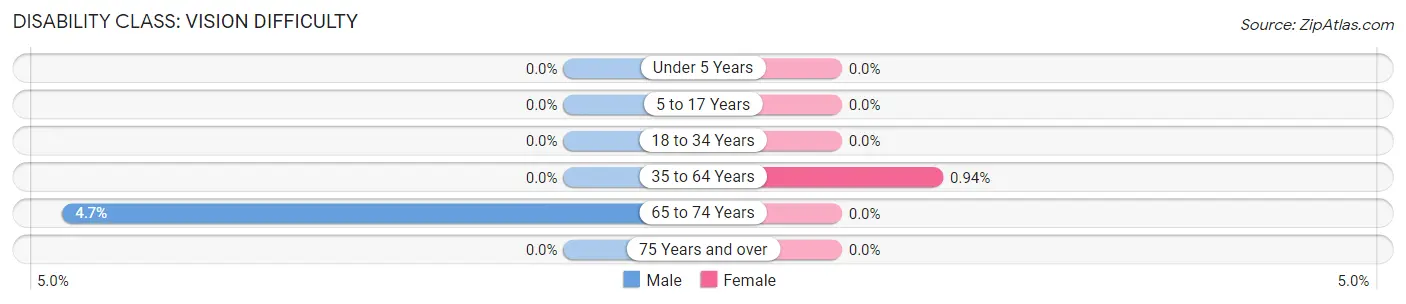
| Age Bracket | Male | Female |
| Under 5 Years | 0 (0.0%) | 0 (0.0%) |
| 5 to 17 Years | 0 (0.0%) | 0 (0.0%) |
| 18 to 34 Years | 0 (0.0%) | 0 (0.0%) |
| 35 to 64 Years | 0 (0.0%) | 1 (0.9%) |
| 65 to 74 Years | 2 (4.6%) | 0 (0.0%) |
| 75 Years and over | 0 (0.0%) | 0 (0.0%) |
Disability Class: Cognitive Difficulty
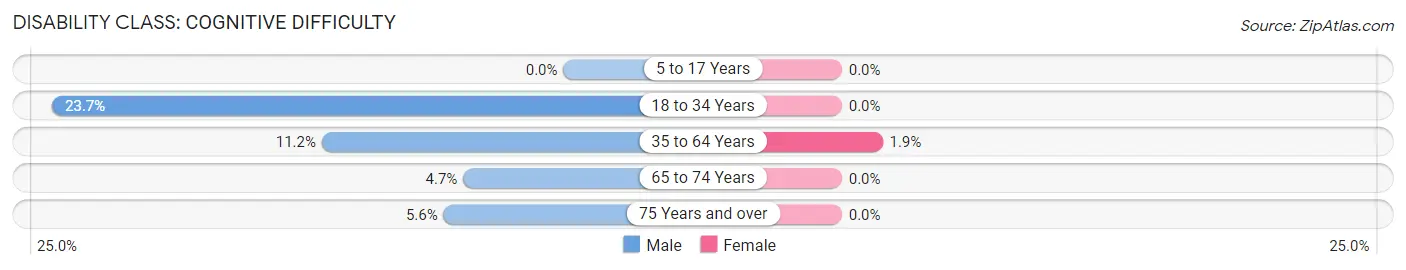
| Age Bracket | Male | Female |
| 5 to 17 Years | 0 (0.0%) | 0 (0.0%) |
| 18 to 34 Years | 14 (23.7%) | 0 (0.0%) |
| 35 to 64 Years | 13 (11.2%) | 2 (1.9%) |
| 65 to 74 Years | 2 (4.6%) | 0 (0.0%) |
| 75 Years and over | 1 (5.6%) | 0 (0.0%) |
Disability Class: Ambulatory Difficulty
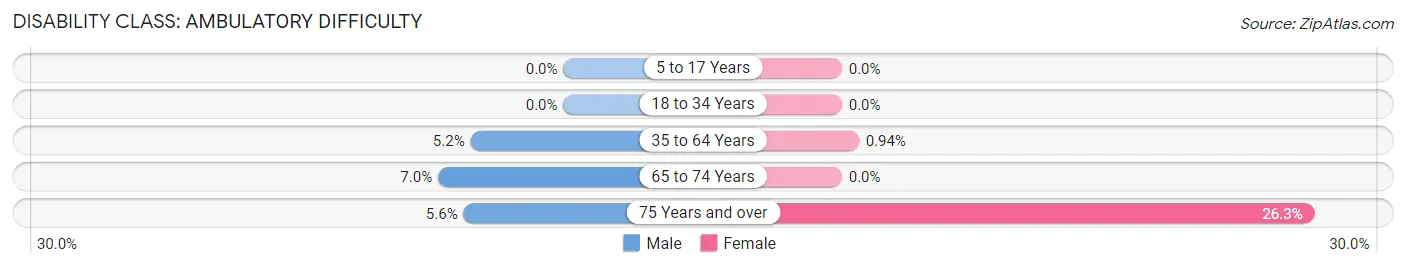
| Age Bracket | Male | Female |
| 5 to 17 Years | 0 (0.0%) | 0 (0.0%) |
| 18 to 34 Years | 0 (0.0%) | 0 (0.0%) |
| 35 to 64 Years | 6 (5.2%) | 1 (0.9%) |
| 65 to 74 Years | 3 (7.0%) | 0 (0.0%) |
| 75 Years and over | 1 (5.6%) | 10 (26.3%) |
Disability Class: Self-Care Difficulty
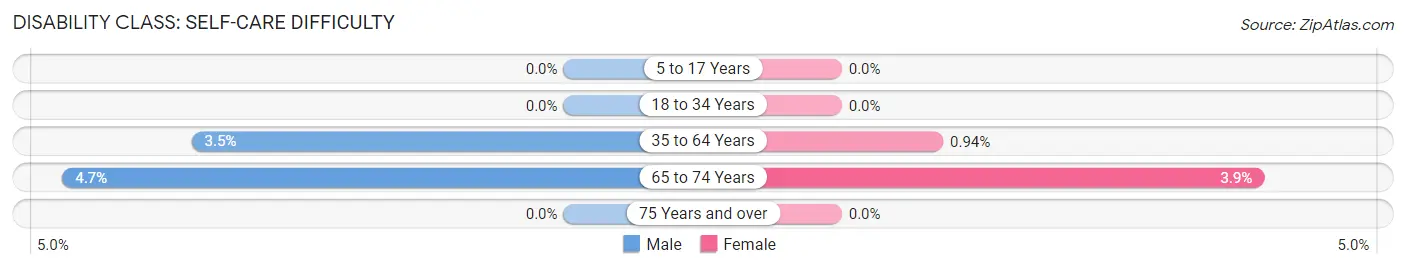
| Age Bracket | Male | Female |
| 5 to 17 Years | 0 (0.0%) | 0 (0.0%) |
| 18 to 34 Years | 0 (0.0%) | 0 (0.0%) |
| 35 to 64 Years | 4 (3.5%) | 1 (0.9%) |
| 65 to 74 Years | 2 (4.6%) | 2 (3.9%) |
| 75 Years and over | 0 (0.0%) | 0 (0.0%) |
Technology Access in Center City
Computing Device Access in Center City
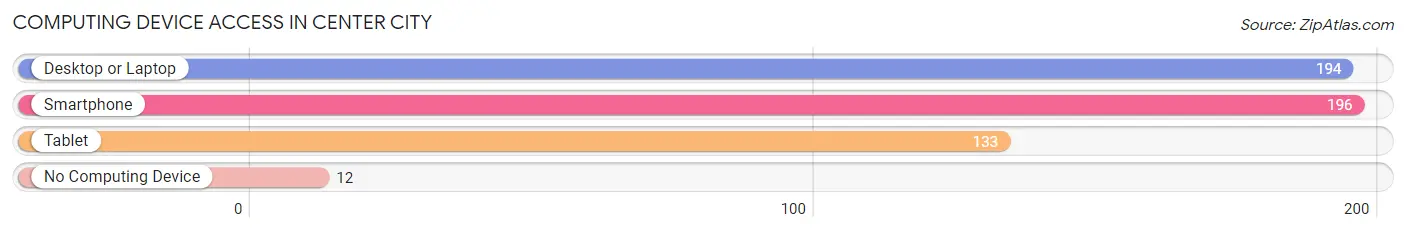
| Device Type | # Households | % Households |
| Desktop or Laptop | 194 | 79.5% |
| Smartphone | 196 | 80.3% |
| Tablet | 133 | 54.5% |
| No Computing Device | 12 | 4.9% |
| Total | 244 | 100.0% |
Internet Access in Center City
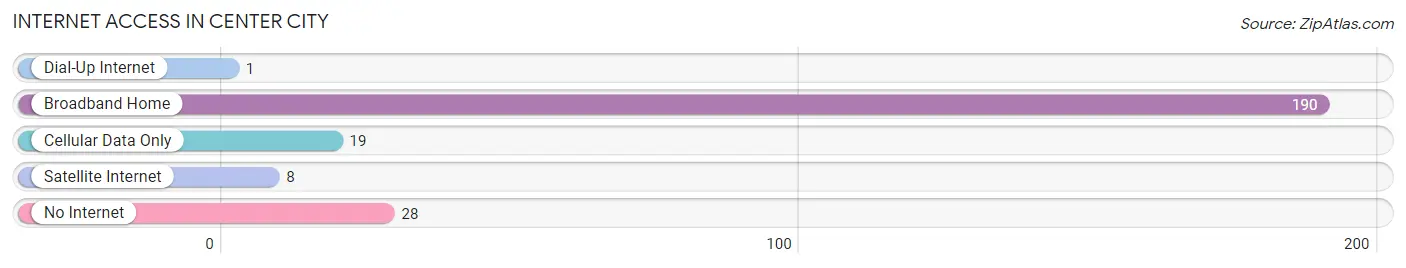
| Internet Type | # Households | % Households |
| Dial-Up Internet | 1 | 0.4% |
| Broadband Home | 190 | 77.9% |
| Cellular Data Only | 19 | 7.8% |
| Satellite Internet | 8 | 3.3% |
| No Internet | 28 | 11.5% |
| Total | 244 | 100.0% |
Center City Summary
City Center, Minnesota is a small city located in the heart of the state. It is situated in the center of Hennepin County, and is part of the Minneapolis-St. Paul metropolitan area. The city is home to a population of approximately 8,000 people, and is known for its vibrant downtown area, which is home to a variety of shops, restaurants, and other businesses.
History
City Center was founded in 1854 by a group of settlers from the nearby town of St. Anthony. The settlers were looking for a place to build a new town, and they chose the area that is now City Center. The town was originally called “Centerville”, but the name was changed to City Center in 1872.
The city grew rapidly in the late 19th and early 20th centuries, and by the 1920s it had become a bustling commercial center. The city was home to a variety of businesses, including a large department store, a movie theater, and a number of banks.
In the 1950s, City Center began to experience a decline in population and economic activity. This was due in part to the construction of the nearby Mall of America, which drew shoppers away from the downtown area. However, in the late 1990s, the city began to experience a resurgence, as new businesses and residents moved into the area.
Geography
City Center is located in the center of Hennepin County, and is part of the Minneapolis-St. Paul metropolitan area. The city is situated on the banks of the Mississippi River, and is surrounded by a number of lakes and rivers. The city is also home to a number of parks and green spaces, including the City Center Park, which is located in the heart of the city.
Economy
City Center is home to a variety of businesses, including retail stores, restaurants, and other services. The city is also home to a number of corporate headquarters, including Target Corporation and Best Buy. The city is also home to a number of medical facilities, including the University of Minnesota Medical Center.
Demographics
As of the 2010 census, City Center had a population of 8,000 people. The population is predominantly white, with a small percentage of African Americans, Asians, and other ethnicities. The median household income in the city is $50,000, and the median home value is $200,000.
Conclusion
City Center, Minnesota is a small city located in the heart of the state. It is home to a population of approximately 8,000 people, and is known for its vibrant downtown area. The city has a rich history, and is home to a variety of businesses, including retail stores, restaurants, and other services. The city is also home to a number of corporate headquarters, and is home to a number of medical facilities. The population is predominantly white, with a small percentage of African Americans, Asians, and other ethnicities. The median household income in the city is $50,000, and the median home value is $200,000.
Common Questions
What is Per Capita Income in Center City?
Per Capita income in Center City is $38,920.
What is the Median Family Income in Center City?
Median Family Income in Center City is $92,344.
What is the Median Household income in Center City?
Median Household Income in Center City is $87,656.
What is Income or Wage Gap in Center City?
Income or Wage Gap in Center City is 22.0%.
Women in Center City earn 78.0 cents for every dollar earned by a man.
What is Inequality or Gini Index in Center City?
Inequality or Gini Index in Center City is 0.35.
What is the Total Population of Center City?
Total Population of Center City is 624.
What is the Total Male Population of Center City?
Total Male Population of Center City is 335.
What is the Total Female Population of Center City?
Total Female Population of Center City is 289.
What is the Ratio of Males per 100 Females in Center City?
There are 115.92 Males per 100 Females in Center City.
What is the Ratio of Females per 100 Males in Center City?
There are 86.27 Females per 100 Males in Center City.
What is the Median Population Age in Center City?
Median Population Age in Center City is 48.3 Years.
What is the Average Family Size in Center City
Average Family Size in Center City is 2.9 People.
What is the Average Household Size in Center City
Average Household Size in Center City is 2.4 People.
How Large is the Labor Force in Center City?
There are 317 People in the Labor Forcein in Center City.
What is the Percentage of People in the Labor Force in Center City?
60.7% of People are in the Labor Force in Center City.
What is the Unemployment Rate in Center City?
Unemployment Rate in Center City is 9.1%.