Zip Codes with the Lowest Births per 1,000 Women in Labor Force in Lexington, KY
RELATED REPORTS & OPTIONS
Lowest Birth Rate | In Labor Force
Lexington
Compare Zip Codes
Map of Zip Codes with the Lowest Births per 1,000 Women in Labor Force in Lexington
100.0
10.0
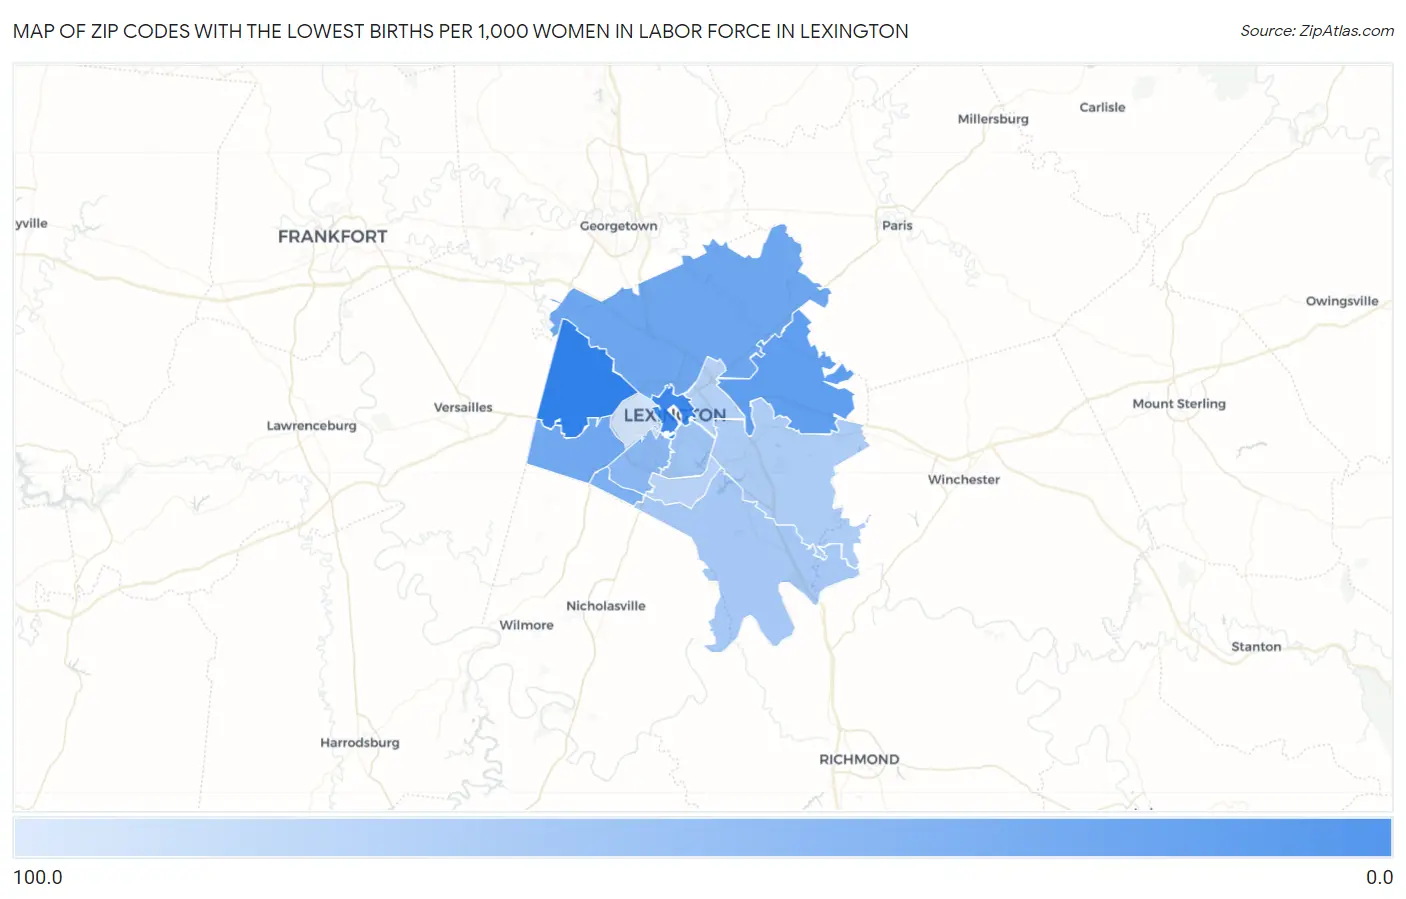
Zip Codes with the Lowest Births per 1,000 Women in Labor Force in Lexington, KY
| Zip Code | Births / 1,000 Women | vs State | vs National | |
| 1. | 40508 | 10.0 | 50.0(-40.0)#15 | 48.0(-38.0)#681 |
| 2. | 40516 | 18.0 | 50.0(-32.0)#39 | 48.0(-30.0)#2,255 |
| 3. | 40511 | 22.0 | 50.0(-28.0)#50 | 48.0(-26.0)#3,084 |
| 4. | 40513 | 23.0 | 50.0(-27.0)#56 | 48.0(-25.0)#3,417 |
| 5. | 40514 | 29.0 | 50.0(-21.0)#81 | 48.0(-19.0)#5,114 |
| 6. | 40503 | 34.0 | 50.0(-16.0)#103 | 48.0(-14.0)#6,641 |
| 7. | 40502 | 47.0 | 50.0(-3.00)#172 | 48.0(-1.000)#10,847 |
| 8. | 40515 | 52.0 | 50.0(+2.00)#197 | 48.0(+4.00)#12,281 |
| 9. | 40509 | 57.0 | 50.0(+7.00)#218 | 48.0(+9.00)#13,673 |
| 10. | 40505 | 64.0 | 50.0(+14.0)#245 | 48.0(+16.0)#15,306 |
| 11. | 40517 | 69.0 | 50.0(+19.0)#269 | 48.0(+21.0)#16,265 |
| 12. | 40504 | 100.0 | 50.0(+50.0)#323 | 48.0(+52.0)#19,707 |
1
Common Questions
What are the Top 10 Zip Codes with the Lowest Births per 1,000 Women in Labor Force in Lexington, KY?
Top 10 Zip Codes with the Lowest Births per 1,000 Women in Labor Force in Lexington, KY are:
What zip code has the Lowest Births per 1,000 Women in Labor Force in Lexington, KY?
40508 has the Lowest Births per 1,000 Women in Labor Force in Lexington, KY with 10.0.
What is the Number Births per 1,000 Women in Labor Force in Lexington, KY?
Number Births per 1,000 Women in Labor Force in Lexington is 47.0.
What is the Number Births per 1,000 Women in Labor Force in Kentucky?
Number Births per 1,000 Women in Labor Force in Kentucky is 50.0.
What is the Number Births per 1,000 Women in Labor Force in the United States?
Number Births per 1,000 Women in Labor Force in the United States is 48.0.