Zip Codes with the Highest Percentage of Population with a Degree in Psychology in Indianapolis, IN
RELATED REPORTS & OPTIONS
Psychology
Indianapolis
Compare Zip Codes
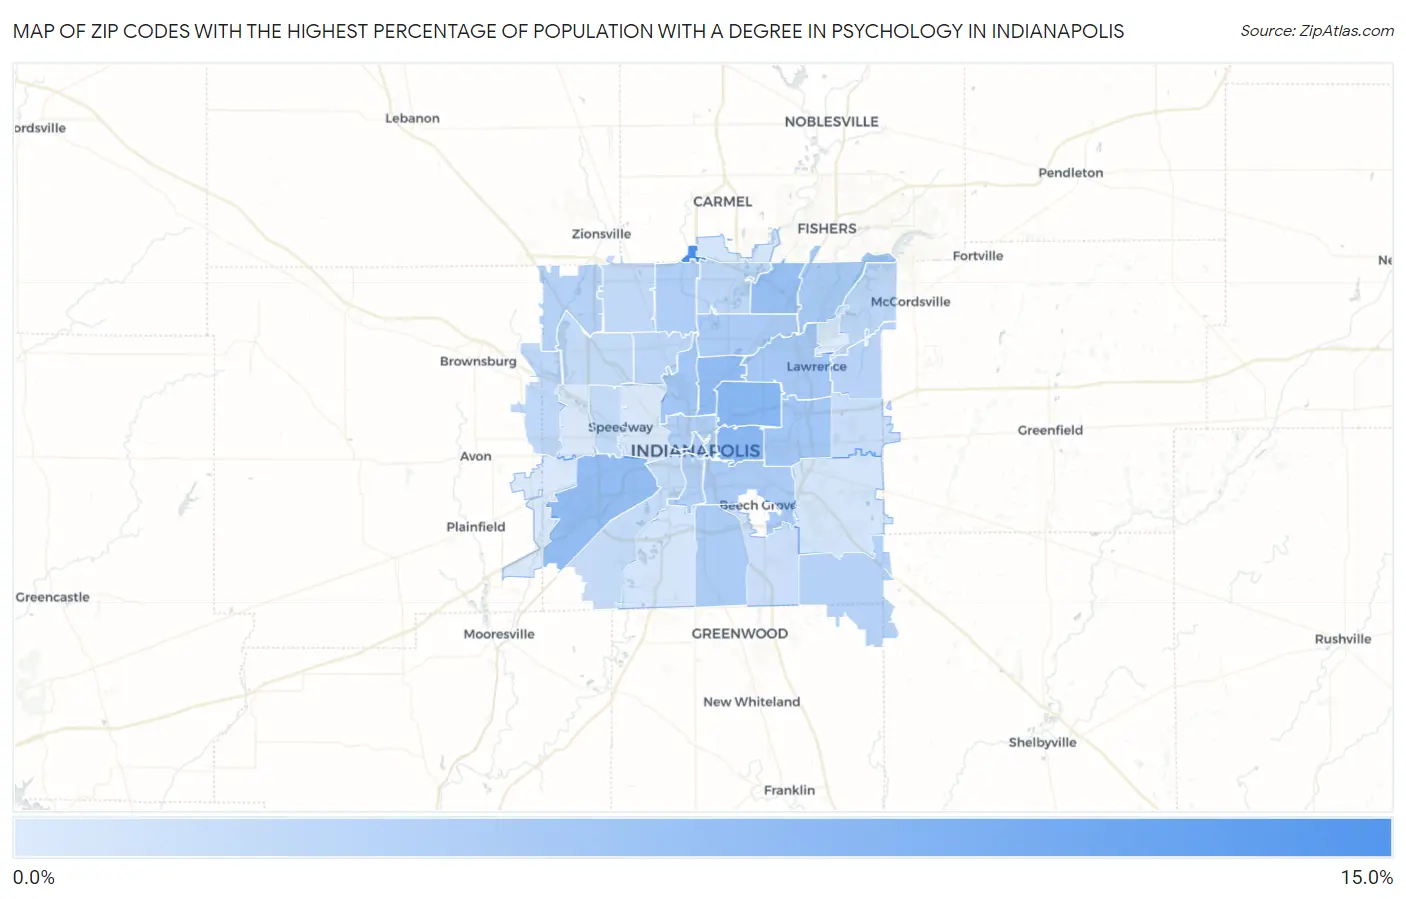
Map of Zip Codes with the Highest Percentage of Population with a Degree in Psychology in Indianapolis
1.6%
13.3%
Zip Codes with the Highest Percentage of Population with a Degree in Psychology in Indianapolis, IN
| Zip Code | % Graduates | vs State | vs National | |
| 1. | 46290 | 13.3% | 4.1%(+9.22)#30 | 5.1%(+8.28)#1,417 |
| 2. | 46218 | 8.1% | 4.1%(+3.96)#75 | 5.1%(+3.02)#4,042 |
| 3. | 46201 | 7.9% | 4.1%(+3.81)#79 | 5.1%(+2.87)#4,230 |
| 4. | 46205 | 7.3% | 4.1%(+3.23)#91 | 5.1%(+2.30)#5,062 |
| 5. | 46241 | 7.3% | 4.1%(+3.17)#92 | 5.1%(+2.23)#5,165 |
| 6. | 46250 | 6.8% | 4.1%(+2.65)#101 | 5.1%(+1.71)#6,083 |
| 7. | 46208 | 6.0% | 4.1%(+1.84)#134 | 5.1%(+0.903)#8,082 |
| 8. | 46219 | 5.9% | 4.1%(+1.81)#135 | 5.1%(+0.876)#8,171 |
| 9. | 46226 | 5.8% | 4.1%(+1.66)#145 | 5.1%(+0.726)#8,648 |
| 10. | 46256 | 5.7% | 4.1%(+1.56)#148 | 5.1%(+0.621)#8,969 |
| 11. | 46220 | 5.4% | 4.1%(+1.32)#158 | 5.1%(+0.385)#9,723 |
| 12. | 46203 | 5.3% | 4.1%(+1.22)#165 | 5.1%(+0.278)#10,073 |
| 13. | 46227 | 5.3% | 4.1%(+1.17)#166 | 5.1%(+0.234)#10,205 |
| 14. | 46260 | 4.9% | 4.1%(+0.818)#186 | 5.1%(-0.120)#11,521 |
| 15. | 46204 | 4.9% | 4.1%(+0.779)#189 | 5.1%(-0.159)#11,652 |
| 16. | 46202 | 4.9% | 4.1%(+0.757)#192 | 5.1%(-0.181)#11,722 |
| 17. | 46225 | 4.7% | 4.1%(+0.584)#200 | 5.1%(-0.354)#12,329 |
| 18. | 46278 | 4.5% | 4.1%(+0.376)#216 | 5.1%(-0.562)#13,143 |
| 19. | 46259 | 4.4% | 4.1%(+0.334)#219 | 5.1%(-0.604)#13,313 |
| 20. | 46235 | 4.4% | 4.1%(+0.280)#223 | 5.1%(-0.658)#13,502 |
| 21. | 46228 | 4.1% | 4.1%(-0.050)#255 | 5.1%(-0.988)#14,700 |
| 22. | 46236 | 4.0% | 4.1%(-0.105)#260 | 5.1%(-1.04)#14,891 |
| 23. | 46240 | 3.9% | 4.1%(-0.204)#263 | 5.1%(-1.14)#15,253 |
| 24. | 46234 | 3.8% | 4.1%(-0.355)#276 | 5.1%(-1.29)#15,768 |
| 25. | 46268 | 3.6% | 4.1%(-0.471)#292 | 5.1%(-1.41)#16,176 |
| 26. | 46254 | 3.4% | 4.1%(-0.667)#308 | 5.1%(-1.61)#16,875 |
| 27. | 46224 | 3.4% | 4.1%(-0.713)#315 | 5.1%(-1.65)#17,002 |
| 28. | 46221 | 3.4% | 4.1%(-0.727)#318 | 5.1%(-1.66)#17,043 |
| 29. | 46229 | 3.2% | 4.1%(-0.943)#335 | 5.1%(-1.88)#17,744 |
| 30. | 46237 | 3.0% | 4.1%(-1.15)#358 | 5.1%(-2.08)#18,332 |
| 31. | 46280 | 2.2% | 4.1%(-1.87)#407 | 5.1%(-2.80)#20,261 |
| 32. | 46217 | 2.2% | 4.1%(-1.87)#408 | 5.1%(-2.81)#20,274 |
| 33. | 46239 | 2.2% | 4.1%(-1.93)#412 | 5.1%(-2.86)#20,414 |
| 34. | 46214 | 2.0% | 4.1%(-2.15)#423 | 5.1%(-3.09)#20,886 |
| 35. | 46222 | 1.9% | 4.1%(-2.22)#431 | 5.1%(-3.16)#21,033 |
| 36. | 46231 | 1.8% | 4.1%(-2.34)#440 | 5.1%(-3.28)#21,293 |
| 37. | 46216 | 1.6% | 4.1%(-2.54)#451 | 5.1%(-3.48)#21,669 |
1
Common Questions
What are the Top 10 Zip Codes with the Highest Percentage of Population with a Degree in Psychology in Indianapolis, IN?
Top 10 Zip Codes with the Highest Percentage of Population with a Degree in Psychology in Indianapolis, IN are:
What zip code has the Highest Percentage of Population with a Degree in Psychology in Indianapolis, IN?
46290 has the Highest Percentage of Population with a Degree in Psychology in Indianapolis, IN with 13.3%.
What is the Percentage of Population with a Degree in Psychology in Indianapolis, IN?
Percentage of Population with a Degree in Psychology in Indianapolis is 4.7%.
What is the Percentage of Population with a Degree in Psychology in Indiana?
Percentage of Population with a Degree in Psychology in Indiana is 4.1%.
What is the Percentage of Population with a Degree in Psychology in the United States?
Percentage of Population with a Degree in Psychology in the United States is 5.1%.