Glenwood, IN Map & Demographics
Glenwood Map
Glenwood Overview
$28,927
PER CAPITA INCOME
$65,750
AVG FAMILY INCOME
$64,375
AVG HOUSEHOLD INCOME
28.5%
WAGE / INCOME GAP [ % ]
71.5¢/ $1
WAGE / INCOME GAP [ $ ]
0.35
INEQUALITY / GINI INDEX
403
TOTAL POPULATION
212
MALE POPULATION
191
FEMALE POPULATION
110.99
MALES / 100 FEMALES
90.09
FEMALES / 100 MALES
49.5
MEDIAN AGE
2.6
AVG FAMILY SIZE
2.4
AVG HOUSEHOLD SIZE
270
LABOR FORCE [ PEOPLE ]
73.4%
PERCENT IN LABOR FORCE
2.6%
UNEMPLOYMENT RATE
Glenwood Zip Codes
Glenwood Area Codes
Income in Glenwood
Income Overview in Glenwood
Per Capita Income in Glenwood is $28,927, while median incomes of families and households are $65,750 and $64,375 respectively.
| Characteristic | Number | Measure |
| Per Capita Income | 403 | $28,927 |
| Median Family Income | 119 | $65,750 |
| Mean Family Income | 119 | $70,092 |
| Median Household Income | 171 | $64,375 |
| Mean Household Income | 171 | $62,774 |
| Income Deficit | 119 | $0 |
| Wage / Income Gap (%) | 403 | 28.54% |
| Wage / Income Gap ($) | 403 | 71.46¢ per $1 |
| Gini / Inequality Index | 403 | 0.35 |
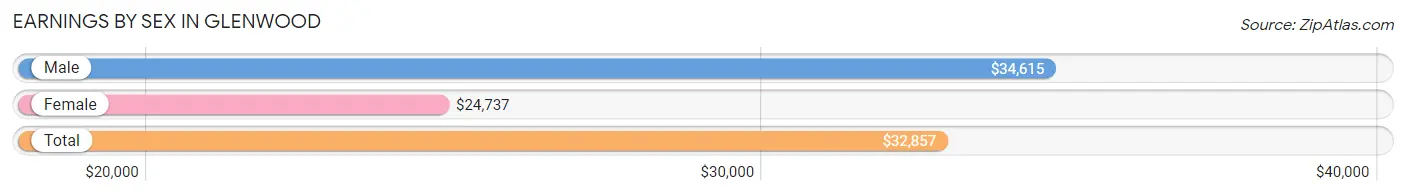
Earnings by Sex in Glenwood
Average Earnings in Glenwood are $32,857, $34,615 for men and $24,737 for women, a difference of 28.5%.
| Sex | Number | Average Earnings |
| Male | 128 (48.1%) | $34,615 |
| Female | 138 (51.9%) | $24,737 |
| Total | 266 (100.0%) | $32,857 |
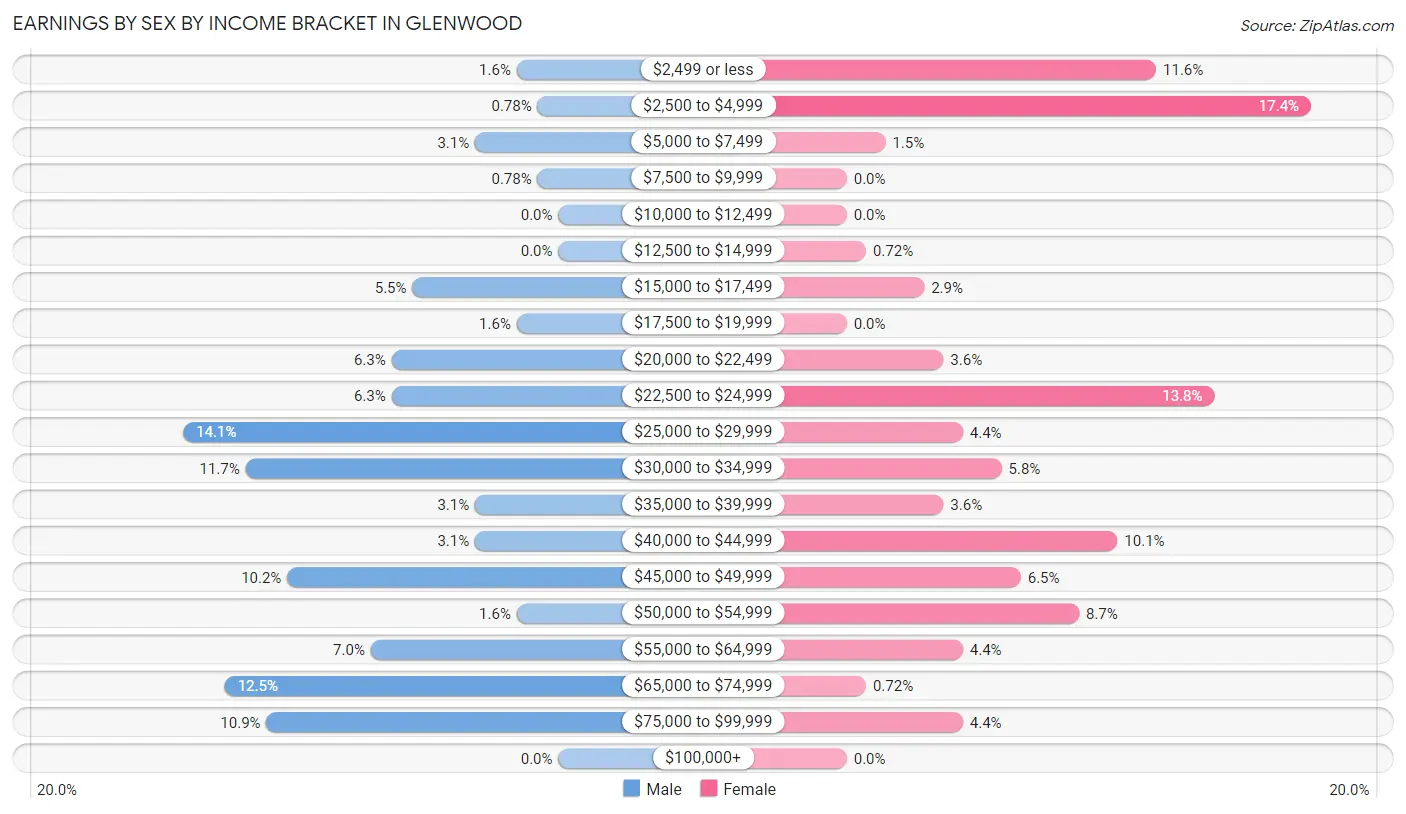
Earnings by Sex by Income Bracket in Glenwood
The most common earnings brackets in Glenwood are $25,000 to $29,999 for men (18 | 14.1%) and $2,500 to $4,999 for women (24 | 17.4%).
| Income | Male | Female |
| $2,499 or less | 2 (1.6%) | 16 (11.6%) |
| $2,500 to $4,999 | 1 (0.8%) | 24 (17.4%) |
| $5,000 to $7,499 | 4 (3.1%) | 2 (1.5%) |
| $7,500 to $9,999 | 1 (0.8%) | 0 (0.0%) |
| $10,000 to $12,499 | 0 (0.0%) | 0 (0.0%) |
| $12,500 to $14,999 | 0 (0.0%) | 1 (0.7%) |
| $15,000 to $17,499 | 7 (5.5%) | 4 (2.9%) |
| $17,500 to $19,999 | 2 (1.6%) | 0 (0.0%) |
| $20,000 to $22,499 | 8 (6.2%) | 5 (3.6%) |
| $22,500 to $24,999 | 8 (6.2%) | 19 (13.8%) |
| $25,000 to $29,999 | 18 (14.1%) | 6 (4.3%) |
| $30,000 to $34,999 | 15 (11.7%) | 8 (5.8%) |
| $35,000 to $39,999 | 4 (3.1%) | 5 (3.6%) |
| $40,000 to $44,999 | 4 (3.1%) | 14 (10.1%) |
| $45,000 to $49,999 | 13 (10.2%) | 9 (6.5%) |
| $50,000 to $54,999 | 2 (1.6%) | 12 (8.7%) |
| $55,000 to $64,999 | 9 (7.0%) | 6 (4.3%) |
| $65,000 to $74,999 | 16 (12.5%) | 1 (0.7%) |
| $75,000 to $99,999 | 14 (10.9%) | 6 (4.3%) |
| $100,000+ | 0 (0.0%) | 0 (0.0%) |
| Total | 128 (100.0%) | 138 (100.0%) |
Earnings by Sex by Educational Attainment in Glenwood
Average earnings in Glenwood are $45,795 for men and $26,250 for women, a difference of 42.7%. Men with an educational attainment of high school diploma enjoy the highest average annual earnings of $41,875, while those with high school diploma education earn the least with $41,875. Women with an educational attainment of college or associate's degree earn the most with the average annual earnings of $24,338, while those with college or associate's degree education have the smallest earnings of $24,338.

| Educational Attainment | Male Income | Female Income |
| Less than High School | - | - |
| High School Diploma | $41,875 | $0 |
| College or Associate's Degree | - | - |
| Bachelor's Degree | - | - |
| Graduate Degree | - | - |
| Total | $45,795 | $26,250 |
Family Income in Glenwood
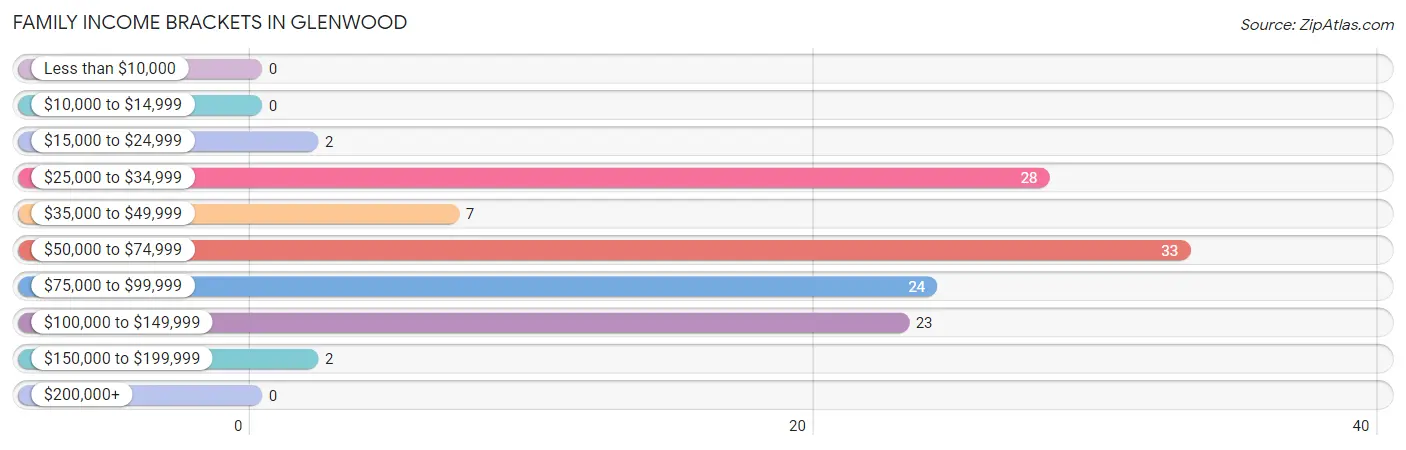
Family Income Brackets in Glenwood
According to the Glenwood family income data, there are 33 families falling into the $50,000 to $74,999 income range, which is the most common income bracket and makes up 27.7% of all families.
| Income Bracket | # Families | % Families |
| Less than $10,000 | 0 | 0.0% |
| $10,000 to $14,999 | 0 | 0.0% |
| $15,000 to $24,999 | 2 | 1.7% |
| $25,000 to $34,999 | 28 | 23.5% |
| $35,000 to $49,999 | 7 | 5.9% |
| $50,000 to $74,999 | 33 | 27.7% |
| $75,000 to $99,999 | 24 | 20.2% |
| $100,000 to $149,999 | 23 | 19.3% |
| $150,000 to $199,999 | 2 | 1.7% |
| $200,000+ | 0 | 0.0% |
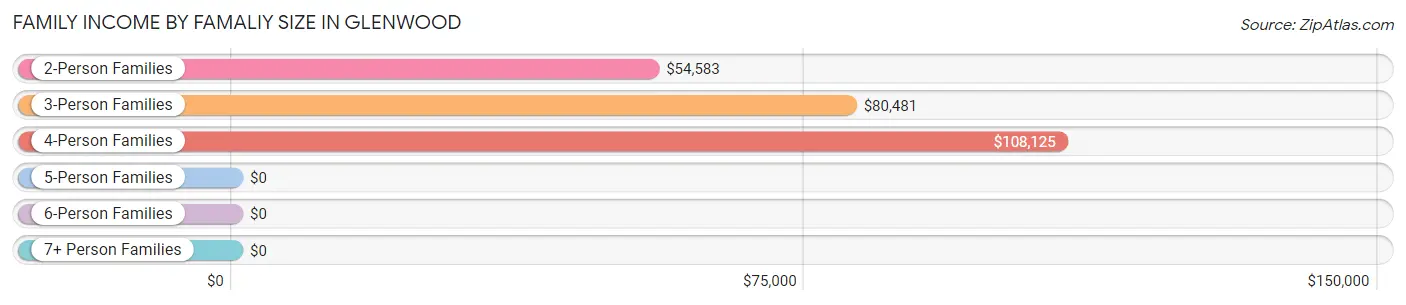
Family Income by Famaliy Size in Glenwood
4-person families (11 | 9.2%) account for the highest median family income in Glenwood with $108,125 per family, while 2-person families (75 | 63.0%) have the highest median income of $27,292 per family member.
| Income Bracket | # Families | Median Income |
| 2-Person Families | 75 (63.0%) | $54,583 |
| 3-Person Families | 25 (21.0%) | $80,481 |
| 4-Person Families | 11 (9.2%) | $108,125 |
| 5-Person Families | 8 (6.7%) | $0 |
| 6-Person Families | 0 (0.0%) | $0 |
| 7+ Person Families | 0 (0.0%) | $0 |
| Total | 119 (100.0%) | $65,750 |
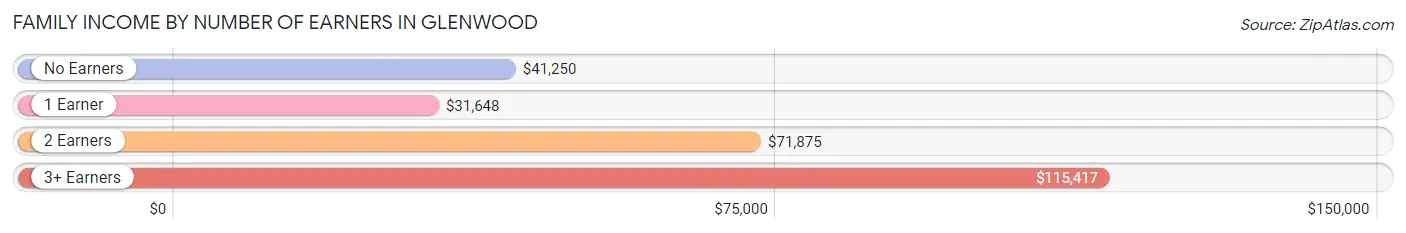
Family Income by Number of Earners in Glenwood
The median family income in Glenwood is $65,750, with families comprising 3+ earners (21) having the highest median family income of $115,417, while families with 1 earner (37) have the lowest median family income of $31,648, accounting for 17.6% and 31.1% of families, respectively.
| Number of Earners | # Families | Median Income |
| No Earners | 12 (10.1%) | $41,250 |
| 1 Earner | 37 (31.1%) | $31,648 |
| 2 Earners | 49 (41.2%) | $71,875 |
| 3+ Earners | 21 (17.6%) | $115,417 |
| Total | 119 (100.0%) | $65,750 |
Household Income in Glenwood
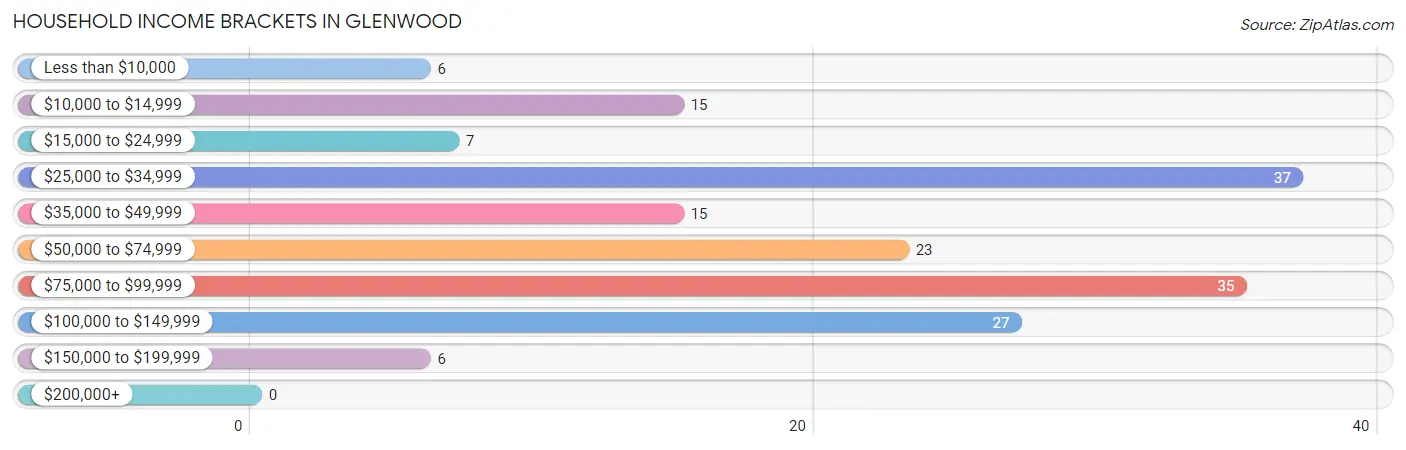
Household Income Brackets in Glenwood
With 37 households falling in the category, the $25,000 to $34,999 income range is the most frequent in Glenwood, accounting for 21.6% of all households.
| Income Bracket | # Households | % Households |
| Less than $10,000 | 6 | 3.5% |
| $10,000 to $14,999 | 15 | 8.8% |
| $15,000 to $24,999 | 7 | 4.1% |
| $25,000 to $34,999 | 37 | 21.6% |
| $35,000 to $49,999 | 15 | 8.8% |
| $50,000 to $74,999 | 23 | 13.5% |
| $75,000 to $99,999 | 35 | 20.5% |
| $100,000 to $149,999 | 27 | 15.8% |
| $150,000 to $199,999 | 6 | 3.5% |
| $200,000+ | 0 | 0.0% |
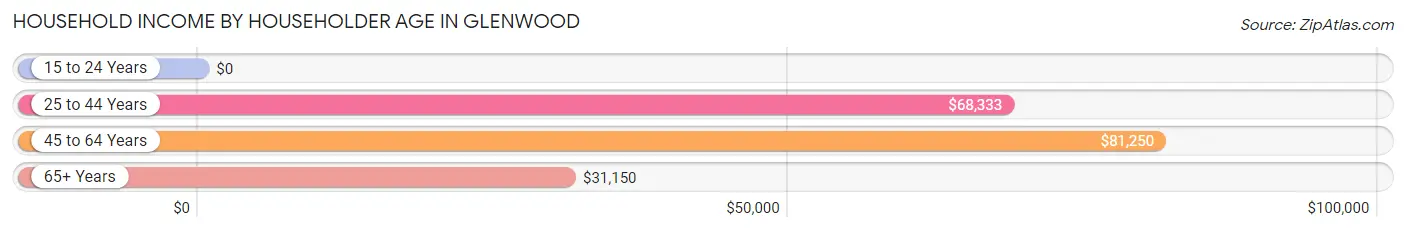
Household Income by Householder Age in Glenwood
The median household income in Glenwood is $64,375, with the highest median household income of $81,250 found in the 45 to 64 years age bracket for the primary householder. A total of 64 households (37.4%) fall into this category. Meanwhile, the 15 to 24 years age bracket for the primary householder has the lowest median household income of $0, with 8 households (4.7%) in this group.
| Income Bracket | # Households | Median Income |
| 15 to 24 Years | 8 (4.7%) | $0 |
| 25 to 44 Years | 36 (21.0%) | $68,333 |
| 45 to 64 Years | 64 (37.4%) | $81,250 |
| 65+ Years | 63 (36.8%) | $31,150 |
| Total | 171 (100.0%) | $64,375 |
Poverty in Glenwood
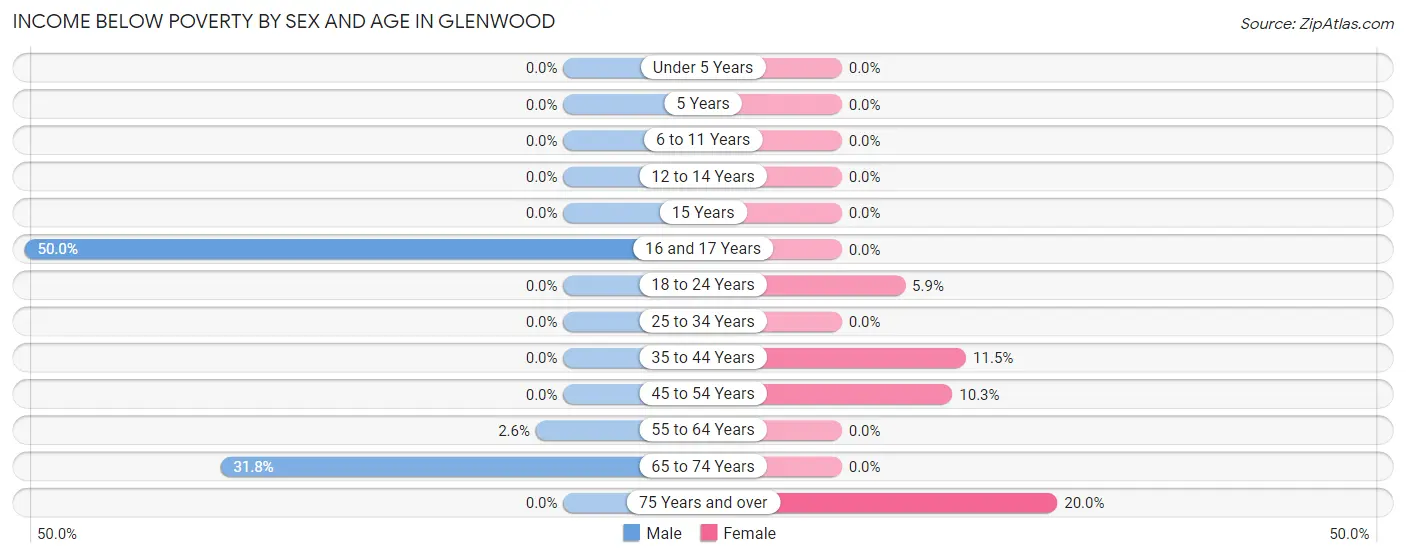
Income Below Poverty by Sex and Age in Glenwood
With 8.0% poverty level for males and 5.9% for females among the residents of Glenwood, 16 and 17 year old males and 75 year old and over females are the most vulnerable to poverty, with 2 males (50.0%) and 3 females (20.0%) in their respective age groups living below the poverty level.
| Age Bracket | Male | Female |
| Under 5 Years | 0 (0.0%) | 0 (0.0%) |
| 5 Years | 0 (0.0%) | 0 (0.0%) |
| 6 to 11 Years | 0 (0.0%) | 0 (0.0%) |
| 12 to 14 Years | 0 (0.0%) | 0 (0.0%) |
| 15 Years | 0 (0.0%) | 0 (0.0%) |
| 16 and 17 Years | 2 (50.0%) | 0 (0.0%) |
| 18 to 24 Years | 0 (0.0%) | 1 (5.9%) |
| 25 to 34 Years | 0 (0.0%) | 0 (0.0%) |
| 35 to 44 Years | 0 (0.0%) | 3 (11.5%) |
| 45 to 54 Years | 0 (0.0%) | 4 (10.3%) |
| 55 to 64 Years | 1 (2.6%) | 0 (0.0%) |
| 65 to 74 Years | 14 (31.8%) | 0 (0.0%) |
| 75 Years and over | 0 (0.0%) | 3 (20.0%) |
| Total | 17 (8.0%) | 11 (5.9%) |
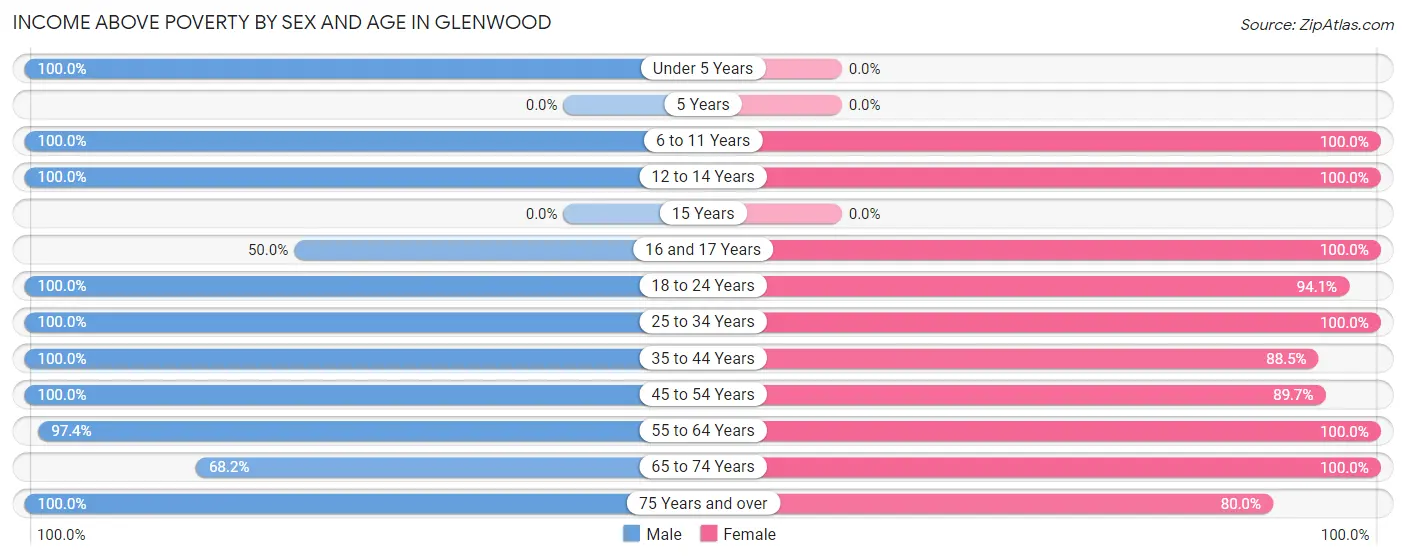
Income Above Poverty by Sex and Age in Glenwood
According to the poverty statistics in Glenwood, males aged under 5 years and females aged 6 to 11 years are the age groups that are most secure financially, with 100.0% of males and 100.0% of females in these age groups living above the poverty line.
| Age Bracket | Male | Female |
| Under 5 Years | 2 (100.0%) | 0 (0.0%) |
| 5 Years | 0 (0.0%) | 0 (0.0%) |
| 6 to 11 Years | 13 (100.0%) | 10 (100.0%) |
| 12 to 14 Years | 5 (100.0%) | 2 (100.0%) |
| 15 Years | 0 (0.0%) | 0 (0.0%) |
| 16 and 17 Years | 2 (50.0%) | 7 (100.0%) |
| 18 to 24 Years | 25 (100.0%) | 16 (94.1%) |
| 25 to 34 Years | 12 (100.0%) | 3 (100.0%) |
| 35 to 44 Years | 21 (100.0%) | 23 (88.5%) |
| 45 to 54 Years | 36 (100.0%) | 35 (89.7%) |
| 55 to 64 Years | 38 (97.4%) | 37 (100.0%) |
| 65 to 74 Years | 30 (68.2%) | 32 (100.0%) |
| 75 Years and over | 11 (100.0%) | 12 (80.0%) |
| Total | 195 (92.0%) | 177 (94.2%) |
Income Below Poverty Among Married-Couple Families in Glenwood
| Children | Above Poverty | Below Poverty |
| No Children | 70 (100.0%) | 0 (0.0%) |
| 1 or 2 Children | 25 (100.0%) | 0 (0.0%) |
| 3 or 4 Children | 0 (0.0%) | 0 (0.0%) |
| 5 or more Children | 0 (0.0%) | 0 (0.0%) |
| Total | 95 (100.0%) | 0 (0.0%) |
Income Below Poverty Among Single-Parent Households in Glenwood
| Children | Single Father | Single Mother |
| No Children | 0 (0.0%) | 0 (0.0%) |
| 1 or 2 Children | 0 (0.0%) | 0 (0.0%) |
| 3 or 4 Children | 0 (0.0%) | 0 (0.0%) |
| 5 or more Children | 0 (0.0%) | 0 (0.0%) |
| Total | 0 (0.0%) | 0 (0.0%) |
Income Below Poverty Among Married-Couple vs Single-Parent Households in Glenwood
| Children | Married-Couple Families | Single-Parent Households |
| No Children | 0 (0.0%) | 0 (0.0%) |
| 1 or 2 Children | 0 (0.0%) | 0 (0.0%) |
| 3 or 4 Children | 0 (0.0%) | 0 (0.0%) |
| 5 or more Children | 0 (0.0%) | 0 (0.0%) |
| Total | 0 (0.0%) | 0 (0.0%) |
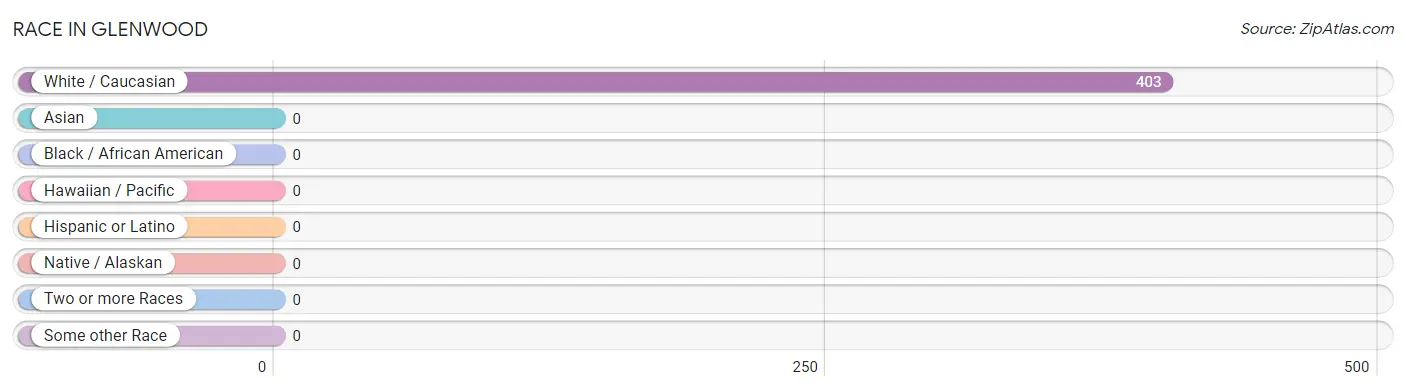
Race in Glenwood
The most populous races in Glenwood are , and White / Caucasian (403 | 100.0%).
| Race | # Population | % Population |
| Asian | 0 | 0.0% |
| Black / African American | 0 | 0.0% |
| Hawaiian / Pacific | 0 | 0.0% |
| Hispanic or Latino | 0 | 0.0% |
| Native / Alaskan | 0 | 0.0% |
| White / Caucasian | 403 | 100.0% |
| Two or more Races | 0 | 0.0% |
| Some other Race | 0 | 0.0% |
| Total | 403 | 100.0% |
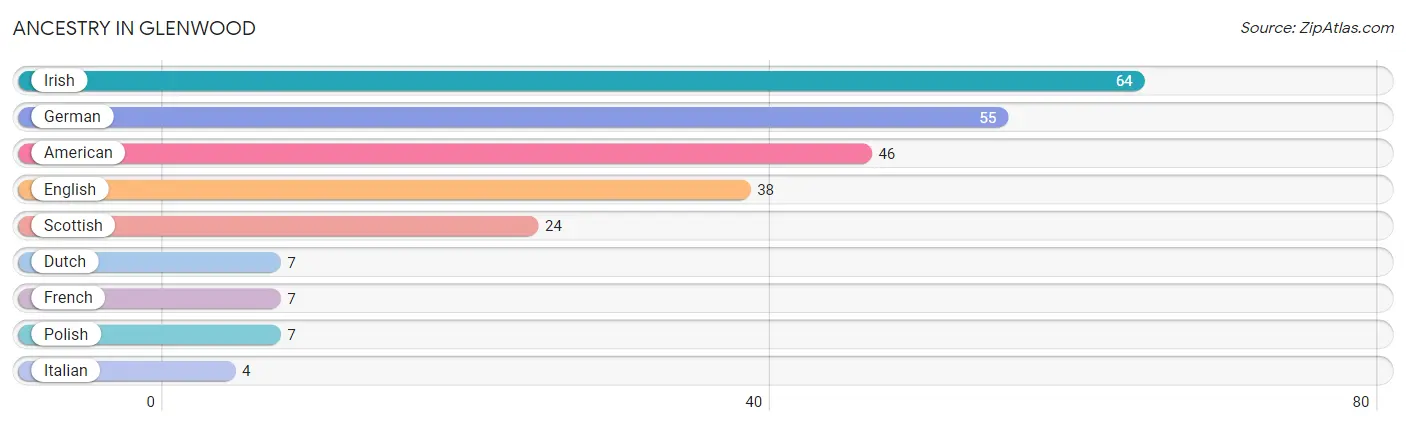
Ancestry in Glenwood
The most populous ancestries reported in Glenwood are Irish (64 | 15.9%), German (55 | 13.7%), American (46 | 11.4%), English (38 | 9.4%), and Scottish (24 | 6.0%), together accounting for 56.3% of all Glenwood residents.
| Ancestry | # Population | % Population |
| American | 46 | 11.4% |
| Dutch | 7 | 1.7% |
| English | 38 | 9.4% |
| French | 7 | 1.7% |
| German | 55 | 13.7% |
| Irish | 64 | 15.9% |
| Italian | 4 | 1.0% |
| Polish | 7 | 1.7% |
| Scottish | 24 | 6.0% | View All 9 Rows |
Immigrants in Glenwood

| Immigration Origin | # Population | % Population | View All 0 Rows |
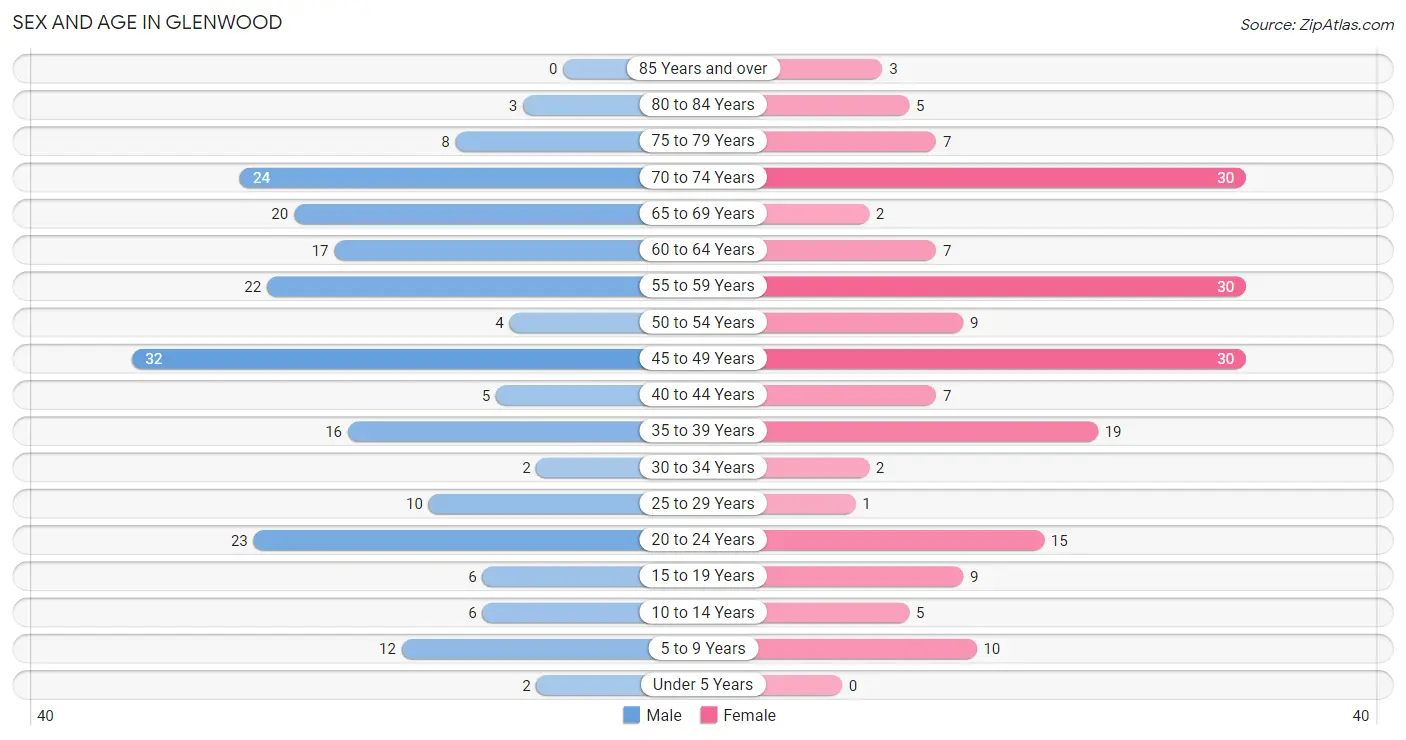
Sex and Age in Glenwood
Sex and Age in Glenwood
The most populous age groups in Glenwood are 45 to 49 Years (32 | 15.1%) for men and 45 to 49 Years (30 | 15.7%) for women.
| Age Bracket | Male | Female |
| Under 5 Years | 2 (0.9%) | 0 (0.0%) |
| 5 to 9 Years | 12 (5.7%) | 10 (5.2%) |
| 10 to 14 Years | 6 (2.8%) | 5 (2.6%) |
| 15 to 19 Years | 6 (2.8%) | 9 (4.7%) |
| 20 to 24 Years | 23 (10.8%) | 15 (7.9%) |
| 25 to 29 Years | 10 (4.7%) | 1 (0.5%) |
| 30 to 34 Years | 2 (0.9%) | 2 (1.1%) |
| 35 to 39 Years | 16 (7.5%) | 19 (10.0%) |
| 40 to 44 Years | 5 (2.4%) | 7 (3.7%) |
| 45 to 49 Years | 32 (15.1%) | 30 (15.7%) |
| 50 to 54 Years | 4 (1.9%) | 9 (4.7%) |
| 55 to 59 Years | 22 (10.4%) | 30 (15.7%) |
| 60 to 64 Years | 17 (8.0%) | 7 (3.7%) |
| 65 to 69 Years | 20 (9.4%) | 2 (1.1%) |
| 70 to 74 Years | 24 (11.3%) | 30 (15.7%) |
| 75 to 79 Years | 8 (3.8%) | 7 (3.7%) |
| 80 to 84 Years | 3 (1.4%) | 5 (2.6%) |
| 85 Years and over | 0 (0.0%) | 3 (1.6%) |
| Total | 212 (100.0%) | 191 (100.0%) |
Families and Households in Glenwood
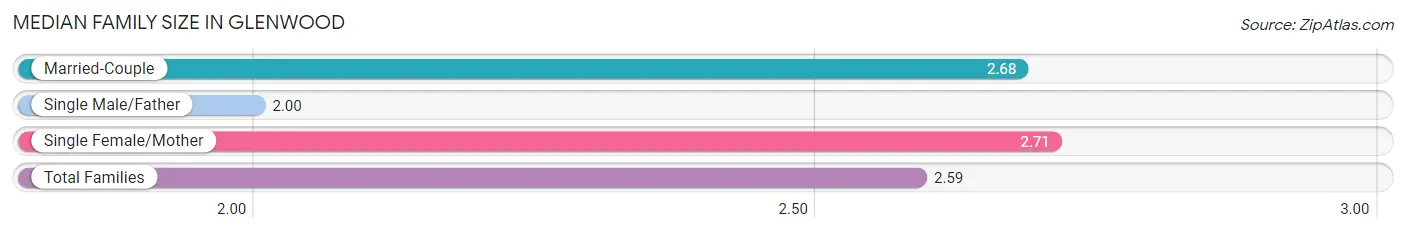
Median Family Size in Glenwood
The median family size in Glenwood is 2.59 persons per family, with single female/mother families (7 | 5.9%) accounting for the largest median family size of 2.71 persons per family. On the other hand, single male/father families (17 | 14.3%) represent the smallest median family size with 2.00 persons per family.
| Family Type | # Families | Family Size |
| Married-Couple | 95 (79.8%) | 2.68 |
| Single Male/Father | 17 (14.3%) | 2.00 |
| Single Female/Mother | 7 (5.9%) | 2.71 |
| Total Families | 119 (100.0%) | 2.59 |
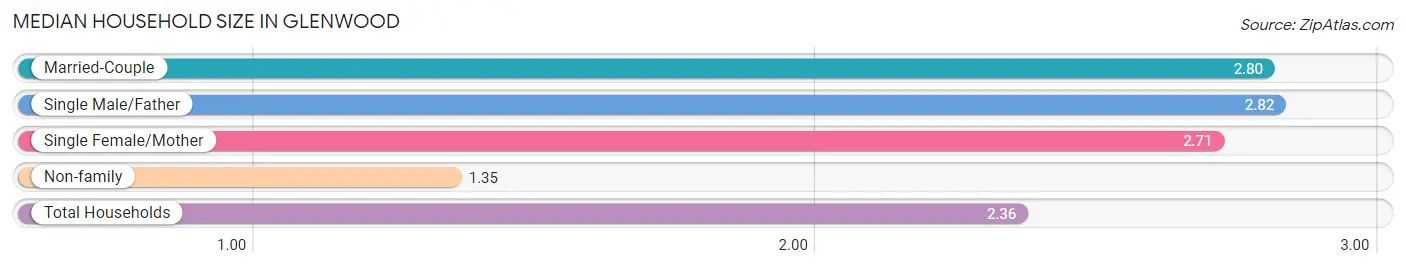
Median Household Size in Glenwood
The median household size in Glenwood is 2.36 persons per household, with single male/father households (17 | 9.9%) accounting for the largest median household size of 2.82 persons per household. non-family households (52 | 30.4%) represent the smallest median household size with 1.35 persons per household.
| Household Type | # Households | Household Size |
| Married-Couple | 95 (55.6%) | 2.80 |
| Single Male/Father | 17 (9.9%) | 2.82 |
| Single Female/Mother | 7 (4.1%) | 2.71 |
| Non-family | 52 (30.4%) | 1.35 |
| Total Households | 171 (100.0%) | 2.36 |
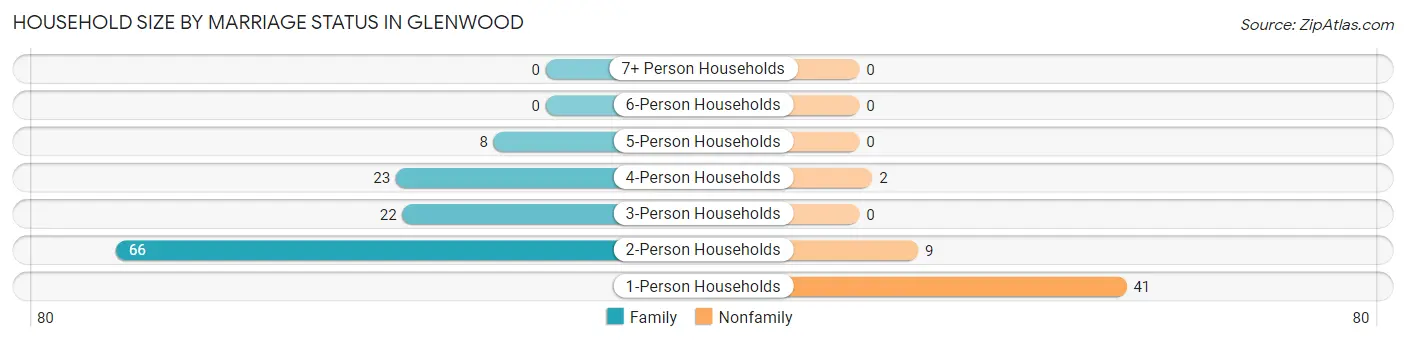
Household Size by Marriage Status in Glenwood
Out of a total of 171 households in Glenwood, 119 (69.6%) are family households, while 52 (30.4%) are nonfamily households. The most numerous type of family households are 2-person households, comprising 66, and the most common type of nonfamily households are 1-person households, comprising 41.
| Household Size | Family Households | Nonfamily Households |
| 1-Person Households | - | 41 (24.0%) |
| 2-Person Households | 66 (38.6%) | 9 (5.3%) |
| 3-Person Households | 22 (12.9%) | 0 (0.0%) |
| 4-Person Households | 23 (13.5%) | 2 (1.2%) |
| 5-Person Households | 8 (4.7%) | 0 (0.0%) |
| 6-Person Households | 0 (0.0%) | 0 (0.0%) |
| 7+ Person Households | 0 (0.0%) | 0 (0.0%) |
| Total | 119 (69.6%) | 52 (30.4%) |
Female Fertility in Glenwood
Fertility by Age in Glenwood
| Age Bracket | Women with Births | Births / 1,000 Women |
| 15 to 19 years | 0 (0.0%) | 0.0 |
| 20 to 34 years | 0 (0.0%) | 0.0 |
| 35 to 50 years | 0 (0.0%) | 0.0 |
| Total | 0 (0.0%) | 0.0 |
Fertility by Age by Marriage Status in Glenwood
| Age Bracket | Married | Unmarried |
| 15 to 19 years | 0 (0.0%) | 0 (0.0%) |
| 20 to 34 years | 0 (0.0%) | 0 (0.0%) |
| 35 to 50 years | 0 (0.0%) | 0 (0.0%) |
| Total | 0 (0.0%) | 0 (0.0%) |
Fertility by Education in Glenwood
| Educational Attainment | Women with Births | Births / 1,000 Women |
| Less than High School | 0 (0.0%) | 0.0 |
| High School Diploma | 0 (0.0%) | 0.0 |
| College or Associate's Degree | 0 (0.0%) | 0.0 |
| Bachelor's Degree | 0 (0.0%) | 0.0 |
| Graduate Degree | 0 (0.0%) | 0.0 |
| Total | 0 (0.0%) | 0.0 |
Fertility by Education by Marriage Status in Glenwood
| Educational Attainment | Married | Unmarried |
| Less than High School | 0 (0.0%) | 0 (0.0%) |
| High School Diploma | 0 (0.0%) | 0 (0.0%) |
| College or Associate's Degree | 0 (0.0%) | 0 (0.0%) |
| Bachelor's Degree | 0 (0.0%) | 0 (0.0%) |
| Graduate Degree | 0 (0.0%) | 0 (0.0%) |
| Total | 0 (0.0%) | 0 (0.0%) |
Employment Characteristics in Glenwood
Employment by Class of Employer in Glenwood
Among the 263 employed individuals in Glenwood, private company employees (189 | 71.9%), self-employed (not incorporated) (32 | 12.2%), and not-for-profit organizations (24 | 9.1%) make up the most common classes of employment.
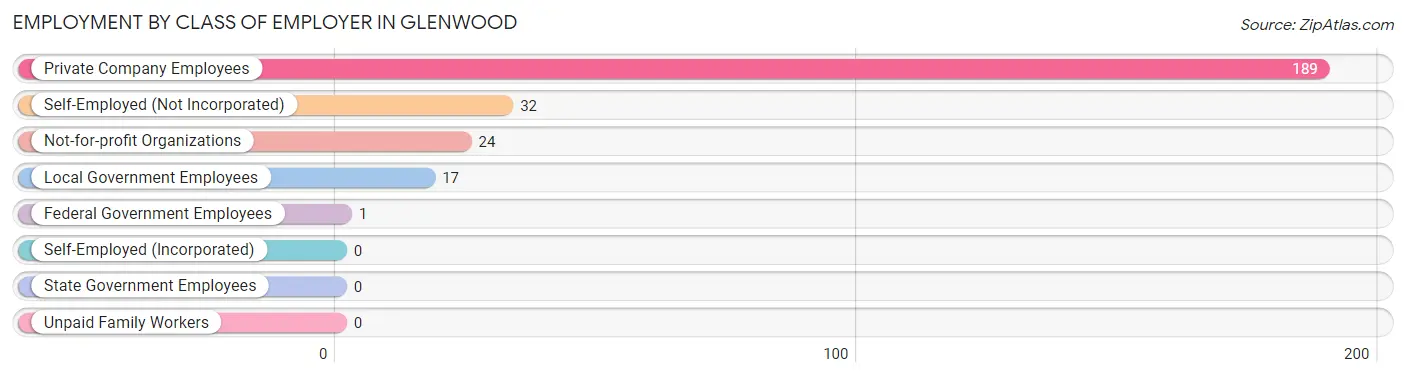
| Employer Class | # Employees | % Employees |
| Private Company Employees | 189 | 71.9% |
| Self-Employed (Incorporated) | 0 | 0.0% |
| Self-Employed (Not Incorporated) | 32 | 12.2% |
| Not-for-profit Organizations | 24 | 9.1% |
| Local Government Employees | 17 | 6.5% |
| State Government Employees | 0 | 0.0% |
| Federal Government Employees | 1 | 0.4% |
| Unpaid Family Workers | 0 | 0.0% |
| Total | 263 | 100.0% |
Employment Status by Age in Glenwood
According to the labor force statistics for Glenwood, out of the total population over 16 years of age (368), 73.4% or 270 individuals are in the labor force, with 2.6% or 7 of them unemployed. The age group with the highest labor force participation rate is 25 to 29 years, with 100.0% or 11 individuals in the labor force. Within the labor force, the 35 to 44 years age range has the highest percentage of unemployed individuals, with 6.8% or 3 of them being unemployed.
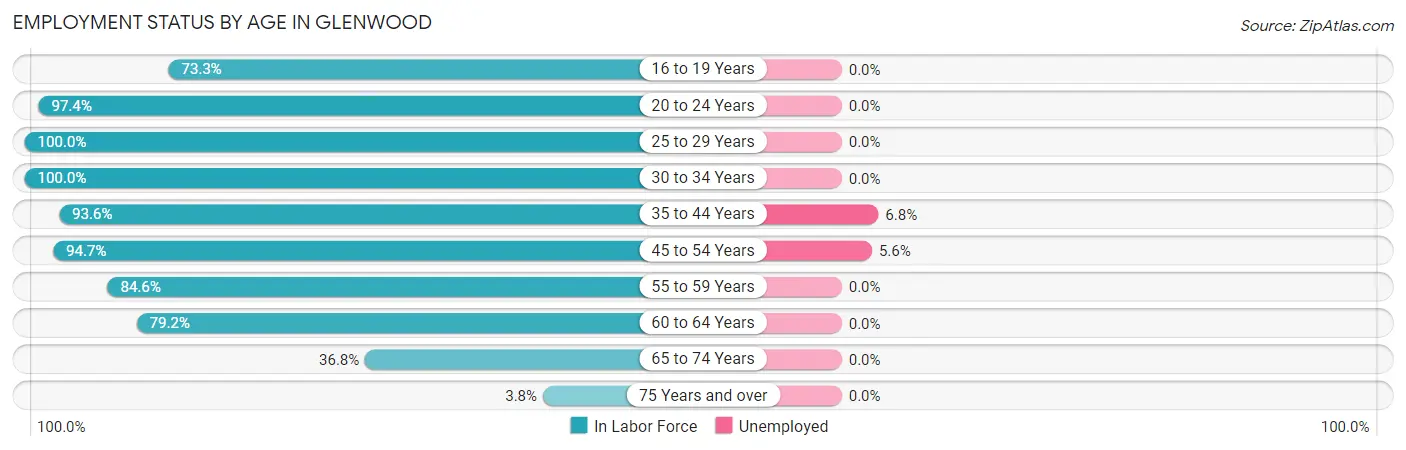
| Age Bracket | In Labor Force | Unemployed |
| 16 to 19 Years | 11 (73.3%) | 0 (0.0%) |
| 20 to 24 Years | 37 (97.4%) | 0 (0.0%) |
| 25 to 29 Years | 11 (100.0%) | 0 (0.0%) |
| 30 to 34 Years | 4 (100.0%) | 0 (0.0%) |
| 35 to 44 Years | 44 (93.6%) | 3 (6.8%) |
| 45 to 54 Years | 71 (94.7%) | 4 (5.6%) |
| 55 to 59 Years | 44 (84.6%) | 0 (0.0%) |
| 60 to 64 Years | 19 (79.2%) | 0 (0.0%) |
| 65 to 74 Years | 28 (36.8%) | 0 (0.0%) |
| 75 Years and over | 1 (3.8%) | 0 (0.0%) |
| Total | 270 (73.4%) | 7 (2.6%) |
Employment Status by Educational Attainment in Glenwood
According to labor force statistics for Glenwood, 90.6% of individuals (193) out of the total population between 25 and 64 years of age (213) are in the labor force, with 3.6% or 7 of them being unemployed. The group with the highest labor force participation rate are those with the educational attainment of bachelor's degree or higher, with 100.0% or 12 individuals in the labor force. Within the labor force, individuals with less than high school education have the highest percentage of unemployment, with 18.8% or 3 of them being unemployed.
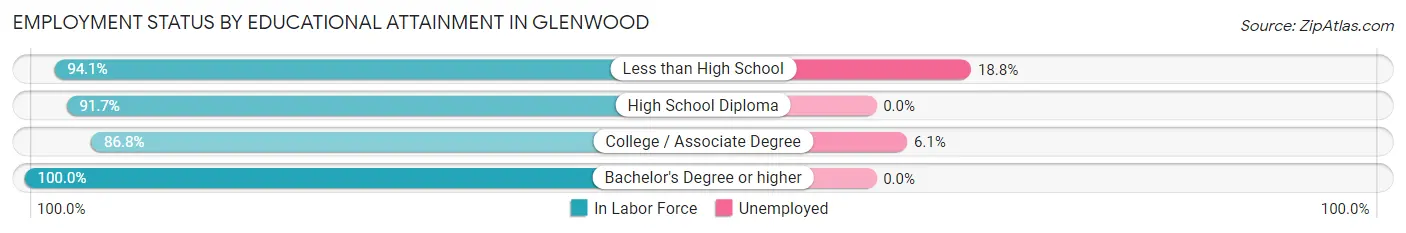
| Educational Attainment | In Labor Force | Unemployed |
| Less than High School | 16 (94.1%) | 3 (18.8%) |
| High School Diploma | 99 (91.7%) | 0 (0.0%) |
| College / Associate Degree | 66 (86.8%) | 5 (6.1%) |
| Bachelor's Degree or higher | 12 (100.0%) | 0 (0.0%) |
| Total | 193 (90.6%) | 8 (3.6%) |
Employment Occupations by Sex in Glenwood
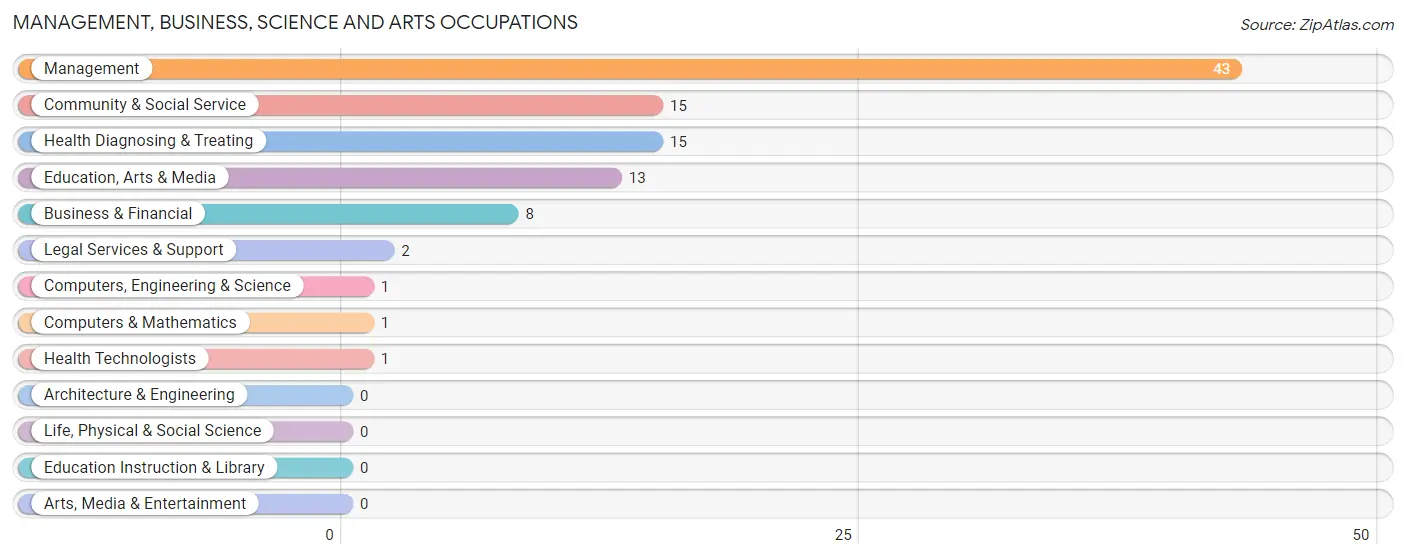
Management, Business, Science and Arts Occupations
The most common Management, Business, Science and Arts occupations in Glenwood are Management (43 | 16.4%), Community & Social Service (15 | 5.7%), Health Diagnosing & Treating (15 | 5.7%), Education, Arts & Media (13 | 4.9%), and Business & Financial (8 | 3.0%).
Management, Business, Science and Arts Occupations by Sex
Within the Management, Business, Science and Arts occupations in Glenwood, the most male-oriented occupations are Health Technologists (100.0%), Management (41.9%), and Health Diagnosing & Treating (20.0%), while the most female-oriented occupations are Business & Financial (100.0%), Computers, Engineering & Science (100.0%), and Computers & Mathematics (100.0%).
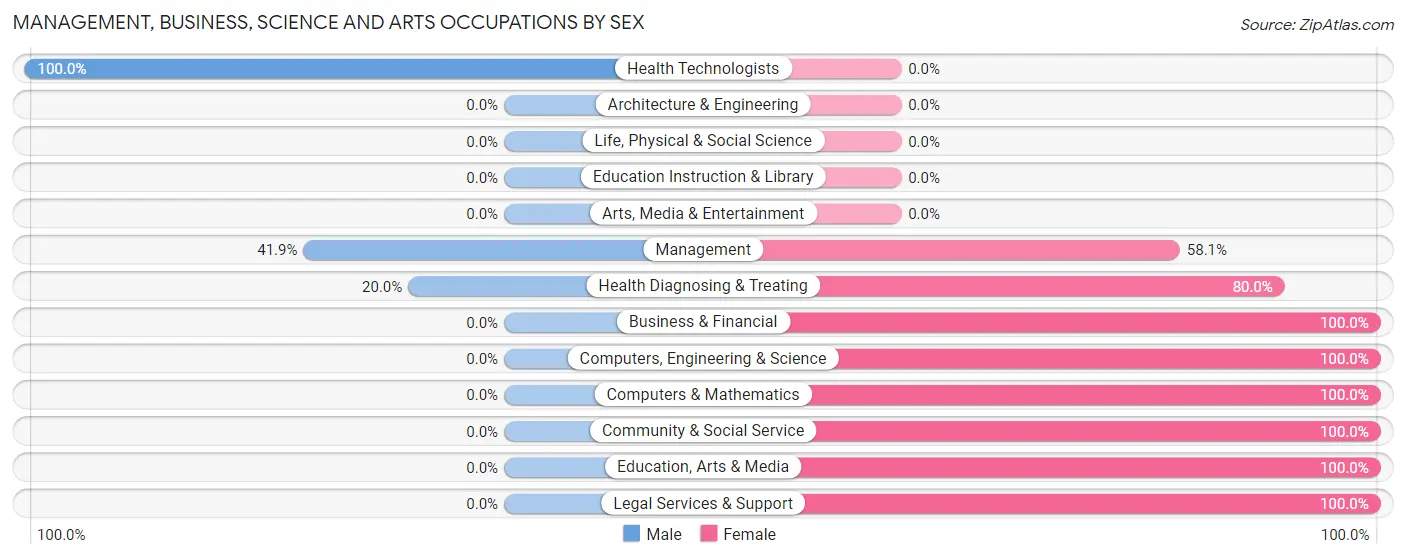
| Occupation | Male | Female |
| Management | 18 (41.9%) | 25 (58.1%) |
| Business & Financial | 0 (0.0%) | 8 (100.0%) |
| Computers, Engineering & Science | 0 (0.0%) | 1 (100.0%) |
| Computers & Mathematics | 0 (0.0%) | 1 (100.0%) |
| Architecture & Engineering | 0 (0.0%) | 0 (0.0%) |
| Life, Physical & Social Science | 0 (0.0%) | 0 (0.0%) |
| Community & Social Service | 0 (0.0%) | 15 (100.0%) |
| Education, Arts & Media | 0 (0.0%) | 13 (100.0%) |
| Legal Services & Support | 0 (0.0%) | 2 (100.0%) |
| Education Instruction & Library | 0 (0.0%) | 0 (0.0%) |
| Arts, Media & Entertainment | 0 (0.0%) | 0 (0.0%) |
| Health Diagnosing & Treating | 3 (20.0%) | 12 (80.0%) |
| Health Technologists | 1 (100.0%) | 0 (0.0%) |
| Total (Category) | 21 (25.6%) | 61 (74.4%) |
| Total (Overall) | 128 (48.7%) | 135 (51.3%) |
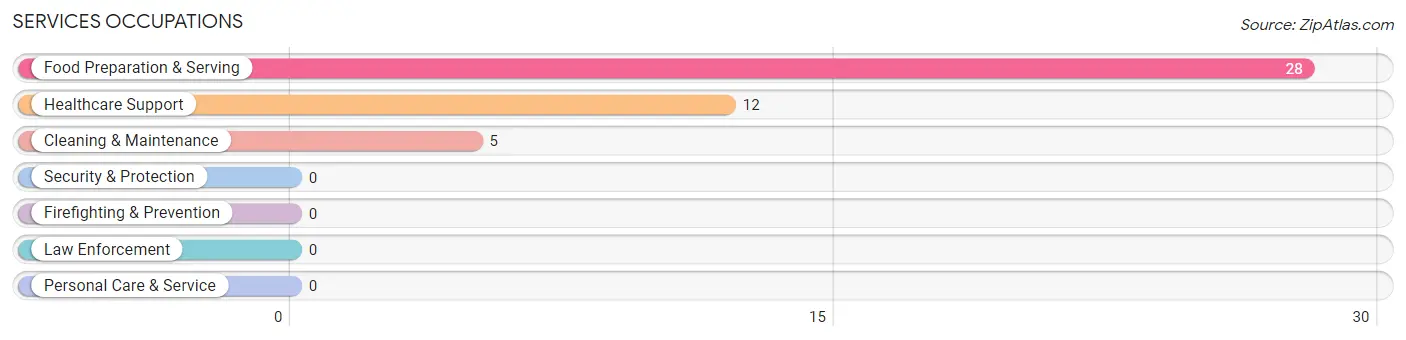
Services Occupations
The most common Services occupations in Glenwood are Food Preparation & Serving (28 | 10.6%), Healthcare Support (12 | 4.6%), and Cleaning & Maintenance (5 | 1.9%).
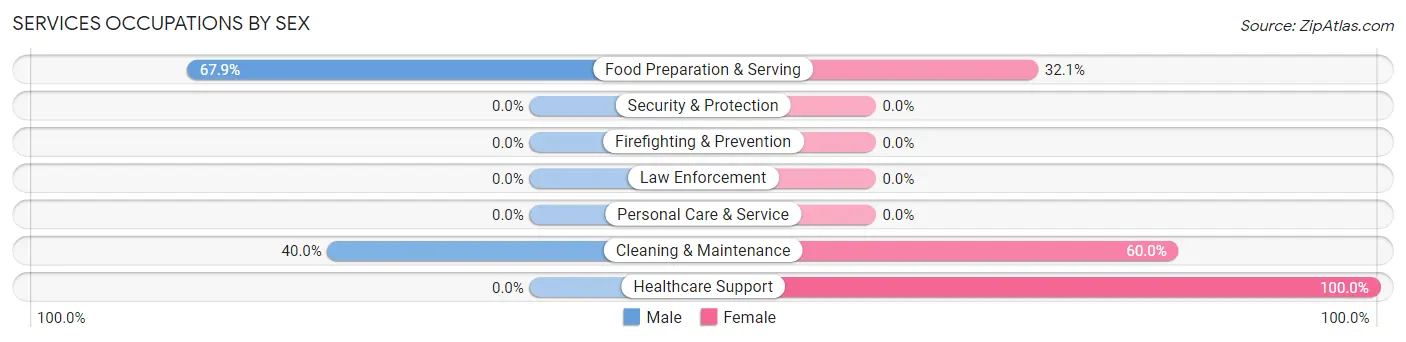
Services Occupations by Sex
Within the Services occupations in Glenwood, the most male-oriented occupations are Food Preparation & Serving (67.9%), and Cleaning & Maintenance (40.0%), while the most female-oriented occupations are Healthcare Support (100.0%), Cleaning & Maintenance (60.0%), and Food Preparation & Serving (32.1%).
| Occupation | Male | Female |
| Healthcare Support | 0 (0.0%) | 12 (100.0%) |
| Security & Protection | 0 (0.0%) | 0 (0.0%) |
| Firefighting & Prevention | 0 (0.0%) | 0 (0.0%) |
| Law Enforcement | 0 (0.0%) | 0 (0.0%) |
| Food Preparation & Serving | 19 (67.9%) | 9 (32.1%) |
| Cleaning & Maintenance | 2 (40.0%) | 3 (60.0%) |
| Personal Care & Service | 0 (0.0%) | 0 (0.0%) |
| Total (Category) | 21 (46.7%) | 24 (53.3%) |
| Total (Overall) | 128 (48.7%) | 135 (51.3%) |
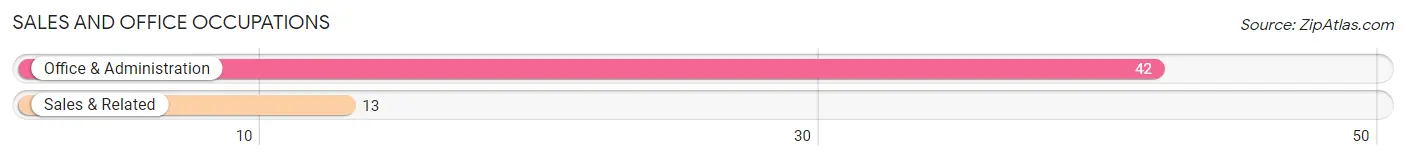
Sales and Office Occupations
The most common Sales and Office occupations in Glenwood are Office & Administration (42 | 16.0%), and Sales & Related (13 | 4.9%).
Sales and Office Occupations by Sex
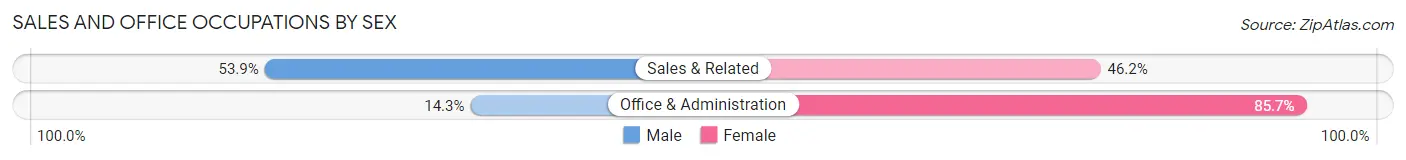
| Occupation | Male | Female |
| Sales & Related | 7 (53.8%) | 6 (46.2%) |
| Office & Administration | 6 (14.3%) | 36 (85.7%) |
| Total (Category) | 13 (23.6%) | 42 (76.4%) |
| Total (Overall) | 128 (48.7%) | 135 (51.3%) |
Natural Resources, Construction and Maintenance Occupations
The most common Natural Resources, Construction and Maintenance occupations in Glenwood are , and Installation, Maintenance & Repair (10 | 3.8%).
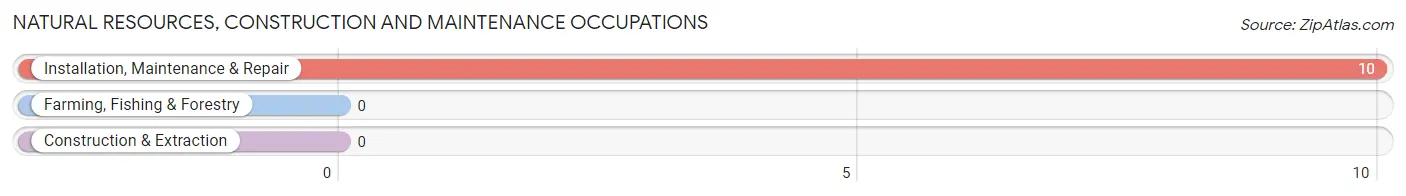
Natural Resources, Construction and Maintenance Occupations by Sex
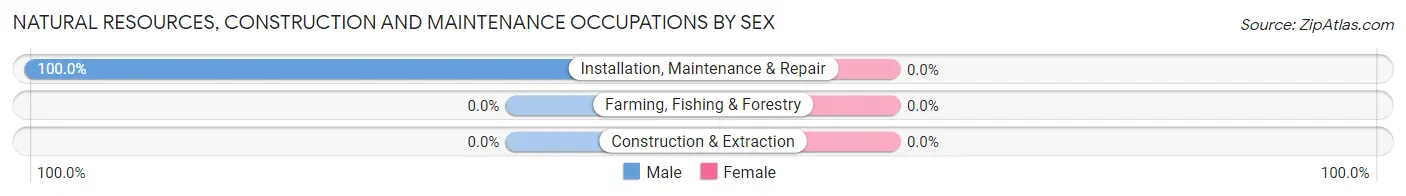
| Occupation | Male | Female |
| Farming, Fishing & Forestry | 0 (0.0%) | 0 (0.0%) |
| Construction & Extraction | 0 (0.0%) | 0 (0.0%) |
| Installation, Maintenance & Repair | 10 (100.0%) | 0 (0.0%) |
| Total (Category) | 10 (100.0%) | 0 (0.0%) |
| Total (Overall) | 128 (48.7%) | 135 (51.3%) |
Production, Transportation and Moving Occupations
The most common Production, Transportation and Moving occupations in Glenwood are Production (33 | 12.6%), Transportation (20 | 7.6%), and Material Moving (18 | 6.8%).
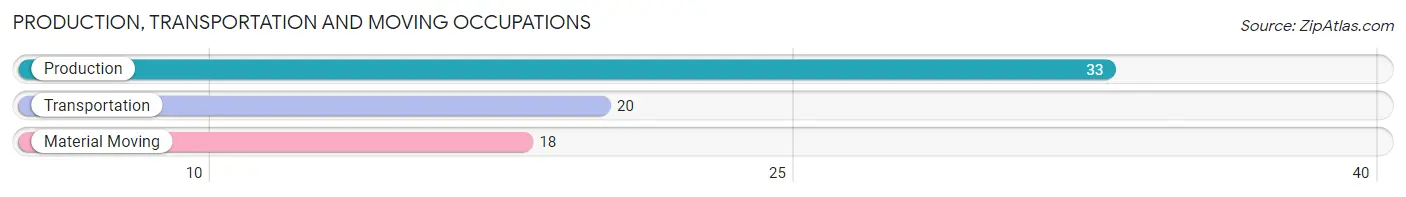
Production, Transportation and Moving Occupations by Sex
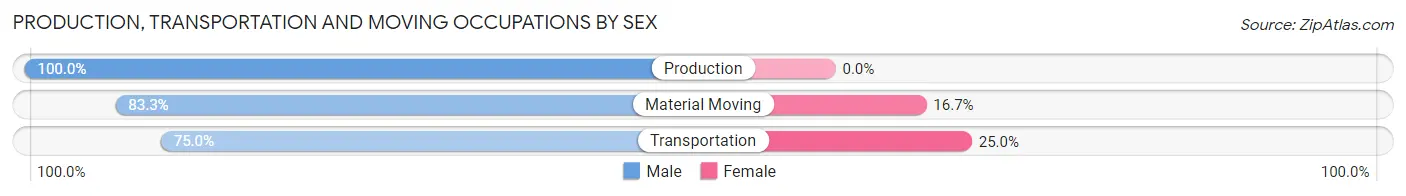
| Occupation | Male | Female |
| Production | 33 (100.0%) | 0 (0.0%) |
| Transportation | 15 (75.0%) | 5 (25.0%) |
| Material Moving | 15 (83.3%) | 3 (16.7%) |
| Total (Category) | 63 (88.7%) | 8 (11.3%) |
| Total (Overall) | 128 (48.7%) | 135 (51.3%) |
Employment Industries by Sex in Glenwood
Employment Industries in Glenwood
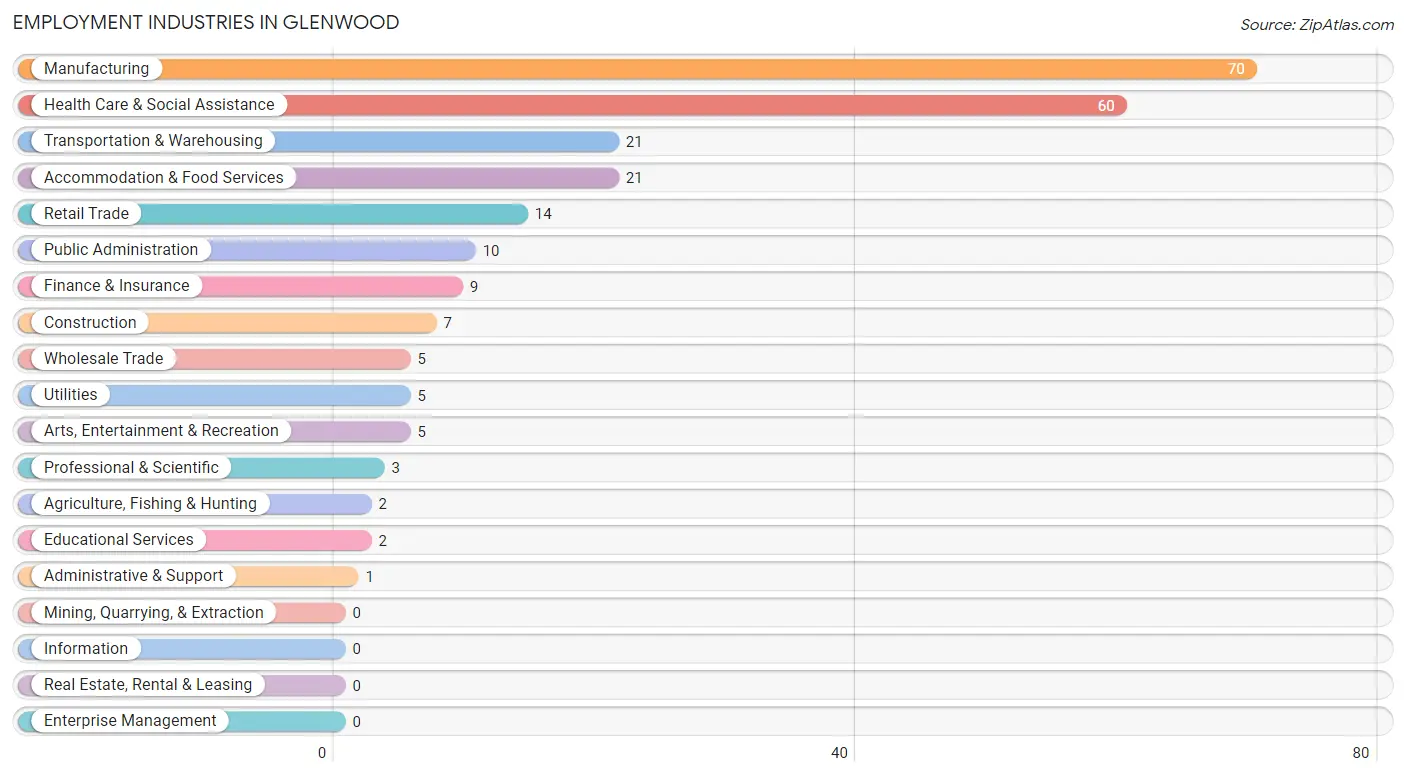
The major employment industries in Glenwood include Manufacturing (70 | 26.6%), Health Care & Social Assistance (60 | 22.8%), Transportation & Warehousing (21 | 8.0%), Accommodation & Food Services (21 | 8.0%), and Retail Trade (14 | 5.3%).
Employment Industries by Sex in Glenwood
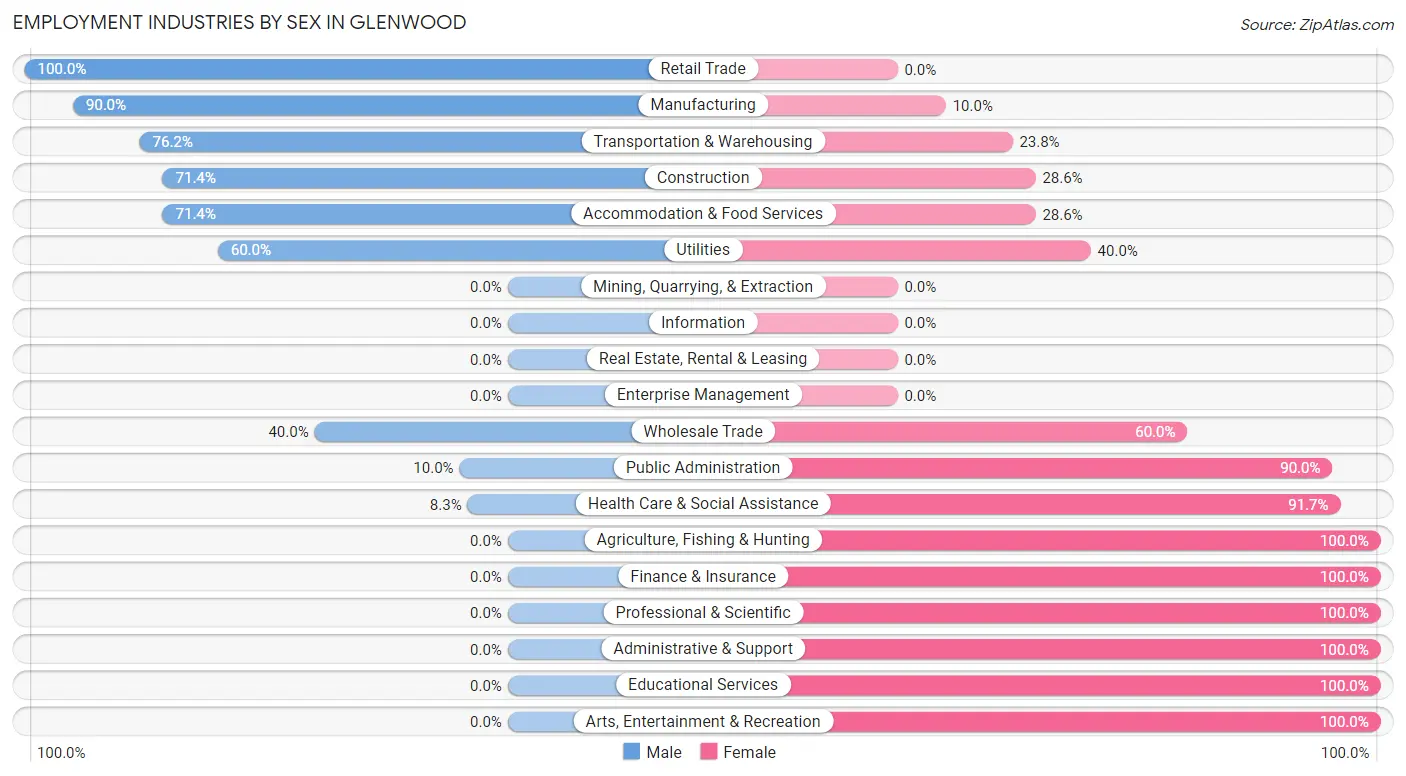
The Glenwood industries that see more men than women are Retail Trade (100.0%), Manufacturing (90.0%), and Transportation & Warehousing (76.2%), whereas the industries that tend to have a higher number of women are Agriculture, Fishing & Hunting (100.0%), Finance & Insurance (100.0%), and Professional & Scientific (100.0%).
| Industry | Male | Female |
| Agriculture, Fishing & Hunting | 0 (0.0%) | 2 (100.0%) |
| Mining, Quarrying, & Extraction | 0 (0.0%) | 0 (0.0%) |
| Construction | 5 (71.4%) | 2 (28.6%) |
| Manufacturing | 63 (90.0%) | 7 (10.0%) |
| Wholesale Trade | 2 (40.0%) | 3 (60.0%) |
| Retail Trade | 14 (100.0%) | 0 (0.0%) |
| Transportation & Warehousing | 16 (76.2%) | 5 (23.8%) |
| Utilities | 3 (60.0%) | 2 (40.0%) |
| Information | 0 (0.0%) | 0 (0.0%) |
| Finance & Insurance | 0 (0.0%) | 9 (100.0%) |
| Real Estate, Rental & Leasing | 0 (0.0%) | 0 (0.0%) |
| Professional & Scientific | 0 (0.0%) | 3 (100.0%) |
| Enterprise Management | 0 (0.0%) | 0 (0.0%) |
| Administrative & Support | 0 (0.0%) | 1 (100.0%) |
| Educational Services | 0 (0.0%) | 2 (100.0%) |
| Health Care & Social Assistance | 5 (8.3%) | 55 (91.7%) |
| Arts, Entertainment & Recreation | 0 (0.0%) | 5 (100.0%) |
| Accommodation & Food Services | 15 (71.4%) | 6 (28.6%) |
| Public Administration | 1 (10.0%) | 9 (90.0%) |
| Total | 128 (48.7%) | 135 (51.3%) |
Education in Glenwood
School Enrollment in Glenwood
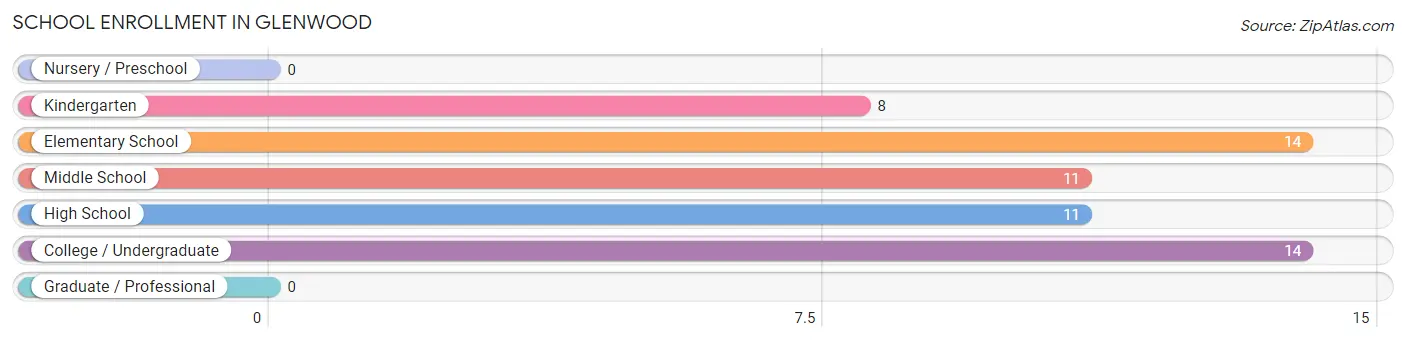
The most common levels of schooling among the 58 students in Glenwood are elementary school (14 | 24.1%), college / undergraduate (14 | 24.1%), and middle school (11 | 19.0%).
| School Level | # Students | % Students |
| Nursery / Preschool | 0 | 0.0% |
| Kindergarten | 8 | 13.8% |
| Elementary School | 14 | 24.1% |
| Middle School | 11 | 19.0% |
| High School | 11 | 19.0% |
| College / Undergraduate | 14 | 24.1% |
| Graduate / Professional | 0 | 0.0% |
| Total | 58 | 100.0% |
School Enrollment by Age by Funding Source in Glenwood
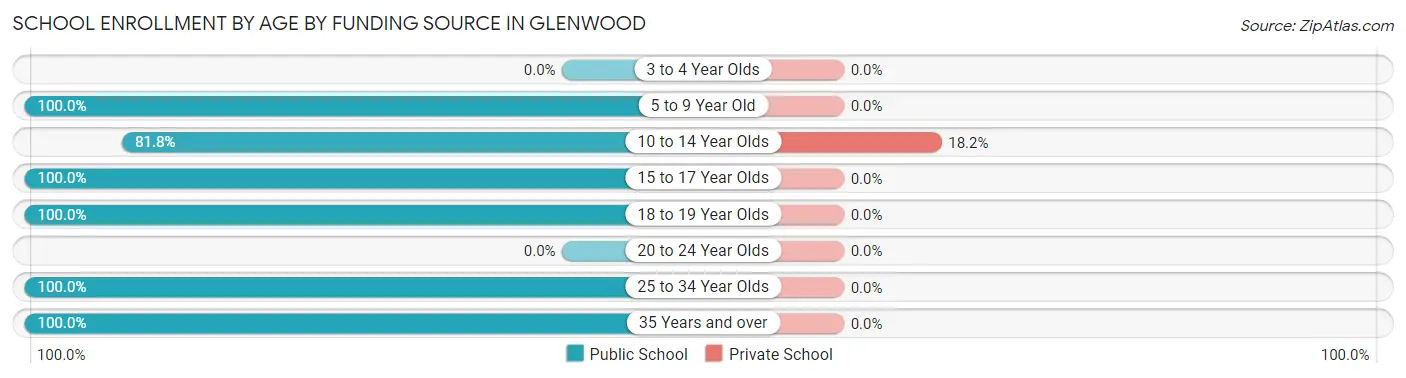
Out of a total of 58 students who are enrolled in schools in Glenwood, 2 (3.4%) attend a private institution, while the remaining 56 (96.6%) are enrolled in public schools. The age group of 10 to 14 year olds has the highest likelihood of being enrolled in private schools, with 2 (18.2% in the age bracket) enrolled. Conversely, the age group of 5 to 9 year old has the lowest likelihood of being enrolled in a private school, with 22 (100.0% in the age bracket) attending a public institution.
| Age Bracket | Public School | Private School |
| 3 to 4 Year Olds | 0 (0.0%) | 0 (0.0%) |
| 5 to 9 Year Old | 22 (100.0%) | 0 (0.0%) |
| 10 to 14 Year Olds | 9 (81.8%) | 2 (18.2%) |
| 15 to 17 Year Olds | 11 (100.0%) | 0 (0.0%) |
| 18 to 19 Year Olds | 2 (100.0%) | 0 (0.0%) |
| 20 to 24 Year Olds | 0 (0.0%) | 0 (0.0%) |
| 25 to 34 Year Olds | 5 (100.0%) | 0 (0.0%) |
| 35 Years and over | 7 (100.0%) | 0 (0.0%) |
| Total | 56 (96.6%) | 2 (3.4%) |
Educational Attainment by Field of Study in Glenwood
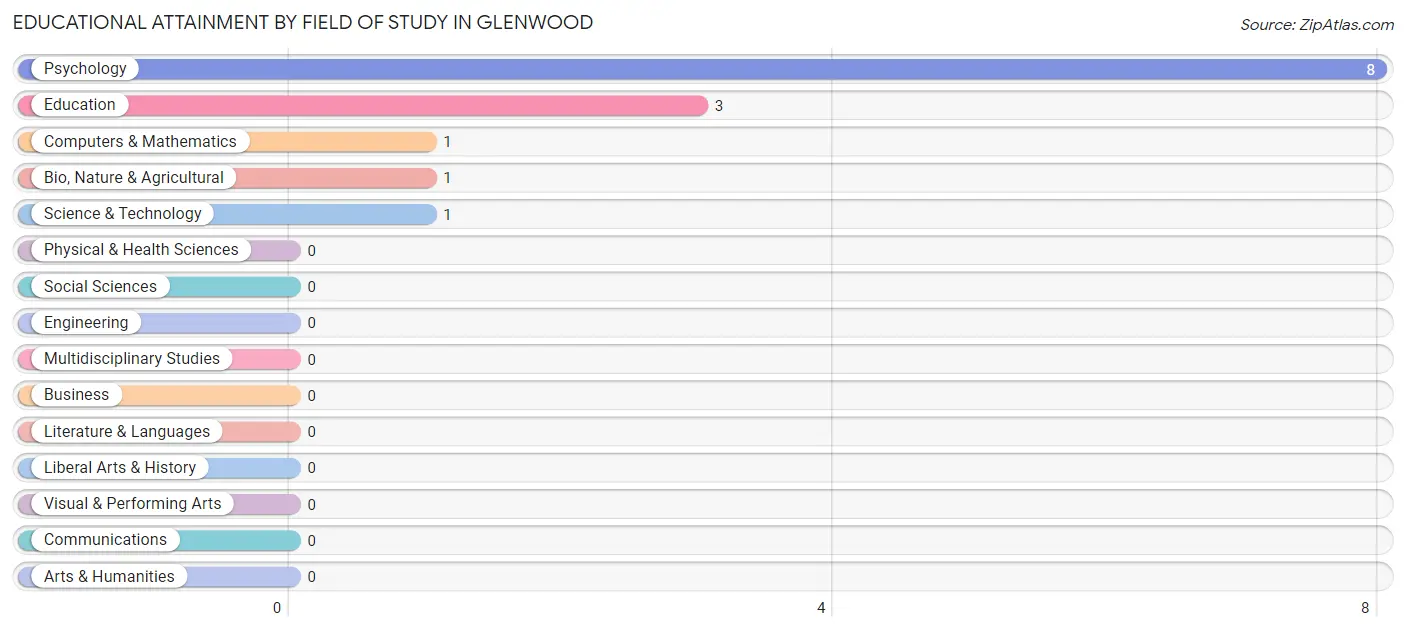
Psychology (8 | 57.1%), education (3 | 21.4%), computers & mathematics (1 | 7.1%), bio, nature & agricultural (1 | 7.1%), and science & technology (1 | 7.1%) are the most common fields of study among 14 individuals in Glenwood who have obtained a bachelor's degree or higher.
| Field of Study | # Graduates | % Graduates |
| Computers & Mathematics | 1 | 7.1% |
| Bio, Nature & Agricultural | 1 | 7.1% |
| Physical & Health Sciences | 0 | 0.0% |
| Psychology | 8 | 57.1% |
| Social Sciences | 0 | 0.0% |
| Engineering | 0 | 0.0% |
| Multidisciplinary Studies | 0 | 0.0% |
| Science & Technology | 1 | 7.1% |
| Business | 0 | 0.0% |
| Education | 3 | 21.4% |
| Literature & Languages | 0 | 0.0% |
| Liberal Arts & History | 0 | 0.0% |
| Visual & Performing Arts | 0 | 0.0% |
| Communications | 0 | 0.0% |
| Arts & Humanities | 0 | 0.0% |
| Total | 14 | 100.0% |
Transportation & Commute in Glenwood
Vehicle Availability by Sex in Glenwood
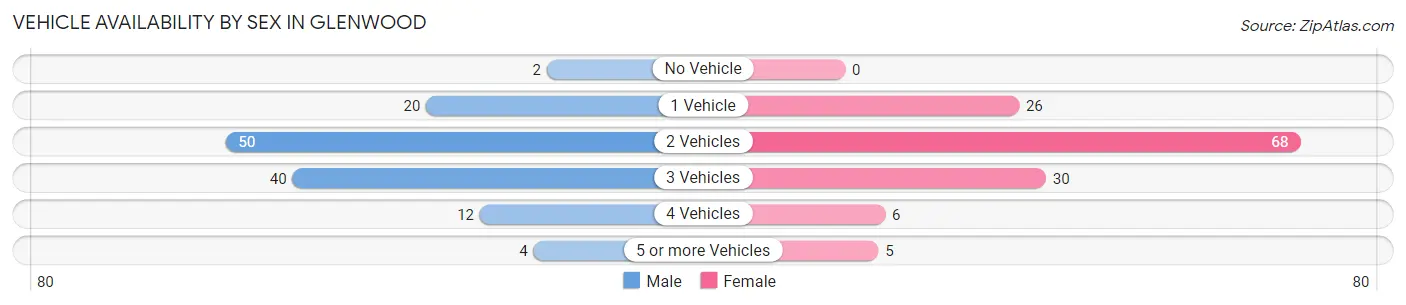
The most prevalent vehicle ownership categories in Glenwood are males with 2 vehicles (50, accounting for 39.1%) and females with 2 vehicles (68, making up 37.0%).
| Vehicles Available | Male | Female |
| No Vehicle | 2 (1.6%) | 0 (0.0%) |
| 1 Vehicle | 20 (15.6%) | 26 (19.3%) |
| 2 Vehicles | 50 (39.1%) | 68 (50.4%) |
| 3 Vehicles | 40 (31.2%) | 30 (22.2%) |
| 4 Vehicles | 12 (9.4%) | 6 (4.4%) |
| 5 or more Vehicles | 4 (3.1%) | 5 (3.7%) |
| Total | 128 (100.0%) | 135 (100.0%) |
Commute Time in Glenwood
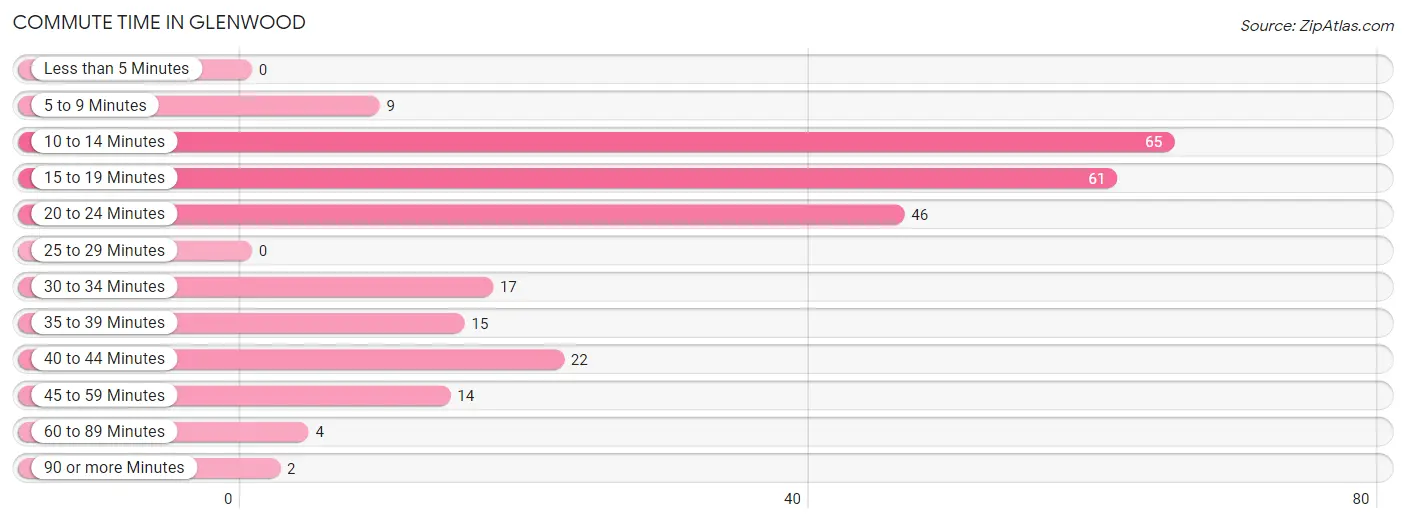
The most frequently occuring commute durations in Glenwood are 10 to 14 minutes (65 commuters, 25.5%), 15 to 19 minutes (61 commuters, 23.9%), and 20 to 24 minutes (46 commuters, 18.0%).
| Commute Time | # Commuters | % Commuters |
| Less than 5 Minutes | 0 | 0.0% |
| 5 to 9 Minutes | 9 | 3.5% |
| 10 to 14 Minutes | 65 | 25.5% |
| 15 to 19 Minutes | 61 | 23.9% |
| 20 to 24 Minutes | 46 | 18.0% |
| 25 to 29 Minutes | 0 | 0.0% |
| 30 to 34 Minutes | 17 | 6.7% |
| 35 to 39 Minutes | 15 | 5.9% |
| 40 to 44 Minutes | 22 | 8.6% |
| 45 to 59 Minutes | 14 | 5.5% |
| 60 to 89 Minutes | 4 | 1.6% |
| 90 or more Minutes | 2 | 0.8% |
Commute Time by Sex in Glenwood
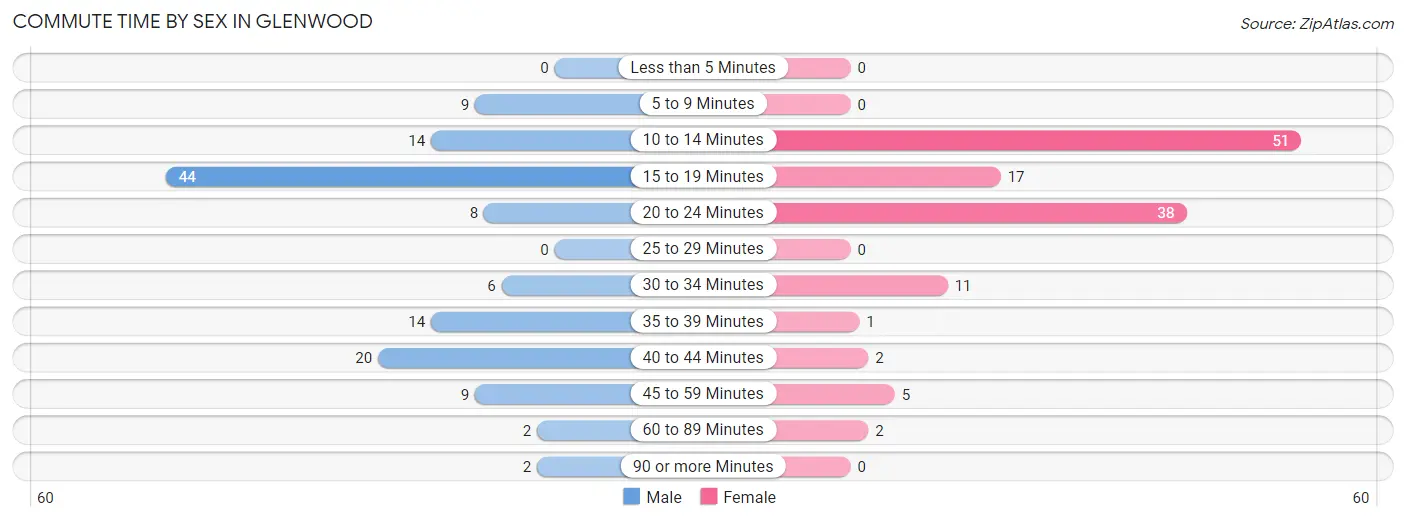
The most common commute times in Glenwood are 15 to 19 minutes (44 commuters, 34.4%) for males and 10 to 14 minutes (51 commuters, 40.2%) for females.
| Commute Time | Male | Female |
| Less than 5 Minutes | 0 (0.0%) | 0 (0.0%) |
| 5 to 9 Minutes | 9 (7.0%) | 0 (0.0%) |
| 10 to 14 Minutes | 14 (10.9%) | 51 (40.2%) |
| 15 to 19 Minutes | 44 (34.4%) | 17 (13.4%) |
| 20 to 24 Minutes | 8 (6.2%) | 38 (29.9%) |
| 25 to 29 Minutes | 0 (0.0%) | 0 (0.0%) |
| 30 to 34 Minutes | 6 (4.7%) | 11 (8.7%) |
| 35 to 39 Minutes | 14 (10.9%) | 1 (0.8%) |
| 40 to 44 Minutes | 20 (15.6%) | 2 (1.6%) |
| 45 to 59 Minutes | 9 (7.0%) | 5 (3.9%) |
| 60 to 89 Minutes | 2 (1.6%) | 2 (1.6%) |
| 90 or more Minutes | 2 (1.6%) | 0 (0.0%) |
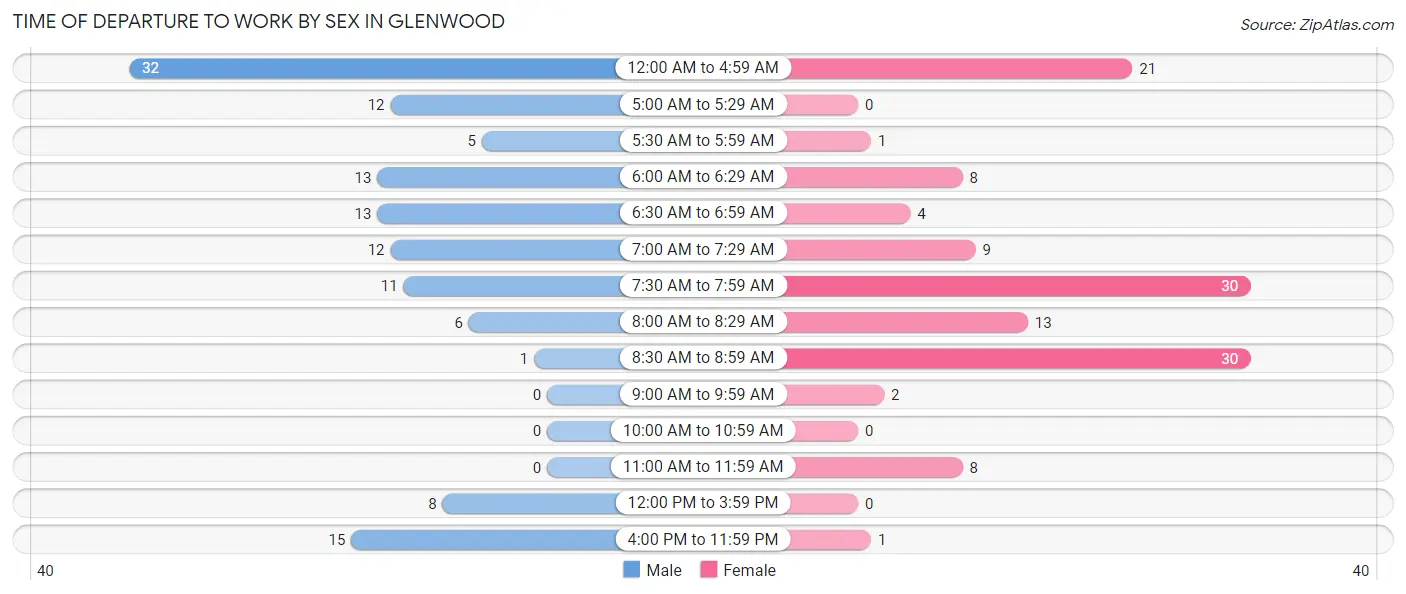
Time of Departure to Work by Sex in Glenwood
The most frequent times of departure to work in Glenwood are 12:00 AM to 4:59 AM (32, 25.0%) for males and 7:30 AM to 7:59 AM (30, 23.6%) for females.
| Time of Departure | Male | Female |
| 12:00 AM to 4:59 AM | 32 (25.0%) | 21 (16.5%) |
| 5:00 AM to 5:29 AM | 12 (9.4%) | 0 (0.0%) |
| 5:30 AM to 5:59 AM | 5 (3.9%) | 1 (0.8%) |
| 6:00 AM to 6:29 AM | 13 (10.2%) | 8 (6.3%) |
| 6:30 AM to 6:59 AM | 13 (10.2%) | 4 (3.2%) |
| 7:00 AM to 7:29 AM | 12 (9.4%) | 9 (7.1%) |
| 7:30 AM to 7:59 AM | 11 (8.6%) | 30 (23.6%) |
| 8:00 AM to 8:29 AM | 6 (4.7%) | 13 (10.2%) |
| 8:30 AM to 8:59 AM | 1 (0.8%) | 30 (23.6%) |
| 9:00 AM to 9:59 AM | 0 (0.0%) | 2 (1.6%) |
| 10:00 AM to 10:59 AM | 0 (0.0%) | 0 (0.0%) |
| 11:00 AM to 11:59 AM | 0 (0.0%) | 8 (6.3%) |
| 12:00 PM to 3:59 PM | 8 (6.2%) | 0 (0.0%) |
| 4:00 PM to 11:59 PM | 15 (11.7%) | 1 (0.8%) |
| Total | 128 (100.0%) | 127 (100.0%) |
Housing Occupancy in Glenwood
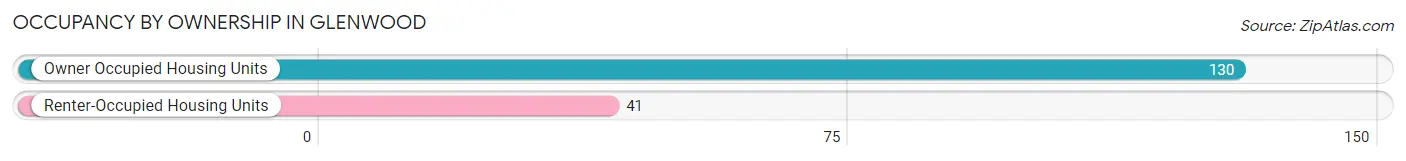
Occupancy by Ownership in Glenwood
Of the total 171 dwellings in Glenwood, owner-occupied units account for 130 (76.0%), while renter-occupied units make up 41 (24.0%).
| Occupancy | # Housing Units | % Housing Units |
| Owner Occupied Housing Units | 130 | 76.0% |
| Renter-Occupied Housing Units | 41 | 24.0% |
| Total Occupied Housing Units | 171 | 100.0% |
Occupancy by Household Size in Glenwood
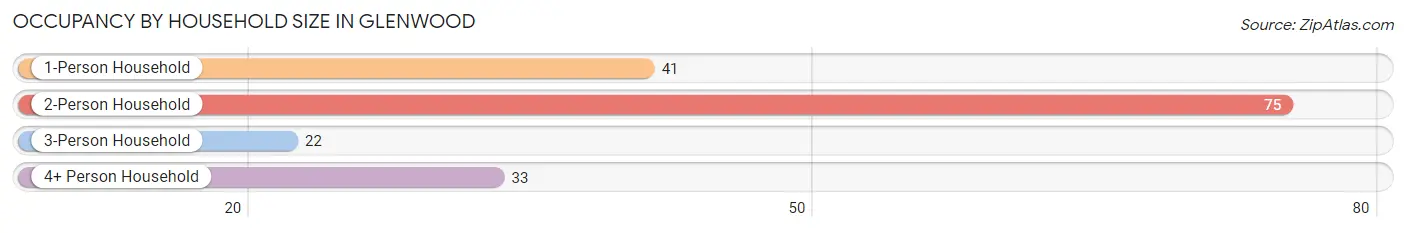
| Household Size | # Housing Units | % Housing Units |
| 1-Person Household | 41 | 24.0% |
| 2-Person Household | 75 | 43.9% |
| 3-Person Household | 22 | 12.9% |
| 4+ Person Household | 33 | 19.3% |
| Total Housing Units | 171 | 100.0% |
Occupancy by Ownership by Household Size in Glenwood
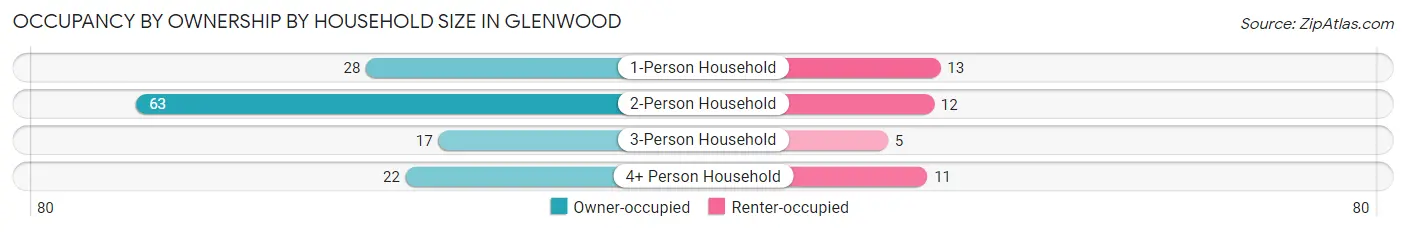
| Household Size | Owner-occupied | Renter-occupied |
| 1-Person Household | 28 (68.3%) | 13 (31.7%) |
| 2-Person Household | 63 (84.0%) | 12 (16.0%) |
| 3-Person Household | 17 (77.3%) | 5 (22.7%) |
| 4+ Person Household | 22 (66.7%) | 11 (33.3%) |
| Total Housing Units | 130 (76.0%) | 41 (24.0%) |
Occupancy by Educational Attainment in Glenwood
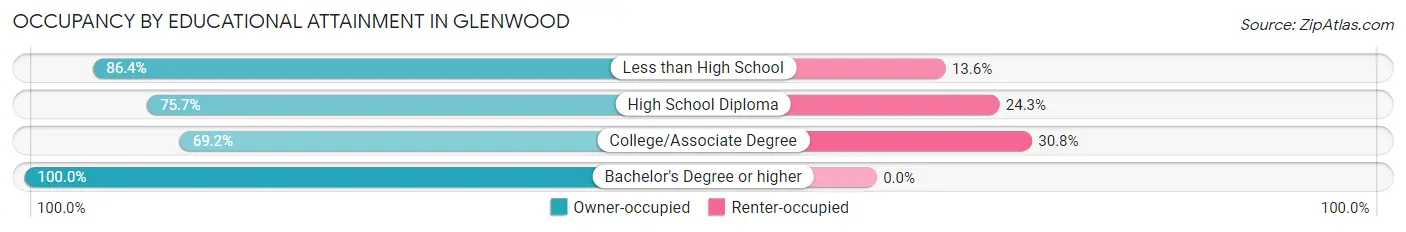
| Household Size | Owner-occupied | Renter-occupied |
| Less than High School | 19 (86.4%) | 3 (13.6%) |
| High School Diploma | 56 (75.7%) | 18 (24.3%) |
| College/Associate Degree | 45 (69.2%) | 20 (30.8%) |
| Bachelor's Degree or higher | 10 (100.0%) | 0 (0.0%) |
Occupancy by Age of Householder in Glenwood
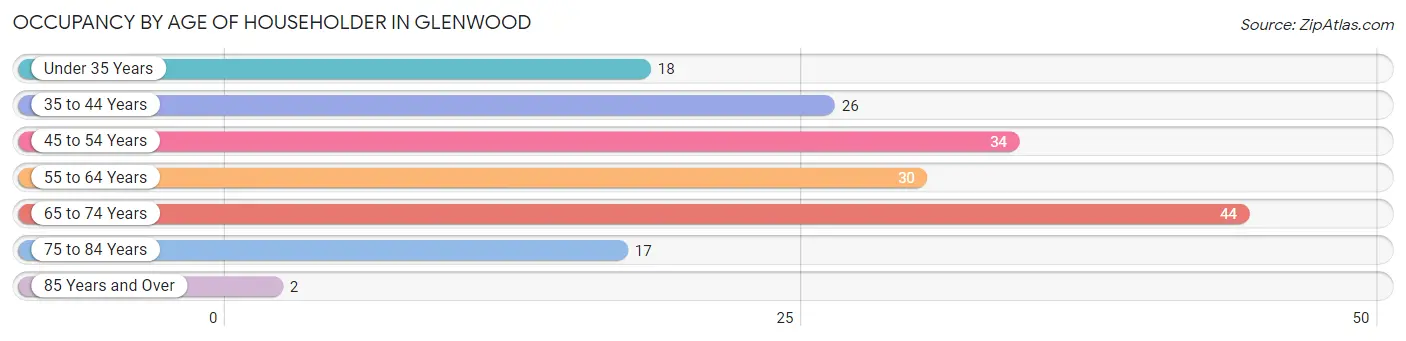
| Age Bracket | # Households | % Households |
| Under 35 Years | 18 | 10.5% |
| 35 to 44 Years | 26 | 15.2% |
| 45 to 54 Years | 34 | 19.9% |
| 55 to 64 Years | 30 | 17.5% |
| 65 to 74 Years | 44 | 25.7% |
| 75 to 84 Years | 17 | 9.9% |
| 85 Years and Over | 2 | 1.2% |
| Total | 171 | 100.0% |
Housing Finances in Glenwood
Median Income by Occupancy in Glenwood
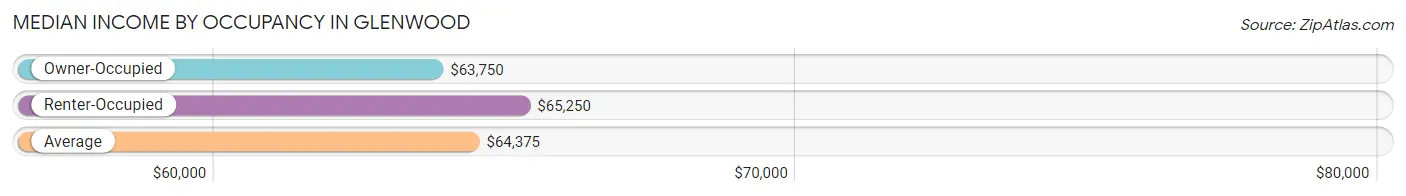
| Occupancy Type | # Households | Median Income |
| Owner-Occupied | 130 (76.0%) | $63,750 |
| Renter-Occupied | 41 (24.0%) | $65,250 |
| Average | 171 (100.0%) | $64,375 |
Occupancy by Householder Income Bracket in Glenwood
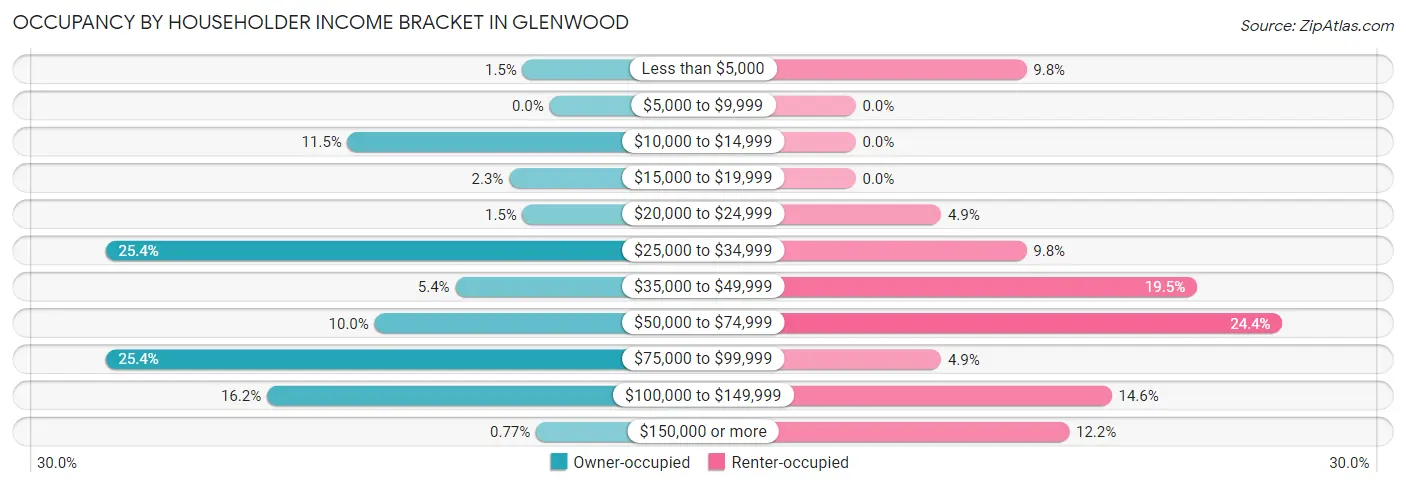
| Income Bracket | Owner-occupied | Renter-occupied |
| Less than $5,000 | 2 (1.5%) | 4 (9.8%) |
| $5,000 to $9,999 | 0 (0.0%) | 0 (0.0%) |
| $10,000 to $14,999 | 15 (11.5%) | 0 (0.0%) |
| $15,000 to $19,999 | 3 (2.3%) | 0 (0.0%) |
| $20,000 to $24,999 | 2 (1.5%) | 2 (4.9%) |
| $25,000 to $34,999 | 33 (25.4%) | 4 (9.8%) |
| $35,000 to $49,999 | 7 (5.4%) | 8 (19.5%) |
| $50,000 to $74,999 | 13 (10.0%) | 10 (24.4%) |
| $75,000 to $99,999 | 33 (25.4%) | 2 (4.9%) |
| $100,000 to $149,999 | 21 (16.2%) | 6 (14.6%) |
| $150,000 or more | 1 (0.8%) | 5 (12.2%) |
| Total | 130 (100.0%) | 41 (100.0%) |
Monthly Housing Cost Tiers in Glenwood
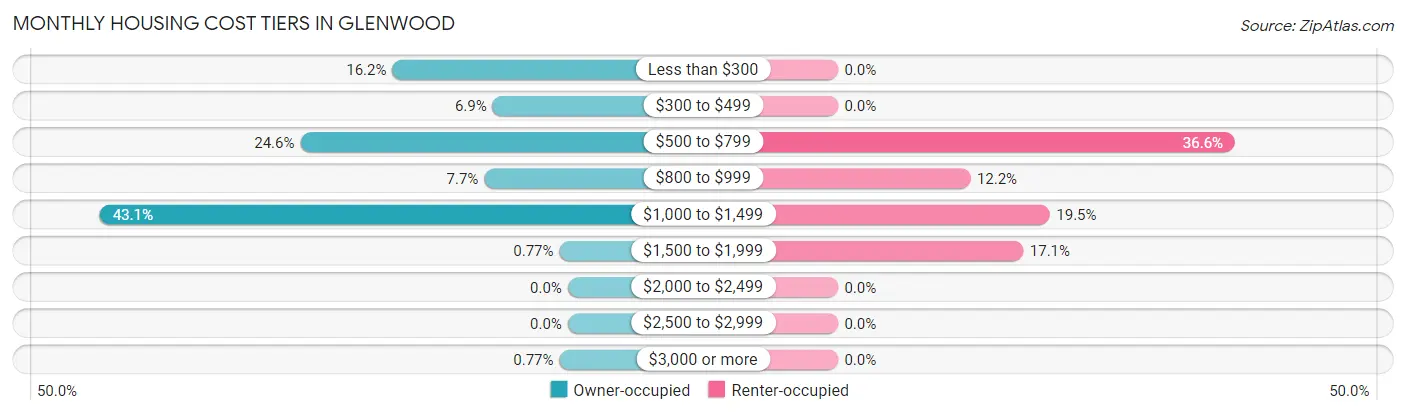
| Monthly Cost | Owner-occupied | Renter-occupied |
| Less than $300 | 21 (16.2%) | 0 (0.0%) |
| $300 to $499 | 9 (6.9%) | 0 (0.0%) |
| $500 to $799 | 32 (24.6%) | 15 (36.6%) |
| $800 to $999 | 10 (7.7%) | 5 (12.2%) |
| $1,000 to $1,499 | 56 (43.1%) | 8 (19.5%) |
| $1,500 to $1,999 | 1 (0.8%) | 7 (17.1%) |
| $2,000 to $2,499 | 0 (0.0%) | 0 (0.0%) |
| $2,500 to $2,999 | 0 (0.0%) | 0 (0.0%) |
| $3,000 or more | 1 (0.8%) | 0 (0.0%) |
| Total | 130 (100.0%) | 41 (100.0%) |
Physical Housing Characteristics in Glenwood
Housing Structures in Glenwood
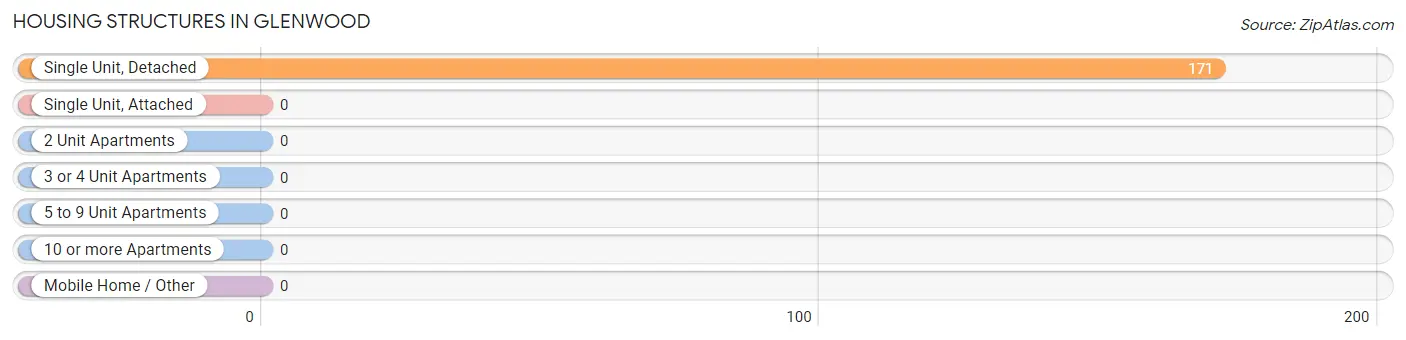
| Structure Type | # Housing Units | % Housing Units |
| Single Unit, Detached | 171 | 100.0% |
| Single Unit, Attached | 0 | 0.0% |
| 2 Unit Apartments | 0 | 0.0% |
| 3 or 4 Unit Apartments | 0 | 0.0% |
| 5 to 9 Unit Apartments | 0 | 0.0% |
| 10 or more Apartments | 0 | 0.0% |
| Mobile Home / Other | 0 | 0.0% |
| Total | 171 | 100.0% |
Housing Structures by Occupancy in Glenwood
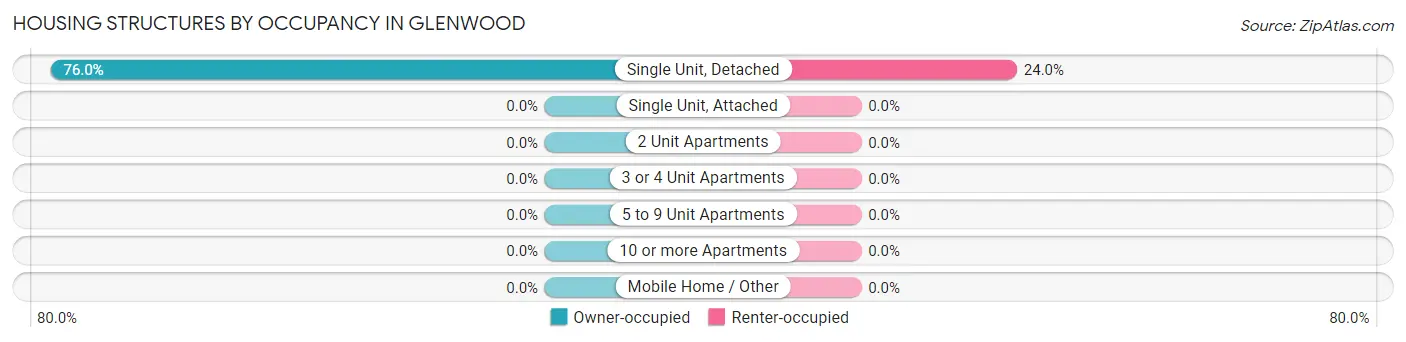
| Structure Type | Owner-occupied | Renter-occupied |
| Single Unit, Detached | 130 (76.0%) | 41 (24.0%) |
| Single Unit, Attached | 0 (0.0%) | 0 (0.0%) |
| 2 Unit Apartments | 0 (0.0%) | 0 (0.0%) |
| 3 or 4 Unit Apartments | 0 (0.0%) | 0 (0.0%) |
| 5 to 9 Unit Apartments | 0 (0.0%) | 0 (0.0%) |
| 10 or more Apartments | 0 (0.0%) | 0 (0.0%) |
| Mobile Home / Other | 0 (0.0%) | 0 (0.0%) |
| Total | 130 (76.0%) | 41 (24.0%) |
Housing Structures by Number of Rooms in Glenwood
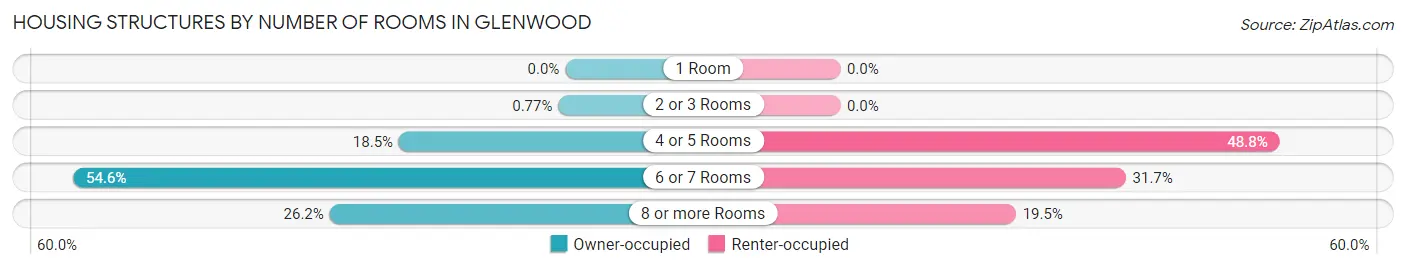
| Number of Rooms | Owner-occupied | Renter-occupied |
| 1 Room | 0 (0.0%) | 0 (0.0%) |
| 2 or 3 Rooms | 1 (0.8%) | 0 (0.0%) |
| 4 or 5 Rooms | 24 (18.5%) | 20 (48.8%) |
| 6 or 7 Rooms | 71 (54.6%) | 13 (31.7%) |
| 8 or more Rooms | 34 (26.2%) | 8 (19.5%) |
| Total | 130 (100.0%) | 41 (100.0%) |
Housing Structure by Heating Type in Glenwood
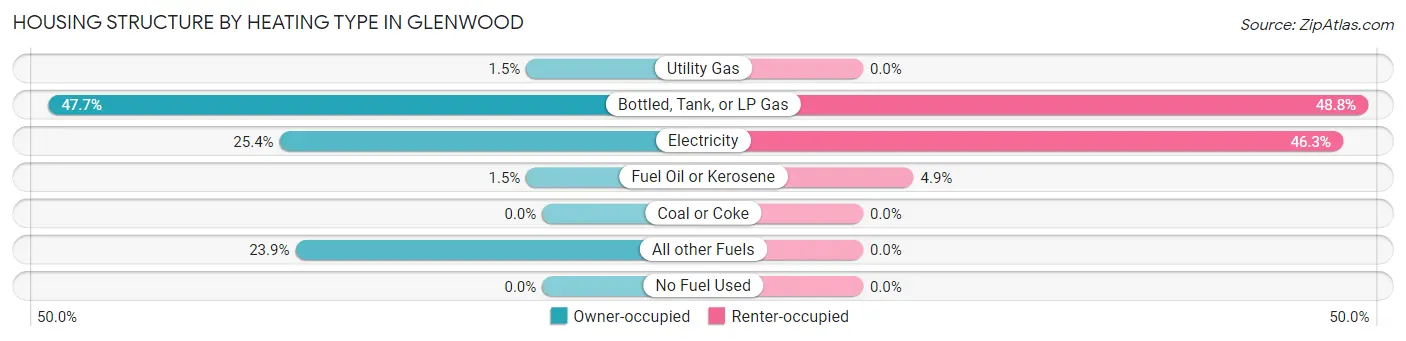
| Heating Type | Owner-occupied | Renter-occupied |
| Utility Gas | 2 (1.5%) | 0 (0.0%) |
| Bottled, Tank, or LP Gas | 62 (47.7%) | 20 (48.8%) |
| Electricity | 33 (25.4%) | 19 (46.3%) |
| Fuel Oil or Kerosene | 2 (1.5%) | 2 (4.9%) |
| Coal or Coke | 0 (0.0%) | 0 (0.0%) |
| All other Fuels | 31 (23.8%) | 0 (0.0%) |
| No Fuel Used | 0 (0.0%) | 0 (0.0%) |
| Total | 130 (100.0%) | 41 (100.0%) |
Household Vehicle Usage in Glenwood
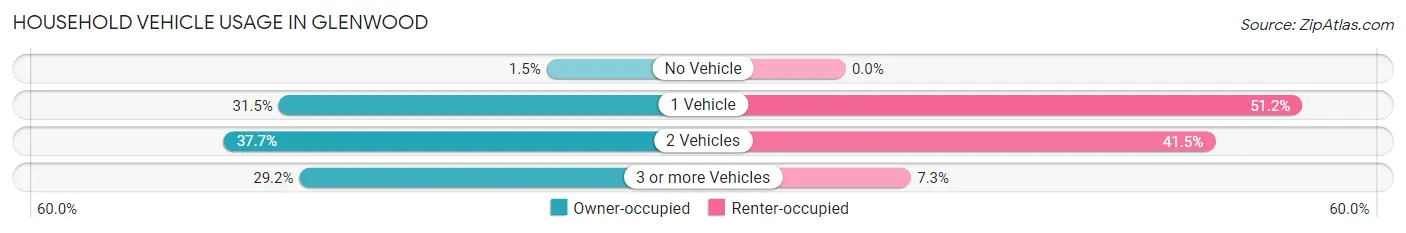
| Vehicles per Household | Owner-occupied | Renter-occupied |
| No Vehicle | 2 (1.5%) | 0 (0.0%) |
| 1 Vehicle | 41 (31.5%) | 21 (51.2%) |
| 2 Vehicles | 49 (37.7%) | 17 (41.5%) |
| 3 or more Vehicles | 38 (29.2%) | 3 (7.3%) |
| Total | 130 (100.0%) | 41 (100.0%) |
Real Estate & Mortgages in Glenwood
Real Estate and Mortgage Overview in Glenwood
| Characteristic | Without Mortgage | With Mortgage |
| Housing Units | 43 | 87 |
| Median Property Value | $57,900 | $91,100 |
| Median Household Income | - | - |
| Monthly Housing Costs | $358 | $0 |
| Real Estate Taxes | $721 | $12 |
Property Value by Mortgage Status in Glenwood
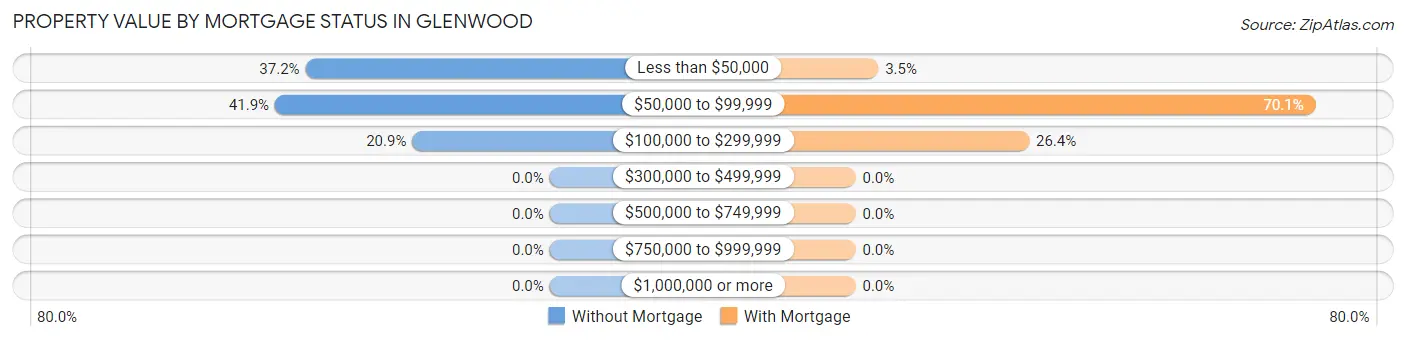
| Property Value | Without Mortgage | With Mortgage |
| Less than $50,000 | 16 (37.2%) | 3 (3.5%) |
| $50,000 to $99,999 | 18 (41.9%) | 61 (70.1%) |
| $100,000 to $299,999 | 9 (20.9%) | 23 (26.4%) |
| $300,000 to $499,999 | 0 (0.0%) | 0 (0.0%) |
| $500,000 to $749,999 | 0 (0.0%) | 0 (0.0%) |
| $750,000 to $999,999 | 0 (0.0%) | 0 (0.0%) |
| $1,000,000 or more | 0 (0.0%) | 0 (0.0%) |
| Total | 43 (100.0%) | 87 (100.0%) |
Household Income by Mortgage Status in Glenwood
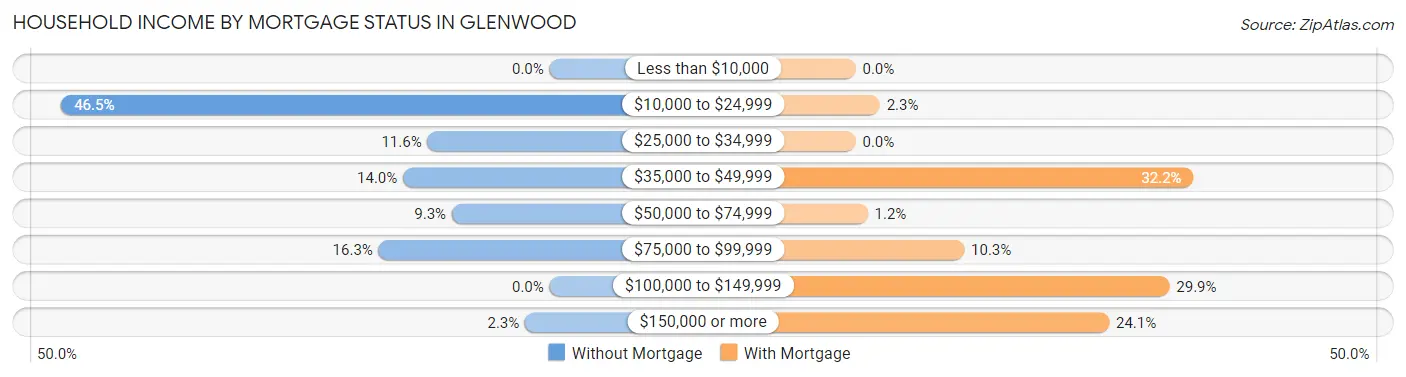
| Household Income | Without Mortgage | With Mortgage |
| Less than $10,000 | 0 (0.0%) | 0 (0.0%) |
| $10,000 to $24,999 | 20 (46.5%) | 2 (2.3%) |
| $25,000 to $34,999 | 5 (11.6%) | 0 (0.0%) |
| $35,000 to $49,999 | 6 (14.0%) | 28 (32.2%) |
| $50,000 to $74,999 | 4 (9.3%) | 1 (1.1%) |
| $75,000 to $99,999 | 7 (16.3%) | 9 (10.3%) |
| $100,000 to $149,999 | 0 (0.0%) | 26 (29.9%) |
| $150,000 or more | 1 (2.3%) | 21 (24.1%) |
| Total | 43 (100.0%) | 87 (100.0%) |
Property Value to Household Income Ratio in Glenwood
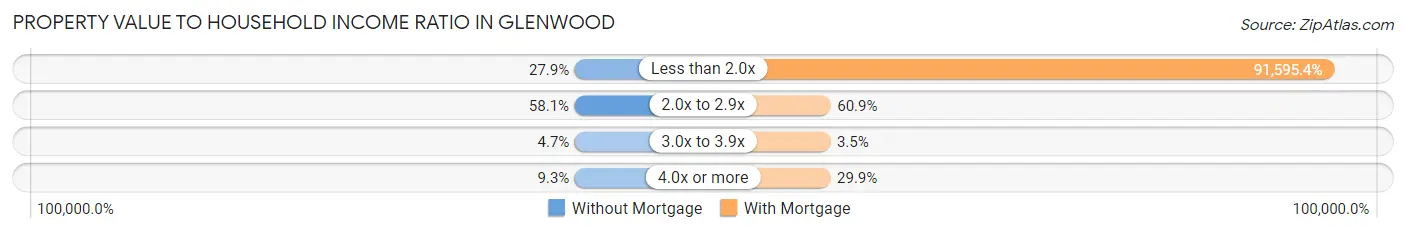
| Value-to-Income Ratio | Without Mortgage | With Mortgage |
| Less than 2.0x | 12 (27.9%) | 79,688 (91,595.4%) |
| 2.0x to 2.9x | 25 (58.1%) | 53 (60.9%) |
| 3.0x to 3.9x | 2 (4.6%) | 3 (3.5%) |
| 4.0x or more | 4 (9.3%) | 26 (29.9%) |
| Total | 43 (100.0%) | 87 (100.0%) |
Real Estate Taxes by Mortgage Status in Glenwood
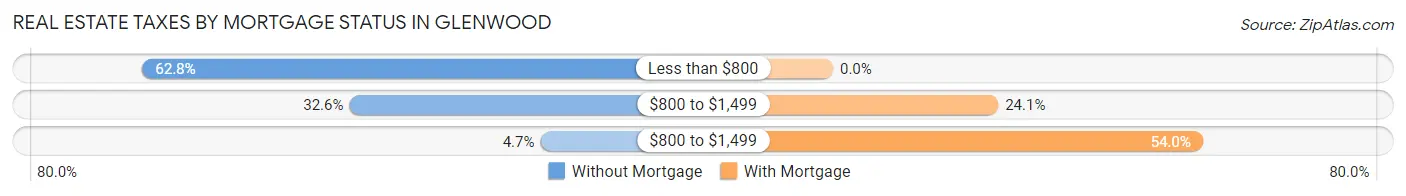
| Property Taxes | Without Mortgage | With Mortgage |
| Less than $800 | 27 (62.8%) | 0 (0.0%) |
| $800 to $1,499 | 14 (32.6%) | 21 (24.1%) |
| $800 to $1,499 | 2 (4.6%) | 47 (54.0%) |
| Total | 43 (100.0%) | 87 (100.0%) |
Health & Disability in Glenwood
Health Insurance Coverage by Age in Glenwood
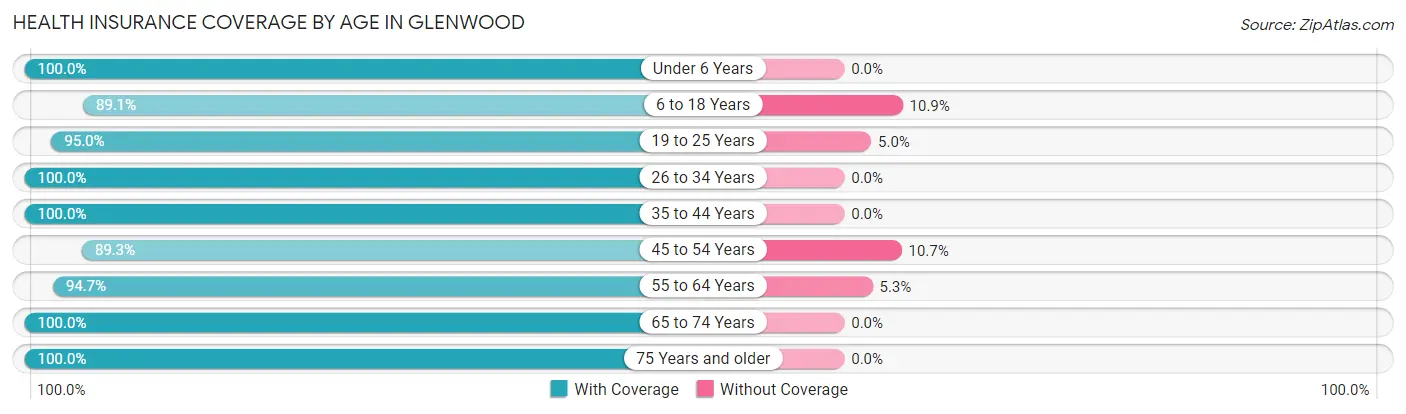
| Age Bracket | With Coverage | Without Coverage |
| Under 6 Years | 2 (100.0%) | 0 (0.0%) |
| 6 to 18 Years | 41 (89.1%) | 5 (10.9%) |
| 19 to 25 Years | 38 (95.0%) | 2 (5.0%) |
| 26 to 34 Years | 15 (100.0%) | 0 (0.0%) |
| 35 to 44 Years | 47 (100.0%) | 0 (0.0%) |
| 45 to 54 Years | 67 (89.3%) | 8 (10.7%) |
| 55 to 64 Years | 72 (94.7%) | 4 (5.3%) |
| 65 to 74 Years | 76 (100.0%) | 0 (0.0%) |
| 75 Years and older | 26 (100.0%) | 0 (0.0%) |
| Total | 384 (95.3%) | 19 (4.7%) |
Health Insurance Coverage by Citizenship Status in Glenwood
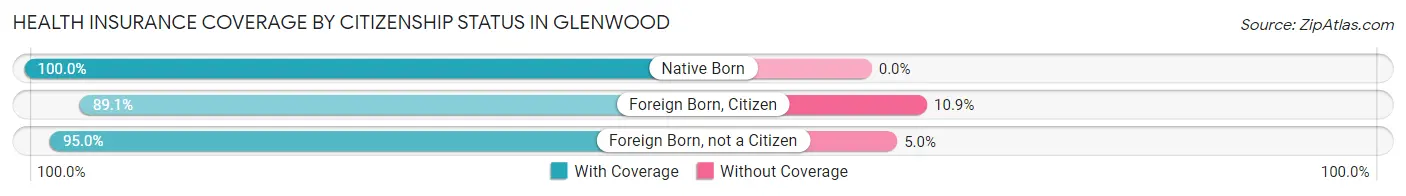
| Citizenship Status | With Coverage | Without Coverage |
| Native Born | 2 (100.0%) | 0 (0.0%) |
| Foreign Born, Citizen | 41 (89.1%) | 5 (10.9%) |
| Foreign Born, not a Citizen | 38 (95.0%) | 2 (5.0%) |
Health Insurance Coverage by Household Income in Glenwood
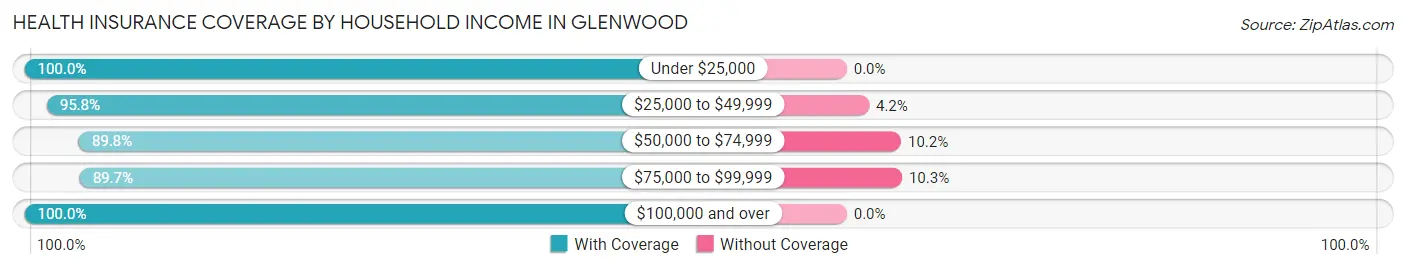
| Household Income | With Coverage | Without Coverage |
| Under $25,000 | 32 (100.0%) | 0 (0.0%) |
| $25,000 to $49,999 | 92 (95.8%) | 4 (4.2%) |
| $50,000 to $74,999 | 53 (89.8%) | 6 (10.2%) |
| $75,000 to $99,999 | 78 (89.7%) | 9 (10.3%) |
| $100,000 and over | 129 (100.0%) | 0 (0.0%) |
Public vs Private Health Insurance Coverage by Age in Glenwood
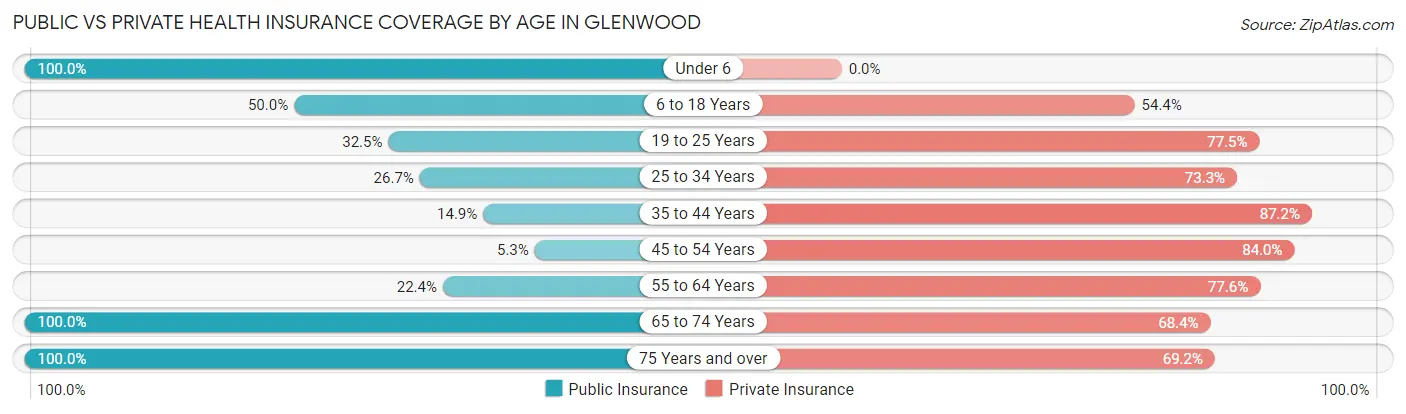
| Age Bracket | Public Insurance | Private Insurance |
| Under 6 | 2 (100.0%) | 0 (0.0%) |
| 6 to 18 Years | 23 (50.0%) | 25 (54.3%) |
| 19 to 25 Years | 13 (32.5%) | 31 (77.5%) |
| 25 to 34 Years | 4 (26.7%) | 11 (73.3%) |
| 35 to 44 Years | 7 (14.9%) | 41 (87.2%) |
| 45 to 54 Years | 4 (5.3%) | 63 (84.0%) |
| 55 to 64 Years | 17 (22.4%) | 59 (77.6%) |
| 65 to 74 Years | 76 (100.0%) | 52 (68.4%) |
| 75 Years and over | 26 (100.0%) | 18 (69.2%) |
| Total | 172 (42.7%) | 300 (74.4%) |
Disability Status by Sex by Age in Glenwood
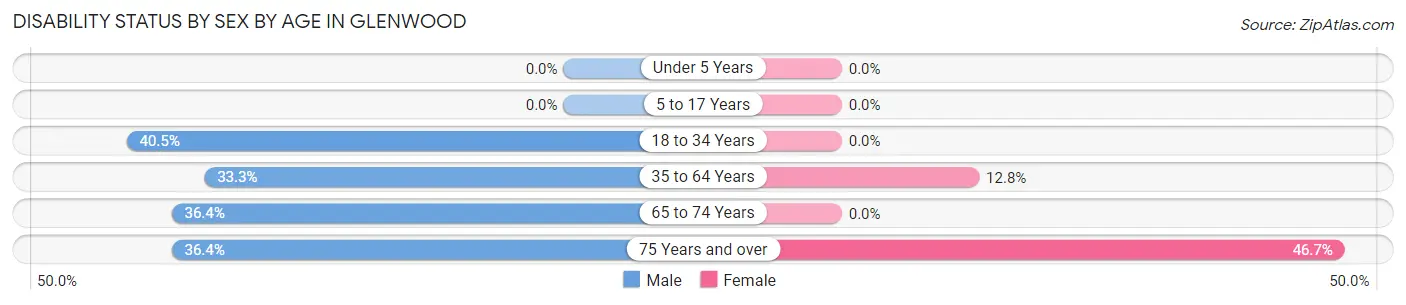
| Age Bracket | Male | Female |
| Under 5 Years | 0 (0.0%) | 0 (0.0%) |
| 5 to 17 Years | 0 (0.0%) | 0 (0.0%) |
| 18 to 34 Years | 15 (40.5%) | 0 (0.0%) |
| 35 to 64 Years | 32 (33.3%) | 13 (12.8%) |
| 65 to 74 Years | 16 (36.4%) | 0 (0.0%) |
| 75 Years and over | 4 (36.4%) | 7 (46.7%) |
Disability Class by Sex by Age in Glenwood
Disability Class: Hearing Difficulty
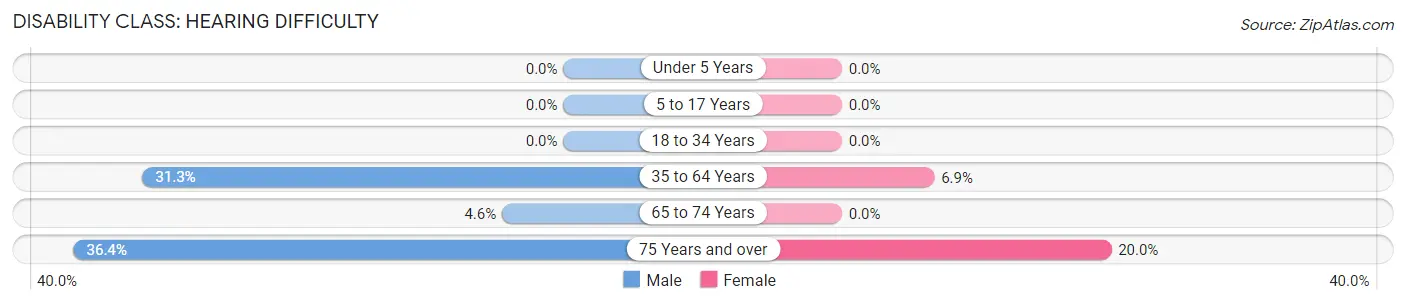
| Age Bracket | Male | Female |
| Under 5 Years | 0 (0.0%) | 0 (0.0%) |
| 5 to 17 Years | 0 (0.0%) | 0 (0.0%) |
| 18 to 34 Years | 0 (0.0%) | 0 (0.0%) |
| 35 to 64 Years | 30 (31.2%) | 7 (6.9%) |
| 65 to 74 Years | 2 (4.5%) | 0 (0.0%) |
| 75 Years and over | 4 (36.4%) | 3 (20.0%) |
Disability Class: Vision Difficulty
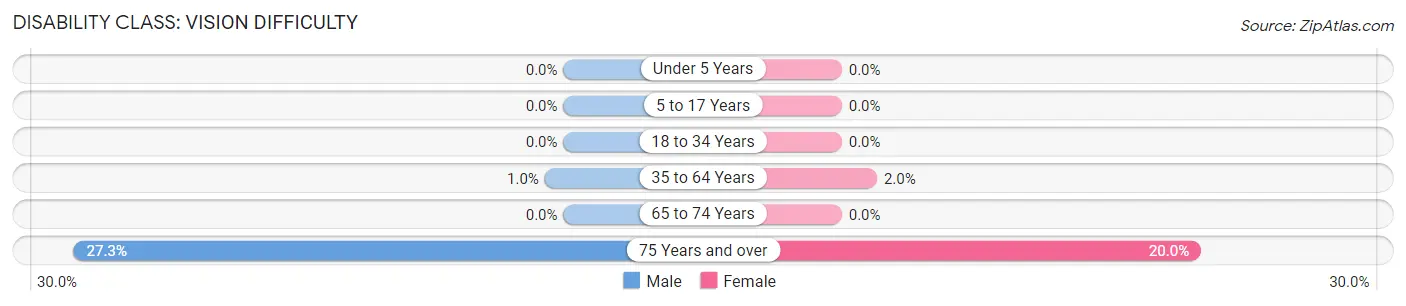
| Age Bracket | Male | Female |
| Under 5 Years | 0 (0.0%) | 0 (0.0%) |
| 5 to 17 Years | 0 (0.0%) | 0 (0.0%) |
| 18 to 34 Years | 0 (0.0%) | 0 (0.0%) |
| 35 to 64 Years | 1 (1.0%) | 2 (2.0%) |
| 65 to 74 Years | 0 (0.0%) | 0 (0.0%) |
| 75 Years and over | 3 (27.3%) | 3 (20.0%) |
Disability Class: Cognitive Difficulty
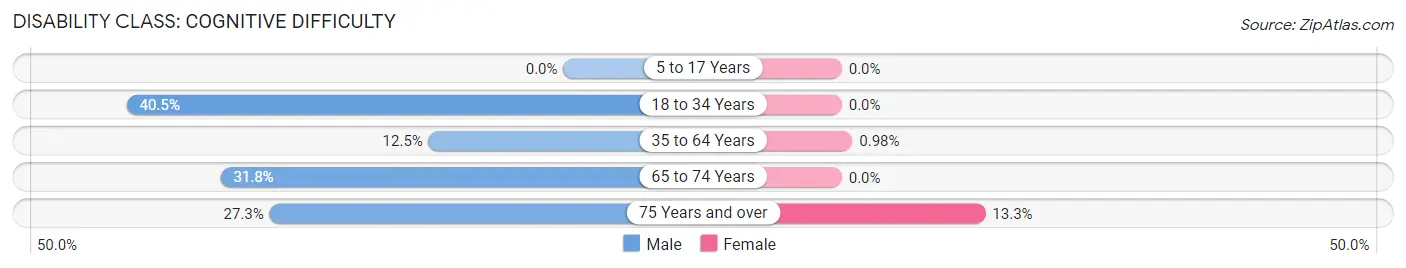
| Age Bracket | Male | Female |
| 5 to 17 Years | 0 (0.0%) | 0 (0.0%) |
| 18 to 34 Years | 15 (40.5%) | 0 (0.0%) |
| 35 to 64 Years | 12 (12.5%) | 1 (1.0%) |
| 65 to 74 Years | 14 (31.8%) | 0 (0.0%) |
| 75 Years and over | 3 (27.3%) | 2 (13.3%) |
Disability Class: Ambulatory Difficulty
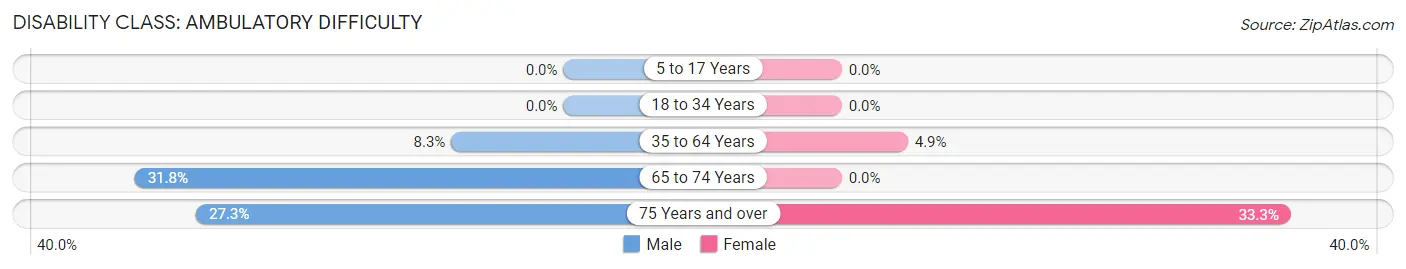
| Age Bracket | Male | Female |
| 5 to 17 Years | 0 (0.0%) | 0 (0.0%) |
| 18 to 34 Years | 0 (0.0%) | 0 (0.0%) |
| 35 to 64 Years | 8 (8.3%) | 5 (4.9%) |
| 65 to 74 Years | 14 (31.8%) | 0 (0.0%) |
| 75 Years and over | 3 (27.3%) | 5 (33.3%) |
Disability Class: Self-Care Difficulty
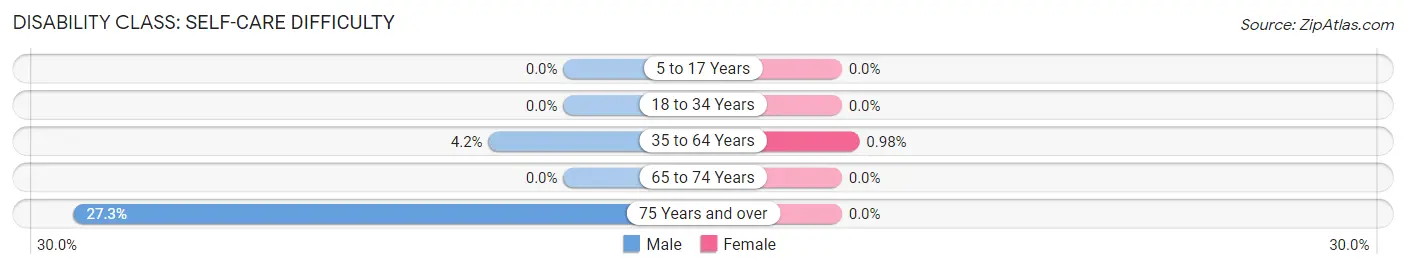
| Age Bracket | Male | Female |
| 5 to 17 Years | 0 (0.0%) | 0 (0.0%) |
| 18 to 34 Years | 0 (0.0%) | 0 (0.0%) |
| 35 to 64 Years | 4 (4.2%) | 1 (1.0%) |
| 65 to 74 Years | 0 (0.0%) | 0 (0.0%) |
| 75 Years and over | 3 (27.3%) | 0 (0.0%) |
Technology Access in Glenwood
Computing Device Access in Glenwood
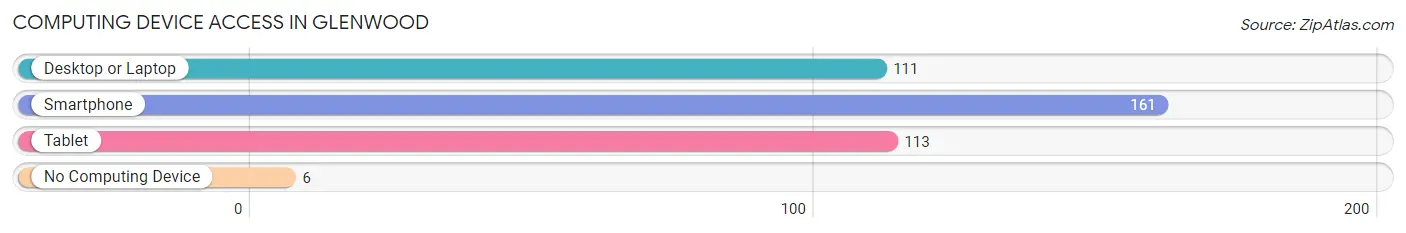
| Device Type | # Households | % Households |
| Desktop or Laptop | 111 | 64.9% |
| Smartphone | 161 | 94.2% |
| Tablet | 113 | 66.1% |
| No Computing Device | 6 | 3.5% |
| Total | 171 | 100.0% |
Internet Access in Glenwood
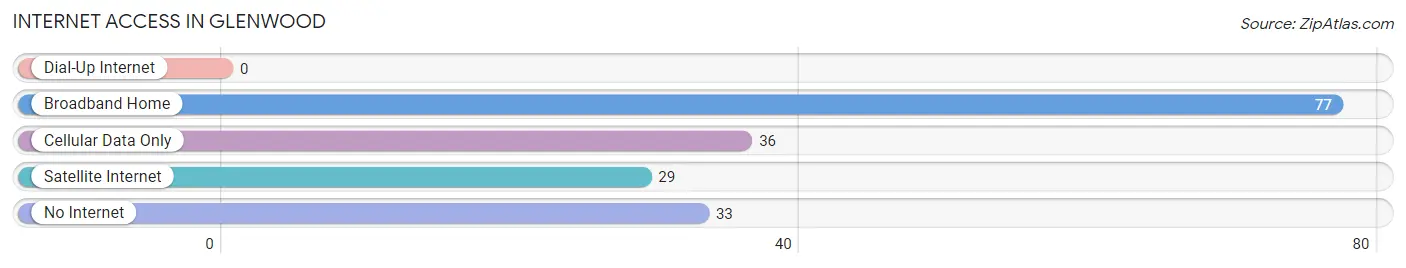
| Internet Type | # Households | % Households |
| Dial-Up Internet | 0 | 0.0% |
| Broadband Home | 77 | 45.0% |
| Cellular Data Only | 36 | 21.0% |
| Satellite Internet | 29 | 17.0% |
| No Internet | 33 | 19.3% |
| Total | 171 | 100.0% |
Glenwood Summary
Glenwood is a small town located in the state of Indiana, in the United States. It is situated in the northwest corner of the state, in the county of Porter. The town has a population of approximately 1,500 people, and is part of the Chicago metropolitan area.
Geography
Glenwood is located in the northwest corner of Indiana, in the county of Porter. It is situated on the banks of the Kankakee River, and is surrounded by the towns of Hebron, Valparaiso, and Chesterton. The town is located approximately 40 miles from Chicago, and is part of the Chicago metropolitan area. The town is situated on a flat plain, and is surrounded by rolling hills and wooded areas. The climate in Glenwood is humid continental, with hot summers and cold winters.
History
Glenwood was founded in 1836 by a group of settlers from New York. The town was originally named “Glenwood” after the nearby Glenwood Creek. The town was incorporated in 1837, and the first post office was established in 1838. The town grew slowly, and by the late 19th century, it had become a popular summer resort destination. The town was also known for its brickyards, which produced bricks for many of the buildings in the area.
In the early 20th century, the town began to decline, as many of the businesses and industries moved away. The town was revitalized in the 1950s, when the Indiana Toll Road was built through the area. This brought new businesses and industries to the area, and the town began to grow again.
Economy
The economy of Glenwood is largely based on manufacturing and agriculture. The town is home to several manufacturing companies, including a steel mill, a paper mill, and a plastics factory. The town is also home to several agricultural businesses, including a dairy farm, a vegetable farm, and a fruit farm. The town is also home to several retail stores, restaurants, and other businesses.
Demographics
As of the 2010 census, the population of Glenwood was 1,500 people. The racial makeup of the town was 95.3% White, 0.7% African American, 0.3% Native American, 0.7% Asian, 0.3% from other races, and 2.7% from two or more races. The median household income was $45,000, and the median family income was $50,000. The per capita income was $20,000.
Conclusion
Glenwood is a small town located in the northwest corner of Indiana. It has a population of approximately 1,500 people, and is part of the Chicago metropolitan area. The town has a long history, and its economy is largely based on manufacturing and agriculture. The town has a diverse population, with a median household income of $45,000.
Common Questions
What is Per Capita Income in Glenwood?
Per Capita income in Glenwood is $28,927.
What is the Median Family Income in Glenwood?
Median Family Income in Glenwood is $65,750.
What is the Median Household income in Glenwood?
Median Household Income in Glenwood is $64,375.
What is Income or Wage Gap in Glenwood?
Income or Wage Gap in Glenwood is 28.5%.
Women in Glenwood earn 71.5 cents for every dollar earned by a man.
What is Inequality or Gini Index in Glenwood?
Inequality or Gini Index in Glenwood is 0.35.
What is the Total Population of Glenwood?
Total Population of Glenwood is 403.
What is the Total Male Population of Glenwood?
Total Male Population of Glenwood is 212.
What is the Total Female Population of Glenwood?
Total Female Population of Glenwood is 191.
What is the Ratio of Males per 100 Females in Glenwood?
There are 110.99 Males per 100 Females in Glenwood.
What is the Ratio of Females per 100 Males in Glenwood?
There are 90.09 Females per 100 Males in Glenwood.
What is the Median Population Age in Glenwood?
Median Population Age in Glenwood is 49.5 Years.
What is the Average Family Size in Glenwood
Average Family Size in Glenwood is 2.6 People.
What is the Average Household Size in Glenwood
Average Household Size in Glenwood is 2.4 People.
How Large is the Labor Force in Glenwood?
There are 270 People in the Labor Forcein in Glenwood.
What is the Percentage of People in the Labor Force in Glenwood?
73.4% of People are in the Labor Force in Glenwood.
What is the Unemployment Rate in Glenwood?
Unemployment Rate in Glenwood is 2.6%.