Zip Codes with the Highest Percentage of Local Government Employees in Evansville, IN
RELATED REPORTS & OPTIONS
Local Government Employees
Evansville
Compare Zip Codes
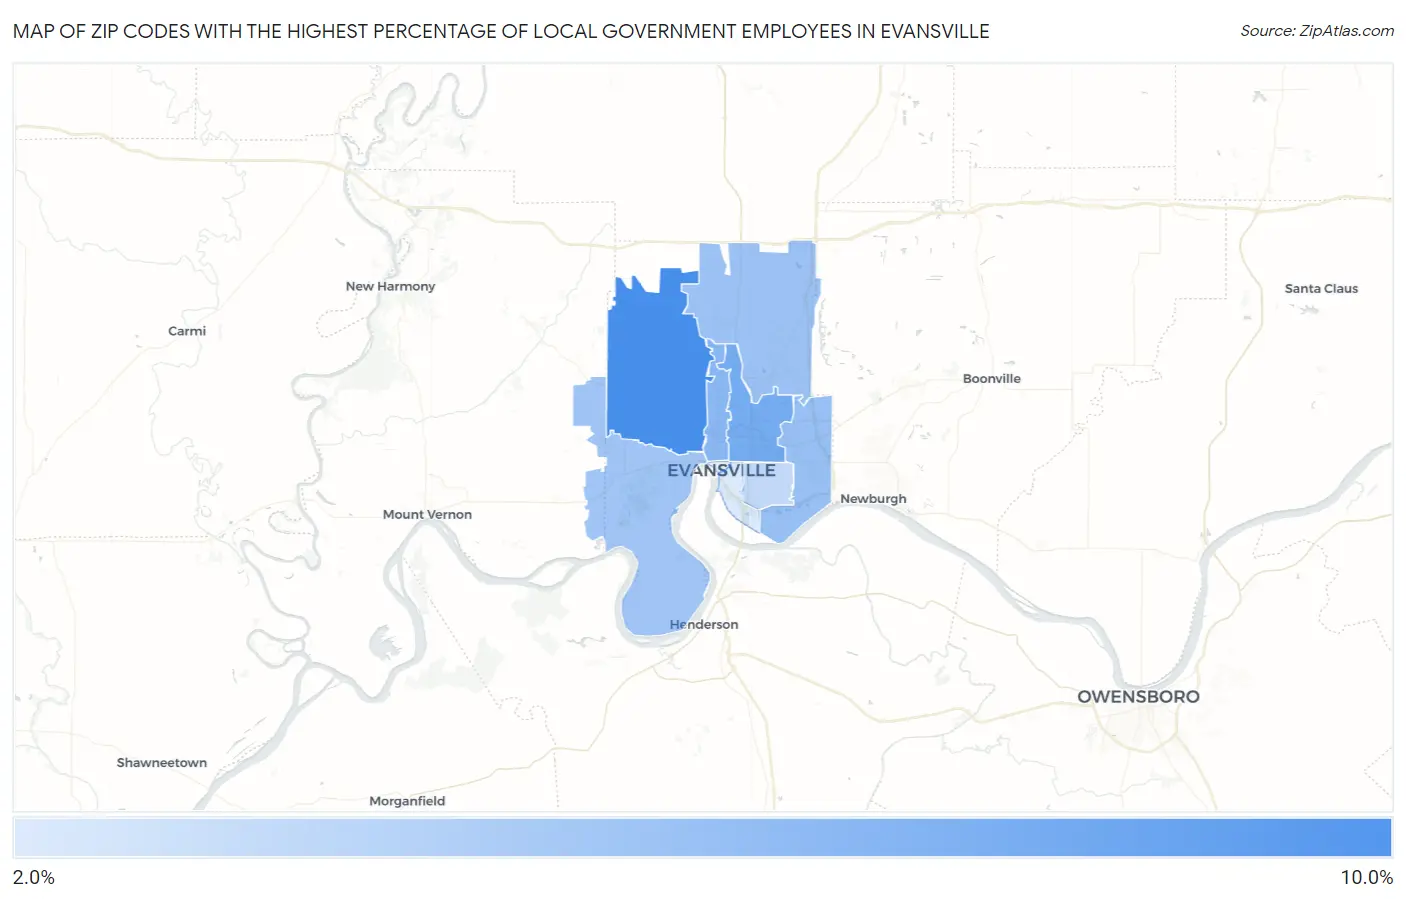
Map of Zip Codes with the Highest Percentage of Local Government Employees in Evansville
2.5%
9.4%
Zip Codes with the Highest Percentage of Local Government Employees in Evansville, IN
| Zip Code | % Local Government Employees | vs State | vs National | |
| 1. | 47720 | 9.4% | 6.2%(+3.25)#135 | 7.2%(+2.20)#9,527 |
| 2. | 47711 | 7.3% | 6.2%(+1.13)#274 | 7.2%(+0.079)#15,366 |
| 3. | 47710 | 6.3% | 6.2%(+0.149)#349 | 7.2%(-0.907)#18,724 |
| 4. | 47715 | 5.7% | 6.2%(-0.493)#417 | 7.2%(-1.55)#20,871 |
| 5. | 47725 | 5.5% | 6.2%(-0.644)#438 | 7.2%(-1.70)#21,408 |
| 6. | 47712 | 5.3% | 6.2%(-0.906)#466 | 7.2%(-1.96)#22,228 |
| 7. | 47714 | 3.8% | 6.2%(-2.40)#601 | 7.2%(-3.46)#26,210 |
| 8. | 47713 | 2.5% | 6.2%(-3.63)#661 | 7.2%(-4.68)#28,146 |
1
Common Questions
What are the Top 5 Zip Codes with the Highest Percentage of Local Government Employees in Evansville, IN?
Top 5 Zip Codes with the Highest Percentage of Local Government Employees in Evansville, IN are:
What zip code has the Highest Percentage of Local Government Employees in Evansville, IN?
47720 has the Highest Percentage of Local Government Employees in Evansville, IN with 9.4%.
What is the Percentage of Local Government Employees in Evansville, IN?
Percentage of Local Government Employees in Evansville is 5.3%.
What is the Percentage of Local Government Employees in Indiana?
Percentage of Local Government Employees in Indiana is 6.2%.
What is the Percentage of Local Government Employees in the United States?
Percentage of Local Government Employees in the United States is 7.2%.