Zip Codes with the Highest Percentage of Local Government Employees in Hammond, IN
RELATED REPORTS & OPTIONS
Local Government Employees
Hammond
Compare Zip Codes
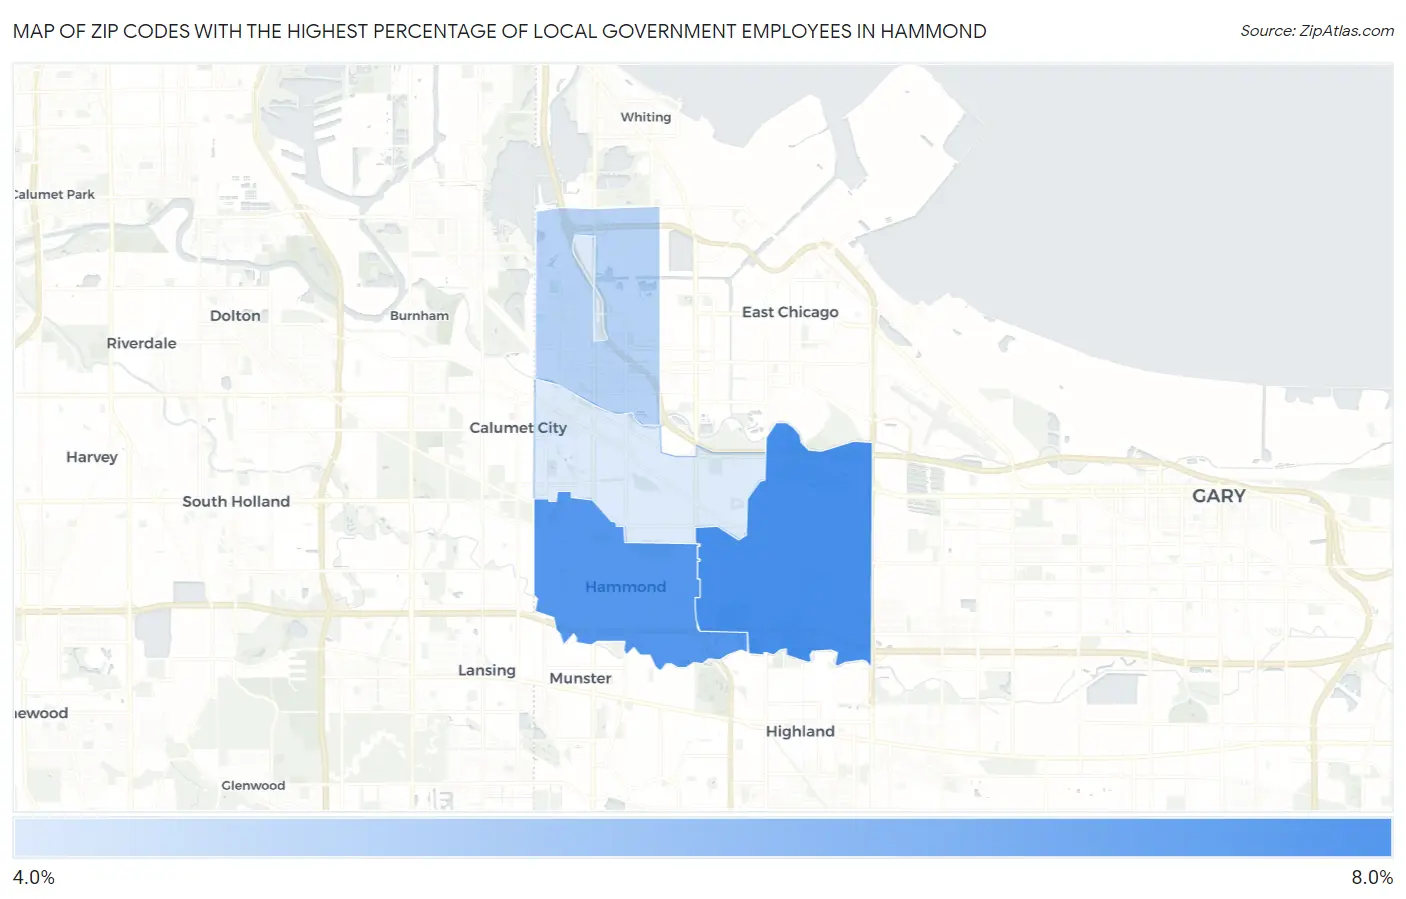
Map of Zip Codes with the Highest Percentage of Local Government Employees in Hammond
4.7%
6.1%
Zip Codes with the Highest Percentage of Local Government Employees in Hammond, IN
| Zip Code | % Local Government Employees | vs State | vs National | |
| 1. | 46323 | 6.1% | 6.2%(-0.105)#379 | 7.2%(-1.16)#19,562 |
| 2. | 46324 | 5.9% | 6.2%(-0.246)#392 | 7.2%(-1.30)#20,023 |
| 3. | 46327 | 5.0% | 6.2%(-1.14)#489 | 7.2%(-2.19)#22,951 |
| 4. | 46320 | 4.7% | 6.2%(-1.51)#518 | 7.2%(-2.57)#23,992 |
1
Common Questions
What are the Top 3 Zip Codes with the Highest Percentage of Local Government Employees in Hammond, IN?
Top 3 Zip Codes with the Highest Percentage of Local Government Employees in Hammond, IN are:
What zip code has the Highest Percentage of Local Government Employees in Hammond, IN?
46323 has the Highest Percentage of Local Government Employees in Hammond, IN with 6.1%.
What is the Percentage of Local Government Employees in Hammond, IN?
Percentage of Local Government Employees in Hammond is 5.5%.
What is the Percentage of Local Government Employees in Indiana?
Percentage of Local Government Employees in Indiana is 6.2%.
What is the Percentage of Local Government Employees in the United States?
Percentage of Local Government Employees in the United States is 7.2%.