Zip Codes with the Highest Percentage of Population Employed in Education Instruction & Library in Indiana
RELATED REPORTS & OPTIONS
Education Instruction & Library
Indiana
Compare Zip Codes
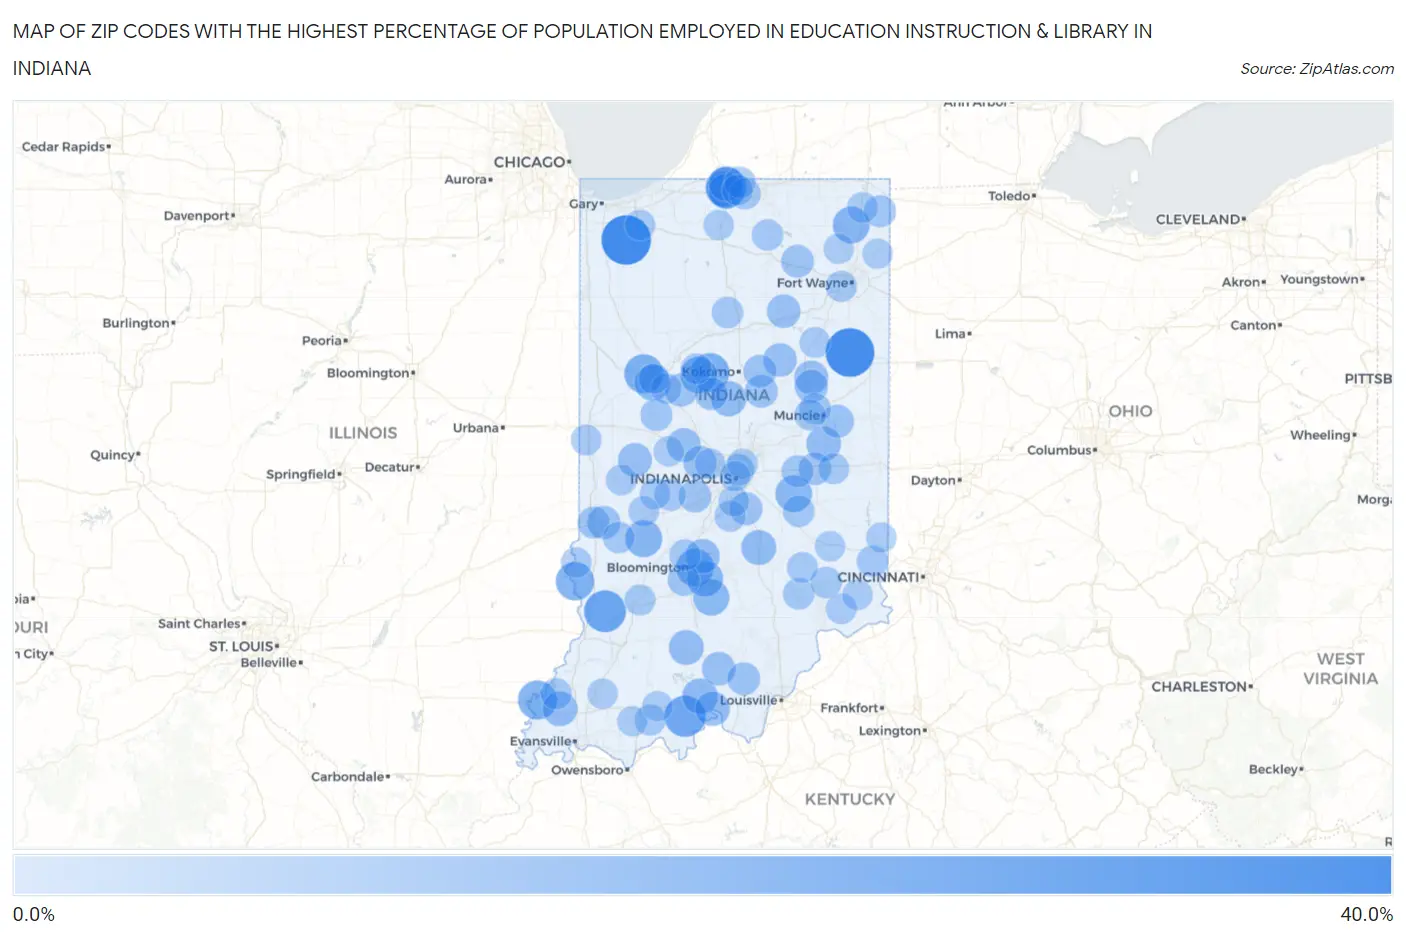
Map of Zip Codes with the Highest Percentage of Population Employed in Education Instruction & Library in Indiana
0.0%
40.0%
Zip Codes with the Highest Percentage of Population Employed in Education Instruction & Library in Indiana
| Zip Code | % Employed | vs State | vs National | |
| 1. | 46302 | 35.7% | 5.8%(+30.0)#1 | 6.2%(+29.5)#170 |
| 2. | 46778 | 34.4% | 5.8%(+28.6)#2 | 6.2%(+28.2)#196 |
| 3. | 47535 | 24.4% | 5.8%(+18.6)#3 | 6.2%(+18.2)#394 |
| 4. | 47514 | 23.5% | 5.8%(+17.8)#4 | 6.2%(+17.3)#431 |
| 5. | 46556 | 22.6% | 5.8%(+16.9)#5 | 6.2%(+16.4)#488 |
| 6. | 47616 | 20.3% | 5.8%(+14.5)#6 | 6.2%(+14.1)#621 |
| 7. | 47906 | 20.2% | 5.8%(+14.5)#7 | 6.2%(+14.1)#629 |
| 8. | 46915 | 20.1% | 5.8%(+14.3)#8 | 6.2%(+13.9)#645 |
| 9. | 47861 | 19.4% | 5.8%(+13.7)#9 | 6.2%(+13.2)#699 |
| 10. | 47405 | 18.3% | 5.8%(+12.5)#10 | 6.2%(+12.1)#802 |
| 11. | 46730 | 17.3% | 5.8%(+11.5)#11 | 6.2%(+11.1)#915 |
| 12. | 47833 | 17.3% | 5.8%(+11.5)#12 | 6.2%(+11.1)#917 |
| 13. | 46144 | 16.9% | 5.8%(+11.2)#13 | 6.2%(+10.8)#951 |
| 14. | 46920 | 16.8% | 5.8%(+11.1)#14 | 6.2%(+10.7)#970 |
| 15. | 47436 | 16.2% | 5.8%(+10.5)#15 | 6.2%(+10.1)#1,062 |
| 16. | 47401 | 16.2% | 5.8%(+10.4)#16 | 6.2%(+10.0)#1,064 |
| 17. | 47901 | 16.2% | 5.8%(+10.4)#17 | 6.2%(+10.0)#1,067 |
| 18. | 46616 | 15.7% | 5.8%(+9.90)#18 | 6.2%(+9.47)#1,162 |
| 19. | 47123 | 15.4% | 5.8%(+9.63)#19 | 6.2%(+9.20)#1,214 |
| 20. | 46617 | 15.0% | 5.8%(+9.27)#20 | 6.2%(+8.85)#1,277 |
| 21. | 46049 | 14.8% | 5.8%(+9.04)#21 | 6.2%(+8.61)#1,323 |
| 22. | 46637 | 14.6% | 5.8%(+8.80)#22 | 6.2%(+8.38)#1,375 |
| 23. | 47280 | 14.5% | 5.8%(+8.71)#23 | 6.2%(+8.28)#1,397 |
| 24. | 47612 | 14.3% | 5.8%(+8.57)#24 | 6.2%(+8.15)#1,440 |
| 25. | 47469 | 14.3% | 5.8%(+8.57)#25 | 6.2%(+8.15)#1,442 |
| 26. | 47361 | 14.1% | 5.8%(+8.33)#26 | 6.2%(+7.90)#1,524 |
| 27. | 47137 | 14.0% | 5.8%(+8.22)#27 | 6.2%(+7.79)#1,546 |
| 28. | 47408 | 13.8% | 5.8%(+8.07)#28 | 6.2%(+7.65)#1,590 |
| 29. | 47989 | 13.1% | 5.8%(+7.37)#29 | 6.2%(+6.94)#1,854 |
| 30. | 46102 | 13.1% | 5.8%(+7.34)#30 | 6.2%(+6.92)#1,865 |
| 31. | 46989 | 12.9% | 5.8%(+7.16)#31 | 6.2%(+6.74)#1,935 |
| 32. | 47125 | 12.7% | 5.8%(+6.91)#32 | 6.2%(+6.49)#2,038 |
| 33. | 46987 | 12.7% | 5.8%(+6.89)#33 | 6.2%(+6.47)#2,045 |
| 34. | 46990 | 12.4% | 5.8%(+6.66)#34 | 6.2%(+6.23)#2,166 |
| 35. | 46167 | 12.4% | 5.8%(+6.60)#35 | 6.2%(+6.18)#2,195 |
| 36. | 47803 | 12.1% | 5.8%(+6.31)#36 | 6.2%(+5.89)#2,350 |
| 37. | 46058 | 12.0% | 5.8%(+6.26)#37 | 6.2%(+5.84)#2,379 |
| 38. | 46957 | 12.0% | 5.8%(+6.24)#38 | 6.2%(+5.82)#2,389 |
| 39. | 47383 | 11.8% | 5.8%(+6.06)#39 | 6.2%(+5.63)#2,494 |
| 40. | 47164 | 11.6% | 5.8%(+5.86)#40 | 6.2%(+5.44)#2,618 |
| 41. | 46076 | 11.6% | 5.8%(+5.85)#41 | 6.2%(+5.42)#2,627 |
| 42. | 46936 | 11.5% | 5.8%(+5.76)#42 | 6.2%(+5.34)#2,686 |
| 43. | 46764 | 11.5% | 5.8%(+5.71)#43 | 6.2%(+5.29)#2,724 |
| 44. | 46184 | 11.4% | 5.8%(+5.63)#44 | 6.2%(+5.21)#2,790 |
| 45. | 46057 | 11.2% | 5.8%(+5.47)#45 | 6.2%(+5.05)#2,900 |
| 46. | 46118 | 11.2% | 5.8%(+5.42)#46 | 6.2%(+5.00)#2,929 |
| 47. | 47385 | 11.1% | 5.8%(+5.30)#47 | 6.2%(+4.88)#3,018 |
| 48. | 47955 | 10.6% | 5.8%(+4.85)#48 | 6.2%(+4.43)#3,351 |
| 49. | 47403 | 10.4% | 5.8%(+4.61)#49 | 6.2%(+4.19)#3,578 |
| 50. | 46742 | 10.4% | 5.8%(+4.61)#50 | 6.2%(+4.19)#3,579 |
| 51. | 46117 | 10.3% | 5.8%(+4.55)#51 | 6.2%(+4.12)#3,641 |
| 52. | 47809 | 10.2% | 5.8%(+4.49)#52 | 6.2%(+4.06)#3,695 |
| 53. | 46150 | 9.8% | 5.8%(+4.03)#53 | 6.2%(+3.61)#4,184 |
| 54. | 47282 | 9.8% | 5.8%(+4.02)#54 | 6.2%(+3.59)#4,202 |
| 55. | 46988 | 9.8% | 5.8%(+4.01)#55 | 6.2%(+3.59)#4,208 |
| 56. | 46128 | 9.7% | 5.8%(+3.95)#56 | 6.2%(+3.53)#4,277 |
| 57. | 47304 | 9.6% | 5.8%(+3.88)#57 | 6.2%(+3.45)#4,348 |
| 58. | 46205 | 9.6% | 5.8%(+3.88)#58 | 6.2%(+3.45)#4,350 |
| 59. | 47846 | 9.6% | 5.8%(+3.86)#59 | 6.2%(+3.44)#4,376 |
| 60. | 46542 | 9.5% | 5.8%(+3.79)#60 | 6.2%(+3.36)#4,472 |
| 61. | 46561 | 9.5% | 5.8%(+3.75)#61 | 6.2%(+3.32)#4,516 |
| 62. | 47022 | 9.5% | 5.8%(+3.72)#62 | 6.2%(+3.29)#4,554 |
| 63. | 47023 | 9.4% | 5.8%(+3.61)#63 | 6.2%(+3.19)#4,693 |
| 64. | 46530 | 9.3% | 5.8%(+3.57)#64 | 6.2%(+3.14)#4,755 |
| 65. | 47404 | 9.3% | 5.8%(+3.56)#65 | 6.2%(+3.14)#4,766 |
| 66. | 47579 | 9.2% | 5.8%(+3.44)#66 | 6.2%(+3.01)#4,942 |
| 67. | 46804 | 9.1% | 5.8%(+3.32)#67 | 6.2%(+2.89)#5,111 |
| 68. | 47665 | 9.0% | 5.8%(+3.29)#68 | 6.2%(+2.86)#5,159 |
| 69. | 47396 | 9.0% | 5.8%(+3.27)#69 | 6.2%(+2.85)#5,184 |
| 70. | 47387 | 8.9% | 5.8%(+3.18)#70 | 6.2%(+2.75)#5,340 |
| 71. | 47449 | 8.9% | 5.8%(+3.17)#71 | 6.2%(+2.75)#5,346 |
| 72. | 47283 | 8.9% | 5.8%(+3.12)#72 | 6.2%(+2.70)#5,428 |
| 73. | 46106 | 8.9% | 5.8%(+3.11)#73 | 6.2%(+2.69)#5,443 |
| 74. | 47872 | 8.7% | 5.8%(+2.98)#74 | 6.2%(+2.55)#5,655 |
| 75. | 46545 | 8.7% | 5.8%(+2.97)#75 | 6.2%(+2.54)#5,664 |
| 76. | 47974 | 8.7% | 5.8%(+2.93)#76 | 6.2%(+2.50)#5,752 |
| 77. | 46135 | 8.7% | 5.8%(+2.91)#77 | 6.2%(+2.48)#5,787 |
| 78. | 46792 | 8.6% | 5.8%(+2.86)#78 | 6.2%(+2.44)#5,881 |
| 79. | 46779 | 8.6% | 5.8%(+2.86)#79 | 6.2%(+2.44)#5,882 |
| 80. | 47224 | 8.6% | 5.8%(+2.85)#80 | 6.2%(+2.43)#5,911 |
| 81. | 46913 | 8.5% | 5.8%(+2.76)#81 | 6.2%(+2.33)#6,060 |
| 82. | 46171 | 8.5% | 5.8%(+2.75)#82 | 6.2%(+2.32)#6,076 |
| 83. | 47941 | 8.4% | 5.8%(+2.68)#83 | 6.2%(+2.25)#6,210 |
| 84. | 47904 | 8.4% | 5.8%(+2.65)#84 | 6.2%(+2.23)#6,267 |
| 85. | 47849 | 8.3% | 5.8%(+2.55)#85 | 6.2%(+2.12)#6,512 |
| 86. | 46142 | 8.3% | 5.8%(+2.53)#86 | 6.2%(+2.10)#6,552 |
| 87. | 46112 | 8.3% | 5.8%(+2.51)#87 | 6.2%(+2.09)#6,574 |
| 88. | 46383 | 8.2% | 5.8%(+2.47)#88 | 6.2%(+2.05)#6,658 |
| 89. | 47263 | 8.1% | 5.8%(+2.35)#89 | 6.2%(+1.92)#6,917 |
| 90. | 46537 | 8.1% | 5.8%(+2.30)#90 | 6.2%(+1.88)#7,023 |
| 91. | 47660 | 8.1% | 5.8%(+2.30)#91 | 6.2%(+1.88)#7,024 |
| 92. | 47537 | 8.1% | 5.8%(+2.30)#92 | 6.2%(+1.87)#7,033 |
| 93. | 47018 | 8.1% | 5.8%(+2.30)#93 | 6.2%(+1.87)#7,036 |
| 94. | 46220 | 8.0% | 5.8%(+2.29)#94 | 6.2%(+1.86)#7,062 |
| 95. | 46788 | 8.0% | 5.8%(+2.29)#95 | 6.2%(+1.86)#7,066 |
| 96. | 47968 | 8.0% | 5.8%(+2.28)#96 | 6.2%(+1.86)#7,068 |
| 97. | 46202 | 8.0% | 5.8%(+2.27)#97 | 6.2%(+1.84)#7,095 |
| 98. | 46763 | 8.0% | 5.8%(+2.26)#98 | 6.2%(+1.84)#7,109 |
| 99. | 47532 | 8.0% | 5.8%(+2.22)#99 | 6.2%(+1.80)#7,193 |
| 100. | 47016 | 8.0% | 5.8%(+2.20)#100 | 6.2%(+1.78)#7,249 |
Common Questions
What are the Top 10 Zip Codes with the Highest Percentage of Population Employed in Education Instruction & Library in Indiana?
Top 10 Zip Codes with the Highest Percentage of Population Employed in Education Instruction & Library in Indiana are:
What zip code has the Highest Percentage of Population Employed in Education Instruction & Library in Indiana?
46302 has the Highest Percentage of Population Employed in Education Instruction & Library in Indiana with 35.7%.
What is the Percentage of Population Employed in Education Instruction & Library in the State of Indiana?
Percentage of Population Employed in Education Instruction & Library in Indiana is 5.8%.
What is the Percentage of Population Employed in Education Instruction & Library in the United States?
Percentage of Population Employed in Education Instruction & Library in the United States is 6.2%.