Sweet Grass, MT Map & Demographics
Sweet Grass Map
Sweet Grass Overview
$41,860
PER CAPITA INCOME
$75,263
AVG HOUSEHOLD INCOME
0.06
INEQUALITY / GINI INDEX
70
TOTAL POPULATION
38
MALE POPULATION
32
FEMALE POPULATION
118.75
MALES / 100 FEMALES
84.21
FEMALES / 100 MALES
62.6
MEDIAN AGE
1.8
AVG FAMILY SIZE
1.9
AVG HOUSEHOLD SIZE
39
LABOR FORCE [ PEOPLE ]
55.7%
PERCENT IN LABOR FORCE
Sweet Grass Zip Codes
Sweet Grass Area Codes
Income in Sweet Grass
Income Overview in Sweet Grass
| Characteristic | Number | Measure |
| Per Capita Income | 70 | $41,860 |
| Median Family Income | 12 | $0 |
| Mean Family Income | 12 | $0 |
| Median Household Income | 36 | $75,263 |
| Mean Household Income | 36 | $74,389 |
| Income Deficit | 12 | $0 |
| Wage / Income Gap (%) | 70 | 0.00% |
| Wage / Income Gap ($) | 70 | 100.00¢ per $1 |
| Gini / Inequality Index | 70 | 0.06 |
Earnings by Sex in Sweet Grass
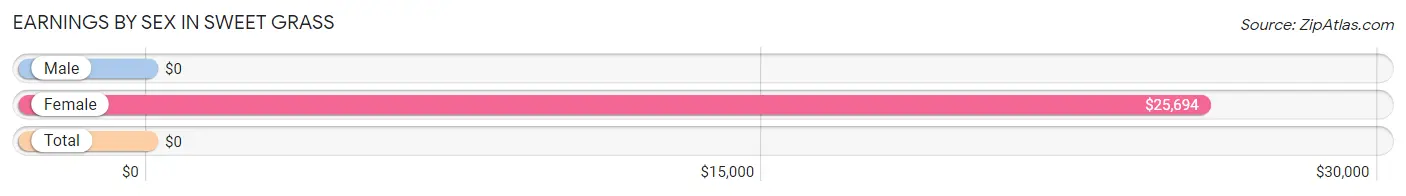
| Sex | Number | Average Earnings |
| Male | 26 (66.7%) | $0 |
| Female | 13 (33.3%) | $25,694 |
| Total | 39 (100.0%) | $0 |
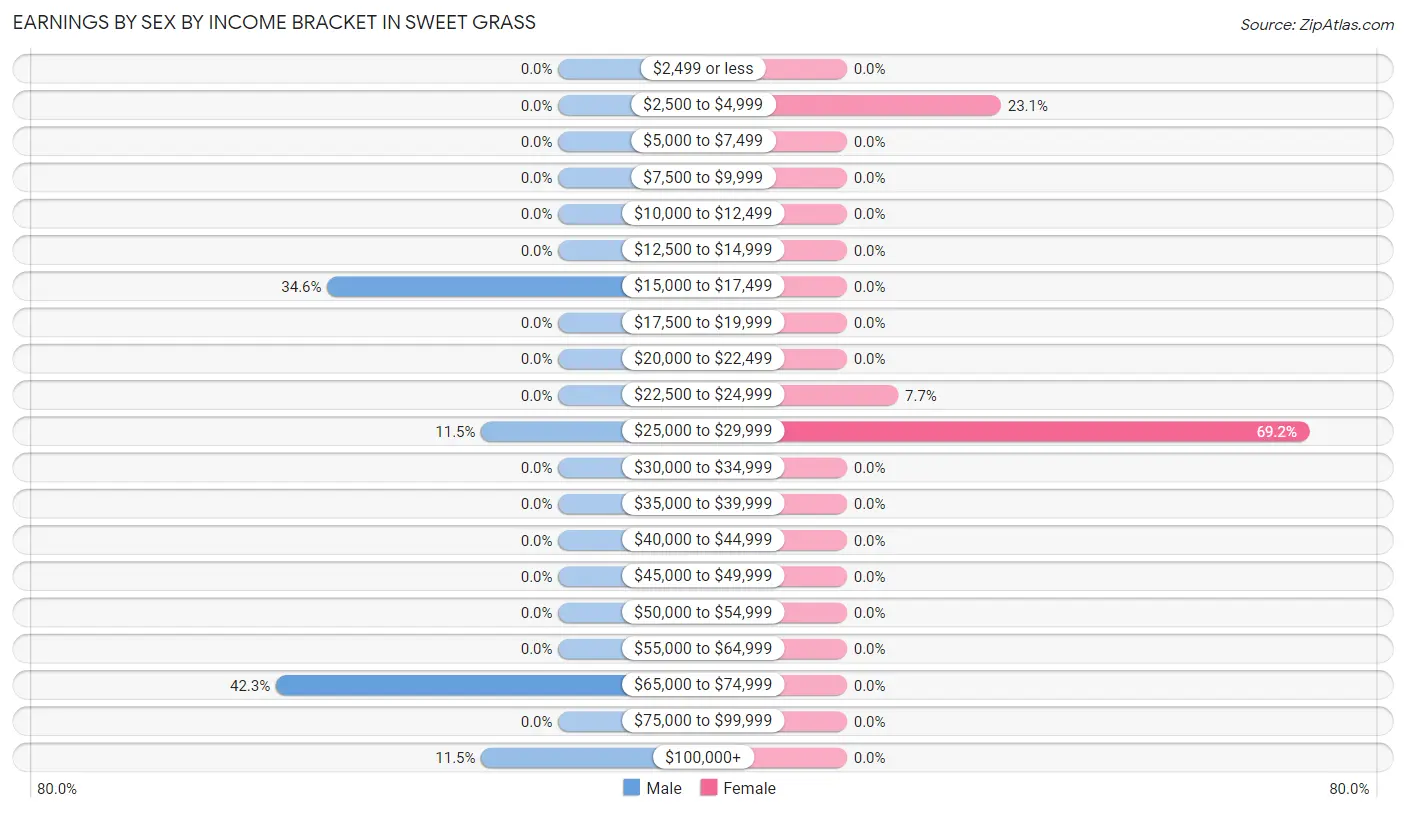
Earnings by Sex by Income Bracket in Sweet Grass
The most common earnings brackets in Sweet Grass are $65,000 to $74,999 for men (11 | 42.3%) and $25,000 to $29,999 for women (9 | 69.2%).
| Income | Male | Female |
| $2,499 or less | 0 (0.0%) | 0 (0.0%) |
| $2,500 to $4,999 | 0 (0.0%) | 3 (23.1%) |
| $5,000 to $7,499 | 0 (0.0%) | 0 (0.0%) |
| $7,500 to $9,999 | 0 (0.0%) | 0 (0.0%) |
| $10,000 to $12,499 | 0 (0.0%) | 0 (0.0%) |
| $12,500 to $14,999 | 0 (0.0%) | 0 (0.0%) |
| $15,000 to $17,499 | 9 (34.6%) | 0 (0.0%) |
| $17,500 to $19,999 | 0 (0.0%) | 0 (0.0%) |
| $20,000 to $22,499 | 0 (0.0%) | 0 (0.0%) |
| $22,500 to $24,999 | 0 (0.0%) | 1 (7.7%) |
| $25,000 to $29,999 | 3 (11.5%) | 9 (69.2%) |
| $30,000 to $34,999 | 0 (0.0%) | 0 (0.0%) |
| $35,000 to $39,999 | 0 (0.0%) | 0 (0.0%) |
| $40,000 to $44,999 | 0 (0.0%) | 0 (0.0%) |
| $45,000 to $49,999 | 0 (0.0%) | 0 (0.0%) |
| $50,000 to $54,999 | 0 (0.0%) | 0 (0.0%) |
| $55,000 to $64,999 | 0 (0.0%) | 0 (0.0%) |
| $65,000 to $74,999 | 11 (42.3%) | 0 (0.0%) |
| $75,000 to $99,999 | 0 (0.0%) | 0 (0.0%) |
| $100,000+ | 3 (11.5%) | 0 (0.0%) |
| Total | 26 (100.0%) | 13 (100.0%) |
Earnings by Sex by Educational Attainment in Sweet Grass
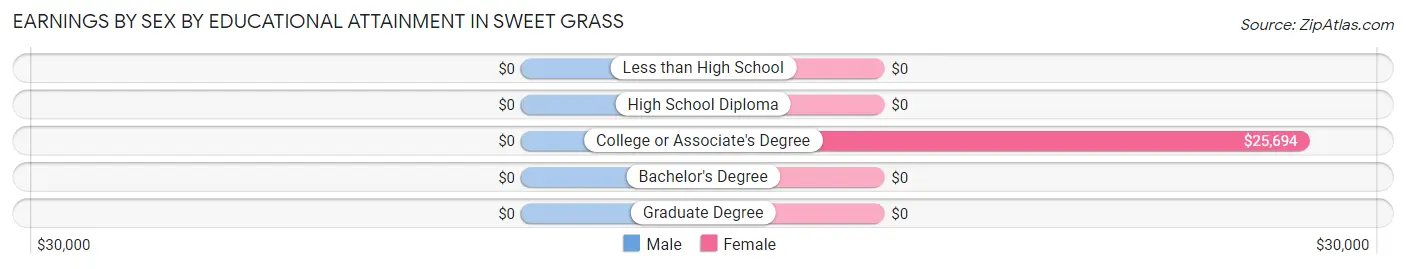
| Educational Attainment | Male Income | Female Income |
| Less than High School | - | - |
| High School Diploma | - | - |
| College or Associate's Degree | - | - |
| Bachelor's Degree | - | - |
| Graduate Degree | - | - |
| Total | - | - |
Family Income in Sweet Grass
Family Income Brackets in Sweet Grass
According to the Sweet Grass family income data, there are 12 families falling into the $50,000 to $74,999 income range, which is the most common income bracket and makes up 100.0% of all families.
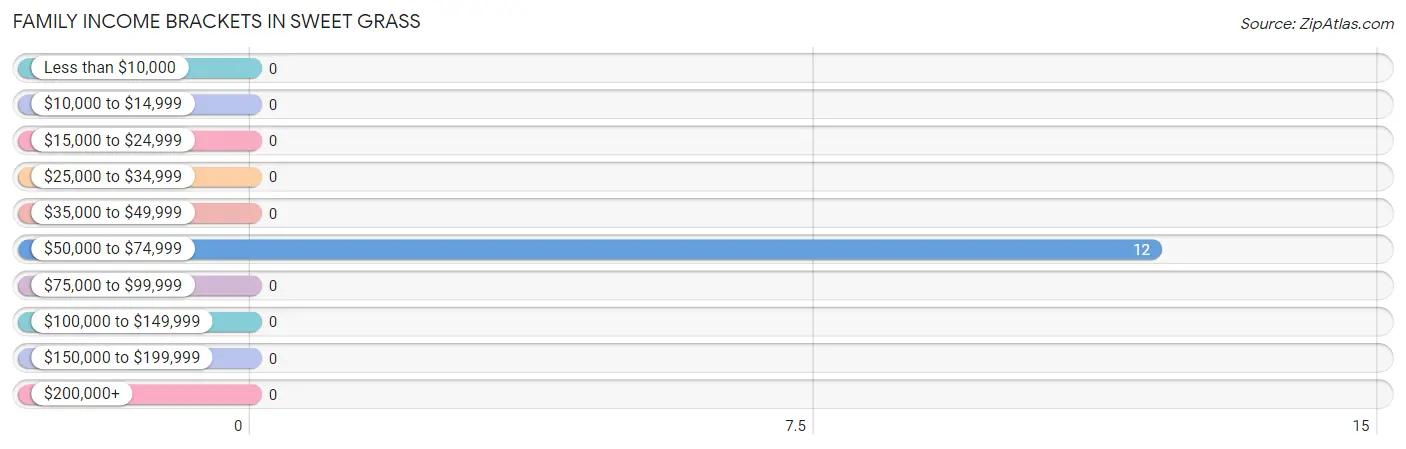
| Income Bracket | # Families | % Families |
| Less than $10,000 | 0 | 0.0% |
| $10,000 to $14,999 | 0 | 0.0% |
| $15,000 to $24,999 | 0 | 0.0% |
| $25,000 to $34,999 | 0 | 0.0% |
| $35,000 to $49,999 | 0 | 0.0% |
| $50,000 to $74,999 | 12 | 100.0% |
| $75,000 to $99,999 | 0 | 0.0% |
| $100,000 to $149,999 | 0 | 0.0% |
| $150,000 to $199,999 | 0 | 0.0% |
| $200,000+ | 0 | 0.0% |
Family Income by Famaliy Size in Sweet Grass
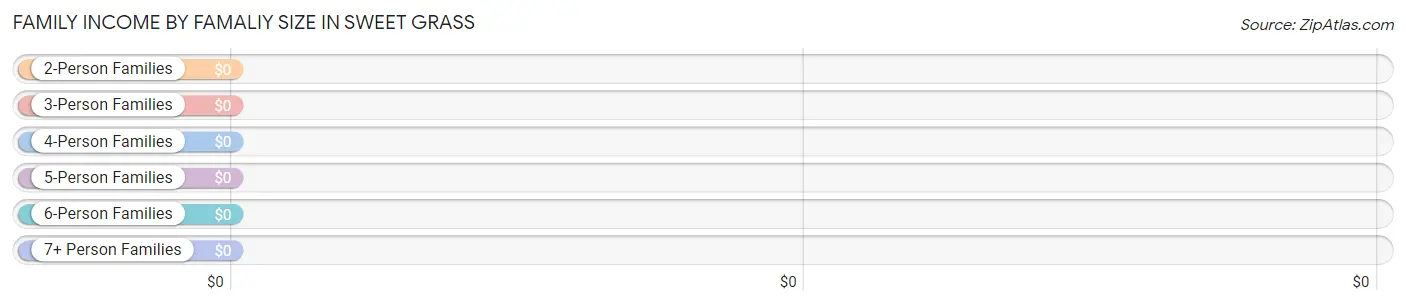
| Income Bracket | # Families | Median Income |
| 2-Person Families | 12 (100.0%) | $0 |
| 3-Person Families | 0 (0.0%) | $0 |
| 4-Person Families | 0 (0.0%) | $0 |
| 5-Person Families | 0 (0.0%) | $0 |
| 6-Person Families | 0 (0.0%) | $0 |
| 7+ Person Families | 0 (0.0%) | $0 |
| Total | 12 (100.0%) | $0 |
Family Income by Number of Earners in Sweet Grass
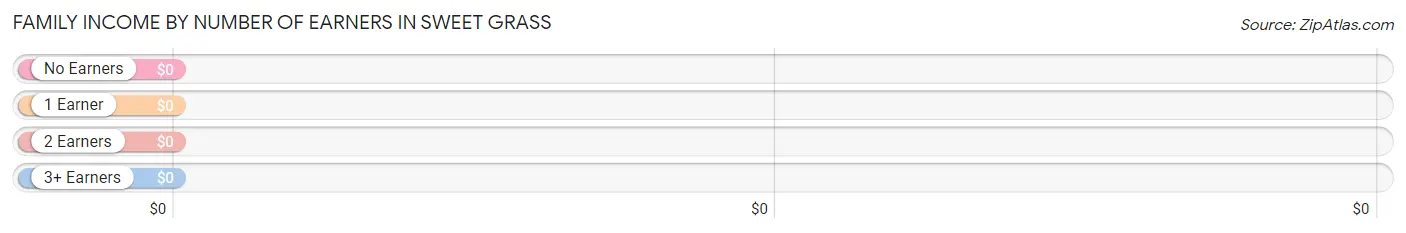
| Number of Earners | # Families | Median Income |
| No Earners | 12 (100.0%) | $0 |
| 1 Earner | 0 (0.0%) | $0 |
| 2 Earners | 0 (0.0%) | $0 |
| 3+ Earners | 0 (0.0%) | $0 |
| Total | 12 (100.0%) | $0 |
Household Income in Sweet Grass
Household Income Brackets in Sweet Grass
With 19 households falling in the category, the $75,000 to $99,999 income range is the most frequent in Sweet Grass, accounting for 52.8% of all households.
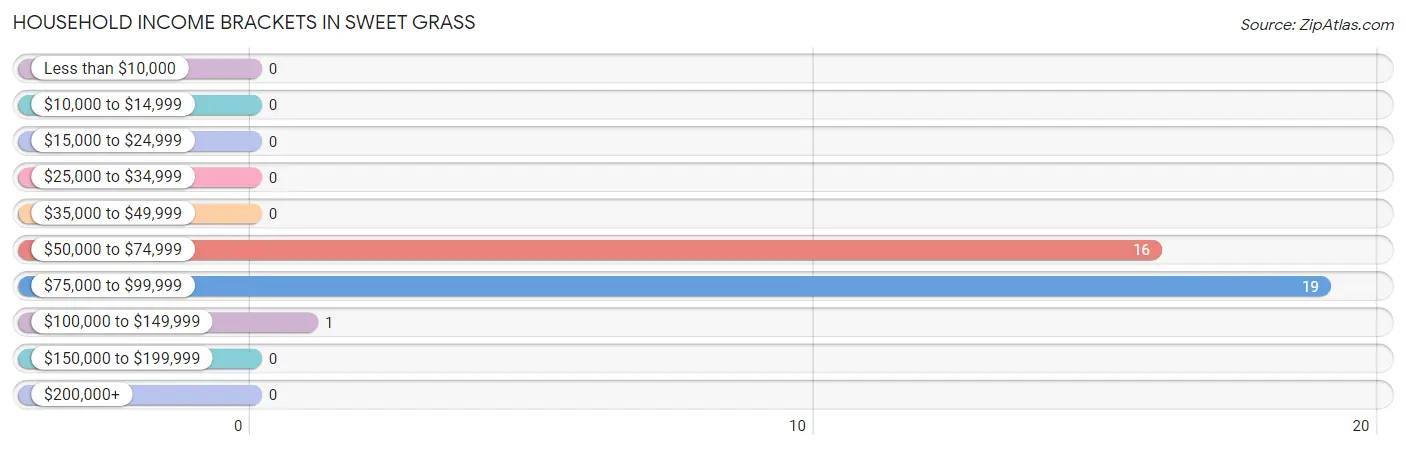
| Income Bracket | # Households | % Households |
| Less than $10,000 | 0 | 0.0% |
| $10,000 to $14,999 | 0 | 0.0% |
| $15,000 to $24,999 | 0 | 0.0% |
| $25,000 to $34,999 | 0 | 0.0% |
| $35,000 to $49,999 | 0 | 0.0% |
| $50,000 to $74,999 | 16 | 44.4% |
| $75,000 to $99,999 | 19 | 52.8% |
| $100,000 to $149,999 | 1 | 2.8% |
| $150,000 to $199,999 | 0 | 0.0% |
| $200,000+ | 0 | 0.0% |
Household Income by Householder Age in Sweet Grass
The median household income in Sweet Grass is $75,263, with the highest median household income of $59,750 found in the 45 to 64 years age bracket for the primary householder. A total of 9 households (25.0%) fall into this category.
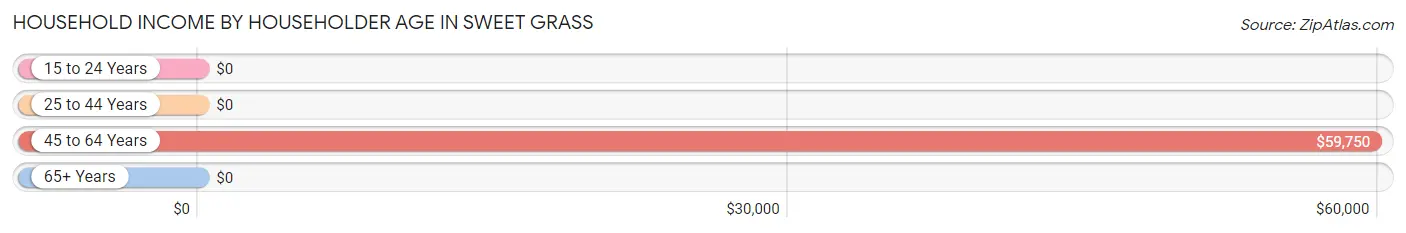
| Income Bracket | # Households | Median Income |
| 15 to 24 Years | 0 (0.0%) | $0 |
| 25 to 44 Years | 11 (30.6%) | $0 |
| 45 to 64 Years | 9 (25.0%) | $59,750 |
| 65+ Years | 16 (44.4%) | $0 |
| Total | 36 (100.0%) | $75,263 |
Poverty in Sweet Grass
Income Below Poverty by Sex and Age in Sweet Grass
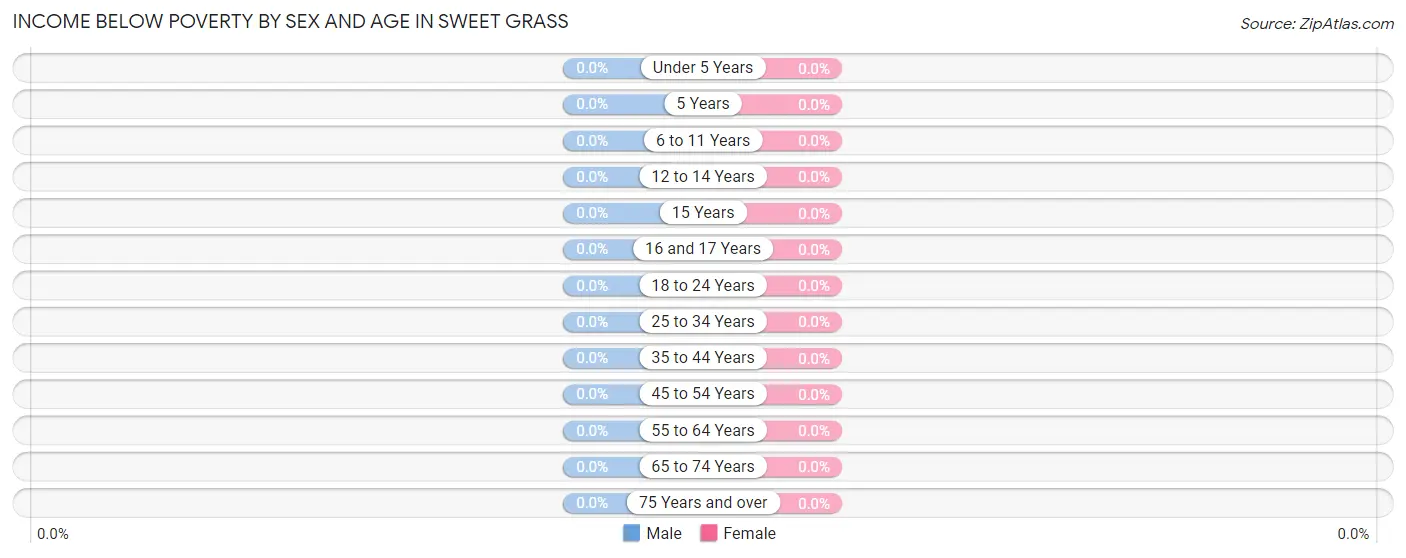
| Age Bracket | Male | Female |
| Under 5 Years | 0 (0.0%) | 0 (0.0%) |
| 5 Years | 0 (0.0%) | 0 (0.0%) |
| 6 to 11 Years | 0 (0.0%) | 0 (0.0%) |
| 12 to 14 Years | 0 (0.0%) | 0 (0.0%) |
| 15 Years | 0 (0.0%) | 0 (0.0%) |
| 16 and 17 Years | 0 (0.0%) | 0 (0.0%) |
| 18 to 24 Years | 0 (0.0%) | 0 (0.0%) |
| 25 to 34 Years | 0 (0.0%) | 0 (0.0%) |
| 35 to 44 Years | 0 (0.0%) | 0 (0.0%) |
| 45 to 54 Years | 0 (0.0%) | 0 (0.0%) |
| 55 to 64 Years | 0 (0.0%) | 0 (0.0%) |
| 65 to 74 Years | 0 (0.0%) | 0 (0.0%) |
| 75 Years and over | 0 (0.0%) | 0 (0.0%) |
| Total | 0 (0.0%) | 0 (0.0%) |
Income Above Poverty by Sex and Age in Sweet Grass
According to the poverty statistics in Sweet Grass, males aged 35 to 44 years and females aged 25 to 34 years are the age groups that are most secure financially, with 100.0% of males and 100.0% of females in these age groups living above the poverty line.
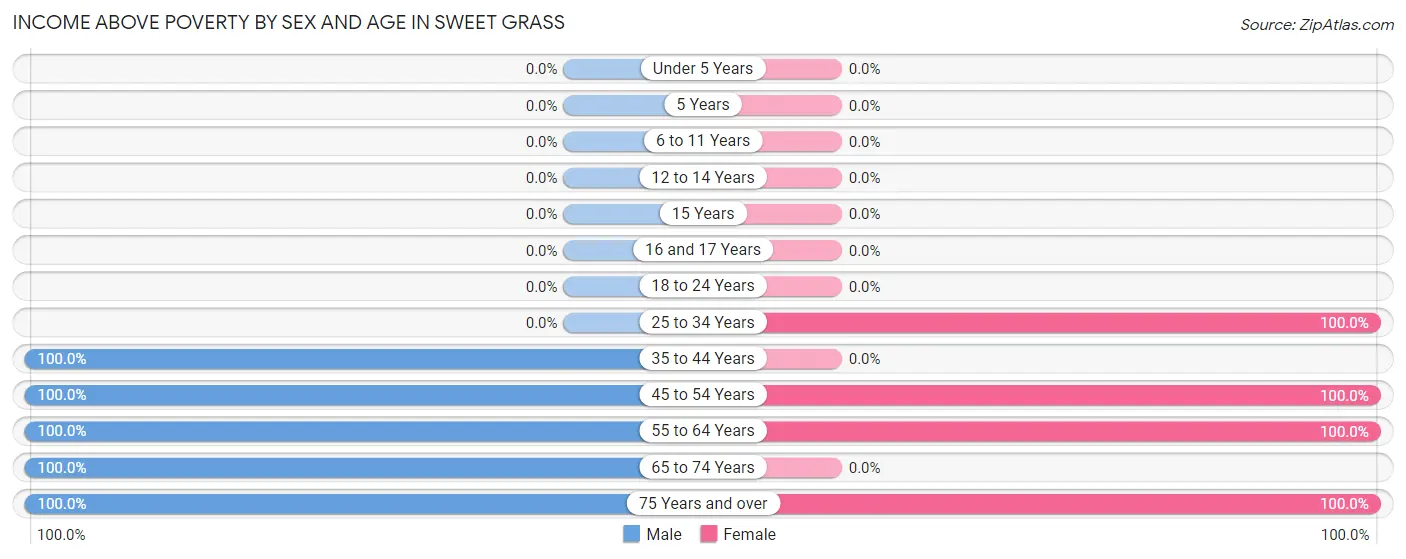
| Age Bracket | Male | Female |
| Under 5 Years | 0 (0.0%) | 0 (0.0%) |
| 5 Years | 0 (0.0%) | 0 (0.0%) |
| 6 to 11 Years | 0 (0.0%) | 0 (0.0%) |
| 12 to 14 Years | 0 (0.0%) | 0 (0.0%) |
| 15 Years | 0 (0.0%) | 0 (0.0%) |
| 16 and 17 Years | 0 (0.0%) | 0 (0.0%) |
| 18 to 24 Years | 0 (0.0%) | 0 (0.0%) |
| 25 to 34 Years | 0 (0.0%) | 12 (100.0%) |
| 35 to 44 Years | 11 (100.0%) | 0 (0.0%) |
| 45 to 54 Years | 3 (100.0%) | 1 (100.0%) |
| 55 to 64 Years | 8 (100.0%) | 5 (100.0%) |
| 65 to 74 Years | 9 (100.0%) | 0 (0.0%) |
| 75 Years and over | 7 (100.0%) | 14 (100.0%) |
| Total | 38 (100.0%) | 32 (100.0%) |
Income Below Poverty Among Married-Couple Families in Sweet Grass
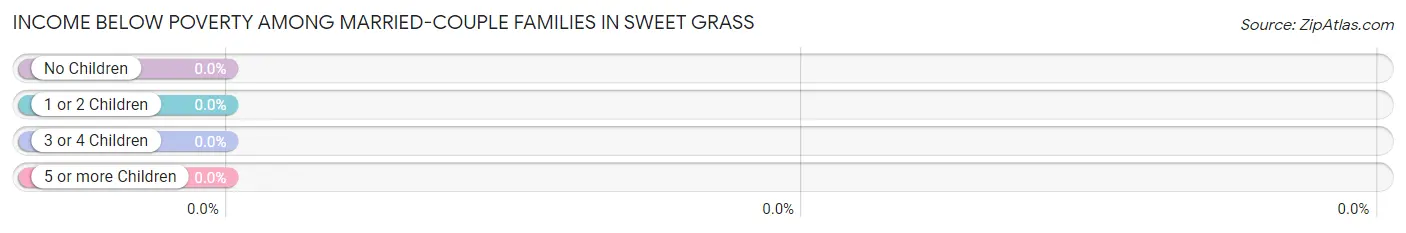
| Children | Above Poverty | Below Poverty |
| No Children | 12 (100.0%) | 0 (0.0%) |
| 1 or 2 Children | 0 (0.0%) | 0 (0.0%) |
| 3 or 4 Children | 0 (0.0%) | 0 (0.0%) |
| 5 or more Children | 0 (0.0%) | 0 (0.0%) |
| Total | 12 (100.0%) | 0 (0.0%) |
Income Below Poverty Among Single-Parent Households in Sweet Grass
| Children | Single Father | Single Mother |
| No Children | 0 (0.0%) | 0 (0.0%) |
| 1 or 2 Children | 0 (0.0%) | 0 (0.0%) |
| 3 or 4 Children | 0 (0.0%) | 0 (0.0%) |
| 5 or more Children | 0 (0.0%) | 0 (0.0%) |
| Total | 0 (0.0%) | 0 (0.0%) |
Income Below Poverty Among Married-Couple vs Single-Parent Households in Sweet Grass
| Children | Married-Couple Families | Single-Parent Households |
| No Children | 0 (0.0%) | 0 (0.0%) |
| 1 or 2 Children | 0 (0.0%) | 0 (0.0%) |
| 3 or 4 Children | 0 (0.0%) | 0 (0.0%) |
| 5 or more Children | 0 (0.0%) | 0 (0.0%) |
| Total | 0 (0.0%) | 0 (0.0%) |
Race in Sweet Grass
The most populous races in Sweet Grass are White / Caucasian (61 | 87.1%), Hispanic or Latino (9 | 12.9%), and Some other Race (9 | 12.9%).
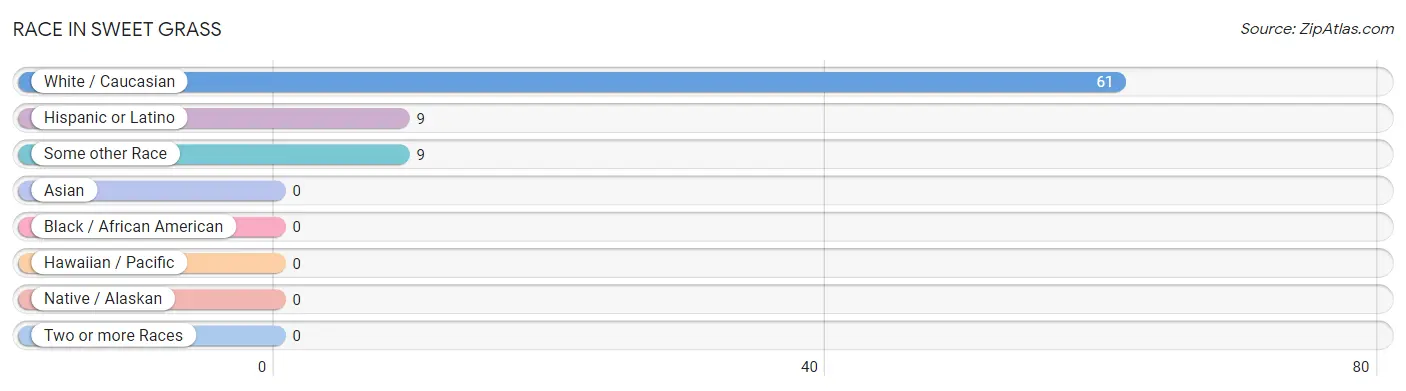
| Race | # Population | % Population |
| Asian | 0 | 0.0% |
| Black / African American | 0 | 0.0% |
| Hawaiian / Pacific | 0 | 0.0% |
| Hispanic or Latino | 9 | 12.9% |
| Native / Alaskan | 0 | 0.0% |
| White / Caucasian | 61 | 87.1% |
| Two or more Races | 0 | 0.0% |
| Some other Race | 9 | 12.9% |
| Total | 70 | 100.0% |
Ancestry in Sweet Grass
The most populous ancestries reported in Sweet Grass are German (17 | 24.3%), Welsh (16 | 22.9%), English (15 | 21.4%), Scottish (12 | 17.1%), and Norwegian (9 | 12.9%), together accounting for 98.6% of all Sweet Grass residents.
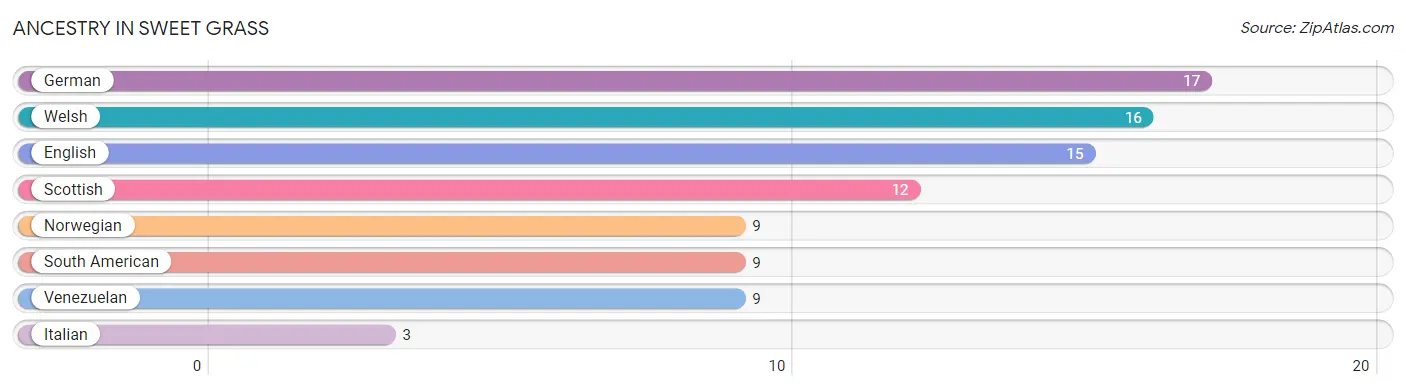
| Ancestry | # Population | % Population |
| English | 15 | 21.4% |
| German | 17 | 24.3% |
| Italian | 3 | 4.3% |
| Norwegian | 9 | 12.9% |
| Scottish | 12 | 17.1% |
| South American | 9 | 12.9% |
| Venezuelan | 9 | 12.9% |
| Welsh | 16 | 22.9% | View All 8 Rows |
Immigrants in Sweet Grass
The most numerous immigrant groups reported in Sweet Grass came from Latin America (9 | 12.9%), South America (9 | 12.9%), and Venezuela (9 | 12.9%), together accounting for 38.6% of all Sweet Grass residents.
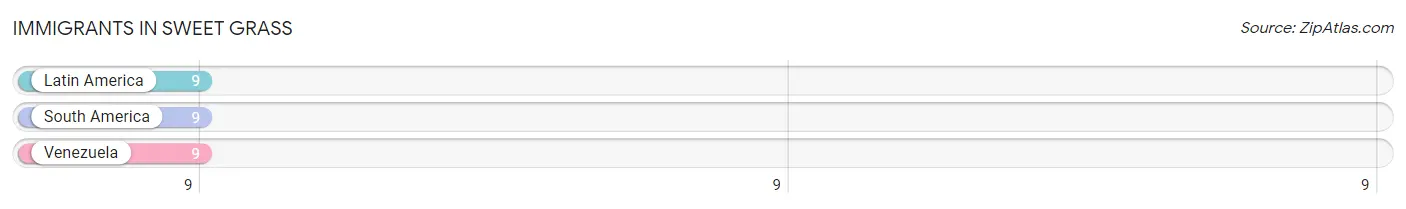
| Immigration Origin | # Population | % Population |
| Latin America | 9 | 12.9% |
| South America | 9 | 12.9% |
| Venezuela | 9 | 12.9% | View All 3 Rows |
Sex and Age in Sweet Grass
Sex and Age in Sweet Grass
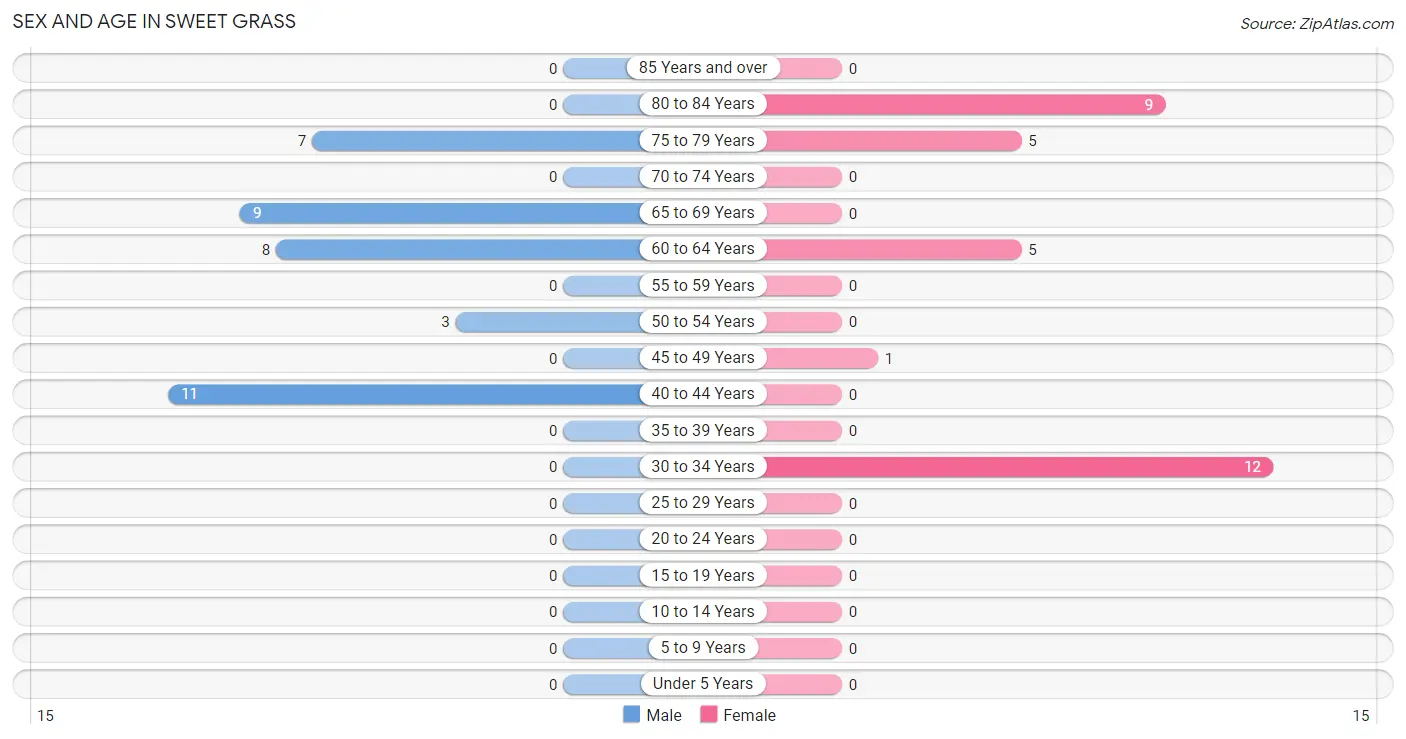
The most populous age groups in Sweet Grass are 40 to 44 Years (11 | 28.9%) for men and 30 to 34 Years (12 | 37.5%) for women.
| Age Bracket | Male | Female |
| Under 5 Years | 0 (0.0%) | 0 (0.0%) |
| 5 to 9 Years | 0 (0.0%) | 0 (0.0%) |
| 10 to 14 Years | 0 (0.0%) | 0 (0.0%) |
| 15 to 19 Years | 0 (0.0%) | 0 (0.0%) |
| 20 to 24 Years | 0 (0.0%) | 0 (0.0%) |
| 25 to 29 Years | 0 (0.0%) | 0 (0.0%) |
| 30 to 34 Years | 0 (0.0%) | 12 (37.5%) |
| 35 to 39 Years | 0 (0.0%) | 0 (0.0%) |
| 40 to 44 Years | 11 (28.9%) | 0 (0.0%) |
| 45 to 49 Years | 0 (0.0%) | 1 (3.1%) |
| 50 to 54 Years | 3 (7.9%) | 0 (0.0%) |
| 55 to 59 Years | 0 (0.0%) | 0 (0.0%) |
| 60 to 64 Years | 8 (21.0%) | 5 (15.6%) |
| 65 to 69 Years | 9 (23.7%) | 0 (0.0%) |
| 70 to 74 Years | 0 (0.0%) | 0 (0.0%) |
| 75 to 79 Years | 7 (18.4%) | 5 (15.6%) |
| 80 to 84 Years | 0 (0.0%) | 9 (28.1%) |
| 85 Years and over | 0 (0.0%) | 0 (0.0%) |
| Total | 38 (100.0%) | 32 (100.0%) |
Families and Households in Sweet Grass
Median Family Size in Sweet Grass
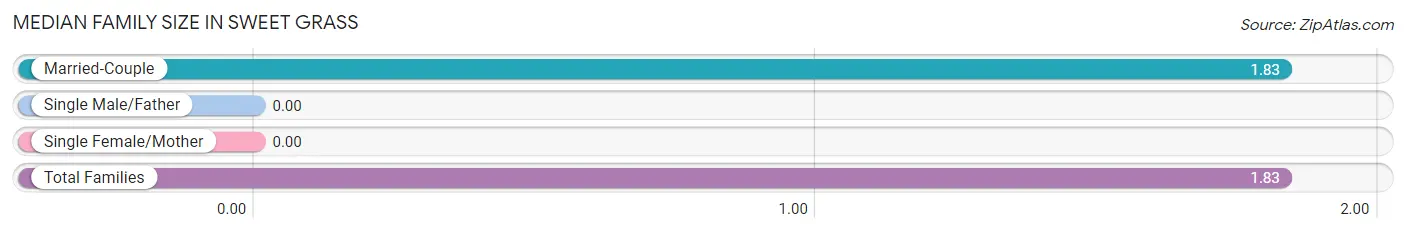
| Family Type | # Families | Family Size |
| Married-Couple | 12 (100.0%) | 1.83 |
| Single Male/Father | 0 (0.0%) | - |
| Single Female/Mother | 0 (0.0%) | - |
| Total Families | 12 (100.0%) | 1.83 |
Median Household Size in Sweet Grass
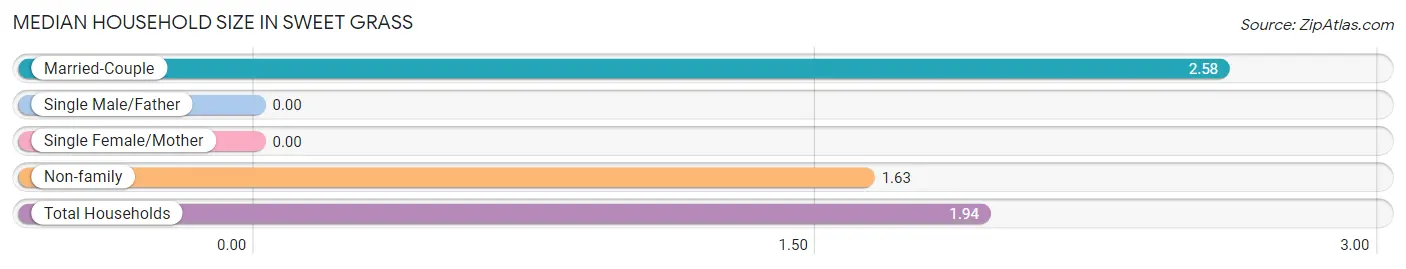
| Household Type | # Households | Household Size |
| Married-Couple | 12 (33.3%) | 2.58 |
| Single Male/Father | 0 (0.0%) | - |
| Single Female/Mother | 0 (0.0%) | - |
| Non-family | 24 (66.7%) | 1.63 |
| Total Households | 36 (100.0%) | 1.94 |
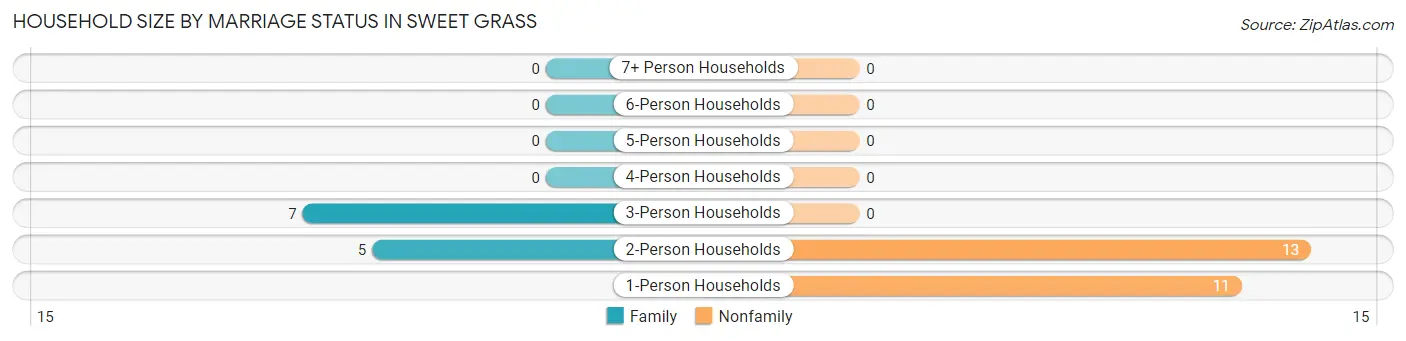
Household Size by Marriage Status in Sweet Grass
Out of a total of 36 households in Sweet Grass, 12 (33.3%) are family households, while 24 (66.7%) are nonfamily households. The most numerous type of family households are 3-person households, comprising 7, and the most common type of nonfamily households are 2-person households, comprising 13.
| Household Size | Family Households | Nonfamily Households |
| 1-Person Households | - | 11 (30.6%) |
| 2-Person Households | 5 (13.9%) | 13 (36.1%) |
| 3-Person Households | 7 (19.4%) | 0 (0.0%) |
| 4-Person Households | 0 (0.0%) | 0 (0.0%) |
| 5-Person Households | 0 (0.0%) | 0 (0.0%) |
| 6-Person Households | 0 (0.0%) | 0 (0.0%) |
| 7+ Person Households | 0 (0.0%) | 0 (0.0%) |
| Total | 12 (33.3%) | 24 (66.7%) |
Female Fertility in Sweet Grass
Fertility by Age in Sweet Grass
| Age Bracket | Women with Births | Births / 1,000 Women |
| 15 to 19 years | 0 (0.0%) | 0.0 |
| 20 to 34 years | 0 (0.0%) | 0.0 |
| 35 to 50 years | 0 (0.0%) | 0.0 |
| Total | 0 (0.0%) | 0.0 |
Fertility by Age by Marriage Status in Sweet Grass
| Age Bracket | Married | Unmarried |
| 15 to 19 years | 0 (0.0%) | 0 (0.0%) |
| 20 to 34 years | 0 (0.0%) | 0 (0.0%) |
| 35 to 50 years | 0 (0.0%) | 0 (0.0%) |
| Total | 0 (0.0%) | 0 (0.0%) |
Fertility by Education in Sweet Grass
| Educational Attainment | Women with Births | Births / 1,000 Women |
| Less than High School | 0 (0.0%) | 0.0 |
| High School Diploma | 0 (0.0%) | 0.0 |
| College or Associate's Degree | 0 (0.0%) | 0.0 |
| Bachelor's Degree | 0 (0.0%) | 0.0 |
| Graduate Degree | 0 (0.0%) | 0.0 |
| Total | 0 (0.0%) | 0.0 |
Fertility by Education by Marriage Status in Sweet Grass
| Educational Attainment | Married | Unmarried |
| Less than High School | 0 (0.0%) | 0 (0.0%) |
| High School Diploma | 0 (0.0%) | 0 (0.0%) |
| College or Associate's Degree | 0 (0.0%) | 0 (0.0%) |
| Bachelor's Degree | 0 (0.0%) | 0 (0.0%) |
| Graduate Degree | 0 (0.0%) | 0 (0.0%) |
| Total | 0 (0.0%) | 0 (0.0%) |
Employment Characteristics in Sweet Grass
Employment by Class of Employer in Sweet Grass
Among the 39 employed individuals in Sweet Grass, private company employees (33 | 84.6%), self-employed (incorporated) (3 | 7.7%), and federal government employees (3 | 7.7%) make up the most common classes of employment.
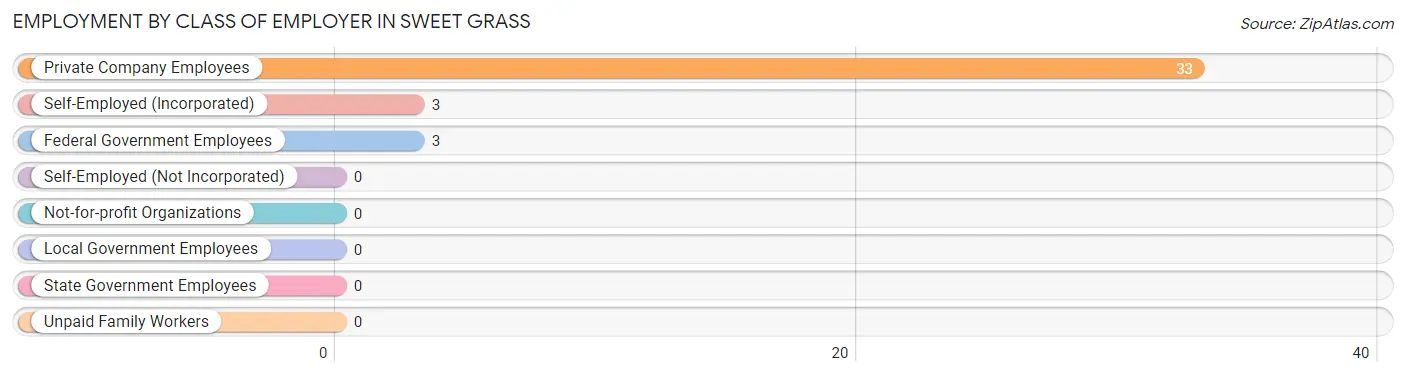
| Employer Class | # Employees | % Employees |
| Private Company Employees | 33 | 84.6% |
| Self-Employed (Incorporated) | 3 | 7.7% |
| Self-Employed (Not Incorporated) | 0 | 0.0% |
| Not-for-profit Organizations | 0 | 0.0% |
| Local Government Employees | 0 | 0.0% |
| State Government Employees | 0 | 0.0% |
| Federal Government Employees | 3 | 7.7% |
| Unpaid Family Workers | 0 | 0.0% |
| Total | 39 | 100.0% |
Employment Status by Age in Sweet Grass
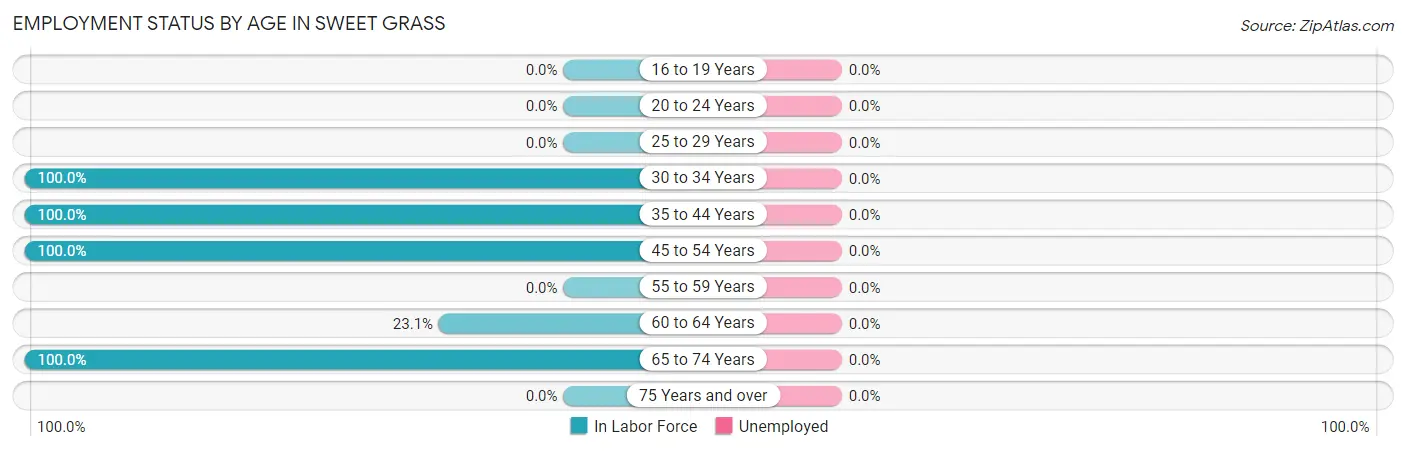
| Age Bracket | In Labor Force | Unemployed |
| 16 to 19 Years | 0 (0.0%) | 0 (0.0%) |
| 20 to 24 Years | 0 (0.0%) | 0 (0.0%) |
| 25 to 29 Years | 0 (0.0%) | 0 (0.0%) |
| 30 to 34 Years | 12 (100.0%) | 0 (0.0%) |
| 35 to 44 Years | 11 (100.0%) | 0 (0.0%) |
| 45 to 54 Years | 4 (100.0%) | 0 (0.0%) |
| 55 to 59 Years | 0 (0.0%) | 0 (0.0%) |
| 60 to 64 Years | 3 (23.1%) | 0 (0.0%) |
| 65 to 74 Years | 9 (100.0%) | 0 (0.0%) |
| 75 Years and over | 0 (0.0%) | 0 (0.0%) |
| Total | 39 (55.7%) | 0 (0.0%) |
Employment Status by Educational Attainment in Sweet Grass
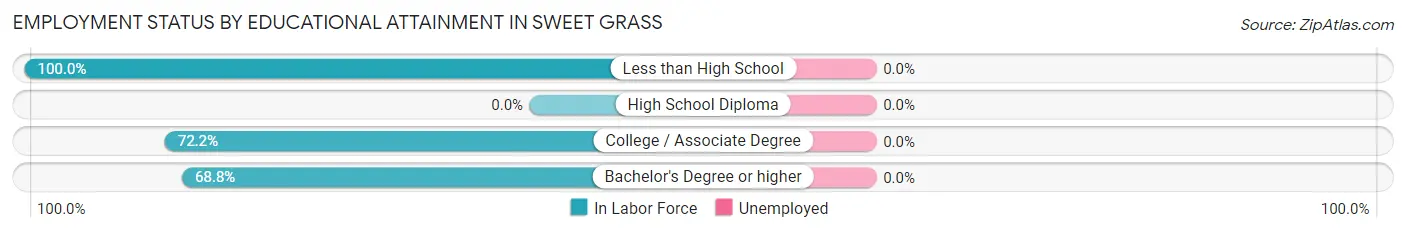
| Educational Attainment | In Labor Force | Unemployed |
| Less than High School | 6 (100.0%) | 0 (0.0%) |
| High School Diploma | 0 (0.0%) | 0 (0.0%) |
| College / Associate Degree | 13 (72.2%) | 0 (0.0%) |
| Bachelor's Degree or higher | 11 (68.8%) | 0 (0.0%) |
| Total | 30 (75.0%) | 0 (0.0%) |
Employment Occupations by Sex in Sweet Grass
Management, Business, Science and Arts Occupations
The most common Management, Business, Science and Arts occupations in Sweet Grass are , and Business & Financial (3 | 7.7%).
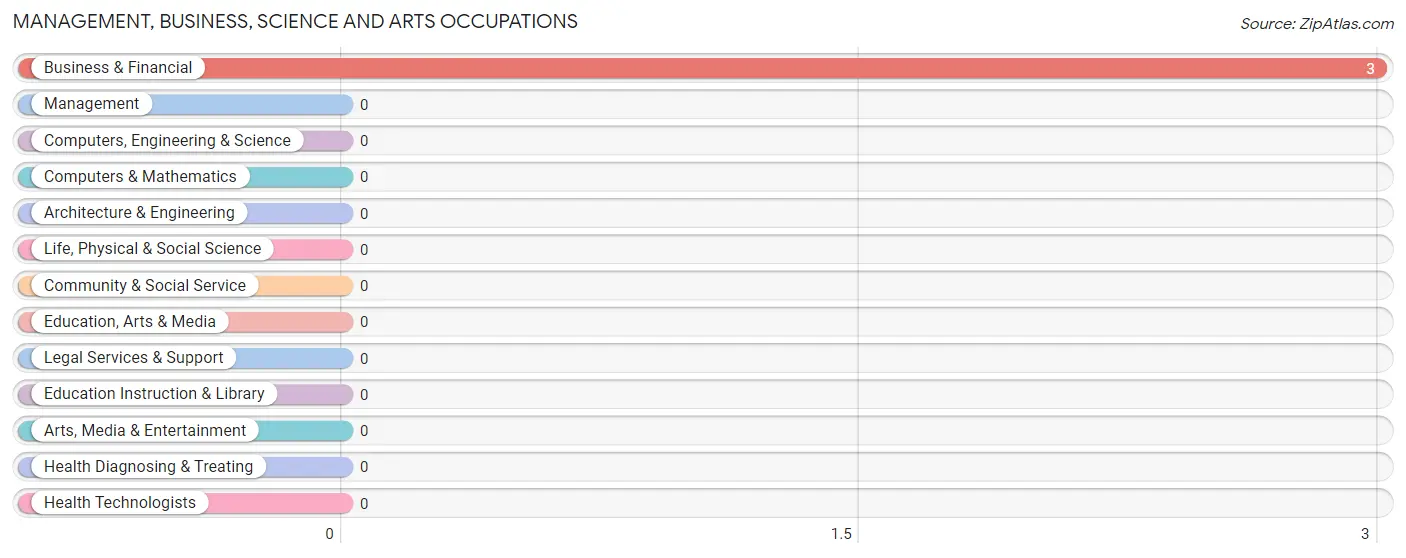
Management, Business, Science and Arts Occupations by Sex
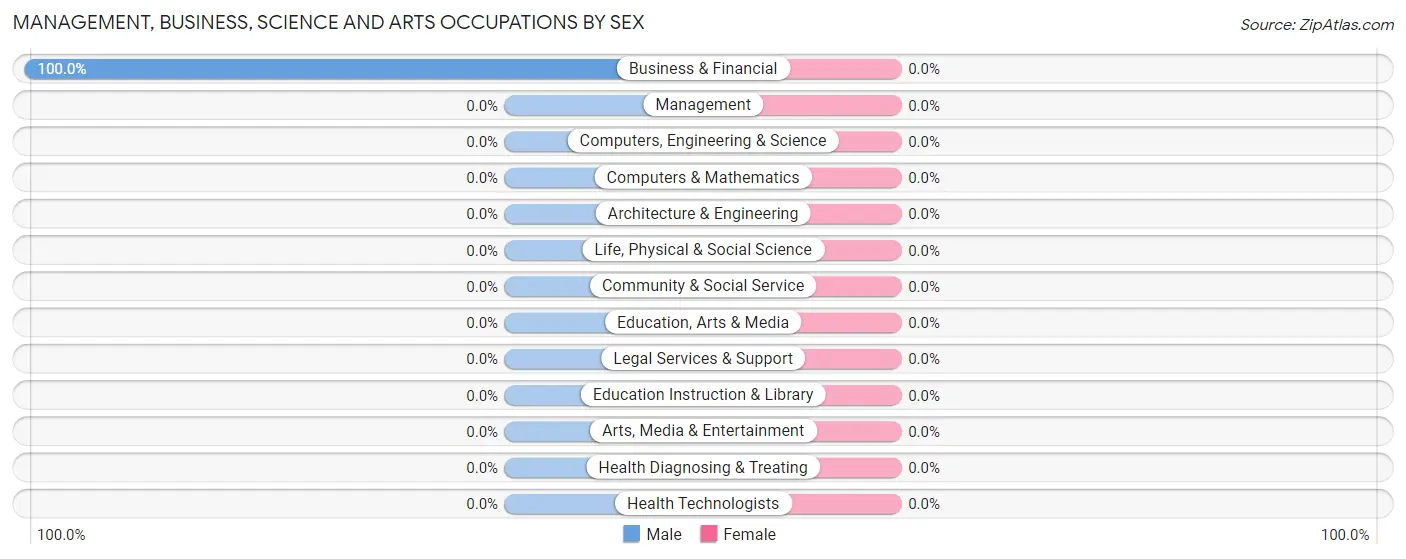
| Occupation | Male | Female |
| Management | 0 (0.0%) | 0 (0.0%) |
| Business & Financial | 3 (100.0%) | 0 (0.0%) |
| Computers, Engineering & Science | 0 (0.0%) | 0 (0.0%) |
| Computers & Mathematics | 0 (0.0%) | 0 (0.0%) |
| Architecture & Engineering | 0 (0.0%) | 0 (0.0%) |
| Life, Physical & Social Science | 0 (0.0%) | 0 (0.0%) |
| Community & Social Service | 0 (0.0%) | 0 (0.0%) |
| Education, Arts & Media | 0 (0.0%) | 0 (0.0%) |
| Legal Services & Support | 0 (0.0%) | 0 (0.0%) |
| Education Instruction & Library | 0 (0.0%) | 0 (0.0%) |
| Arts, Media & Entertainment | 0 (0.0%) | 0 (0.0%) |
| Health Diagnosing & Treating | 0 (0.0%) | 0 (0.0%) |
| Health Technologists | 0 (0.0%) | 0 (0.0%) |
| Total (Category) | 3 (100.0%) | 0 (0.0%) |
| Total (Overall) | 26 (66.7%) | 13 (33.3%) |
Services Occupations
The most common Services occupations in Sweet Grass are , and Food Preparation & Serving (24 | 61.5%).
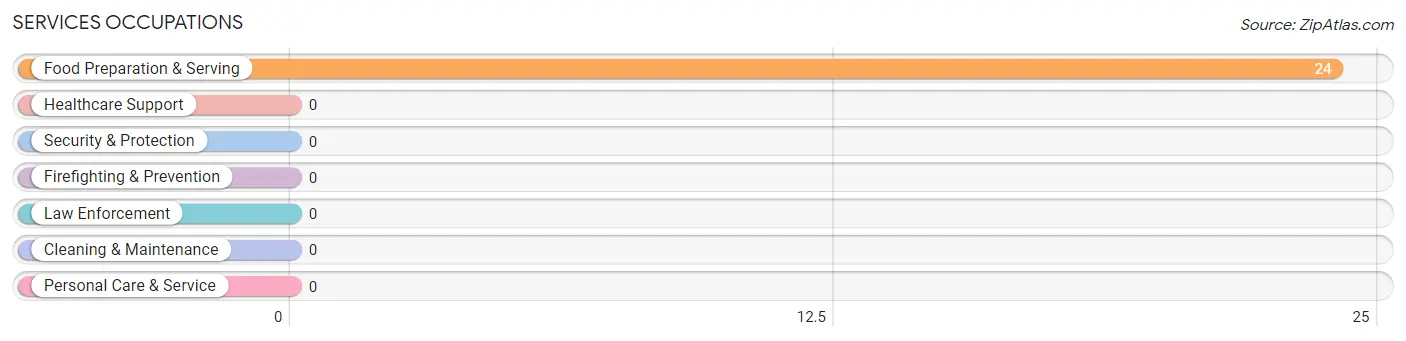
Services Occupations by Sex
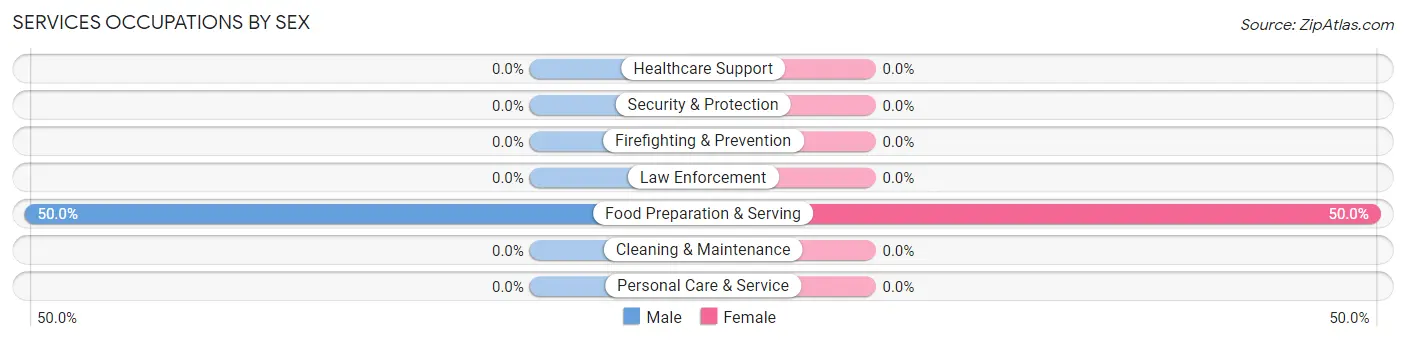
| Occupation | Male | Female |
| Healthcare Support | 0 (0.0%) | 0 (0.0%) |
| Security & Protection | 0 (0.0%) | 0 (0.0%) |
| Firefighting & Prevention | 0 (0.0%) | 0 (0.0%) |
| Law Enforcement | 0 (0.0%) | 0 (0.0%) |
| Food Preparation & Serving | 12 (50.0%) | 12 (50.0%) |
| Cleaning & Maintenance | 0 (0.0%) | 0 (0.0%) |
| Personal Care & Service | 0 (0.0%) | 0 (0.0%) |
| Total (Category) | 12 (50.0%) | 12 (50.0%) |
| Total (Overall) | 26 (66.7%) | 13 (33.3%) |
Sales and Office Occupations
The most common Sales and Office occupations in Sweet Grass are , and Office & Administration (1 | 2.6%).
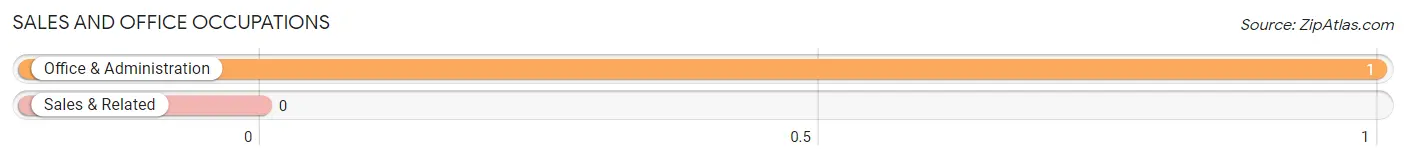
Sales and Office Occupations by Sex
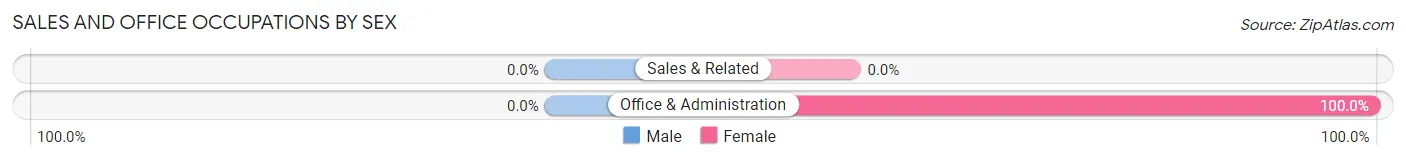
| Occupation | Male | Female |
| Sales & Related | 0 (0.0%) | 0 (0.0%) |
| Office & Administration | 0 (0.0%) | 1 (100.0%) |
| Total (Category) | 0 (0.0%) | 1 (100.0%) |
| Total (Overall) | 26 (66.7%) | 13 (33.3%) |
Natural Resources, Construction and Maintenance Occupations
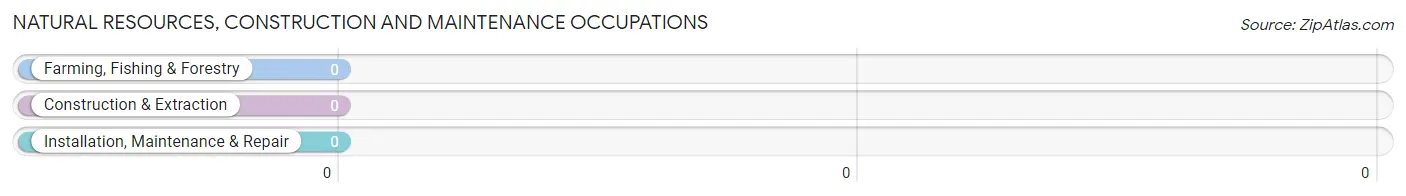
Natural Resources, Construction and Maintenance Occupations by Sex
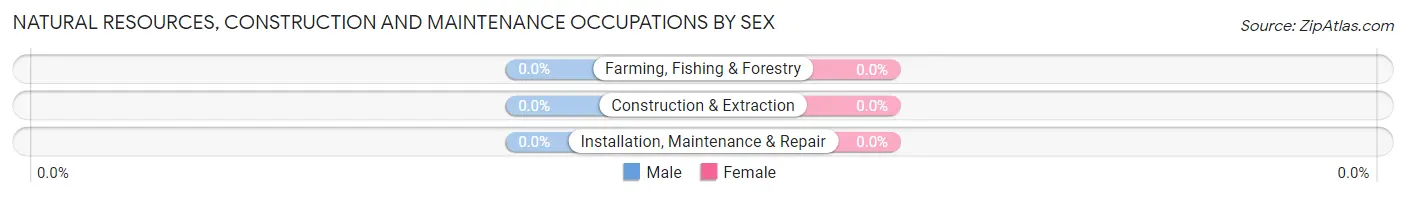
| Occupation | Male | Female |
| Farming, Fishing & Forestry | 0 (0.0%) | 0 (0.0%) |
| Construction & Extraction | 0 (0.0%) | 0 (0.0%) |
| Installation, Maintenance & Repair | 0 (0.0%) | 0 (0.0%) |
| Total (Category) | 0 (0.0%) | 0 (0.0%) |
| Total (Overall) | 26 (66.7%) | 13 (33.3%) |
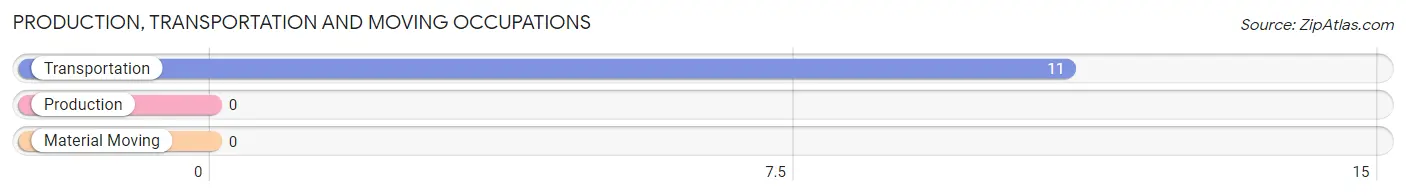
Production, Transportation and Moving Occupations
The most common Production, Transportation and Moving occupations in Sweet Grass are , and Transportation (11 | 28.2%).
Production, Transportation and Moving Occupations by Sex
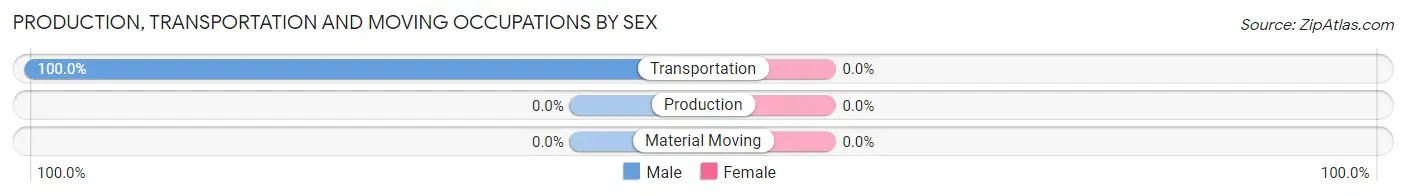
| Occupation | Male | Female |
| Production | 0 (0.0%) | 0 (0.0%) |
| Transportation | 11 (100.0%) | 0 (0.0%) |
| Material Moving | 0 (0.0%) | 0 (0.0%) |
| Total (Category) | 11 (100.0%) | 0 (0.0%) |
| Total (Overall) | 26 (66.7%) | 13 (33.3%) |
Employment Industries by Sex in Sweet Grass
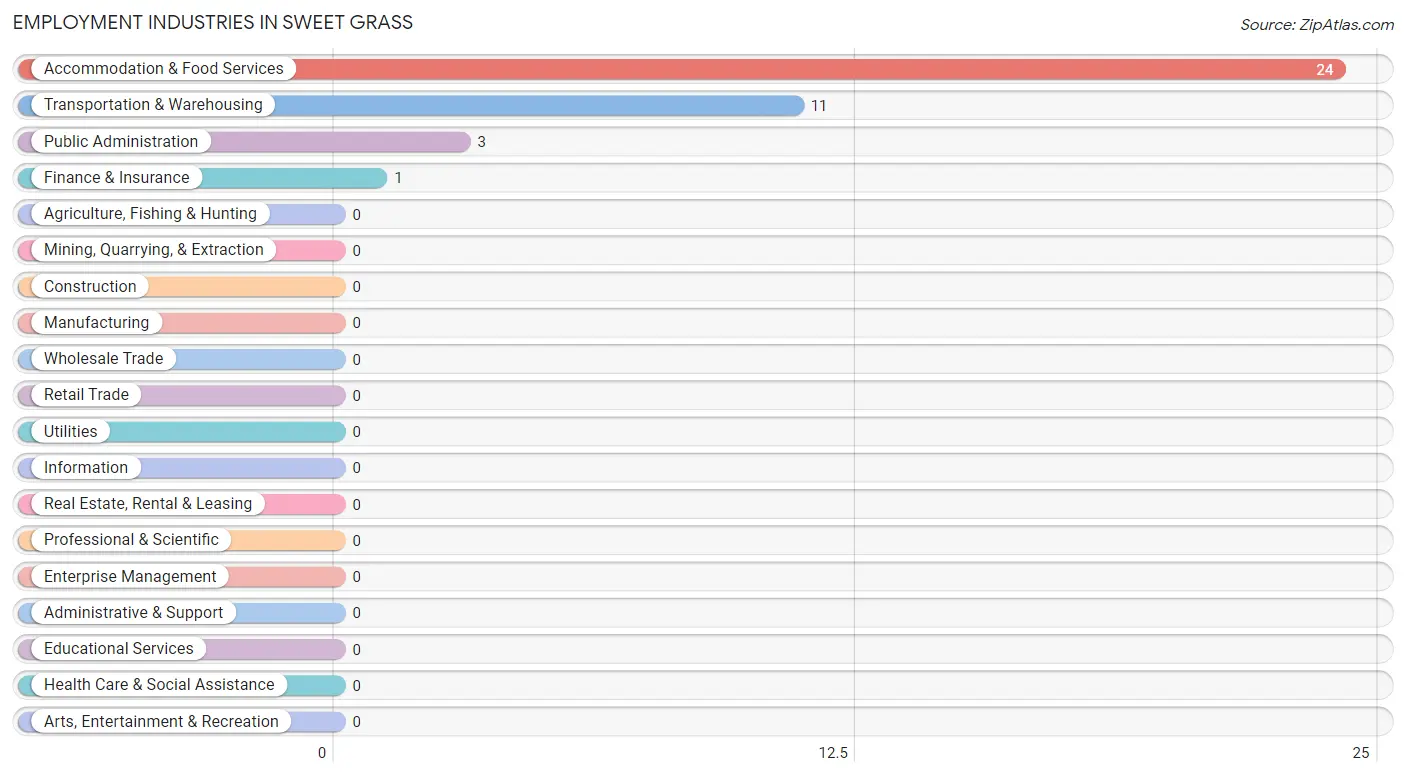
Employment Industries in Sweet Grass
The major employment industries in Sweet Grass include Accommodation & Food Services (24 | 61.5%), Transportation & Warehousing (11 | 28.2%), Public Administration (3 | 7.7%), and Finance & Insurance (1 | 2.6%).
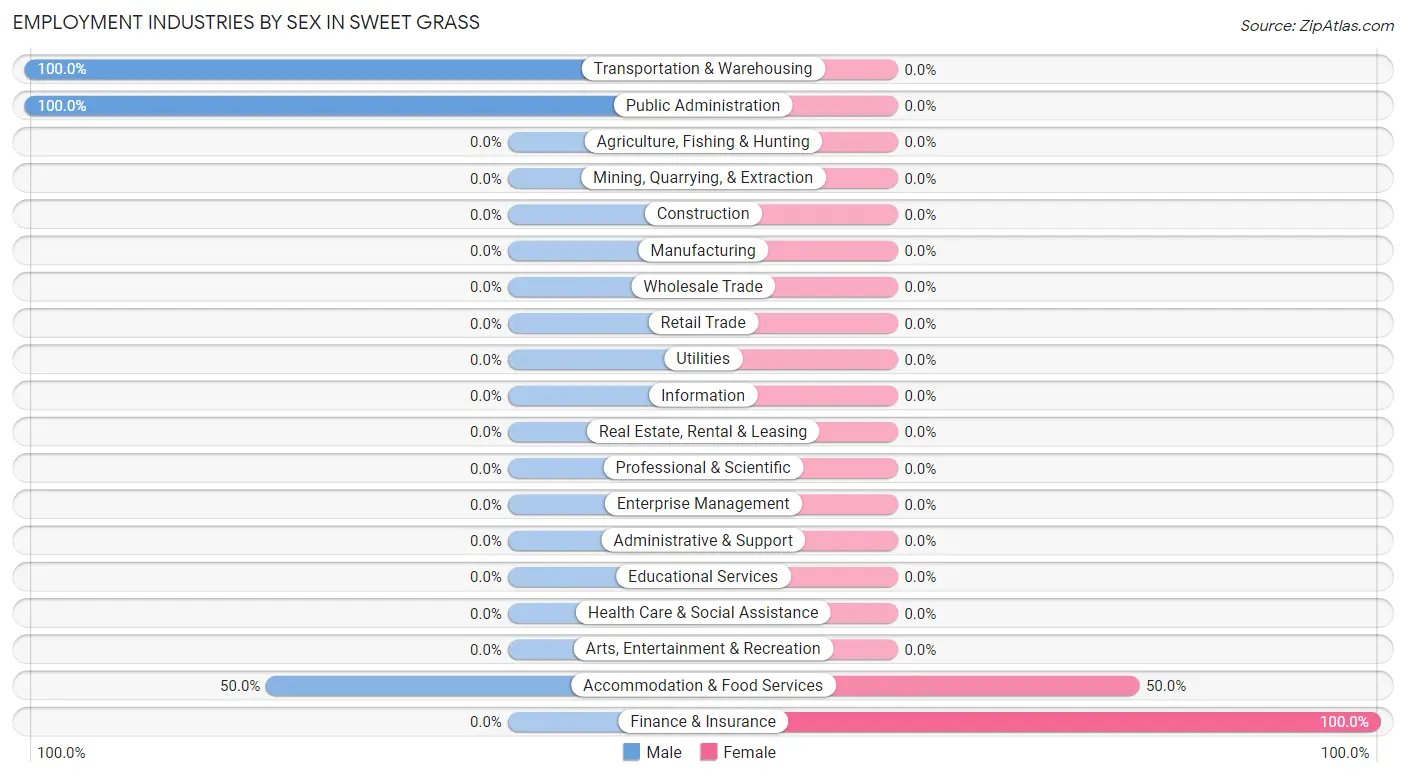
Employment Industries by Sex in Sweet Grass
The Sweet Grass industries that see more men than women are Transportation & Warehousing (100.0%), Public Administration (100.0%), and Accommodation & Food Services (50.0%), whereas the industries that tend to have a higher number of women are Finance & Insurance (100.0%), and Accommodation & Food Services (50.0%).
| Industry | Male | Female |
| Agriculture, Fishing & Hunting | 0 (0.0%) | 0 (0.0%) |
| Mining, Quarrying, & Extraction | 0 (0.0%) | 0 (0.0%) |
| Construction | 0 (0.0%) | 0 (0.0%) |
| Manufacturing | 0 (0.0%) | 0 (0.0%) |
| Wholesale Trade | 0 (0.0%) | 0 (0.0%) |
| Retail Trade | 0 (0.0%) | 0 (0.0%) |
| Transportation & Warehousing | 11 (100.0%) | 0 (0.0%) |
| Utilities | 0 (0.0%) | 0 (0.0%) |
| Information | 0 (0.0%) | 0 (0.0%) |
| Finance & Insurance | 0 (0.0%) | 1 (100.0%) |
| Real Estate, Rental & Leasing | 0 (0.0%) | 0 (0.0%) |
| Professional & Scientific | 0 (0.0%) | 0 (0.0%) |
| Enterprise Management | 0 (0.0%) | 0 (0.0%) |
| Administrative & Support | 0 (0.0%) | 0 (0.0%) |
| Educational Services | 0 (0.0%) | 0 (0.0%) |
| Health Care & Social Assistance | 0 (0.0%) | 0 (0.0%) |
| Arts, Entertainment & Recreation | 0 (0.0%) | 0 (0.0%) |
| Accommodation & Food Services | 12 (50.0%) | 12 (50.0%) |
| Public Administration | 3 (100.0%) | 0 (0.0%) |
| Total | 26 (66.7%) | 13 (33.3%) |
Education in Sweet Grass
School Enrollment in Sweet Grass
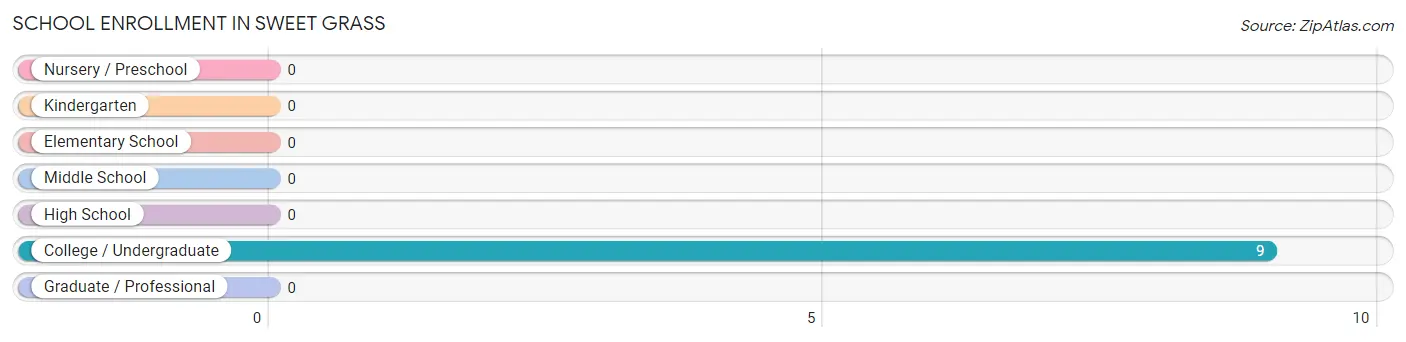
| School Level | # Students | % Students |
| Nursery / Preschool | 0 | 0.0% |
| Kindergarten | 0 | 0.0% |
| Elementary School | 0 | 0.0% |
| Middle School | 0 | 0.0% |
| High School | 0 | 0.0% |
| College / Undergraduate | 9 | 100.0% |
| Graduate / Professional | 0 | 0.0% |
| Total | 9 | 100.0% |
School Enrollment by Age by Funding Source in Sweet Grass
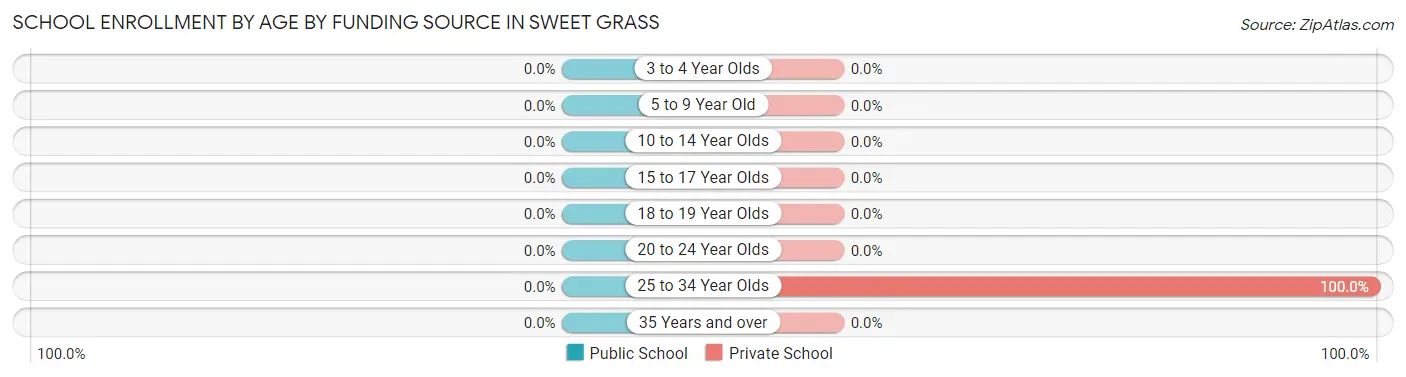
| Age Bracket | Public School | Private School |
| 3 to 4 Year Olds | 0 (0.0%) | 0 (0.0%) |
| 5 to 9 Year Old | 0 (0.0%) | 0 (0.0%) |
| 10 to 14 Year Olds | 0 (0.0%) | 0 (0.0%) |
| 15 to 17 Year Olds | 0 (0.0%) | 0 (0.0%) |
| 18 to 19 Year Olds | 0 (0.0%) | 0 (0.0%) |
| 20 to 24 Year Olds | 0 (0.0%) | 0 (0.0%) |
| 25 to 34 Year Olds | 0 (0.0%) | 9 (100.0%) |
| 35 Years and over | 0 (0.0%) | 0 (0.0%) |
| Total | 0 (0.0%) | 9 (100.0%) |
Educational Attainment by Field of Study in Sweet Grass
Business (11 | 68.8%), and arts & humanities (5 | 31.2%) are the most common fields of study among 16 individuals in Sweet Grass who have obtained a bachelor's degree or higher.
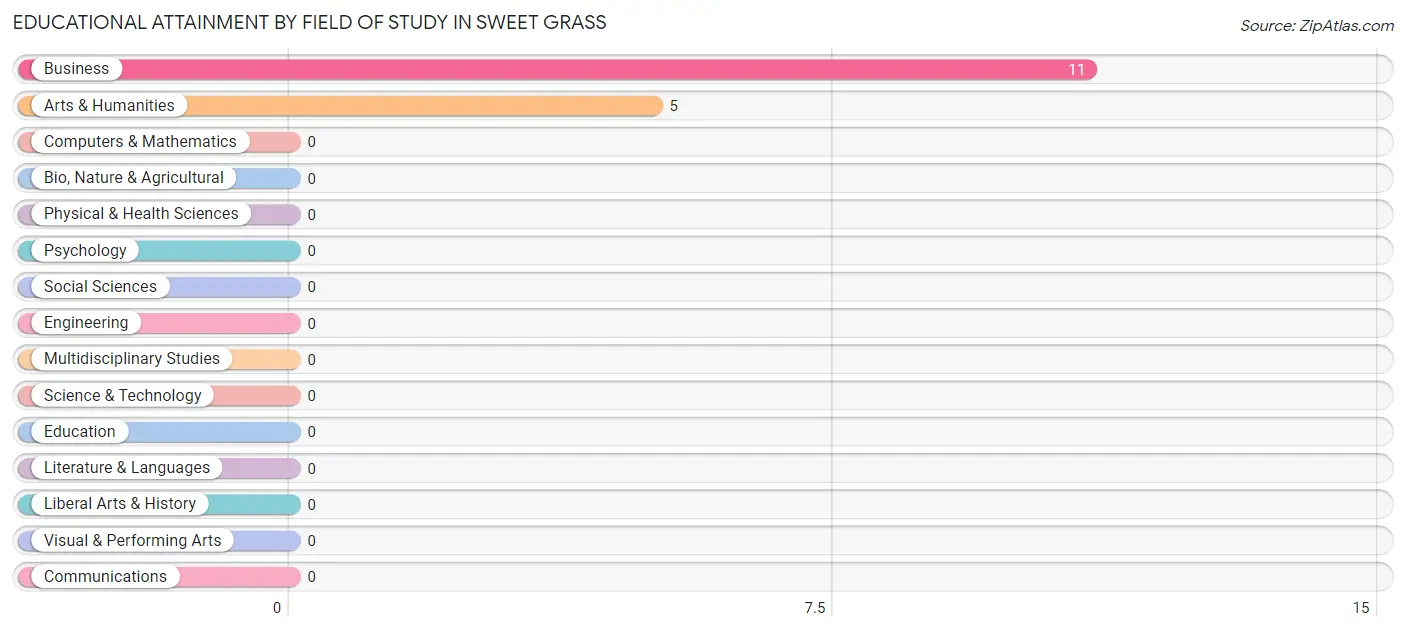
| Field of Study | # Graduates | % Graduates |
| Computers & Mathematics | 0 | 0.0% |
| Bio, Nature & Agricultural | 0 | 0.0% |
| Physical & Health Sciences | 0 | 0.0% |
| Psychology | 0 | 0.0% |
| Social Sciences | 0 | 0.0% |
| Engineering | 0 | 0.0% |
| Multidisciplinary Studies | 0 | 0.0% |
| Science & Technology | 0 | 0.0% |
| Business | 11 | 68.8% |
| Education | 0 | 0.0% |
| Literature & Languages | 0 | 0.0% |
| Liberal Arts & History | 0 | 0.0% |
| Visual & Performing Arts | 0 | 0.0% |
| Communications | 0 | 0.0% |
| Arts & Humanities | 5 | 31.2% |
| Total | 16 | 100.0% |
Transportation & Commute in Sweet Grass
Vehicle Availability by Sex in Sweet Grass
The most prevalent vehicle ownership categories in Sweet Grass are males with 5 or more vehicles (14, accounting for 53.8%) and females with 5 or more vehicles (3, making up 107.7%).
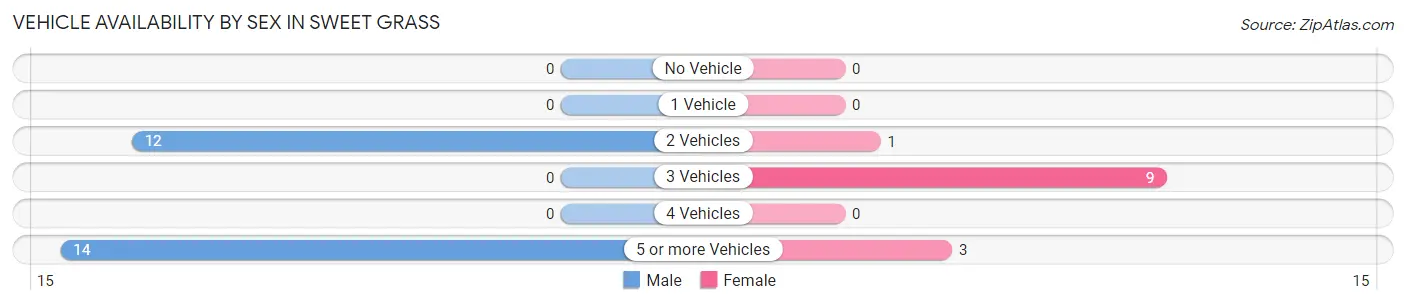
| Vehicles Available | Male | Female |
| No Vehicle | 0 (0.0%) | 0 (0.0%) |
| 1 Vehicle | 0 (0.0%) | 0 (0.0%) |
| 2 Vehicles | 12 (46.2%) | 1 (7.7%) |
| 3 Vehicles | 0 (0.0%) | 9 (69.2%) |
| 4 Vehicles | 0 (0.0%) | 0 (0.0%) |
| 5 or more Vehicles | 14 (53.8%) | 3 (23.1%) |
| Total | 26 (100.0%) | 13 (100.0%) |
Commute Time in Sweet Grass
The most frequently occuring commute durations in Sweet Grass are less than 5 minutes (26 commuters, 66.7%), 10 to 14 minutes (9 commuters, 23.1%), and 5 to 9 minutes (4 commuters, 10.3%).
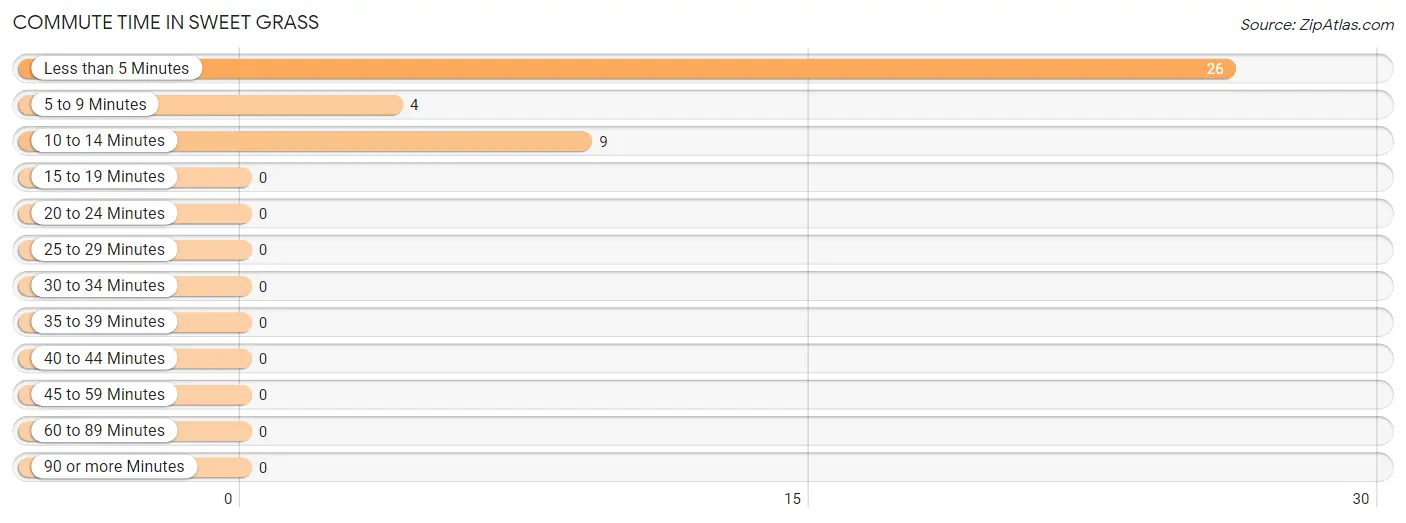
| Commute Time | # Commuters | % Commuters |
| Less than 5 Minutes | 26 | 66.7% |
| 5 to 9 Minutes | 4 | 10.3% |
| 10 to 14 Minutes | 9 | 23.1% |
| 15 to 19 Minutes | 0 | 0.0% |
| 20 to 24 Minutes | 0 | 0.0% |
| 25 to 29 Minutes | 0 | 0.0% |
| 30 to 34 Minutes | 0 | 0.0% |
| 35 to 39 Minutes | 0 | 0.0% |
| 40 to 44 Minutes | 0 | 0.0% |
| 45 to 59 Minutes | 0 | 0.0% |
| 60 to 89 Minutes | 0 | 0.0% |
| 90 or more Minutes | 0 | 0.0% |
Commute Time by Sex in Sweet Grass
The most common commute times in Sweet Grass are less than 5 minutes (23 commuters, 88.5%) for males and 10 to 14 minutes (9 commuters, 69.2%) for females.
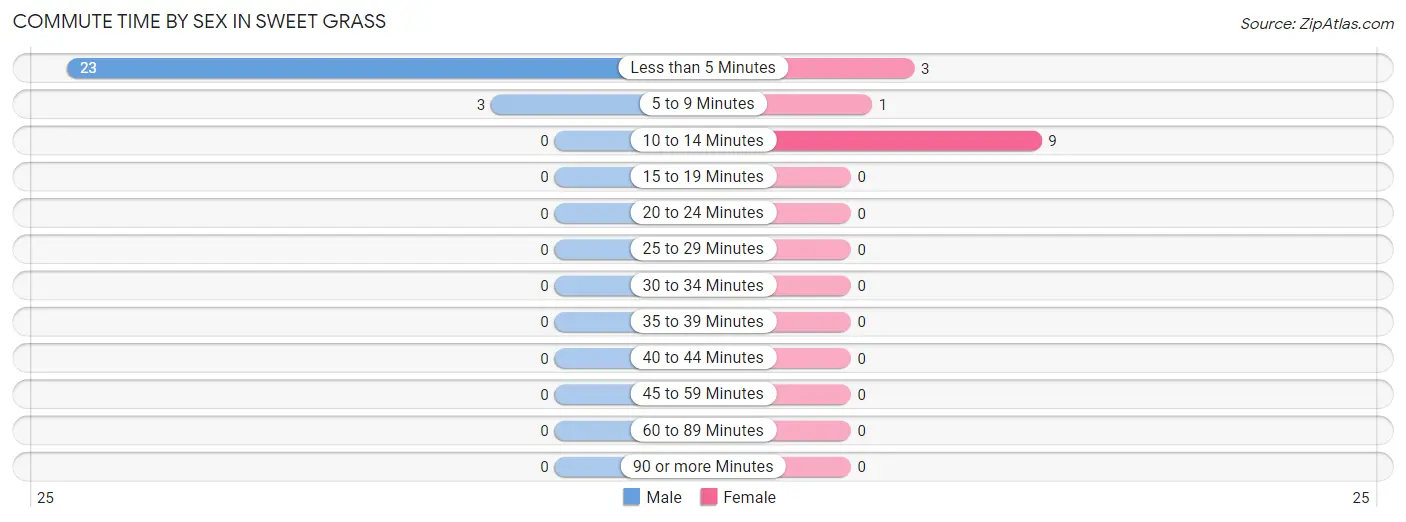
| Commute Time | Male | Female |
| Less than 5 Minutes | 23 (88.5%) | 3 (23.1%) |
| 5 to 9 Minutes | 3 (11.5%) | 1 (7.7%) |
| 10 to 14 Minutes | 0 (0.0%) | 9 (69.2%) |
| 15 to 19 Minutes | 0 (0.0%) | 0 (0.0%) |
| 20 to 24 Minutes | 0 (0.0%) | 0 (0.0%) |
| 25 to 29 Minutes | 0 (0.0%) | 0 (0.0%) |
| 30 to 34 Minutes | 0 (0.0%) | 0 (0.0%) |
| 35 to 39 Minutes | 0 (0.0%) | 0 (0.0%) |
| 40 to 44 Minutes | 0 (0.0%) | 0 (0.0%) |
| 45 to 59 Minutes | 0 (0.0%) | 0 (0.0%) |
| 60 to 89 Minutes | 0 (0.0%) | 0 (0.0%) |
| 90 or more Minutes | 0 (0.0%) | 0 (0.0%) |
Time of Departure to Work by Sex in Sweet Grass
The most frequent times of departure to work in Sweet Grass are 10:00 AM to 10:59 AM (23, 88.5%) for males and 10:00 AM to 10:59 AM (12, 92.3%) for females.
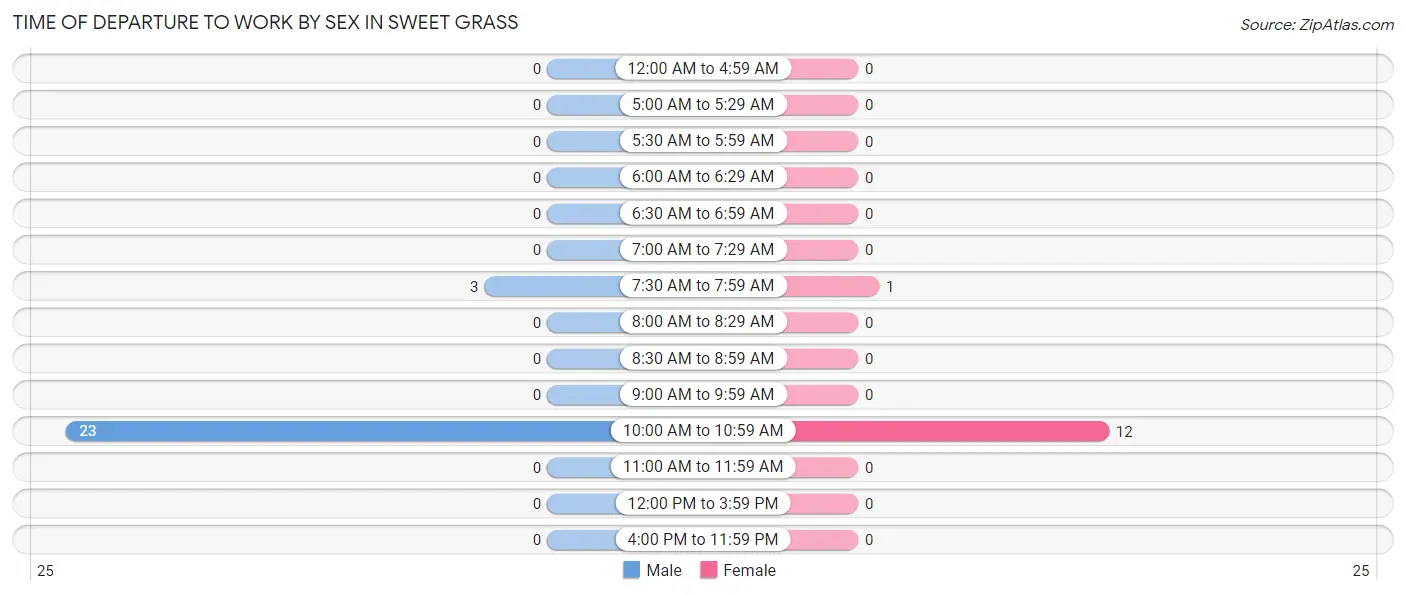
| Time of Departure | Male | Female |
| 12:00 AM to 4:59 AM | 0 (0.0%) | 0 (0.0%) |
| 5:00 AM to 5:29 AM | 0 (0.0%) | 0 (0.0%) |
| 5:30 AM to 5:59 AM | 0 (0.0%) | 0 (0.0%) |
| 6:00 AM to 6:29 AM | 0 (0.0%) | 0 (0.0%) |
| 6:30 AM to 6:59 AM | 0 (0.0%) | 0 (0.0%) |
| 7:00 AM to 7:29 AM | 0 (0.0%) | 0 (0.0%) |
| 7:30 AM to 7:59 AM | 3 (11.5%) | 1 (7.7%) |
| 8:00 AM to 8:29 AM | 0 (0.0%) | 0 (0.0%) |
| 8:30 AM to 8:59 AM | 0 (0.0%) | 0 (0.0%) |
| 9:00 AM to 9:59 AM | 0 (0.0%) | 0 (0.0%) |
| 10:00 AM to 10:59 AM | 23 (88.5%) | 12 (92.3%) |
| 11:00 AM to 11:59 AM | 0 (0.0%) | 0 (0.0%) |
| 12:00 PM to 3:59 PM | 0 (0.0%) | 0 (0.0%) |
| 4:00 PM to 11:59 PM | 0 (0.0%) | 0 (0.0%) |
| Total | 26 (100.0%) | 13 (100.0%) |
Housing Occupancy in Sweet Grass
Occupancy by Ownership in Sweet Grass
Of the total 36 dwellings in Sweet Grass, owner-occupied units account for 25 (69.4%), while renter-occupied units make up 11 (30.6%).
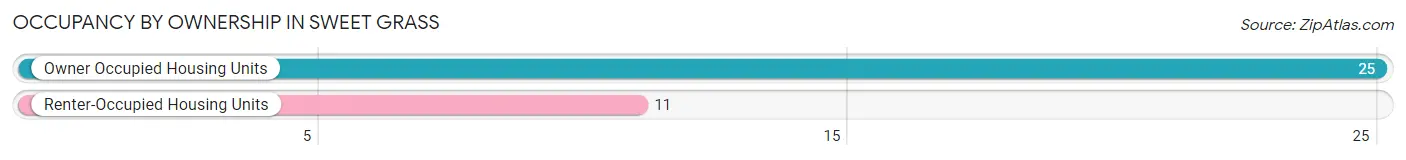
| Occupancy | # Housing Units | % Housing Units |
| Owner Occupied Housing Units | 25 | 69.4% |
| Renter-Occupied Housing Units | 11 | 30.6% |
| Total Occupied Housing Units | 36 | 100.0% |
Occupancy by Household Size in Sweet Grass
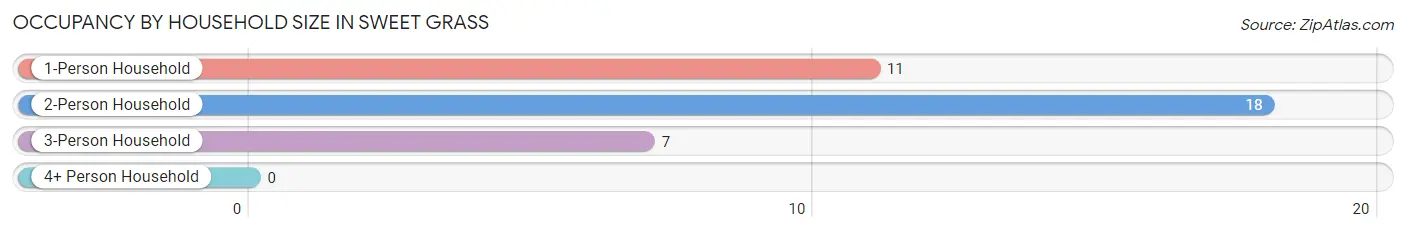
| Household Size | # Housing Units | % Housing Units |
| 1-Person Household | 11 | 30.6% |
| 2-Person Household | 18 | 50.0% |
| 3-Person Household | 7 | 19.4% |
| 4+ Person Household | 0 | 0.0% |
| Total Housing Units | 36 | 100.0% |
Occupancy by Ownership by Household Size in Sweet Grass
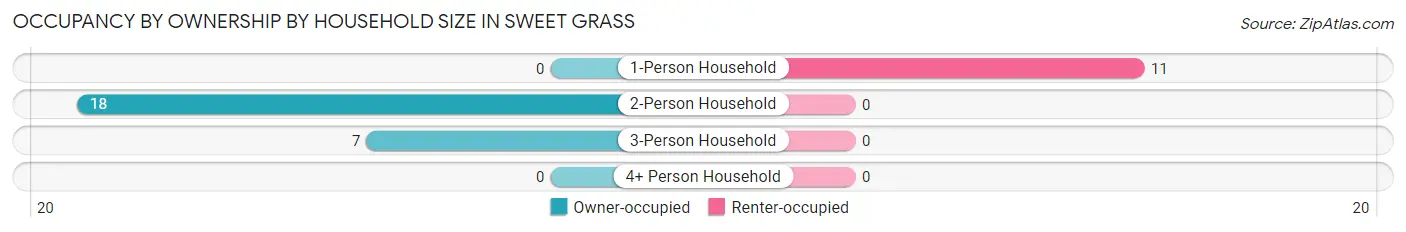
| Household Size | Owner-occupied | Renter-occupied |
| 1-Person Household | 0 (0.0%) | 11 (100.0%) |
| 2-Person Household | 18 (100.0%) | 0 (0.0%) |
| 3-Person Household | 7 (100.0%) | 0 (0.0%) |
| 4+ Person Household | 0 (0.0%) | 0 (0.0%) |
| Total Housing Units | 25 (69.4%) | 11 (30.6%) |
Occupancy by Educational Attainment in Sweet Grass
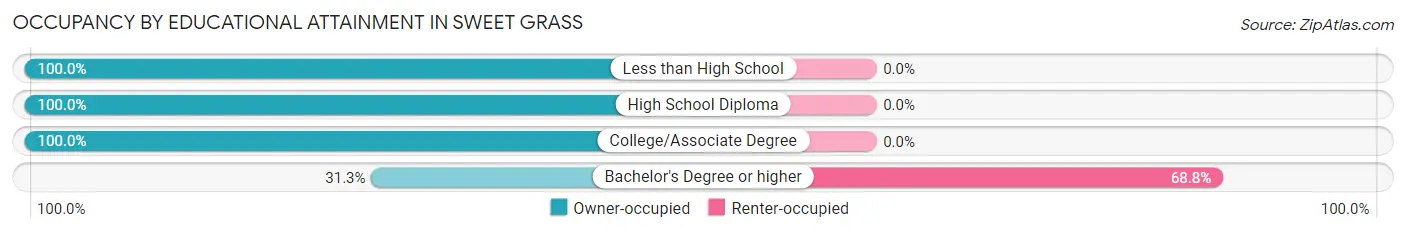
| Household Size | Owner-occupied | Renter-occupied |
| Less than High School | 3 (100.0%) | 0 (0.0%) |
| High School Diploma | 7 (100.0%) | 0 (0.0%) |
| College/Associate Degree | 10 (100.0%) | 0 (0.0%) |
| Bachelor's Degree or higher | 5 (31.2%) | 11 (68.8%) |
Occupancy by Age of Householder in Sweet Grass
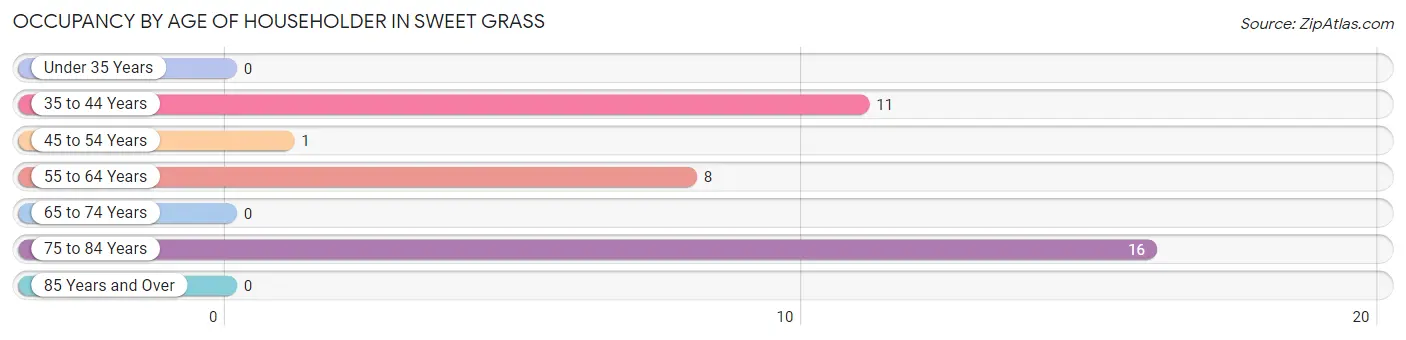
| Age Bracket | # Households | % Households |
| Under 35 Years | 0 | 0.0% |
| 35 to 44 Years | 11 | 30.6% |
| 45 to 54 Years | 1 | 2.8% |
| 55 to 64 Years | 8 | 22.2% |
| 65 to 74 Years | 0 | 0.0% |
| 75 to 84 Years | 16 | 44.4% |
| 85 Years and Over | 0 | 0.0% |
| Total | 36 | 100.0% |
Housing Finances in Sweet Grass
Median Income by Occupancy in Sweet Grass
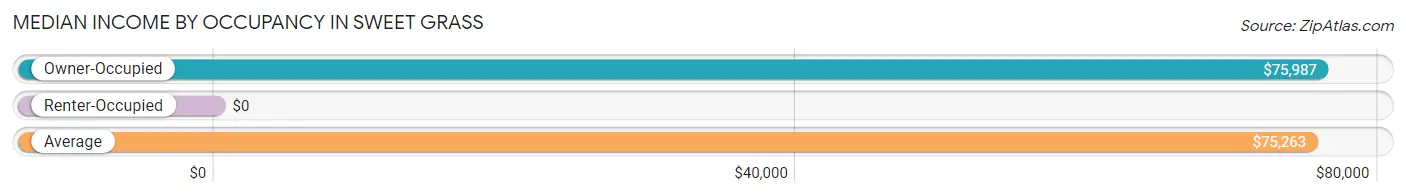
| Occupancy Type | # Households | Median Income |
| Owner-Occupied | 25 (69.4%) | $75,987 |
| Renter-Occupied | 11 (30.6%) | $0 |
| Average | 36 (100.0%) | $75,263 |
Occupancy by Householder Income Bracket in Sweet Grass
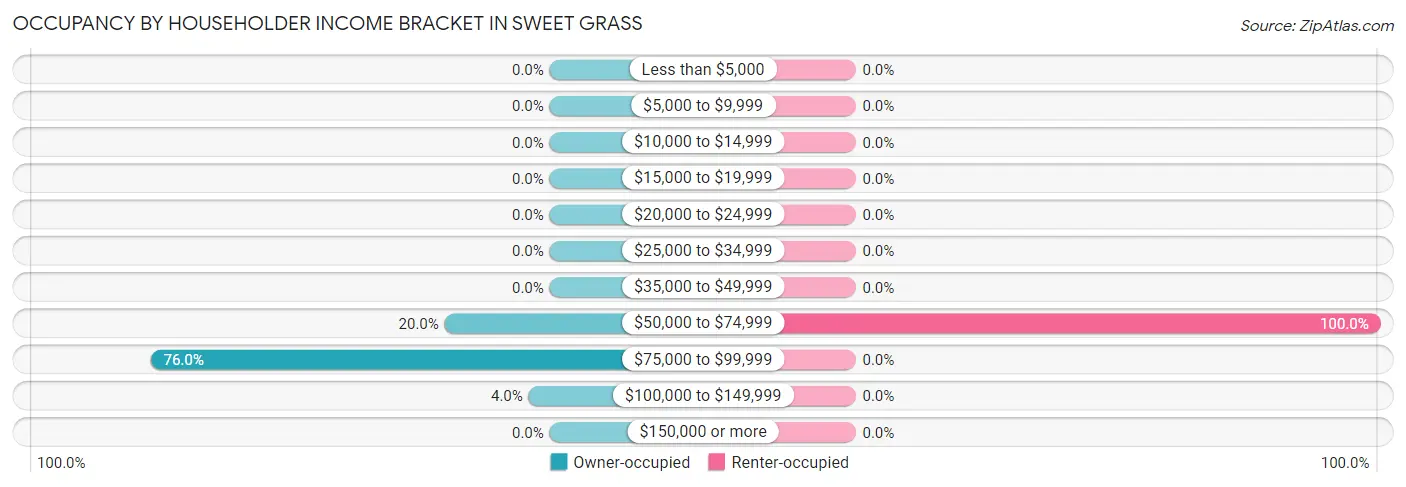
| Income Bracket | Owner-occupied | Renter-occupied |
| Less than $5,000 | 0 (0.0%) | 0 (0.0%) |
| $5,000 to $9,999 | 0 (0.0%) | 0 (0.0%) |
| $10,000 to $14,999 | 0 (0.0%) | 0 (0.0%) |
| $15,000 to $19,999 | 0 (0.0%) | 0 (0.0%) |
| $20,000 to $24,999 | 0 (0.0%) | 0 (0.0%) |
| $25,000 to $34,999 | 0 (0.0%) | 0 (0.0%) |
| $35,000 to $49,999 | 0 (0.0%) | 0 (0.0%) |
| $50,000 to $74,999 | 5 (20.0%) | 11 (100.0%) |
| $75,000 to $99,999 | 19 (76.0%) | 0 (0.0%) |
| $100,000 to $149,999 | 1 (4.0%) | 0 (0.0%) |
| $150,000 or more | 0 (0.0%) | 0 (0.0%) |
| Total | 25 (100.0%) | 11 (100.0%) |
Monthly Housing Cost Tiers in Sweet Grass
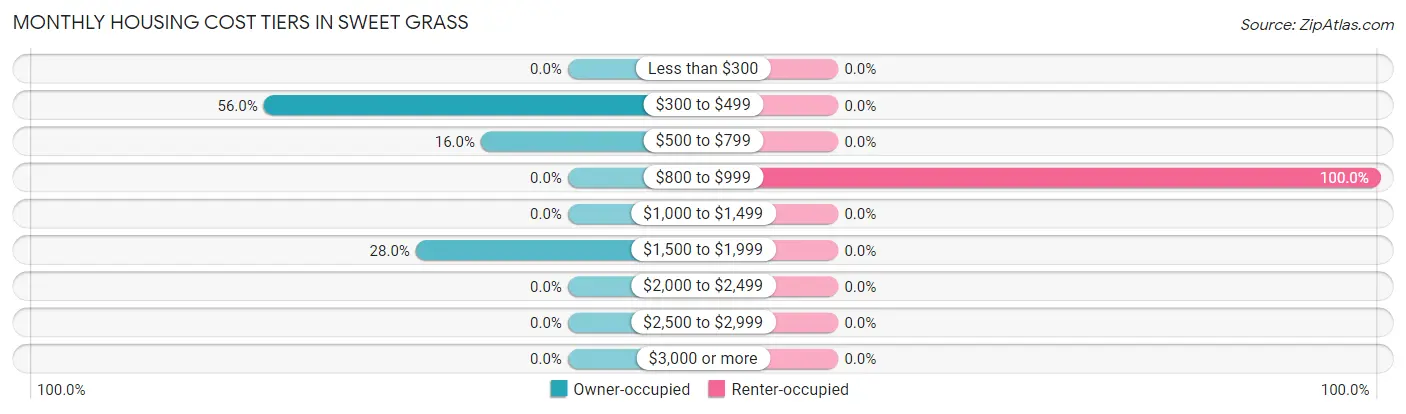
| Monthly Cost | Owner-occupied | Renter-occupied |
| Less than $300 | 0 (0.0%) | 0 (0.0%) |
| $300 to $499 | 14 (56.0%) | 0 (0.0%) |
| $500 to $799 | 4 (16.0%) | 0 (0.0%) |
| $800 to $999 | 0 (0.0%) | 11 (100.0%) |
| $1,000 to $1,499 | 0 (0.0%) | 0 (0.0%) |
| $1,500 to $1,999 | 7 (28.0%) | 0 (0.0%) |
| $2,000 to $2,499 | 0 (0.0%) | 0 (0.0%) |
| $2,500 to $2,999 | 0 (0.0%) | 0 (0.0%) |
| $3,000 or more | 0 (0.0%) | 0 (0.0%) |
| Total | 25 (100.0%) | 11 (100.0%) |
Physical Housing Characteristics in Sweet Grass
Housing Structures in Sweet Grass
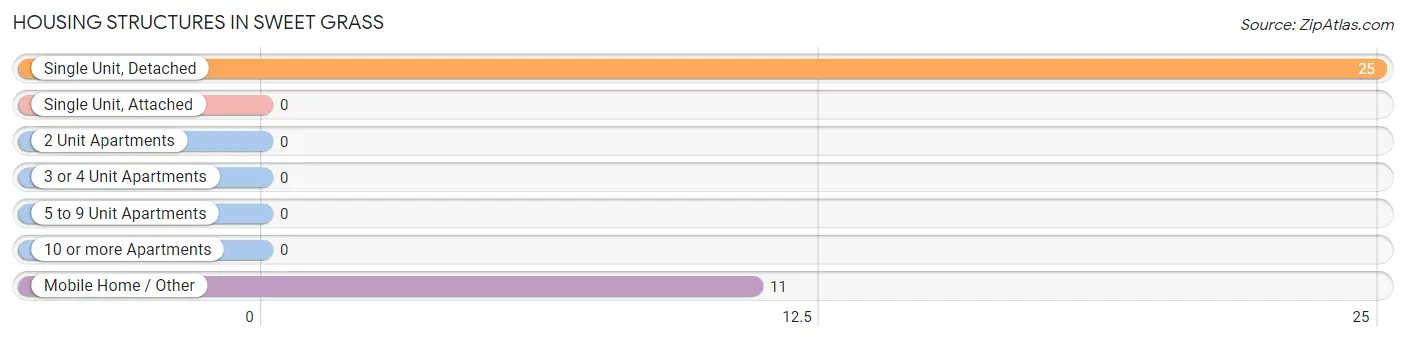
| Structure Type | # Housing Units | % Housing Units |
| Single Unit, Detached | 25 | 69.4% |
| Single Unit, Attached | 0 | 0.0% |
| 2 Unit Apartments | 0 | 0.0% |
| 3 or 4 Unit Apartments | 0 | 0.0% |
| 5 to 9 Unit Apartments | 0 | 0.0% |
| 10 or more Apartments | 0 | 0.0% |
| Mobile Home / Other | 11 | 30.6% |
| Total | 36 | 100.0% |
Housing Structures by Occupancy in Sweet Grass
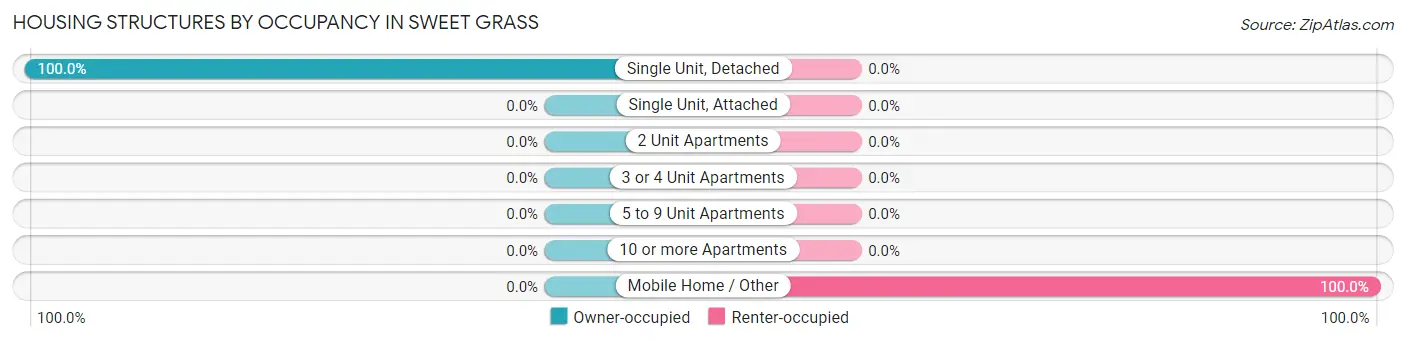
| Structure Type | Owner-occupied | Renter-occupied |
| Single Unit, Detached | 25 (100.0%) | 0 (0.0%) |
| Single Unit, Attached | 0 (0.0%) | 0 (0.0%) |
| 2 Unit Apartments | 0 (0.0%) | 0 (0.0%) |
| 3 or 4 Unit Apartments | 0 (0.0%) | 0 (0.0%) |
| 5 to 9 Unit Apartments | 0 (0.0%) | 0 (0.0%) |
| 10 or more Apartments | 0 (0.0%) | 0 (0.0%) |
| Mobile Home / Other | 0 (0.0%) | 11 (100.0%) |
| Total | 25 (69.4%) | 11 (30.6%) |
Housing Structures by Number of Rooms in Sweet Grass
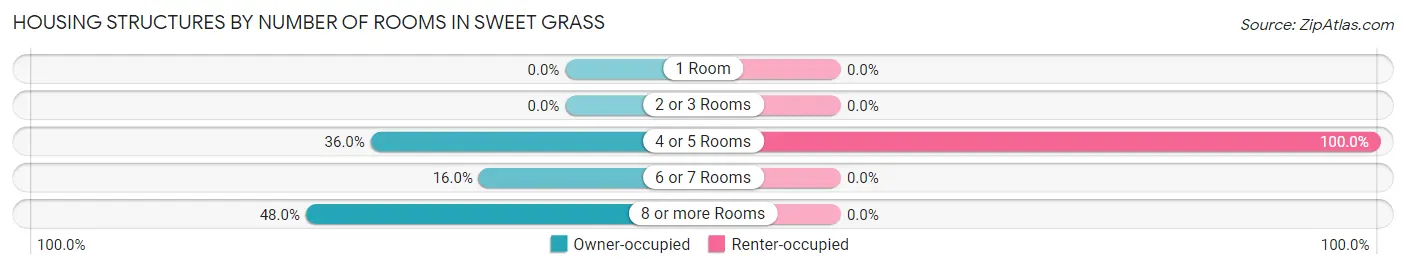
| Number of Rooms | Owner-occupied | Renter-occupied |
| 1 Room | 0 (0.0%) | 0 (0.0%) |
| 2 or 3 Rooms | 0 (0.0%) | 0 (0.0%) |
| 4 or 5 Rooms | 9 (36.0%) | 11 (100.0%) |
| 6 or 7 Rooms | 4 (16.0%) | 0 (0.0%) |
| 8 or more Rooms | 12 (48.0%) | 0 (0.0%) |
| Total | 25 (100.0%) | 11 (100.0%) |
Housing Structure by Heating Type in Sweet Grass
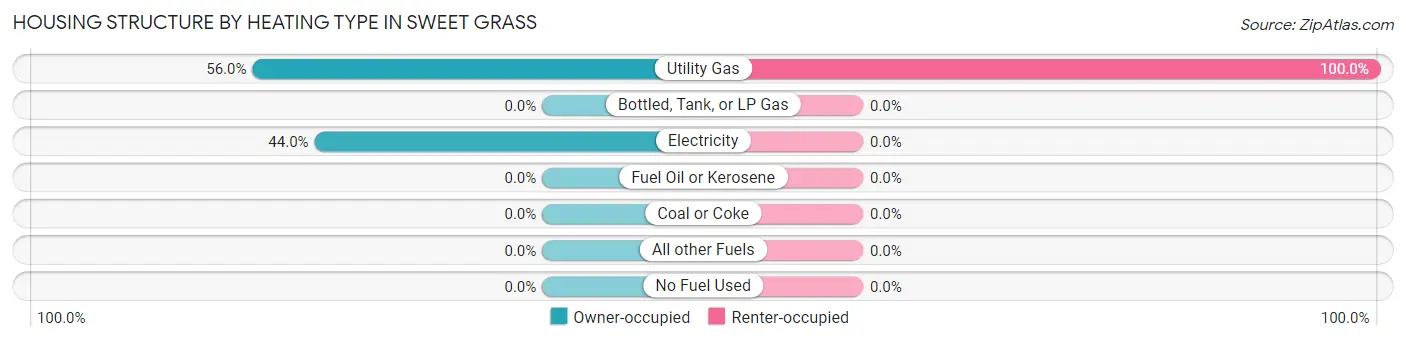
| Heating Type | Owner-occupied | Renter-occupied |
| Utility Gas | 14 (56.0%) | 11 (100.0%) |
| Bottled, Tank, or LP Gas | 0 (0.0%) | 0 (0.0%) |
| Electricity | 11 (44.0%) | 0 (0.0%) |
| Fuel Oil or Kerosene | 0 (0.0%) | 0 (0.0%) |
| Coal or Coke | 0 (0.0%) | 0 (0.0%) |
| All other Fuels | 0 (0.0%) | 0 (0.0%) |
| No Fuel Used | 0 (0.0%) | 0 (0.0%) |
| Total | 25 (100.0%) | 11 (100.0%) |
Household Vehicle Usage in Sweet Grass
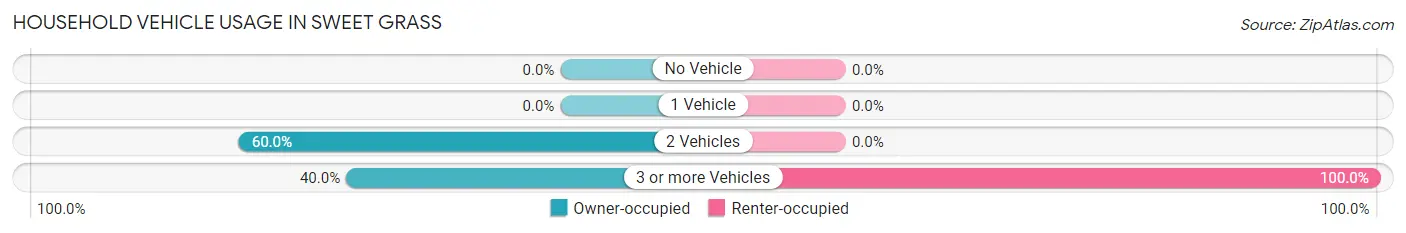
| Vehicles per Household | Owner-occupied | Renter-occupied |
| No Vehicle | 0 (0.0%) | 0 (0.0%) |
| 1 Vehicle | 0 (0.0%) | 0 (0.0%) |
| 2 Vehicles | 15 (60.0%) | 0 (0.0%) |
| 3 or more Vehicles | 10 (40.0%) | 11 (100.0%) |
| Total | 25 (100.0%) | 11 (100.0%) |
Real Estate & Mortgages in Sweet Grass
Real Estate and Mortgage Overview in Sweet Grass
| Characteristic | Without Mortgage | With Mortgage |
| Housing Units | 17 | 8 |
| Median Property Value | - | - |
| Median Household Income | $75,729 | $0 |
| Monthly Housing Costs | $461 | $0 |
| Real Estate Taxes | $879 | $7 |
Property Value by Mortgage Status in Sweet Grass
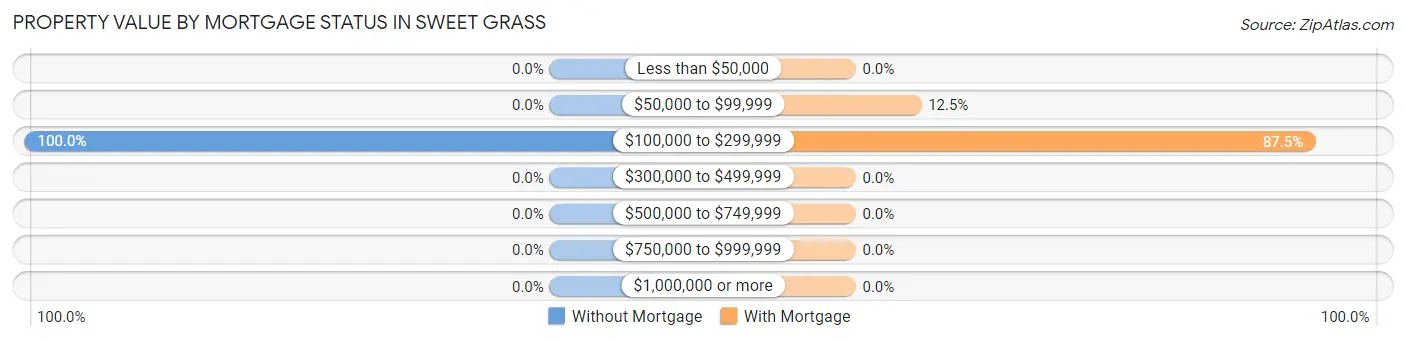
| Property Value | Without Mortgage | With Mortgage |
| Less than $50,000 | 0 (0.0%) | 0 (0.0%) |
| $50,000 to $99,999 | 0 (0.0%) | 1 (12.5%) |
| $100,000 to $299,999 | 17 (100.0%) | 7 (87.5%) |
| $300,000 to $499,999 | 0 (0.0%) | 0 (0.0%) |
| $500,000 to $749,999 | 0 (0.0%) | 0 (0.0%) |
| $750,000 to $999,999 | 0 (0.0%) | 0 (0.0%) |
| $1,000,000 or more | 0 (0.0%) | 0 (0.0%) |
| Total | 17 (100.0%) | 8 (100.0%) |
Household Income by Mortgage Status in Sweet Grass
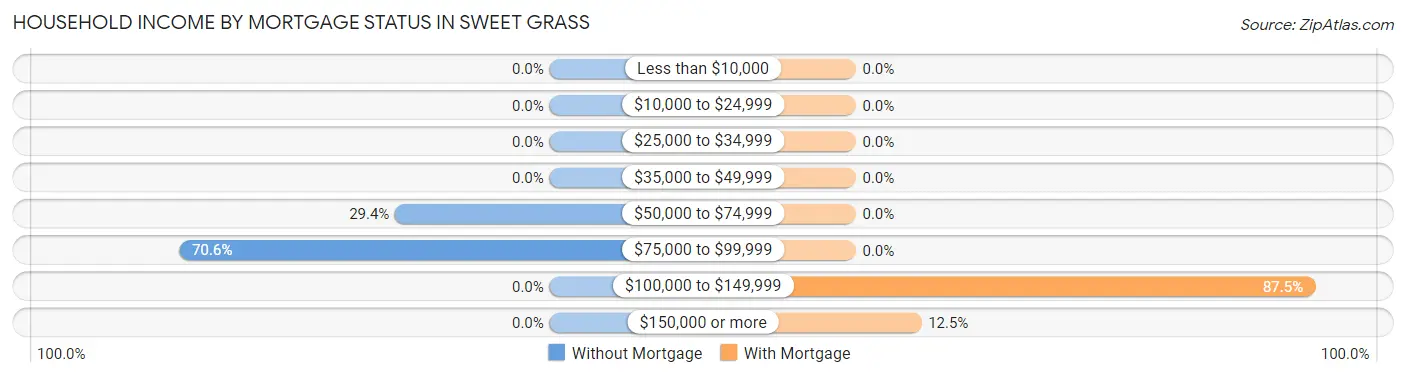
| Household Income | Without Mortgage | With Mortgage |
| Less than $10,000 | 0 (0.0%) | 0 (0.0%) |
| $10,000 to $24,999 | 0 (0.0%) | 0 (0.0%) |
| $25,000 to $34,999 | 0 (0.0%) | 0 (0.0%) |
| $35,000 to $49,999 | 0 (0.0%) | 0 (0.0%) |
| $50,000 to $74,999 | 5 (29.4%) | 0 (0.0%) |
| $75,000 to $99,999 | 12 (70.6%) | 0 (0.0%) |
| $100,000 to $149,999 | 0 (0.0%) | 7 (87.5%) |
| $150,000 or more | 0 (0.0%) | 1 (12.5%) |
| Total | 17 (100.0%) | 8 (100.0%) |
Property Value to Household Income Ratio in Sweet Grass
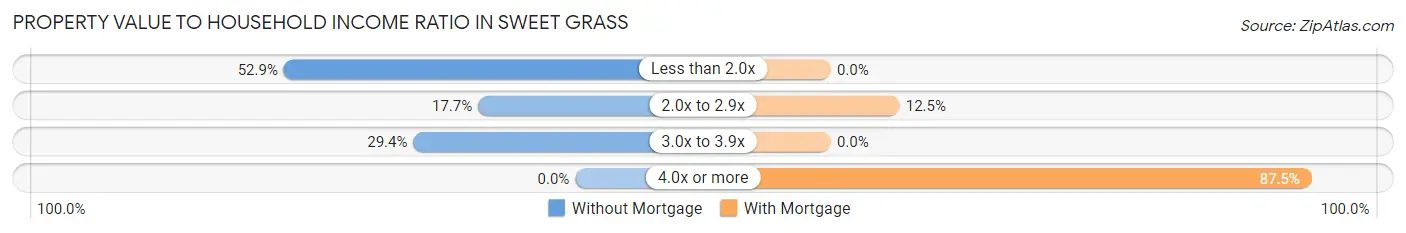
| Value-to-Income Ratio | Without Mortgage | With Mortgage |
| Less than 2.0x | 9 (52.9%) | 0 (0.0%) |
| 2.0x to 2.9x | 3 (17.6%) | 1 (12.5%) |
| 3.0x to 3.9x | 5 (29.4%) | 0 (0.0%) |
| 4.0x or more | 0 (0.0%) | 7 (87.5%) |
| Total | 17 (100.0%) | 8 (100.0%) |
Real Estate Taxes by Mortgage Status in Sweet Grass
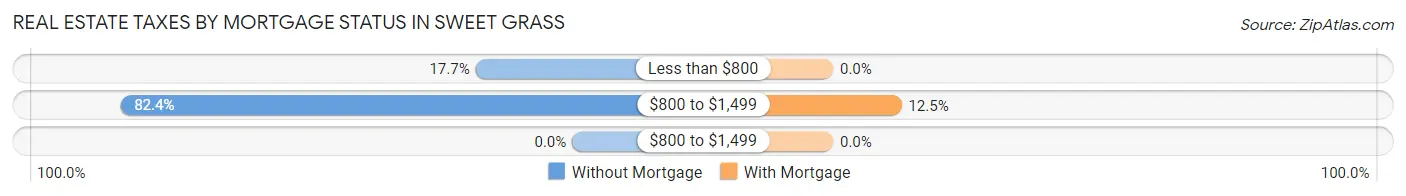
| Property Taxes | Without Mortgage | With Mortgage |
| Less than $800 | 3 (17.6%) | 0 (0.0%) |
| $800 to $1,499 | 14 (82.4%) | 1 (12.5%) |
| $800 to $1,499 | 0 (0.0%) | 0 (0.0%) |
| Total | 17 (100.0%) | 8 (100.0%) |
Health & Disability in Sweet Grass
Health Insurance Coverage by Age in Sweet Grass
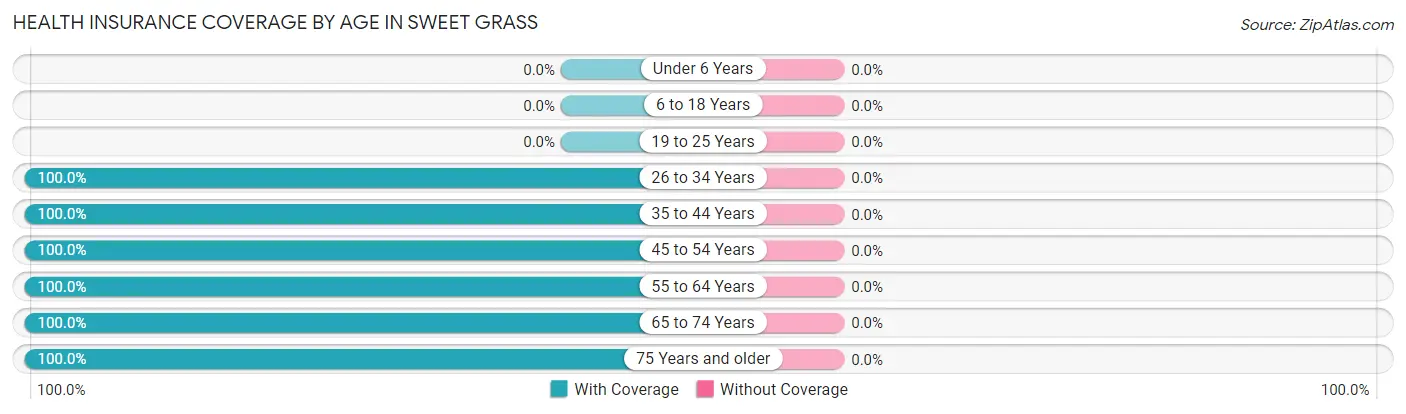
| Age Bracket | With Coverage | Without Coverage |
| Under 6 Years | 0 (0.0%) | 0 (0.0%) |
| 6 to 18 Years | 0 (0.0%) | 0 (0.0%) |
| 19 to 25 Years | 0 (0.0%) | 0 (0.0%) |
| 26 to 34 Years | 12 (100.0%) | 0 (0.0%) |
| 35 to 44 Years | 11 (100.0%) | 0 (0.0%) |
| 45 to 54 Years | 4 (100.0%) | 0 (0.0%) |
| 55 to 64 Years | 13 (100.0%) | 0 (0.0%) |
| 65 to 74 Years | 9 (100.0%) | 0 (0.0%) |
| 75 Years and older | 21 (100.0%) | 0 (0.0%) |
| Total | 70 (100.0%) | 0 (0.0%) |
Health Insurance Coverage by Citizenship Status in Sweet Grass
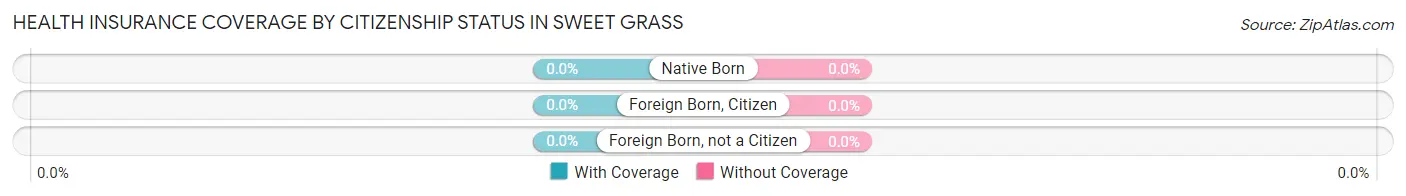
| Citizenship Status | With Coverage | Without Coverage |
| Native Born | 0 (0.0%) | 0 (0.0%) |
| Foreign Born, Citizen | 0 (0.0%) | 0 (0.0%) |
| Foreign Born, not a Citizen | 0 (0.0%) | 0 (0.0%) |
Health Insurance Coverage by Household Income in Sweet Grass
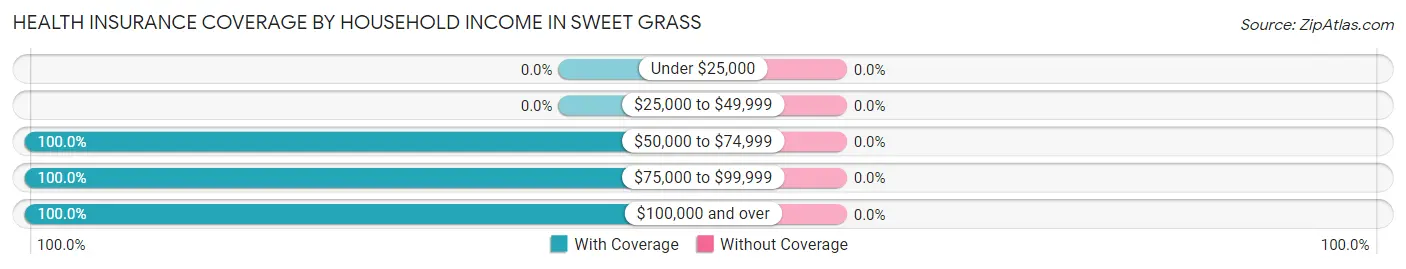
| Household Income | With Coverage | Without Coverage |
| Under $25,000 | 0 (0.0%) | 0 (0.0%) |
| $25,000 to $49,999 | 0 (0.0%) | 0 (0.0%) |
| $50,000 to $74,999 | 21 (100.0%) | 0 (0.0%) |
| $75,000 to $99,999 | 45 (100.0%) | 0 (0.0%) |
| $100,000 and over | 4 (100.0%) | 0 (0.0%) |
Public vs Private Health Insurance Coverage by Age in Sweet Grass
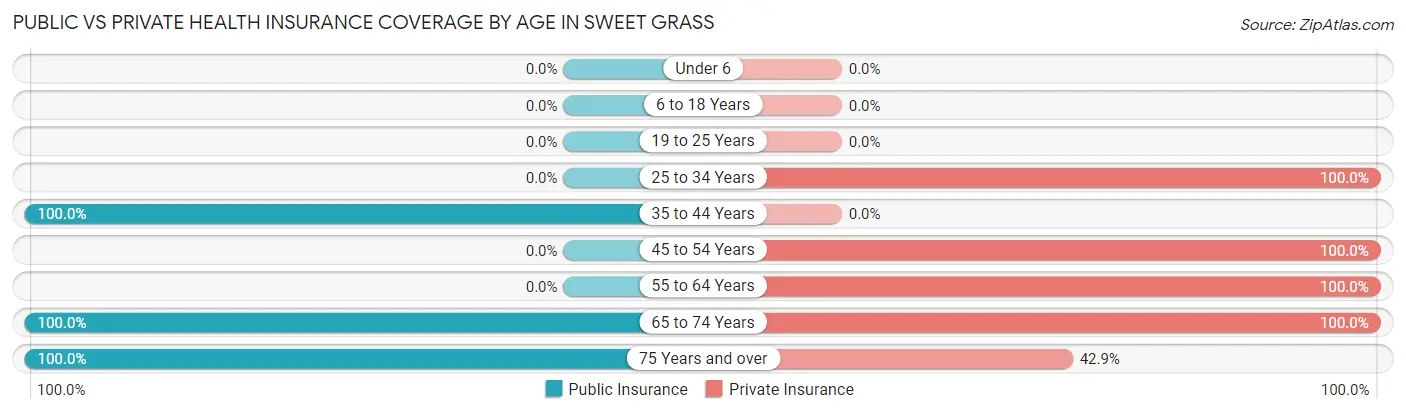
| Age Bracket | Public Insurance | Private Insurance |
| Under 6 | 0 (0.0%) | 0 (0.0%) |
| 6 to 18 Years | 0 (0.0%) | 0 (0.0%) |
| 19 to 25 Years | 0 (0.0%) | 0 (0.0%) |
| 25 to 34 Years | 0 (0.0%) | 12 (100.0%) |
| 35 to 44 Years | 11 (100.0%) | 0 (0.0%) |
| 45 to 54 Years | 0 (0.0%) | 4 (100.0%) |
| 55 to 64 Years | 0 (0.0%) | 13 (100.0%) |
| 65 to 74 Years | 9 (100.0%) | 9 (100.0%) |
| 75 Years and over | 21 (100.0%) | 9 (42.9%) |
| Total | 41 (58.6%) | 47 (67.1%) |
Disability Status by Sex by Age in Sweet Grass
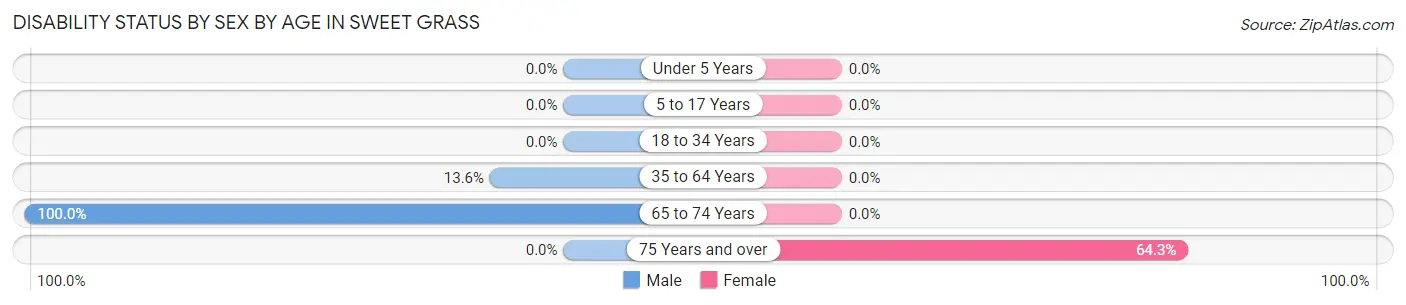
| Age Bracket | Male | Female |
| Under 5 Years | 0 (0.0%) | 0 (0.0%) |
| 5 to 17 Years | 0 (0.0%) | 0 (0.0%) |
| 18 to 34 Years | 0 (0.0%) | 0 (0.0%) |
| 35 to 64 Years | 3 (13.6%) | 0 (0.0%) |
| 65 to 74 Years | 9 (100.0%) | 0 (0.0%) |
| 75 Years and over | 0 (0.0%) | 9 (64.3%) |
Disability Class by Sex by Age in Sweet Grass
Disability Class: Hearing Difficulty
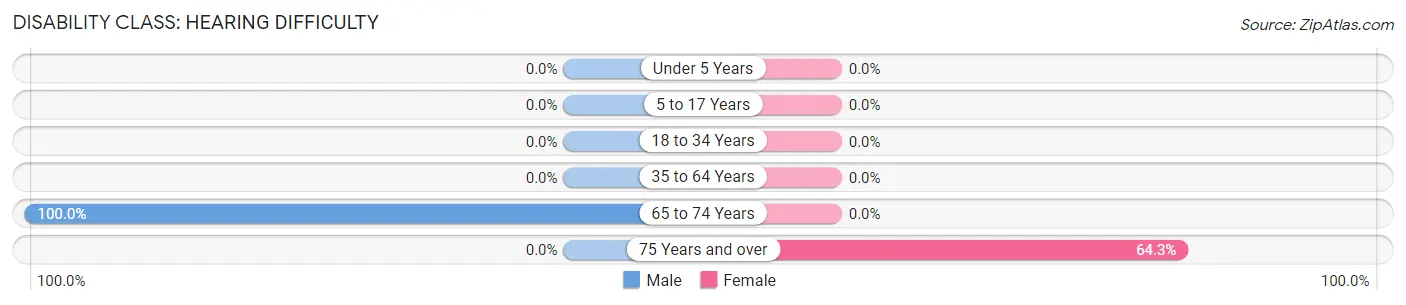
| Age Bracket | Male | Female |
| Under 5 Years | 0 (0.0%) | 0 (0.0%) |
| 5 to 17 Years | 0 (0.0%) | 0 (0.0%) |
| 18 to 34 Years | 0 (0.0%) | 0 (0.0%) |
| 35 to 64 Years | 0 (0.0%) | 0 (0.0%) |
| 65 to 74 Years | 9 (100.0%) | 0 (0.0%) |
| 75 Years and over | 0 (0.0%) | 9 (64.3%) |
Disability Class: Vision Difficulty
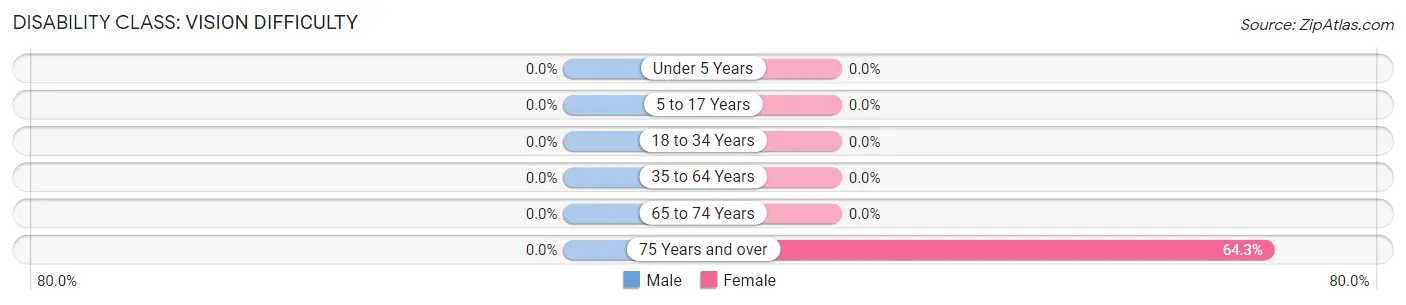
| Age Bracket | Male | Female |
| Under 5 Years | 0 (0.0%) | 0 (0.0%) |
| 5 to 17 Years | 0 (0.0%) | 0 (0.0%) |
| 18 to 34 Years | 0 (0.0%) | 0 (0.0%) |
| 35 to 64 Years | 0 (0.0%) | 0 (0.0%) |
| 65 to 74 Years | 0 (0.0%) | 0 (0.0%) |
| 75 Years and over | 0 (0.0%) | 9 (64.3%) |
Disability Class: Cognitive Difficulty
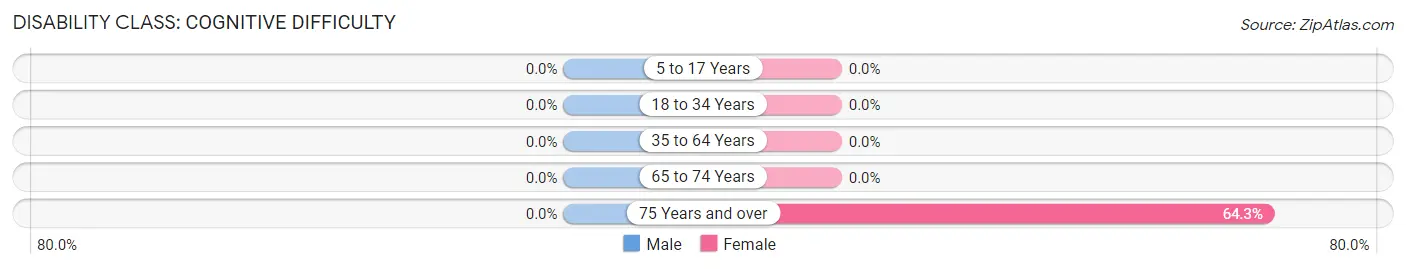
| Age Bracket | Male | Female |
| 5 to 17 Years | 0 (0.0%) | 0 (0.0%) |
| 18 to 34 Years | 0 (0.0%) | 0 (0.0%) |
| 35 to 64 Years | 0 (0.0%) | 0 (0.0%) |
| 65 to 74 Years | 0 (0.0%) | 0 (0.0%) |
| 75 Years and over | 0 (0.0%) | 9 (64.3%) |
Disability Class: Ambulatory Difficulty
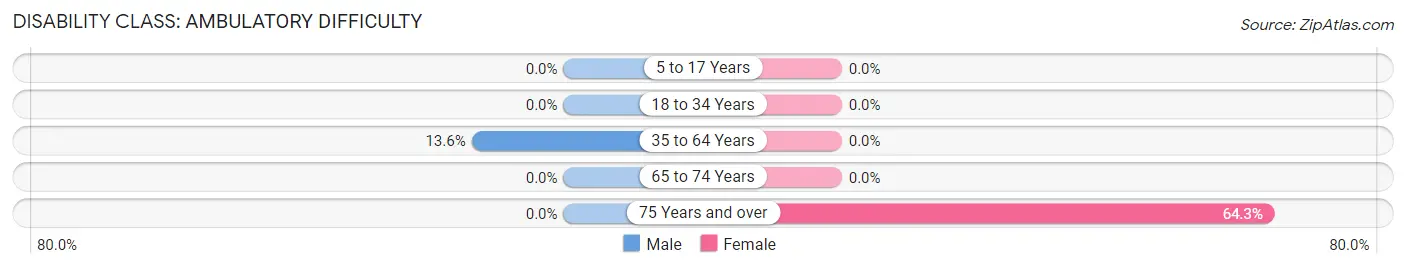
| Age Bracket | Male | Female |
| 5 to 17 Years | 0 (0.0%) | 0 (0.0%) |
| 18 to 34 Years | 0 (0.0%) | 0 (0.0%) |
| 35 to 64 Years | 3 (13.6%) | 0 (0.0%) |
| 65 to 74 Years | 0 (0.0%) | 0 (0.0%) |
| 75 Years and over | 0 (0.0%) | 9 (64.3%) |
Disability Class: Self-Care Difficulty
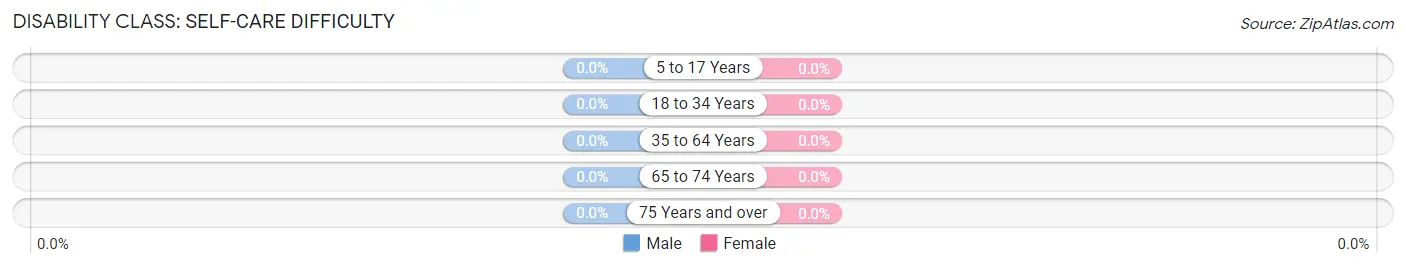
| Age Bracket | Male | Female |
| 5 to 17 Years | 0 (0.0%) | 0 (0.0%) |
| 18 to 34 Years | 0 (0.0%) | 0 (0.0%) |
| 35 to 64 Years | 0 (0.0%) | 0 (0.0%) |
| 65 to 74 Years | 0 (0.0%) | 0 (0.0%) |
| 75 Years and over | 0 (0.0%) | 0 (0.0%) |
Technology Access in Sweet Grass
Computing Device Access in Sweet Grass
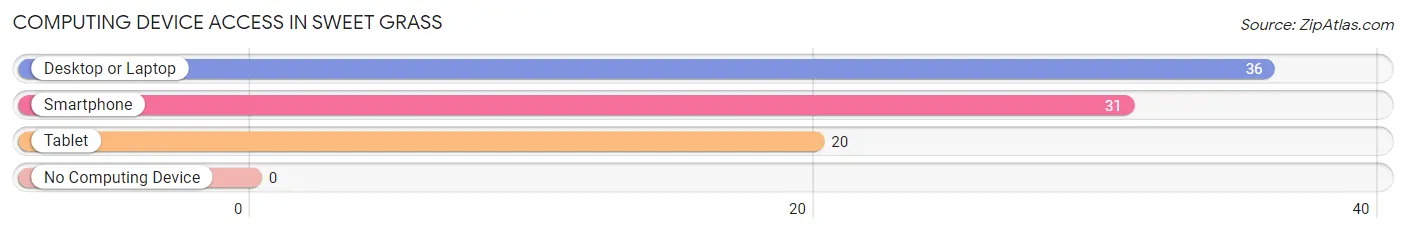
| Device Type | # Households | % Households |
| Desktop or Laptop | 36 | 100.0% |
| Smartphone | 31 | 86.1% |
| Tablet | 20 | 55.6% |
| No Computing Device | 0 | 0.0% |
| Total | 36 | 100.0% |
Internet Access in Sweet Grass
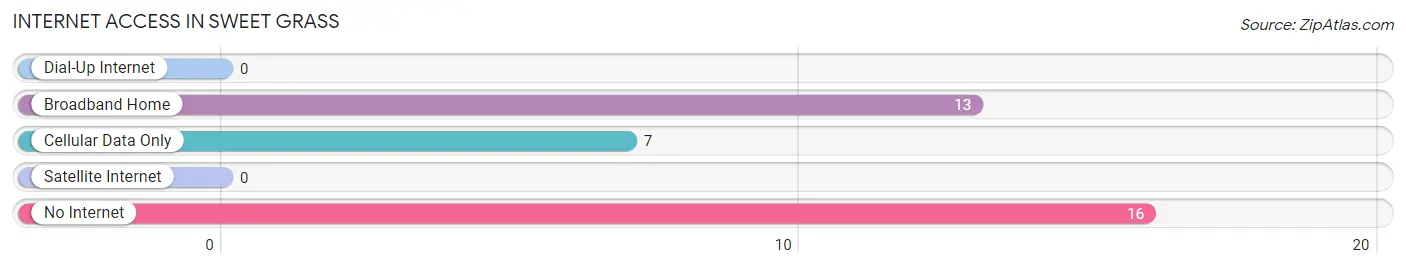
| Internet Type | # Households | % Households |
| Dial-Up Internet | 0 | 0.0% |
| Broadband Home | 13 | 36.1% |
| Cellular Data Only | 7 | 19.4% |
| Satellite Internet | 0 | 0.0% |
| No Internet | 16 | 44.4% |
| Total | 36 | 100.0% |
Sweet Grass Summary
History
The history of Sweet Grass, Montana dates back to the early 1800s when the area was inhabited by the Blackfeet and Crow tribes. The Blackfeet were the first to settle in the area, and they used the area for hunting and gathering. The Crow tribe followed shortly after, and they used the area for fishing and trading.
In 1855, the Treaty of Hellgate was signed between the United States and the Blackfeet and Crow tribes, which allowed for the settlement of the area by non-Native Americans. The first settlers were ranchers and farmers, who established homesteads in the area.
The town of Sweet Grass was officially established in 1883, and it was named after the sweet grass that grew in the area. The town quickly grew, and by the early 1900s, it had become a bustling community with a variety of businesses, including a hotel, a bank, a general store, and a post office.
In the early 1900s, the town was also home to a number of saloons, which were popular with the local cowboys. The town also had a number of churches, and it was a popular destination for tourists.
In the 1920s, the town experienced a boom in population, and it became a popular destination for tourists. The town was also home to a number of businesses, including a movie theater, a bowling alley, and a variety of restaurants.
In the 1950s, the town experienced a decline in population, and many of the businesses closed. However, the town still remained a popular destination for tourists, and it was home to a number of small businesses.
Geography
Sweet Grass, Montana is located in the northern part of the state, near the border with Canada. The town is situated in the Sweet Grass Valley, which is surrounded by the Rocky Mountains. The town is located at an elevation of 4,000 feet, and it has a total area of 1.2 square miles.
The climate in Sweet Grass is semi-arid, with hot summers and cold winters. The average temperature in the summer is around 70 degrees Fahrenheit, and the average temperature in the winter is around 20 degrees Fahrenheit.
Economy
The economy of Sweet Grass is largely based on tourism and agriculture. The town is home to a number of tourist attractions, including the Sweet Grass County Museum, the Sweet Grass County Historical Society, and the Sweet Grass County Fairgrounds.
The town is also home to a number of agricultural businesses, including cattle ranches, wheat farms, and hay farms. The town is also home to a number of small businesses, including restaurants, shops, and hotels.
Demographics
As of the 2010 census, the population of Sweet Grass was 1,093. The racial makeup of the town was 97.3% White, 0.7% Native American, 0.2% Asian, 0.1% from other races, and 1.7% from two or more races.
The median income for a household in Sweet Grass was $37,500, and the median income for a family was $45,000. The per capita income for the town was $19,000. About 11.3% of the population was below the poverty line.
Common Questions
What is Per Capita Income in Sweet Grass?
Per Capita income in Sweet Grass is $41,860.
What is the Median Household income in Sweet Grass?
Median Household Income in Sweet Grass is $75,263.
What is Inequality or Gini Index in Sweet Grass?
Inequality or Gini Index in Sweet Grass is 0.06.
What is the Total Population of Sweet Grass?
Total Population of Sweet Grass is 70.
What is the Total Male Population of Sweet Grass?
Total Male Population of Sweet Grass is 38.
What is the Total Female Population of Sweet Grass?
Total Female Population of Sweet Grass is 32.
What is the Ratio of Males per 100 Females in Sweet Grass?
There are 118.75 Males per 100 Females in Sweet Grass.
What is the Ratio of Females per 100 Males in Sweet Grass?
There are 84.21 Females per 100 Males in Sweet Grass.
What is the Median Population Age in Sweet Grass?
Median Population Age in Sweet Grass is 62.6 Years.
What is the Average Family Size in Sweet Grass
Average Family Size in Sweet Grass is 1.8 People.
What is the Average Household Size in Sweet Grass
Average Household Size in Sweet Grass is 1.9 People.
How Large is the Labor Force in Sweet Grass?
There are 39 People in the Labor Forcein in Sweet Grass.
What is the Percentage of People in the Labor Force in Sweet Grass?
55.7% of People are in the Labor Force in Sweet Grass.