Cities with the Highest Percentage of Immigrants from South America in Georgia
RELATED REPORTS & OPTIONS
South America
Georgia
Compare Cities
Map of Cities with the Highest Percentage of Immigrants from South America in Georgia
0.00%
15.00%
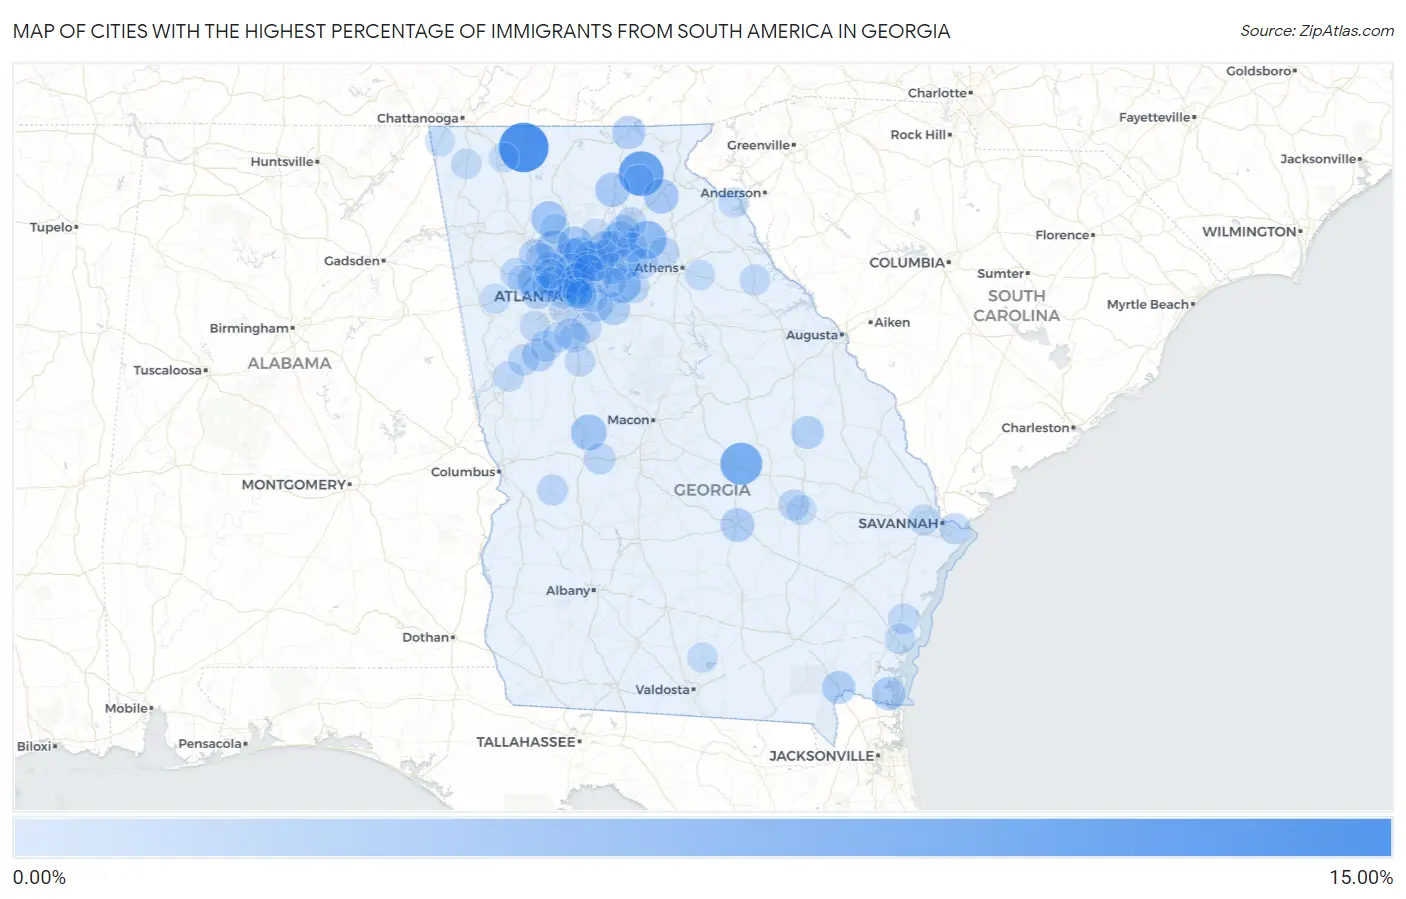
Cities with the Highest Percentage of Immigrants from South America in Georgia
| City | South America | vs State | vs National | |
| 1. | Eton | 12.39% | 0.87%(+11.5)#37 | 1.10%(+11.3)#1,943 |
| 2. | Yonah | 9.51% | 0.87%(+8.64)#38 | 1.10%(+8.41)#1,944 |
| 3. | East Dublin | 7.75% | 0.87%(+6.88)#145 | 1.10%(+6.66)#5,452 |
| 4. | Pendergrass | 5.51% | 0.87%(+4.64)#234 | 1.10%(+4.41)#8,189 |
| 5. | Ellerslie | 5.01% | 0.87%(+4.15)#235 | 1.10%(+3.92)#8,190 |
| 6. | Duluth | 4.32% | 0.87%(+3.45)#236 | 1.10%(+3.22)#8,191 |
| 7. | Loganville | 4.16% | 0.87%(+3.29)#237 | 1.10%(+3.06)#8,192 |
| 8. | Roswell | 4.06% | 0.87%(+3.19)#238 | 1.10%(+2.96)#8,193 |
| 9. | Salem | 3.98% | 0.87%(+3.11)#239 | 1.10%(+2.88)#8,194 |
| 10. | Cataula | 3.72% | 0.87%(+2.85)#240 | 1.10%(+2.62)#8,195 |
| 11. | Waleska | 3.66% | 0.87%(+2.80)#241 | 1.10%(+2.57)#8,196 |
| 12. | Baldwin | 3.38% | 0.87%(+2.51)#242 | 1.10%(+2.28)#8,197 |
| 13. | Woodstock | 3.35% | 0.87%(+2.48)#246 | 1.10%(+2.25)#8,465 |
| 14. | Fairplay | 3.24% | 0.87%(+2.37)#247 | 1.10%(+2.14)#8,466 |
| 15. | Flowery Branch | 3.19% | 0.87%(+2.32)#248 | 1.10%(+2.09)#8,467 |
| 16. | Vinings | 3.17% | 0.87%(+2.30)#303 | 1.10%(+2.07)#10,819 |
| 17. | Dahlonega | 3.16% | 0.87%(+2.29)#304 | 1.10%(+2.06)#10,820 |
| 18. | Milton | 3.12% | 0.87%(+2.25)#305 | 1.10%(+2.02)#10,821 |
| 19. | Mcrae Helena | 2.78% | 0.87%(+1.91)#306 | 1.10%(+1.68)#10,822 |
| 20. | Kings Bay Base | 2.61% | 0.87%(+1.74)#307 | 1.10%(+1.52)#10,823 |
| 21. | Young Harris | 2.53% | 0.87%(+1.66)#308 | 1.10%(+1.43)#10,824 |
| 22. | Lithia Springs | 2.48% | 0.87%(+1.62)#309 | 1.10%(+1.39)#10,825 |
| 23. | Stonecrest | 2.42% | 0.87%(+1.55)#310 | 1.10%(+1.32)#10,833 |
| 24. | Sugar Hill | 2.39% | 0.87%(+1.52)#311 | 1.10%(+1.29)#10,834 |
| 25. | Folkston | 2.38% | 0.87%(+1.51)#312 | 1.10%(+1.28)#10,835 |
| 26. | Jekyll Island | 2.33% | 0.87%(+1.46)#313 | 1.10%(+1.23)#10,836 |
| 27. | Brookhaven | 2.31% | 0.87%(+1.44)#314 | 1.10%(+1.21)#10,837 |
| 28. | Summertown | 2.31% | 0.87%(+1.44)#315 | 1.10%(+1.21)#10,838 |
| 29. | Marietta | 2.21% | 0.87%(+1.35)#316 | 1.10%(+1.12)#10,839 |
| 30. | Conyers | 2.21% | 0.87%(+1.34)#317 | 1.10%(+1.11)#10,840 |
| 31. | Doraville | 2.21% | 0.87%(+1.34)#318 | 1.10%(+1.11)#10,841 |
| 32. | Johns Creek | 2.16% | 0.87%(+1.29)#319 | 1.10%(+1.07)#10,842 |
| 33. | Auburn | 2.14% | 0.87%(+1.27)#320 | 1.10%(+1.04)#10,843 |
| 34. | Turin | 2.12% | 0.87%(+1.25)#321 | 1.10%(+1.02)#10,844 |
| 35. | Powder Springs | 2.07% | 0.87%(+1.20)#322 | 1.10%(+0.969)#10,845 |
| 36. | Sandy Springs | 2.06% | 0.87%(+1.19)#323 | 1.10%(+0.959)#10,846 |
| 37. | Oakwood | 1.95% | 0.87%(+1.08)#324 | 1.10%(+0.850)#10,847 |
| 38. | Alpharetta | 1.74% | 0.87%(+0.872)#325 | 1.10%(+0.643)#10,848 |
| 39. | Druid Hills | 1.65% | 0.87%(+0.785)#375 | 1.10%(+0.555)#13,817 |
| 40. | Smyrna | 1.61% | 0.87%(+0.746)#376 | 1.10%(+0.516)#13,818 |
| 41. | Acworth | 1.61% | 0.87%(+0.744)#377 | 1.10%(+0.515)#13,819 |
| 42. | Chamblee | 1.55% | 0.87%(+0.686)#378 | 1.10%(+0.456)#13,820 |
| 43. | Kennesaw | 1.51% | 0.87%(+0.645)#379 | 1.10%(+0.416)#13,821 |
| 44. | Reynolds | 1.51% | 0.87%(+0.645)#380 | 1.10%(+0.415)#13,822 |
| 45. | Buford | 1.49% | 0.87%(+0.624)#381 | 1.10%(+0.394)#13,823 |
| 46. | North Decatur | 1.49% | 0.87%(+0.621)#382 | 1.10%(+0.392)#13,824 |
| 47. | Dallas | 1.49% | 0.87%(+0.618)#383 | 1.10%(+0.388)#13,921 |
| 48. | Milstead | 1.48% | 0.87%(+0.613)#384 | 1.10%(+0.383)#13,922 |
| 49. | North Druid Hills | 1.47% | 0.87%(+0.605)#385 | 1.10%(+0.375)#13,923 |
| 50. | Peachtree City | 1.47% | 0.87%(+0.600)#386 | 1.10%(+0.370)#13,924 |
| 51. | Georgetown Quitman County Unified Government | 1.47% | 0.87%(+0.599)#387 | 1.10%(+0.370)#13,925 |
| 52. | Lilburn | 1.40% | 0.87%(+0.529)#388 | 1.10%(+0.299)#13,926 |
| 53. | Talahi Island | 1.35% | 0.87%(+0.482)#389 | 1.10%(+0.252)#13,927 |
| 54. | Hapeville | 1.33% | 0.87%(+0.456)#390 | 1.10%(+0.227)#13,928 |
| 55. | Arcade | 1.31% | 0.87%(+0.444)#391 | 1.10%(+0.214)#13,929 |
| 56. | Dacula | 1.27% | 0.87%(+0.406)#392 | 1.10%(+0.176)#13,930 |
| 57. | Between | 1.22% | 0.87%(+0.353)#393 | 1.10%(+0.124)#13,931 |
| 58. | Peachtree Corners | 1.22% | 0.87%(+0.353)#394 | 1.10%(+0.124)#13,932 |
| 59. | Lawrenceville | 1.19% | 0.87%(+0.326)#395 | 1.10%(+0.097)#13,933 |
| 60. | Irondale | 1.19% | 0.87%(+0.324)#396 | 1.10%(+0.094)#13,934 |
| 61. | Buena Vista | 1.17% | 0.87%(+0.303)#397 | 1.10%(+0.073)#13,935 |
| 62. | Vidalia | 1.16% | 0.87%(+0.287)#398 | 1.10%(+0.057)#13,936 |
| 63. | Moreland | 1.15% | 0.87%(+0.283)#399 | 1.10%(+0.053)#13,937 |
| 64. | Stockbridge | 1.13% | 0.87%(+0.265)#400 | 1.10%(+0.035)#13,938 |
| 65. | Pooler | 1.13% | 0.87%(+0.258)#401 | 1.10%(+0.029)#13,939 |
| 66. | Suwanee | 1.12% | 0.87%(+0.252)#402 | 1.10%(+0.022)#13,940 |
| 67. | Darien | 1.12% | 0.87%(+0.249)#403 | 1.10%(+0.019)#13,941 |
| 68. | Hogansville | 1.11% | 0.87%(+0.243)#404 | 1.10%(+0.013)#13,942 |
| 69. | Norcross | 1.05% | 0.87%(+0.181)#405 | 1.10%(-0.049)#13,943 |
| 70. | Tignall | 1.03% | 0.87%(+0.163)#406 | 1.10%(-0.066)#13,944 |
| 71. | Gainesville | 1.03% | 0.87%(+0.158)#407 | 1.10%(-0.072)#13,945 |
| 72. | Cleveland | 1.00% | 0.87%(+0.128)#408 | 1.10%(-0.102)#13,946 |
| 73. | Experiment | 0.97% | 0.87%(+0.101)#409 | 1.10%(-0.129)#13,947 |
| 74. | Palmetto | 0.97% | 0.87%(+0.099)#410 | 1.10%(-0.131)#13,948 |
| 75. | Winder | 0.96% | 0.87%(+0.093)#411 | 1.10%(-0.137)#13,949 |
| 76. | Belvedere Park | 0.93% | 0.87%(+0.059)#412 | 1.10%(-0.171)#13,950 |
| 77. | Country Club Estates | 0.92% | 0.87%(+0.048)#413 | 1.10%(-0.182)#13,951 |
| 78. | Reed Creek | 0.89% | 0.87%(+0.023)#414 | 1.10%(-0.206)#13,952 |
| 79. | Athens-Clarke County Unified Government (Balance) | 0.86% | 0.87%(-0.004)#415 | 1.10%(-0.234)#13,953 |
| 80. | Braselton | 0.85% | 0.87%(-0.014)#416 | 1.10%(-0.243)#13,954 |
| 81. | Temple | 0.85% | 0.87%(-0.016)#417 | 1.10%(-0.246)#13,955 |
| 82. | Lovejoy | 0.83% | 0.87%(-0.034)#418 | 1.10%(-0.264)#13,956 |
| 83. | Arnoldsville | 0.82% | 0.87%(-0.046)#419 | 1.10%(-0.275)#13,957 |
| 84. | Snellville | 0.81% | 0.87%(-0.055)#420 | 1.10%(-0.285)#13,958 |
| 85. | Hiram | 0.79% | 0.87%(-0.074)#421 | 1.10%(-0.304)#13,959 |
| 86. | Mableton | 0.79% | 0.87%(-0.076)#422 | 1.10%(-0.306)#13,960 |
| 87. | Redan | 0.78% | 0.87%(-0.090)#423 | 1.10%(-0.319)#13,961 |
| 88. | Ray City | 0.77% | 0.87%(-0.102)#424 | 1.10%(-0.331)#13,962 |
| 89. | Lafayette | 0.76% | 0.87%(-0.104)#425 | 1.10%(-0.333)#13,963 |
| 90. | Berry College | 0.75% | 0.87%(-0.116)#426 | 1.10%(-0.346)#13,964 |
| 91. | Atlanta | 0.75% | 0.87%(-0.116)#427 | 1.10%(-0.346)#13,965 |
| 92. | Avondale Estates | 0.71% | 0.87%(-0.156)#428 | 1.10%(-0.385)#13,966 |
| 93. | Canton | 0.71% | 0.87%(-0.158)#429 | 1.10%(-0.388)#13,967 |
| 94. | Dalton | 0.70% | 0.87%(-0.170)#430 | 1.10%(-0.400)#13,968 |
| 95. | Trenton | 0.69% | 0.87%(-0.183)#431 | 1.10%(-0.413)#13,969 |
| 96. | Santa Claus | 0.68% | 0.87%(-0.184)#432 | 1.10%(-0.413)#13,970 |
| 97. | Fayetteville | 0.68% | 0.87%(-0.185)#433 | 1.10%(-0.414)#13,971 |
| 98. | Fair Oaks | 0.68% | 0.87%(-0.192)#434 | 1.10%(-0.422)#13,972 |
| 99. | Decatur | 0.66% | 0.87%(-0.209)#435 | 1.10%(-0.439)#13,973 |
| 100. | Cumming | 0.65% | 0.87%(-0.217)#436 | 1.10%(-0.447)#13,974 |
Common Questions
What are the Top 10 Cities with the Highest Percentage of Immigrants from South America in Georgia?
Top 10 Cities with the Highest Percentage of Immigrants from South America in Georgia are:
#1
12.39%
#2
9.51%
#3
7.75%
#4
5.51%
#5
4.32%
#6
4.16%
#7
4.06%
#8
3.98%
#9
3.66%
#10
3.38%
What city has the Highest Percentage of Immigrants from South America in Georgia?
Eton has the Highest Percentage of Immigrants from South America in Georgia with 12.39%.
What is the Percentage of Immigrants from South America in the State of Georgia?
Percentage of Immigrants from South America in Georgia is 0.87%.
What is the Percentage of Immigrants from South America in the United States?
Percentage of Immigrants from South America in the United States is 1.10%.