Cities with the Highest Percentage of Immigrants from South America in Minnesota
RELATED REPORTS & OPTIONS
South America
Minnesota
Compare Cities
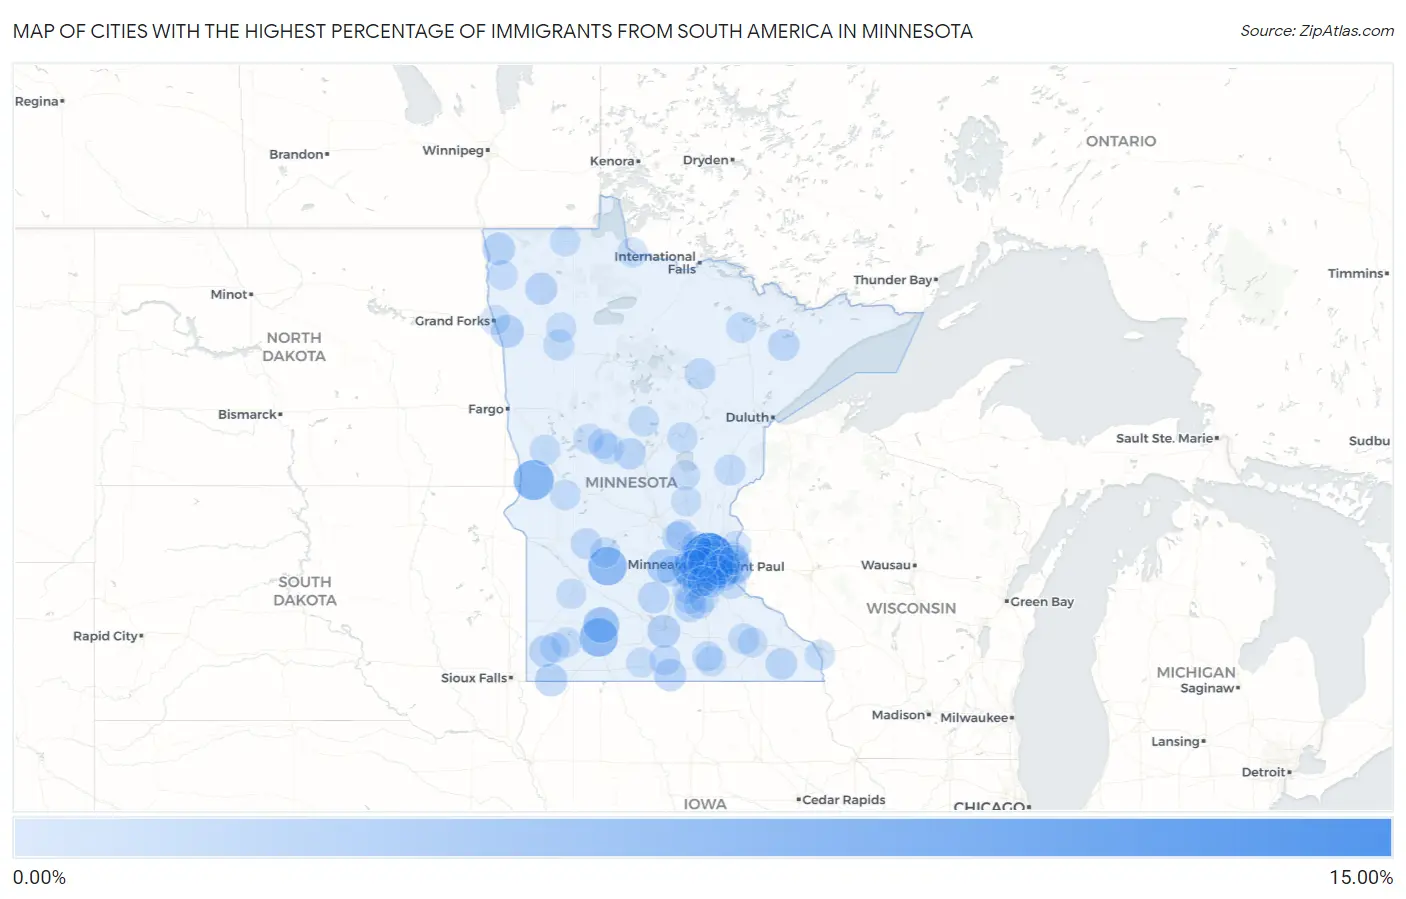
Map of Cities with the Highest Percentage of Immigrants from South America in Minnesota
0.00%
15.00%
Cities with the Highest Percentage of Immigrants from South America in Minnesota
| City | South America | vs State | vs National | |
| 1. | Hilltop | 12.94% | 0.45%(+12.5)#17 | 1.10%(+11.8)#1,671 |
| 2. | Tintah | 6.67% | 0.45%(+6.22)#18 | 1.10%(+5.57)#1,672 |
| 3. | Blomkest | 5.75% | 0.45%(+5.30)#64 | 1.10%(+4.65)#4,064 |
| 4. | Jeffers | 5.56% | 0.45%(+5.11)#118 | 1.10%(+4.46)#6,032 |
| 5. | Greenwood | 4.72% | 0.45%(+4.27)#119 | 1.10%(+3.62)#6,033 |
| 6. | Columbia Heights | 4.11% | 0.45%(+3.66)#120 | 1.10%(+3.01)#6,034 |
| 7. | Sanborn | 4.00% | 0.45%(+3.55)#247 | 1.10%(+2.90)#9,796 |
| 8. | Winsted | 2.85% | 0.45%(+2.40)#248 | 1.10%(+1.76)#9,797 |
| 9. | Fridley | 2.68% | 0.45%(+2.23)#249 | 1.10%(+1.59)#9,798 |
| 10. | Skyline | 2.22% | 0.45%(+1.77)#257 | 1.10%(+1.12)#10,266 |
| 11. | Fisher | 2.09% | 0.45%(+1.64)#258 | 1.10%(+0.990)#10,267 |
| 12. | Ellsworth | 2.02% | 0.45%(+1.57)#259 | 1.10%(+0.926)#10,268 |
| 13. | Hallock | 2.00% | 0.45%(+1.55)#260 | 1.10%(+0.899)#10,269 |
| 14. | Arden Hills | 1.76% | 0.45%(+1.31)#261 | 1.10%(+0.666)#10,270 |
| 15. | Frost | 1.75% | 0.45%(+1.30)#332 | 1.10%(+0.650)#12,328 |
| 16. | Holt | 1.67% | 0.45%(+1.22)#333 | 1.10%(+0.568)#12,329 |
| 17. | Minneapolis | 1.55% | 0.45%(+1.10)#334 | 1.10%(+0.447)#12,330 |
| 18. | Edgerton | 1.51% | 0.45%(+1.06)#335 | 1.10%(+0.414)#12,331 |
| 19. | Eden Prairie | 1.49% | 0.45%(+1.04)#336 | 1.10%(+0.393)#12,332 |
| 20. | Montgomery | 1.47% | 0.45%(+1.02)#337 | 1.10%(+0.375)#12,333 |
| 21. | Falcon Heights | 1.47% | 0.45%(+1.02)#338 | 1.10%(+0.373)#12,334 |
| 22. | Lakeland | 1.47% | 0.45%(+1.02)#339 | 1.10%(+0.368)#12,335 |
| 23. | Mendota | 1.41% | 0.45%(+0.959)#340 | 1.10%(+0.310)#12,336 |
| 24. | Gaylord | 1.39% | 0.45%(+0.943)#341 | 1.10%(+0.295)#12,337 |
| 25. | Babbitt | 1.38% | 0.45%(+0.930)#342 | 1.10%(+0.282)#12,338 |
| 26. | Lanesboro | 1.33% | 0.45%(+0.877)#343 | 1.10%(+0.229)#12,339 |
| 27. | Burnsville | 1.25% | 0.45%(+0.796)#344 | 1.10%(+0.147)#12,340 |
| 28. | Motley | 1.24% | 0.45%(+0.787)#345 | 1.10%(+0.138)#12,341 |
| 29. | Circle Pines | 1.20% | 0.45%(+0.751)#346 | 1.10%(+0.103)#12,342 |
| 30. | Osseo | 1.18% | 0.45%(+0.727)#375 | 1.10%(+0.079)#13,612 |
| 31. | Stillwater | 1.18% | 0.45%(+0.726)#376 | 1.10%(+0.077)#13,613 |
| 32. | Long Lake | 1.17% | 0.45%(+0.719)#377 | 1.10%(+0.070)#13,614 |
| 33. | Medina | 1.14% | 0.45%(+0.692)#378 | 1.10%(+0.043)#13,615 |
| 34. | Brooklyn Center | 1.09% | 0.45%(+0.644)#379 | 1.10%(-0.005)#13,616 |
| 35. | Monticello | 1.09% | 0.45%(+0.637)#380 | 1.10%(-0.012)#13,617 |
| 36. | Big Lake | 1.08% | 0.45%(+0.630)#381 | 1.10%(-0.019)#13,618 |
| 37. | Mayer | 1.06% | 0.45%(+0.607)#382 | 1.10%(-0.041)#13,619 |
| 38. | Murdock | 1.05% | 0.45%(+0.603)#383 | 1.10%(-0.046)#13,620 |
| 39. | Richfield | 1.04% | 0.45%(+0.591)#384 | 1.10%(-0.058)#13,621 |
| 40. | Brooklyn Park | 1.02% | 0.45%(+0.575)#385 | 1.10%(-0.074)#13,622 |
| 41. | Bovey | 1.01% | 0.45%(+0.562)#386 | 1.10%(-0.087)#13,623 |
| 42. | St Paul Park | 0.96% | 0.45%(+0.515)#387 | 1.10%(-0.134)#13,624 |
| 43. | Byron | 0.96% | 0.45%(+0.508)#388 | 1.10%(-0.141)#13,625 |
| 44. | Mcintosh | 0.95% | 0.45%(+0.501)#389 | 1.10%(-0.148)#13,626 |
| 45. | Delavan | 0.94% | 0.45%(+0.494)#390 | 1.10%(-0.155)#13,627 |
| 46. | Sandstone | 0.94% | 0.45%(+0.486)#391 | 1.10%(-0.163)#13,628 |
| 47. | St Louis Park | 0.93% | 0.45%(+0.482)#392 | 1.10%(-0.167)#13,629 |
| 48. | Sunfish Lake | 0.90% | 0.45%(+0.455)#393 | 1.10%(-0.194)#13,630 |
| 49. | St Marys Point | 0.86% | 0.45%(+0.407)#394 | 1.10%(-0.242)#13,631 |
| 50. | Newport | 0.84% | 0.45%(+0.391)#395 | 1.10%(-0.258)#13,632 |
| 51. | Verndale | 0.83% | 0.45%(+0.384)#396 | 1.10%(-0.265)#13,633 |
| 52. | St Anthony City Hennepin And Ramsey Counties | 0.81% | 0.45%(+0.365)#397 | 1.10%(-0.284)#13,634 |
| 53. | Chanhassen | 0.80% | 0.45%(+0.351)#398 | 1.10%(-0.298)#13,635 |
| 54. | Bloomington | 0.78% | 0.45%(+0.327)#399 | 1.10%(-0.322)#13,636 |
| 55. | Spring Lake Park | 0.78% | 0.45%(+0.326)#400 | 1.10%(-0.323)#13,637 |
| 56. | Lauderdale | 0.77% | 0.45%(+0.325)#401 | 1.10%(-0.324)#13,638 |
| 57. | Willmar | 0.75% | 0.45%(+0.303)#402 | 1.10%(-0.346)#13,639 |
| 58. | New Prague | 0.74% | 0.45%(+0.286)#403 | 1.10%(-0.363)#13,640 |
| 59. | Hoffman | 0.74% | 0.45%(+0.286)#404 | 1.10%(-0.363)#13,641 |
| 60. | Elizabeth | 0.74% | 0.45%(+0.286)#405 | 1.10%(-0.363)#13,642 |
| 61. | Pine River | 0.71% | 0.45%(+0.260)#406 | 1.10%(-0.388)#13,643 |
| 62. | Plymouth | 0.71% | 0.45%(+0.259)#407 | 1.10%(-0.390)#13,644 |
| 63. | Robbinsdale | 0.71% | 0.45%(+0.256)#408 | 1.10%(-0.392)#13,645 |
| 64. | Aitkin | 0.70% | 0.45%(+0.247)#409 | 1.10%(-0.402)#13,686 |
| 65. | Blaine | 0.69% | 0.45%(+0.244)#410 | 1.10%(-0.404)#13,687 |
| 66. | Slayton | 0.68% | 0.45%(+0.232)#411 | 1.10%(-0.416)#13,688 |
| 67. | Roseau | 0.66% | 0.45%(+0.210)#412 | 1.10%(-0.439)#13,689 |
| 68. | Cook | 0.65% | 0.45%(+0.204)#413 | 1.10%(-0.445)#13,690 |
| 69. | La Crescent | 0.64% | 0.45%(+0.186)#414 | 1.10%(-0.463)#13,691 |
| 70. | Woodbury | 0.63% | 0.45%(+0.182)#415 | 1.10%(-0.467)#13,692 |
| 71. | Elko New Market | 0.62% | 0.45%(+0.169)#416 | 1.10%(-0.480)#13,693 |
| 72. | Hastings | 0.60% | 0.45%(+0.153)#417 | 1.10%(-0.495)#13,694 |
| 73. | Prior Lake | 0.60% | 0.45%(+0.152)#418 | 1.10%(-0.497)#13,695 |
| 74. | Hollandale | 0.59% | 0.45%(+0.142)#419 | 1.10%(-0.507)#13,696 |
| 75. | Maplewood | 0.59% | 0.45%(+0.140)#420 | 1.10%(-0.509)#13,697 |
| 76. | Jordan | 0.59% | 0.45%(+0.137)#421 | 1.10%(-0.512)#13,698 |
| 77. | Dayton | 0.58% | 0.45%(+0.131)#422 | 1.10%(-0.517)#13,699 |
| 78. | Geneva | 0.57% | 0.45%(+0.120)#423 | 1.10%(-0.528)#13,700 |
| 79. | Chandler | 0.56% | 0.45%(+0.108)#424 | 1.10%(-0.541)#13,701 |
| 80. | Marine On St Croix | 0.55% | 0.45%(+0.105)#425 | 1.10%(-0.543)#13,702 |
| 81. | Wayzata | 0.55% | 0.45%(+0.100)#426 | 1.10%(-0.548)#13,703 |
| 82. | Stephen | 0.54% | 0.45%(+0.094)#427 | 1.10%(-0.555)#13,704 |
| 83. | Baudette | 0.53% | 0.45%(+0.082)#428 | 1.10%(-0.567)#13,970 |
| 84. | Oakdale | 0.52% | 0.45%(+0.075)#429 | 1.10%(-0.574)#13,971 |
| 85. | Eagan | 0.52% | 0.45%(+0.073)#430 | 1.10%(-0.575)#13,972 |
| 86. | Cottonwood | 0.52% | 0.45%(+0.072)#431 | 1.10%(-0.577)#13,973 |
| 87. | West St Paul | 0.52% | 0.45%(+0.069)#432 | 1.10%(-0.580)#13,974 |
| 88. | New York Mills | 0.51% | 0.45%(+0.065)#433 | 1.10%(-0.584)#13,975 |
| 89. | Lonsdale | 0.51% | 0.45%(+0.058)#434 | 1.10%(-0.591)#13,976 |
| 90. | Onamia | 0.50% | 0.45%(+0.053)#435 | 1.10%(-0.596)#13,977 |
| 91. | Oklee | 0.50% | 0.45%(+0.052)#436 | 1.10%(-0.597)#13,978 |
| 92. | Apple Valley | 0.50% | 0.45%(+0.049)#437 | 1.10%(-0.600)#13,979 |
| 93. | Milaca | 0.49% | 0.45%(+0.045)#438 | 1.10%(-0.603)#13,980 |
| 94. | Golden Valley | 0.48% | 0.45%(+0.034)#439 | 1.10%(-0.615)#13,981 |
| 95. | Northrop | 0.48% | 0.45%(+0.031)#440 | 1.10%(-0.618)#13,982 |
| 96. | Oak Park Heights | 0.48% | 0.45%(+0.031)#441 | 1.10%(-0.618)#13,983 |
| 97. | Savage | 0.47% | 0.45%(+0.025)#442 | 1.10%(-0.624)#13,984 |
| 98. | East Grand Forks | 0.47% | 0.45%(+0.022)#443 | 1.10%(-0.627)#13,985 |
| 99. | Rochester | 0.47% | 0.45%(+0.017)#444 | 1.10%(-0.632)#13,986 |
| 100. | Wadena | 0.46% | 0.45%(+0.013)#445 | 1.10%(-0.636)#13,987 |
Common Questions
What are the Top 10 Cities with the Highest Percentage of Immigrants from South America in Minnesota?
Top 10 Cities with the Highest Percentage of Immigrants from South America in Minnesota are:
What city has the Highest Percentage of Immigrants from South America in Minnesota?
Hilltop has the Highest Percentage of Immigrants from South America in Minnesota with 12.94%.
What is the Percentage of Immigrants from South America in the State of Minnesota?
Percentage of Immigrants from South America in Minnesota is 0.45%.
What is the Percentage of Immigrants from South America in the United States?
Percentage of Immigrants from South America in the United States is 1.10%.