Cities with the Highest Percentage of Immigrants from South America in Missouri
RELATED REPORTS & OPTIONS
South America
Missouri
Compare Cities
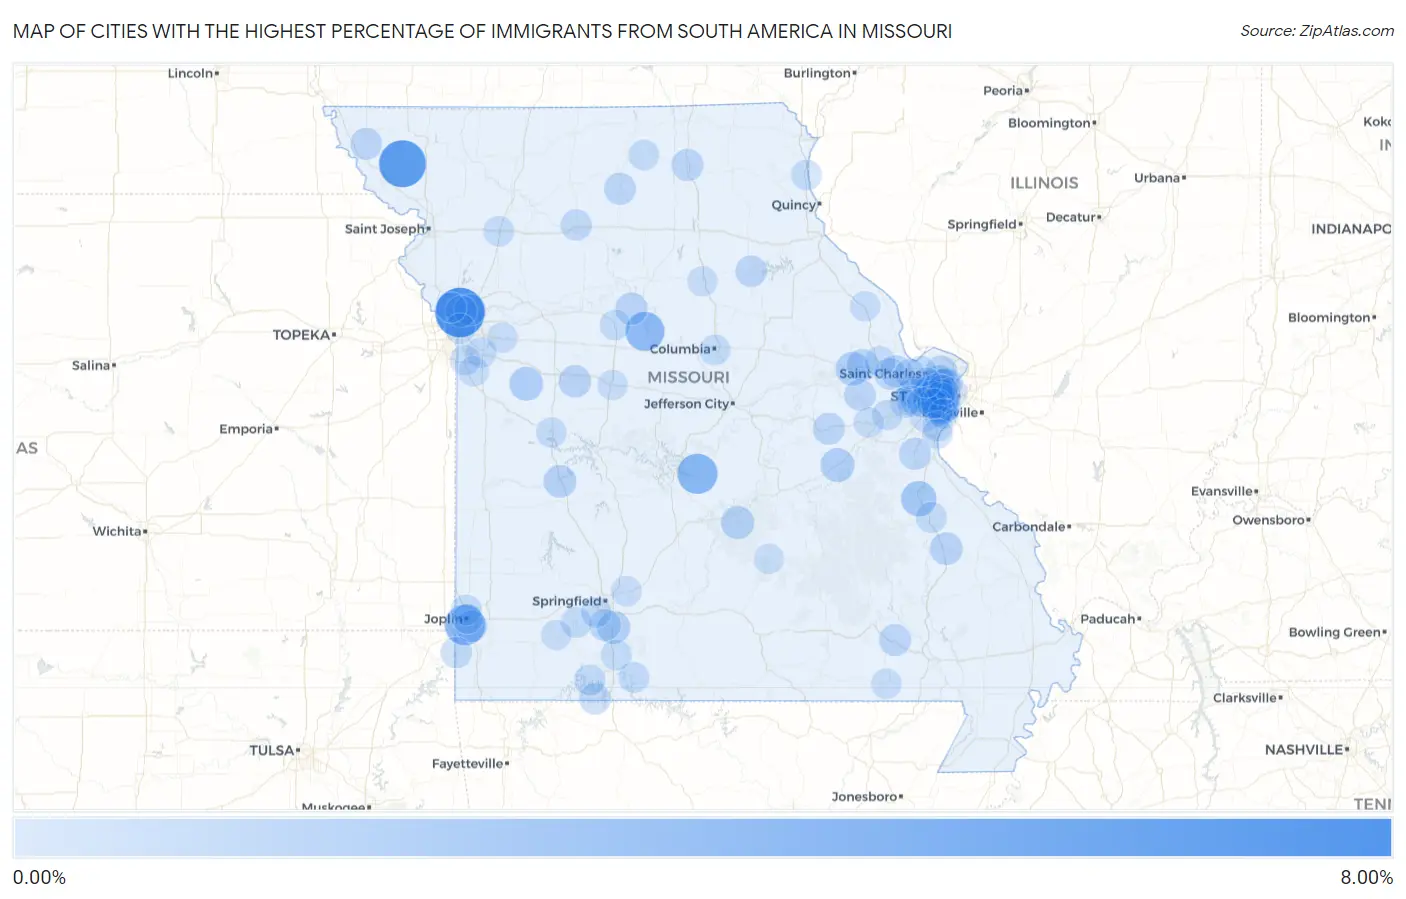
Map of Cities with the Highest Percentage of Immigrants from South America in Missouri
0.00%
8.00%
Cities with the Highest Percentage of Immigrants from South America in Missouri
| City | South America | vs State | vs National | |
| 1. | Oaks | 6.01% | 0.17%(+5.85)#30 | 1.10%(+4.91)#3,545 |
| 2. | Maitland | 5.19% | 0.17%(+5.03)#31 | 1.10%(+4.09)#3,546 |
| 3. | Shoal Creek Drive | 3.18% | 0.17%(+3.01)#79 | 1.10%(+2.08)#6,471 |
| 4. | Brumley | 3.12% | 0.17%(+2.96)#80 | 1.10%(+2.03)#6,623 |
| 5. | Arrow Rock | 2.78% | 0.17%(+2.61)#81 | 1.10%(+1.68)#6,624 |
| 6. | Bonne Terre | 1.66% | 0.17%(+1.50)#318 | 1.10%(+0.563)#14,050 |
| 7. | Clarkson Valley | 1.34% | 0.17%(+1.18)#319 | 1.10%(+0.244)#14,051 |
| 8. | Overland | 1.31% | 0.17%(+1.14)#320 | 1.10%(+0.209)#14,052 |
| 9. | Bourbon | 1.25% | 0.17%(+1.09)#321 | 1.10%(+0.152)#14,053 |
| 10. | Holden | 1.20% | 0.17%(+1.03)#322 | 1.10%(+0.097)#14,054 |
| 11. | Truesdale | 1.19% | 0.17%(+1.02)#323 | 1.10%(+0.090)#14,055 |
| 12. | Marlborough | 1.16% | 0.17%(+0.999)#324 | 1.10%(+0.065)#14,056 |
| 13. | Country Life Acres | 1.08% | 0.17%(+0.910)#325 | 1.10%(-0.023)#14,057 |
| 14. | Ladue | 1.01% | 0.17%(+0.842)#326 | 1.10%(-0.091)#14,058 |
| 15. | Fort Leonard Wood | 0.99% | 0.17%(+0.827)#327 | 1.10%(-0.106)#14,059 |
| 16. | Ozark | 0.98% | 0.17%(+0.813)#328 | 1.10%(-0.120)#14,060 |
| 17. | Westwood | 0.97% | 0.17%(+0.806)#329 | 1.10%(-0.127)#14,061 |
| 18. | Osceola | 0.93% | 0.17%(+0.769)#330 | 1.10%(-0.165)#14,062 |
| 19. | Fredericktown | 0.90% | 0.17%(+0.736)#331 | 1.10%(-0.197)#14,063 |
| 20. | Normandy | 0.88% | 0.17%(+0.718)#332 | 1.10%(-0.215)#14,064 |
| 21. | Affton | 0.83% | 0.17%(+0.668)#333 | 1.10%(-0.265)#14,065 |
| 22. | Whiteman Afb | 0.80% | 0.17%(+0.636)#334 | 1.10%(-0.297)#14,066 |
| 23. | Woodson Terrace | 0.79% | 0.17%(+0.621)#335 | 1.10%(-0.312)#14,067 |
| 24. | Slater | 0.75% | 0.17%(+0.590)#336 | 1.10%(-0.343)#14,068 |
| 25. | Kirksville | 0.72% | 0.17%(+0.553)#337 | 1.10%(-0.380)#14,069 |
| 26. | Chesterfield | 0.70% | 0.17%(+0.534)#338 | 1.10%(-0.399)#14,070 |
| 27. | Ellsinore | 0.68% | 0.17%(+0.514)#339 | 1.10%(-0.420)#14,071 |
| 28. | Browning | 0.68% | 0.17%(+0.513)#340 | 1.10%(-0.420)#14,072 |
| 29. | Gerald | 0.67% | 0.17%(+0.503)#341 | 1.10%(-0.430)#14,073 |
| 30. | Hillsboro | 0.66% | 0.17%(+0.498)#342 | 1.10%(-0.435)#14,074 |
| 31. | Wright City | 0.66% | 0.17%(+0.498)#343 | 1.10%(-0.435)#14,075 |
| 32. | Creve Coeur | 0.66% | 0.17%(+0.493)#344 | 1.10%(-0.440)#14,076 |
| 33. | Saginaw | 0.66% | 0.17%(+0.491)#345 | 1.10%(-0.443)#14,077 |
| 34. | O Fallon | 0.64% | 0.17%(+0.473)#346 | 1.10%(-0.460)#14,078 |
| 35. | Nixa | 0.63% | 0.17%(+0.468)#347 | 1.10%(-0.465)#14,079 |
| 36. | Lakeshire | 0.63% | 0.17%(+0.468)#348 | 1.10%(-0.465)#14,080 |
| 37. | Florissant | 0.62% | 0.17%(+0.460)#349 | 1.10%(-0.473)#14,081 |
| 38. | Fairfax | 0.62% | 0.17%(+0.454)#350 | 1.10%(-0.479)#14,082 |
| 39. | Lake St Louis | 0.61% | 0.17%(+0.449)#351 | 1.10%(-0.484)#14,083 |
| 40. | Paris | 0.58% | 0.17%(+0.412)#352 | 1.10%(-0.521)#14,084 |
| 41. | Marthasville | 0.57% | 0.17%(+0.408)#353 | 1.10%(-0.525)#14,085 |
| 42. | Richmond Heights | 0.57% | 0.17%(+0.401)#354 | 1.10%(-0.532)#14,086 |
| 43. | Wilbur Park | 0.54% | 0.17%(+0.371)#355 | 1.10%(-0.562)#14,087 |
| 44. | Blue Eye | 0.51% | 0.17%(+0.349)#356 | 1.10%(-0.584)#14,088 |
| 45. | Pleasant Valley | 0.51% | 0.17%(+0.344)#357 | 1.10%(-0.589)#14,089 |
| 46. | Chillicothe | 0.51% | 0.17%(+0.341)#358 | 1.10%(-0.592)#14,090 |
| 47. | Seneca | 0.50% | 0.17%(+0.334)#359 | 1.10%(-0.600)#14,091 |
| 48. | Gladstone | 0.49% | 0.17%(+0.324)#360 | 1.10%(-0.609)#14,092 |
| 49. | Frontenac | 0.44% | 0.17%(+0.275)#361 | 1.10%(-0.659)#14,093 |
| 50. | Crystal Lake Park | 0.43% | 0.17%(+0.270)#362 | 1.10%(-0.663)#14,094 |
| 51. | Farmington | 0.41% | 0.17%(+0.244)#363 | 1.10%(-0.690)#14,095 |
| 52. | Kimberling City | 0.38% | 0.17%(+0.216)#364 | 1.10%(-0.717)#14,096 |
| 53. | Maplewood | 0.38% | 0.17%(+0.213)#365 | 1.10%(-0.720)#14,097 |
| 54. | Ellisville | 0.36% | 0.17%(+0.198)#366 | 1.10%(-0.735)#14,098 |
| 55. | Des Peres | 0.36% | 0.17%(+0.196)#367 | 1.10%(-0.737)#14,201 |
| 56. | Kissee Mills | 0.35% | 0.17%(+0.188)#368 | 1.10%(-0.745)#14,202 |
| 57. | Billings | 0.35% | 0.17%(+0.186)#369 | 1.10%(-0.747)#14,203 |
| 58. | Columbia | 0.35% | 0.17%(+0.186)#370 | 1.10%(-0.747)#14,204 |
| 59. | Green City | 0.34% | 0.17%(+0.170)#371 | 1.10%(-0.763)#14,205 |
| 60. | St Charles | 0.32% | 0.17%(+0.159)#372 | 1.10%(-0.774)#14,206 |
| 61. | Olivette | 0.32% | 0.17%(+0.155)#373 | 1.10%(-0.778)#14,207 |
| 62. | Saddlebrooke | 0.32% | 0.17%(+0.153)#374 | 1.10%(-0.780)#14,208 |
| 63. | Murphy | 0.31% | 0.17%(+0.143)#375 | 1.10%(-0.790)#14,209 |
| 64. | Airport Drive | 0.30% | 0.17%(+0.131)#376 | 1.10%(-0.802)#14,210 |
| 65. | Kansas City | 0.30% | 0.17%(+0.130)#377 | 1.10%(-0.803)#14,211 |
| 66. | Marshall | 0.29% | 0.17%(+0.127)#378 | 1.10%(-0.806)#14,212 |
| 67. | Flint Hill | 0.29% | 0.17%(+0.123)#379 | 1.10%(-0.810)#14,213 |
| 68. | Sappington | 0.28% | 0.17%(+0.119)#380 | 1.10%(-0.814)#14,214 |
| 69. | Battlefield | 0.28% | 0.17%(+0.116)#381 | 1.10%(-0.817)#14,215 |
| 70. | Lee S Summit | 0.28% | 0.17%(+0.113)#382 | 1.10%(-0.820)#14,216 |
| 71. | Wildwood | 0.28% | 0.17%(+0.113)#383 | 1.10%(-0.820)#14,217 |
| 72. | Grandview | 0.28% | 0.17%(+0.113)#384 | 1.10%(-0.821)#14,218 |
| 73. | Gray Summit | 0.27% | 0.17%(+0.107)#385 | 1.10%(-0.826)#14,219 |
| 74. | Brentwood | 0.27% | 0.17%(+0.104)#386 | 1.10%(-0.829)#14,220 |
| 75. | Cameron | 0.26% | 0.17%(+0.099)#387 | 1.10%(-0.835)#14,221 |
| 76. | Clinton | 0.26% | 0.17%(+0.093)#388 | 1.10%(-0.840)#14,222 |
| 77. | Manchester | 0.26% | 0.17%(+0.093)#389 | 1.10%(-0.841)#14,223 |
| 78. | Canton | 0.26% | 0.17%(+0.091)#390 | 1.10%(-0.842)#14,224 |
| 79. | St Louis | 0.25% | 0.17%(+0.082)#391 | 1.10%(-0.851)#14,225 |
| 80. | Oakland | 0.24% | 0.17%(+0.080)#392 | 1.10%(-0.853)#14,226 |
| 81. | Raymore | 0.24% | 0.17%(+0.076)#393 | 1.10%(-0.857)#14,227 |
| 82. | Bellerive Acres | 0.24% | 0.17%(+0.072)#394 | 1.10%(-0.861)#14,228 |
| 83. | University City | 0.24% | 0.17%(+0.070)#395 | 1.10%(-0.863)#14,229 |
| 84. | Arnold | 0.24% | 0.17%(+0.070)#396 | 1.10%(-0.863)#14,230 |
| 85. | St Peters | 0.23% | 0.17%(+0.069)#397 | 1.10%(-0.864)#14,231 |
| 86. | Doniphan | 0.23% | 0.17%(+0.069)#398 | 1.10%(-0.864)#14,232 |
| 87. | Strafford | 0.23% | 0.17%(+0.068)#399 | 1.10%(-0.865)#14,233 |
| 88. | Eolia | 0.23% | 0.17%(+0.062)#400 | 1.10%(-0.871)#14,234 |
| 89. | Kirkwood | 0.23% | 0.17%(+0.060)#401 | 1.10%(-0.873)#14,235 |
| 90. | Aurora | 0.22% | 0.17%(+0.054)#402 | 1.10%(-0.879)#14,236 |
| 91. | Grain Valley | 0.22% | 0.17%(+0.052)#403 | 1.10%(-0.882)#14,237 |
| 92. | Maryland Heights | 0.21% | 0.17%(+0.041)#404 | 1.10%(-0.892)#14,238 |
| 93. | Joplin | 0.20% | 0.17%(+0.035)#405 | 1.10%(-0.898)#14,239 |
| 94. | Platte Woods | 0.20% | 0.17%(+0.034)#406 | 1.10%(-0.899)#14,240 |
| 95. | Sedalia | 0.20% | 0.17%(+0.032)#407 | 1.10%(-0.901)#14,241 |
| 96. | Union | 0.19% | 0.17%(+0.021)#408 | 1.10%(-0.912)#14,242 |
| 97. | Licking | 0.18% | 0.17%(+0.014)#409 | 1.10%(-0.919)#14,243 |
| 98. | Mehlville | 0.18% | 0.17%(+0.014)#410 | 1.10%(-0.920)#14,244 |
| 99. | Moberly | 0.18% | 0.17%(+0.010)#411 | 1.10%(-0.923)#14,245 |
| 100. | Imperial | 0.17% | 0.17%(+0.002)#412 | 1.10%(-0.931)#14,246 |
Common Questions
What are the Top 10 Cities with the Highest Percentage of Immigrants from South America in Missouri?
Top 10 Cities with the Highest Percentage of Immigrants from South America in Missouri are:
#1
6.01%
#2
5.19%
#3
3.18%
#4
3.12%
#5
2.78%
#6
1.66%
#7
1.34%
#8
1.31%
#9
1.25%
#10
1.20%
What city has the Highest Percentage of Immigrants from South America in Missouri?
Oaks has the Highest Percentage of Immigrants from South America in Missouri with 6.01%.
What is the Percentage of Immigrants from South America in the State of Missouri?
Percentage of Immigrants from South America in Missouri is 0.17%.
What is the Percentage of Immigrants from South America in the United States?
Percentage of Immigrants from South America in the United States is 1.10%.