Cities with the Highest Percentage of Immigrants from South America in Wisconsin
RELATED REPORTS & OPTIONS
South America
Wisconsin
Compare Cities
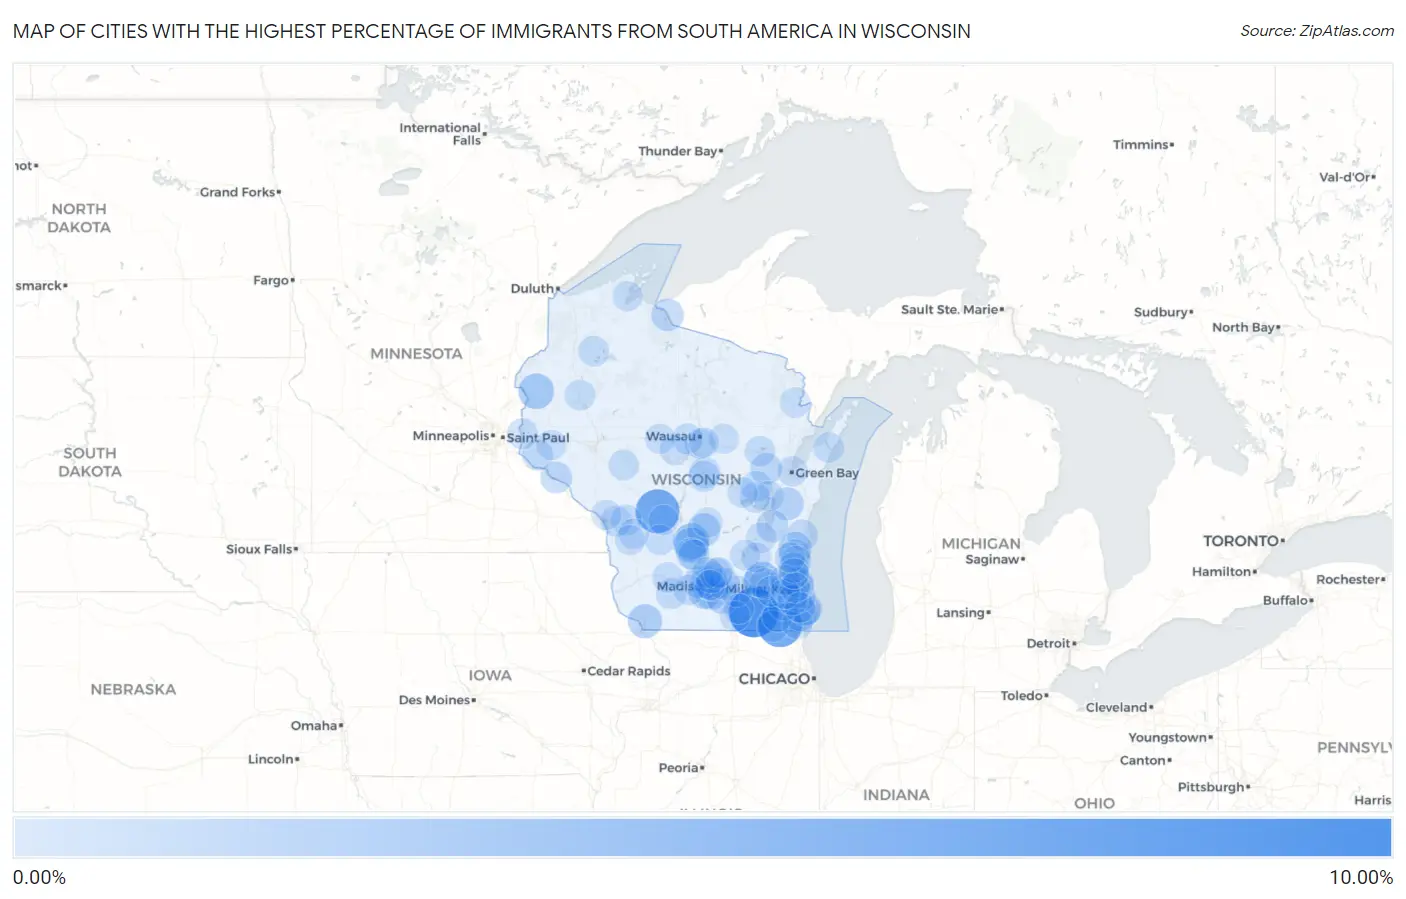
Map of Cities with the Highest Percentage of Immigrants from South America in Wisconsin
0.00%
10.00%
Cities with the Highest Percentage of Immigrants from South America in Wisconsin
| City | South America | vs State | vs National | |
| 1. | Turtle Lake | 8.58% | 0.23%(+8.35)#230 | 1.10%(+7.48)#10,242 |
| 2. | Lily Lake | 6.24% | 0.23%(+6.01)#231 | 1.10%(+5.14)#10,243 |
| 3. | Wyeville | 6.03% | 0.23%(+5.80)#232 | 1.10%(+4.94)#10,244 |
| 4. | Raymond | 3.78% | 0.23%(+3.55)#233 | 1.10%(+2.68)#10,245 |
| 5. | Lac La Belle | 2.78% | 0.23%(+2.55)#234 | 1.10%(+1.68)#10,246 |
| 6. | Wisconsin Dells | 2.55% | 0.23%(+2.32)#326 | 1.10%(+1.45)#12,914 |
| 7. | Milltown | 2.47% | 0.23%(+2.24)#327 | 1.10%(+1.37)#12,915 |
| 8. | Lake Delton | 2.22% | 0.23%(+1.99)#328 | 1.10%(+1.12)#12,916 |
| 9. | Mount Pleasant | 1.93% | 0.23%(+1.70)#329 | 1.10%(+0.830)#12,917 |
| 10. | Dickeyville | 1.87% | 0.23%(+1.64)#330 | 1.10%(+0.768)#12,918 |
| 11. | Fitchburg | 1.69% | 0.23%(+1.46)#331 | 1.10%(+0.595)#12,919 |
| 12. | Random Lake | 1.58% | 0.23%(+1.35)#332 | 1.10%(+0.484)#12,920 |
| 13. | Oxford | 1.57% | 0.23%(+1.34)#333 | 1.10%(+0.467)#12,921 |
| 14. | Verona | 1.42% | 0.23%(+1.19)#334 | 1.10%(+0.319)#12,922 |
| 15. | Stoughton | 1.34% | 0.23%(+1.11)#335 | 1.10%(+0.246)#12,923 |
| 16. | Potter | 1.31% | 0.23%(+1.08)#336 | 1.10%(+0.212)#12,924 |
| 17. | Hurley | 1.14% | 0.23%(+0.909)#337 | 1.10%(+0.041)#12,925 |
| 18. | Middleton | 1.10% | 0.23%(+0.868)#338 | 1.10%(-0.001)#12,926 |
| 19. | Wind Point | 1.07% | 0.23%(+0.837)#356 | 1.10%(-0.032)#13,814 |
| 20. | St Peter | 1.03% | 0.23%(+0.796)#357 | 1.10%(-0.073)#13,815 |
| 21. | Madison | 1.02% | 0.23%(+0.789)#358 | 1.10%(-0.079)#13,816 |
| 22. | Cross Plains | 0.89% | 0.23%(+0.659)#359 | 1.10%(-0.210)#13,817 |
| 23. | North Bay | 0.88% | 0.23%(+0.651)#360 | 1.10%(-0.217)#13,818 |
| 24. | Ixonia | 0.87% | 0.23%(+0.642)#361 | 1.10%(-0.226)#13,819 |
| 25. | Cottage Grove | 0.86% | 0.23%(+0.629)#362 | 1.10%(-0.239)#13,820 |
| 26. | Pepin | 0.85% | 0.23%(+0.621)#363 | 1.10%(-0.248)#13,821 |
| 27. | Fredonia | 0.82% | 0.23%(+0.588)#364 | 1.10%(-0.281)#13,822 |
| 28. | Cudahy | 0.80% | 0.23%(+0.572)#365 | 1.10%(-0.297)#13,823 |
| 29. | Nichols | 0.80% | 0.23%(+0.567)#366 | 1.10%(-0.301)#13,824 |
| 30. | Bloomfield | 0.75% | 0.23%(+0.522)#367 | 1.10%(-0.347)#13,825 |
| 31. | Lake Ripley | 0.71% | 0.23%(+0.477)#368 | 1.10%(-0.392)#13,826 |
| 32. | Deforest | 0.69% | 0.23%(+0.458)#369 | 1.10%(-0.411)#13,827 |
| 33. | Oconomowoc | 0.68% | 0.23%(+0.447)#370 | 1.10%(-0.422)#13,828 |
| 34. | Waunakee | 0.67% | 0.23%(+0.440)#371 | 1.10%(-0.429)#13,829 |
| 35. | Park Ridge | 0.63% | 0.23%(+0.397)#372 | 1.10%(-0.472)#13,830 |
| 36. | Wind Lake | 0.59% | 0.23%(+0.359)#373 | 1.10%(-0.509)#13,924 |
| 37. | Plover | 0.58% | 0.23%(+0.346)#374 | 1.10%(-0.523)#13,925 |
| 38. | Sheboygan Falls | 0.55% | 0.23%(+0.322)#375 | 1.10%(-0.547)#13,926 |
| 39. | Mission | 0.54% | 0.23%(+0.312)#376 | 1.10%(-0.556)#13,927 |
| 40. | Burlington | 0.53% | 0.23%(+0.298)#377 | 1.10%(-0.571)#13,928 |
| 41. | Hortonville | 0.51% | 0.23%(+0.285)#378 | 1.10%(-0.584)#13,929 |
| 42. | West Baraboo | 0.51% | 0.23%(+0.284)#379 | 1.10%(-0.584)#13,930 |
| 43. | Ellsworth | 0.51% | 0.23%(+0.282)#380 | 1.10%(-0.587)#13,931 |
| 44. | Greenfield | 0.51% | 0.23%(+0.277)#381 | 1.10%(-0.592)#13,932 |
| 45. | Shorewood | 0.50% | 0.23%(+0.274)#382 | 1.10%(-0.595)#13,933 |
| 46. | West Salem | 0.48% | 0.23%(+0.246)#383 | 1.10%(-0.622)#13,934 |
| 47. | Hayward | 0.48% | 0.23%(+0.245)#384 | 1.10%(-0.623)#13,935 |
| 48. | Shawano | 0.47% | 0.23%(+0.237)#385 | 1.10%(-0.631)#13,936 |
| 49. | Baraboo | 0.46% | 0.23%(+0.233)#386 | 1.10%(-0.636)#13,937 |
| 50. | Dane | 0.45% | 0.23%(+0.223)#387 | 1.10%(-0.645)#13,938 |
| 51. | Rockland | 0.45% | 0.23%(+0.219)#388 | 1.10%(-0.650)#13,939 |
| 52. | Rice Lake | 0.44% | 0.23%(+0.215)#389 | 1.10%(-0.653)#13,940 |
| 53. | North Hudson | 0.44% | 0.23%(+0.213)#390 | 1.10%(-0.655)#13,941 |
| 54. | Dodgeville | 0.42% | 0.23%(+0.191)#391 | 1.10%(-0.678)#13,942 |
| 55. | Glendale | 0.41% | 0.23%(+0.179)#392 | 1.10%(-0.690)#13,943 |
| 56. | Saukville | 0.40% | 0.23%(+0.168)#393 | 1.10%(-0.701)#13,944 |
| 57. | Menasha | 0.40% | 0.23%(+0.168)#394 | 1.10%(-0.701)#13,945 |
| 58. | Fairchild | 0.40% | 0.23%(+0.166)#395 | 1.10%(-0.702)#13,946 |
| 59. | Kenosha | 0.39% | 0.23%(+0.161)#396 | 1.10%(-0.707)#13,947 |
| 60. | Wales | 0.38% | 0.23%(+0.152)#397 | 1.10%(-0.716)#13,948 |
| 61. | Hillsboro | 0.38% | 0.23%(+0.150)#398 | 1.10%(-0.719)#13,949 |
| 62. | Sturgeon Bay | 0.36% | 0.23%(+0.134)#399 | 1.10%(-0.734)#13,950 |
| 63. | Rothschild | 0.36% | 0.23%(+0.132)#400 | 1.10%(-0.737)#13,951 |
| 64. | Lone Rock | 0.36% | 0.23%(+0.130)#401 | 1.10%(-0.739)#13,952 |
| 65. | Whitefish Bay | 0.36% | 0.23%(+0.128)#402 | 1.10%(-0.740)#13,953 |
| 66. | Marathon City | 0.36% | 0.23%(+0.128)#403 | 1.10%(-0.741)#13,954 |
| 67. | Brookfield | 0.35% | 0.23%(+0.124)#404 | 1.10%(-0.745)#13,955 |
| 68. | Wausaukee | 0.35% | 0.23%(+0.120)#405 | 1.10%(-0.749)#13,956 |
| 69. | Blue Mounds | 0.35% | 0.23%(+0.118)#406 | 1.10%(-0.751)#13,957 |
| 70. | Windsor | 0.34% | 0.23%(+0.113)#407 | 1.10%(-0.756)#13,958 |
| 71. | Thiensville | 0.34% | 0.23%(+0.106)#408 | 1.10%(-0.763)#13,959 |
| 72. | Oakfield | 0.33% | 0.23%(+0.099)#409 | 1.10%(-0.770)#13,960 |
| 73. | Beaver Dam | 0.32% | 0.23%(+0.089)#410 | 1.10%(-0.780)#13,961 |
| 74. | Winchester | 0.32% | 0.23%(+0.087)#411 | 1.10%(-0.782)#13,962 |
| 75. | Fremont | 0.31% | 0.23%(+0.085)#412 | 1.10%(-0.784)#13,963 |
| 76. | Menomonee Falls | 0.31% | 0.23%(+0.079)#413 | 1.10%(-0.790)#13,964 |
| 77. | Cashton | 0.31% | 0.23%(+0.077)#414 | 1.10%(-0.791)#13,965 |
| 78. | Washburn | 0.30% | 0.23%(+0.074)#415 | 1.10%(-0.794)#13,966 |
| 79. | Franklin | 0.30% | 0.23%(+0.072)#416 | 1.10%(-0.797)#13,967 |
| 80. | Janesville | 0.30% | 0.23%(+0.069)#417 | 1.10%(-0.800)#13,968 |
| 81. | Caledonia | 0.30% | 0.23%(+0.067)#418 | 1.10%(-0.802)#13,969 |
| 82. | Green Bay | 0.30% | 0.23%(+0.067)#419 | 1.10%(-0.802)#13,970 |
| 83. | Stratford | 0.29% | 0.23%(+0.064)#420 | 1.10%(-0.805)#13,971 |
| 84. | New Berlin | 0.29% | 0.23%(+0.058)#421 | 1.10%(-0.811)#13,972 |
| 85. | Mequon | 0.29% | 0.23%(+0.057)#422 | 1.10%(-0.811)#13,973 |
| 86. | Camp Douglas | 0.27% | 0.23%(+0.041)#423 | 1.10%(-0.828)#13,974 |
| 87. | Milton | 0.26% | 0.23%(+0.034)#424 | 1.10%(-0.835)#13,975 |
| 88. | Birnamwood | 0.26% | 0.23%(+0.033)#425 | 1.10%(-0.836)#13,976 |
| 89. | Cedarburg | 0.26% | 0.23%(+0.032)#426 | 1.10%(-0.836)#13,977 |
| 90. | Holmen | 0.26% | 0.23%(+0.029)#427 | 1.10%(-0.839)#13,978 |
| 91. | Westby | 0.26% | 0.23%(+0.029)#428 | 1.10%(-0.839)#13,979 |
| 92. | Greenville | 0.26% | 0.23%(+0.027)#429 | 1.10%(-0.842)#13,980 |
| 93. | Shorewood Hills | 0.24% | 0.23%(+0.010)#430 | 1.10%(-0.858)#13,981 |
| 94. | Horicon | 0.24% | 0.23%(+0.008)#431 | 1.10%(-0.861)#13,982 |
| 95. | Westfield | 0.24% | 0.23%(+0.007)#432 | 1.10%(-0.862)#13,983 |
| 96. | Milwaukee | 0.24% | 0.23%(+0.006)#433 | 1.10%(-0.863)#13,984 |
| 97. | Spring Valley | 0.23% | 0.23%(+0.004)#434 | 1.10%(-0.865)#13,985 |
| 98. | Newburg | 0.23% | 0.23%(+0.000)#435 | 1.10%(-0.869)#13,986 |
| 99. | Weston | 0.23% | 0.23%(-0.000)#436 | 1.10%(-0.869)#14,286 |
| 100. | Abbotsford | 0.23% | 0.23%(-0.001)#437 | 1.10%(-0.870)#14,287 |
Common Questions
What are the Top 10 Cities with the Highest Percentage of Immigrants from South America in Wisconsin?
Top 10 Cities with the Highest Percentage of Immigrants from South America in Wisconsin are:
#1
8.58%
#2
6.24%
#3
6.03%
#4
2.78%
#5
2.55%
#6
2.47%
#7
2.22%
#8
1.93%
#9
1.87%
#10
1.69%
What city has the Highest Percentage of Immigrants from South America in Wisconsin?
Turtle Lake has the Highest Percentage of Immigrants from South America in Wisconsin with 8.58%.
What is the Percentage of Immigrants from South America in the State of Wisconsin?
Percentage of Immigrants from South America in Wisconsin is 0.23%.
What is the Percentage of Immigrants from South America in the United States?
Percentage of Immigrants from South America in the United States is 1.10%.