Seneca, SD Map & Demographics
Seneca Map
Seneca Overview
$28,698
PER CAPITA INCOME
$50,833
AVG FAMILY INCOME
$39,375
AVG HOUSEHOLD INCOME
0.39
INEQUALITY / GINI INDEX
42
TOTAL POPULATION
27
MALE POPULATION
15
FEMALE POPULATION
180.00
MALES / 100 FEMALES
55.56
FEMALES / 100 MALES
67.7
MEDIAN AGE
4.3
AVG FAMILY SIZE
2.3
AVG HOUSEHOLD SIZE
14
LABOR FORCE [ PEOPLE ]
33.3%
PERCENT IN LABOR FORCE
Seneca Zip Codes
Seneca Area Codes
Income in Seneca
Income Overview in Seneca
Per Capita Income in Seneca is $28,698, while median incomes of families and households are $50,833 and $39,375 respectively.
| Characteristic | Number | Measure |
| Per Capita Income | 42 | $28,698 |
| Median Family Income | 6 | $50,833 |
| Mean Family Income | 6 | $48,200 |
| Median Household Income | 18 | $39,375 |
| Mean Household Income | 18 | $56,467 |
| Income Deficit | 6 | $0 |
| Wage / Income Gap (%) | 42 | 0.00% |
| Wage / Income Gap ($) | 42 | 100.00¢ per $1 |
| Gini / Inequality Index | 42 | 0.39 |
Earnings by Sex in Seneca
| Sex | Number | Average Earnings |
| Male | 10 (71.4%) | $0 |
| Female | 4 (28.6%) | $0 |
| Total | 14 (100.0%) | $0 |
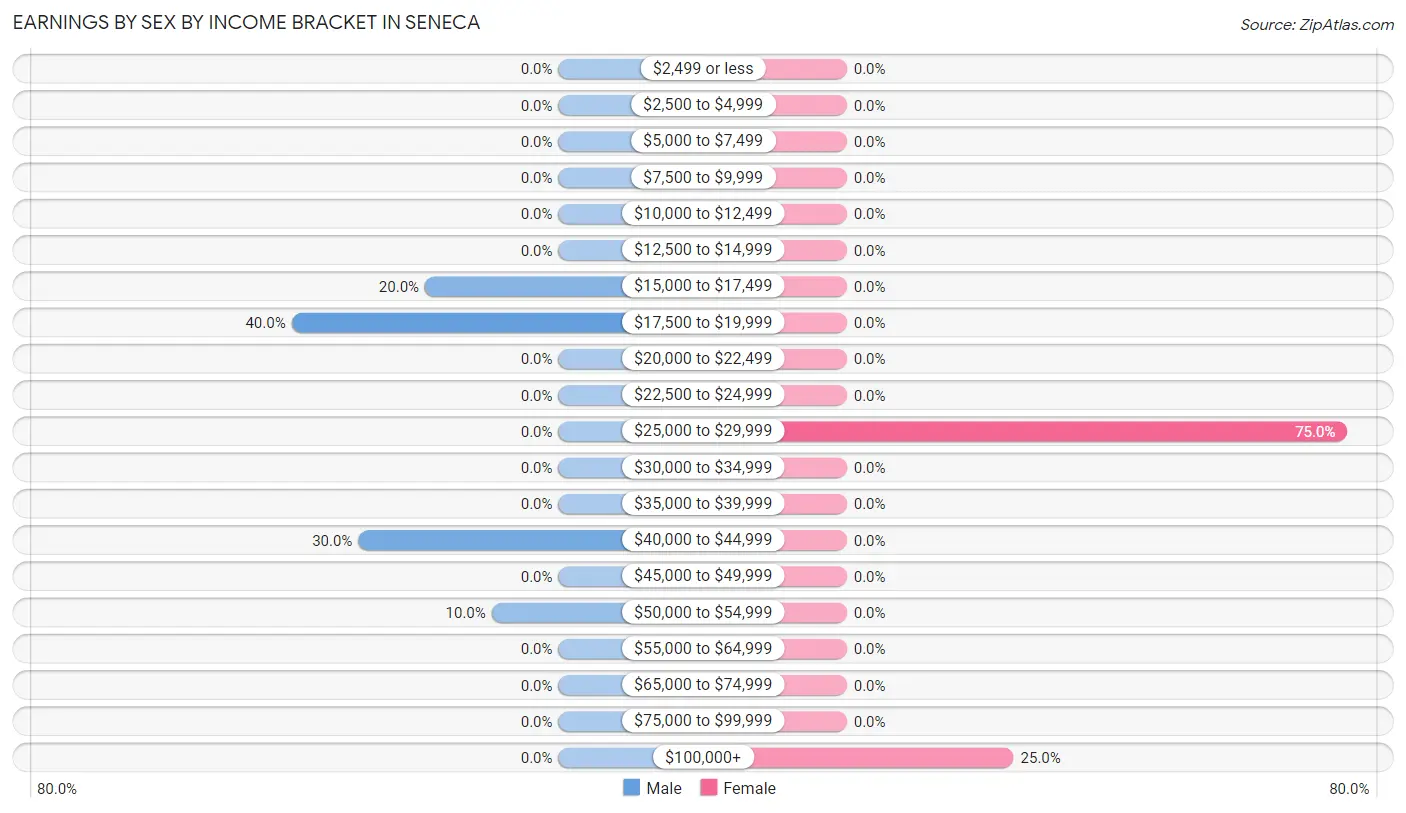
Earnings by Sex by Income Bracket in Seneca
The most common earnings brackets in Seneca are $17,500 to $19,999 for men (4 | 40.0%) and $25,000 to $29,999 for women (3 | 75.0%).
| Income | Male | Female |
| $2,499 or less | 0 (0.0%) | 0 (0.0%) |
| $2,500 to $4,999 | 0 (0.0%) | 0 (0.0%) |
| $5,000 to $7,499 | 0 (0.0%) | 0 (0.0%) |
| $7,500 to $9,999 | 0 (0.0%) | 0 (0.0%) |
| $10,000 to $12,499 | 0 (0.0%) | 0 (0.0%) |
| $12,500 to $14,999 | 0 (0.0%) | 0 (0.0%) |
| $15,000 to $17,499 | 2 (20.0%) | 0 (0.0%) |
| $17,500 to $19,999 | 4 (40.0%) | 0 (0.0%) |
| $20,000 to $22,499 | 0 (0.0%) | 0 (0.0%) |
| $22,500 to $24,999 | 0 (0.0%) | 0 (0.0%) |
| $25,000 to $29,999 | 0 (0.0%) | 3 (75.0%) |
| $30,000 to $34,999 | 0 (0.0%) | 0 (0.0%) |
| $35,000 to $39,999 | 0 (0.0%) | 0 (0.0%) |
| $40,000 to $44,999 | 3 (30.0%) | 0 (0.0%) |
| $45,000 to $49,999 | 0 (0.0%) | 0 (0.0%) |
| $50,000 to $54,999 | 1 (10.0%) | 0 (0.0%) |
| $55,000 to $64,999 | 0 (0.0%) | 0 (0.0%) |
| $65,000 to $74,999 | 0 (0.0%) | 0 (0.0%) |
| $75,000 to $99,999 | 0 (0.0%) | 0 (0.0%) |
| $100,000+ | 0 (0.0%) | 1 (25.0%) |
| Total | 10 (100.0%) | 4 (100.0%) |
Earnings by Sex by Educational Attainment in Seneca
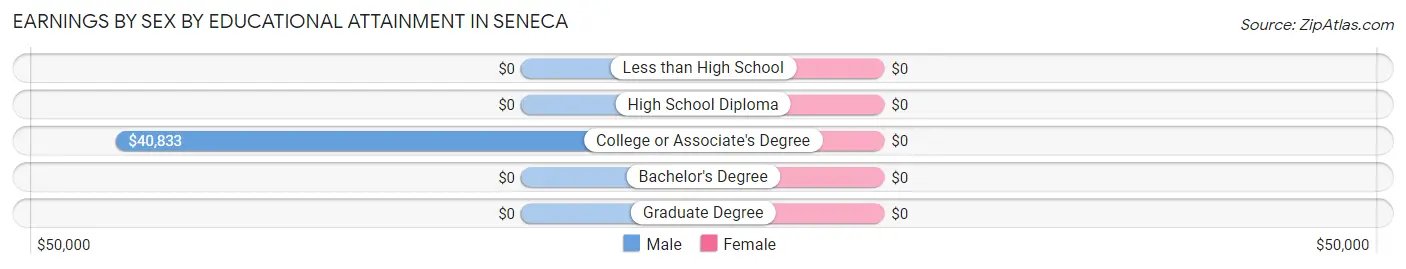
| Educational Attainment | Male Income | Female Income |
| Less than High School | - | - |
| High School Diploma | - | - |
| College or Associate's Degree | $40,833 | $0 |
| Bachelor's Degree | - | - |
| Graduate Degree | - | - |
| Total | - | - |
Family Income in Seneca
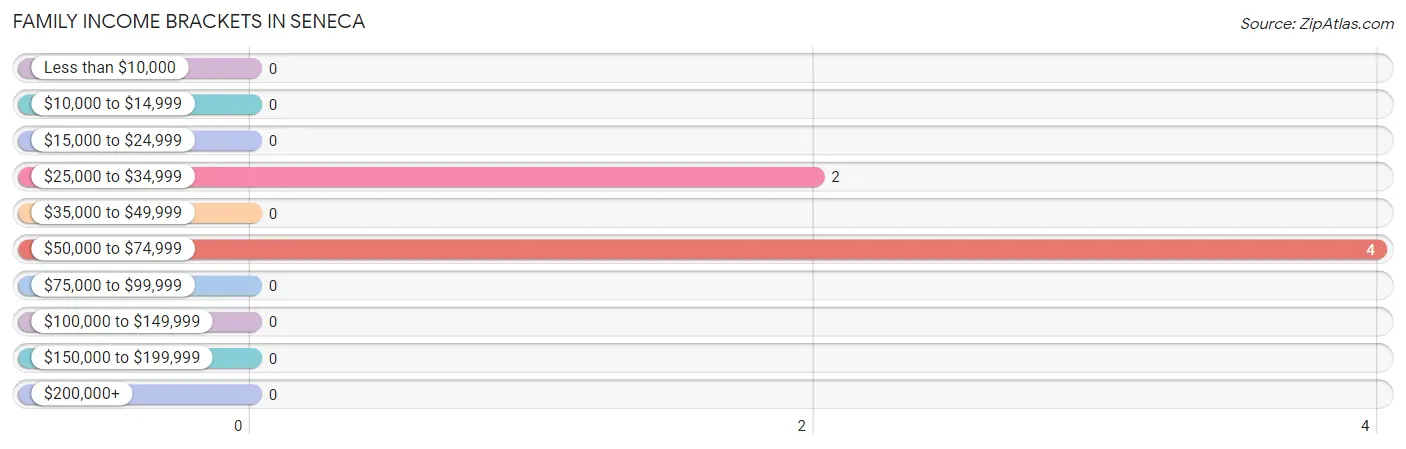
Family Income Brackets in Seneca
According to the Seneca family income data, there are 4 families falling into the $50,000 to $74,999 income range, which is the most common income bracket and makes up 66.7% of all families.
| Income Bracket | # Families | % Families |
| Less than $10,000 | 0 | 0.0% |
| $10,000 to $14,999 | 0 | 0.0% |
| $15,000 to $24,999 | 0 | 0.0% |
| $25,000 to $34,999 | 2 | 33.3% |
| $35,000 to $49,999 | 0 | 0.0% |
| $50,000 to $74,999 | 4 | 66.7% |
| $75,000 to $99,999 | 0 | 0.0% |
| $100,000 to $149,999 | 0 | 0.0% |
| $150,000 to $199,999 | 0 | 0.0% |
| $200,000+ | 0 | 0.0% |
Family Income by Famaliy Size in Seneca
| Income Bracket | # Families | Median Income |
| 2-Person Families | 4 (66.7%) | $0 |
| 3-Person Families | 2 (33.3%) | $0 |
| 4-Person Families | 0 (0.0%) | $0 |
| 5-Person Families | 0 (0.0%) | $0 |
| 6-Person Families | 0 (0.0%) | $0 |
| 7+ Person Families | 0 (0.0%) | $0 |
| Total | 6 (100.0%) | $50,833 |
Family Income by Number of Earners in Seneca
| Number of Earners | # Families | Median Income |
| No Earners | 0 (0.0%) | $0 |
| 1 Earner | 3 (50.0%) | $0 |
| 2 Earners | 3 (50.0%) | $0 |
| 3+ Earners | 0 (0.0%) | $0 |
| Total | 6 (100.0%) | $50,833 |
Household Income in Seneca
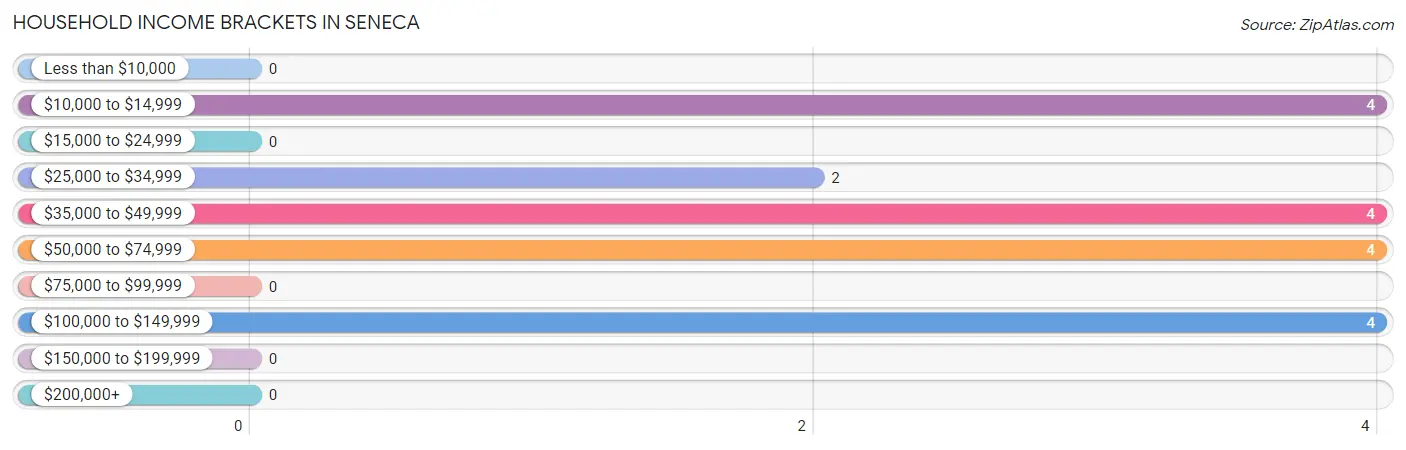
Household Income Brackets in Seneca
With 4 households falling in the category, the $10,000 to $14,999 income range is the most frequent in Seneca, accounting for 22.2% of all households.
| Income Bracket | # Households | % Households |
| Less than $10,000 | 0 | 0.0% |
| $10,000 to $14,999 | 4 | 22.2% |
| $15,000 to $24,999 | 0 | 0.0% |
| $25,000 to $34,999 | 2 | 11.1% |
| $35,000 to $49,999 | 4 | 22.2% |
| $50,000 to $74,999 | 4 | 22.2% |
| $75,000 to $99,999 | 0 | 0.0% |
| $100,000 to $149,999 | 4 | 22.2% |
| $150,000 to $199,999 | 0 | 0.0% |
| $200,000+ | 0 | 0.0% |
Household Income by Householder Age in Seneca
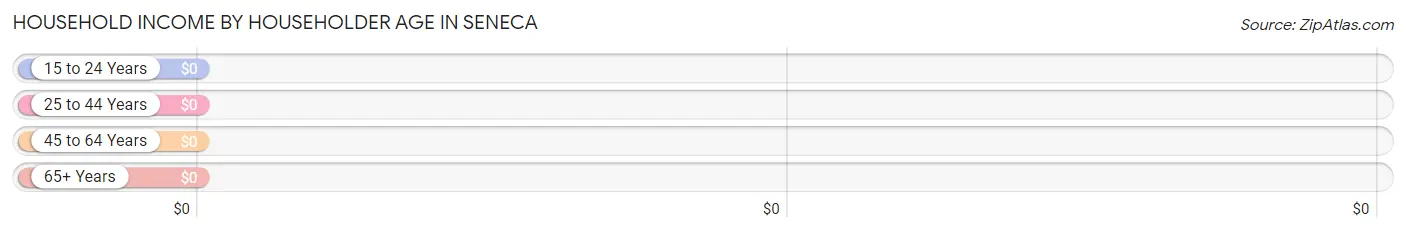
| Income Bracket | # Households | Median Income |
| 15 to 24 Years | 0 (0.0%) | $0 |
| 25 to 44 Years | 2 (11.1%) | $0 |
| 45 to 64 Years | 12 (66.7%) | $0 |
| 65+ Years | 4 (22.2%) | $0 |
| Total | 18 (100.0%) | $39,375 |
Poverty in Seneca
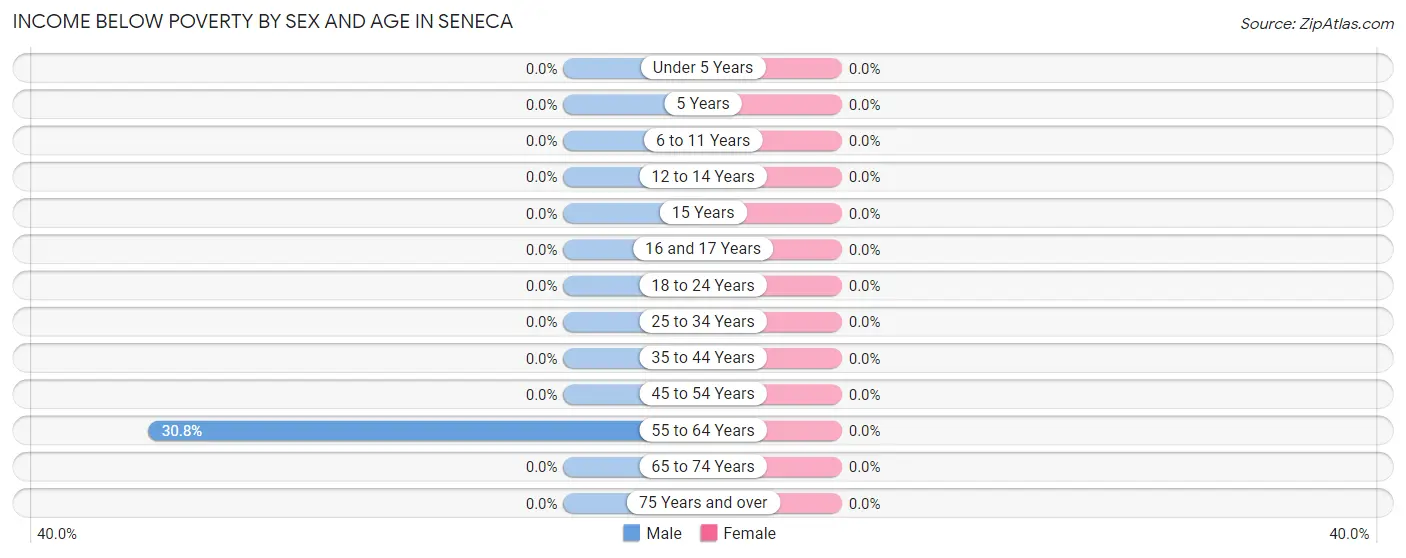
Income Below Poverty by Sex and Age in Seneca
| Age Bracket | Male | Female |
| Under 5 Years | 0 (0.0%) | 0 (0.0%) |
| 5 Years | 0 (0.0%) | 0 (0.0%) |
| 6 to 11 Years | 0 (0.0%) | 0 (0.0%) |
| 12 to 14 Years | 0 (0.0%) | 0 (0.0%) |
| 15 Years | 0 (0.0%) | 0 (0.0%) |
| 16 and 17 Years | 0 (0.0%) | 0 (0.0%) |
| 18 to 24 Years | 0 (0.0%) | 0 (0.0%) |
| 25 to 34 Years | 0 (0.0%) | 0 (0.0%) |
| 35 to 44 Years | 0 (0.0%) | 0 (0.0%) |
| 45 to 54 Years | 0 (0.0%) | 0 (0.0%) |
| 55 to 64 Years | 4 (30.8%) | 0 (0.0%) |
| 65 to 74 Years | 0 (0.0%) | 0 (0.0%) |
| 75 Years and over | 0 (0.0%) | 0 (0.0%) |
| Total | 4 (14.8%) | 0 (0.0%) |
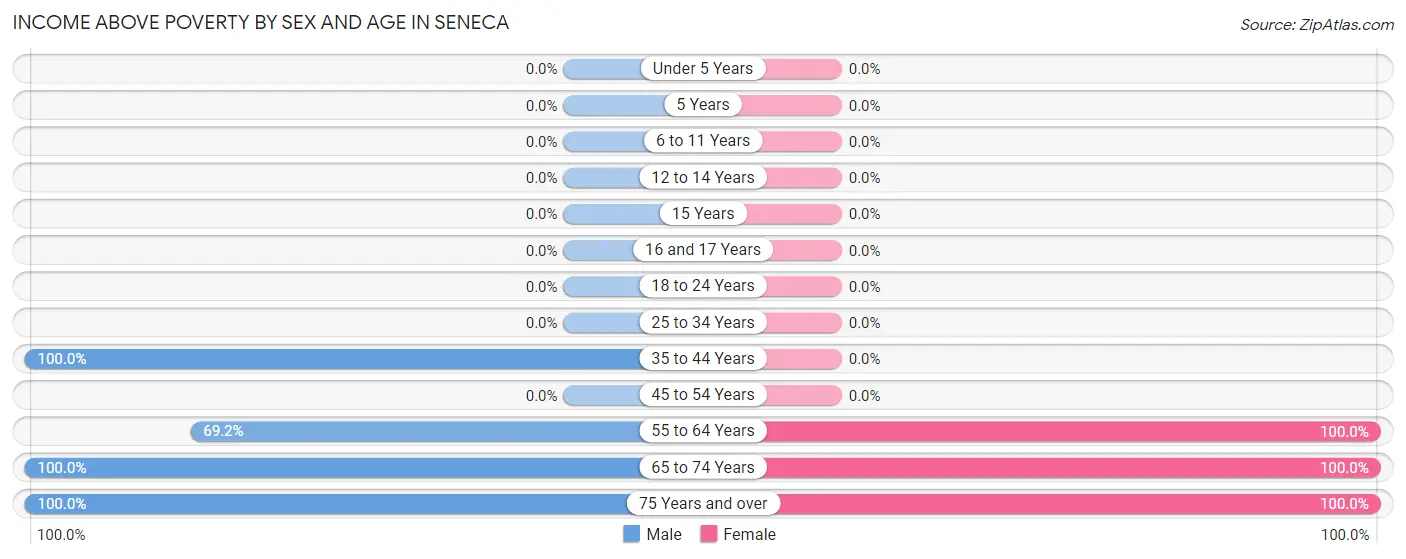
Income Above Poverty by Sex and Age in Seneca
According to the poverty statistics in Seneca, males aged 35 to 44 years and females aged 55 to 64 years are the age groups that are most secure financially, with 100.0% of males and 100.0% of females in these age groups living above the poverty line.
| Age Bracket | Male | Female |
| Under 5 Years | 0 (0.0%) | 0 (0.0%) |
| 5 Years | 0 (0.0%) | 0 (0.0%) |
| 6 to 11 Years | 0 (0.0%) | 0 (0.0%) |
| 12 to 14 Years | 0 (0.0%) | 0 (0.0%) |
| 15 Years | 0 (0.0%) | 0 (0.0%) |
| 16 and 17 Years | 0 (0.0%) | 0 (0.0%) |
| 18 to 24 Years | 0 (0.0%) | 0 (0.0%) |
| 25 to 34 Years | 0 (0.0%) | 0 (0.0%) |
| 35 to 44 Years | 2 (100.0%) | 0 (0.0%) |
| 45 to 54 Years | 0 (0.0%) | 0 (0.0%) |
| 55 to 64 Years | 9 (69.2%) | 3 (100.0%) |
| 65 to 74 Years | 3 (100.0%) | 5 (100.0%) |
| 75 Years and over | 9 (100.0%) | 7 (100.0%) |
| Total | 23 (85.2%) | 15 (100.0%) |
Income Below Poverty Among Married-Couple Families in Seneca
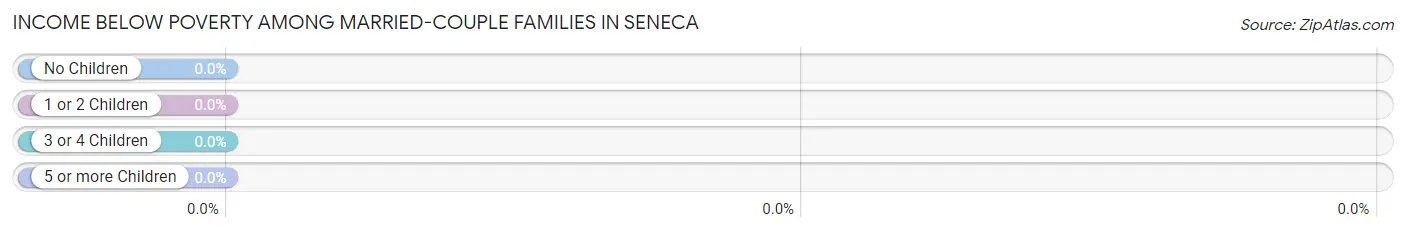
| Children | Above Poverty | Below Poverty |
| No Children | 4 (100.0%) | 0 (0.0%) |
| 1 or 2 Children | 0 (0.0%) | 0 (0.0%) |
| 3 or 4 Children | 0 (0.0%) | 0 (0.0%) |
| 5 or more Children | 0 (0.0%) | 0 (0.0%) |
| Total | 4 (100.0%) | 0 (0.0%) |
Income Below Poverty Among Single-Parent Households in Seneca
| Children | Single Father | Single Mother |
| No Children | 0 (0.0%) | 0 (0.0%) |
| 1 or 2 Children | 0 (0.0%) | 0 (0.0%) |
| 3 or 4 Children | 0 (0.0%) | 0 (0.0%) |
| 5 or more Children | 0 (0.0%) | 0 (0.0%) |
| Total | 0 (0.0%) | 0 (0.0%) |
Income Below Poverty Among Married-Couple vs Single-Parent Households in Seneca
| Children | Married-Couple Families | Single-Parent Households |
| No Children | 0 (0.0%) | 0 (0.0%) |
| 1 or 2 Children | 0 (0.0%) | 0 (0.0%) |
| 3 or 4 Children | 0 (0.0%) | 0 (0.0%) |
| 5 or more Children | 0 (0.0%) | 0 (0.0%) |
| Total | 0 (0.0%) | 0 (0.0%) |
Race in Seneca
The most populous races in Seneca are , and White / Caucasian (42 | 100.0%).
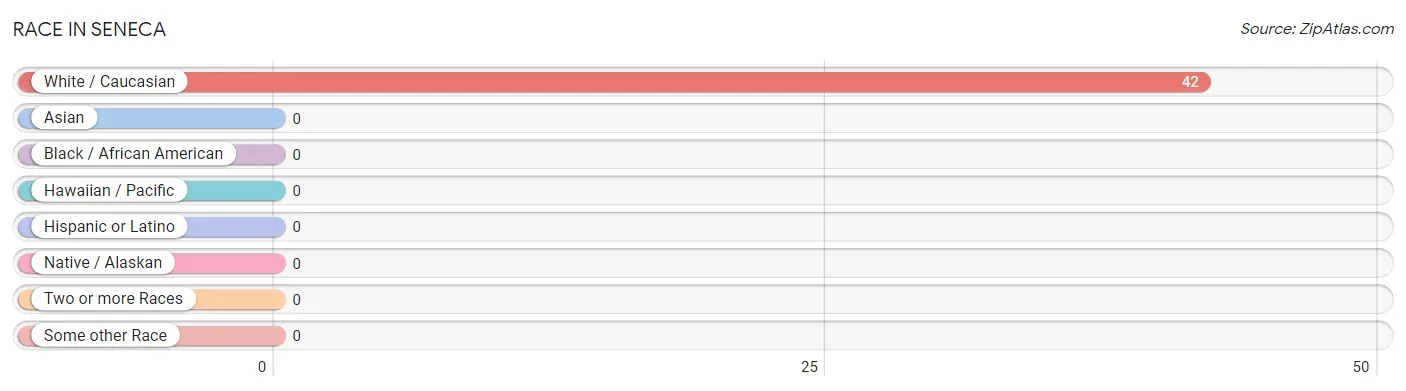
| Race | # Population | % Population |
| Asian | 0 | 0.0% |
| Black / African American | 0 | 0.0% |
| Hawaiian / Pacific | 0 | 0.0% |
| Hispanic or Latino | 0 | 0.0% |
| Native / Alaskan | 0 | 0.0% |
| White / Caucasian | 42 | 100.0% |
| Two or more Races | 0 | 0.0% |
| Some other Race | 0 | 0.0% |
| Total | 42 | 100.0% |
Ancestry in Seneca
The most populous ancestries reported in Seneca are German (16 | 38.1%), English (8 | 19.1%), Norwegian (5 | 11.9%), Swiss (4 | 9.5%), and Polish (3 | 7.1%), together accounting for 85.7% of all Seneca residents.
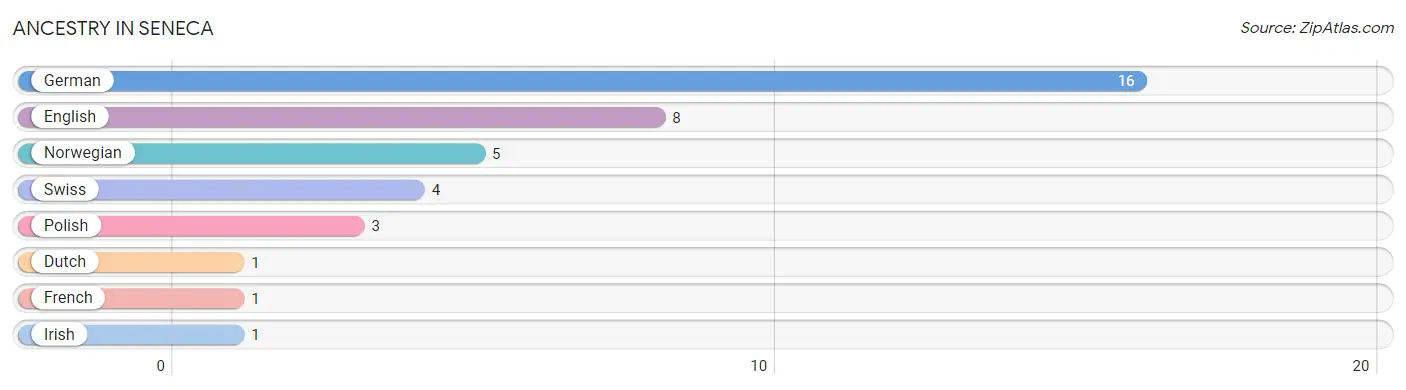
| Ancestry | # Population | % Population |
| Dutch | 1 | 2.4% |
| English | 8 | 19.1% |
| French | 1 | 2.4% |
| German | 16 | 38.1% |
| Irish | 1 | 2.4% |
| Norwegian | 5 | 11.9% |
| Polish | 3 | 7.1% |
| Swiss | 4 | 9.5% | View All 8 Rows |
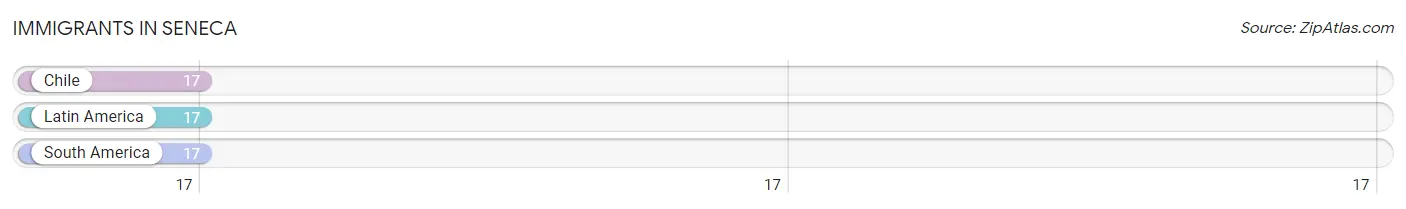
Immigrants in Seneca
The most numerous immigrant groups reported in Seneca came from Chile (17 | 40.5%), Latin America (17 | 40.5%), and South America (17 | 40.5%), together accounting for 121.4% of all Seneca residents.
| Immigration Origin | # Population | % Population |
| Chile | 17 | 40.5% |
| Latin America | 17 | 40.5% |
| South America | 17 | 40.5% | View All 3 Rows |
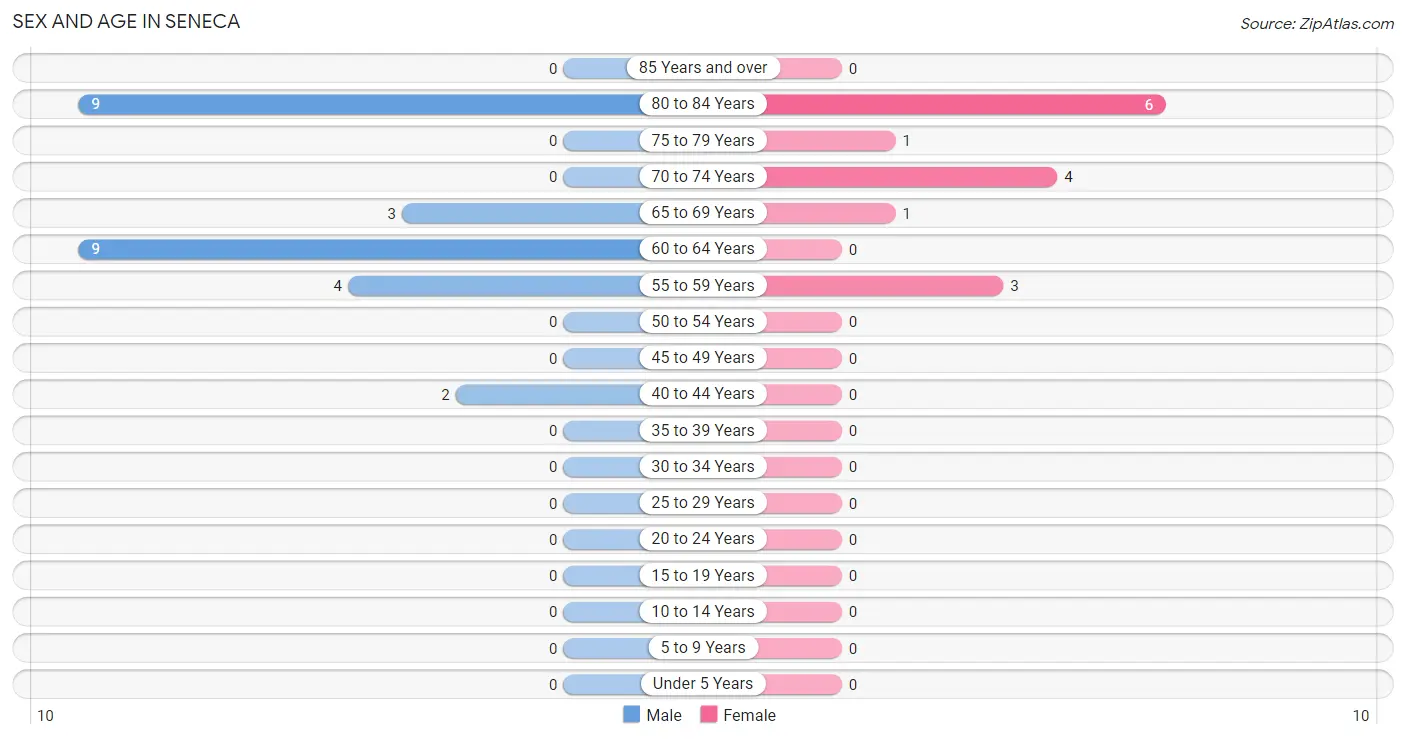
Sex and Age in Seneca
Sex and Age in Seneca
The most populous age groups in Seneca are 60 to 64 Years (9 | 33.3%) for men and 80 to 84 Years (6 | 40.0%) for women.
| Age Bracket | Male | Female |
| Under 5 Years | 0 (0.0%) | 0 (0.0%) |
| 5 to 9 Years | 0 (0.0%) | 0 (0.0%) |
| 10 to 14 Years | 0 (0.0%) | 0 (0.0%) |
| 15 to 19 Years | 0 (0.0%) | 0 (0.0%) |
| 20 to 24 Years | 0 (0.0%) | 0 (0.0%) |
| 25 to 29 Years | 0 (0.0%) | 0 (0.0%) |
| 30 to 34 Years | 0 (0.0%) | 0 (0.0%) |
| 35 to 39 Years | 0 (0.0%) | 0 (0.0%) |
| 40 to 44 Years | 2 (7.4%) | 0 (0.0%) |
| 45 to 49 Years | 0 (0.0%) | 0 (0.0%) |
| 50 to 54 Years | 0 (0.0%) | 0 (0.0%) |
| 55 to 59 Years | 4 (14.8%) | 3 (20.0%) |
| 60 to 64 Years | 9 (33.3%) | 0 (0.0%) |
| 65 to 69 Years | 3 (11.1%) | 1 (6.7%) |
| 70 to 74 Years | 0 (0.0%) | 4 (26.7%) |
| 75 to 79 Years | 0 (0.0%) | 1 (6.7%) |
| 80 to 84 Years | 9 (33.3%) | 6 (40.0%) |
| 85 Years and over | 0 (0.0%) | 0 (0.0%) |
| Total | 27 (100.0%) | 15 (100.0%) |
Families and Households in Seneca
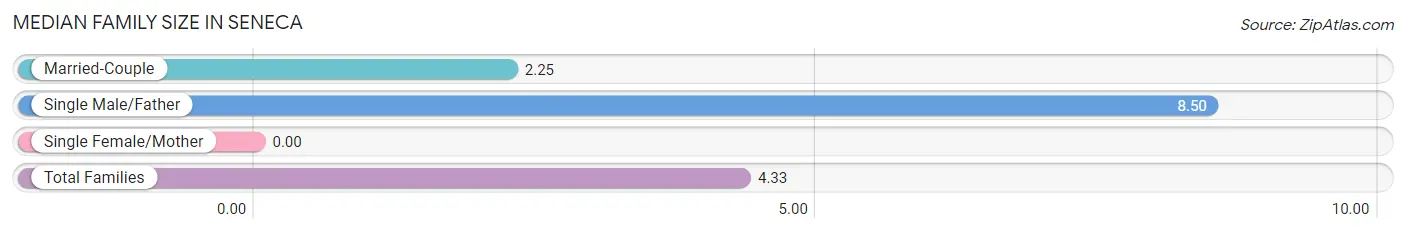
Median Family Size in Seneca
| Family Type | # Families | Family Size |
| Married-Couple | 4 (66.7%) | 2.25 |
| Single Male/Father | 2 (33.3%) | 8.50 |
| Single Female/Mother | 0 (0.0%) | - |
| Total Families | 6 (100.0%) | 4.33 |
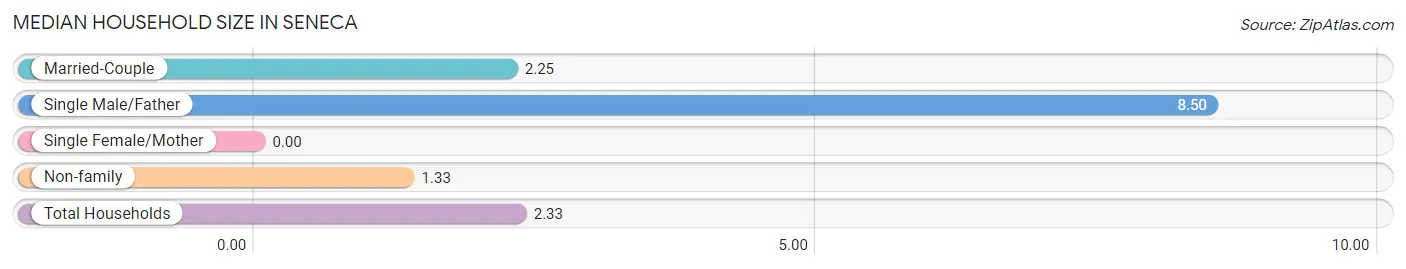
Median Household Size in Seneca
| Household Type | # Households | Household Size |
| Married-Couple | 4 (22.2%) | 2.25 |
| Single Male/Father | 2 (11.1%) | 8.50 |
| Single Female/Mother | 0 (0.0%) | - |
| Non-family | 12 (66.7%) | 1.33 |
| Total Households | 18 (100.0%) | 2.33 |
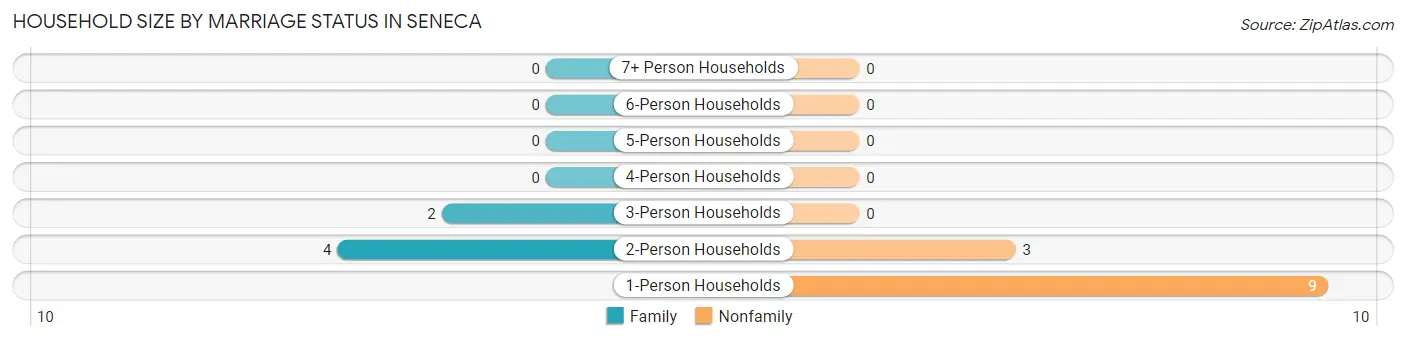
Household Size by Marriage Status in Seneca
Out of a total of 18 households in Seneca, 6 (33.3%) are family households, while 12 (66.7%) are nonfamily households. The most numerous type of family households are 2-person households, comprising 4, and the most common type of nonfamily households are 1-person households, comprising 9.
| Household Size | Family Households | Nonfamily Households |
| 1-Person Households | - | 9 (50.0%) |
| 2-Person Households | 4 (22.2%) | 3 (16.7%) |
| 3-Person Households | 2 (11.1%) | 0 (0.0%) |
| 4-Person Households | 0 (0.0%) | 0 (0.0%) |
| 5-Person Households | 0 (0.0%) | 0 (0.0%) |
| 6-Person Households | 0 (0.0%) | 0 (0.0%) |
| 7+ Person Households | 0 (0.0%) | 0 (0.0%) |
| Total | 6 (33.3%) | 12 (66.7%) |
Female Fertility in Seneca
Fertility by Age in Seneca
| Age Bracket | Women with Births | Births / 1,000 Women |
| 15 to 19 years | 0 (0.0%) | 0.0 |
| 20 to 34 years | 0 (0.0%) | 0.0 |
| 35 to 50 years | 0 (0.0%) | 0.0 |
| Total | 0 (0.0%) | 0.0 |
Fertility by Age by Marriage Status in Seneca
| Age Bracket | Married | Unmarried |
| 15 to 19 years | 0 (0.0%) | 0 (0.0%) |
| 20 to 34 years | 0 (0.0%) | 0 (0.0%) |
| 35 to 50 years | 0 (0.0%) | 0 (0.0%) |
| Total | 0 (0.0%) | 0 (0.0%) |
Fertility by Education in Seneca
| Educational Attainment | Women with Births | Births / 1,000 Women |
| Less than High School | 0 (0.0%) | 0.0 |
| High School Diploma | 0 (0.0%) | 0.0 |
| College or Associate's Degree | 0 (0.0%) | 0.0 |
| Bachelor's Degree | 0 (0.0%) | 0.0 |
| Graduate Degree | 0 (0.0%) | 0.0 |
| Total | 0 (0.0%) | 0.0 |
Fertility by Education by Marriage Status in Seneca
| Educational Attainment | Married | Unmarried |
| Less than High School | 0 (0.0%) | 0 (0.0%) |
| High School Diploma | 0 (0.0%) | 0 (0.0%) |
| College or Associate's Degree | 0 (0.0%) | 0 (0.0%) |
| Bachelor's Degree | 0 (0.0%) | 0 (0.0%) |
| Graduate Degree | 0 (0.0%) | 0 (0.0%) |
| Total | 0 (0.0%) | 0 (0.0%) |
Employment Characteristics in Seneca
Employment by Class of Employer in Seneca
Among the 14 employed individuals in Seneca, private company employees (12 | 85.7%), self-employed (incorporated) (1 | 7.1%), and federal government employees (1 | 7.1%) make up the most common classes of employment.
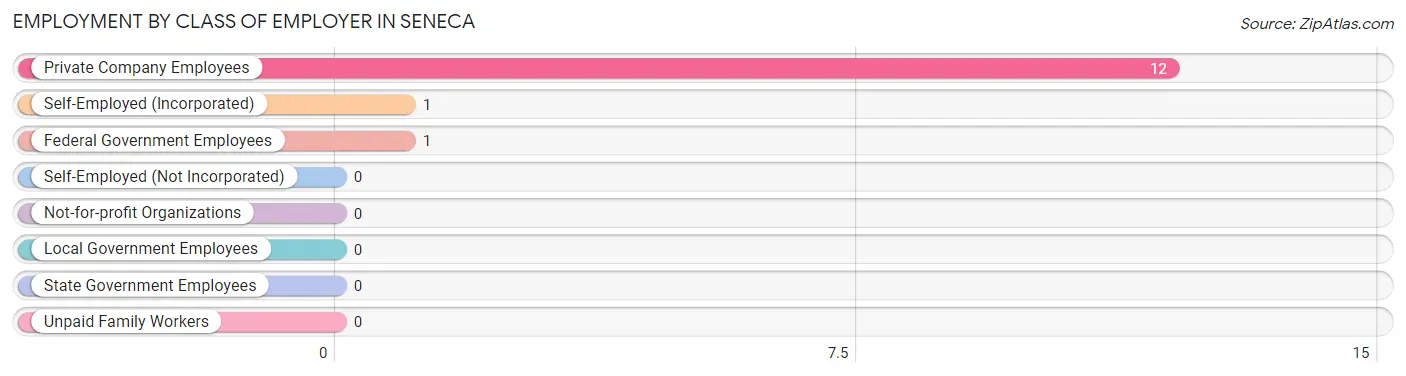
| Employer Class | # Employees | % Employees |
| Private Company Employees | 12 | 85.7% |
| Self-Employed (Incorporated) | 1 | 7.1% |
| Self-Employed (Not Incorporated) | 0 | 0.0% |
| Not-for-profit Organizations | 0 | 0.0% |
| Local Government Employees | 0 | 0.0% |
| State Government Employees | 0 | 0.0% |
| Federal Government Employees | 1 | 7.1% |
| Unpaid Family Workers | 0 | 0.0% |
| Total | 14 | 100.0% |
Employment Status by Age in Seneca
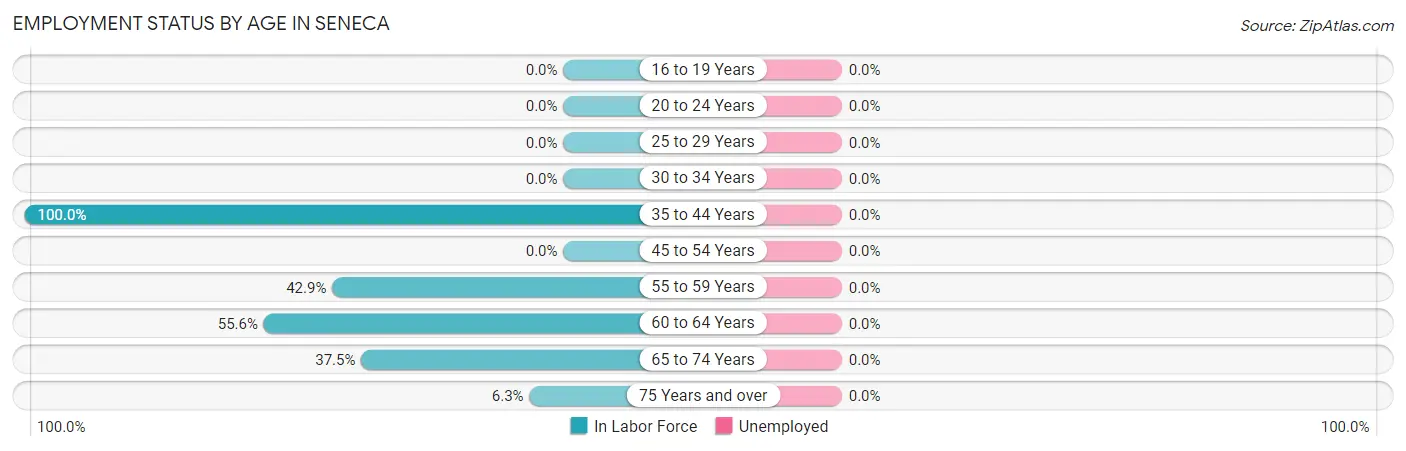
| Age Bracket | In Labor Force | Unemployed |
| 16 to 19 Years | 0 (0.0%) | 0 (0.0%) |
| 20 to 24 Years | 0 (0.0%) | 0 (0.0%) |
| 25 to 29 Years | 0 (0.0%) | 0 (0.0%) |
| 30 to 34 Years | 0 (0.0%) | 0 (0.0%) |
| 35 to 44 Years | 2 (100.0%) | 0 (0.0%) |
| 45 to 54 Years | 0 (0.0%) | 0 (0.0%) |
| 55 to 59 Years | 3 (42.9%) | 0 (0.0%) |
| 60 to 64 Years | 5 (55.6%) | 0 (0.0%) |
| 65 to 74 Years | 3 (37.5%) | 0 (0.0%) |
| 75 Years and over | 1 (6.3%) | 0 (0.0%) |
| Total | 14 (33.3%) | 0 (0.0%) |
Employment Status by Educational Attainment in Seneca
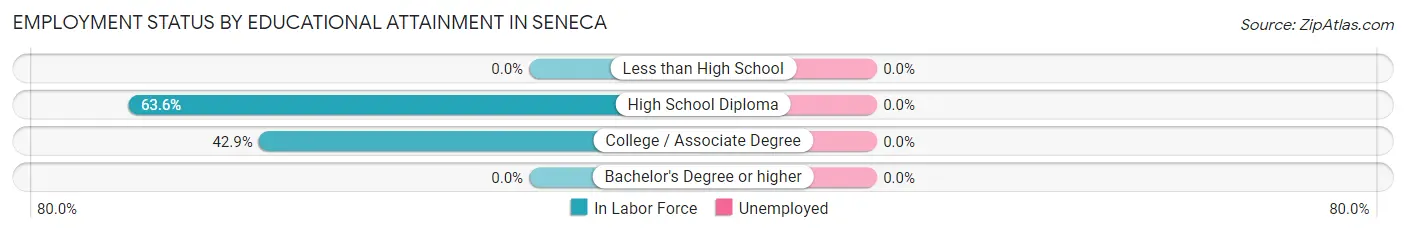
| Educational Attainment | In Labor Force | Unemployed |
| Less than High School | 0 (0.0%) | 0 (0.0%) |
| High School Diploma | 7 (63.6%) | 0 (0.0%) |
| College / Associate Degree | 3 (42.9%) | 0 (0.0%) |
| Bachelor's Degree or higher | 0 (0.0%) | 0 (0.0%) |
| Total | 10 (55.6%) | 0 (0.0%) |
Employment Occupations by Sex in Seneca
Management, Business, Science and Arts Occupations

Management, Business, Science and Arts Occupations by Sex
| Occupation | Male | Female |
| Management | 0 (0.0%) | 0 (0.0%) |
| Business & Financial | 0 (0.0%) | 0 (0.0%) |
| Computers, Engineering & Science | 0 (0.0%) | 0 (0.0%) |
| Computers & Mathematics | 0 (0.0%) | 0 (0.0%) |
| Architecture & Engineering | 0 (0.0%) | 0 (0.0%) |
| Life, Physical & Social Science | 0 (0.0%) | 0 (0.0%) |
| Community & Social Service | 0 (0.0%) | 0 (0.0%) |
| Education, Arts & Media | 0 (0.0%) | 0 (0.0%) |
| Legal Services & Support | 0 (0.0%) | 0 (0.0%) |
| Education Instruction & Library | 0 (0.0%) | 0 (0.0%) |
| Arts, Media & Entertainment | 0 (0.0%) | 0 (0.0%) |
| Health Diagnosing & Treating | 0 (0.0%) | 0 (0.0%) |
| Health Technologists | 0 (0.0%) | 0 (0.0%) |
| Total (Category) | 0 (0.0%) | 0 (0.0%) |
| Total (Overall) | 10 (71.4%) | 4 (28.6%) |
Services Occupations
Services Occupations by Sex
| Occupation | Male | Female |
| Healthcare Support | 0 (0.0%) | 0 (0.0%) |
| Security & Protection | 0 (0.0%) | 0 (0.0%) |
| Firefighting & Prevention | 0 (0.0%) | 0 (0.0%) |
| Law Enforcement | 0 (0.0%) | 0 (0.0%) |
| Food Preparation & Serving | 0 (0.0%) | 0 (0.0%) |
| Cleaning & Maintenance | 0 (0.0%) | 0 (0.0%) |
| Personal Care & Service | 0 (0.0%) | 0 (0.0%) |
| Total (Category) | 0 (0.0%) | 0 (0.0%) |
| Total (Overall) | 10 (71.4%) | 4 (28.6%) |
Sales and Office Occupations
The most common Sales and Office occupations in Seneca are , and Office & Administration (6 | 42.9%).
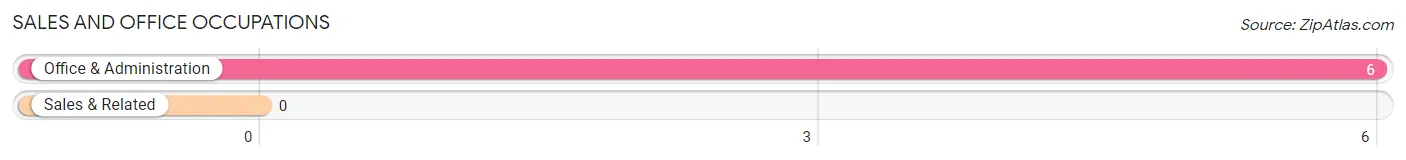
Sales and Office Occupations by Sex
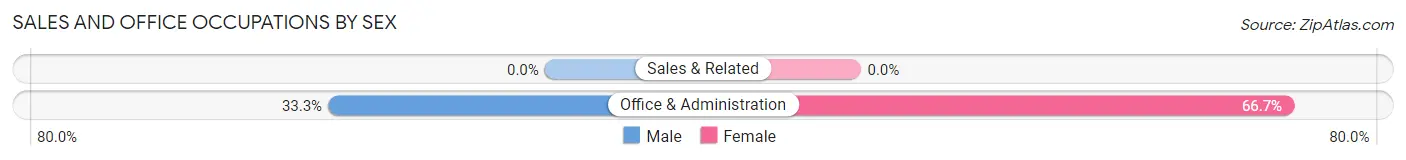
| Occupation | Male | Female |
| Sales & Related | 0 (0.0%) | 0 (0.0%) |
| Office & Administration | 2 (33.3%) | 4 (66.7%) |
| Total (Category) | 2 (33.3%) | 4 (66.7%) |
| Total (Overall) | 10 (71.4%) | 4 (28.6%) |
Natural Resources, Construction and Maintenance Occupations
The most common Natural Resources, Construction and Maintenance occupations in Seneca are , and Installation, Maintenance & Repair (1 | 7.1%).
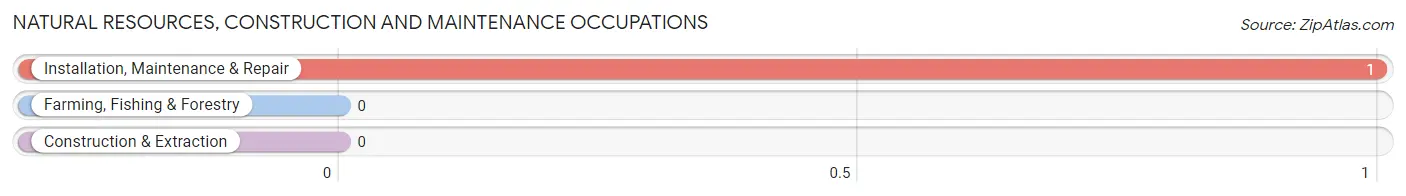
Natural Resources, Construction and Maintenance Occupations by Sex
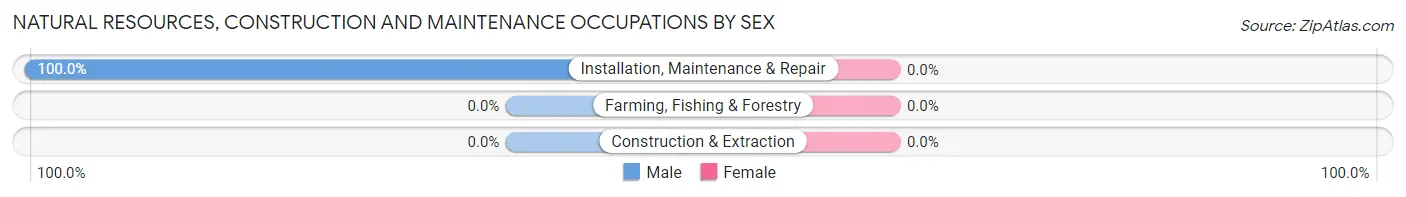
| Occupation | Male | Female |
| Farming, Fishing & Forestry | 0 (0.0%) | 0 (0.0%) |
| Construction & Extraction | 0 (0.0%) | 0 (0.0%) |
| Installation, Maintenance & Repair | 1 (100.0%) | 0 (0.0%) |
| Total (Category) | 1 (100.0%) | 0 (0.0%) |
| Total (Overall) | 10 (71.4%) | 4 (28.6%) |
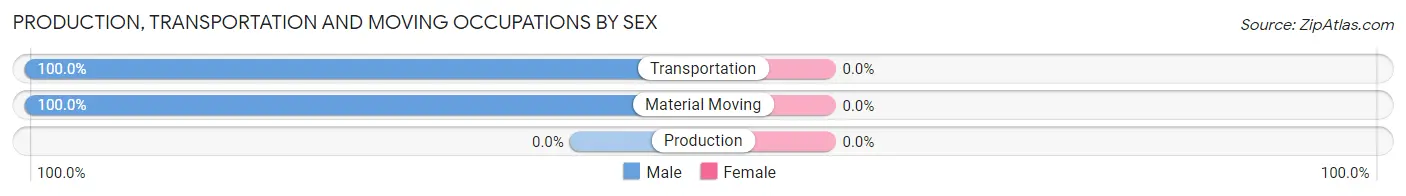
Production, Transportation and Moving Occupations
The most common Production, Transportation and Moving occupations in Seneca are Material Moving (4 | 28.6%), and Transportation (3 | 21.4%).
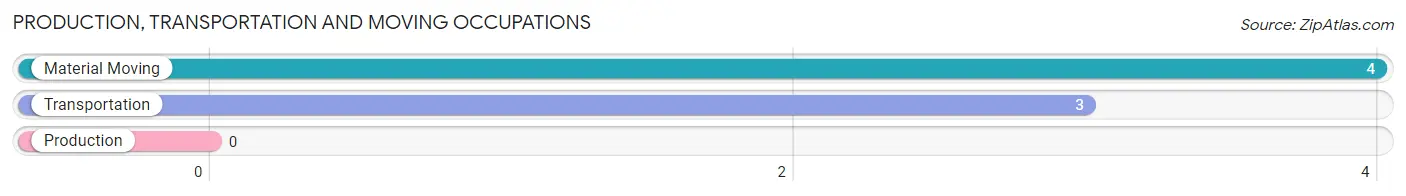
Production, Transportation and Moving Occupations by Sex
| Occupation | Male | Female |
| Production | 0 (0.0%) | 0 (0.0%) |
| Transportation | 3 (100.0%) | 0 (0.0%) |
| Material Moving | 4 (100.0%) | 0 (0.0%) |
| Total (Category) | 7 (100.0%) | 0 (0.0%) |
| Total (Overall) | 10 (71.4%) | 4 (28.6%) |
Employment Industries by Sex in Seneca
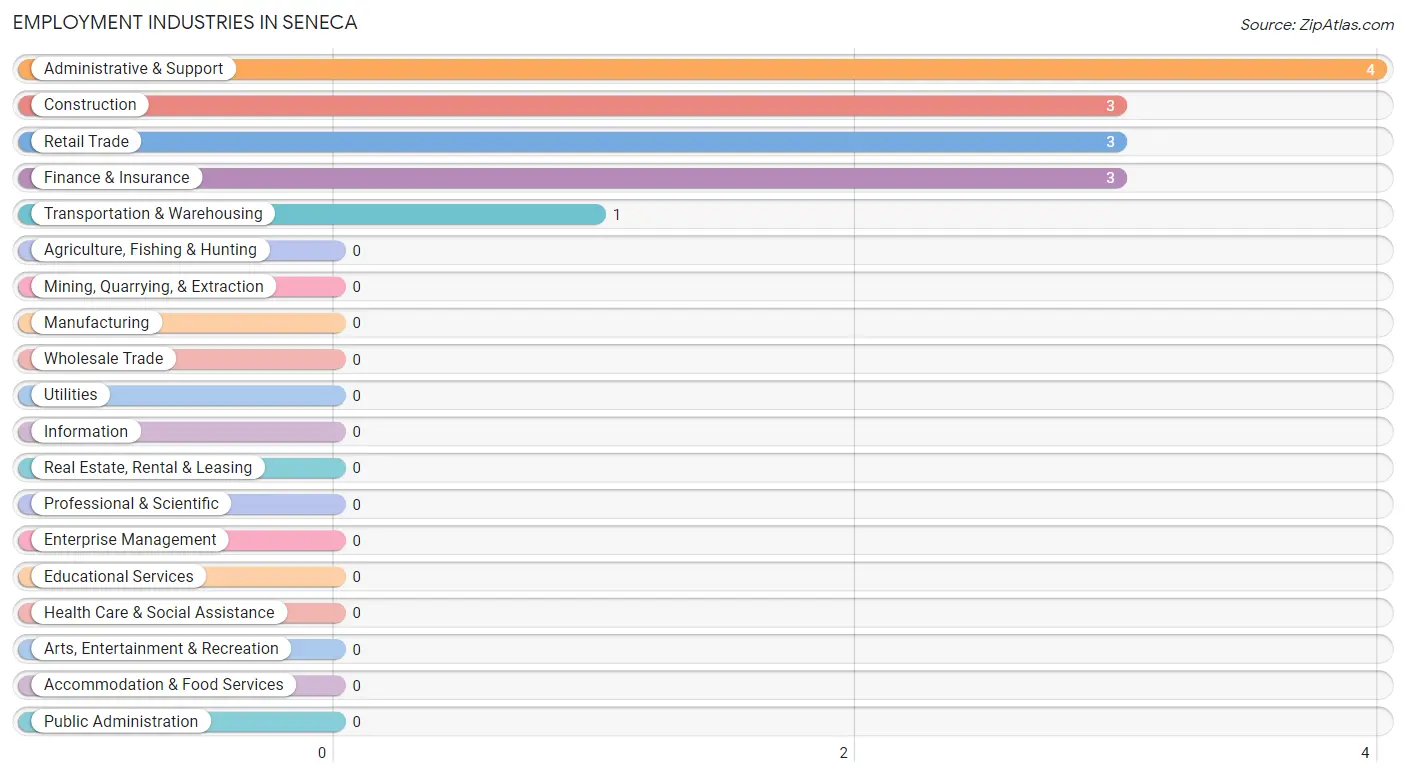
Employment Industries in Seneca
The major employment industries in Seneca include Administrative & Support (4 | 28.6%), Construction (3 | 21.4%), Retail Trade (3 | 21.4%), Finance & Insurance (3 | 21.4%), and Transportation & Warehousing (1 | 7.1%).
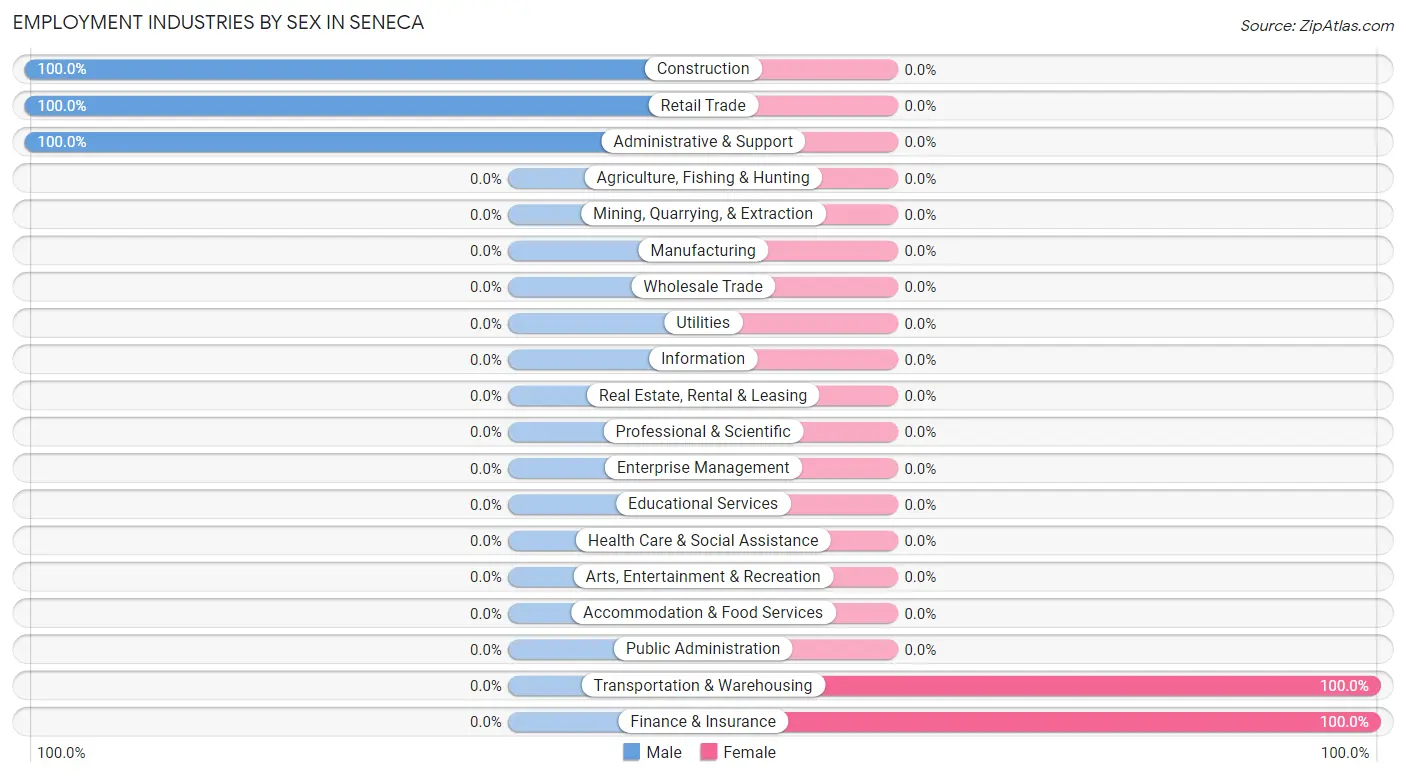
Employment Industries by Sex in Seneca
The Seneca industries that see more men than women are Construction (100.0%), Retail Trade (100.0%), and Administrative & Support (100.0%), whereas the industries that tend to have a higher number of women are Transportation & Warehousing (100.0%), and Finance & Insurance (100.0%).
| Industry | Male | Female |
| Agriculture, Fishing & Hunting | 0 (0.0%) | 0 (0.0%) |
| Mining, Quarrying, & Extraction | 0 (0.0%) | 0 (0.0%) |
| Construction | 3 (100.0%) | 0 (0.0%) |
| Manufacturing | 0 (0.0%) | 0 (0.0%) |
| Wholesale Trade | 0 (0.0%) | 0 (0.0%) |
| Retail Trade | 3 (100.0%) | 0 (0.0%) |
| Transportation & Warehousing | 0 (0.0%) | 1 (100.0%) |
| Utilities | 0 (0.0%) | 0 (0.0%) |
| Information | 0 (0.0%) | 0 (0.0%) |
| Finance & Insurance | 0 (0.0%) | 3 (100.0%) |
| Real Estate, Rental & Leasing | 0 (0.0%) | 0 (0.0%) |
| Professional & Scientific | 0 (0.0%) | 0 (0.0%) |
| Enterprise Management | 0 (0.0%) | 0 (0.0%) |
| Administrative & Support | 4 (100.0%) | 0 (0.0%) |
| Educational Services | 0 (0.0%) | 0 (0.0%) |
| Health Care & Social Assistance | 0 (0.0%) | 0 (0.0%) |
| Arts, Entertainment & Recreation | 0 (0.0%) | 0 (0.0%) |
| Accommodation & Food Services | 0 (0.0%) | 0 (0.0%) |
| Public Administration | 0 (0.0%) | 0 (0.0%) |
| Total | 10 (71.4%) | 4 (28.6%) |
Education in Seneca
School Enrollment in Seneca
| School Level | # Students | % Students |
| Nursery / Preschool | 0 | 0.0% |
| Kindergarten | 0 | 0.0% |
| Elementary School | 0 | 0.0% |
| Middle School | 0 | 0.0% |
| High School | 0 | 0.0% |
| College / Undergraduate | 0 | 0.0% |
| Graduate / Professional | 0 | 0.0% |
| Total | 0 | 0.0% |
School Enrollment by Age by Funding Source in Seneca
| Age Bracket | Public School | Private School |
| 3 to 4 Year Olds | 0 (0.0%) | 0 (0.0%) |
| 5 to 9 Year Old | 0 (0.0%) | 0 (0.0%) |
| 10 to 14 Year Olds | 0 (0.0%) | 0 (0.0%) |
| 15 to 17 Year Olds | 0 (0.0%) | 0 (0.0%) |
| 18 to 19 Year Olds | 0 (0.0%) | 0 (0.0%) |
| 20 to 24 Year Olds | 0 (0.0%) | 0 (0.0%) |
| 25 to 34 Year Olds | 0 (0.0%) | 0 (0.0%) |
| 35 Years and over | 0 (0.0%) | 0 (0.0%) |
| Total | 0 (0.0%) | 0 (0.0%) |
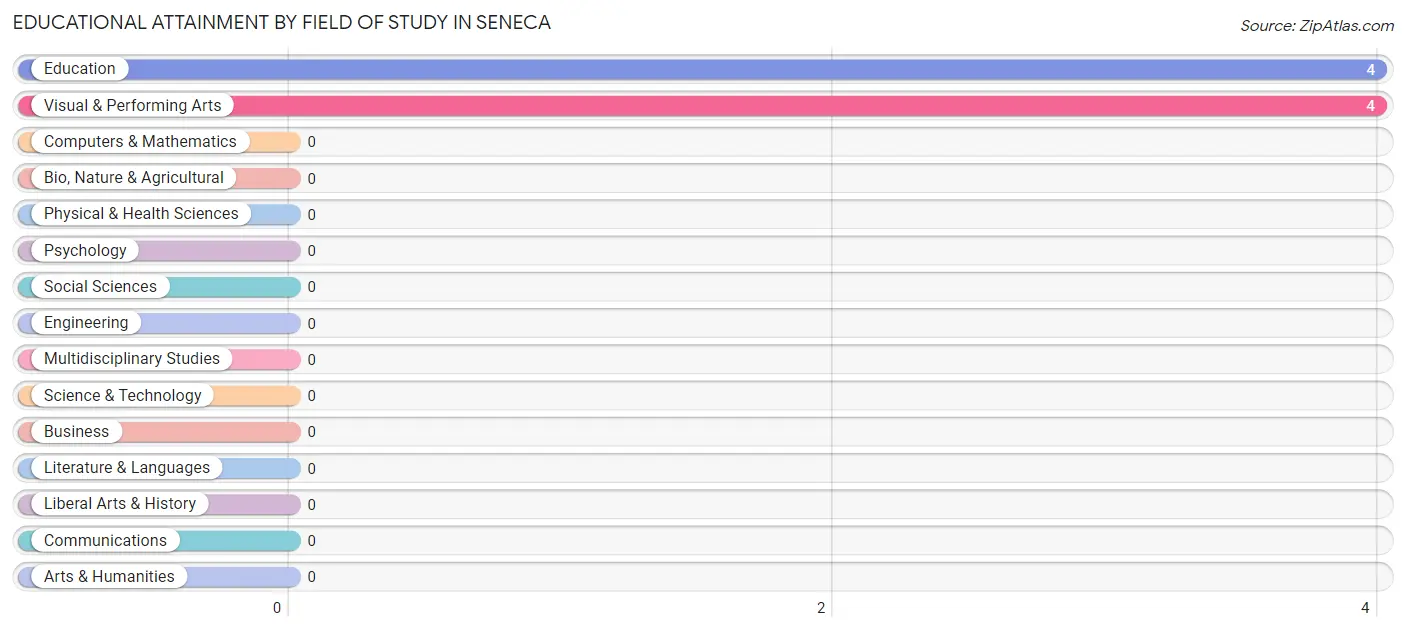
Educational Attainment by Field of Study in Seneca
Education (4 | 50.0%), and visual & performing arts (4 | 50.0%) are the most common fields of study among 8 individuals in Seneca who have obtained a bachelor's degree or higher.
| Field of Study | # Graduates | % Graduates |
| Computers & Mathematics | 0 | 0.0% |
| Bio, Nature & Agricultural | 0 | 0.0% |
| Physical & Health Sciences | 0 | 0.0% |
| Psychology | 0 | 0.0% |
| Social Sciences | 0 | 0.0% |
| Engineering | 0 | 0.0% |
| Multidisciplinary Studies | 0 | 0.0% |
| Science & Technology | 0 | 0.0% |
| Business | 0 | 0.0% |
| Education | 4 | 50.0% |
| Literature & Languages | 0 | 0.0% |
| Liberal Arts & History | 0 | 0.0% |
| Visual & Performing Arts | 4 | 50.0% |
| Communications | 0 | 0.0% |
| Arts & Humanities | 0 | 0.0% |
| Total | 8 | 100.0% |
Transportation & Commute in Seneca
Vehicle Availability by Sex in Seneca
The most prevalent vehicle ownership categories in Seneca are males with 3 vehicles (7, accounting for 70.0%) and females with 3 vehicles (3, making up 175.0%).
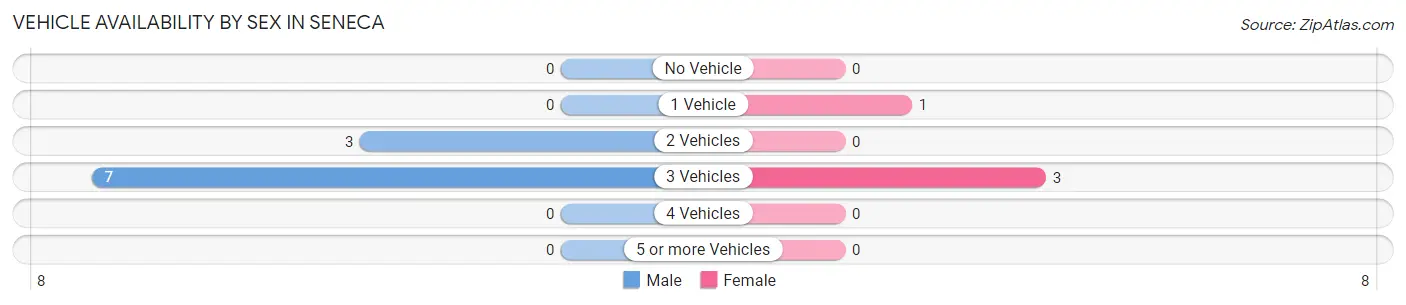
| Vehicles Available | Male | Female |
| No Vehicle | 0 (0.0%) | 0 (0.0%) |
| 1 Vehicle | 0 (0.0%) | 1 (25.0%) |
| 2 Vehicles | 3 (30.0%) | 0 (0.0%) |
| 3 Vehicles | 7 (70.0%) | 3 (75.0%) |
| 4 Vehicles | 0 (0.0%) | 0 (0.0%) |
| 5 or more Vehicles | 0 (0.0%) | 0 (0.0%) |
| Total | 10 (100.0%) | 4 (100.0%) |
Commute Time in Seneca
The most frequently occuring commute durations in Seneca are 20 to 24 minutes (7 commuters, 50.0%), 15 to 19 minutes (3 commuters, 21.4%), and 5 to 9 minutes (2 commuters, 14.3%).
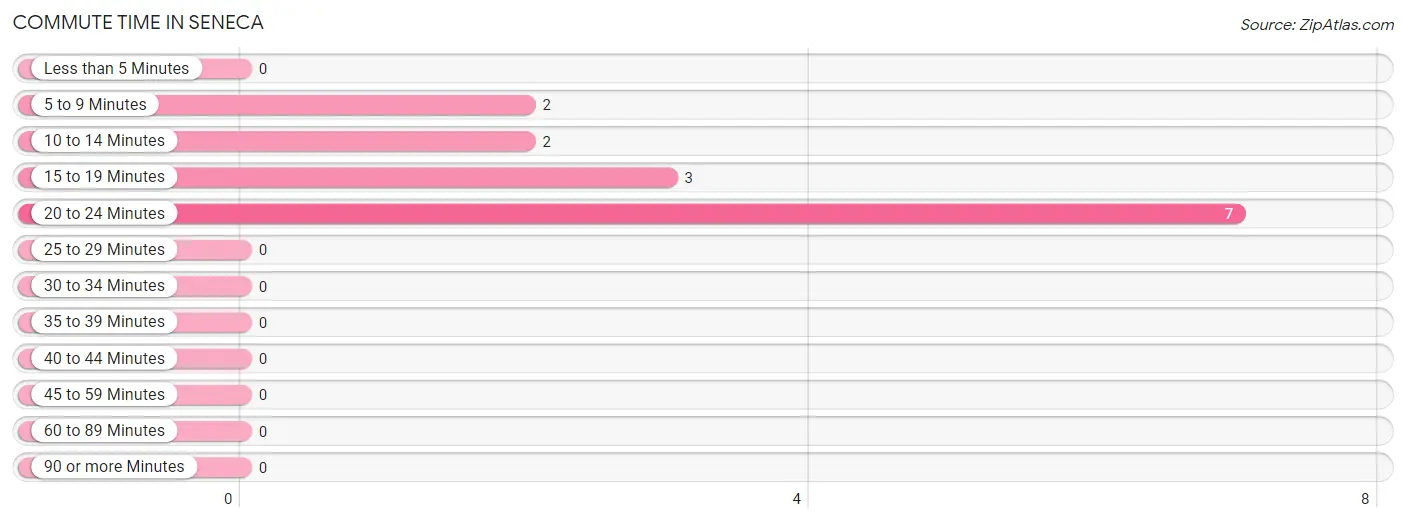
| Commute Time | # Commuters | % Commuters |
| Less than 5 Minutes | 0 | 0.0% |
| 5 to 9 Minutes | 2 | 14.3% |
| 10 to 14 Minutes | 2 | 14.3% |
| 15 to 19 Minutes | 3 | 21.4% |
| 20 to 24 Minutes | 7 | 50.0% |
| 25 to 29 Minutes | 0 | 0.0% |
| 30 to 34 Minutes | 0 | 0.0% |
| 35 to 39 Minutes | 0 | 0.0% |
| 40 to 44 Minutes | 0 | 0.0% |
| 45 to 59 Minutes | 0 | 0.0% |
| 60 to 89 Minutes | 0 | 0.0% |
| 90 or more Minutes | 0 | 0.0% |
Commute Time by Sex in Seneca
The most common commute times in Seneca are 20 to 24 minutes (4 commuters, 40.0%) for males and 20 to 24 minutes (3 commuters, 75.0%) for females.
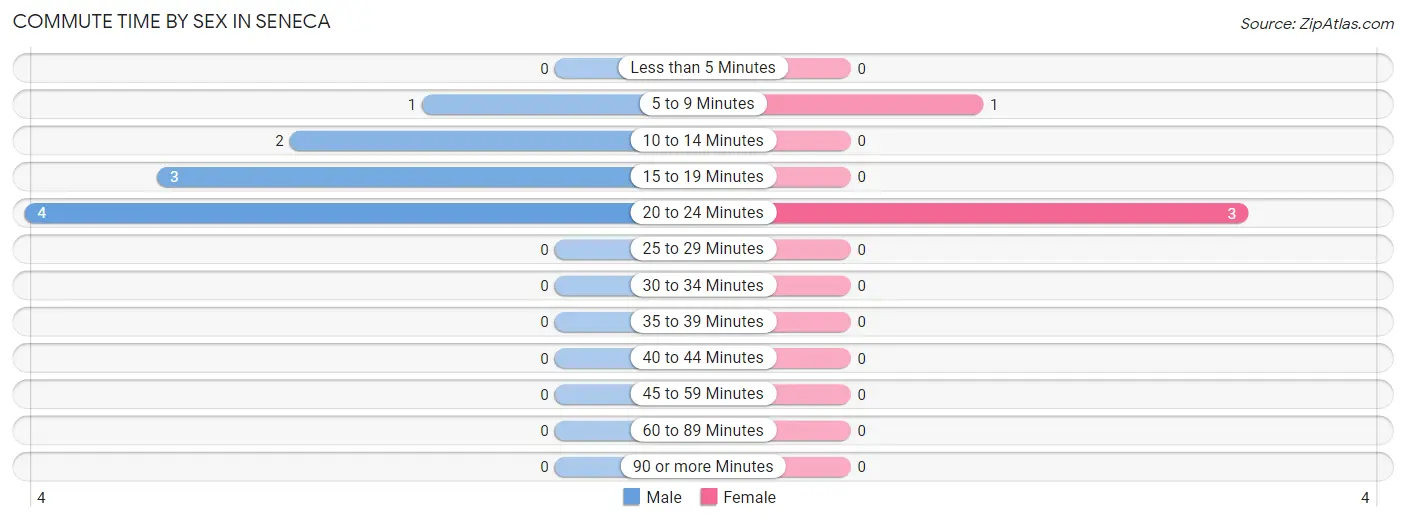
| Commute Time | Male | Female |
| Less than 5 Minutes | 0 (0.0%) | 0 (0.0%) |
| 5 to 9 Minutes | 1 (10.0%) | 1 (25.0%) |
| 10 to 14 Minutes | 2 (20.0%) | 0 (0.0%) |
| 15 to 19 Minutes | 3 (30.0%) | 0 (0.0%) |
| 20 to 24 Minutes | 4 (40.0%) | 3 (75.0%) |
| 25 to 29 Minutes | 0 (0.0%) | 0 (0.0%) |
| 30 to 34 Minutes | 0 (0.0%) | 0 (0.0%) |
| 35 to 39 Minutes | 0 (0.0%) | 0 (0.0%) |
| 40 to 44 Minutes | 0 (0.0%) | 0 (0.0%) |
| 45 to 59 Minutes | 0 (0.0%) | 0 (0.0%) |
| 60 to 89 Minutes | 0 (0.0%) | 0 (0.0%) |
| 90 or more Minutes | 0 (0.0%) | 0 (0.0%) |
Time of Departure to Work by Sex in Seneca
The most frequent times of departure to work in Seneca are 12:00 AM to 4:59 AM (4, 40.0%) for males and 8:00 AM to 8:29 AM (3, 75.0%) for females.
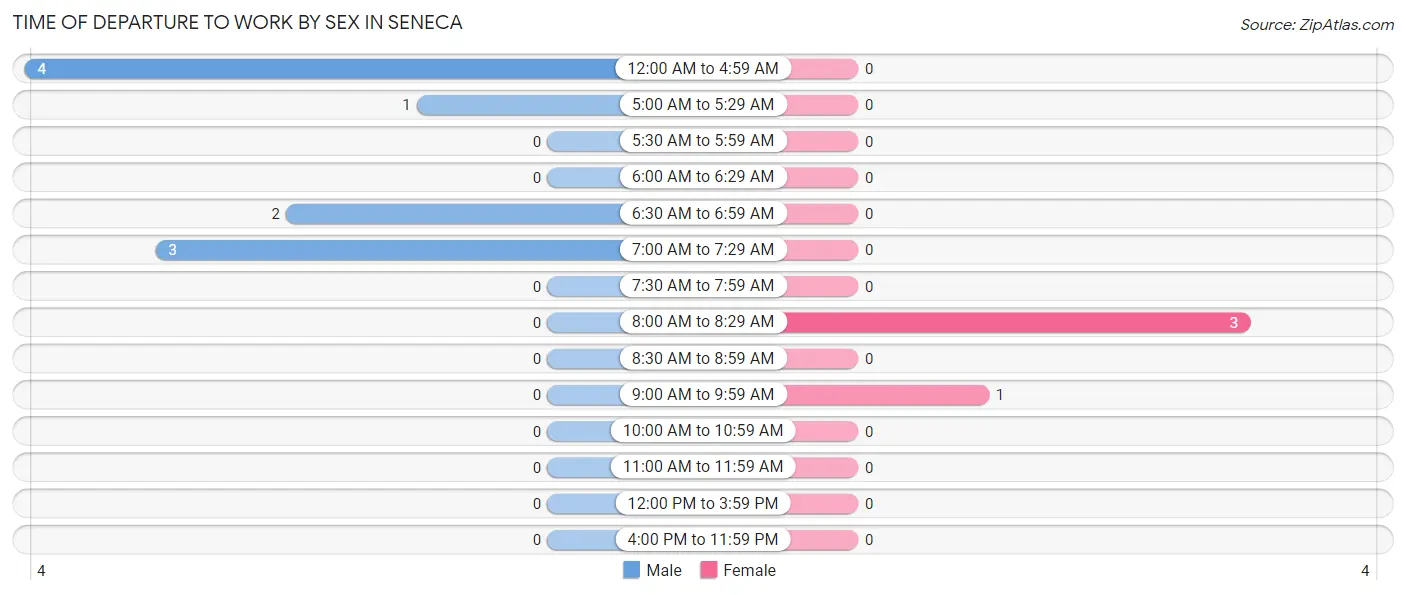
| Time of Departure | Male | Female |
| 12:00 AM to 4:59 AM | 4 (40.0%) | 0 (0.0%) |
| 5:00 AM to 5:29 AM | 1 (10.0%) | 0 (0.0%) |
| 5:30 AM to 5:59 AM | 0 (0.0%) | 0 (0.0%) |
| 6:00 AM to 6:29 AM | 0 (0.0%) | 0 (0.0%) |
| 6:30 AM to 6:59 AM | 2 (20.0%) | 0 (0.0%) |
| 7:00 AM to 7:29 AM | 3 (30.0%) | 0 (0.0%) |
| 7:30 AM to 7:59 AM | 0 (0.0%) | 0 (0.0%) |
| 8:00 AM to 8:29 AM | 0 (0.0%) | 3 (75.0%) |
| 8:30 AM to 8:59 AM | 0 (0.0%) | 0 (0.0%) |
| 9:00 AM to 9:59 AM | 0 (0.0%) | 1 (25.0%) |
| 10:00 AM to 10:59 AM | 0 (0.0%) | 0 (0.0%) |
| 11:00 AM to 11:59 AM | 0 (0.0%) | 0 (0.0%) |
| 12:00 PM to 3:59 PM | 0 (0.0%) | 0 (0.0%) |
| 4:00 PM to 11:59 PM | 0 (0.0%) | 0 (0.0%) |
| Total | 10 (100.0%) | 4 (100.0%) |
Housing Occupancy in Seneca
Occupancy by Ownership in Seneca
Of the total 18 dwellings in Seneca, owner-occupied units account for 18 (100.0%), while renter-occupied units make up 0 (0.0%).
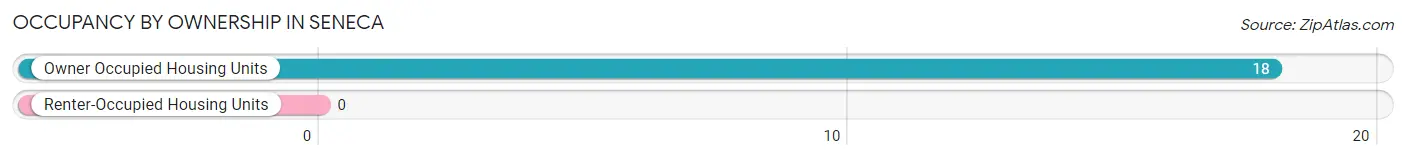
| Occupancy | # Housing Units | % Housing Units |
| Owner Occupied Housing Units | 18 | 100.0% |
| Renter-Occupied Housing Units | 0 | 0.0% |
| Total Occupied Housing Units | 18 | 100.0% |
Occupancy by Household Size in Seneca
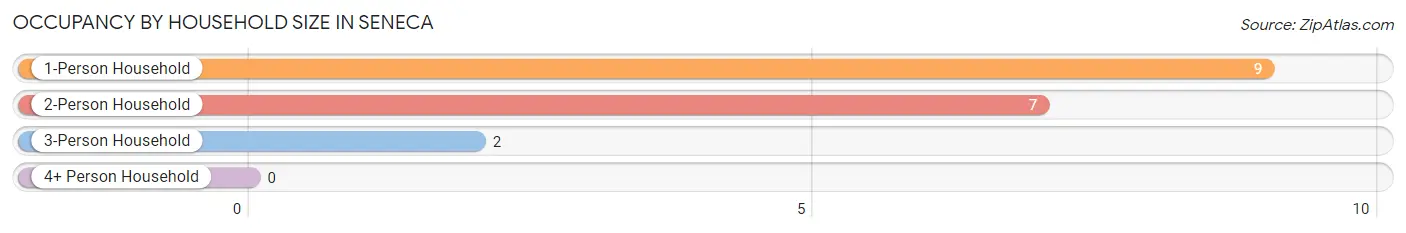
| Household Size | # Housing Units | % Housing Units |
| 1-Person Household | 9 | 50.0% |
| 2-Person Household | 7 | 38.9% |
| 3-Person Household | 2 | 11.1% |
| 4+ Person Household | 0 | 0.0% |
| Total Housing Units | 18 | 100.0% |
Occupancy by Ownership by Household Size in Seneca
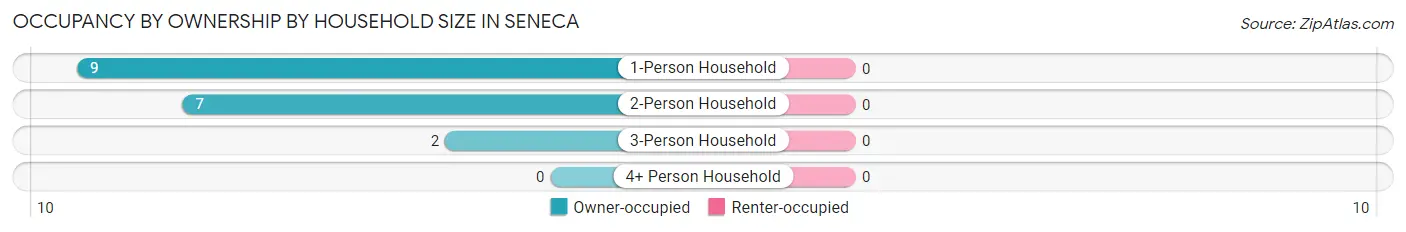
| Household Size | Owner-occupied | Renter-occupied |
| 1-Person Household | 9 (100.0%) | 0 (0.0%) |
| 2-Person Household | 7 (100.0%) | 0 (0.0%) |
| 3-Person Household | 2 (100.0%) | 0 (0.0%) |
| 4+ Person Household | 0 (0.0%) | 0 (0.0%) |
| Total Housing Units | 18 (100.0%) | 0 (0.0%) |
Occupancy by Educational Attainment in Seneca
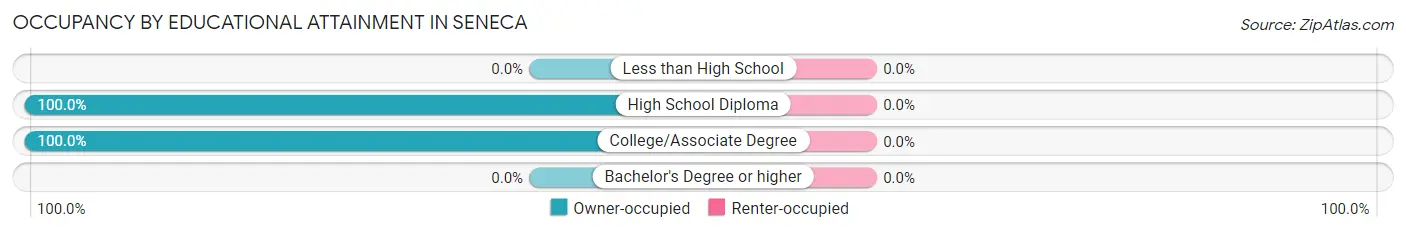
| Household Size | Owner-occupied | Renter-occupied |
| Less than High School | 0 (0.0%) | 0 (0.0%) |
| High School Diploma | 8 (100.0%) | 0 (0.0%) |
| College/Associate Degree | 10 (100.0%) | 0 (0.0%) |
| Bachelor's Degree or higher | 0 (0.0%) | 0 (0.0%) |
Occupancy by Age of Householder in Seneca
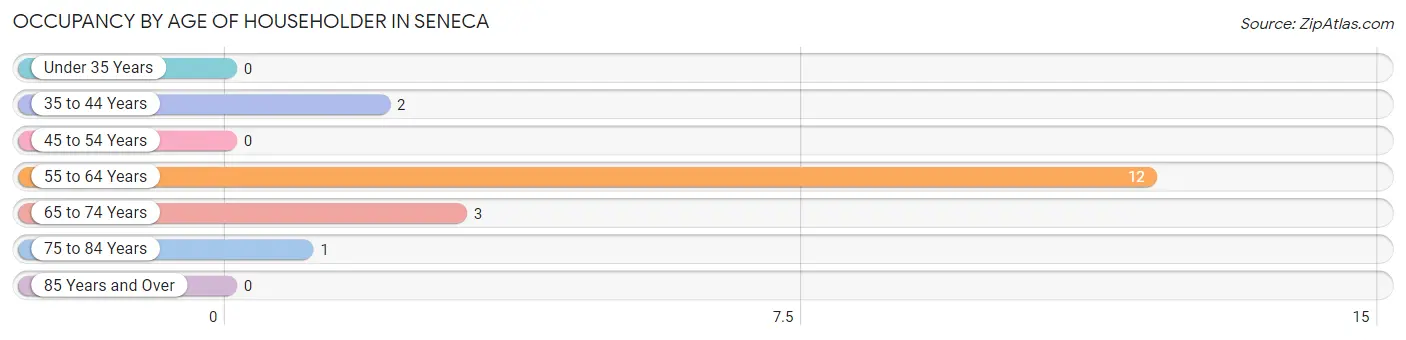
| Age Bracket | # Households | % Households |
| Under 35 Years | 0 | 0.0% |
| 35 to 44 Years | 2 | 11.1% |
| 45 to 54 Years | 0 | 0.0% |
| 55 to 64 Years | 12 | 66.7% |
| 65 to 74 Years | 3 | 16.7% |
| 75 to 84 Years | 1 | 5.6% |
| 85 Years and Over | 0 | 0.0% |
| Total | 18 | 100.0% |
Housing Finances in Seneca
Median Income by Occupancy in Seneca
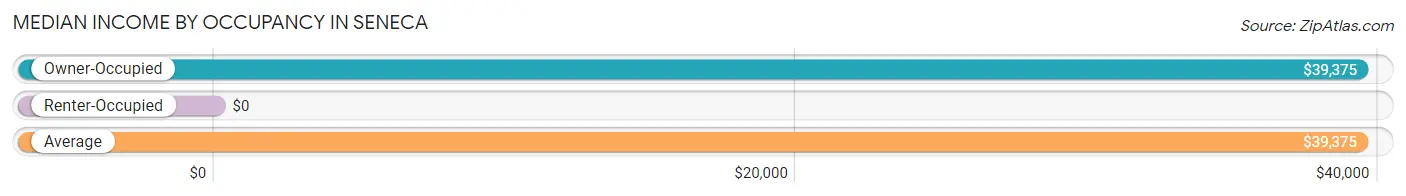
| Occupancy Type | # Households | Median Income |
| Owner-Occupied | 18 (100.0%) | $39,375 |
| Renter-Occupied | 0 (0.0%) | $0 |
| Average | 18 (100.0%) | $39,375 |
Occupancy by Householder Income Bracket in Seneca
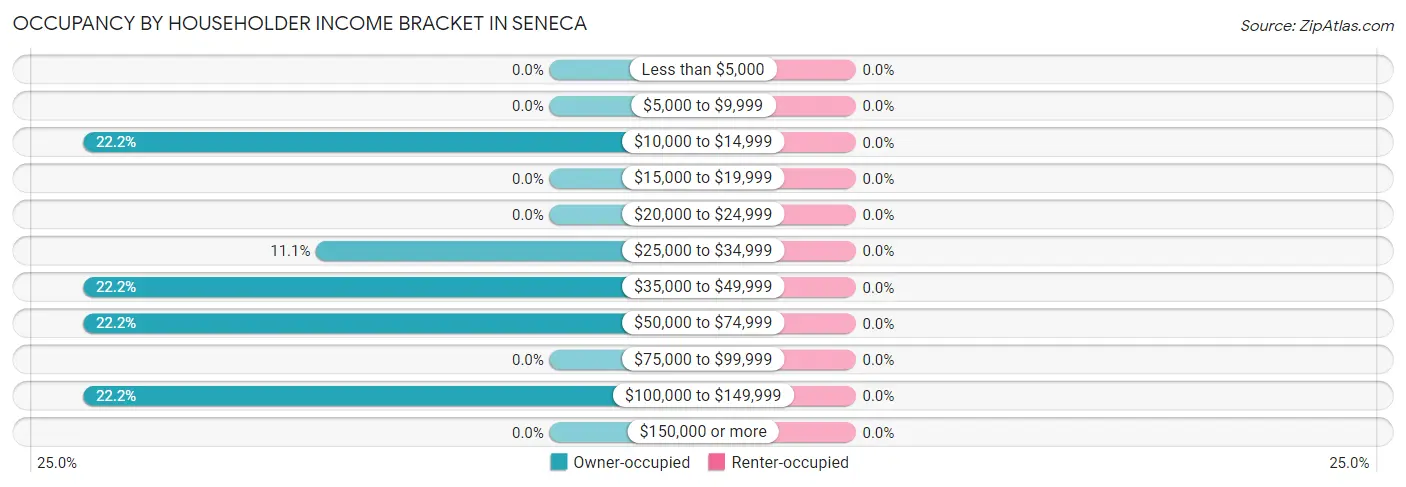
| Income Bracket | Owner-occupied | Renter-occupied |
| Less than $5,000 | 0 (0.0%) | 0 (0.0%) |
| $5,000 to $9,999 | 0 (0.0%) | 0 (0.0%) |
| $10,000 to $14,999 | 4 (22.2%) | 0 (0.0%) |
| $15,000 to $19,999 | 0 (0.0%) | 0 (0.0%) |
| $20,000 to $24,999 | 0 (0.0%) | 0 (0.0%) |
| $25,000 to $34,999 | 2 (11.1%) | 0 (0.0%) |
| $35,000 to $49,999 | 4 (22.2%) | 0 (0.0%) |
| $50,000 to $74,999 | 4 (22.2%) | 0 (0.0%) |
| $75,000 to $99,999 | 0 (0.0%) | 0 (0.0%) |
| $100,000 to $149,999 | 4 (22.2%) | 0 (0.0%) |
| $150,000 or more | 0 (0.0%) | 0 (0.0%) |
| Total | 18 (100.0%) | 0 (0.0%) |
Monthly Housing Cost Tiers in Seneca
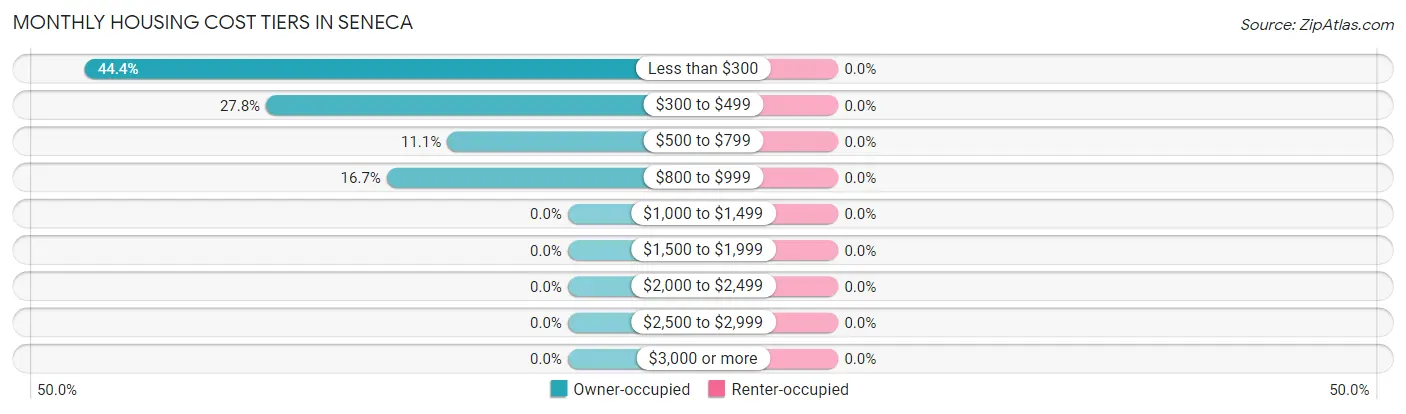
| Monthly Cost | Owner-occupied | Renter-occupied |
| Less than $300 | 8 (44.4%) | 0 (0.0%) |
| $300 to $499 | 5 (27.8%) | 0 (0.0%) |
| $500 to $799 | 2 (11.1%) | 0 (0.0%) |
| $800 to $999 | 3 (16.7%) | 0 (0.0%) |
| $1,000 to $1,499 | 0 (0.0%) | 0 (0.0%) |
| $1,500 to $1,999 | 0 (0.0%) | 0 (0.0%) |
| $2,000 to $2,499 | 0 (0.0%) | 0 (0.0%) |
| $2,500 to $2,999 | 0 (0.0%) | 0 (0.0%) |
| $3,000 or more | 0 (0.0%) | 0 (0.0%) |
| Total | 18 (100.0%) | 0 (0.0%) |
Physical Housing Characteristics in Seneca
Housing Structures in Seneca
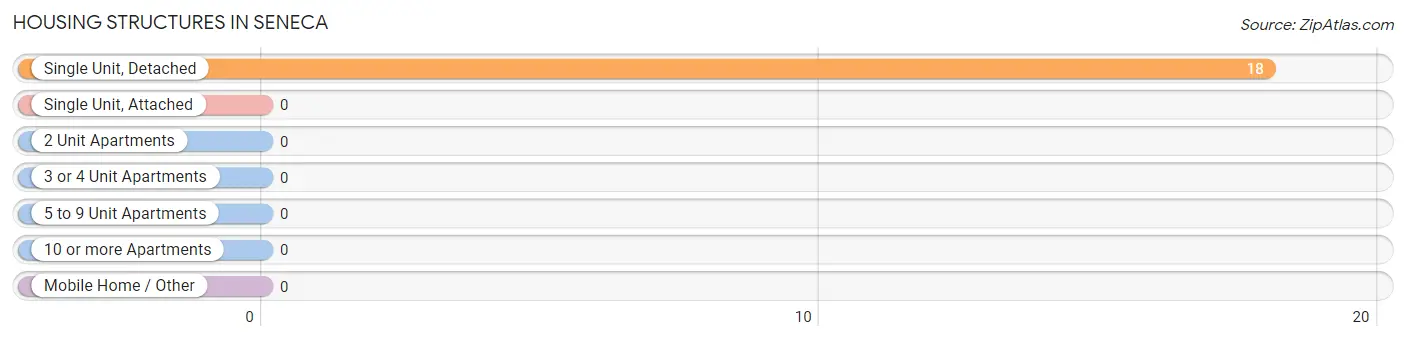
| Structure Type | # Housing Units | % Housing Units |
| Single Unit, Detached | 18 | 100.0% |
| Single Unit, Attached | 0 | 0.0% |
| 2 Unit Apartments | 0 | 0.0% |
| 3 or 4 Unit Apartments | 0 | 0.0% |
| 5 to 9 Unit Apartments | 0 | 0.0% |
| 10 or more Apartments | 0 | 0.0% |
| Mobile Home / Other | 0 | 0.0% |
| Total | 18 | 100.0% |
Housing Structures by Occupancy in Seneca
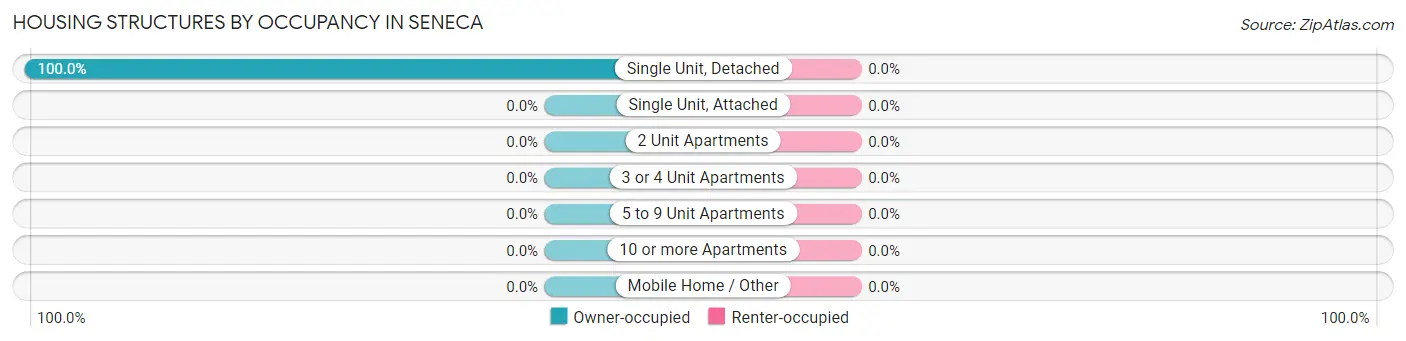
| Structure Type | Owner-occupied | Renter-occupied |
| Single Unit, Detached | 18 (100.0%) | 0 (0.0%) |
| Single Unit, Attached | 0 (0.0%) | 0 (0.0%) |
| 2 Unit Apartments | 0 (0.0%) | 0 (0.0%) |
| 3 or 4 Unit Apartments | 0 (0.0%) | 0 (0.0%) |
| 5 to 9 Unit Apartments | 0 (0.0%) | 0 (0.0%) |
| 10 or more Apartments | 0 (0.0%) | 0 (0.0%) |
| Mobile Home / Other | 0 (0.0%) | 0 (0.0%) |
| Total | 18 (100.0%) | 0 (0.0%) |
Housing Structures by Number of Rooms in Seneca
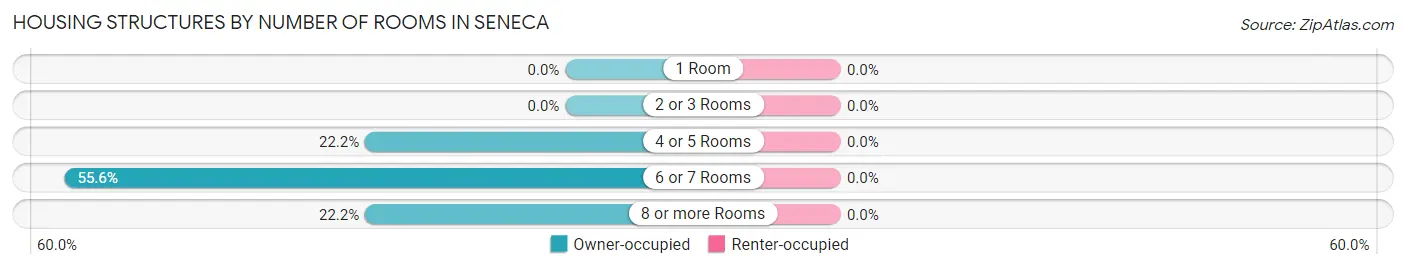
| Number of Rooms | Owner-occupied | Renter-occupied |
| 1 Room | 0 (0.0%) | 0 (0.0%) |
| 2 or 3 Rooms | 0 (0.0%) | 0 (0.0%) |
| 4 or 5 Rooms | 4 (22.2%) | 0 (0.0%) |
| 6 or 7 Rooms | 10 (55.6%) | 0 (0.0%) |
| 8 or more Rooms | 4 (22.2%) | 0 (0.0%) |
| Total | 18 (100.0%) | 0 (0.0%) |
Housing Structure by Heating Type in Seneca
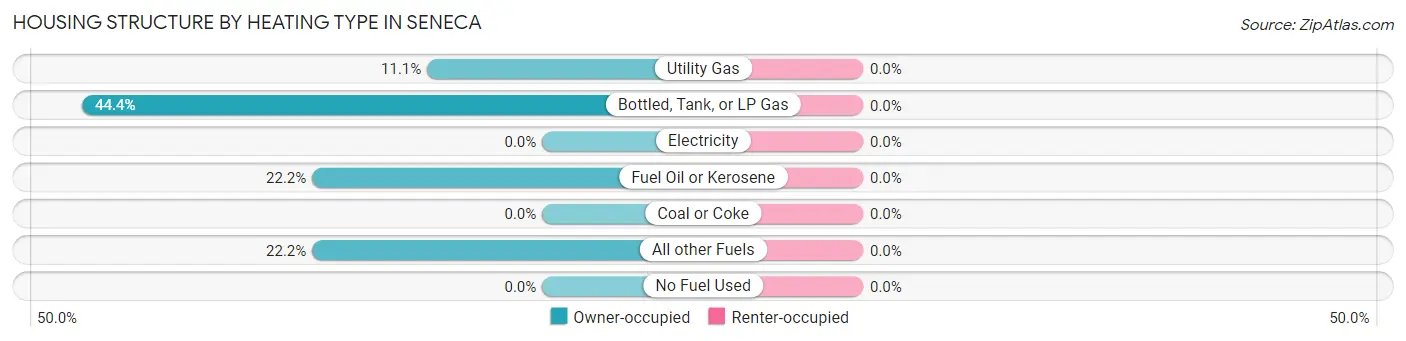
| Heating Type | Owner-occupied | Renter-occupied |
| Utility Gas | 2 (11.1%) | 0 (0.0%) |
| Bottled, Tank, or LP Gas | 8 (44.4%) | 0 (0.0%) |
| Electricity | 0 (0.0%) | 0 (0.0%) |
| Fuel Oil or Kerosene | 4 (22.2%) | 0 (0.0%) |
| Coal or Coke | 0 (0.0%) | 0 (0.0%) |
| All other Fuels | 4 (22.2%) | 0 (0.0%) |
| No Fuel Used | 0 (0.0%) | 0 (0.0%) |
| Total | 18 (100.0%) | 0 (0.0%) |
Household Vehicle Usage in Seneca
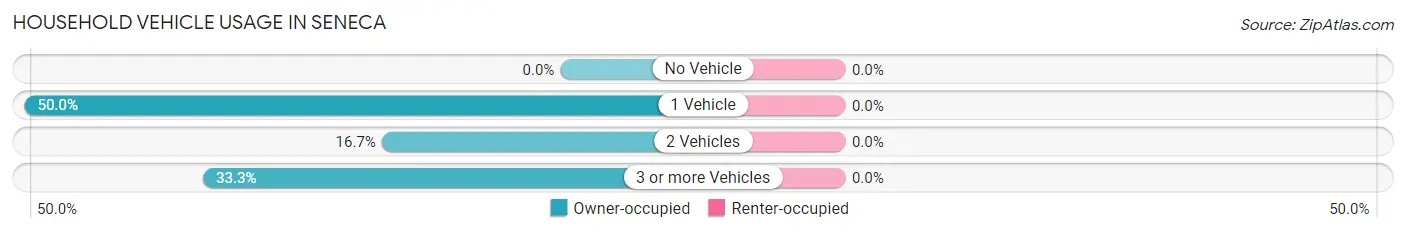
| Vehicles per Household | Owner-occupied | Renter-occupied |
| No Vehicle | 0 (0.0%) | 0 (0.0%) |
| 1 Vehicle | 9 (50.0%) | 0 (0.0%) |
| 2 Vehicles | 3 (16.7%) | 0 (0.0%) |
| 3 or more Vehicles | 6 (33.3%) | 0 (0.0%) |
| Total | 18 (100.0%) | 0 (0.0%) |
Real Estate & Mortgages in Seneca
Real Estate and Mortgage Overview in Seneca
| Characteristic | Without Mortgage | With Mortgage |
| Housing Units | 15 | 3 |
| Median Property Value | - | - |
| Median Household Income | - | - |
| Monthly Housing Costs | $294 | $0 |
| Real Estate Taxes | $199 | $0 |
Property Value by Mortgage Status in Seneca
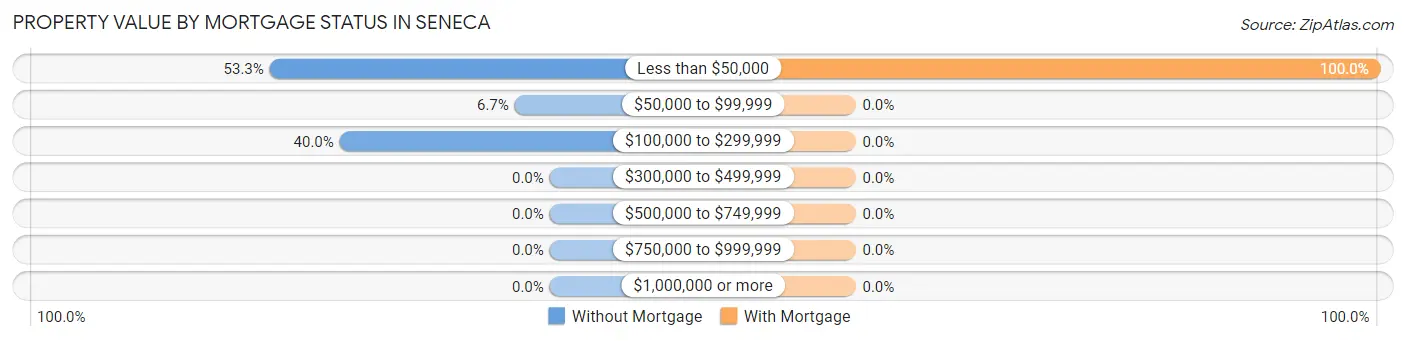
| Property Value | Without Mortgage | With Mortgage |
| Less than $50,000 | 8 (53.3%) | 3 (100.0%) |
| $50,000 to $99,999 | 1 (6.7%) | 0 (0.0%) |
| $100,000 to $299,999 | 6 (40.0%) | 0 (0.0%) |
| $300,000 to $499,999 | 0 (0.0%) | 0 (0.0%) |
| $500,000 to $749,999 | 0 (0.0%) | 0 (0.0%) |
| $750,000 to $999,999 | 0 (0.0%) | 0 (0.0%) |
| $1,000,000 or more | 0 (0.0%) | 0 (0.0%) |
| Total | 15 (100.0%) | 3 (100.0%) |
Household Income by Mortgage Status in Seneca
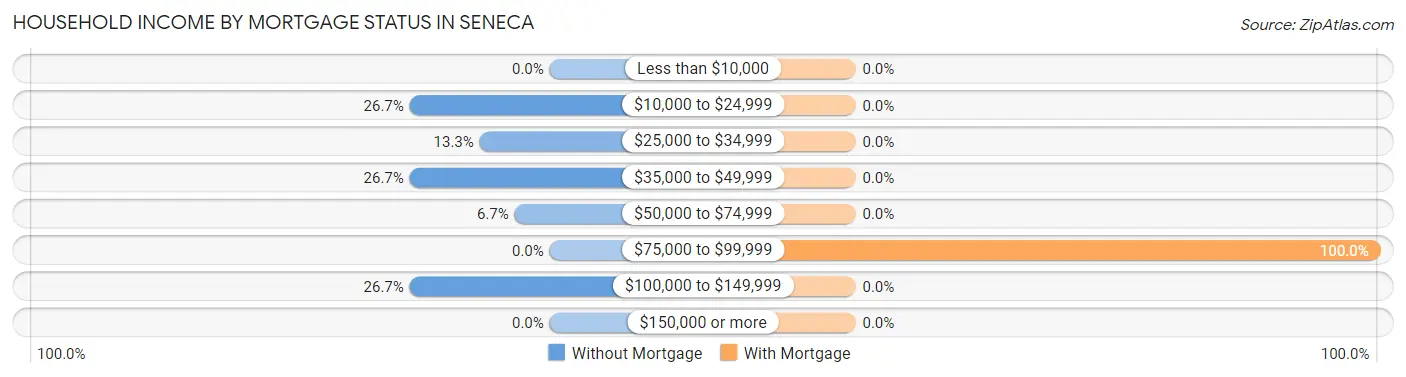
| Household Income | Without Mortgage | With Mortgage |
| Less than $10,000 | 0 (0.0%) | 0 (0.0%) |
| $10,000 to $24,999 | 4 (26.7%) | 0 (0.0%) |
| $25,000 to $34,999 | 2 (13.3%) | 0 (0.0%) |
| $35,000 to $49,999 | 4 (26.7%) | 0 (0.0%) |
| $50,000 to $74,999 | 1 (6.7%) | 0 (0.0%) |
| $75,000 to $99,999 | 0 (0.0%) | 3 (100.0%) |
| $100,000 to $149,999 | 4 (26.7%) | 0 (0.0%) |
| $150,000 or more | 0 (0.0%) | 0 (0.0%) |
| Total | 15 (100.0%) | 3 (100.0%) |
Property Value to Household Income Ratio in Seneca
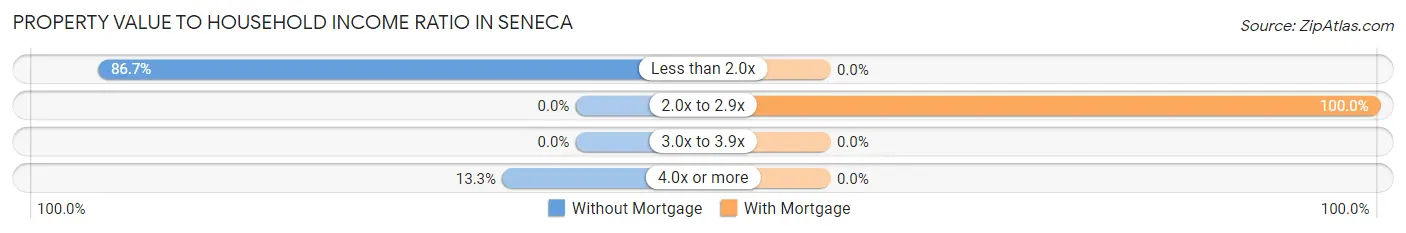
| Value-to-Income Ratio | Without Mortgage | With Mortgage |
| Less than 2.0x | 13 (86.7%) | 0 (0.0%) |
| 2.0x to 2.9x | 0 (0.0%) | 3 (100.0%) |
| 3.0x to 3.9x | 0 (0.0%) | 0 (0.0%) |
| 4.0x or more | 2 (13.3%) | 0 (0.0%) |
| Total | 15 (100.0%) | 3 (100.0%) |
Real Estate Taxes by Mortgage Status in Seneca
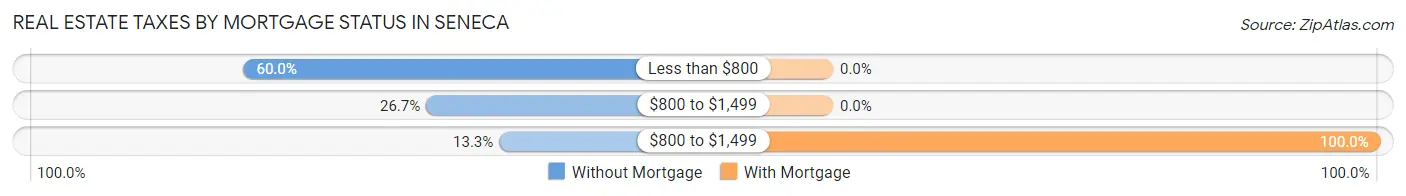
| Property Taxes | Without Mortgage | With Mortgage |
| Less than $800 | 9 (60.0%) | 0 (0.0%) |
| $800 to $1,499 | 4 (26.7%) | 0 (0.0%) |
| $800 to $1,499 | 2 (13.3%) | 3 (100.0%) |
| Total | 15 (100.0%) | 3 (100.0%) |
Health & Disability in Seneca
Health Insurance Coverage by Age in Seneca
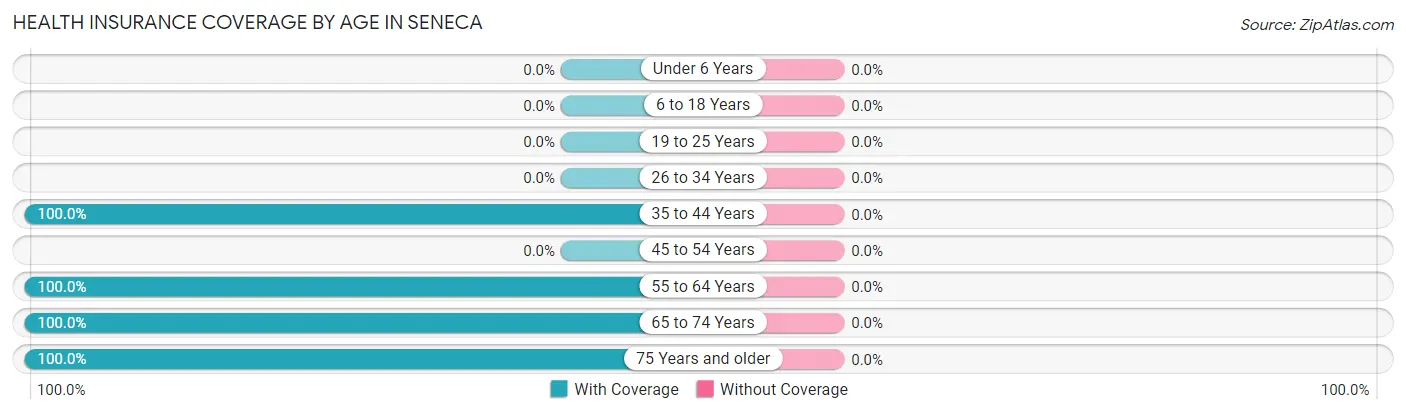
| Age Bracket | With Coverage | Without Coverage |
| Under 6 Years | 0 (0.0%) | 0 (0.0%) |
| 6 to 18 Years | 0 (0.0%) | 0 (0.0%) |
| 19 to 25 Years | 0 (0.0%) | 0 (0.0%) |
| 26 to 34 Years | 0 (0.0%) | 0 (0.0%) |
| 35 to 44 Years | 2 (100.0%) | 0 (0.0%) |
| 45 to 54 Years | 0 (0.0%) | 0 (0.0%) |
| 55 to 64 Years | 16 (100.0%) | 0 (0.0%) |
| 65 to 74 Years | 8 (100.0%) | 0 (0.0%) |
| 75 Years and older | 16 (100.0%) | 0 (0.0%) |
| Total | 42 (100.0%) | 0 (0.0%) |
Health Insurance Coverage by Citizenship Status in Seneca
| Citizenship Status | With Coverage | Without Coverage |
| Native Born | 0 (0.0%) | 0 (0.0%) |
| Foreign Born, Citizen | 0 (0.0%) | 0 (0.0%) |
| Foreign Born, not a Citizen | 0 (0.0%) | 0 (0.0%) |
Health Insurance Coverage by Household Income in Seneca
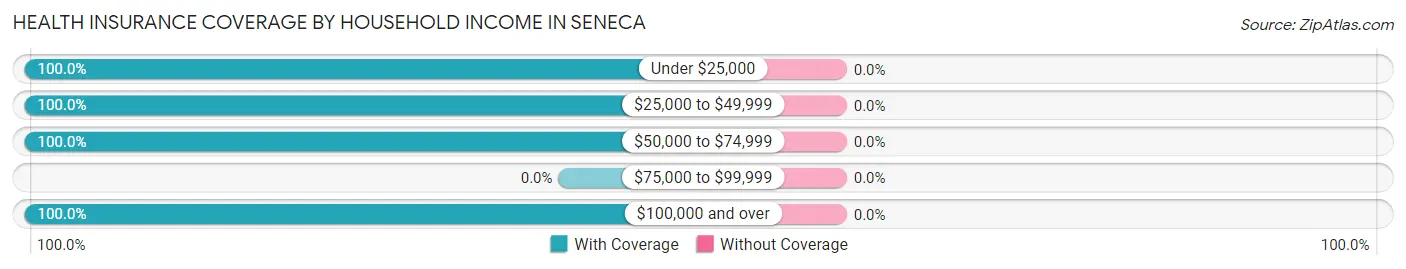
| Household Income | With Coverage | Without Coverage |
| Under $25,000 | 4 (100.0%) | 0 (0.0%) |
| $25,000 to $49,999 | 21 (100.0%) | 0 (0.0%) |
| $50,000 to $74,999 | 9 (100.0%) | 0 (0.0%) |
| $75,000 to $99,999 | 0 (0.0%) | 0 (0.0%) |
| $100,000 and over | 8 (100.0%) | 0 (0.0%) |
Public vs Private Health Insurance Coverage by Age in Seneca
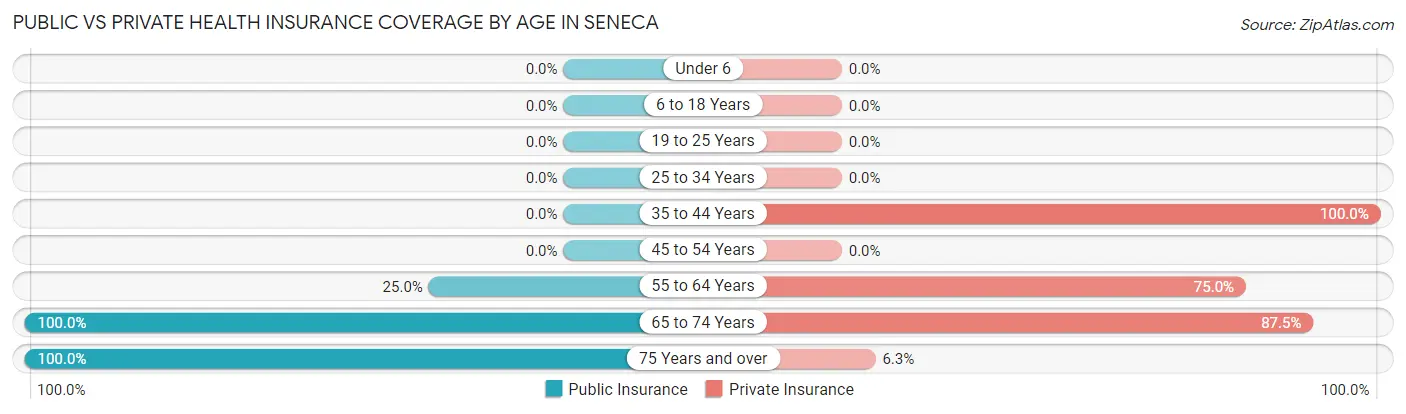
| Age Bracket | Public Insurance | Private Insurance |
| Under 6 | 0 (0.0%) | 0 (0.0%) |
| 6 to 18 Years | 0 (0.0%) | 0 (0.0%) |
| 19 to 25 Years | 0 (0.0%) | 0 (0.0%) |
| 25 to 34 Years | 0 (0.0%) | 0 (0.0%) |
| 35 to 44 Years | 0 (0.0%) | 2 (100.0%) |
| 45 to 54 Years | 0 (0.0%) | 0 (0.0%) |
| 55 to 64 Years | 4 (25.0%) | 12 (75.0%) |
| 65 to 74 Years | 8 (100.0%) | 7 (87.5%) |
| 75 Years and over | 16 (100.0%) | 1 (6.2%) |
| Total | 28 (66.7%) | 22 (52.4%) |
Disability Status by Sex by Age in Seneca
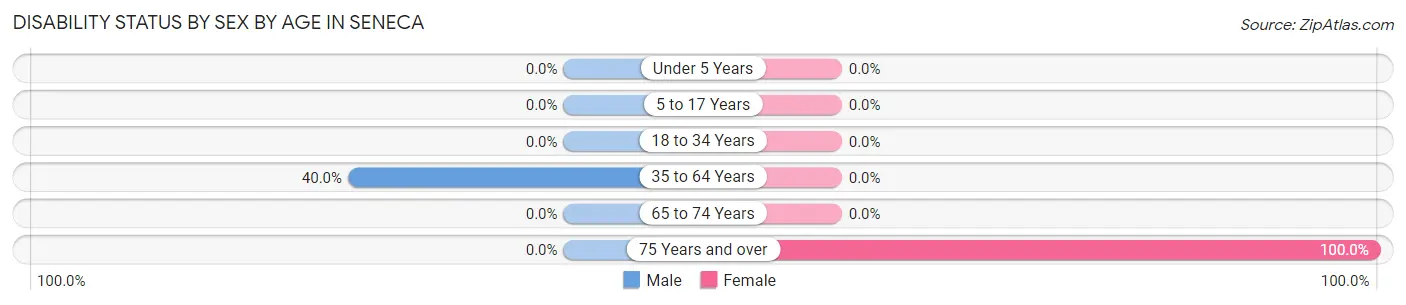
| Age Bracket | Male | Female |
| Under 5 Years | 0 (0.0%) | 0 (0.0%) |
| 5 to 17 Years | 0 (0.0%) | 0 (0.0%) |
| 18 to 34 Years | 0 (0.0%) | 0 (0.0%) |
| 35 to 64 Years | 6 (40.0%) | 0 (0.0%) |
| 65 to 74 Years | 0 (0.0%) | 0 (0.0%) |
| 75 Years and over | 0 (0.0%) | 7 (100.0%) |
Disability Class by Sex by Age in Seneca
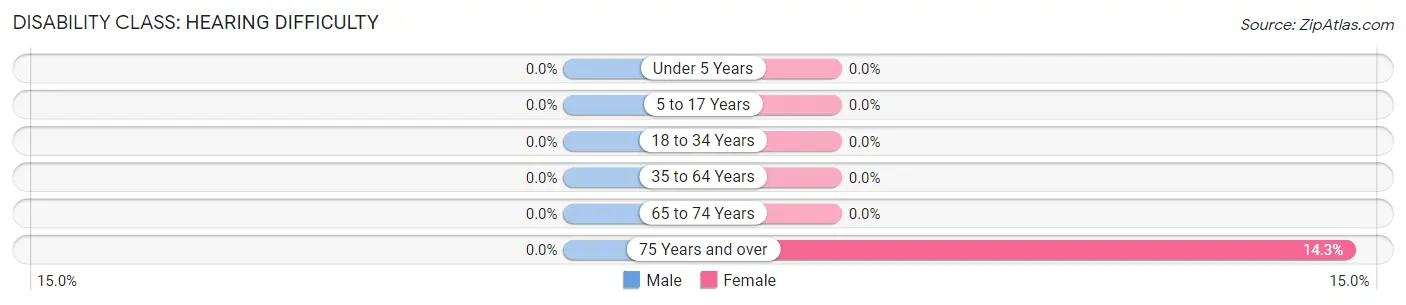
Disability Class: Hearing Difficulty
| Age Bracket | Male | Female |
| Under 5 Years | 0 (0.0%) | 0 (0.0%) |
| 5 to 17 Years | 0 (0.0%) | 0 (0.0%) |
| 18 to 34 Years | 0 (0.0%) | 0 (0.0%) |
| 35 to 64 Years | 0 (0.0%) | 0 (0.0%) |
| 65 to 74 Years | 0 (0.0%) | 0 (0.0%) |
| 75 Years and over | 0 (0.0%) | 1 (14.3%) |
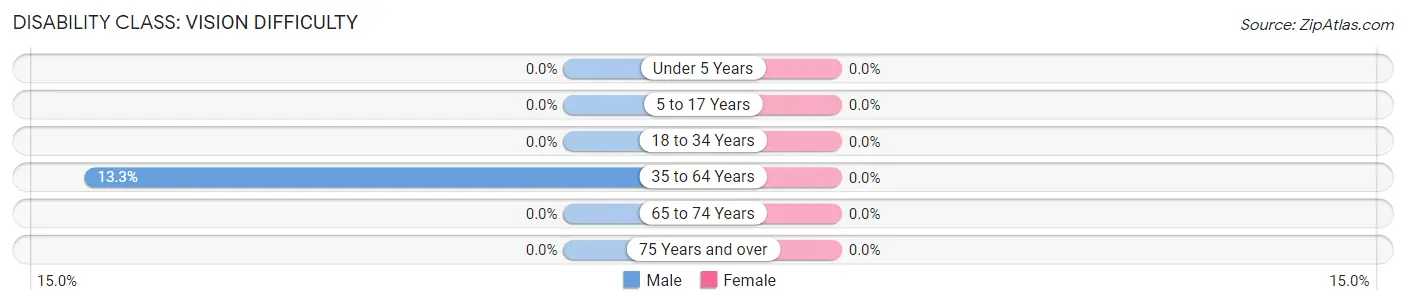
Disability Class: Vision Difficulty
| Age Bracket | Male | Female |
| Under 5 Years | 0 (0.0%) | 0 (0.0%) |
| 5 to 17 Years | 0 (0.0%) | 0 (0.0%) |
| 18 to 34 Years | 0 (0.0%) | 0 (0.0%) |
| 35 to 64 Years | 2 (13.3%) | 0 (0.0%) |
| 65 to 74 Years | 0 (0.0%) | 0 (0.0%) |
| 75 Years and over | 0 (0.0%) | 0 (0.0%) |
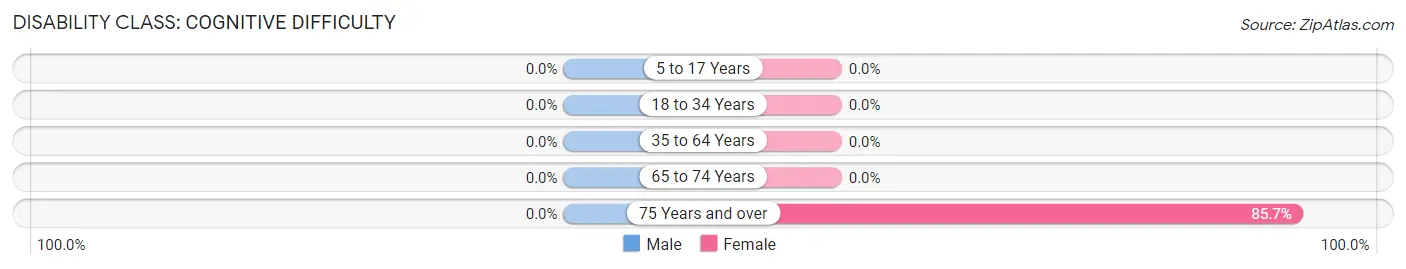
Disability Class: Cognitive Difficulty
| Age Bracket | Male | Female |
| 5 to 17 Years | 0 (0.0%) | 0 (0.0%) |
| 18 to 34 Years | 0 (0.0%) | 0 (0.0%) |
| 35 to 64 Years | 0 (0.0%) | 0 (0.0%) |
| 65 to 74 Years | 0 (0.0%) | 0 (0.0%) |
| 75 Years and over | 0 (0.0%) | 6 (85.7%) |
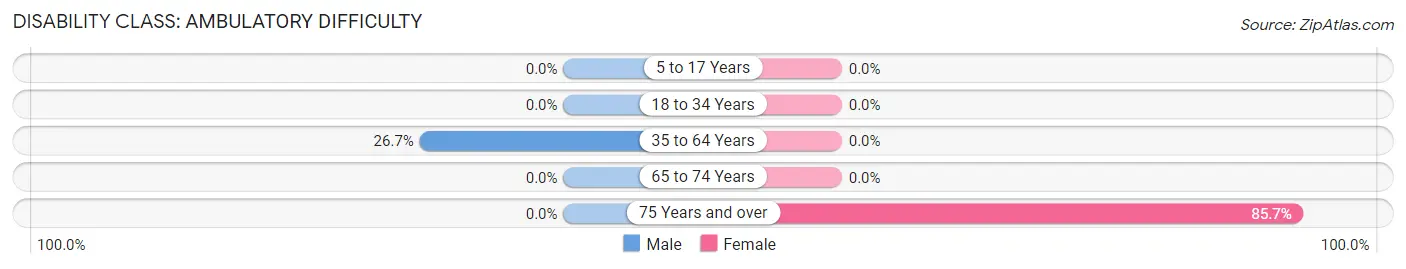
Disability Class: Ambulatory Difficulty
| Age Bracket | Male | Female |
| 5 to 17 Years | 0 (0.0%) | 0 (0.0%) |
| 18 to 34 Years | 0 (0.0%) | 0 (0.0%) |
| 35 to 64 Years | 4 (26.7%) | 0 (0.0%) |
| 65 to 74 Years | 0 (0.0%) | 0 (0.0%) |
| 75 Years and over | 0 (0.0%) | 6 (85.7%) |
Disability Class: Self-Care Difficulty
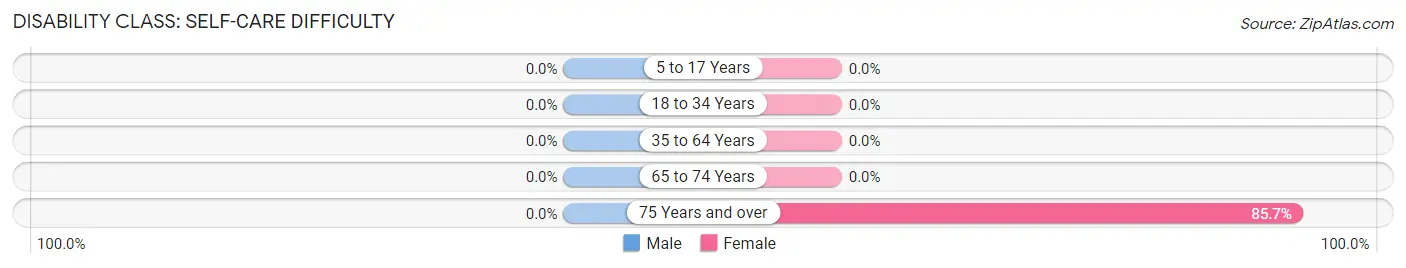
| Age Bracket | Male | Female |
| 5 to 17 Years | 0 (0.0%) | 0 (0.0%) |
| 18 to 34 Years | 0 (0.0%) | 0 (0.0%) |
| 35 to 64 Years | 0 (0.0%) | 0 (0.0%) |
| 65 to 74 Years | 0 (0.0%) | 0 (0.0%) |
| 75 Years and over | 0 (0.0%) | 6 (85.7%) |
Technology Access in Seneca
Computing Device Access in Seneca
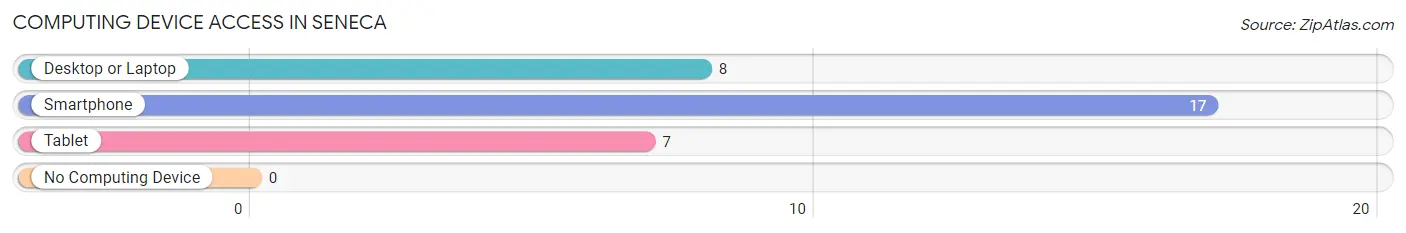
| Device Type | # Households | % Households |
| Desktop or Laptop | 8 | 44.4% |
| Smartphone | 17 | 94.4% |
| Tablet | 7 | 38.9% |
| No Computing Device | 0 | 0.0% |
| Total | 18 | 100.0% |
Internet Access in Seneca
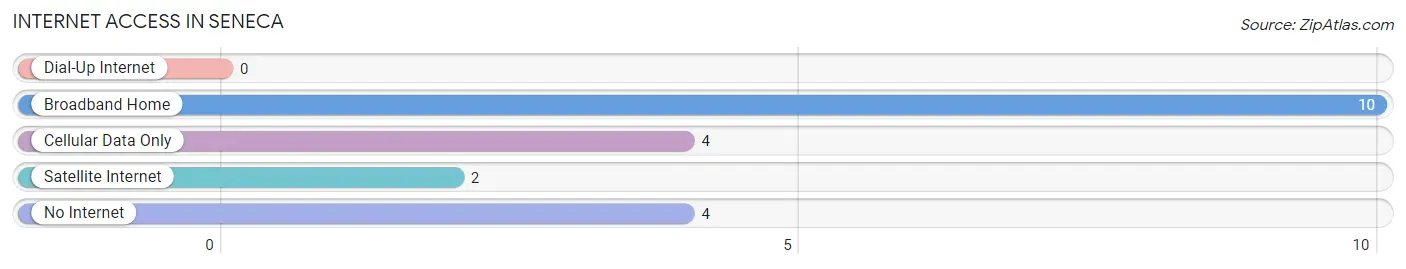
| Internet Type | # Households | % Households |
| Dial-Up Internet | 0 | 0.0% |
| Broadband Home | 10 | 55.6% |
| Cellular Data Only | 4 | 22.2% |
| Satellite Internet | 2 | 11.1% |
| No Internet | 4 | 22.2% |
| Total | 18 | 100.0% |
Seneca Summary
Seneca, South Dakota is a small town located in the southeastern corner of the state. It is situated in the Missouri River Valley, and is surrounded by rolling hills and prairies. The town has a population of just over 500 people, and is the county seat of Moody County.
History
The area that is now Seneca was first settled in the late 1800s by German immigrants. The town was originally called “New Berlin”, but was later changed to Seneca in honor of the Seneca Indians who had once lived in the area. The town was officially incorporated in 1887.
In the early 1900s, Seneca was a thriving agricultural community. The town was home to several grain elevators, a creamery, a flour mill, and a lumber yard. The town also had a hotel, a bank, a post office, and several churches.
In the 1950s, the town began to decline as many of its residents moved away in search of better economic opportunities. The town’s population dropped from over 1,000 in 1950 to just over 500 in 2000.
Geography
Seneca is located in the southeastern corner of South Dakota, in the Missouri River Valley. The town is situated on the banks of the Big Sioux River, and is surrounded by rolling hills and prairies. The town is located about 25 miles from Sioux Falls, the state’s largest city.
The climate in Seneca is typical of the Midwest, with hot summers and cold winters. The average temperature in the summer is around 75 degrees Fahrenheit, and the average temperature in the winter is around 20 degrees Fahrenheit.
Economy
The economy of Seneca is largely based on agriculture. The town is home to several grain elevators, a creamery, and a flour mill. The town also has a few small businesses, including a hardware store, a grocery store, and a restaurant.
The town is also home to a few manufacturing companies, including a furniture factory and a plastics factory. The town also has a few small service businesses, including a gas station, a car repair shop, and a barber shop.
Demographics
As of the 2010 census, the population of Seneca was 514. The town is predominantly white, with a small Hispanic population. The median household income in the town is $41,250, and the median home value is $90,000.
The town is served by the Seneca School District, which includes an elementary school, a middle school, and a high school. The town also has a public library and a community center.
Seneca is a small town with a rich history and a strong sense of community. The town is home to a diverse population, and is a great place to live and work.
Common Questions
What is Per Capita Income in Seneca?
Per Capita income in Seneca is $28,698.
What is the Median Family Income in Seneca?
Median Family Income in Seneca is $50,833.
What is the Median Household income in Seneca?
Median Household Income in Seneca is $39,375.
What is Inequality or Gini Index in Seneca?
Inequality or Gini Index in Seneca is 0.39.
What is the Total Population of Seneca?
Total Population of Seneca is 42.
What is the Total Male Population of Seneca?
Total Male Population of Seneca is 27.
What is the Total Female Population of Seneca?
Total Female Population of Seneca is 15.
What is the Ratio of Males per 100 Females in Seneca?
There are 180.00 Males per 100 Females in Seneca.
What is the Ratio of Females per 100 Males in Seneca?
There are 55.56 Females per 100 Males in Seneca.
What is the Median Population Age in Seneca?
Median Population Age in Seneca is 67.7 Years.
What is the Average Family Size in Seneca
Average Family Size in Seneca is 4.3 People.
What is the Average Household Size in Seneca
Average Household Size in Seneca is 2.3 People.
How Large is the Labor Force in Seneca?
There are 14 People in the Labor Forcein in Seneca.
What is the Percentage of People in the Labor Force in Seneca?
33.3% of People are in the Labor Force in Seneca.