South Sioux City, NE Map & Demographics
South Sioux City Map
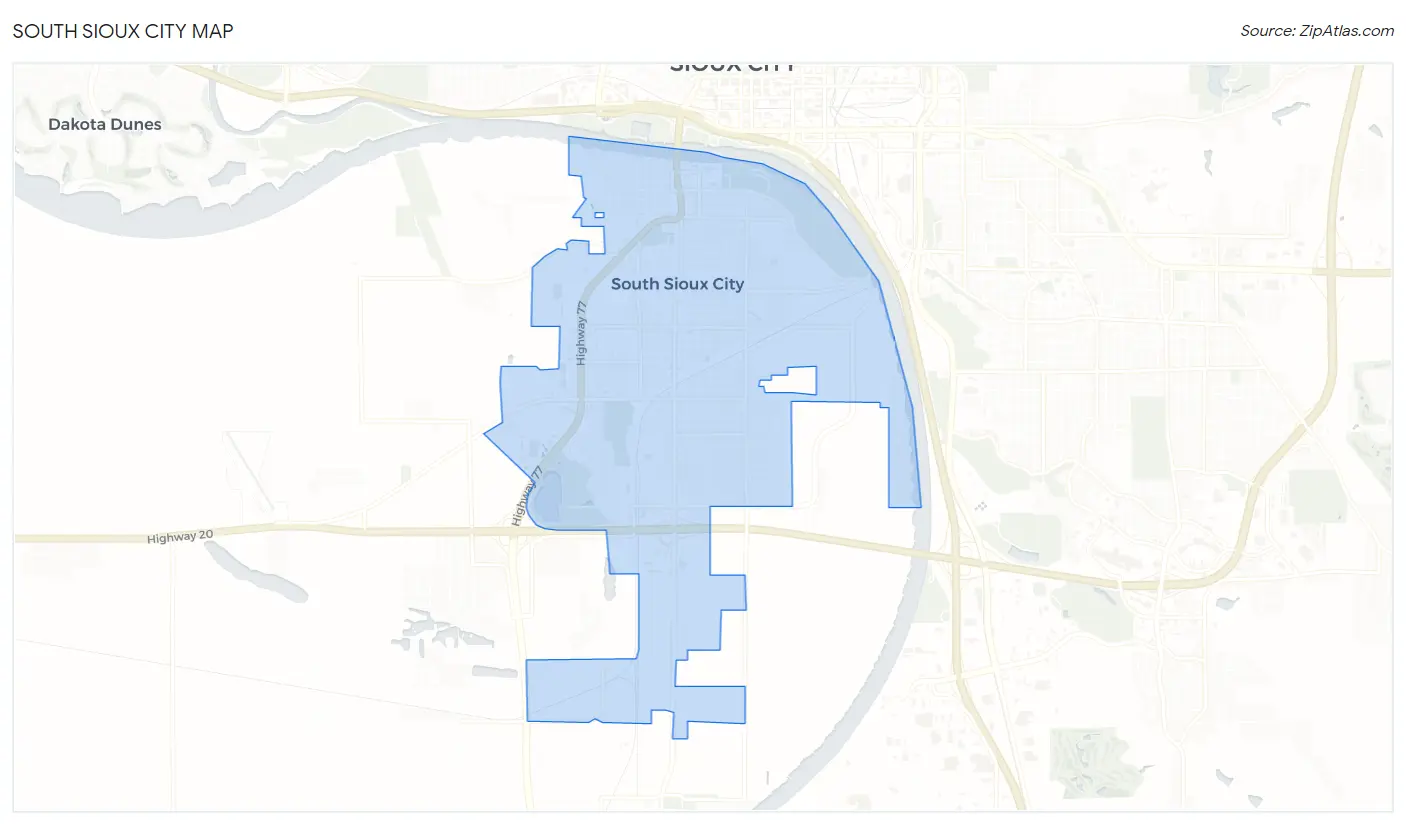
South Sioux City Overview
$29,668
PER CAPITA INCOME
$77,679
AVG FAMILY INCOME
$62,650
AVG HOUSEHOLD INCOME
38.3%
WAGE / INCOME GAP [ % ]
61.7¢/ $1
WAGE / INCOME GAP [ $ ]
0.42
INEQUALITY / GINI INDEX
13,835
TOTAL POPULATION
6,845
MALE POPULATION
6,990
FEMALE POPULATION
97.93
MALES / 100 FEMALES
102.12
FEMALES / 100 MALES
31.0
MEDIAN AGE
3.6
AVG FAMILY SIZE
2.9
AVG HOUSEHOLD SIZE
7,101
LABOR FORCE [ PEOPLE ]
70.8%
PERCENT IN LABOR FORCE
2.3%
UNEMPLOYMENT RATE
South Sioux City Zip Codes
South Sioux City Area Codes
Income in South Sioux City
Income Overview in South Sioux City
Per Capita Income in South Sioux City is $29,668, while median incomes of families and households are $77,679 and $62,650 respectively.
| Characteristic | Number | Measure |
| Per Capita Income | 13,835 | $29,668 |
| Median Family Income | 3,118 | $77,679 |
| Mean Family Income | 3,118 | $100,593 |
| Median Household Income | 4,805 | $62,650 |
| Mean Household Income | 4,805 | $83,204 |
| Income Deficit | 3,118 | $0 |
| Wage / Income Gap (%) | 13,835 | 38.27% |
| Wage / Income Gap ($) | 13,835 | 61.73¢ per $1 |
| Gini / Inequality Index | 13,835 | 0.42 |
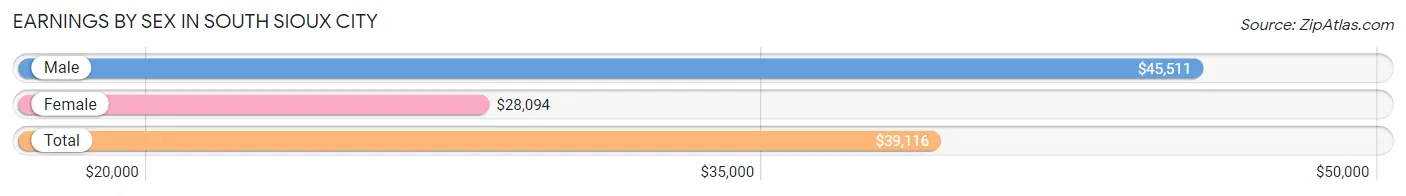
Earnings by Sex in South Sioux City
Average Earnings in South Sioux City are $39,116, $45,511 for men and $28,094 for women, a difference of 38.3%.
| Sex | Number | Average Earnings |
| Male | 4,182 (57.4%) | $45,511 |
| Female | 3,101 (42.6%) | $28,094 |
| Total | 7,283 (100.0%) | $39,116 |
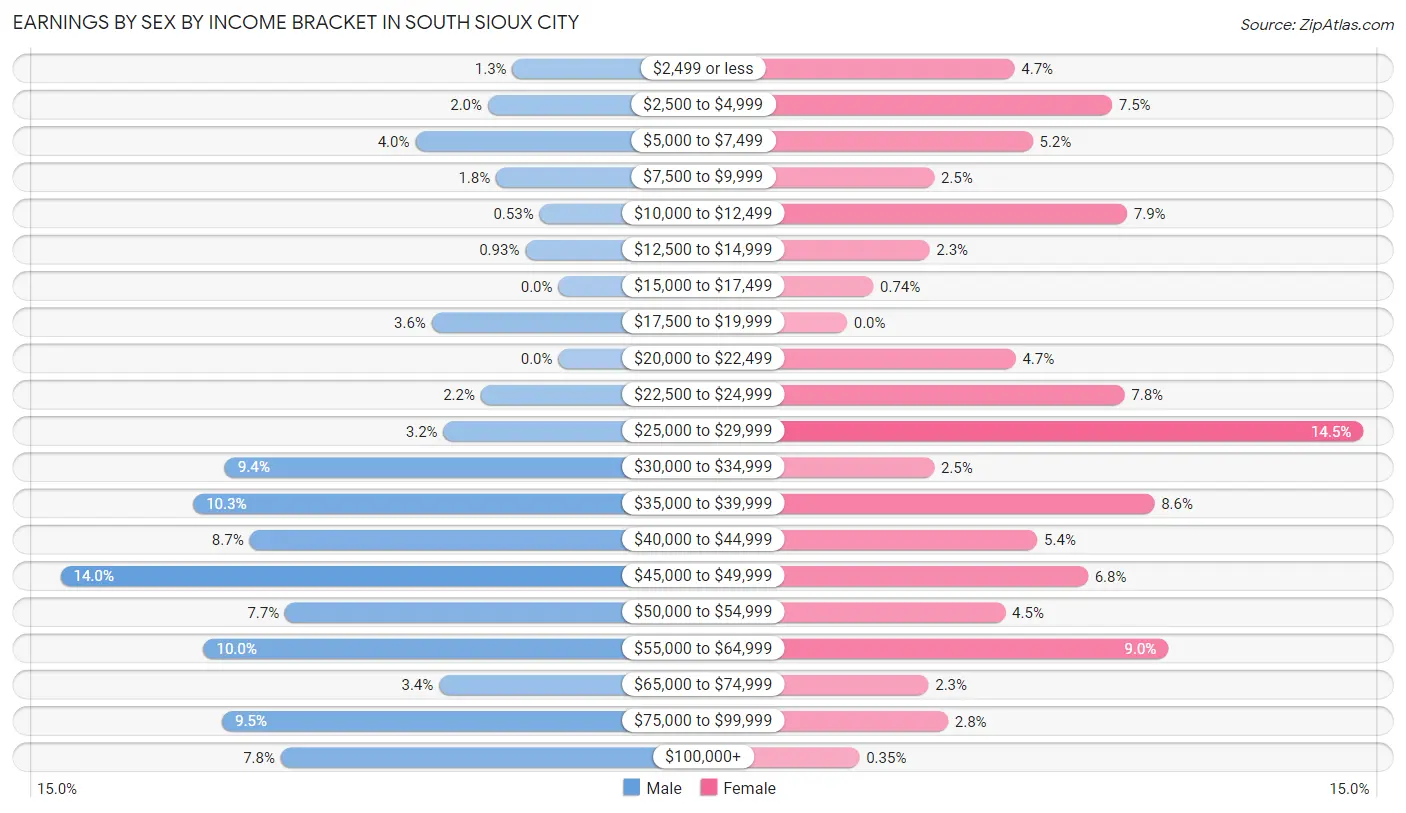
Earnings by Sex by Income Bracket in South Sioux City
The most common earnings brackets in South Sioux City are $45,000 to $49,999 for men (585 | 14.0%) and $25,000 to $29,999 for women (450 | 14.5%).
| Income | Male | Female |
| $2,499 or less | 54 (1.3%) | 146 (4.7%) |
| $2,500 to $4,999 | 83 (2.0%) | 231 (7.4%) |
| $5,000 to $7,499 | 168 (4.0%) | 162 (5.2%) |
| $7,500 to $9,999 | 73 (1.8%) | 76 (2.5%) |
| $10,000 to $12,499 | 22 (0.5%) | 244 (7.9%) |
| $12,500 to $14,999 | 39 (0.9%) | 72 (2.3%) |
| $15,000 to $17,499 | 0 (0.0%) | 23 (0.7%) |
| $17,500 to $19,999 | 149 (3.6%) | 0 (0.0%) |
| $20,000 to $22,499 | 0 (0.0%) | 147 (4.7%) |
| $22,500 to $24,999 | 91 (2.2%) | 242 (7.8%) |
| $25,000 to $29,999 | 135 (3.2%) | 450 (14.5%) |
| $30,000 to $34,999 | 392 (9.4%) | 76 (2.5%) |
| $35,000 to $39,999 | 429 (10.3%) | 268 (8.6%) |
| $40,000 to $44,999 | 363 (8.7%) | 166 (5.3%) |
| $45,000 to $49,999 | 585 (14.0%) | 210 (6.8%) |
| $50,000 to $54,999 | 321 (7.7%) | 138 (4.4%) |
| $55,000 to $64,999 | 417 (10.0%) | 280 (9.0%) |
| $65,000 to $74,999 | 140 (3.4%) | 71 (2.3%) |
| $75,000 to $99,999 | 395 (9.5%) | 88 (2.8%) |
| $100,000+ | 326 (7.8%) | 11 (0.4%) |
| Total | 4,182 (100.0%) | 3,101 (100.0%) |
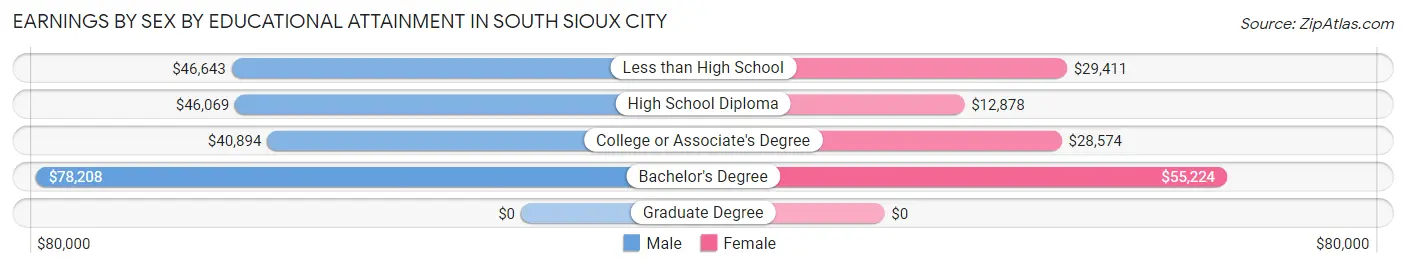
Earnings by Sex by Educational Attainment in South Sioux City
Average earnings in South Sioux City are $46,327 for men and $29,215 for women, a difference of 36.9%. Men with an educational attainment of bachelor's degree enjoy the highest average annual earnings of $78,208, while those with college or associate's degree education earn the least with $40,894. Women with an educational attainment of bachelor's degree earn the most with the average annual earnings of $55,224, while those with high school diploma education have the smallest earnings of $12,878.
| Educational Attainment | Male Income | Female Income |
| Less than High School | $46,643 | $29,411 |
| High School Diploma | $46,069 | $12,878 |
| College or Associate's Degree | $40,894 | $28,574 |
| Bachelor's Degree | $78,208 | $55,224 |
| Graduate Degree | - | - |
| Total | $46,327 | $29,215 |
Family Income in South Sioux City
Family Income Brackets in South Sioux City
According to the South Sioux City family income data, there are 820 families falling into the $100,000 to $149,999 income range, which is the most common income bracket and makes up 26.3% of all families. Conversely, the less than $10,000 income bracket is the least frequent group with only 25 families (0.8%) belonging to this category.
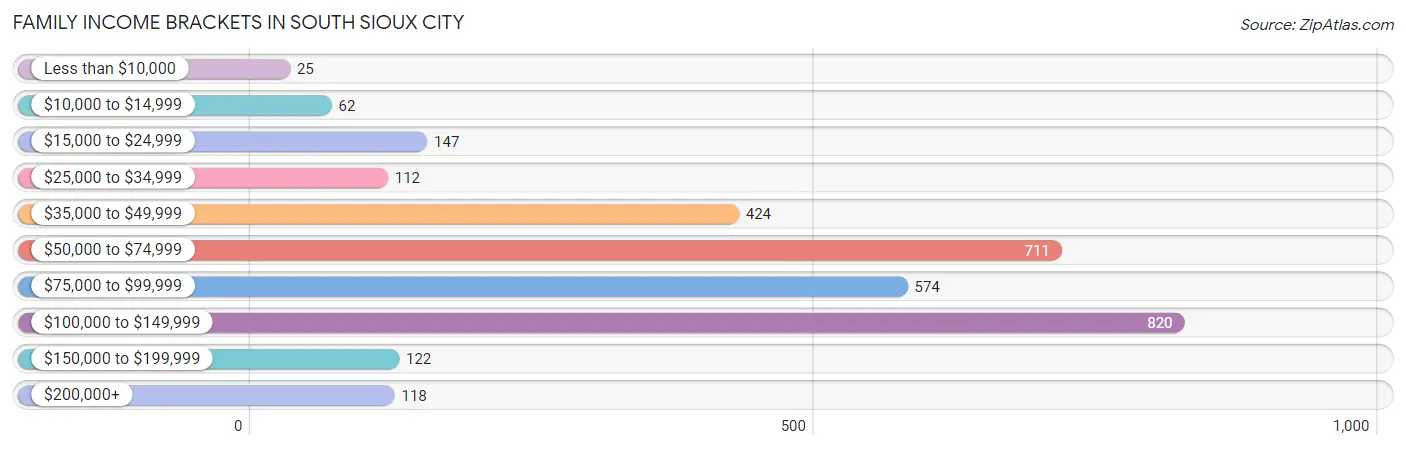
| Income Bracket | # Families | % Families |
| Less than $10,000 | 25 | 0.8% |
| $10,000 to $14,999 | 62 | 2.0% |
| $15,000 to $24,999 | 147 | 4.7% |
| $25,000 to $34,999 | 112 | 3.6% |
| $35,000 to $49,999 | 424 | 13.6% |
| $50,000 to $74,999 | 711 | 22.8% |
| $75,000 to $99,999 | 574 | 18.4% |
| $100,000 to $149,999 | 820 | 26.3% |
| $150,000 to $199,999 | 122 | 3.9% |
| $200,000+ | 118 | 3.8% |
Family Income by Famaliy Size in South Sioux City
5-person families (391 | 12.5%) account for the highest median family income in South Sioux City with $87,348 per family, while 2-person families (1,381 | 44.3%) have the highest median income of $39,304 per family member.
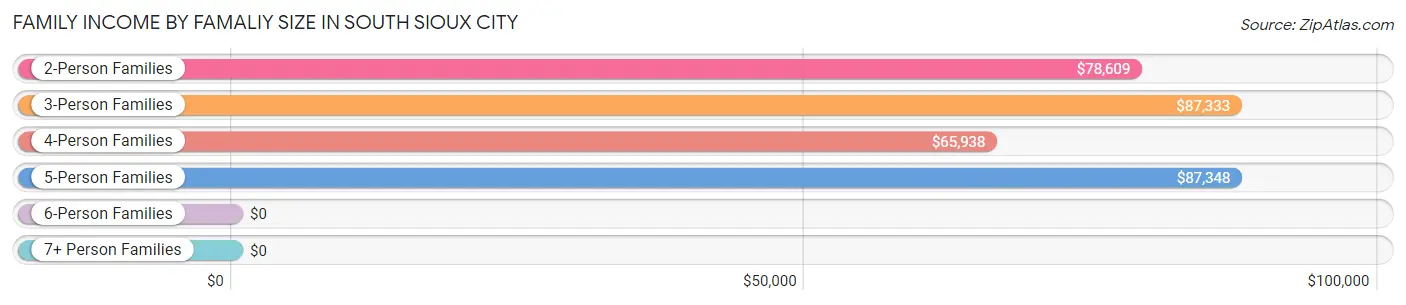
| Income Bracket | # Families | Median Income |
| 2-Person Families | 1,381 (44.3%) | $78,609 |
| 3-Person Families | 404 (13.0%) | $87,333 |
| 4-Person Families | 530 (17.0%) | $65,938 |
| 5-Person Families | 391 (12.5%) | $87,348 |
| 6-Person Families | 91 (2.9%) | $0 |
| 7+ Person Families | 321 (10.3%) | $0 |
| Total | 3,118 (100.0%) | $77,679 |
Family Income by Number of Earners in South Sioux City
The median family income in South Sioux City is $77,679, with families comprising 3+ earners (439) having the highest median family income of $117,386, while families with 1 earner (1,053) have the lowest median family income of $47,107, accounting for 14.1% and 33.8% of families, respectively.
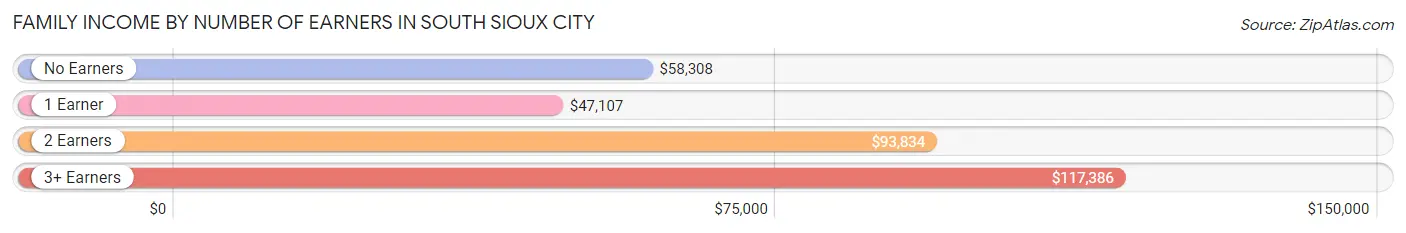
| Number of Earners | # Families | Median Income |
| No Earners | 273 (8.8%) | $58,308 |
| 1 Earner | 1,053 (33.8%) | $47,107 |
| 2 Earners | 1,353 (43.4%) | $93,834 |
| 3+ Earners | 439 (14.1%) | $117,386 |
| Total | 3,118 (100.0%) | $77,679 |
Household Income in South Sioux City
Household Income Brackets in South Sioux City
With 971 households falling in the category, the $100,000 to $149,999 income range is the most frequent in South Sioux City, accounting for 20.2% of all households. In contrast, only 106 households (2.2%) fall into the less than $10,000 income bracket, making it the least populous group.
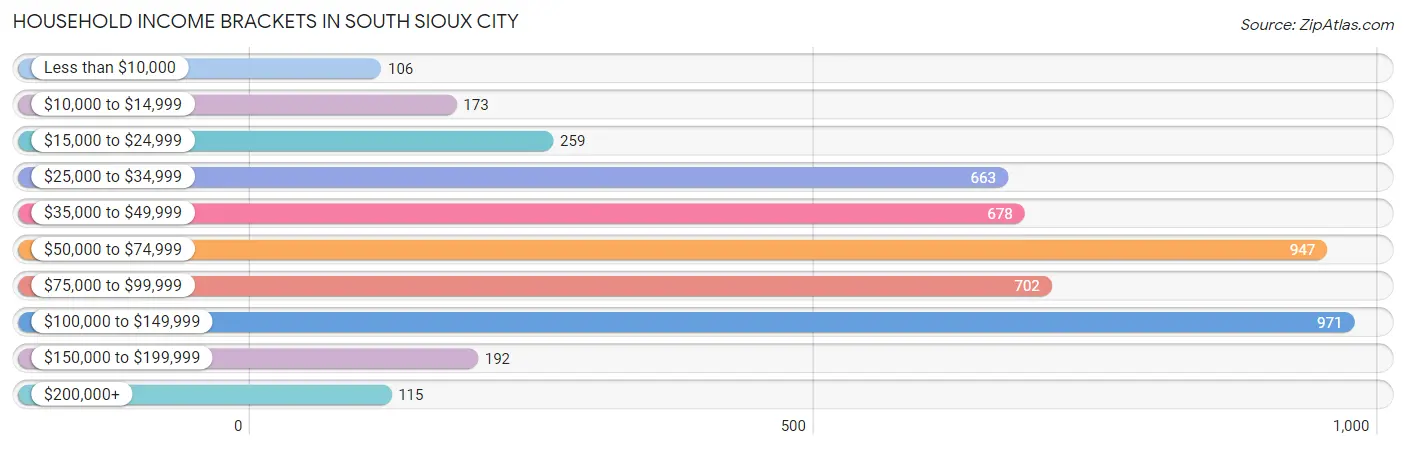
| Income Bracket | # Households | % Households |
| Less than $10,000 | 106 | 2.2% |
| $10,000 to $14,999 | 173 | 3.6% |
| $15,000 to $24,999 | 259 | 5.4% |
| $25,000 to $34,999 | 663 | 13.8% |
| $35,000 to $49,999 | 678 | 14.1% |
| $50,000 to $74,999 | 947 | 19.7% |
| $75,000 to $99,999 | 702 | 14.6% |
| $100,000 to $149,999 | 971 | 20.2% |
| $150,000 to $199,999 | 192 | 4.0% |
| $200,000+ | 115 | 2.4% |
Household Income by Householder Age in South Sioux City
The median household income in South Sioux City is $62,650, with the highest median household income of $74,196 found in the 25 to 44 years age bracket for the primary householder. A total of 1,907 households (39.7%) fall into this category. Meanwhile, the 65+ years age bracket for the primary householder has the lowest median household income of $43,788, with 994 households (20.7%) in this group.
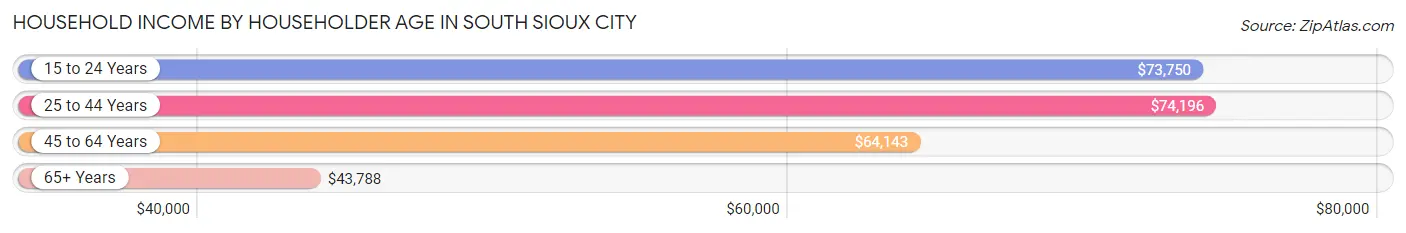
| Income Bracket | # Households | Median Income |
| 15 to 24 Years | 226 (4.7%) | $73,750 |
| 25 to 44 Years | 1,907 (39.7%) | $74,196 |
| 45 to 64 Years | 1,678 (34.9%) | $64,143 |
| 65+ Years | 994 (20.7%) | $43,788 |
| Total | 4,805 (100.0%) | $62,650 |
Poverty in South Sioux City
Income Below Poverty by Sex and Age in South Sioux City
With 6.3% poverty level for males and 12.4% for females among the residents of South Sioux City, 5 year old males and 18 to 24 year old females are the most vulnerable to poverty, with 42 males (100.0%) and 207 females (29.4%) in their respective age groups living below the poverty level.
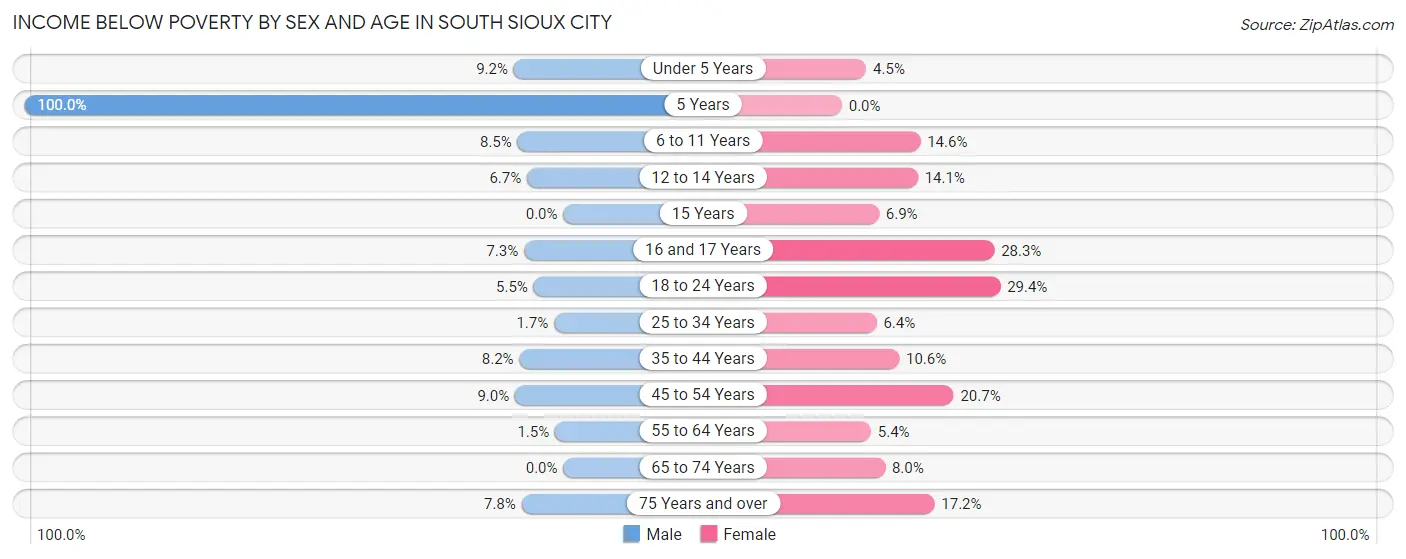
| Age Bracket | Male | Female |
| Under 5 Years | 45 (9.2%) | 24 (4.5%) |
| 5 Years | 42 (100.0%) | 0 (0.0%) |
| 6 to 11 Years | 41 (8.5%) | 91 (14.6%) |
| 12 to 14 Years | 43 (6.7%) | 72 (14.1%) |
| 15 Years | 0 (0.0%) | 16 (6.9%) |
| 16 and 17 Years | 10 (7.3%) | 43 (28.3%) |
| 18 to 24 Years | 40 (5.5%) | 207 (29.4%) |
| 25 to 34 Years | 16 (1.7%) | 68 (6.4%) |
| 35 to 44 Years | 85 (8.2%) | 94 (10.6%) |
| 45 to 54 Years | 75 (9.0%) | 85 (20.7%) |
| 55 to 64 Years | 11 (1.5%) | 39 (5.4%) |
| 65 to 74 Years | 0 (0.0%) | 45 (8.0%) |
| 75 Years and over | 22 (7.7%) | 73 (17.2%) |
| Total | 430 (6.3%) | 857 (12.4%) |
Income Above Poverty by Sex and Age in South Sioux City
According to the poverty statistics in South Sioux City, males aged 15 years and females aged 5 years are the age groups that are most secure financially, with 100.0% of males and 100.0% of females in these age groups living above the poverty line.
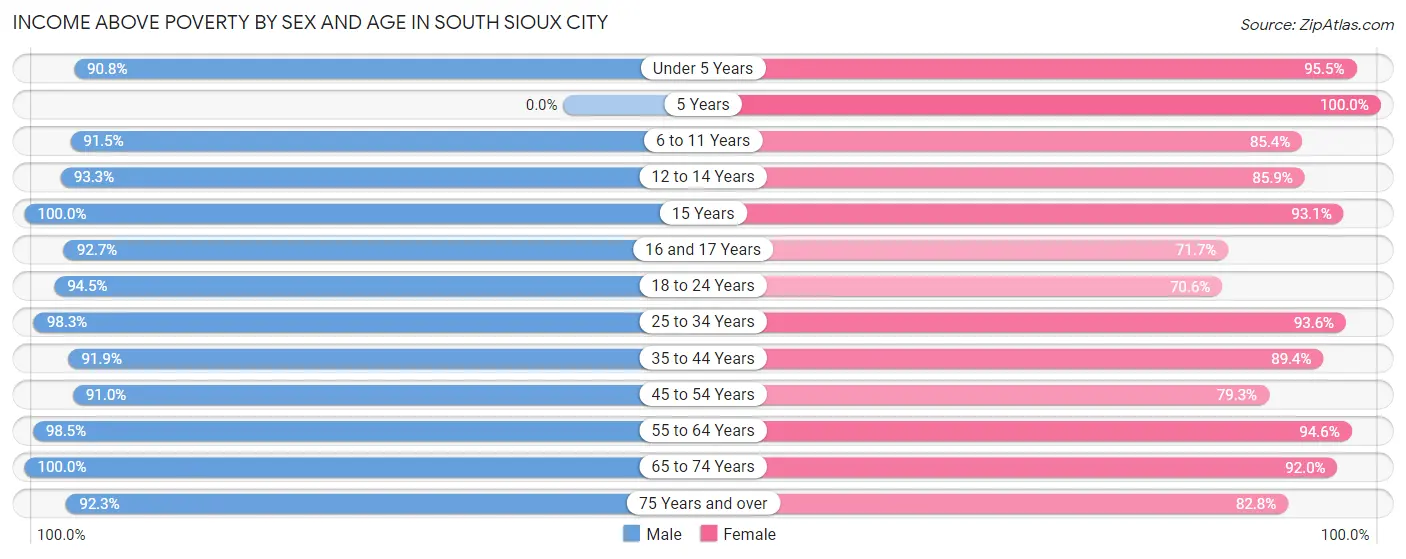
| Age Bracket | Male | Female |
| Under 5 Years | 444 (90.8%) | 507 (95.5%) |
| 5 Years | 0 (0.0%) | 67 (100.0%) |
| 6 to 11 Years | 442 (91.5%) | 534 (85.4%) |
| 12 to 14 Years | 595 (93.3%) | 439 (85.9%) |
| 15 Years | 131 (100.0%) | 217 (93.1%) |
| 16 and 17 Years | 127 (92.7%) | 109 (71.7%) |
| 18 to 24 Years | 687 (94.5%) | 497 (70.6%) |
| 25 to 34 Years | 909 (98.3%) | 990 (93.6%) |
| 35 to 44 Years | 958 (91.8%) | 791 (89.4%) |
| 45 to 54 Years | 761 (91.0%) | 325 (79.3%) |
| 55 to 64 Years | 702 (98.5%) | 684 (94.6%) |
| 65 to 74 Years | 352 (100.0%) | 517 (92.0%) |
| 75 Years and over | 262 (92.2%) | 352 (82.8%) |
| Total | 6,370 (93.7%) | 6,029 (87.5%) |
Income Below Poverty Among Married-Couple Families in South Sioux City
The poverty statistics for married-couple families in South Sioux City show that 3.3% or 74 of the total 2,260 families live below the poverty line. Families with 1 or 2 children have the highest poverty rate of 9.1%, comprising of 74 families. On the other hand, families with no children have the lowest poverty rate of 0.0%, which includes 0 families.
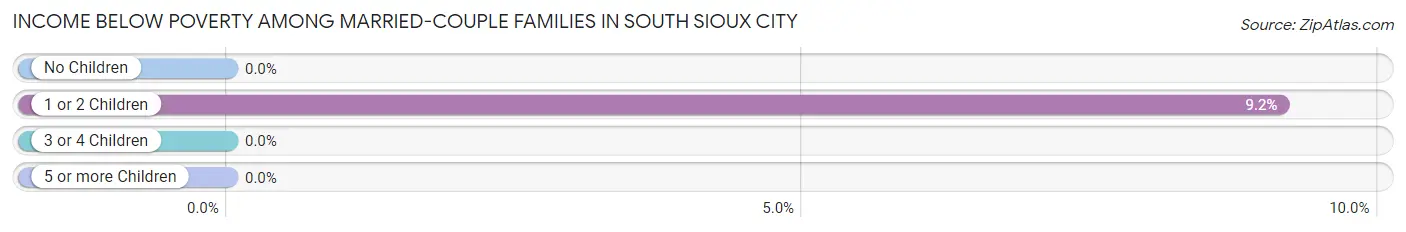
| Children | Above Poverty | Below Poverty |
| No Children | 946 (100.0%) | 0 (0.0%) |
| 1 or 2 Children | 735 (90.8%) | 74 (9.1%) |
| 3 or 4 Children | 381 (100.0%) | 0 (0.0%) |
| 5 or more Children | 124 (100.0%) | 0 (0.0%) |
| Total | 2,186 (96.7%) | 74 (3.3%) |
Income Below Poverty Among Single-Parent Households in South Sioux City
According to the poverty data in South Sioux City, 12.4% or 50 single-father households and 14.7% or 67 single-mother households are living below the poverty line. Among single-father households, those with 1 or 2 children have the highest poverty rate, with 50 households (21.8%) experiencing poverty. Likewise, among single-mother households, those with 3 or 4 children have the highest poverty rate, with 31 households (43.1%) falling below the poverty line.
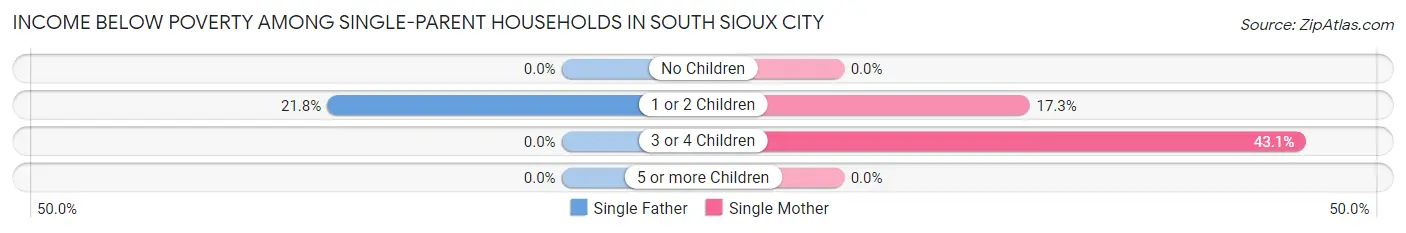
| Children | Single Father | Single Mother |
| No Children | 0 (0.0%) | 0 (0.0%) |
| 1 or 2 Children | 50 (21.8%) | 36 (17.3%) |
| 3 or 4 Children | 0 (0.0%) | 31 (43.1%) |
| 5 or more Children | 0 (0.0%) | 0 (0.0%) |
| Total | 50 (12.4%) | 67 (14.7%) |
Income Below Poverty Among Married-Couple vs Single-Parent Households in South Sioux City
The poverty data for South Sioux City shows that 74 of the married-couple family households (3.3%) and 117 of the single-parent households (13.6%) are living below the poverty level. Within the married-couple family households, those with 1 or 2 children have the highest poverty rate, with 74 households (9.1%) falling below the poverty line. Among the single-parent households, those with 3 or 4 children have the highest poverty rate, with 31 household (22.5%) living below poverty.
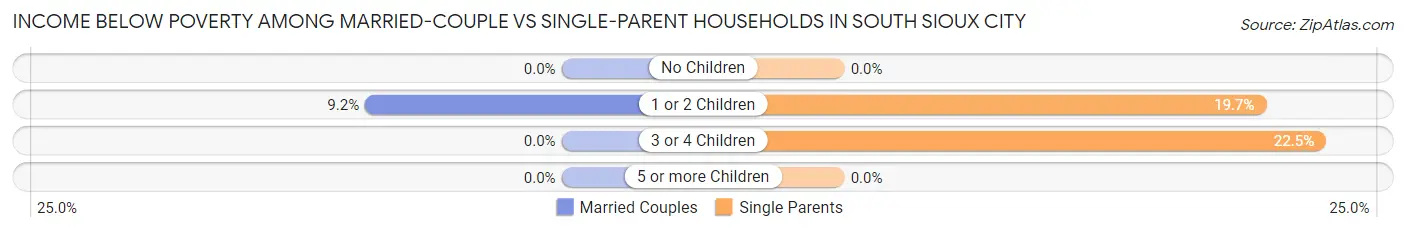
| Children | Married-Couple Families | Single-Parent Households |
| No Children | 0 (0.0%) | 0 (0.0%) |
| 1 or 2 Children | 74 (9.1%) | 86 (19.7%) |
| 3 or 4 Children | 0 (0.0%) | 31 (22.5%) |
| 5 or more Children | 0 (0.0%) | 0 (0.0%) |
| Total | 74 (3.3%) | 117 (13.6%) |
Race in South Sioux City
The most populous races in South Sioux City are Hispanic or Latino (6,726 | 48.6%), White / Caucasian (5,484 | 39.6%), and Some other Race (3,681 | 26.6%).
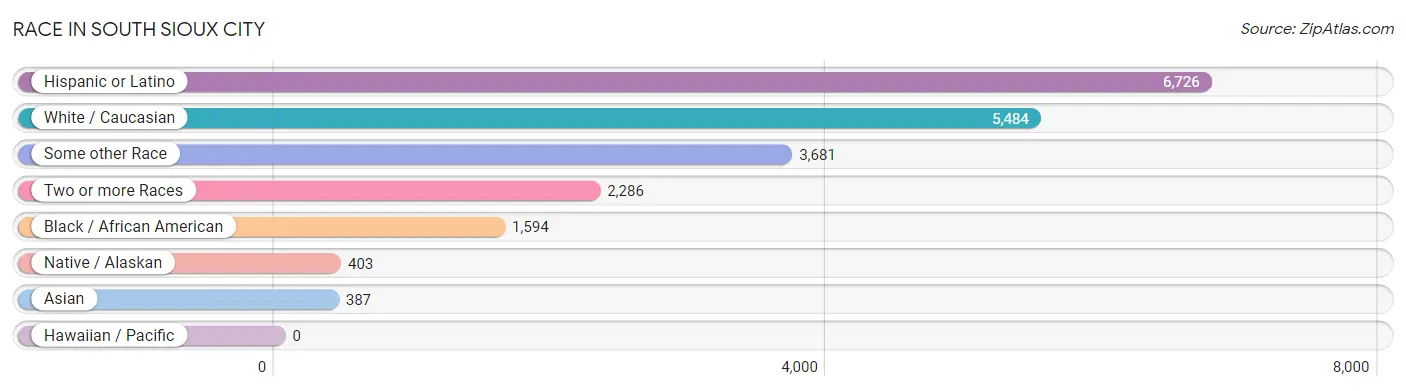
| Race | # Population | % Population |
| Asian | 387 | 2.8% |
| Black / African American | 1,594 | 11.5% |
| Hawaiian / Pacific | 0 | 0.0% |
| Hispanic or Latino | 6,726 | 48.6% |
| Native / Alaskan | 403 | 2.9% |
| White / Caucasian | 5,484 | 39.6% |
| Two or more Races | 2,286 | 16.5% |
| Some other Race | 3,681 | 26.6% |
| Total | 13,835 | 100.0% |
Ancestry in South Sioux City
The most populous ancestries reported in South Sioux City are Mexican (6,138 | 44.4%), German (1,570 | 11.4%), Subsaharan African (1,487 | 10.7%), Irish (1,088 | 7.9%), and English (700 | 5.1%), together accounting for 79.4% of all South Sioux City residents.
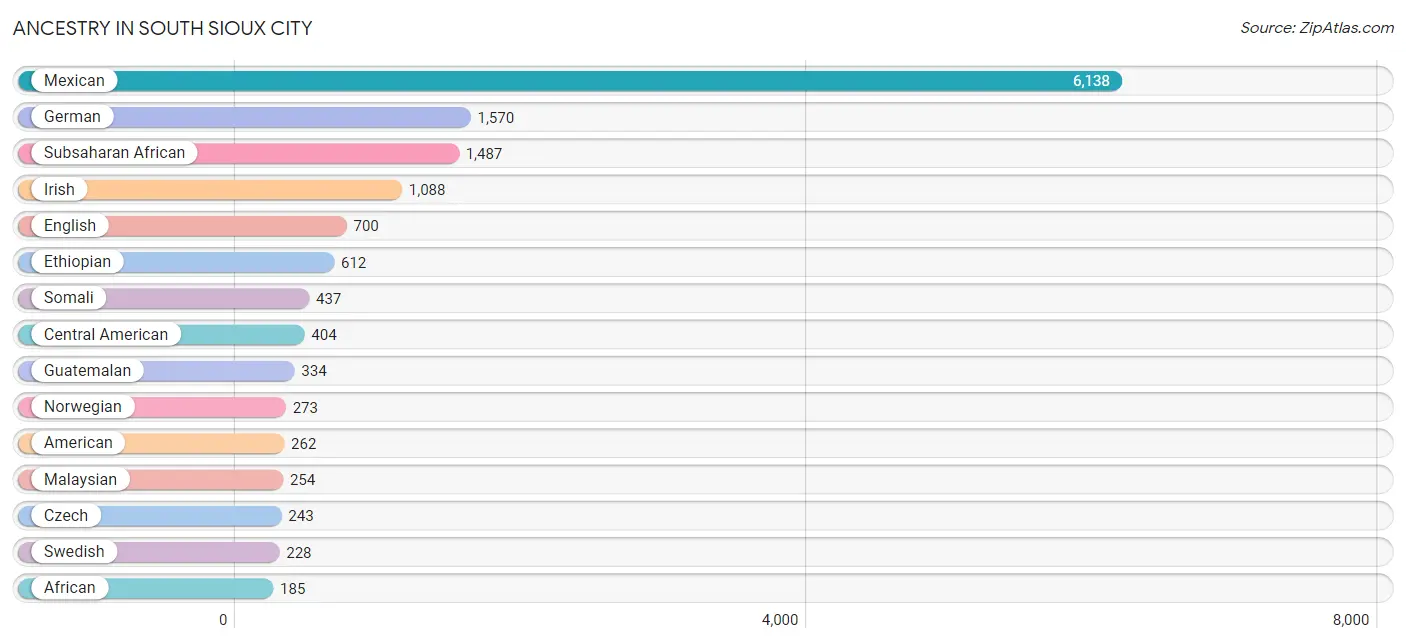
| Ancestry | # Population | % Population |
| African | 185 | 1.3% |
| American | 262 | 1.9% |
| Arab | 8 | 0.1% |
| British | 15 | 0.1% |
| Central American | 404 | 2.9% |
| Central American Indian | 7 | 0.1% |
| Czech | 243 | 1.8% |
| Danish | 176 | 1.3% |
| Dutch | 156 | 1.1% |
| English | 700 | 5.1% |
| Ethiopian | 612 | 4.4% |
| European | 79 | 0.6% |
| French | 86 | 0.6% |
| French Canadian | 33 | 0.2% |
| German | 1,570 | 11.4% |
| Guatemalan | 334 | 2.4% |
| Indian (Asian) | 98 | 0.7% |
| Irish | 1,088 | 7.9% |
| Italian | 155 | 1.1% |
| Korean | 66 | 0.5% |
| Lebanese | 8 | 0.1% |
| Malaysian | 254 | 1.8% |
| Mexican | 6,138 | 44.4% |
| Navajo | 127 | 0.9% |
| Norwegian | 273 | 2.0% |
| Polish | 28 | 0.2% |
| Portuguese | 7 | 0.1% |
| Puerto Rican | 177 | 1.3% |
| Russian | 64 | 0.5% |
| Salvadoran | 70 | 0.5% |
| Scandinavian | 25 | 0.2% |
| Scotch-Irish | 27 | 0.2% |
| Scottish | 10 | 0.1% |
| Sioux | 154 | 1.1% |
| Slovak | 28 | 0.2% |
| Somali | 437 | 3.2% |
| Subsaharan African | 1,487 | 10.7% |
| Sudanese | 44 | 0.3% |
| Swedish | 228 | 1.7% |
| Thai | 22 | 0.2% |
| Welsh | 74 | 0.5% | View All 41 Rows |
Immigrants in South Sioux City
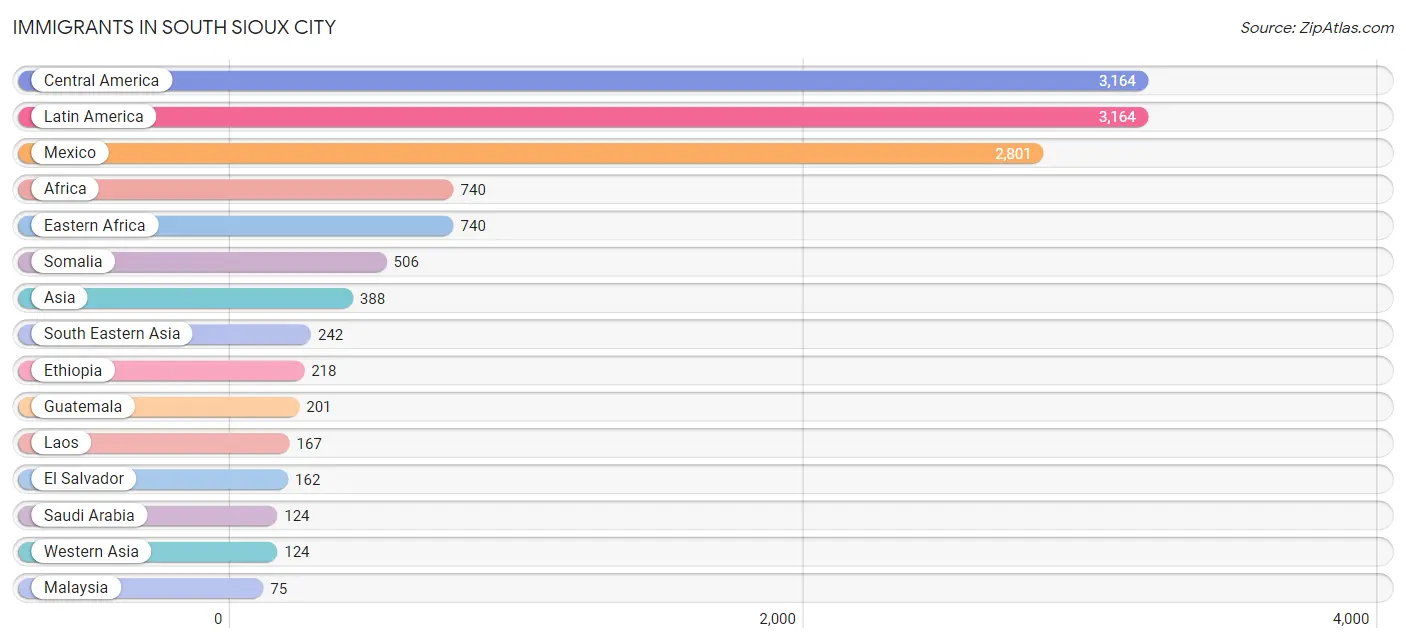
The most numerous immigrant groups reported in South Sioux City came from Central America (3,164 | 22.9%), Latin America (3,164 | 22.9%), Mexico (2,801 | 20.3%), Africa (740 | 5.3%), and Eastern Africa (740 | 5.3%), together accounting for 76.7% of all South Sioux City residents.
| Immigration Origin | # Population | % Population |
| Africa | 740 | 5.3% |
| Asia | 388 | 2.8% |
| Central America | 3,164 | 22.9% |
| Eastern Africa | 740 | 5.3% |
| Eastern Europe | 28 | 0.2% |
| El Salvador | 162 | 1.2% |
| Ethiopia | 218 | 1.6% |
| Europe | 28 | 0.2% |
| Guatemala | 201 | 1.5% |
| India | 22 | 0.2% |
| Laos | 167 | 1.2% |
| Latin America | 3,164 | 22.9% |
| Malaysia | 75 | 0.5% |
| Mexico | 2,801 | 20.3% |
| Saudi Arabia | 124 | 0.9% |
| Serbia | 28 | 0.2% |
| Somalia | 506 | 3.7% |
| South Central Asia | 22 | 0.2% |
| South Eastern Asia | 242 | 1.8% |
| Western Asia | 124 | 0.9% | View All 20 Rows |
Sex and Age in South Sioux City
Sex and Age in South Sioux City
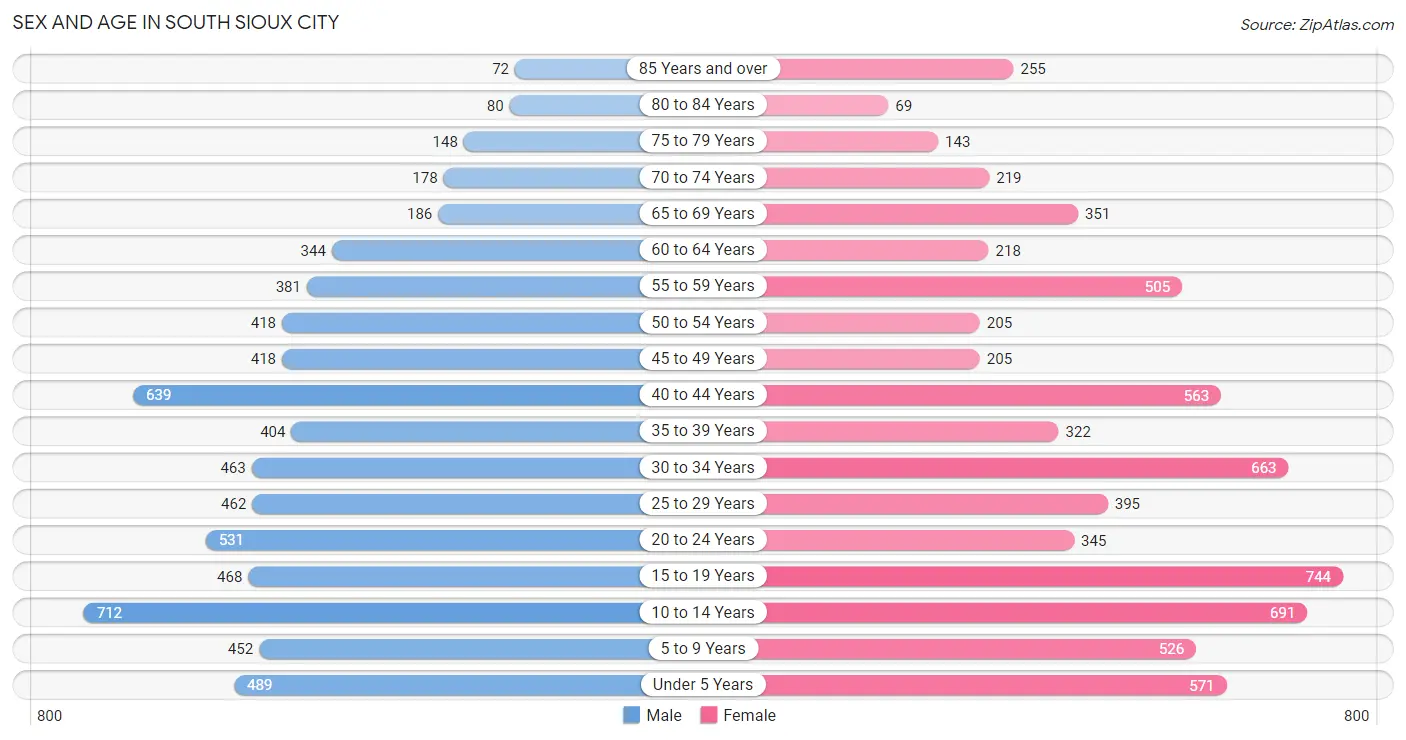
The most populous age groups in South Sioux City are 10 to 14 Years (712 | 10.4%) for men and 15 to 19 Years (744 | 10.6%) for women.
| Age Bracket | Male | Female |
| Under 5 Years | 489 (7.1%) | 571 (8.2%) |
| 5 to 9 Years | 452 (6.6%) | 526 (7.5%) |
| 10 to 14 Years | 712 (10.4%) | 691 (9.9%) |
| 15 to 19 Years | 468 (6.8%) | 744 (10.6%) |
| 20 to 24 Years | 531 (7.8%) | 345 (4.9%) |
| 25 to 29 Years | 462 (6.8%) | 395 (5.7%) |
| 30 to 34 Years | 463 (6.8%) | 663 (9.5%) |
| 35 to 39 Years | 404 (5.9%) | 322 (4.6%) |
| 40 to 44 Years | 639 (9.3%) | 563 (8.1%) |
| 45 to 49 Years | 418 (6.1%) | 205 (2.9%) |
| 50 to 54 Years | 418 (6.1%) | 205 (2.9%) |
| 55 to 59 Years | 381 (5.6%) | 505 (7.2%) |
| 60 to 64 Years | 344 (5.0%) | 218 (3.1%) |
| 65 to 69 Years | 186 (2.7%) | 351 (5.0%) |
| 70 to 74 Years | 178 (2.6%) | 219 (3.1%) |
| 75 to 79 Years | 148 (2.2%) | 143 (2.1%) |
| 80 to 84 Years | 80 (1.2%) | 69 (1.0%) |
| 85 Years and over | 72 (1.1%) | 255 (3.6%) |
| Total | 6,845 (100.0%) | 6,990 (100.0%) |
Families and Households in South Sioux City
Median Family Size in South Sioux City
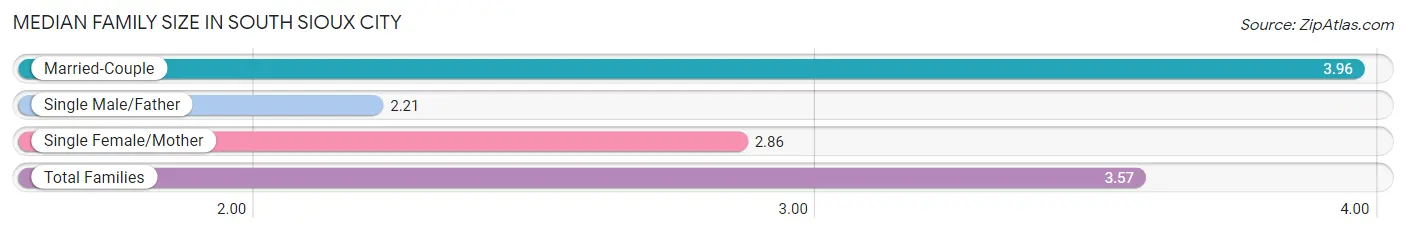
The median family size in South Sioux City is 3.57 persons per family, with married-couple families (2,260 | 72.5%) accounting for the largest median family size of 3.96 persons per family. On the other hand, single male/father families (402 | 12.9%) represent the smallest median family size with 2.21 persons per family.
| Family Type | # Families | Family Size |
| Married-Couple | 2,260 (72.5%) | 3.96 |
| Single Male/Father | 402 (12.9%) | 2.21 |
| Single Female/Mother | 456 (14.6%) | 2.86 |
| Total Families | 3,118 (100.0%) | 3.57 |
Median Household Size in South Sioux City
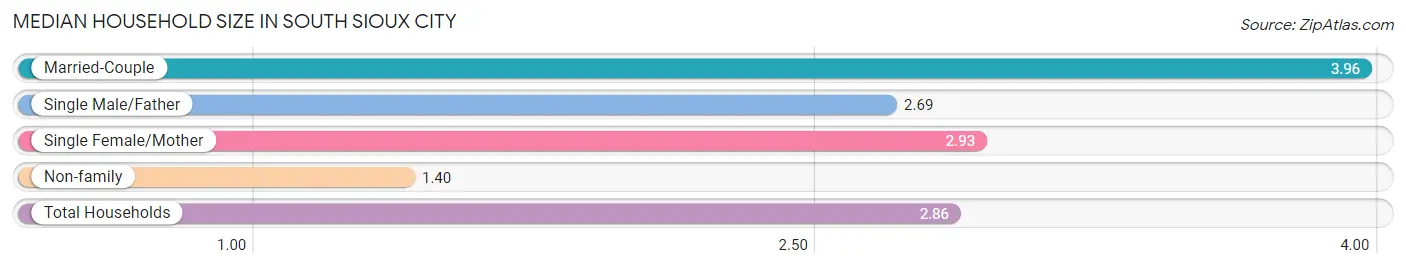
The median household size in South Sioux City is 2.86 persons per household, with married-couple households (2,260 | 47.0%) accounting for the largest median household size of 3.96 persons per household. non-family households (1,687 | 35.1%) represent the smallest median household size with 1.40 persons per household.
| Household Type | # Households | Household Size |
| Married-Couple | 2,260 (47.0%) | 3.96 |
| Single Male/Father | 402 (8.4%) | 2.69 |
| Single Female/Mother | 456 (9.5%) | 2.93 |
| Non-family | 1,687 (35.1%) | 1.40 |
| Total Households | 4,805 (100.0%) | 2.86 |
Household Size by Marriage Status in South Sioux City
Out of a total of 4,805 households in South Sioux City, 3,118 (64.9%) are family households, while 1,687 (35.1%) are nonfamily households. The most numerous type of family households are 2-person households, comprising 1,269, and the most common type of nonfamily households are 1-person households, comprising 1,244.
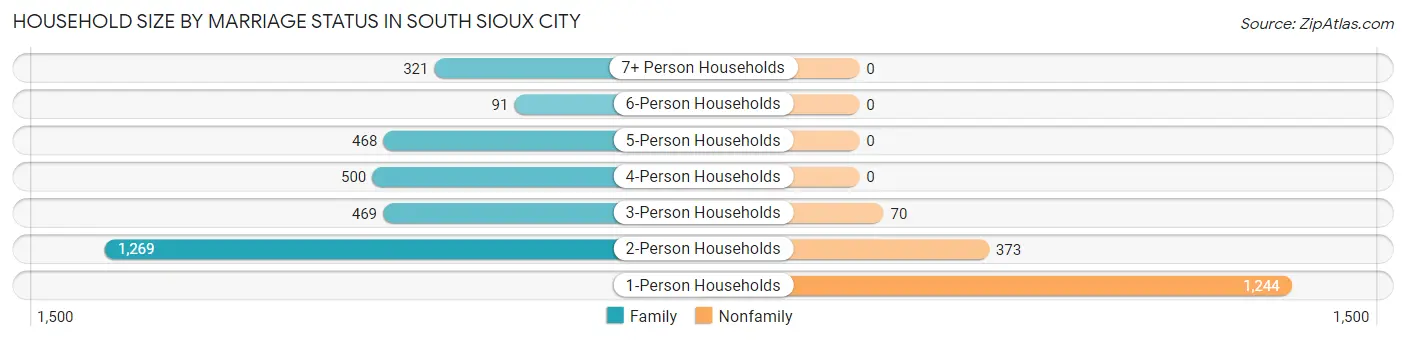
| Household Size | Family Households | Nonfamily Households |
| 1-Person Households | - | 1,244 (25.9%) |
| 2-Person Households | 1,269 (26.4%) | 373 (7.8%) |
| 3-Person Households | 469 (9.8%) | 70 (1.5%) |
| 4-Person Households | 500 (10.4%) | 0 (0.0%) |
| 5-Person Households | 468 (9.7%) | 0 (0.0%) |
| 6-Person Households | 91 (1.9%) | 0 (0.0%) |
| 7+ Person Households | 321 (6.7%) | 0 (0.0%) |
| Total | 3,118 (64.9%) | 1,687 (35.1%) |
Female Fertility in South Sioux City
Fertility by Age in South Sioux City
Average fertility rate in South Sioux City is 50.0 births per 1,000 women. Women in the age bracket of 20 to 34 years have the highest fertility rate with 93.0 births per 1,000 women. Women in the age bracket of 20 to 34 years acount for 79.7% of all women with births.
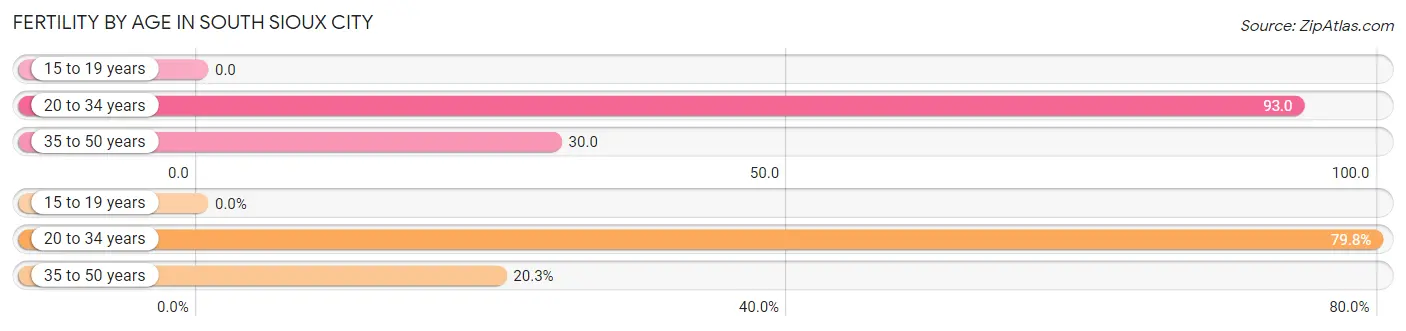
| Age Bracket | Women with Births | Births / 1,000 Women |
| 15 to 19 years | 0 (0.0%) | 0.0 |
| 20 to 34 years | 130 (79.7%) | 93.0 |
| 35 to 50 years | 33 (20.3%) | 30.0 |
| Total | 163 (100.0%) | 50.0 |
Fertility by Age by Marriage Status in South Sioux City
59.5% of women with births (163) in South Sioux City are married. The highest percentage of unmarried women with births falls into 35 to 50 years age bracket with 100.0% of them unmarried at the time of birth, while the lowest percentage of unmarried women with births belong to 20 to 34 years age bracket with 25.4% of them unmarried.
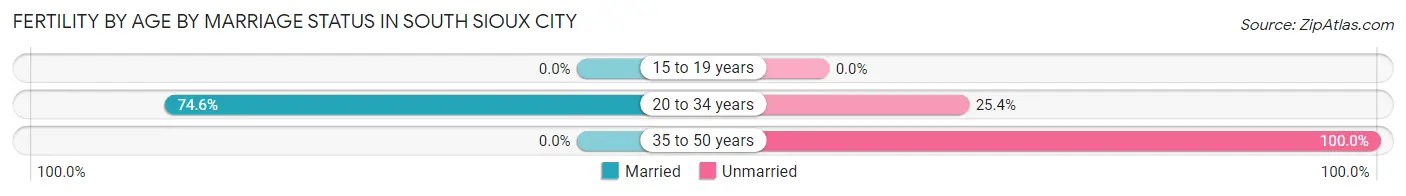
| Age Bracket | Married | Unmarried |
| 15 to 19 years | 0 (0.0%) | 0 (0.0%) |
| 20 to 34 years | 97 (74.6%) | 33 (25.4%) |
| 35 to 50 years | 0 (0.0%) | 33 (100.0%) |
| Total | 97 (59.5%) | 66 (40.5%) |
Fertility by Education in South Sioux City
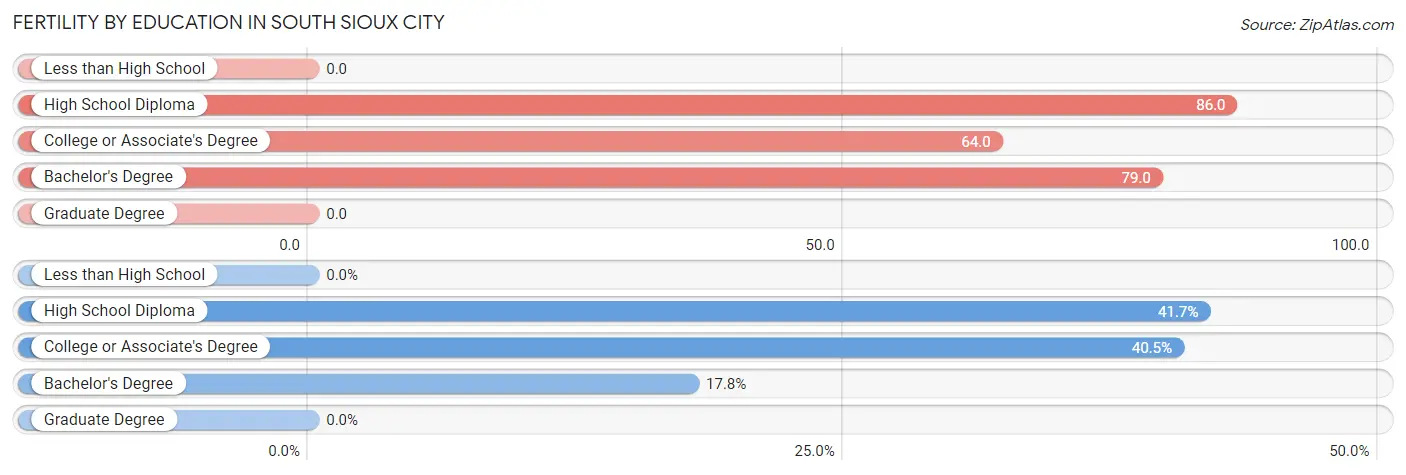
| Educational Attainment | Women with Births | Births / 1,000 Women |
| Less than High School | 0 (0.0%) | 0.0 |
| High School Diploma | 68 (41.7%) | 86.0 |
| College or Associate's Degree | 66 (40.5%) | 64.0 |
| Bachelor's Degree | 29 (17.8%) | 79.0 |
| Graduate Degree | 0 (0.0%) | 0.0 |
| Total | 163 (100.0%) | 50.0 |
Fertility by Education by Marriage Status in South Sioux City
40.5% of women with births in South Sioux City are unmarried. Women with the educational attainment of high school diploma are most likely to be married with 100.0% of them married at childbirth, while women with the educational attainment of college or associate's degree are least likely to be married with 100.0% of them unmarried at childbirth.
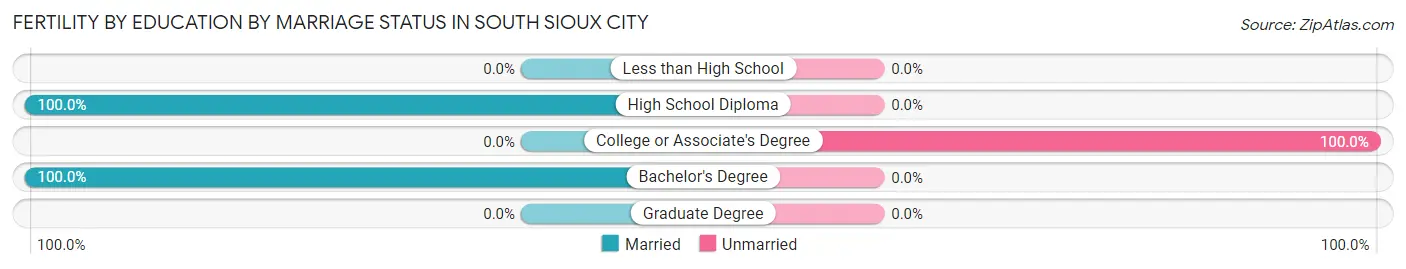
| Educational Attainment | Married | Unmarried |
| Less than High School | 0 (0.0%) | 0 (0.0%) |
| High School Diploma | 68 (100.0%) | 0 (0.0%) |
| College or Associate's Degree | 0 (0.0%) | 66 (100.0%) |
| Bachelor's Degree | 29 (100.0%) | 0 (0.0%) |
| Graduate Degree | 0 (0.0%) | 0 (0.0%) |
| Total | 97 (59.5%) | 66 (40.5%) |
Employment Characteristics in South Sioux City
Employment by Class of Employer in South Sioux City
Among the 6,824 employed individuals in South Sioux City, private company employees (5,345 | 78.3%), self-employed (not incorporated) (486 | 7.1%), and local government employees (444 | 6.5%) make up the most common classes of employment.
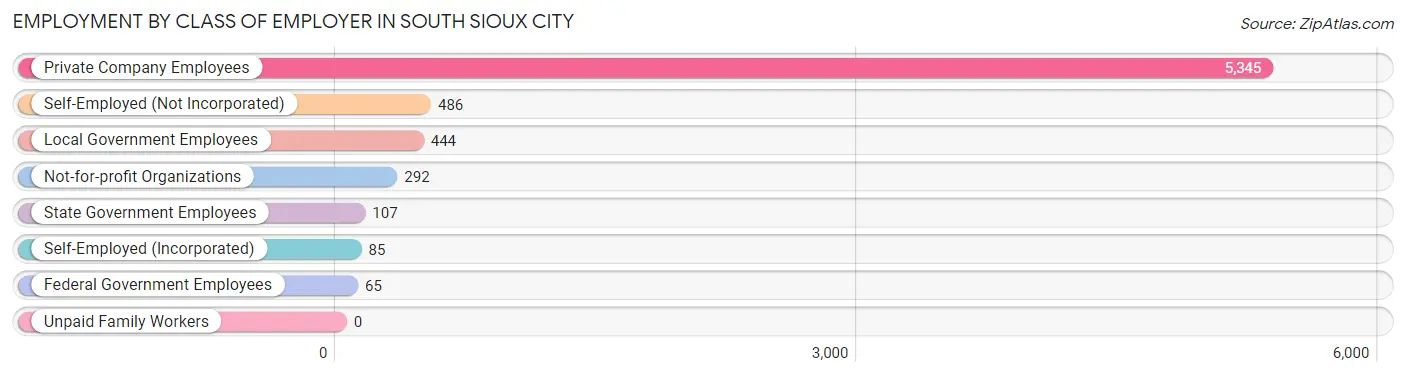
| Employer Class | # Employees | % Employees |
| Private Company Employees | 5,345 | 78.3% |
| Self-Employed (Incorporated) | 85 | 1.3% |
| Self-Employed (Not Incorporated) | 486 | 7.1% |
| Not-for-profit Organizations | 292 | 4.3% |
| Local Government Employees | 444 | 6.5% |
| State Government Employees | 107 | 1.6% |
| Federal Government Employees | 65 | 0.9% |
| Unpaid Family Workers | 0 | 0.0% |
| Total | 6,824 | 100.0% |
Employment Status by Age in South Sioux City
According to the labor force statistics for South Sioux City, out of the total population over 16 years of age (10,030), 70.8% or 7,101 individuals are in the labor force, with 2.3% or 163 of them unemployed. The age group with the highest labor force participation rate is 25 to 29 years, with 97.7% or 837 individuals in the labor force. Within the labor force, the 30 to 34 years age range has the highest percentage of unemployed individuals, with 5.2% or 40 of them being unemployed.
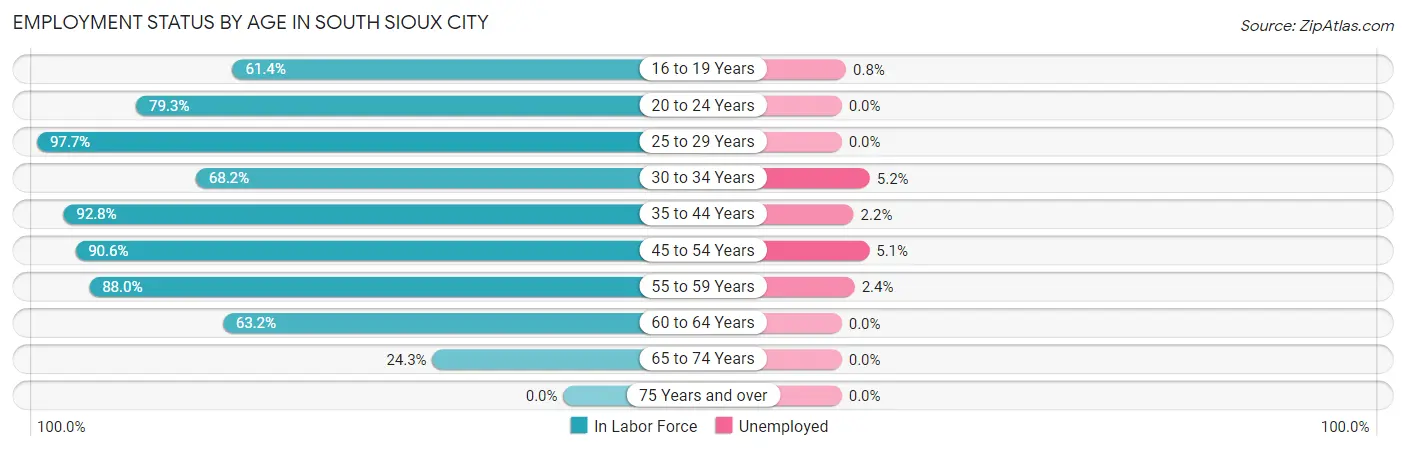
| Age Bracket | In Labor Force | Unemployed |
| 16 to 19 Years | 521 (61.4%) | 4 (0.8%) |
| 20 to 24 Years | 695 (79.3%) | 0 (0.0%) |
| 25 to 29 Years | 837 (97.7%) | 0 (0.0%) |
| 30 to 34 Years | 768 (68.2%) | 40 (5.2%) |
| 35 to 44 Years | 1,789 (92.8%) | 39 (2.2%) |
| 45 to 54 Years | 1,129 (90.6%) | 58 (5.1%) |
| 55 to 59 Years | 780 (88.0%) | 19 (2.4%) |
| 60 to 64 Years | 355 (63.2%) | 0 (0.0%) |
| 65 to 74 Years | 227 (24.3%) | 0 (0.0%) |
| 75 Years and over | 0 (0.0%) | 0 (0.0%) |
| Total | 7,101 (70.8%) | 163 (2.3%) |
Employment Status by Educational Attainment in South Sioux City
According to labor force statistics for South Sioux City, 85.7% of individuals (5,660) out of the total population between 25 and 64 years of age (6,605) are in the labor force, with 2.8% or 158 of them being unemployed. The group with the highest labor force participation rate are those with the educational attainment of bachelor's degree or higher, with 94.7% or 901 individuals in the labor force. Within the labor force, individuals with college / associate degree education have the highest percentage of unemployment, with 4.4% or 79 of them being unemployed.
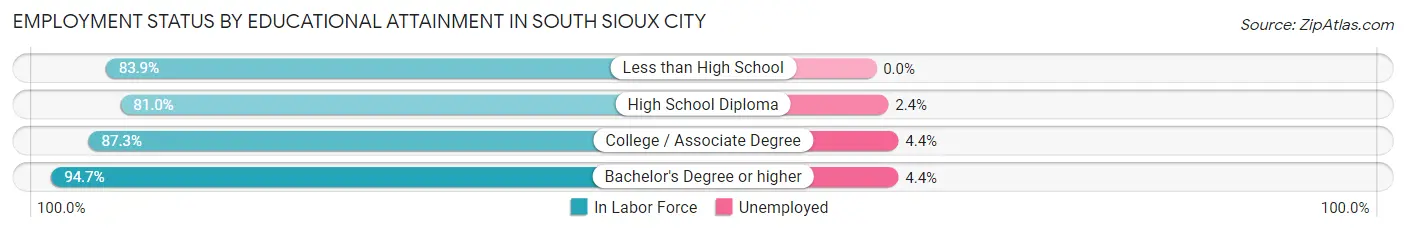
| Educational Attainment | In Labor Force | Unemployed |
| Less than High School | 1,362 (83.9%) | 0 (0.0%) |
| High School Diploma | 1,593 (81.0%) | 47 (2.4%) |
| College / Associate Degree | 1,802 (87.3%) | 91 (4.4%) |
| Bachelor's Degree or higher | 901 (94.7%) | 42 (4.4%) |
| Total | 5,660 (85.7%) | 185 (2.8%) |
Employment Occupations by Sex in South Sioux City
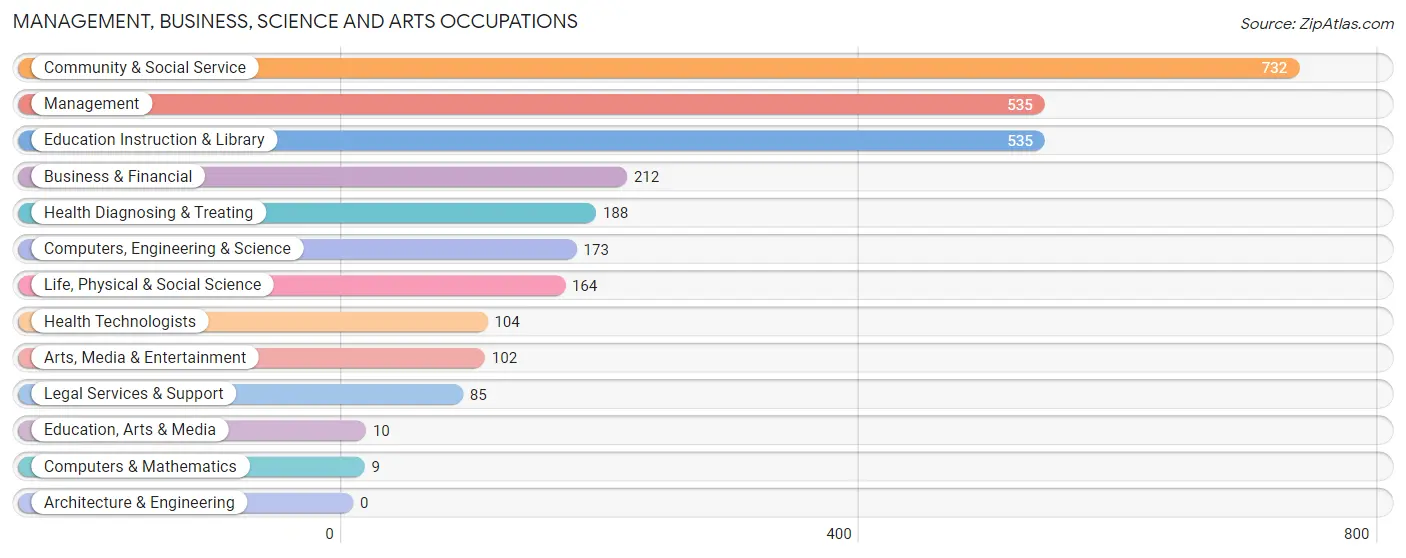
Management, Business, Science and Arts Occupations
The most common Management, Business, Science and Arts occupations in South Sioux City are Community & Social Service (732 | 10.5%), Management (535 | 7.7%), Education Instruction & Library (535 | 7.7%), Business & Financial (212 | 3.0%), and Health Diagnosing & Treating (188 | 2.7%).
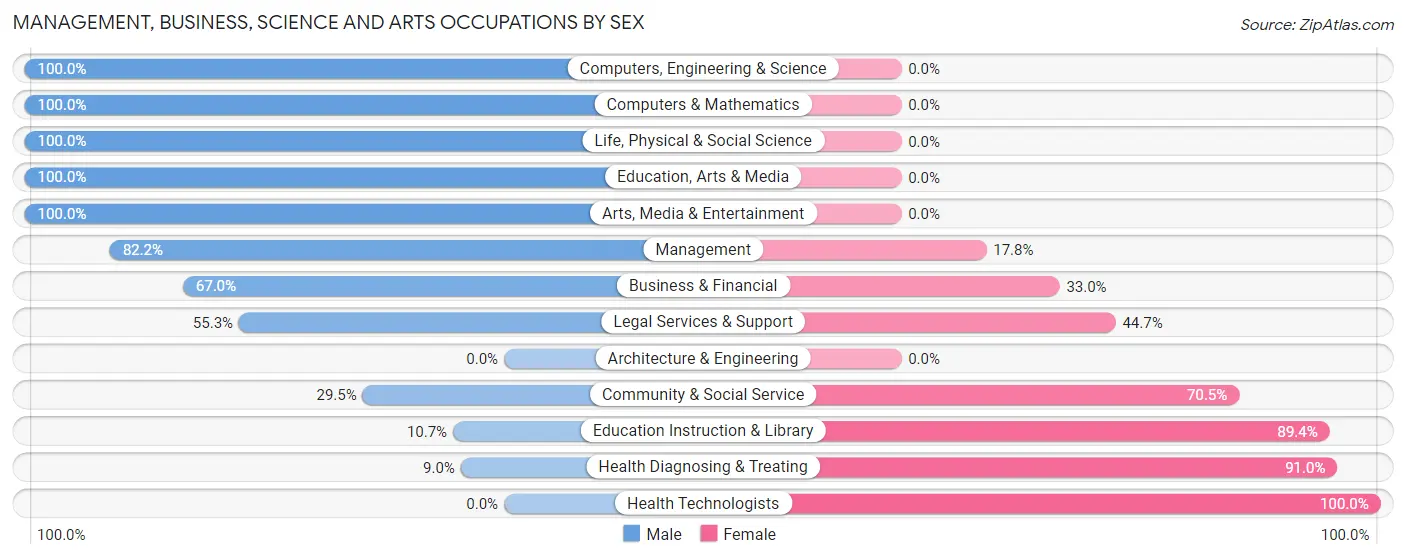
Management, Business, Science and Arts Occupations by Sex
Within the Management, Business, Science and Arts occupations in South Sioux City, the most male-oriented occupations are Computers, Engineering & Science (100.0%), Computers & Mathematics (100.0%), and Life, Physical & Social Science (100.0%), while the most female-oriented occupations are Health Technologists (100.0%), Health Diagnosing & Treating (91.0%), and Education Instruction & Library (89.3%).
| Occupation | Male | Female |
| Management | 440 (82.2%) | 95 (17.8%) |
| Business & Financial | 142 (67.0%) | 70 (33.0%) |
| Computers, Engineering & Science | 173 (100.0%) | 0 (0.0%) |
| Computers & Mathematics | 9 (100.0%) | 0 (0.0%) |
| Architecture & Engineering | 0 (0.0%) | 0 (0.0%) |
| Life, Physical & Social Science | 164 (100.0%) | 0 (0.0%) |
| Community & Social Service | 216 (29.5%) | 516 (70.5%) |
| Education, Arts & Media | 10 (100.0%) | 0 (0.0%) |
| Legal Services & Support | 47 (55.3%) | 38 (44.7%) |
| Education Instruction & Library | 57 (10.6%) | 478 (89.3%) |
| Arts, Media & Entertainment | 102 (100.0%) | 0 (0.0%) |
| Health Diagnosing & Treating | 17 (9.0%) | 171 (91.0%) |
| Health Technologists | 0 (0.0%) | 104 (100.0%) |
| Total (Category) | 988 (53.7%) | 852 (46.3%) |
| Total (Overall) | 4,055 (58.4%) | 2,885 (41.6%) |
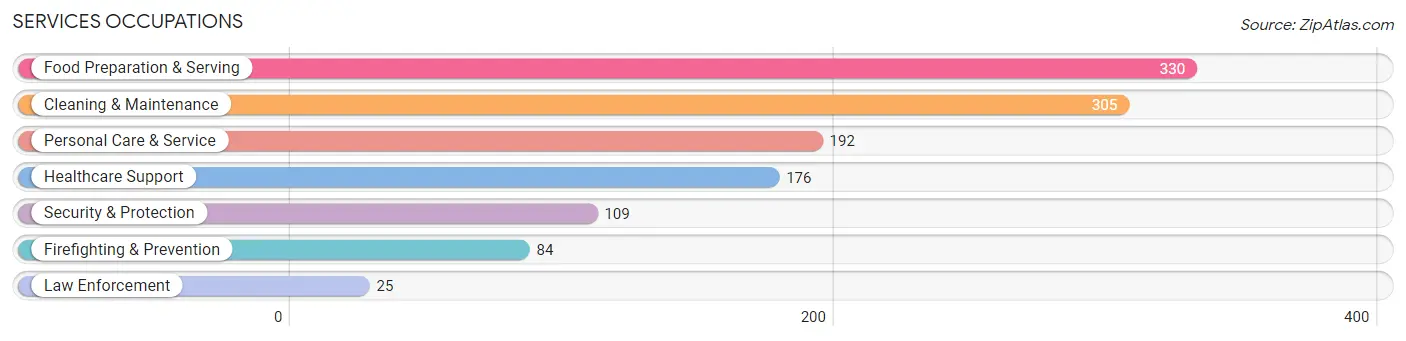
Services Occupations
The most common Services occupations in South Sioux City are Food Preparation & Serving (330 | 4.8%), Cleaning & Maintenance (305 | 4.4%), Personal Care & Service (192 | 2.8%), Healthcare Support (176 | 2.5%), and Security & Protection (109 | 1.6%).
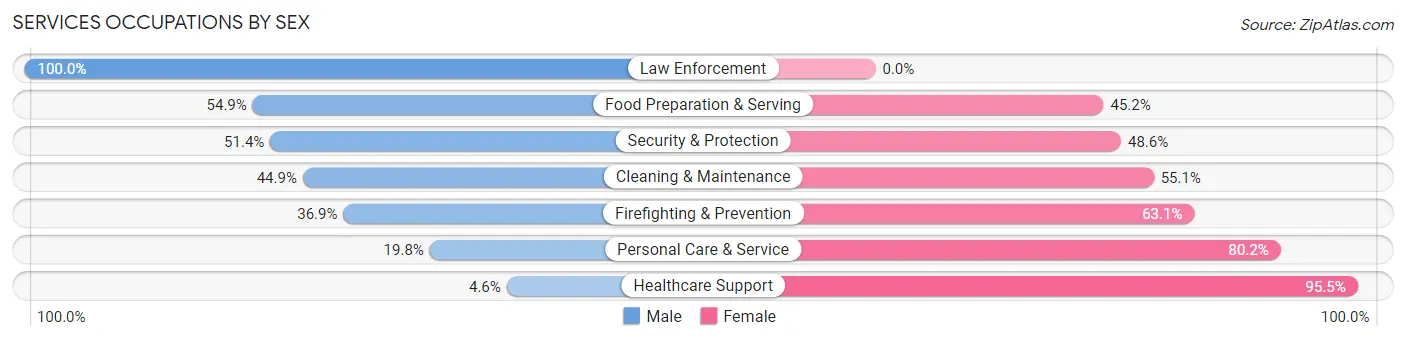
Services Occupations by Sex
Within the Services occupations in South Sioux City, the most male-oriented occupations are Law Enforcement (100.0%), Food Preparation & Serving (54.8%), and Security & Protection (51.4%), while the most female-oriented occupations are Healthcare Support (95.5%), Personal Care & Service (80.2%), and Firefighting & Prevention (63.1%).
| Occupation | Male | Female |
| Healthcare Support | 8 (4.5%) | 168 (95.5%) |
| Security & Protection | 56 (51.4%) | 53 (48.6%) |
| Firefighting & Prevention | 31 (36.9%) | 53 (63.1%) |
| Law Enforcement | 25 (100.0%) | 0 (0.0%) |
| Food Preparation & Serving | 181 (54.8%) | 149 (45.2%) |
| Cleaning & Maintenance | 137 (44.9%) | 168 (55.1%) |
| Personal Care & Service | 38 (19.8%) | 154 (80.2%) |
| Total (Category) | 420 (37.8%) | 692 (62.2%) |
| Total (Overall) | 4,055 (58.4%) | 2,885 (41.6%) |
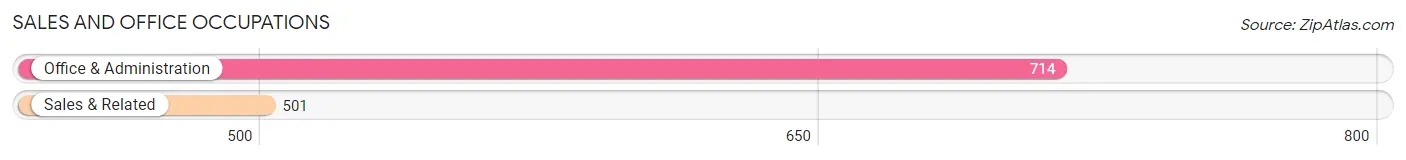
Sales and Office Occupations
The most common Sales and Office occupations in South Sioux City are Office & Administration (714 | 10.3%), and Sales & Related (501 | 7.2%).
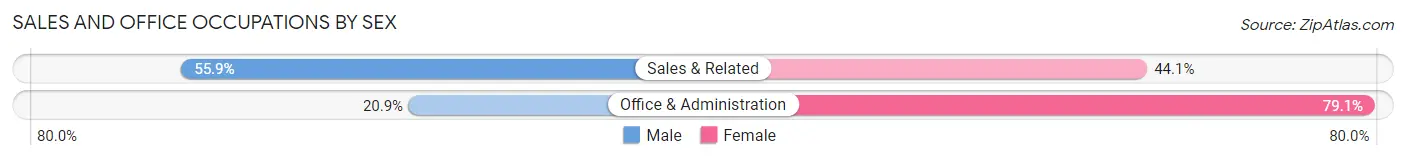
Sales and Office Occupations by Sex
| Occupation | Male | Female |
| Sales & Related | 280 (55.9%) | 221 (44.1%) |
| Office & Administration | 149 (20.9%) | 565 (79.1%) |
| Total (Category) | 429 (35.3%) | 786 (64.7%) |
| Total (Overall) | 4,055 (58.4%) | 2,885 (41.6%) |
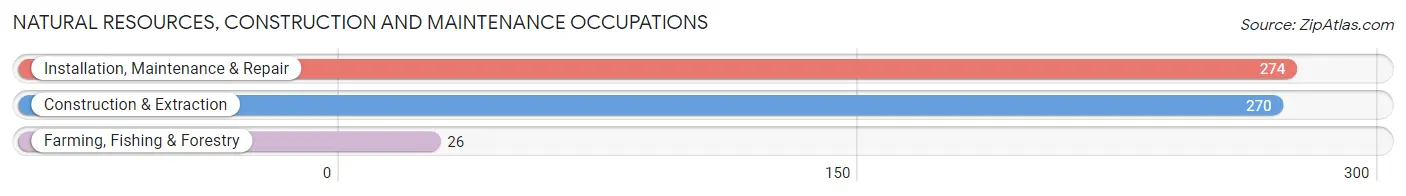
Natural Resources, Construction and Maintenance Occupations
The most common Natural Resources, Construction and Maintenance occupations in South Sioux City are Installation, Maintenance & Repair (274 | 4.0%), Construction & Extraction (270 | 3.9%), and Farming, Fishing & Forestry (26 | 0.4%).
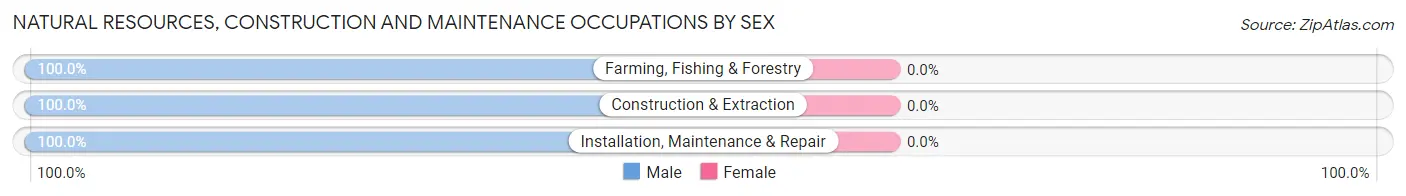
Natural Resources, Construction and Maintenance Occupations by Sex
| Occupation | Male | Female |
| Farming, Fishing & Forestry | 26 (100.0%) | 0 (0.0%) |
| Construction & Extraction | 270 (100.0%) | 0 (0.0%) |
| Installation, Maintenance & Repair | 274 (100.0%) | 0 (0.0%) |
| Total (Category) | 570 (100.0%) | 0 (0.0%) |
| Total (Overall) | 4,055 (58.4%) | 2,885 (41.6%) |
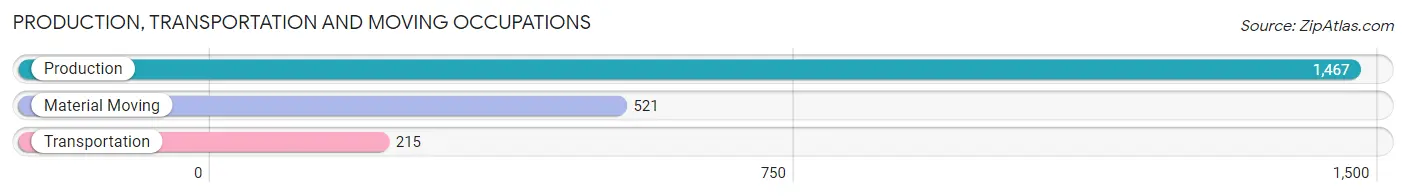
Production, Transportation and Moving Occupations
The most common Production, Transportation and Moving occupations in South Sioux City are Production (1,467 | 21.1%), Material Moving (521 | 7.5%), and Transportation (215 | 3.1%).
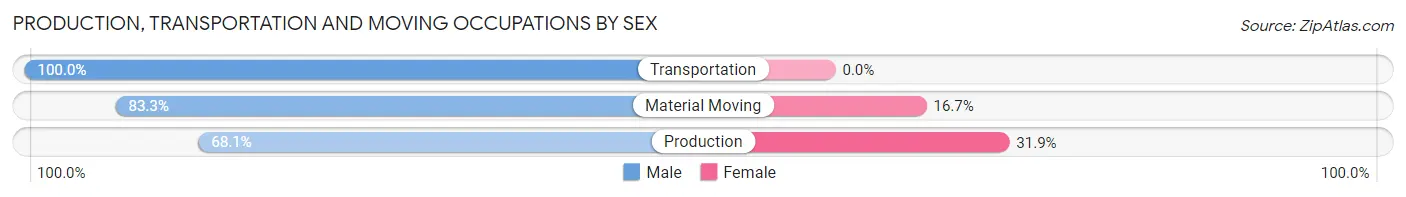
Production, Transportation and Moving Occupations by Sex
| Occupation | Male | Female |
| Production | 999 (68.1%) | 468 (31.9%) |
| Transportation | 215 (100.0%) | 0 (0.0%) |
| Material Moving | 434 (83.3%) | 87 (16.7%) |
| Total (Category) | 1,648 (74.8%) | 555 (25.2%) |
| Total (Overall) | 4,055 (58.4%) | 2,885 (41.6%) |
Employment Industries by Sex in South Sioux City
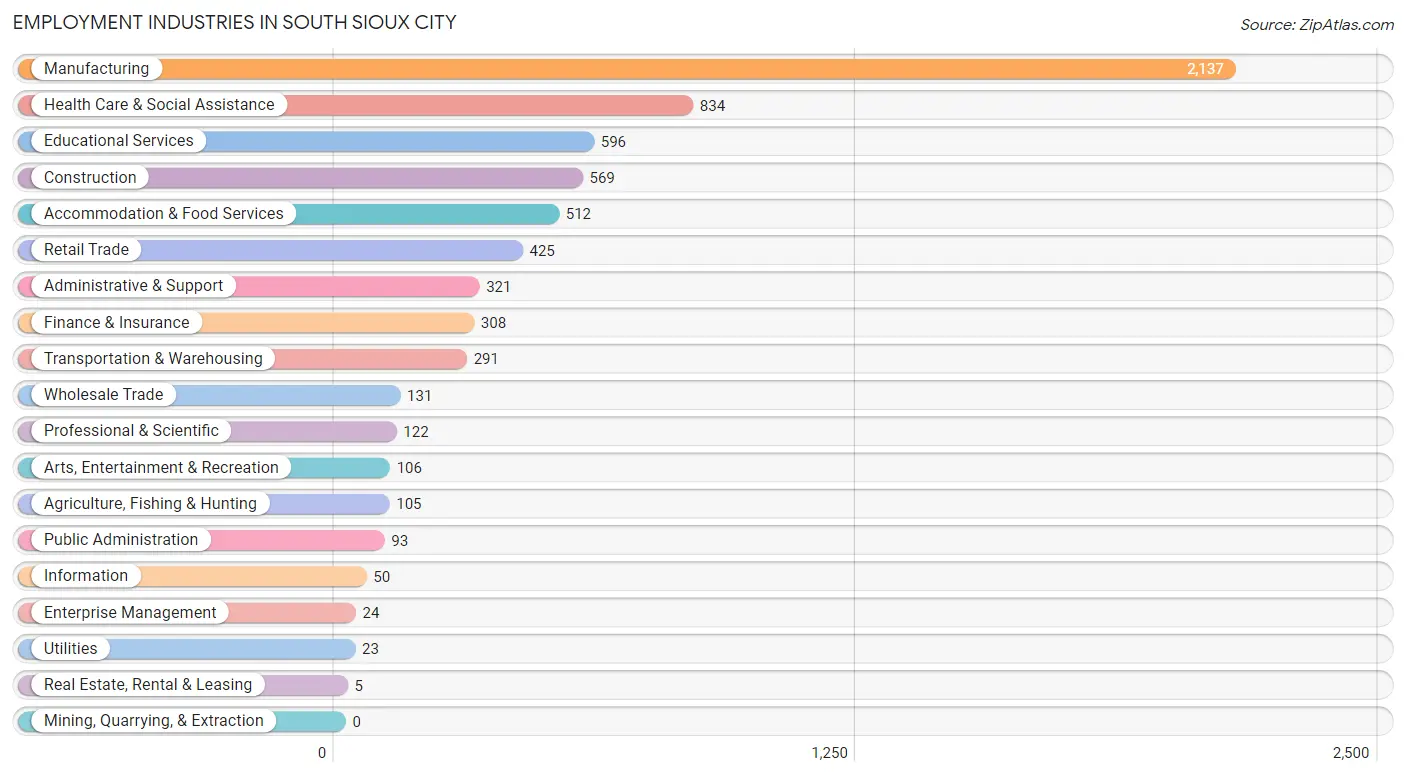
Employment Industries in South Sioux City
The major employment industries in South Sioux City include Manufacturing (2,137 | 30.8%), Health Care & Social Assistance (834 | 12.0%), Educational Services (596 | 8.6%), Construction (569 | 8.2%), and Accommodation & Food Services (512 | 7.4%).
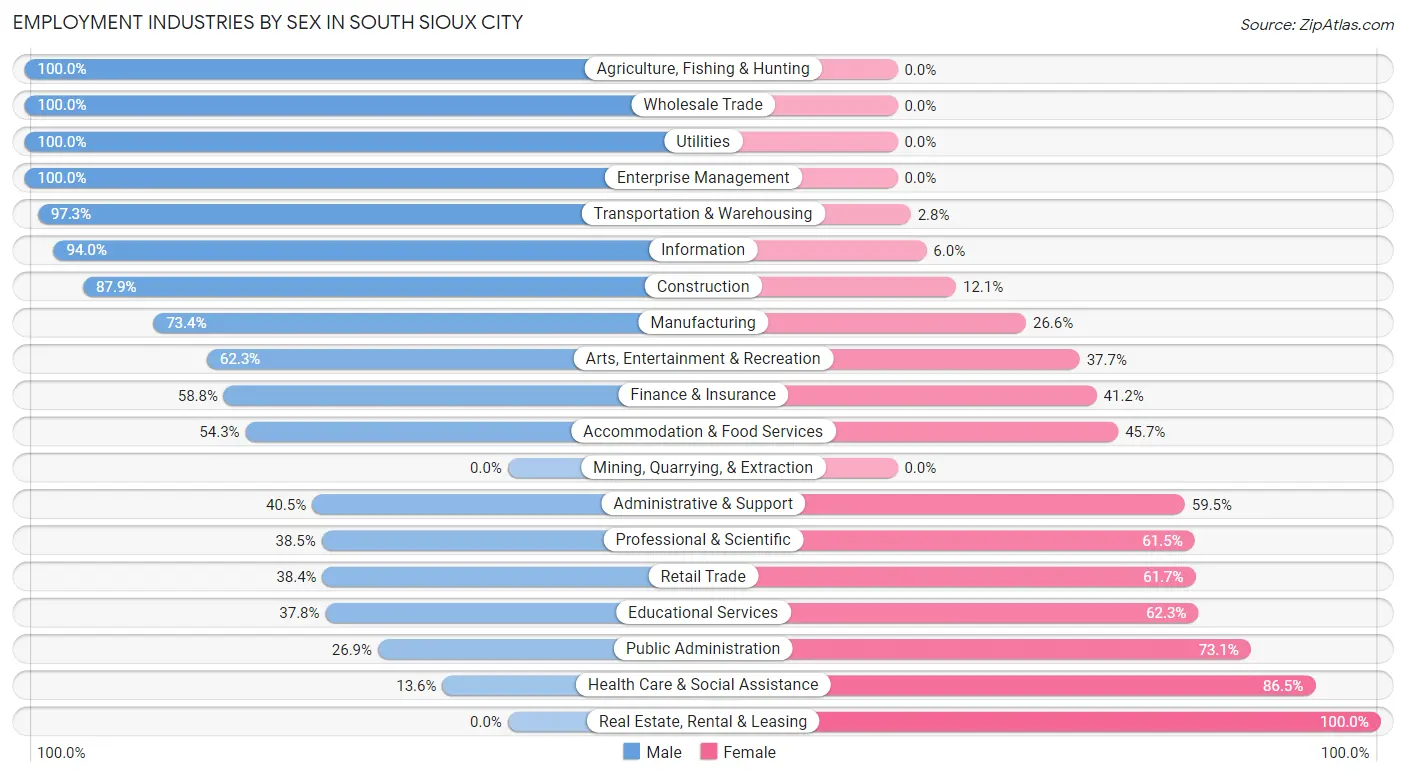
Employment Industries by Sex in South Sioux City
The South Sioux City industries that see more men than women are Agriculture, Fishing & Hunting (100.0%), Wholesale Trade (100.0%), and Utilities (100.0%), whereas the industries that tend to have a higher number of women are Real Estate, Rental & Leasing (100.0%), Health Care & Social Assistance (86.5%), and Public Administration (73.1%).
| Industry | Male | Female |
| Agriculture, Fishing & Hunting | 105 (100.0%) | 0 (0.0%) |
| Mining, Quarrying, & Extraction | 0 (0.0%) | 0 (0.0%) |
| Construction | 500 (87.9%) | 69 (12.1%) |
| Manufacturing | 1,568 (73.4%) | 569 (26.6%) |
| Wholesale Trade | 131 (100.0%) | 0 (0.0%) |
| Retail Trade | 163 (38.4%) | 262 (61.7%) |
| Transportation & Warehousing | 283 (97.3%) | 8 (2.8%) |
| Utilities | 23 (100.0%) | 0 (0.0%) |
| Information | 47 (94.0%) | 3 (6.0%) |
| Finance & Insurance | 181 (58.8%) | 127 (41.2%) |
| Real Estate, Rental & Leasing | 0 (0.0%) | 5 (100.0%) |
| Professional & Scientific | 47 (38.5%) | 75 (61.5%) |
| Enterprise Management | 24 (100.0%) | 0 (0.0%) |
| Administrative & Support | 130 (40.5%) | 191 (59.5%) |
| Educational Services | 225 (37.8%) | 371 (62.3%) |
| Health Care & Social Assistance | 113 (13.6%) | 721 (86.5%) |
| Arts, Entertainment & Recreation | 66 (62.3%) | 40 (37.7%) |
| Accommodation & Food Services | 278 (54.3%) | 234 (45.7%) |
| Public Administration | 25 (26.9%) | 68 (73.1%) |
| Total | 4,055 (58.4%) | 2,885 (41.6%) |
Education in South Sioux City
School Enrollment in South Sioux City
The most common levels of schooling among the 3,754 students in South Sioux City are middle school (1,034 | 27.5%), high school (861 | 22.9%), and elementary school (723 | 19.3%).
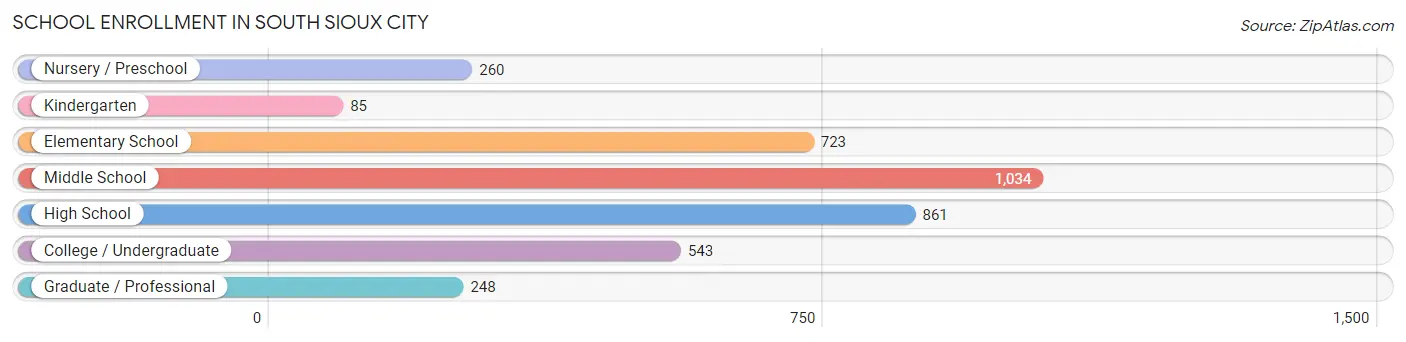
| School Level | # Students | % Students |
| Nursery / Preschool | 260 | 6.9% |
| Kindergarten | 85 | 2.3% |
| Elementary School | 723 | 19.3% |
| Middle School | 1,034 | 27.5% |
| High School | 861 | 22.9% |
| College / Undergraduate | 543 | 14.5% |
| Graduate / Professional | 248 | 6.6% |
| Total | 3,754 | 100.0% |
School Enrollment by Age by Funding Source in South Sioux City
Out of a total of 3,754 students who are enrolled in schools in South Sioux City, 375 (10.0%) attend a private institution, while the remaining 3,379 (90.0%) are enrolled in public schools. The age group of 20 to 24 year olds has the highest likelihood of being enrolled in private schools, with 61 (34.1% in the age bracket) enrolled. Conversely, the age group of 5 to 9 year old has the lowest likelihood of being enrolled in a private school, with 815 (97.5% in the age bracket) attending a public institution.
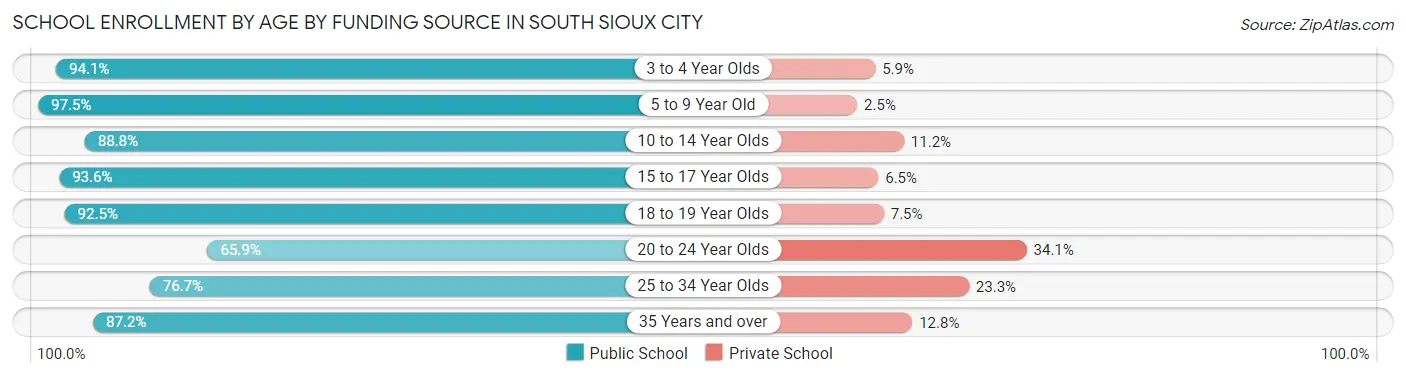
| Age Bracket | Public School | Private School |
| 3 to 4 Year Olds | 176 (94.1%) | 11 (5.9%) |
| 5 to 9 Year Old | 815 (97.5%) | 21 (2.5%) |
| 10 to 14 Year Olds | 1,171 (88.8%) | 148 (11.2%) |
| 15 to 17 Year Olds | 566 (93.5%) | 39 (6.5%) |
| 18 to 19 Year Olds | 260 (92.5%) | 21 (7.5%) |
| 20 to 24 Year Olds | 118 (65.9%) | 61 (34.1%) |
| 25 to 34 Year Olds | 230 (76.7%) | 70 (23.3%) |
| 35 Years and over | 41 (87.2%) | 6 (12.8%) |
| Total | 3,379 (90.0%) | 375 (10.0%) |
Educational Attainment by Field of Study in South Sioux City
Education (357 | 29.4%), business (276 | 22.7%), science & technology (165 | 13.6%), bio, nature & agricultural (96 | 7.9%), and arts & humanities (92 | 7.6%) are the most common fields of study among 1,216 individuals in South Sioux City who have obtained a bachelor's degree or higher.
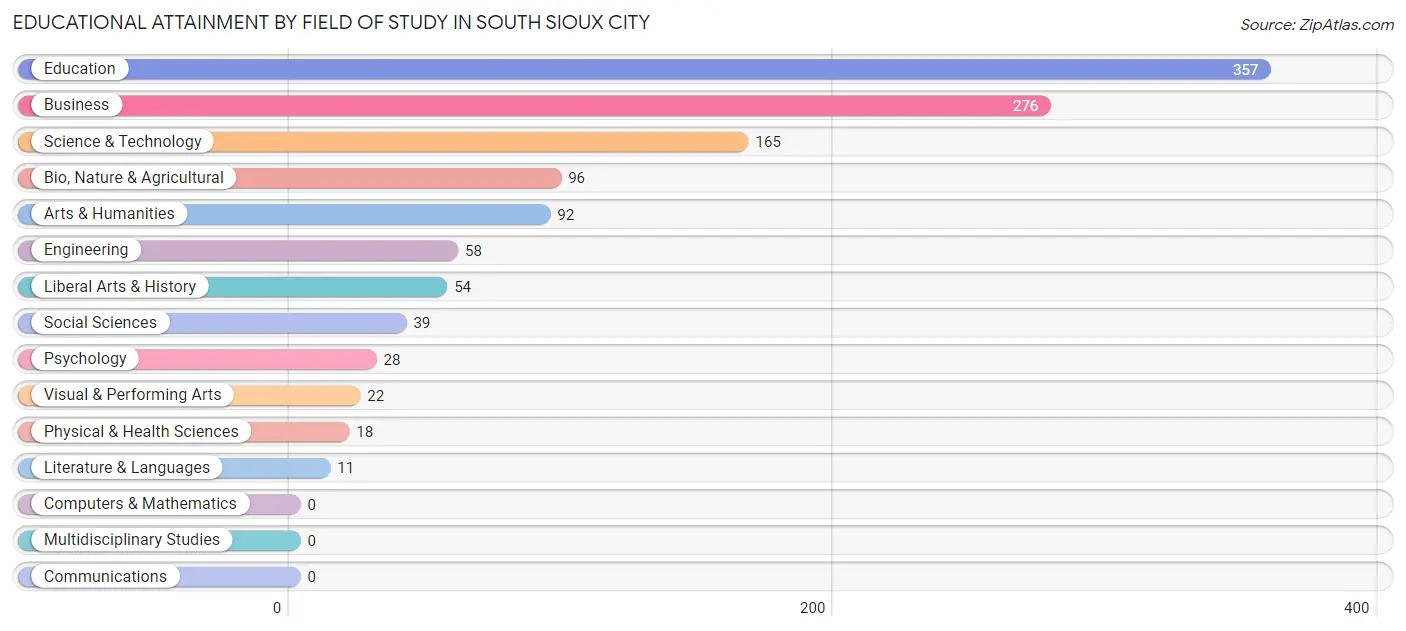
| Field of Study | # Graduates | % Graduates |
| Computers & Mathematics | 0 | 0.0% |
| Bio, Nature & Agricultural | 96 | 7.9% |
| Physical & Health Sciences | 18 | 1.5% |
| Psychology | 28 | 2.3% |
| Social Sciences | 39 | 3.2% |
| Engineering | 58 | 4.8% |
| Multidisciplinary Studies | 0 | 0.0% |
| Science & Technology | 165 | 13.6% |
| Business | 276 | 22.7% |
| Education | 357 | 29.4% |
| Literature & Languages | 11 | 0.9% |
| Liberal Arts & History | 54 | 4.4% |
| Visual & Performing Arts | 22 | 1.8% |
| Communications | 0 | 0.0% |
| Arts & Humanities | 92 | 7.6% |
| Total | 1,216 | 100.0% |
Transportation & Commute in South Sioux City
Vehicle Availability by Sex in South Sioux City
The most prevalent vehicle ownership categories in South Sioux City are males with 2 vehicles (1,843, accounting for 45.8%) and females with 2 vehicles (1,162, making up 65.9%).
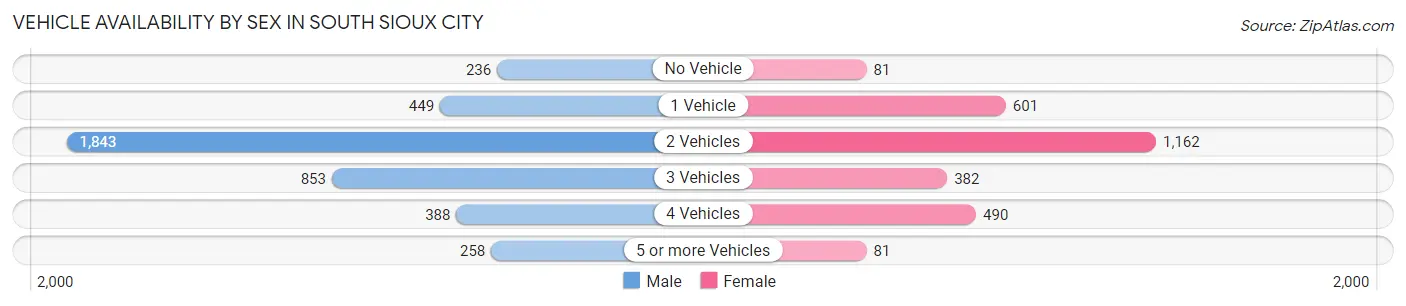
| Vehicles Available | Male | Female |
| No Vehicle | 236 (5.9%) | 81 (2.9%) |
| 1 Vehicle | 449 (11.2%) | 601 (21.5%) |
| 2 Vehicles | 1,843 (45.8%) | 1,162 (41.5%) |
| 3 Vehicles | 853 (21.2%) | 382 (13.7%) |
| 4 Vehicles | 388 (9.6%) | 490 (17.5%) |
| 5 or more Vehicles | 258 (6.4%) | 81 (2.9%) |
| Total | 4,027 (100.0%) | 2,797 (100.0%) |
Commute Time in South Sioux City
The most frequently occuring commute durations in South Sioux City are 10 to 14 minutes (1,958 commuters, 30.8%), 15 to 19 minutes (1,906 commuters, 30.0%), and 5 to 9 minutes (1,304 commuters, 20.5%).
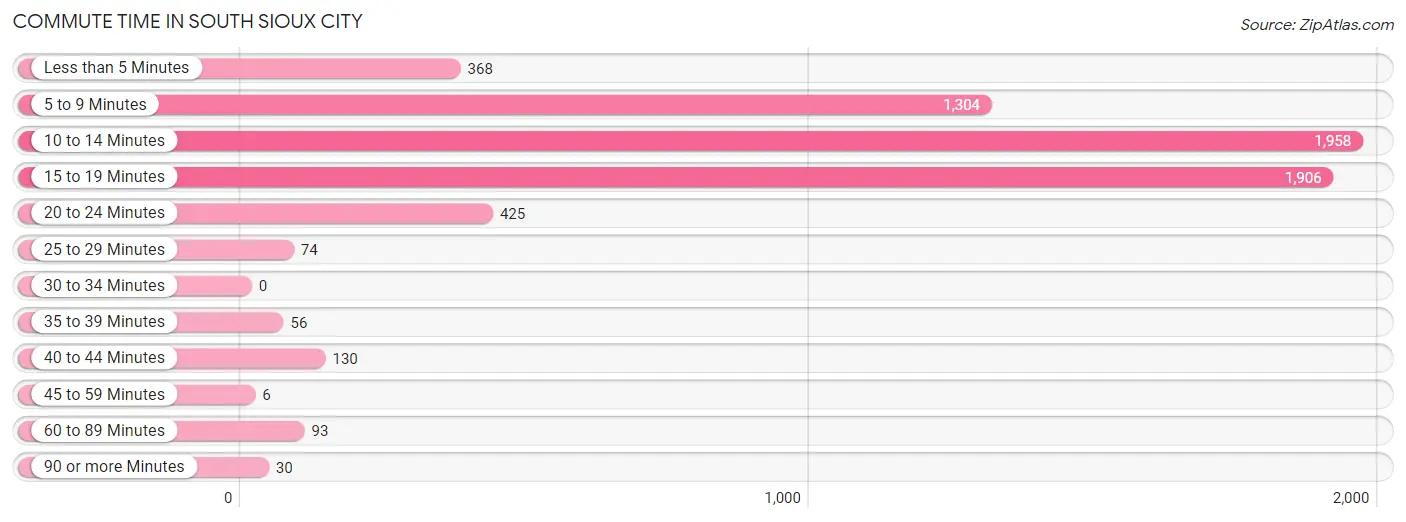
| Commute Time | # Commuters | % Commuters |
| Less than 5 Minutes | 368 | 5.8% |
| 5 to 9 Minutes | 1,304 | 20.5% |
| 10 to 14 Minutes | 1,958 | 30.8% |
| 15 to 19 Minutes | 1,906 | 30.0% |
| 20 to 24 Minutes | 425 | 6.7% |
| 25 to 29 Minutes | 74 | 1.2% |
| 30 to 34 Minutes | 0 | 0.0% |
| 35 to 39 Minutes | 56 | 0.9% |
| 40 to 44 Minutes | 130 | 2.1% |
| 45 to 59 Minutes | 6 | 0.1% |
| 60 to 89 Minutes | 93 | 1.5% |
| 90 or more Minutes | 30 | 0.5% |
Commute Time by Sex in South Sioux City
The most common commute times in South Sioux City are 10 to 14 minutes (1,263 commuters, 35.3%) for males and 5 to 9 minutes (800 commuters, 28.9%) for females.
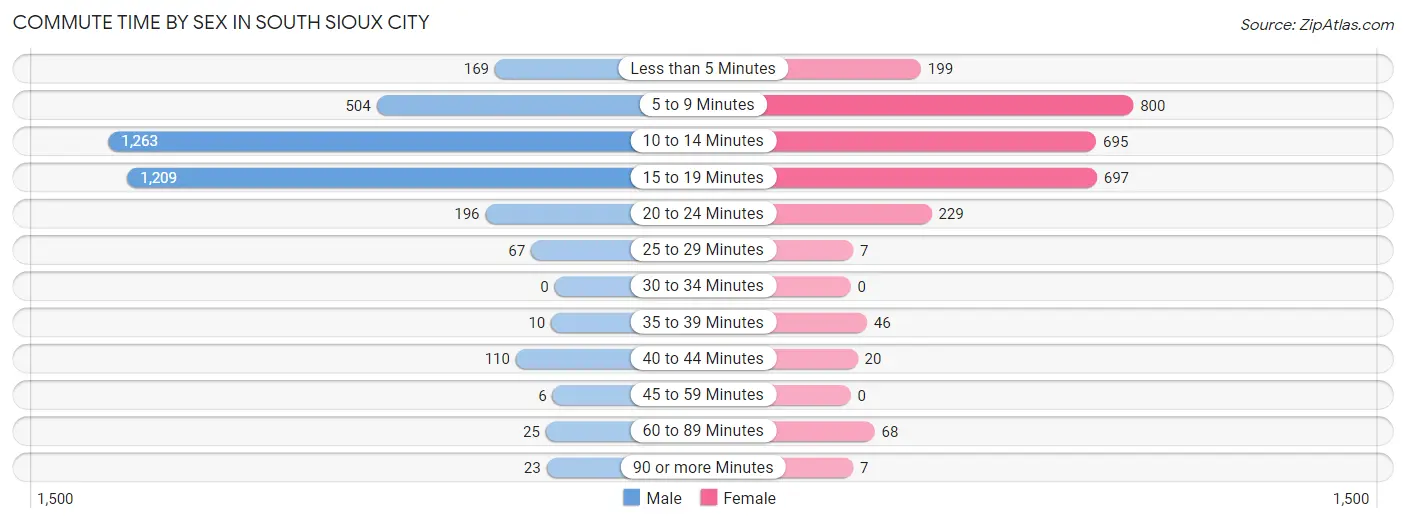
| Commute Time | Male | Female |
| Less than 5 Minutes | 169 (4.7%) | 199 (7.2%) |
| 5 to 9 Minutes | 504 (14.1%) | 800 (28.9%) |
| 10 to 14 Minutes | 1,263 (35.3%) | 695 (25.1%) |
| 15 to 19 Minutes | 1,209 (33.8%) | 697 (25.2%) |
| 20 to 24 Minutes | 196 (5.5%) | 229 (8.3%) |
| 25 to 29 Minutes | 67 (1.9%) | 7 (0.3%) |
| 30 to 34 Minutes | 0 (0.0%) | 0 (0.0%) |
| 35 to 39 Minutes | 10 (0.3%) | 46 (1.7%) |
| 40 to 44 Minutes | 110 (3.1%) | 20 (0.7%) |
| 45 to 59 Minutes | 6 (0.2%) | 0 (0.0%) |
| 60 to 89 Minutes | 25 (0.7%) | 68 (2.5%) |
| 90 or more Minutes | 23 (0.6%) | 7 (0.3%) |
Time of Departure to Work by Sex in South Sioux City
The most frequent times of departure to work in South Sioux City are 12:00 PM to 3:59 PM (719, 20.1%) for males and 7:00 AM to 7:29 AM (514, 18.6%) for females.
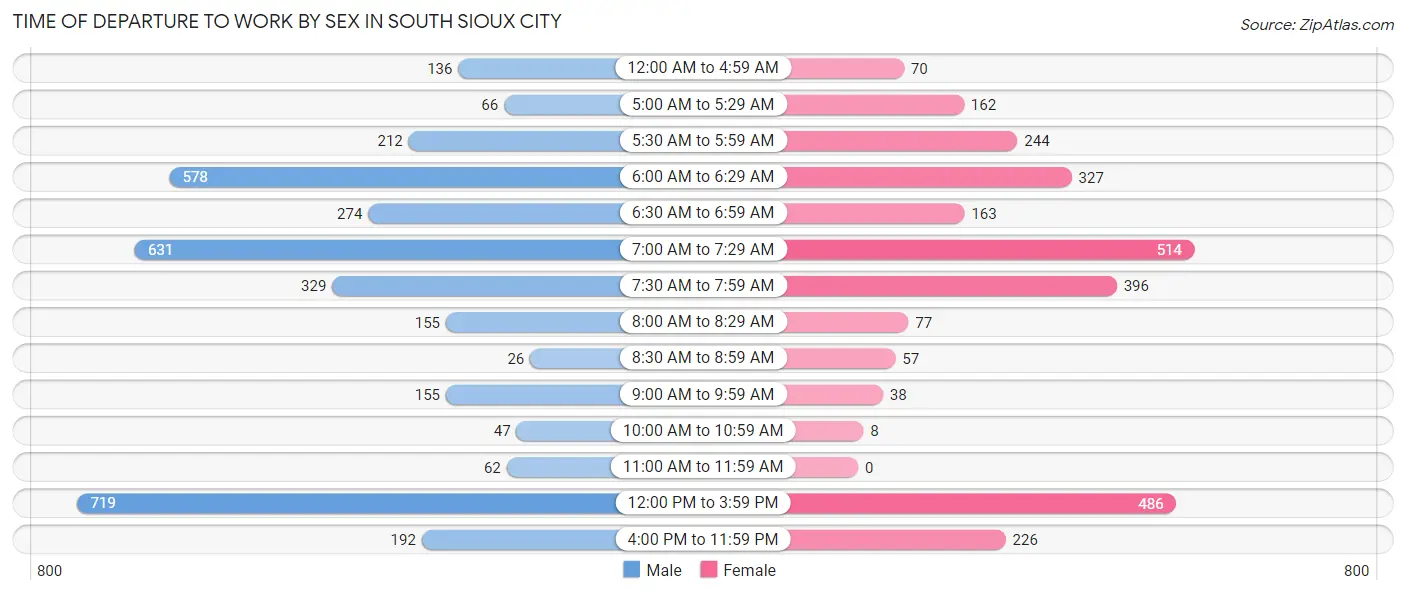
| Time of Departure | Male | Female |
| 12:00 AM to 4:59 AM | 136 (3.8%) | 70 (2.5%) |
| 5:00 AM to 5:29 AM | 66 (1.8%) | 162 (5.9%) |
| 5:30 AM to 5:59 AM | 212 (5.9%) | 244 (8.8%) |
| 6:00 AM to 6:29 AM | 578 (16.1%) | 327 (11.8%) |
| 6:30 AM to 6:59 AM | 274 (7.6%) | 163 (5.9%) |
| 7:00 AM to 7:29 AM | 631 (17.6%) | 514 (18.6%) |
| 7:30 AM to 7:59 AM | 329 (9.2%) | 396 (14.3%) |
| 8:00 AM to 8:29 AM | 155 (4.3%) | 77 (2.8%) |
| 8:30 AM to 8:59 AM | 26 (0.7%) | 57 (2.1%) |
| 9:00 AM to 9:59 AM | 155 (4.3%) | 38 (1.4%) |
| 10:00 AM to 10:59 AM | 47 (1.3%) | 8 (0.3%) |
| 11:00 AM to 11:59 AM | 62 (1.7%) | 0 (0.0%) |
| 12:00 PM to 3:59 PM | 719 (20.1%) | 486 (17.6%) |
| 4:00 PM to 11:59 PM | 192 (5.4%) | 226 (8.2%) |
| Total | 3,582 (100.0%) | 2,768 (100.0%) |
Housing Occupancy in South Sioux City
Occupancy by Ownership in South Sioux City
Of the total 4,805 dwellings in South Sioux City, owner-occupied units account for 2,751 (57.3%), while renter-occupied units make up 2,054 (42.7%).
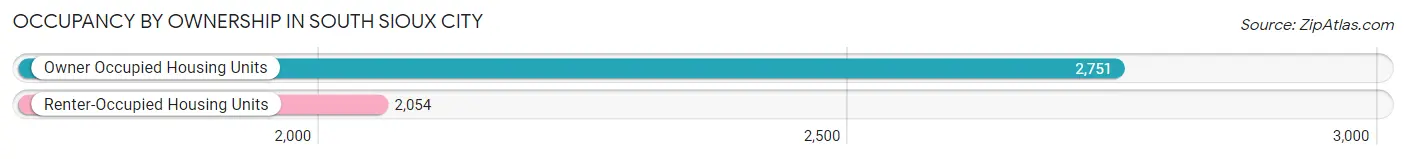
| Occupancy | # Housing Units | % Housing Units |
| Owner Occupied Housing Units | 2,751 | 57.3% |
| Renter-Occupied Housing Units | 2,054 | 42.7% |
| Total Occupied Housing Units | 4,805 | 100.0% |
Occupancy by Household Size in South Sioux City
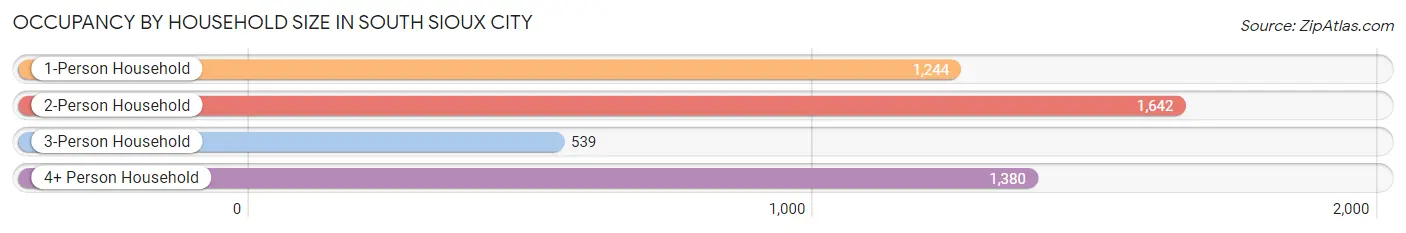
| Household Size | # Housing Units | % Housing Units |
| 1-Person Household | 1,244 | 25.9% |
| 2-Person Household | 1,642 | 34.2% |
| 3-Person Household | 539 | 11.2% |
| 4+ Person Household | 1,380 | 28.7% |
| Total Housing Units | 4,805 | 100.0% |
Occupancy by Ownership by Household Size in South Sioux City
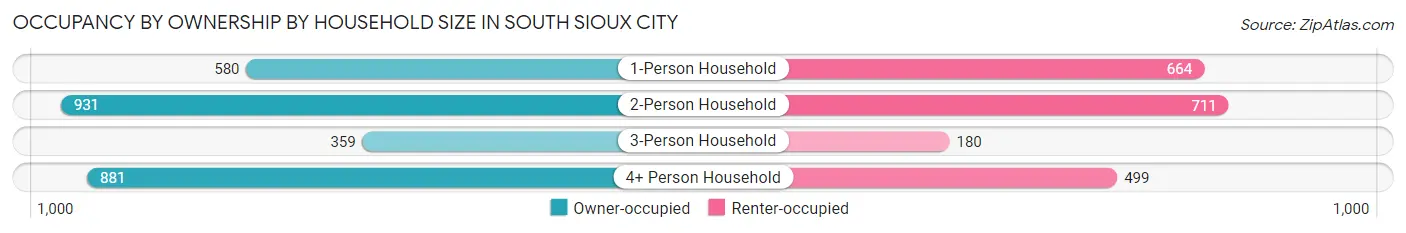
| Household Size | Owner-occupied | Renter-occupied |
| 1-Person Household | 580 (46.6%) | 664 (53.4%) |
| 2-Person Household | 931 (56.7%) | 711 (43.3%) |
| 3-Person Household | 359 (66.6%) | 180 (33.4%) |
| 4+ Person Household | 881 (63.8%) | 499 (36.2%) |
| Total Housing Units | 2,751 (57.3%) | 2,054 (42.7%) |
Occupancy by Educational Attainment in South Sioux City
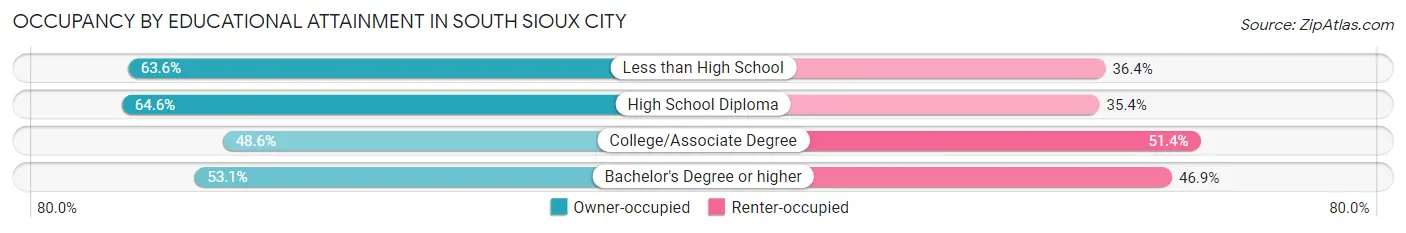
| Household Size | Owner-occupied | Renter-occupied |
| Less than High School | 607 (63.6%) | 347 (36.4%) |
| High School Diploma | 971 (64.6%) | 533 (35.4%) |
| College/Associate Degree | 784 (48.6%) | 830 (51.4%) |
| Bachelor's Degree or higher | 389 (53.1%) | 344 (46.9%) |
Occupancy by Age of Householder in South Sioux City
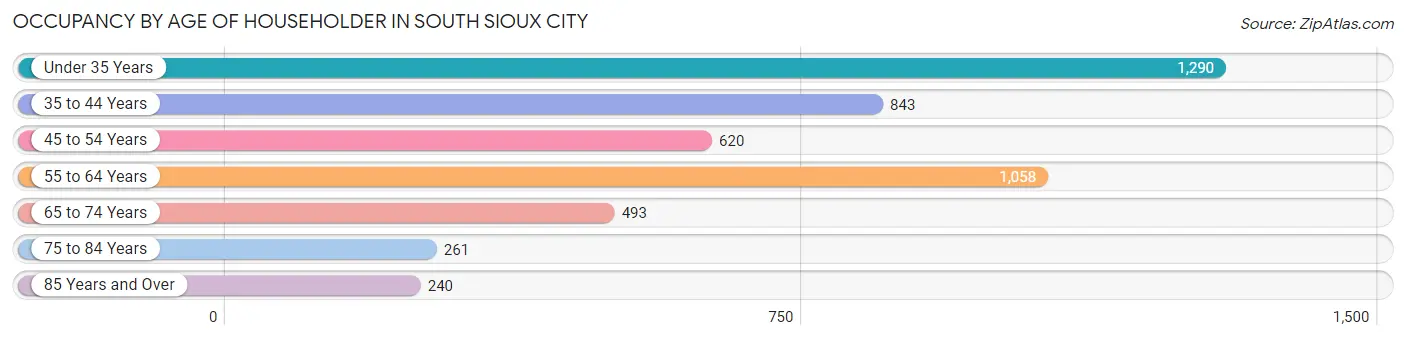
| Age Bracket | # Households | % Households |
| Under 35 Years | 1,290 | 26.9% |
| 35 to 44 Years | 843 | 17.5% |
| 45 to 54 Years | 620 | 12.9% |
| 55 to 64 Years | 1,058 | 22.0% |
| 65 to 74 Years | 493 | 10.3% |
| 75 to 84 Years | 261 | 5.4% |
| 85 Years and Over | 240 | 5.0% |
| Total | 4,805 | 100.0% |
Housing Finances in South Sioux City
Median Income by Occupancy in South Sioux City
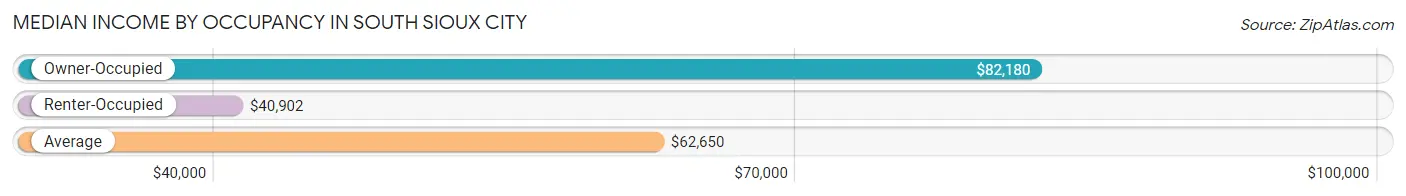
| Occupancy Type | # Households | Median Income |
| Owner-Occupied | 2,751 (57.3%) | $82,180 |
| Renter-Occupied | 2,054 (42.7%) | $40,902 |
| Average | 4,805 (100.0%) | $62,650 |
Occupancy by Householder Income Bracket in South Sioux City
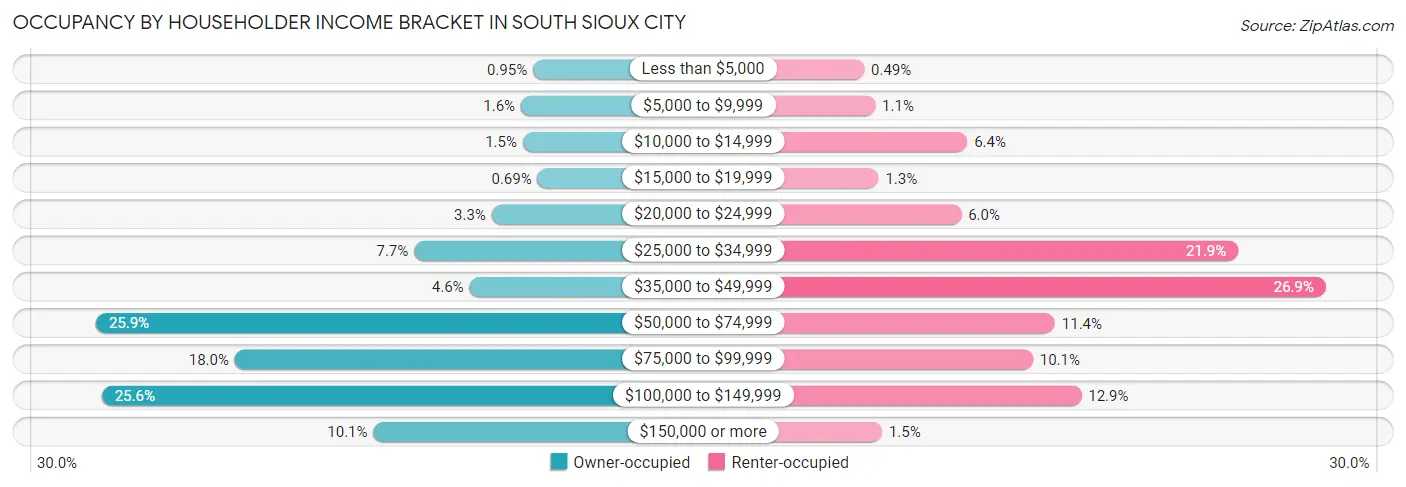
| Income Bracket | Owner-occupied | Renter-occupied |
| Less than $5,000 | 26 (0.9%) | 10 (0.5%) |
| $5,000 to $9,999 | 45 (1.6%) | 23 (1.1%) |
| $10,000 to $14,999 | 42 (1.5%) | 131 (6.4%) |
| $15,000 to $19,999 | 19 (0.7%) | 27 (1.3%) |
| $20,000 to $24,999 | 91 (3.3%) | 124 (6.0%) |
| $25,000 to $34,999 | 213 (7.7%) | 449 (21.9%) |
| $35,000 to $49,999 | 126 (4.6%) | 552 (26.9%) |
| $50,000 to $74,999 | 713 (25.9%) | 234 (11.4%) |
| $75,000 to $99,999 | 495 (18.0%) | 208 (10.1%) |
| $100,000 to $149,999 | 704 (25.6%) | 265 (12.9%) |
| $150,000 or more | 277 (10.1%) | 31 (1.5%) |
| Total | 2,751 (100.0%) | 2,054 (100.0%) |
Monthly Housing Cost Tiers in South Sioux City
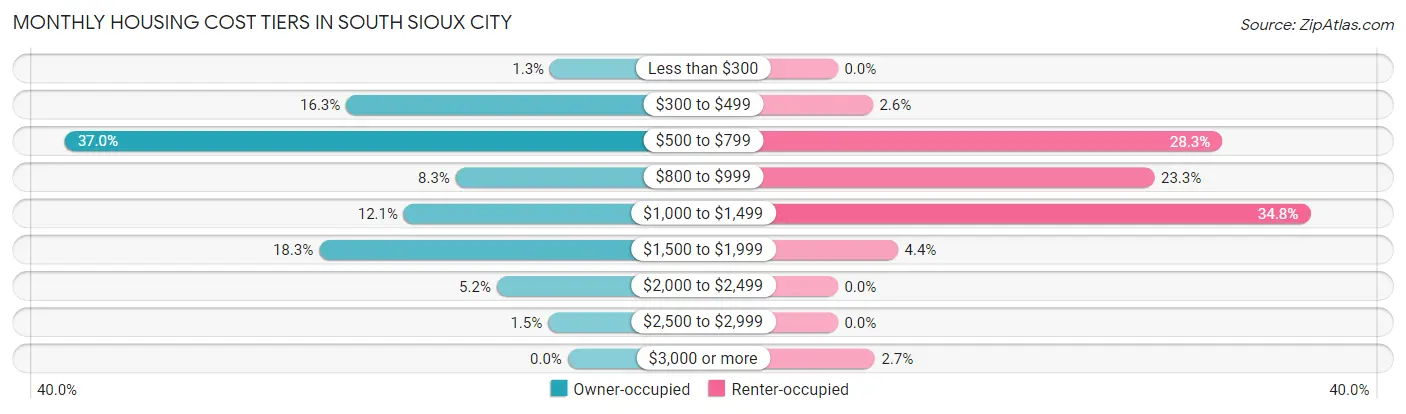
| Monthly Cost | Owner-occupied | Renter-occupied |
| Less than $300 | 36 (1.3%) | 0 (0.0%) |
| $300 to $499 | 449 (16.3%) | 53 (2.6%) |
| $500 to $799 | 1,019 (37.0%) | 582 (28.3%) |
| $800 to $999 | 227 (8.3%) | 479 (23.3%) |
| $1,000 to $1,499 | 332 (12.1%) | 715 (34.8%) |
| $1,500 to $1,999 | 504 (18.3%) | 91 (4.4%) |
| $2,000 to $2,499 | 144 (5.2%) | 0 (0.0%) |
| $2,500 to $2,999 | 40 (1.5%) | 0 (0.0%) |
| $3,000 or more | 0 (0.0%) | 56 (2.7%) |
| Total | 2,751 (100.0%) | 2,054 (100.0%) |
Physical Housing Characteristics in South Sioux City
Housing Structures in South Sioux City
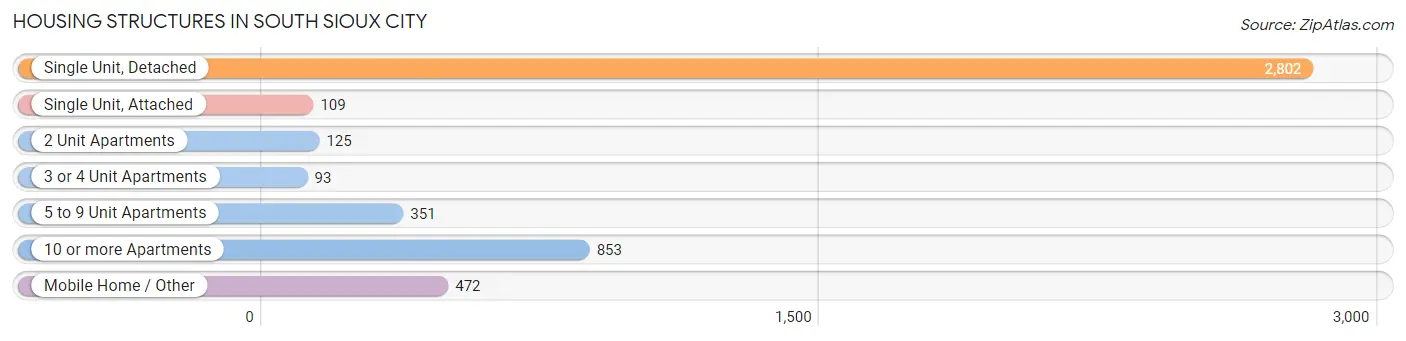
| Structure Type | # Housing Units | % Housing Units |
| Single Unit, Detached | 2,802 | 58.3% |
| Single Unit, Attached | 109 | 2.3% |
| 2 Unit Apartments | 125 | 2.6% |
| 3 or 4 Unit Apartments | 93 | 1.9% |
| 5 to 9 Unit Apartments | 351 | 7.3% |
| 10 or more Apartments | 853 | 17.7% |
| Mobile Home / Other | 472 | 9.8% |
| Total | 4,805 | 100.0% |
Housing Structures by Occupancy in South Sioux City
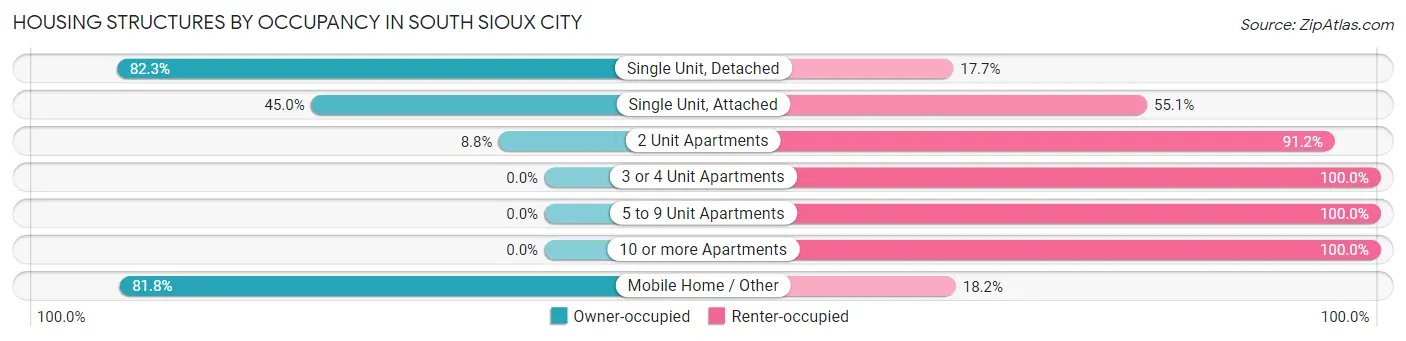
| Structure Type | Owner-occupied | Renter-occupied |
| Single Unit, Detached | 2,305 (82.3%) | 497 (17.7%) |
| Single Unit, Attached | 49 (45.0%) | 60 (55.0%) |
| 2 Unit Apartments | 11 (8.8%) | 114 (91.2%) |
| 3 or 4 Unit Apartments | 0 (0.0%) | 93 (100.0%) |
| 5 to 9 Unit Apartments | 0 (0.0%) | 351 (100.0%) |
| 10 or more Apartments | 0 (0.0%) | 853 (100.0%) |
| Mobile Home / Other | 386 (81.8%) | 86 (18.2%) |
| Total | 2,751 (57.3%) | 2,054 (42.7%) |
Housing Structures by Number of Rooms in South Sioux City
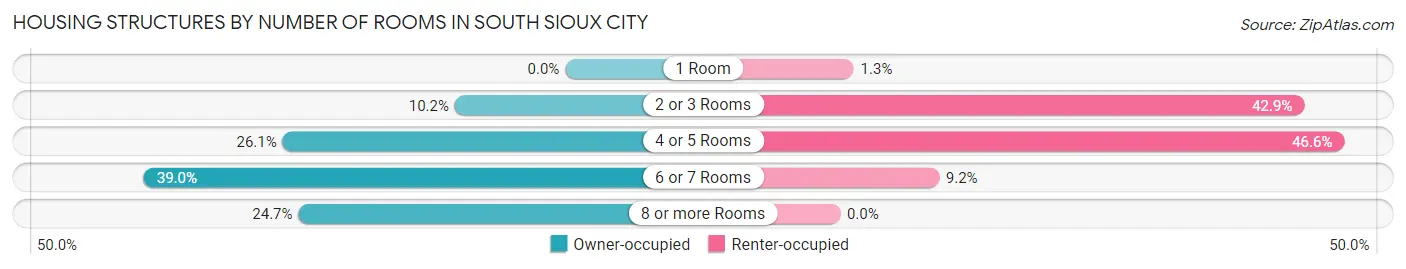
| Number of Rooms | Owner-occupied | Renter-occupied |
| 1 Room | 0 (0.0%) | 26 (1.3%) |
| 2 or 3 Rooms | 281 (10.2%) | 882 (42.9%) |
| 4 or 5 Rooms | 719 (26.1%) | 958 (46.6%) |
| 6 or 7 Rooms | 1,072 (39.0%) | 188 (9.1%) |
| 8 or more Rooms | 679 (24.7%) | 0 (0.0%) |
| Total | 2,751 (100.0%) | 2,054 (100.0%) |
Housing Structure by Heating Type in South Sioux City
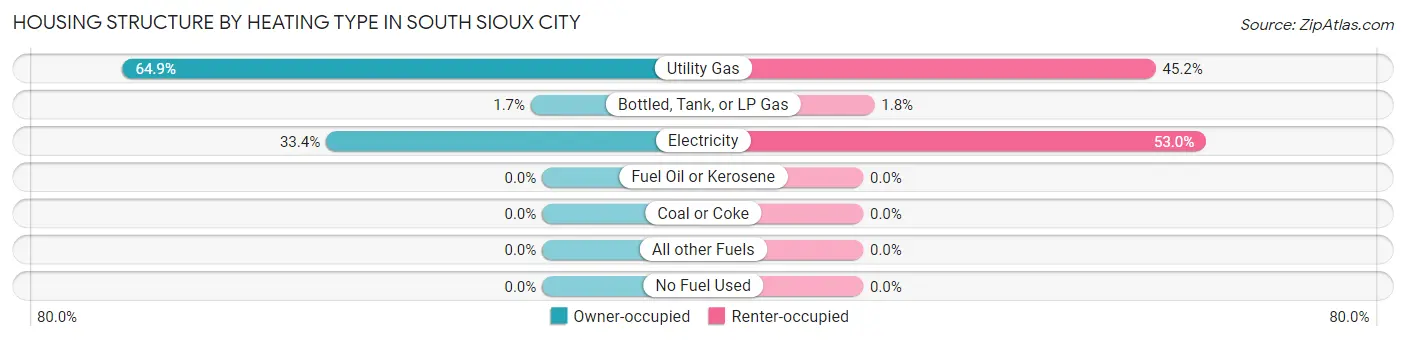
| Heating Type | Owner-occupied | Renter-occupied |
| Utility Gas | 1,784 (64.8%) | 929 (45.2%) |
| Bottled, Tank, or LP Gas | 48 (1.7%) | 36 (1.8%) |
| Electricity | 919 (33.4%) | 1,089 (53.0%) |
| Fuel Oil or Kerosene | 0 (0.0%) | 0 (0.0%) |
| Coal or Coke | 0 (0.0%) | 0 (0.0%) |
| All other Fuels | 0 (0.0%) | 0 (0.0%) |
| No Fuel Used | 0 (0.0%) | 0 (0.0%) |
| Total | 2,751 (100.0%) | 2,054 (100.0%) |
Household Vehicle Usage in South Sioux City
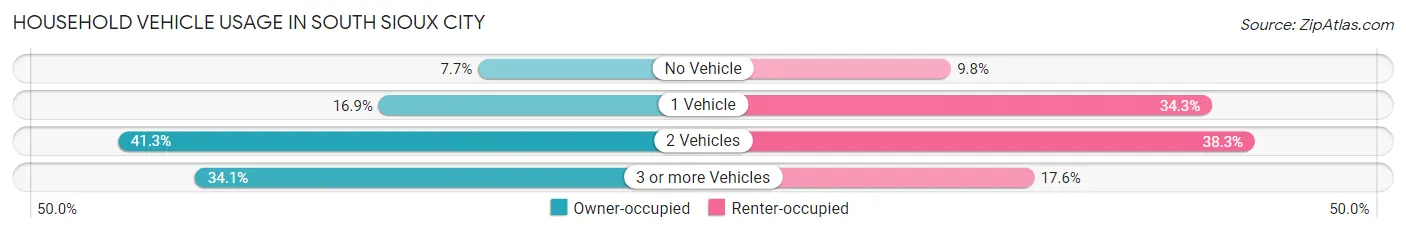
| Vehicles per Household | Owner-occupied | Renter-occupied |
| No Vehicle | 211 (7.7%) | 202 (9.8%) |
| 1 Vehicle | 466 (16.9%) | 704 (34.3%) |
| 2 Vehicles | 1,136 (41.3%) | 786 (38.3%) |
| 3 or more Vehicles | 938 (34.1%) | 362 (17.6%) |
| Total | 2,751 (100.0%) | 2,054 (100.0%) |
Real Estate & Mortgages in South Sioux City
Real Estate and Mortgage Overview in South Sioux City
| Characteristic | Without Mortgage | With Mortgage |
| Housing Units | 1,407 | 1,344 |
| Median Property Value | $133,800 | $161,300 |
| Median Household Income | $61,904 | $221 |
| Monthly Housing Costs | $559 | $0 |
| Real Estate Taxes | $2,367 | $179 |
Property Value by Mortgage Status in South Sioux City
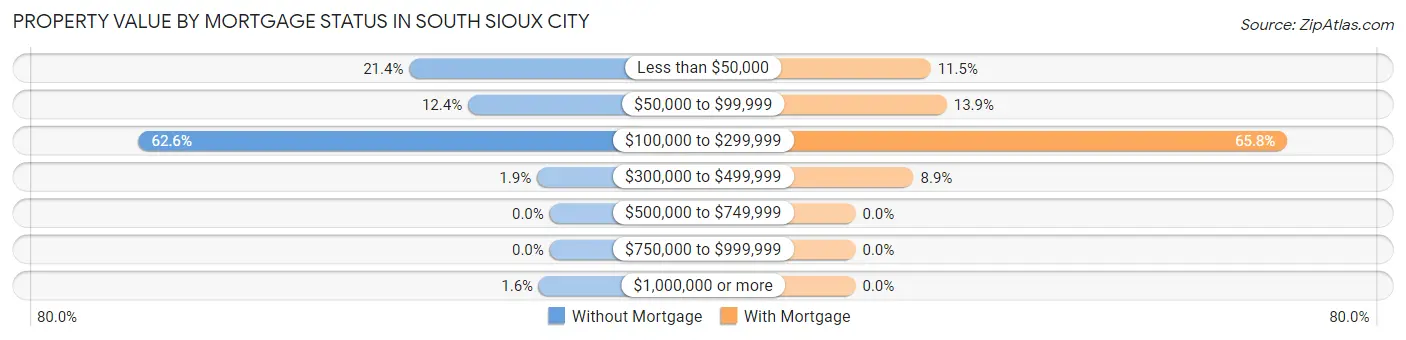
| Property Value | Without Mortgage | With Mortgage |
| Less than $50,000 | 301 (21.4%) | 154 (11.5%) |
| $50,000 to $99,999 | 175 (12.4%) | 187 (13.9%) |
| $100,000 to $299,999 | 881 (62.6%) | 884 (65.8%) |
| $300,000 to $499,999 | 27 (1.9%) | 119 (8.8%) |
| $500,000 to $749,999 | 0 (0.0%) | 0 (0.0%) |
| $750,000 to $999,999 | 0 (0.0%) | 0 (0.0%) |
| $1,000,000 or more | 23 (1.6%) | 0 (0.0%) |
| Total | 1,407 (100.0%) | 1,344 (100.0%) |
Household Income by Mortgage Status in South Sioux City
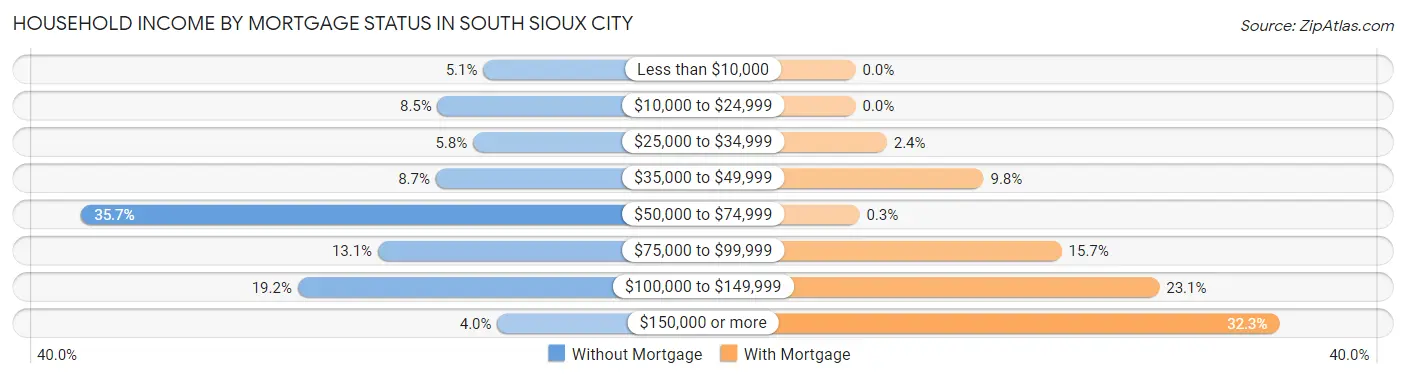
| Household Income | Without Mortgage | With Mortgage |
| Less than $10,000 | 71 (5.1%) | 0 (0.0%) |
| $10,000 to $24,999 | 120 (8.5%) | 0 (0.0%) |
| $25,000 to $34,999 | 82 (5.8%) | 32 (2.4%) |
| $35,000 to $49,999 | 122 (8.7%) | 131 (9.8%) |
| $50,000 to $74,999 | 502 (35.7%) | 4 (0.3%) |
| $75,000 to $99,999 | 184 (13.1%) | 211 (15.7%) |
| $100,000 to $149,999 | 270 (19.2%) | 311 (23.1%) |
| $150,000 or more | 56 (4.0%) | 434 (32.3%) |
| Total | 1,407 (100.0%) | 1,344 (100.0%) |
Property Value to Household Income Ratio in South Sioux City
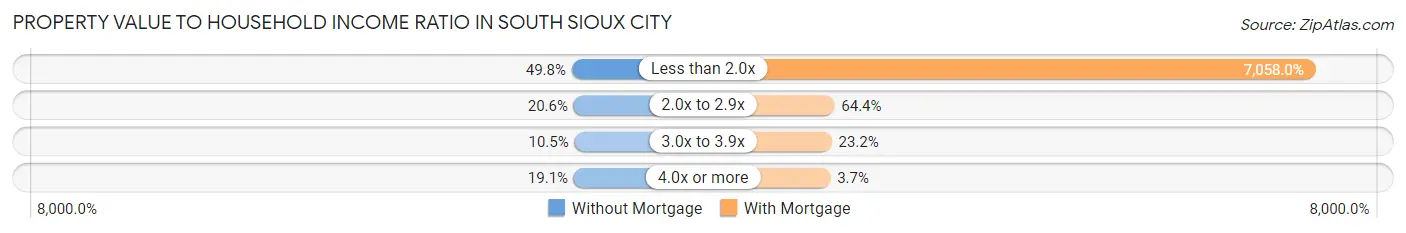
| Value-to-Income Ratio | Without Mortgage | With Mortgage |
| Less than 2.0x | 701 (49.8%) | 94,859 (7,058.0%) |
| 2.0x to 2.9x | 290 (20.6%) | 866 (64.4%) |
| 3.0x to 3.9x | 147 (10.4%) | 312 (23.2%) |
| 4.0x or more | 269 (19.1%) | 50 (3.7%) |
| Total | 1,407 (100.0%) | 1,344 (100.0%) |
Real Estate Taxes by Mortgage Status in South Sioux City
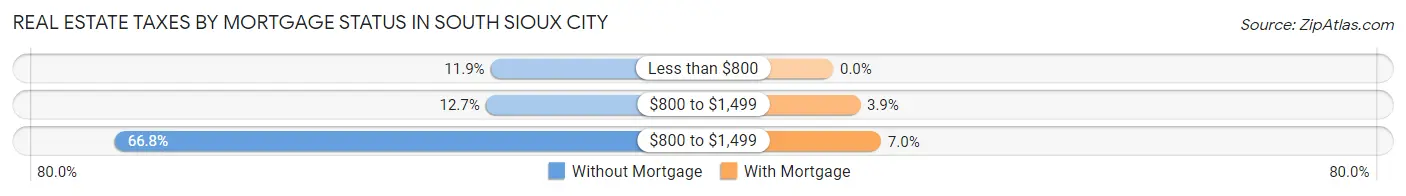
| Property Taxes | Without Mortgage | With Mortgage |
| Less than $800 | 168 (11.9%) | 0 (0.0%) |
| $800 to $1,499 | 178 (12.7%) | 53 (3.9%) |
| $800 to $1,499 | 940 (66.8%) | 94 (7.0%) |
| Total | 1,407 (100.0%) | 1,344 (100.0%) |
Health & Disability in South Sioux City
Health Insurance Coverage by Age in South Sioux City
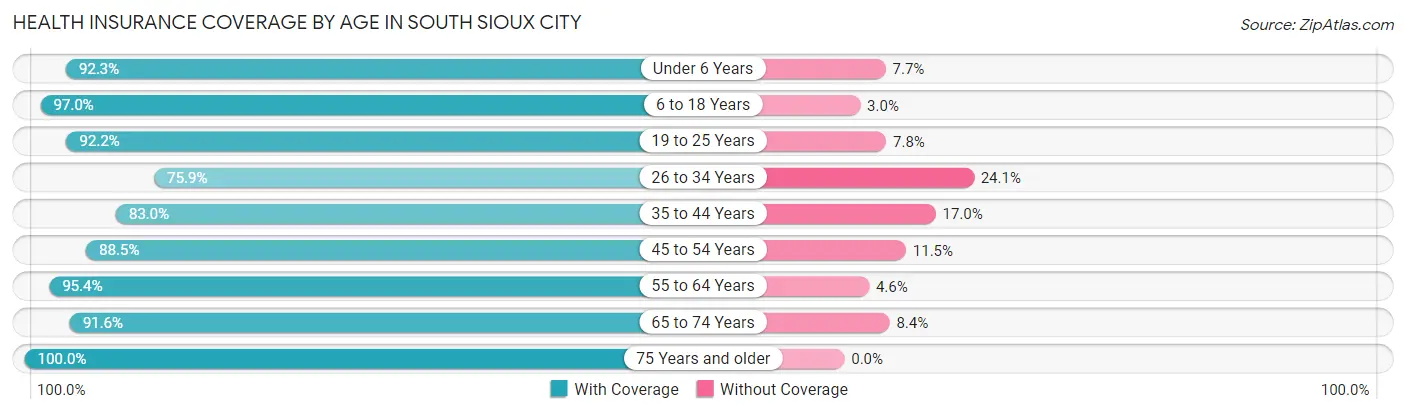
| Age Bracket | With Coverage | Without Coverage |
| Under 6 Years | 1,079 (92.3%) | 90 (7.7%) |
| 6 to 18 Years | 3,110 (97.0%) | 95 (3.0%) |
| 19 to 25 Years | 1,288 (92.2%) | 109 (7.8%) |
| 26 to 34 Years | 1,317 (75.9%) | 419 (24.1%) |
| 35 to 44 Years | 1,600 (83.0%) | 328 (17.0%) |
| 45 to 54 Years | 1,103 (88.5%) | 143 (11.5%) |
| 55 to 64 Years | 1,370 (95.4%) | 66 (4.6%) |
| 65 to 74 Years | 837 (91.6%) | 77 (8.4%) |
| 75 Years and older | 709 (100.0%) | 0 (0.0%) |
| Total | 12,413 (90.3%) | 1,327 (9.7%) |
Health Insurance Coverage by Citizenship Status in South Sioux City
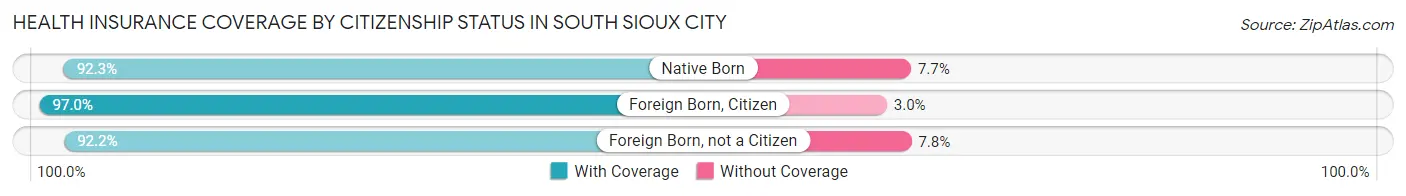
| Citizenship Status | With Coverage | Without Coverage |
| Native Born | 1,079 (92.3%) | 90 (7.7%) |
| Foreign Born, Citizen | 3,110 (97.0%) | 95 (3.0%) |
| Foreign Born, not a Citizen | 1,288 (92.2%) | 109 (7.8%) |
Health Insurance Coverage by Household Income in South Sioux City
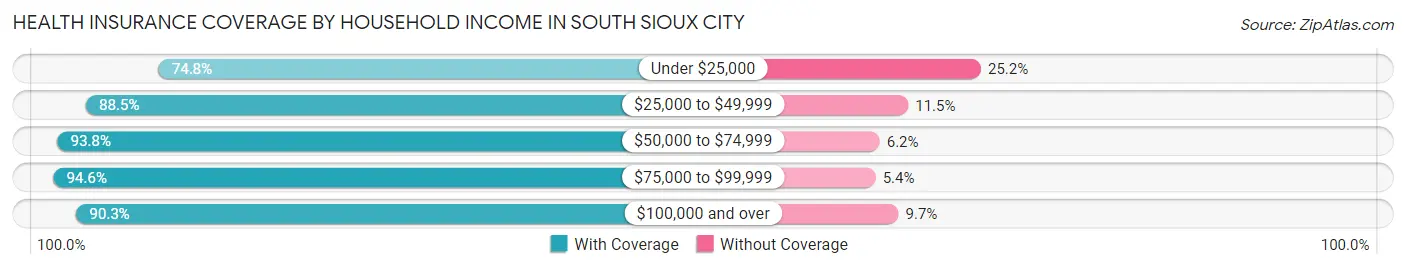
| Household Income | With Coverage | Without Coverage |
| Under $25,000 | 711 (74.8%) | 239 (25.2%) |
| $25,000 to $49,999 | 2,382 (88.5%) | 310 (11.5%) |
| $50,000 to $74,999 | 2,640 (93.8%) | 174 (6.2%) |
| $75,000 to $99,999 | 2,253 (94.6%) | 129 (5.4%) |
| $100,000 and over | 4,418 (90.3%) | 475 (9.7%) |
Public vs Private Health Insurance Coverage by Age in South Sioux City
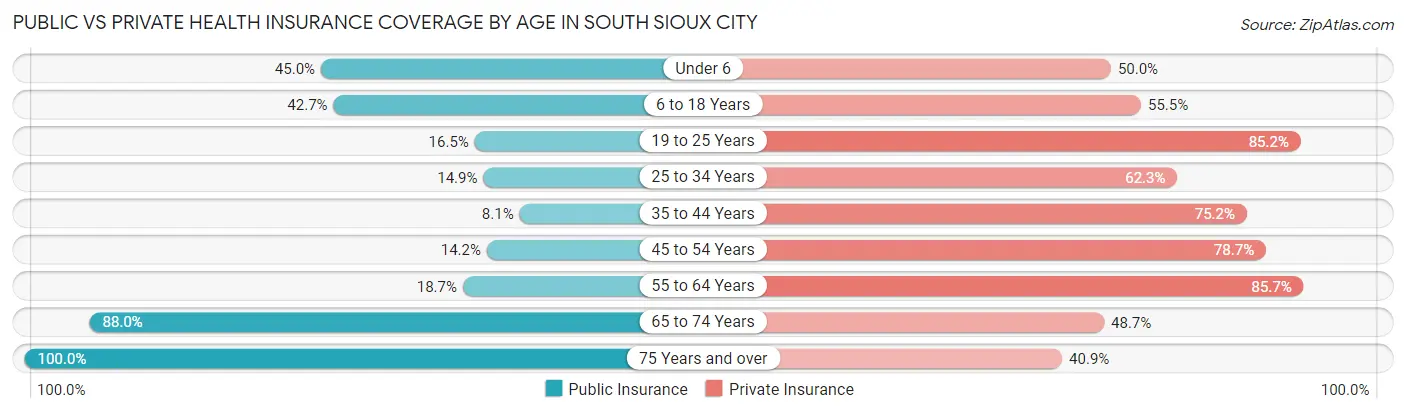
| Age Bracket | Public Insurance | Private Insurance |
| Under 6 | 526 (45.0%) | 584 (50.0%) |
| 6 to 18 Years | 1,368 (42.7%) | 1,780 (55.5%) |
| 19 to 25 Years | 230 (16.5%) | 1,190 (85.2%) |
| 25 to 34 Years | 258 (14.9%) | 1,081 (62.3%) |
| 35 to 44 Years | 157 (8.1%) | 1,449 (75.2%) |
| 45 to 54 Years | 177 (14.2%) | 981 (78.7%) |
| 55 to 64 Years | 268 (18.7%) | 1,231 (85.7%) |
| 65 to 74 Years | 804 (88.0%) | 445 (48.7%) |
| 75 Years and over | 709 (100.0%) | 290 (40.9%) |
| Total | 4,497 (32.7%) | 9,031 (65.7%) |
Disability Status by Sex by Age in South Sioux City
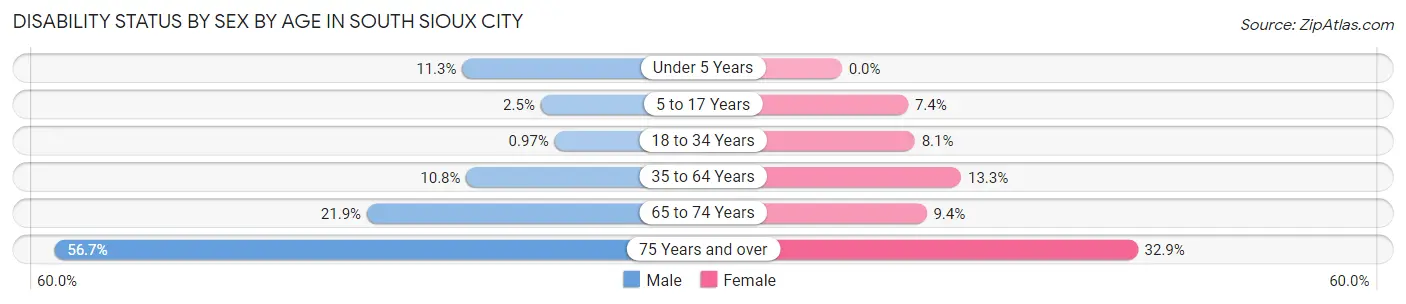
| Age Bracket | Male | Female |
| Under 5 Years | 55 (11.3%) | 0 (0.0%) |
| 5 to 17 Years | 36 (2.5%) | 118 (7.4%) |
| 18 to 34 Years | 16 (1.0%) | 143 (8.1%) |
| 35 to 64 Years | 280 (10.8%) | 268 (13.3%) |
| 65 to 74 Years | 77 (21.9%) | 53 (9.4%) |
| 75 Years and over | 161 (56.7%) | 140 (32.9%) |
Disability Class by Sex by Age in South Sioux City
Disability Class: Hearing Difficulty
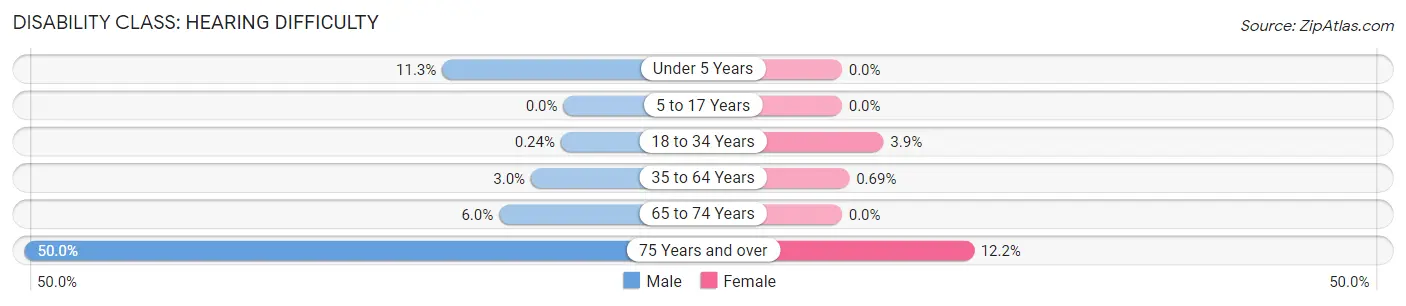
| Age Bracket | Male | Female |
| Under 5 Years | 55 (11.3%) | 0 (0.0%) |
| 5 to 17 Years | 0 (0.0%) | 0 (0.0%) |
| 18 to 34 Years | 4 (0.2%) | 68 (3.9%) |
| 35 to 64 Years | 78 (3.0%) | 14 (0.7%) |
| 65 to 74 Years | 21 (6.0%) | 0 (0.0%) |
| 75 Years and over | 142 (50.0%) | 52 (12.2%) |
Disability Class: Vision Difficulty
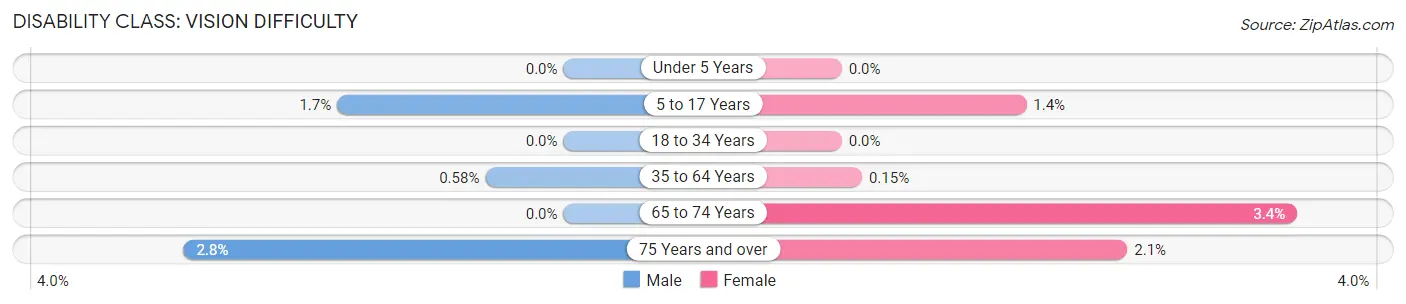
| Age Bracket | Male | Female |
| Under 5 Years | 0 (0.0%) | 0 (0.0%) |
| 5 to 17 Years | 24 (1.7%) | 22 (1.4%) |
| 18 to 34 Years | 0 (0.0%) | 0 (0.0%) |
| 35 to 64 Years | 15 (0.6%) | 3 (0.2%) |
| 65 to 74 Years | 0 (0.0%) | 19 (3.4%) |
| 75 Years and over | 8 (2.8%) | 9 (2.1%) |
Disability Class: Cognitive Difficulty
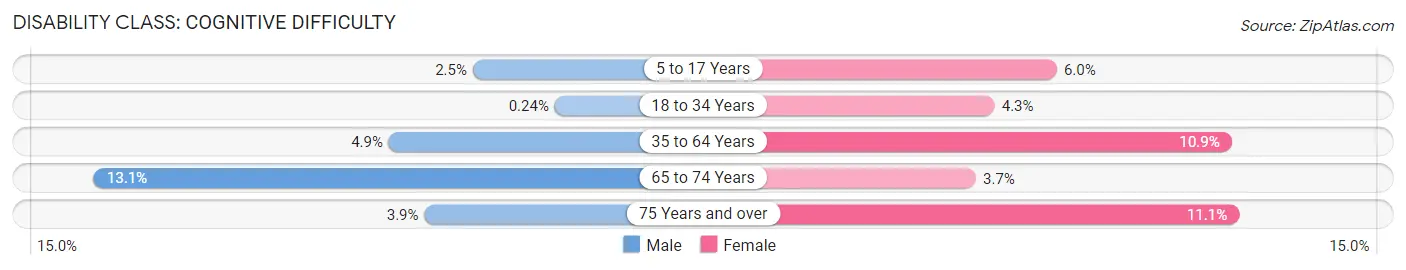
| Age Bracket | Male | Female |
| 5 to 17 Years | 36 (2.5%) | 96 (6.0%) |
| 18 to 34 Years | 4 (0.2%) | 75 (4.3%) |
| 35 to 64 Years | 126 (4.9%) | 219 (10.8%) |
| 65 to 74 Years | 46 (13.1%) | 21 (3.7%) |
| 75 Years and over | 11 (3.9%) | 47 (11.1%) |
Disability Class: Ambulatory Difficulty
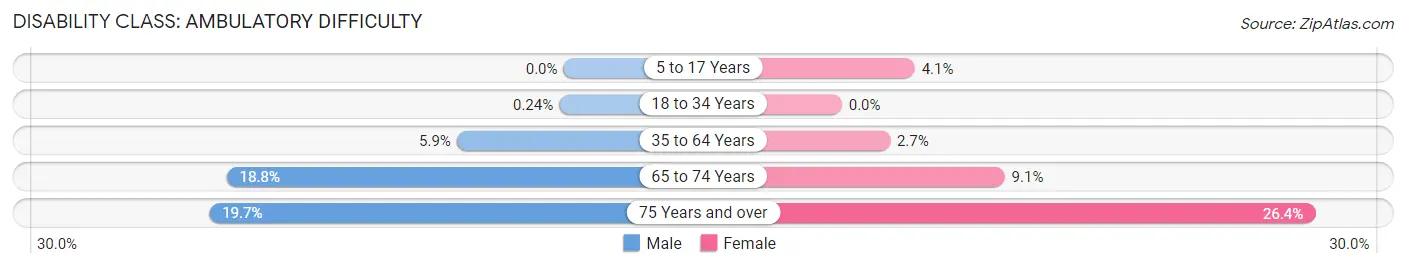
| Age Bracket | Male | Female |
| 5 to 17 Years | 0 (0.0%) | 65 (4.1%) |
| 18 to 34 Years | 4 (0.2%) | 0 (0.0%) |
| 35 to 64 Years | 154 (5.9%) | 54 (2.7%) |
| 65 to 74 Years | 66 (18.8%) | 51 (9.1%) |
| 75 Years and over | 56 (19.7%) | 112 (26.4%) |
Disability Class: Self-Care Difficulty
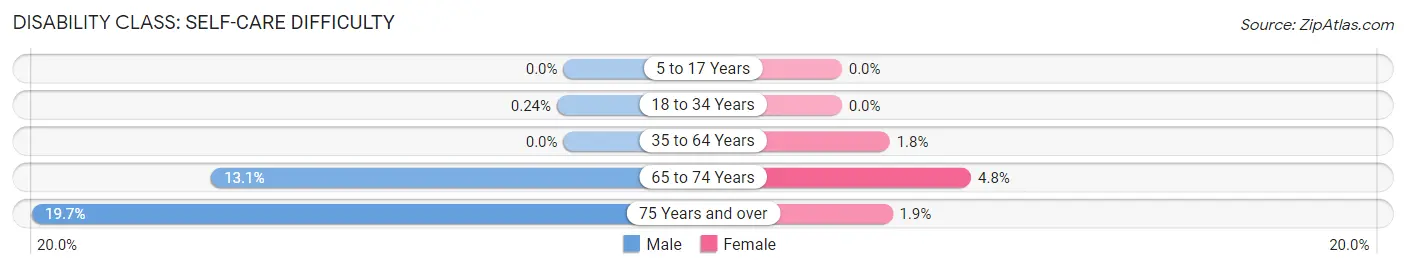
| Age Bracket | Male | Female |
| 5 to 17 Years | 0 (0.0%) | 0 (0.0%) |
| 18 to 34 Years | 4 (0.2%) | 0 (0.0%) |
| 35 to 64 Years | 0 (0.0%) | 36 (1.8%) |
| 65 to 74 Years | 46 (13.1%) | 27 (4.8%) |
| 75 Years and over | 56 (19.7%) | 8 (1.9%) |
Technology Access in South Sioux City
Computing Device Access in South Sioux City
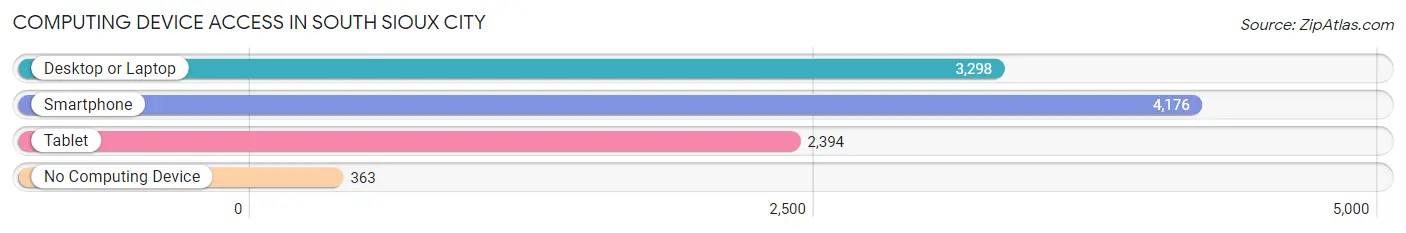
| Device Type | # Households | % Households |
| Desktop or Laptop | 3,298 | 68.6% |
| Smartphone | 4,176 | 86.9% |
| Tablet | 2,394 | 49.8% |
| No Computing Device | 363 | 7.5% |
| Total | 4,805 | 100.0% |
Internet Access in South Sioux City
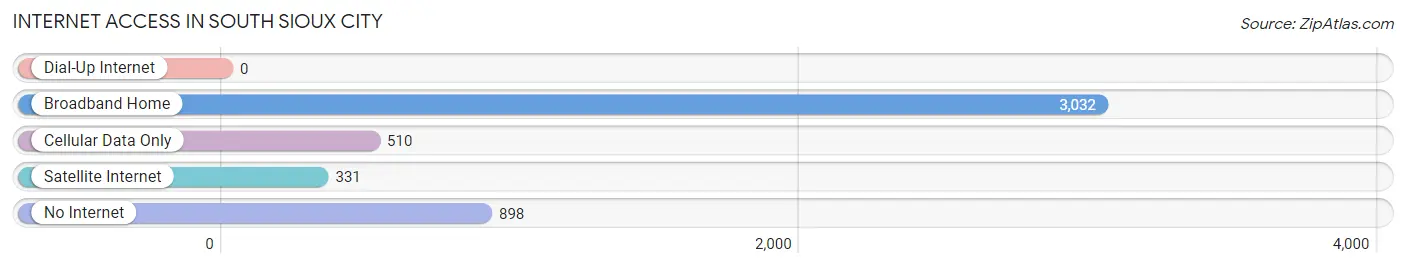
| Internet Type | # Households | % Households |
| Dial-Up Internet | 0 | 0.0% |
| Broadband Home | 3,032 | 63.1% |
| Cellular Data Only | 510 | 10.6% |
| Satellite Internet | 331 | 6.9% |
| No Internet | 898 | 18.7% |
| Total | 4,805 | 100.0% |
South Sioux City Summary
History
South Sioux City, Nebraska is a city located in Dakota County, Nebraska, United States. It is located on the Missouri River, directly across from Sioux City, Iowa. The city was founded in 1857 and incorporated in 1887. It is the largest city in Dakota County and the fourth largest city in Nebraska.
The area that is now South Sioux City was originally inhabited by the Omaha and Ponca Native American tribes. The first white settlers arrived in the area in the early 1800s. The first permanent settlement was established in 1857 by a group of settlers from Iowa. The settlement was originally known as Grand Rapids, but was later renamed South Sioux City.
The city was officially incorporated in 1887 and was named after the Sioux tribe that had inhabited the area. The city quickly grew and by the early 1900s, it had become a major transportation hub. The city was served by several railroads and was home to several large industries, including a meatpacking plant and a flour mill.
The city continued to grow throughout the 20th century and by the 2000s, it had become a major retail and commercial center. The city is now home to several large employers, including Tyson Foods, Wells Fargo, and Walmart.
Geography
South Sioux City is located in Dakota County, Nebraska, United States. It is located on the Missouri River, directly across from Sioux City, Iowa. The city has a total area of 11.2 square miles, of which 10.9 square miles is land and 0.3 square miles is water.
The city is located in the Loess Hills region of Nebraska and is surrounded by rolling hills and bluffs. The city is located in the Central Time Zone and has a humid continental climate, with hot summers and cold winters.
Economy
South Sioux City is a major economic center in the region. The city is home to several large employers, including Tyson Foods, Wells Fargo, and Walmart. The city is also home to several smaller businesses, including manufacturing, retail, and service industries.
The city is also home to several educational institutions, including South Sioux City Community College and South Sioux City High School. The city is also home to several parks and recreational facilities, including the South Sioux City Riverfront Park and the South Sioux City Municipal Golf Course.
Demographics
As of the 2010 census, South Sioux City had a population of 13,353. The racial makeup of the city was 79.2% White, 0.7% African American, 0.7% Native American, 0.7% Asian, 0.1% Pacific Islander, 16.2% from other races, and 2.4% from two or more races. Hispanic or Latino of any race were 33.2% of the population.
The median income for a household in the city was $37,917, and the median income for a family was $45,945. The per capita income for the city was $18,945. About 16.2% of families and 20.2% of the population were below the poverty line, including 28.2% of those under age 18 and 8.2% of those age 65 or over.
Common Questions
What is Per Capita Income in South Sioux City?
Per Capita income in South Sioux City is $29,668.
What is the Median Family Income in South Sioux City?
Median Family Income in South Sioux City is $77,679.
What is the Median Household income in South Sioux City?
Median Household Income in South Sioux City is $62,650.
What is Income or Wage Gap in South Sioux City?
Income or Wage Gap in South Sioux City is 38.3%.
Women in South Sioux City earn 61.7 cents for every dollar earned by a man.
What is Inequality or Gini Index in South Sioux City?
Inequality or Gini Index in South Sioux City is 0.42.
What is the Total Population of South Sioux City?
Total Population of South Sioux City is 13,835.
What is the Total Male Population of South Sioux City?
Total Male Population of South Sioux City is 6,845.
What is the Total Female Population of South Sioux City?
Total Female Population of South Sioux City is 6,990.
What is the Ratio of Males per 100 Females in South Sioux City?
There are 97.93 Males per 100 Females in South Sioux City.
What is the Ratio of Females per 100 Males in South Sioux City?
There are 102.12 Females per 100 Males in South Sioux City.
What is the Median Population Age in South Sioux City?
Median Population Age in South Sioux City is 31.0 Years.
What is the Average Family Size in South Sioux City
Average Family Size in South Sioux City is 3.6 People.
What is the Average Household Size in South Sioux City
Average Household Size in South Sioux City is 2.9 People.
How Large is the Labor Force in South Sioux City?
There are 7,101 People in the Labor Forcein in South Sioux City.
What is the Percentage of People in the Labor Force in South Sioux City?
70.8% of People are in the Labor Force in South Sioux City.
What is the Unemployment Rate in South Sioux City?
Unemployment Rate in South Sioux City is 2.3%.