Dellwood, MO Map & Demographics
Dellwood Map
Dellwood Overview
$29,720
PER CAPITA INCOME
$72,877
AVG FAMILY INCOME
$67,845
AVG HOUSEHOLD INCOME
3.1%
WAGE / INCOME GAP [ % ]
96.9¢/ $1
WAGE / INCOME GAP [ $ ]
0.35
INEQUALITY / GINI INDEX
4,899
TOTAL POPULATION
2,574
MALE POPULATION
2,325
FEMALE POPULATION
110.71
MALES / 100 FEMALES
90.33
FEMALES / 100 MALES
40.8
MEDIAN AGE
3.2
AVG FAMILY SIZE
2.5
AVG HOUSEHOLD SIZE
2,788
LABOR FORCE [ PEOPLE ]
72.2%
PERCENT IN LABOR FORCE
3.4%
UNEMPLOYMENT RATE
Income in Dellwood
Income Overview in Dellwood
Per Capita Income in Dellwood is $29,720, while median incomes of families and households are $72,877 and $67,845 respectively.
| Characteristic | Number | Measure |
| Per Capita Income | 4,899 | $29,720 |
| Median Family Income | 1,266 | $72,877 |
| Mean Family Income | 1,266 | $79,248 |
| Median Household Income | 1,923 | $67,845 |
| Mean Household Income | 1,923 | $73,853 |
| Income Deficit | 1,266 | $0 |
| Wage / Income Gap (%) | 4,899 | 3.14% |
| Wage / Income Gap ($) | 4,899 | 96.86¢ per $1 |
| Gini / Inequality Index | 4,899 | 0.35 |
Earnings by Sex in Dellwood
Average Earnings in Dellwood are $35,597, $34,911 for men and $36,041 for women, a difference of 3.1%.
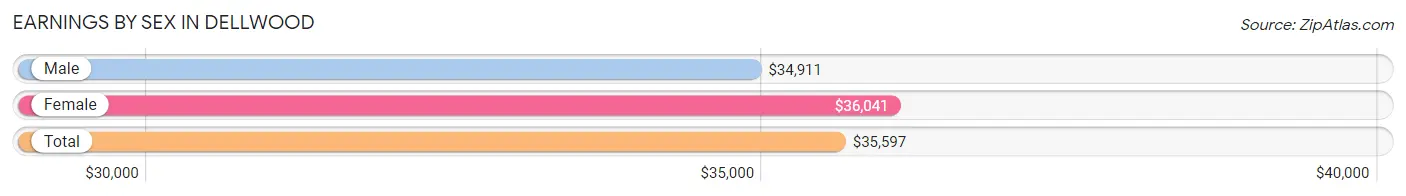
| Sex | Number | Average Earnings |
| Male | 1,250 (44.1%) | $34,911 |
| Female | 1,584 (55.9%) | $36,041 |
| Total | 2,834 (100.0%) | $35,597 |
Earnings by Sex by Income Bracket in Dellwood
The most common earnings brackets in Dellwood are $30,000 to $34,999 for men (238 | 19.0%) and $35,000 to $39,999 for women (260 | 16.4%).
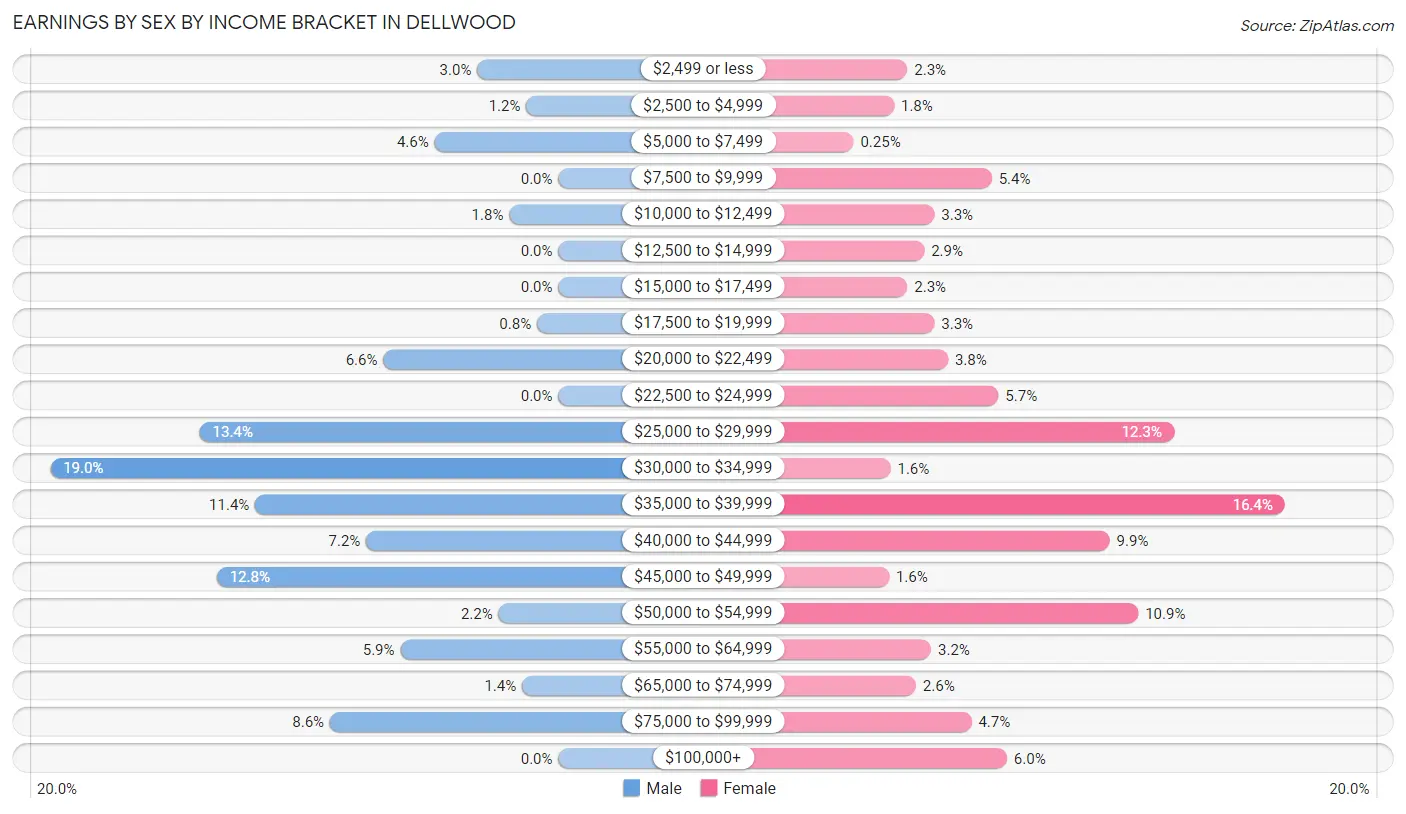
| Income | Male | Female |
| $2,499 or less | 38 (3.0%) | 36 (2.3%) |
| $2,500 to $4,999 | 15 (1.2%) | 28 (1.8%) |
| $5,000 to $7,499 | 58 (4.6%) | 4 (0.3%) |
| $7,500 to $9,999 | 0 (0.0%) | 86 (5.4%) |
| $10,000 to $12,499 | 23 (1.8%) | 52 (3.3%) |
| $12,500 to $14,999 | 0 (0.0%) | 46 (2.9%) |
| $15,000 to $17,499 | 0 (0.0%) | 36 (2.3%) |
| $17,500 to $19,999 | 10 (0.8%) | 52 (3.3%) |
| $20,000 to $22,499 | 82 (6.6%) | 60 (3.8%) |
| $22,500 to $24,999 | 0 (0.0%) | 90 (5.7%) |
| $25,000 to $29,999 | 168 (13.4%) | 194 (12.2%) |
| $30,000 to $34,999 | 238 (19.0%) | 26 (1.6%) |
| $35,000 to $39,999 | 142 (11.4%) | 260 (16.4%) |
| $40,000 to $44,999 | 90 (7.2%) | 156 (9.9%) |
| $45,000 to $49,999 | 160 (12.8%) | 25 (1.6%) |
| $50,000 to $54,999 | 28 (2.2%) | 173 (10.9%) |
| $55,000 to $64,999 | 74 (5.9%) | 50 (3.2%) |
| $65,000 to $74,999 | 17 (1.4%) | 41 (2.6%) |
| $75,000 to $99,999 | 107 (8.6%) | 74 (4.7%) |
| $100,000+ | 0 (0.0%) | 95 (6.0%) |
| Total | 1,250 (100.0%) | 1,584 (100.0%) |
Earnings by Sex by Educational Attainment in Dellwood
Average earnings in Dellwood are $37,105 for men and $36,865 for women, a difference of 0.6%. Men with an educational attainment of college or associate's degree enjoy the highest average annual earnings of $41,950, while those with bachelor's degree education earn the least with $34,314. Women with an educational attainment of graduate degree earn the most with the average annual earnings of $75,742, while those with college or associate's degree education have the smallest earnings of $29,329.
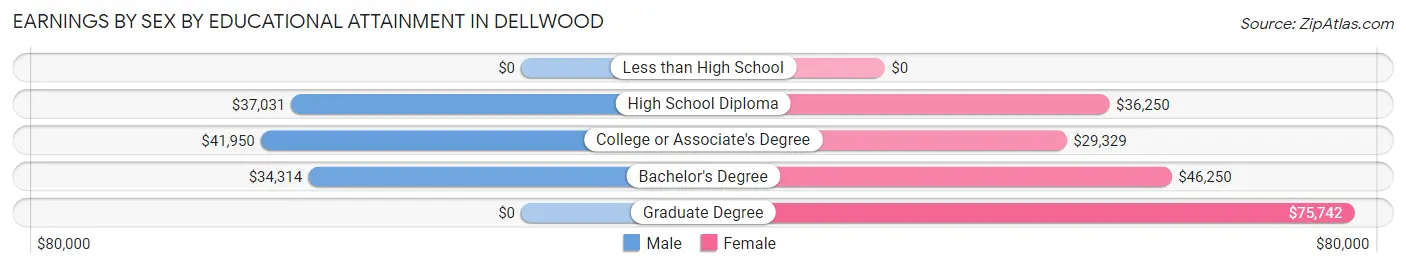
| Educational Attainment | Male Income | Female Income |
| Less than High School | - | - |
| High School Diploma | $37,031 | $36,250 |
| College or Associate's Degree | $41,950 | $29,329 |
| Bachelor's Degree | $34,314 | $46,250 |
| Graduate Degree | - | - |
| Total | $37,105 | $36,865 |
Family Income in Dellwood
Family Income Brackets in Dellwood
According to the Dellwood family income data, there are 349 families falling into the $75,000 to $99,999 income range, which is the most common income bracket and makes up 27.6% of all families. Conversely, the less than $10,000 income bracket is the least frequent group with only 10 families (0.8%) belonging to this category.
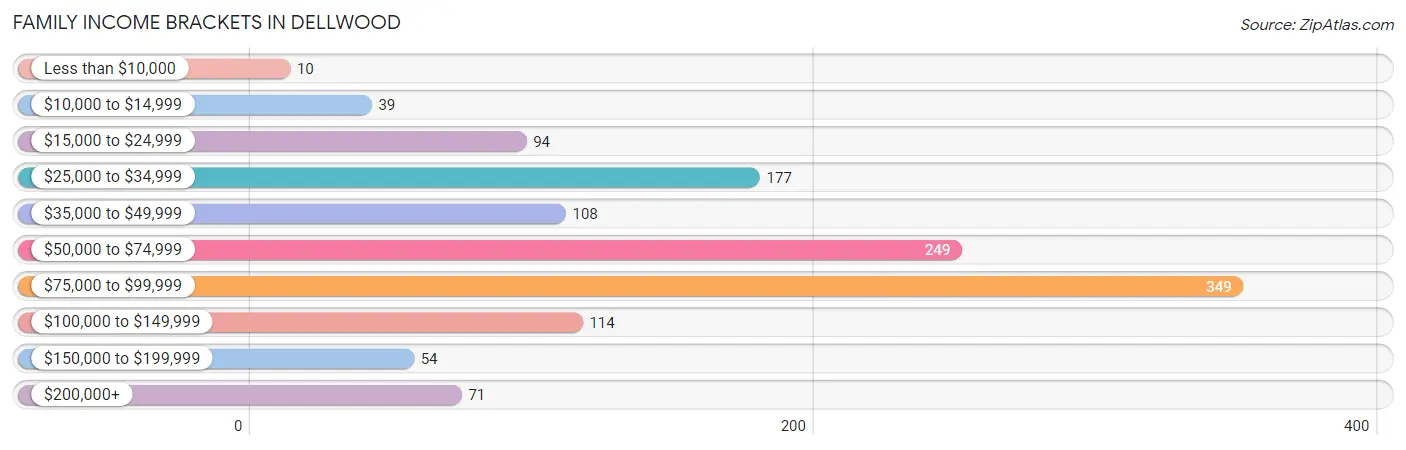
| Income Bracket | # Families | % Families |
| Less than $10,000 | 10 | 0.8% |
| $10,000 to $14,999 | 39 | 3.1% |
| $15,000 to $24,999 | 94 | 7.4% |
| $25,000 to $34,999 | 177 | 14.0% |
| $35,000 to $49,999 | 108 | 8.5% |
| $50,000 to $74,999 | 249 | 19.7% |
| $75,000 to $99,999 | 349 | 27.6% |
| $100,000 to $149,999 | 114 | 9.0% |
| $150,000 to $199,999 | 54 | 4.3% |
| $200,000+ | 71 | 5.6% |
Family Income by Famaliy Size in Dellwood
2-person families (661 | 52.2%) account for the highest median family income in Dellwood with $83,483 per family, while 2-person families (661 | 52.2%) have the highest median income of $41,742 per family member.
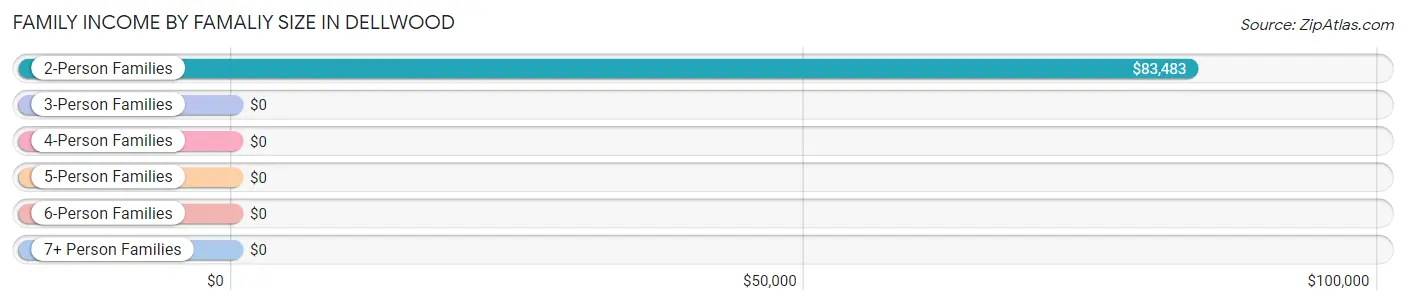
| Income Bracket | # Families | Median Income |
| 2-Person Families | 661 (52.2%) | $83,483 |
| 3-Person Families | 257 (20.3%) | $0 |
| 4-Person Families | 246 (19.4%) | $0 |
| 5-Person Families | 82 (6.5%) | $0 |
| 6-Person Families | 0 (0.0%) | $0 |
| 7+ Person Families | 20 (1.6%) | $0 |
| Total | 1,266 (100.0%) | $72,877 |
Family Income by Number of Earners in Dellwood
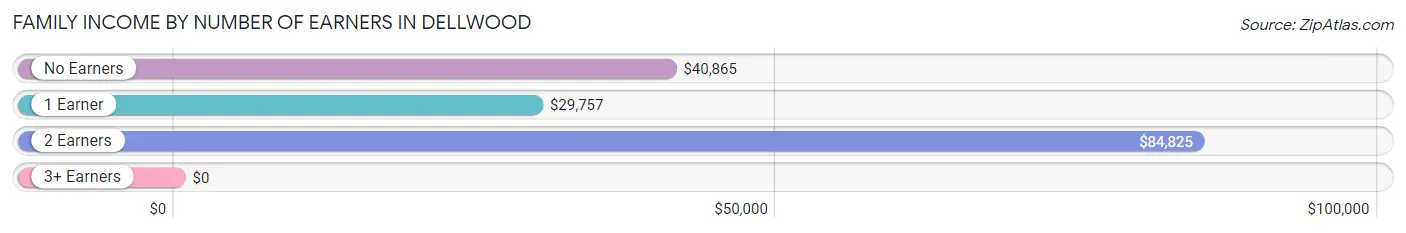
| Number of Earners | # Families | Median Income |
| No Earners | 89 (7.0%) | $40,865 |
| 1 Earner | 460 (36.3%) | $29,757 |
| 2 Earners | 601 (47.5%) | $84,825 |
| 3+ Earners | 116 (9.2%) | $0 |
| Total | 1,266 (100.0%) | $72,877 |
Household Income in Dellwood
Household Income Brackets in Dellwood
With 508 households falling in the category, the $50,000 to $74,999 income range is the most frequent in Dellwood, accounting for 26.4% of all households. In contrast, only 54 households (2.8%) fall into the $150,000 to $199,999 income bracket, making it the least populous group.
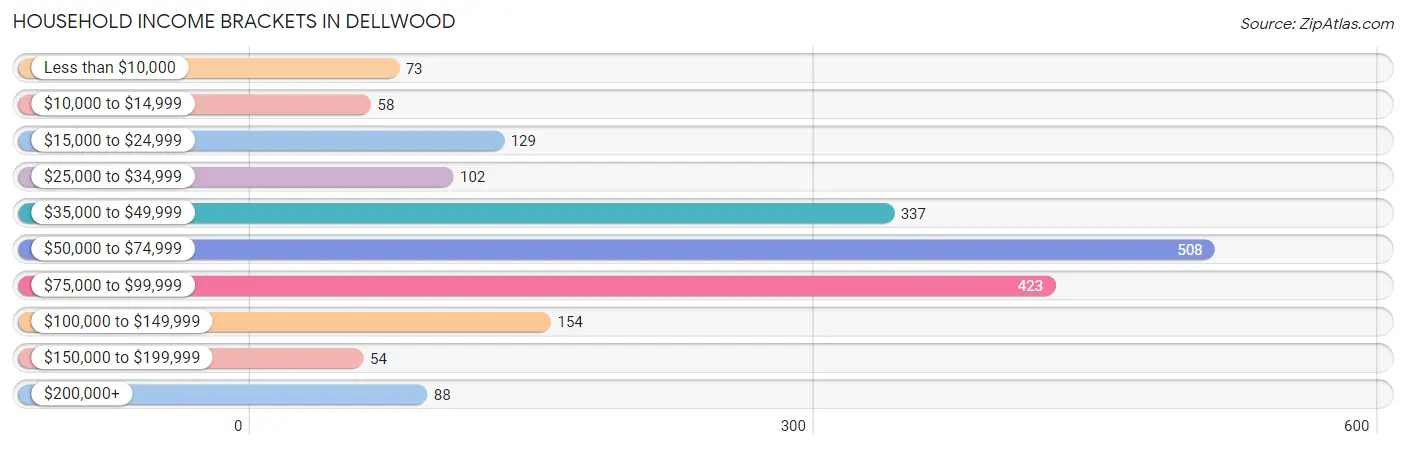
| Income Bracket | # Households | % Households |
| Less than $10,000 | 73 | 3.8% |
| $10,000 to $14,999 | 58 | 3.0% |
| $15,000 to $24,999 | 129 | 6.7% |
| $25,000 to $34,999 | 102 | 5.3% |
| $35,000 to $49,999 | 337 | 17.5% |
| $50,000 to $74,999 | 508 | 26.4% |
| $75,000 to $99,999 | 423 | 22.0% |
| $100,000 to $149,999 | 154 | 8.0% |
| $150,000 to $199,999 | 54 | 2.8% |
| $200,000+ | 88 | 4.6% |
Household Income by Householder Age in Dellwood
The median household income in Dellwood is $67,845, with the highest median household income of $81,563 found in the 65+ years age bracket for the primary householder. A total of 473 households (24.6%) fall into this category.
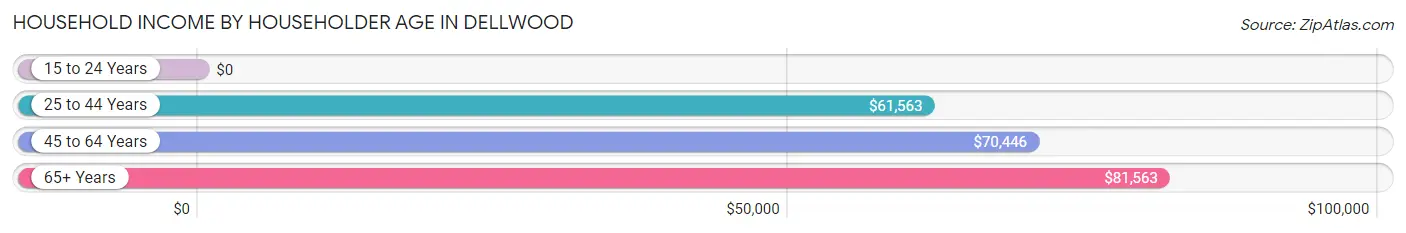
| Income Bracket | # Households | Median Income |
| 15 to 24 Years | 0 (0.0%) | $0 |
| 25 to 44 Years | 632 (32.9%) | $61,563 |
| 45 to 64 Years | 818 (42.5%) | $70,446 |
| 65+ Years | 473 (24.6%) | $81,563 |
| Total | 1,923 (100.0%) | $67,845 |
Poverty in Dellwood
Income Below Poverty by Sex and Age in Dellwood
With 30.1% poverty level for males and 13.7% for females among the residents of Dellwood, 12 to 14 year old males and 12 to 14 year old females are the most vulnerable to poverty, with 178 males (86.0%) and 160 females (63.2%) in their respective age groups living below the poverty level.
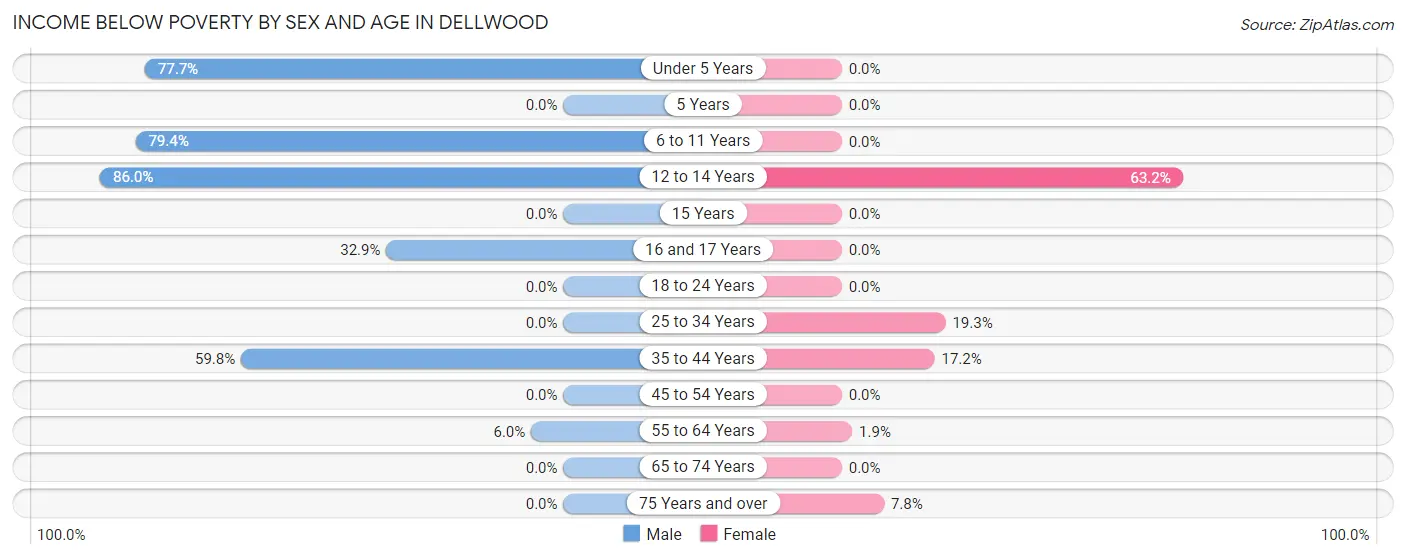
| Age Bracket | Male | Female |
| Under 5 Years | 146 (77.7%) | 0 (0.0%) |
| 5 Years | 0 (0.0%) | 0 (0.0%) |
| 6 to 11 Years | 243 (79.4%) | 0 (0.0%) |
| 12 to 14 Years | 178 (86.0%) | 160 (63.2%) |
| 15 Years | 0 (0.0%) | 0 (0.0%) |
| 16 and 17 Years | 46 (32.9%) | 0 (0.0%) |
| 18 to 24 Years | 0 (0.0%) | 0 (0.0%) |
| 25 to 34 Years | 0 (0.0%) | 46 (19.3%) |
| 35 to 44 Years | 134 (59.8%) | 89 (17.2%) |
| 45 to 54 Years | 0 (0.0%) | 0 (0.0%) |
| 55 to 64 Years | 28 (6.0%) | 10 (1.9%) |
| 65 to 74 Years | 0 (0.0%) | 0 (0.0%) |
| 75 Years and over | 0 (0.0%) | 13 (7.8%) |
| Total | 775 (30.1%) | 318 (13.7%) |
Income Above Poverty by Sex and Age in Dellwood
According to the poverty statistics in Dellwood, males aged 15 years and females aged 5 years are the age groups that are most secure financially, with 100.0% of males and 100.0% of females in these age groups living above the poverty line.
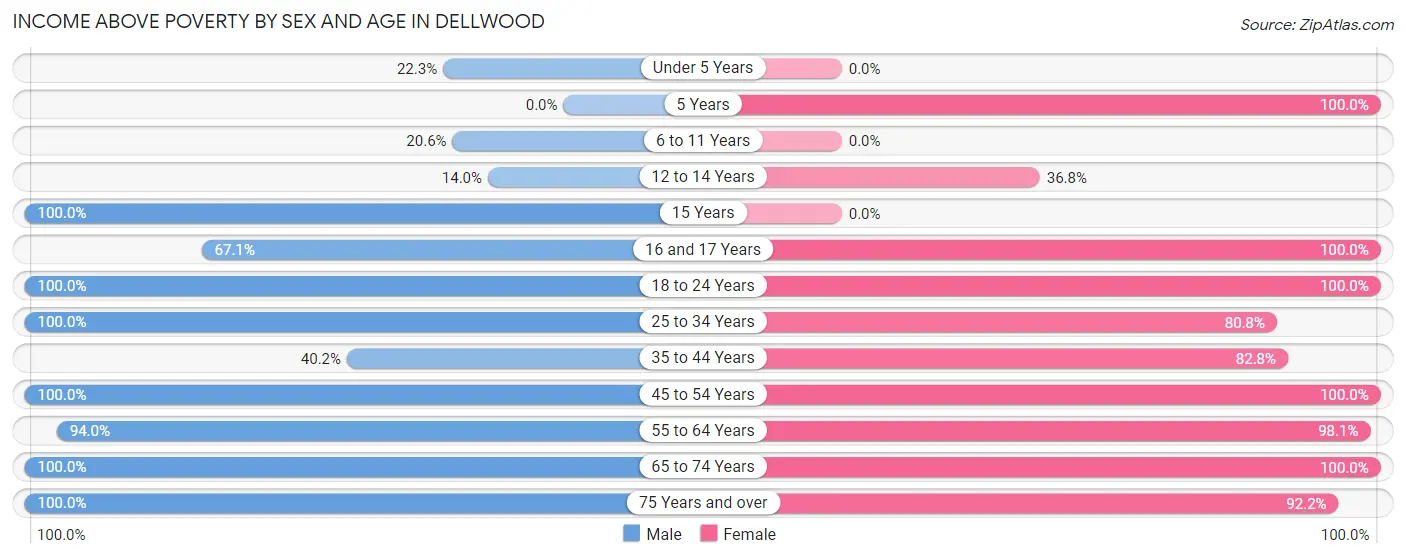
| Age Bracket | Male | Female |
| Under 5 Years | 42 (22.3%) | 0 (0.0%) |
| 5 Years | 0 (0.0%) | 21 (100.0%) |
| 6 to 11 Years | 63 (20.6%) | 0 (0.0%) |
| 12 to 14 Years | 29 (14.0%) | 93 (36.8%) |
| 15 Years | 62 (100.0%) | 0 (0.0%) |
| 16 and 17 Years | 94 (67.1%) | 35 (100.0%) |
| 18 to 24 Years | 211 (100.0%) | 148 (100.0%) |
| 25 to 34 Years | 356 (100.0%) | 193 (80.7%) |
| 35 to 44 Years | 90 (40.2%) | 428 (82.8%) |
| 45 to 54 Years | 140 (100.0%) | 108 (100.0%) |
| 55 to 64 Years | 440 (94.0%) | 512 (98.1%) |
| 65 to 74 Years | 119 (100.0%) | 316 (100.0%) |
| 75 Years and over | 153 (100.0%) | 153 (92.2%) |
| Total | 1,799 (69.9%) | 2,007 (86.3%) |
Income Below Poverty Among Married-Couple Families in Dellwood
The poverty statistics for married-couple families in Dellwood show that 2.0% or 10 of the total 508 families live below the poverty line. Families with no children have the highest poverty rate of 2.6%, comprising of 10 families. On the other hand, families with 1 or 2 children have the lowest poverty rate of 0.0%, which includes 0 families.
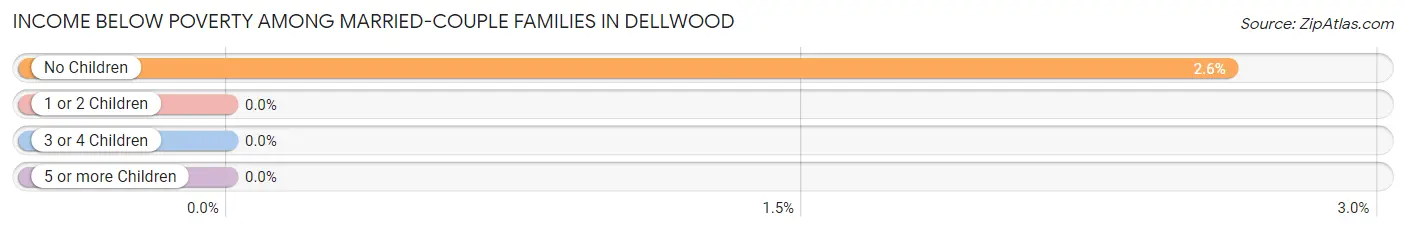
| Children | Above Poverty | Below Poverty |
| No Children | 373 (97.4%) | 10 (2.6%) |
| 1 or 2 Children | 81 (100.0%) | 0 (0.0%) |
| 3 or 4 Children | 24 (100.0%) | 0 (0.0%) |
| 5 or more Children | 20 (100.0%) | 0 (0.0%) |
| Total | 498 (98.0%) | 10 (2.0%) |
Income Below Poverty Among Single-Parent Households in Dellwood
According to the poverty data in Dellwood, 73.6% or 134 single-father households and 14.8% or 85 single-mother households are living below the poverty line. Among single-father households, those with 3 or 4 children have the highest poverty rate, with 134 households (100.0%) experiencing poverty. Likewise, among single-mother households, those with 3 or 4 children have the highest poverty rate, with 46 households (100.0%) falling below the poverty line.
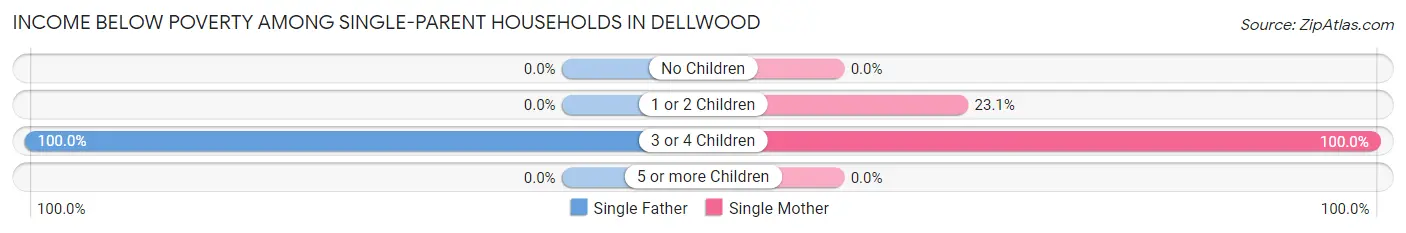
| Children | Single Father | Single Mother |
| No Children | 0 (0.0%) | 0 (0.0%) |
| 1 or 2 Children | 0 (0.0%) | 39 (23.1%) |
| 3 or 4 Children | 134 (100.0%) | 46 (100.0%) |
| 5 or more Children | 0 (0.0%) | 0 (0.0%) |
| Total | 134 (73.6%) | 85 (14.8%) |
Income Below Poverty Among Married-Couple vs Single-Parent Households in Dellwood
The poverty data for Dellwood shows that 10 of the married-couple family households (2.0%) and 219 of the single-parent households (28.9%) are living below the poverty level. Within the married-couple family households, those with no children have the highest poverty rate, with 10 households (2.6%) falling below the poverty line. Among the single-parent households, those with 3 or 4 children have the highest poverty rate, with 180 household (100.0%) living below poverty.
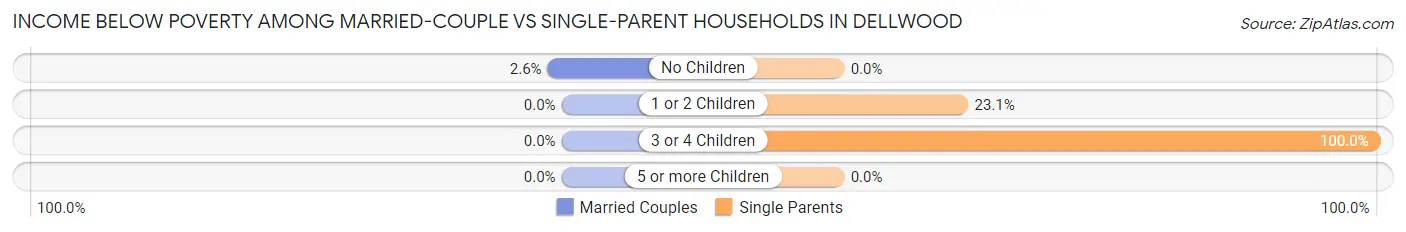
| Children | Married-Couple Families | Single-Parent Households |
| No Children | 10 (2.6%) | 0 (0.0%) |
| 1 or 2 Children | 0 (0.0%) | 39 (23.1%) |
| 3 or 4 Children | 0 (0.0%) | 180 (100.0%) |
| 5 or more Children | 0 (0.0%) | 0 (0.0%) |
| Total | 10 (2.0%) | 219 (28.9%) |
Race in Dellwood
The most populous races in Dellwood are Black / African American (4,080 | 83.3%), White / Caucasian (686 | 14.0%), and Two or more Races (89 | 1.8%).
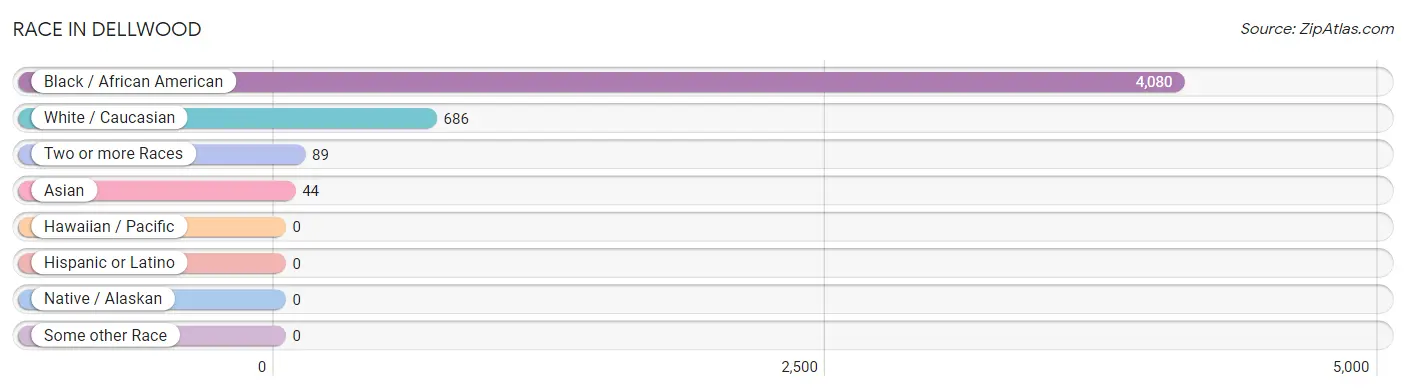
| Race | # Population | % Population |
| Asian | 44 | 0.9% |
| Black / African American | 4,080 | 83.3% |
| Hawaiian / Pacific | 0 | 0.0% |
| Hispanic or Latino | 0 | 0.0% |
| Native / Alaskan | 0 | 0.0% |
| White / Caucasian | 686 | 14.0% |
| Two or more Races | 89 | 1.8% |
| Some other Race | 0 | 0.0% |
| Total | 4,899 | 100.0% |
Ancestry in Dellwood
The most populous ancestries reported in Dellwood are Subsaharan African (269 | 5.5%), Irish (205 | 4.2%), German (184 | 3.8%), English (164 | 3.4%), and Somali (145 | 3.0%), together accounting for 19.7% of all Dellwood residents.
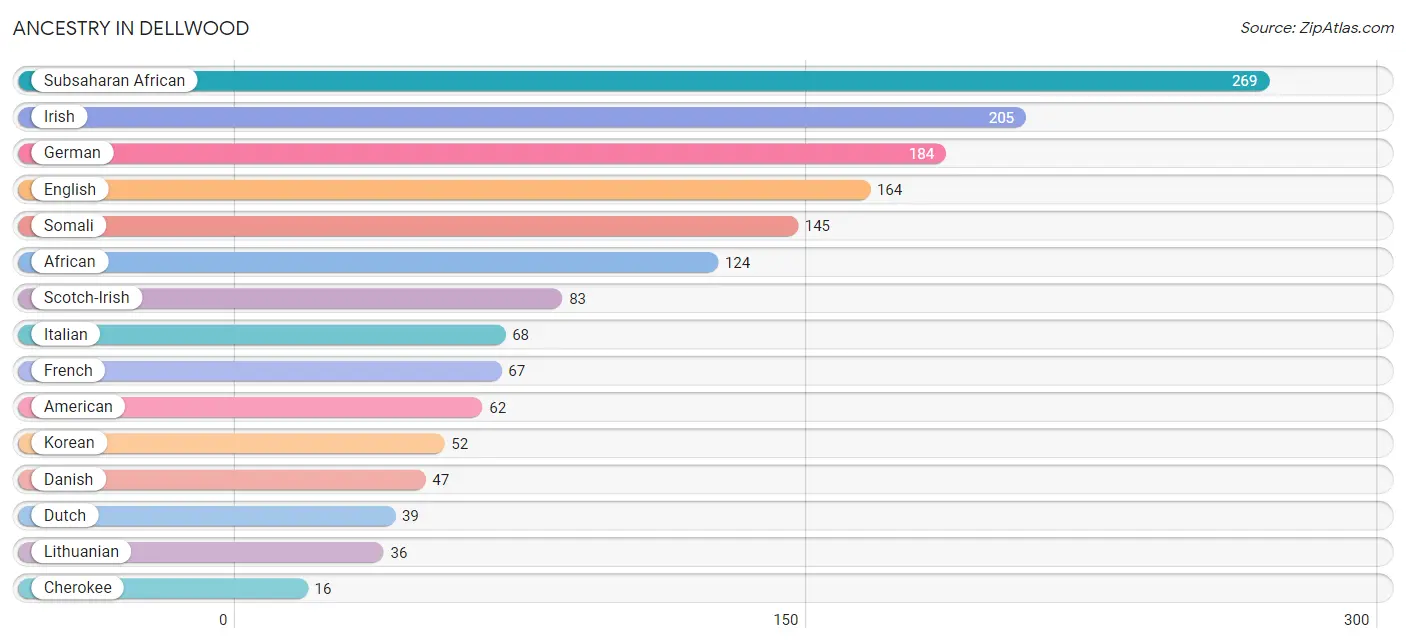
| Ancestry | # Population | % Population |
| African | 124 | 2.5% |
| American | 62 | 1.3% |
| Cherokee | 16 | 0.3% |
| Danish | 47 | 1.0% |
| Dutch | 39 | 0.8% |
| English | 164 | 3.4% |
| European | 15 | 0.3% |
| Finnish | 15 | 0.3% |
| French | 67 | 1.4% |
| German | 184 | 3.8% |
| Irish | 205 | 4.2% |
| Italian | 68 | 1.4% |
| Korean | 52 | 1.1% |
| Lithuanian | 36 | 0.7% |
| Scotch-Irish | 83 | 1.7% |
| Somali | 145 | 3.0% |
| Subsaharan African | 269 | 5.5% | View All 17 Rows |
Immigrants in Dellwood
The most numerous immigrant groups reported in Dellwood came from Asia (44 | 0.9%), Philippines (44 | 0.9%), South Eastern Asia (44 | 0.9%), Africa (40 | 0.8%), and Eastern Africa (40 | 0.8%), together accounting for 4.3% of all Dellwood residents.
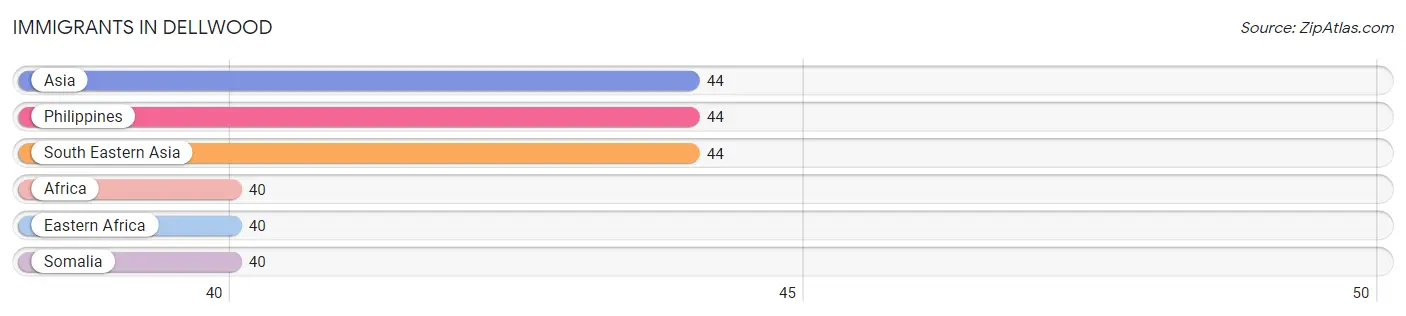
| Immigration Origin | # Population | % Population |
| Africa | 40 | 0.8% |
| Asia | 44 | 0.9% |
| Eastern Africa | 40 | 0.8% |
| Philippines | 44 | 0.9% |
| Somalia | 40 | 0.8% |
| South Eastern Asia | 44 | 0.9% | View All 6 Rows |
Sex and Age in Dellwood
Sex and Age in Dellwood
The most populous age groups in Dellwood are 55 to 59 Years (380 | 14.8%) for men and 40 to 44 Years (319 | 13.7%) for women.
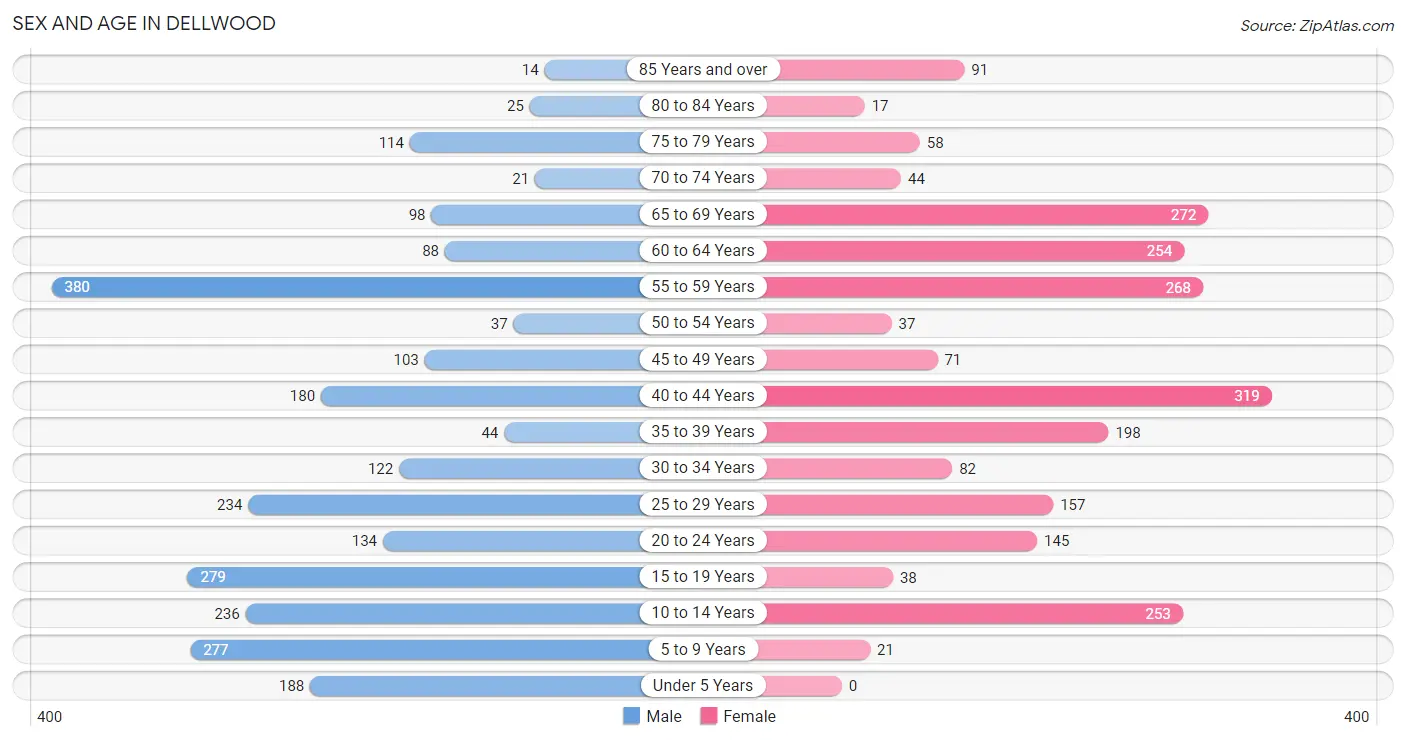
| Age Bracket | Male | Female |
| Under 5 Years | 188 (7.3%) | 0 (0.0%) |
| 5 to 9 Years | 277 (10.8%) | 21 (0.9%) |
| 10 to 14 Years | 236 (9.2%) | 253 (10.9%) |
| 15 to 19 Years | 279 (10.8%) | 38 (1.6%) |
| 20 to 24 Years | 134 (5.2%) | 145 (6.2%) |
| 25 to 29 Years | 234 (9.1%) | 157 (6.8%) |
| 30 to 34 Years | 122 (4.7%) | 82 (3.5%) |
| 35 to 39 Years | 44 (1.7%) | 198 (8.5%) |
| 40 to 44 Years | 180 (7.0%) | 319 (13.7%) |
| 45 to 49 Years | 103 (4.0%) | 71 (3.0%) |
| 50 to 54 Years | 37 (1.4%) | 37 (1.6%) |
| 55 to 59 Years | 380 (14.8%) | 268 (11.5%) |
| 60 to 64 Years | 88 (3.4%) | 254 (10.9%) |
| 65 to 69 Years | 98 (3.8%) | 272 (11.7%) |
| 70 to 74 Years | 21 (0.8%) | 44 (1.9%) |
| 75 to 79 Years | 114 (4.4%) | 58 (2.5%) |
| 80 to 84 Years | 25 (1.0%) | 17 (0.7%) |
| 85 Years and over | 14 (0.5%) | 91 (3.9%) |
| Total | 2,574 (100.0%) | 2,325 (100.0%) |
Families and Households in Dellwood
Median Family Size in Dellwood
The median family size in Dellwood is 3.20 persons per family, with single male/father families (182 | 14.4%) accounting for the largest median family size of 4.05 persons per family. On the other hand, single female/mother families (576 | 45.5%) represent the smallest median family size with 3.04 persons per family.
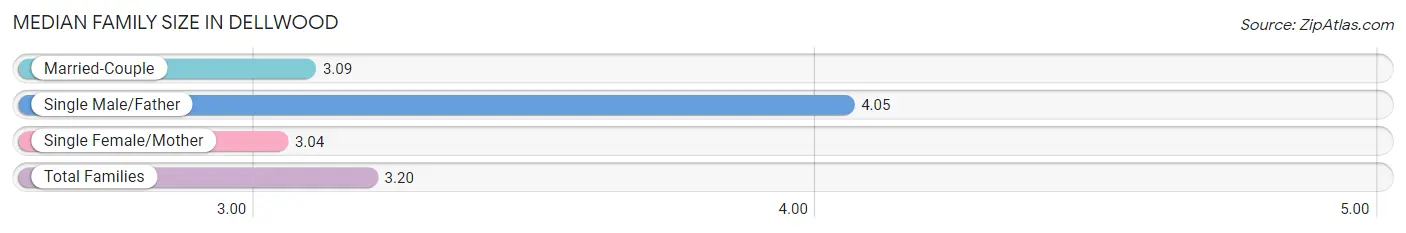
| Family Type | # Families | Family Size |
| Married-Couple | 508 (40.1%) | 3.09 |
| Single Male/Father | 182 (14.4%) | 4.05 |
| Single Female/Mother | 576 (45.5%) | 3.04 |
| Total Families | 1,266 (100.0%) | 3.20 |
Median Household Size in Dellwood
The median household size in Dellwood is 2.55 persons per household, with single male/father households (182 | 9.5%) accounting for the largest median household size of 4.7 persons per household. non-family households (657 | 34.2%) represent the smallest median household size with 1.07 persons per household.
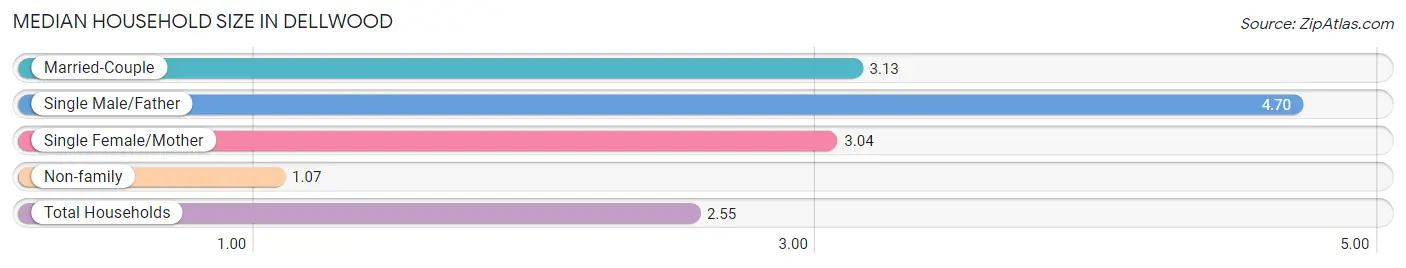
| Household Type | # Households | Household Size |
| Married-Couple | 508 (26.4%) | 3.13 |
| Single Male/Father | 182 (9.5%) | 4.70 |
| Single Female/Mother | 576 (29.9%) | 3.04 |
| Non-family | 657 (34.2%) | 1.07 |
| Total Households | 1,923 (100.0%) | 2.55 |
Household Size by Marriage Status in Dellwood
Out of a total of 1,923 households in Dellwood, 1,266 (65.8%) are family households, while 657 (34.2%) are nonfamily households. The most numerous type of family households are 2-person households, comprising 642, and the most common type of nonfamily households are 1-person households, comprising 605.
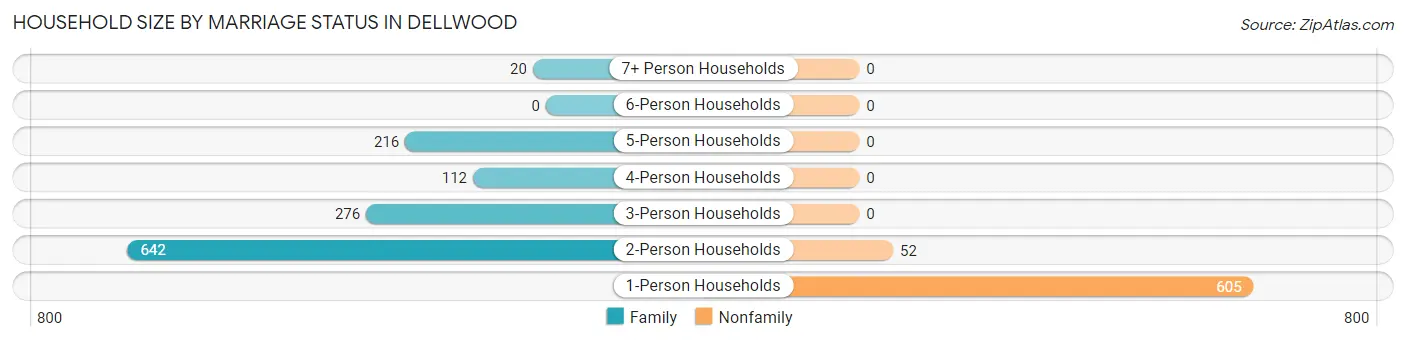
| Household Size | Family Households | Nonfamily Households |
| 1-Person Households | - | 605 (31.5%) |
| 2-Person Households | 642 (33.4%) | 52 (2.7%) |
| 3-Person Households | 276 (14.3%) | 0 (0.0%) |
| 4-Person Households | 112 (5.8%) | 0 (0.0%) |
| 5-Person Households | 216 (11.2%) | 0 (0.0%) |
| 6-Person Households | 0 (0.0%) | 0 (0.0%) |
| 7+ Person Households | 20 (1.0%) | 0 (0.0%) |
| Total | 1,266 (65.8%) | 657 (34.2%) |
Female Fertility in Dellwood
Fertility by Age in Dellwood
Average fertility rate in Dellwood is 65.0 births per 1,000 women. Women in the age bracket of 20 to 34 years have the highest fertility rate with 120.0 births per 1,000 women. Women in the age bracket of 20 to 34 years acount for 69.7% of all women with births.
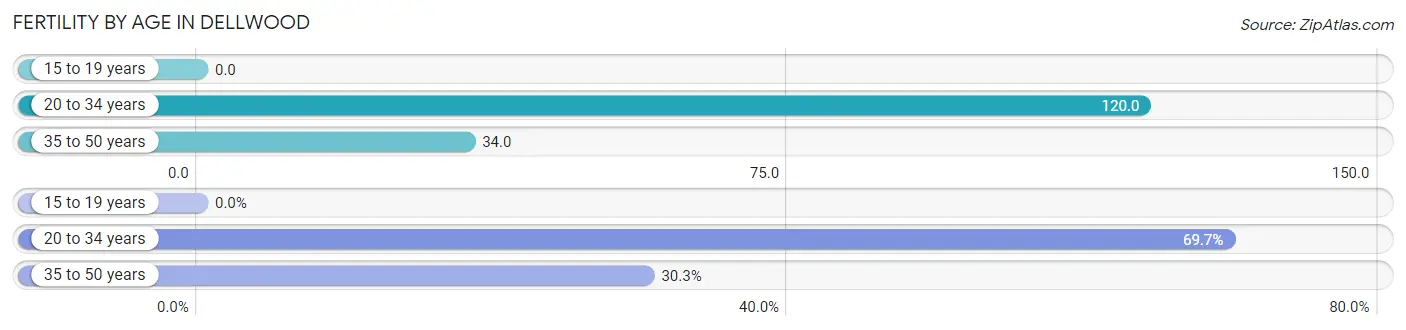
| Age Bracket | Women with Births | Births / 1,000 Women |
| 15 to 19 years | 0 (0.0%) | 0.0 |
| 20 to 34 years | 46 (69.7%) | 120.0 |
| 35 to 50 years | 20 (30.3%) | 34.0 |
| Total | 66 (100.0%) | 65.0 |
Fertility by Age by Marriage Status in Dellwood
30.3% of women with births (66) in Dellwood are married. The highest percentage of unmarried women with births falls into 20 to 34 years age bracket with 100.0% of them unmarried at the time of birth, while the lowest percentage of unmarried women with births belong to 35 to 50 years age bracket with 0.0% of them unmarried.
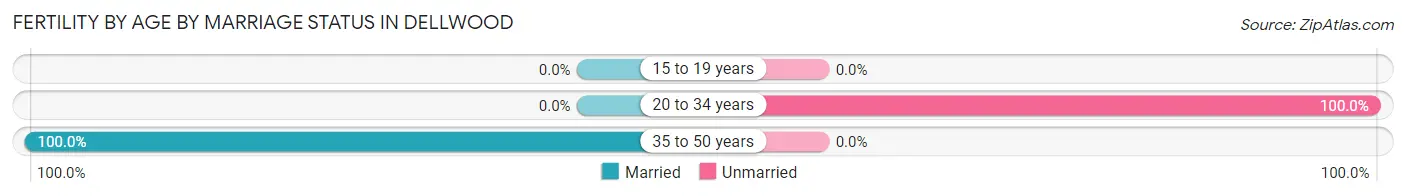
| Age Bracket | Married | Unmarried |
| 15 to 19 years | 0 (0.0%) | 0 (0.0%) |
| 20 to 34 years | 0 (0.0%) | 46 (100.0%) |
| 35 to 50 years | 20 (100.0%) | 0 (0.0%) |
| Total | 20 (30.3%) | 46 (69.7%) |
Fertility by Education in Dellwood
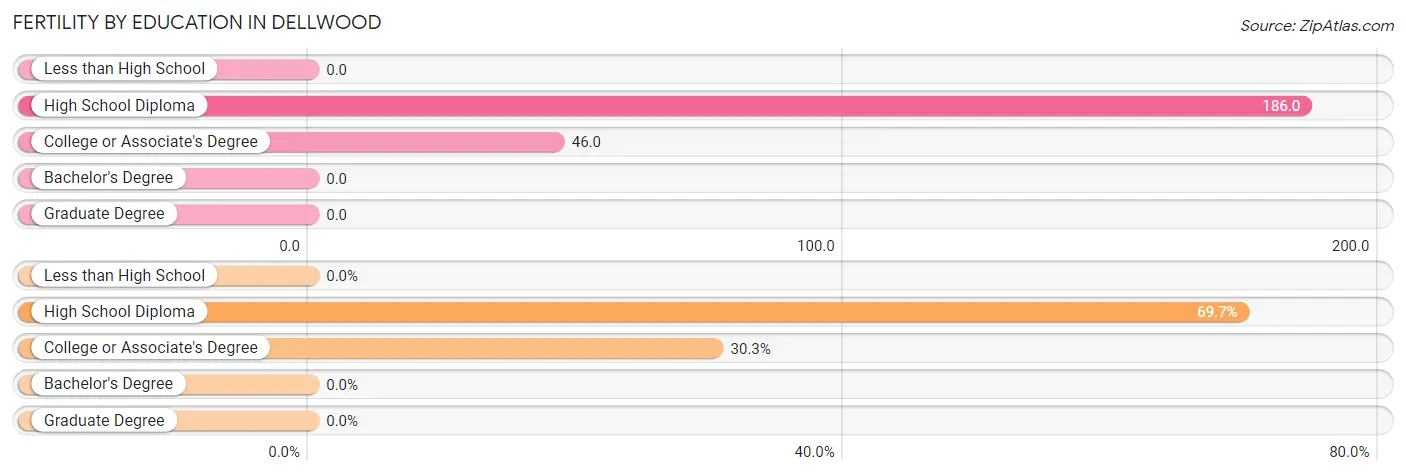
| Educational Attainment | Women with Births | Births / 1,000 Women |
| Less than High School | 0 (0.0%) | 0.0 |
| High School Diploma | 46 (69.7%) | 186.0 |
| College or Associate's Degree | 20 (30.3%) | 46.0 |
| Bachelor's Degree | 0 (0.0%) | 0.0 |
| Graduate Degree | 0 (0.0%) | 0.0 |
| Total | 66 (100.0%) | 65.0 |
Fertility by Education by Marriage Status in Dellwood
69.7% of women with births in Dellwood are unmarried. Women with the educational attainment of college or associate's degree are most likely to be married with 100.0% of them married at childbirth, while women with the educational attainment of high school diploma are least likely to be married with 100.0% of them unmarried at childbirth.
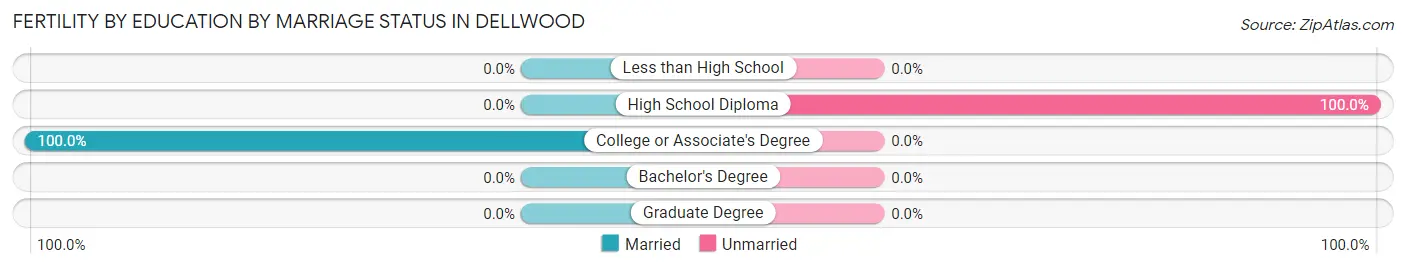
| Educational Attainment | Married | Unmarried |
| Less than High School | 0 (0.0%) | 0 (0.0%) |
| High School Diploma | 0 (0.0%) | 46 (100.0%) |
| College or Associate's Degree | 20 (100.0%) | 0 (0.0%) |
| Bachelor's Degree | 0 (0.0%) | 0 (0.0%) |
| Graduate Degree | 0 (0.0%) | 0 (0.0%) |
| Total | 20 (30.3%) | 46 (69.7%) |
Employment Characteristics in Dellwood
Employment by Class of Employer in Dellwood
Among the 2,537 employed individuals in Dellwood, private company employees (1,503 | 59.2%), state government employees (407 | 16.0%), and local government employees (152 | 6.0%) make up the most common classes of employment.
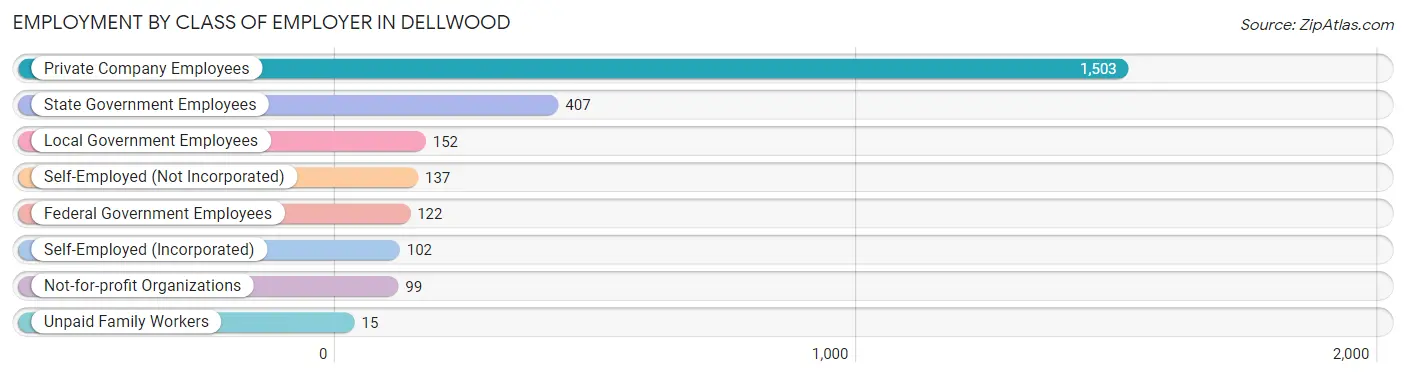
| Employer Class | # Employees | % Employees |
| Private Company Employees | 1,503 | 59.2% |
| Self-Employed (Incorporated) | 102 | 4.0% |
| Self-Employed (Not Incorporated) | 137 | 5.4% |
| Not-for-profit Organizations | 99 | 3.9% |
| Local Government Employees | 152 | 6.0% |
| State Government Employees | 407 | 16.0% |
| Federal Government Employees | 122 | 4.8% |
| Unpaid Family Workers | 15 | 0.6% |
| Total | 2,537 | 100.0% |
Employment Status by Age in Dellwood
According to the labor force statistics for Dellwood, out of the total population over 16 years of age (3,862), 72.2% or 2,788 individuals are in the labor force, with 3.4% or 95 of them unemployed. The age group with the highest labor force participation rate is 30 to 34 years, with 100.0% or 204 individuals in the labor force. Within the labor force, the 20 to 24 years age range has the highest percentage of unemployed individuals, with 16.5% or 38 of them being unemployed.
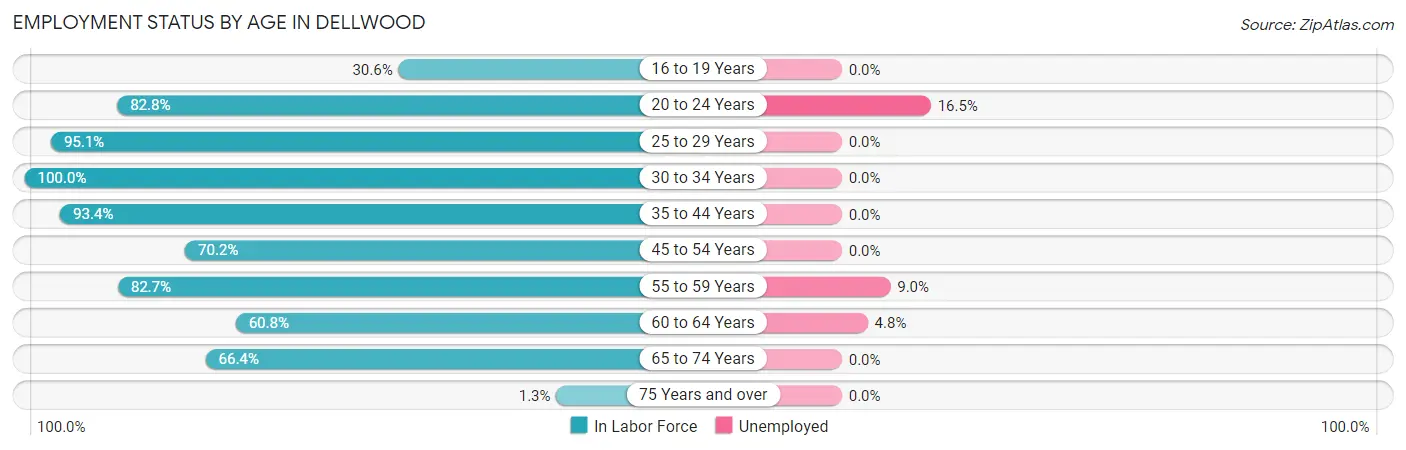
| Age Bracket | In Labor Force | Unemployed |
| 16 to 19 Years | 78 (30.6%) | 0 (0.0%) |
| 20 to 24 Years | 231 (82.8%) | 38 (16.5%) |
| 25 to 29 Years | 372 (95.1%) | 0 (0.0%) |
| 30 to 34 Years | 204 (100.0%) | 0 (0.0%) |
| 35 to 44 Years | 692 (93.4%) | 0 (0.0%) |
| 45 to 54 Years | 174 (70.2%) | 0 (0.0%) |
| 55 to 59 Years | 536 (82.7%) | 48 (9.0%) |
| 60 to 64 Years | 208 (60.8%) | 10 (4.8%) |
| 65 to 74 Years | 289 (66.4%) | 0 (0.0%) |
| 75 Years and over | 4 (1.3%) | 0 (0.0%) |
| Total | 2,788 (72.2%) | 95 (3.4%) |
Employment Status by Educational Attainment in Dellwood
According to labor force statistics for Dellwood, 84.9% of individuals (2,185) out of the total population between 25 and 64 years of age (2,574) are in the labor force, with 2.7% or 59 of them being unemployed. The group with the highest labor force participation rate are those with the educational attainment of less than high school, with 100.0% or 42 individuals in the labor force. Within the labor force, individuals with high school diploma education have the highest percentage of unemployment, with 4.8% or 48 of them being unemployed.
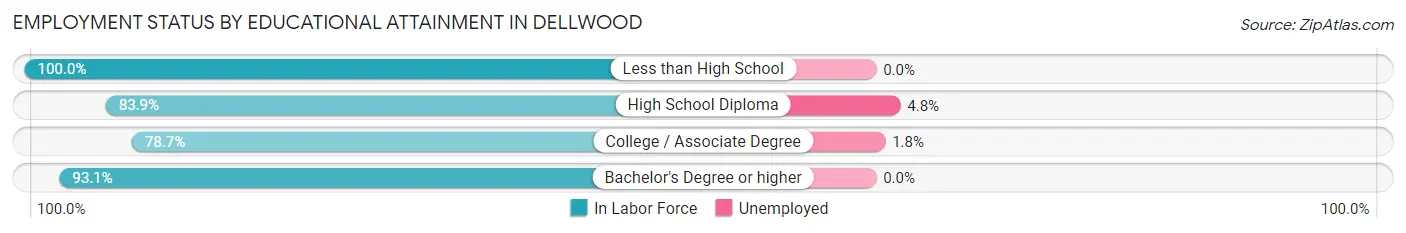
| Educational Attainment | In Labor Force | Unemployed |
| Less than High School | 42 (100.0%) | 0 (0.0%) |
| High School Diploma | 996 (83.9%) | 57 (4.8%) |
| College / Associate Degree | 568 (78.7%) | 13 (1.8%) |
| Bachelor's Degree or higher | 580 (93.1%) | 0 (0.0%) |
| Total | 2,185 (84.9%) | 69 (2.7%) |
Employment Occupations by Sex in Dellwood
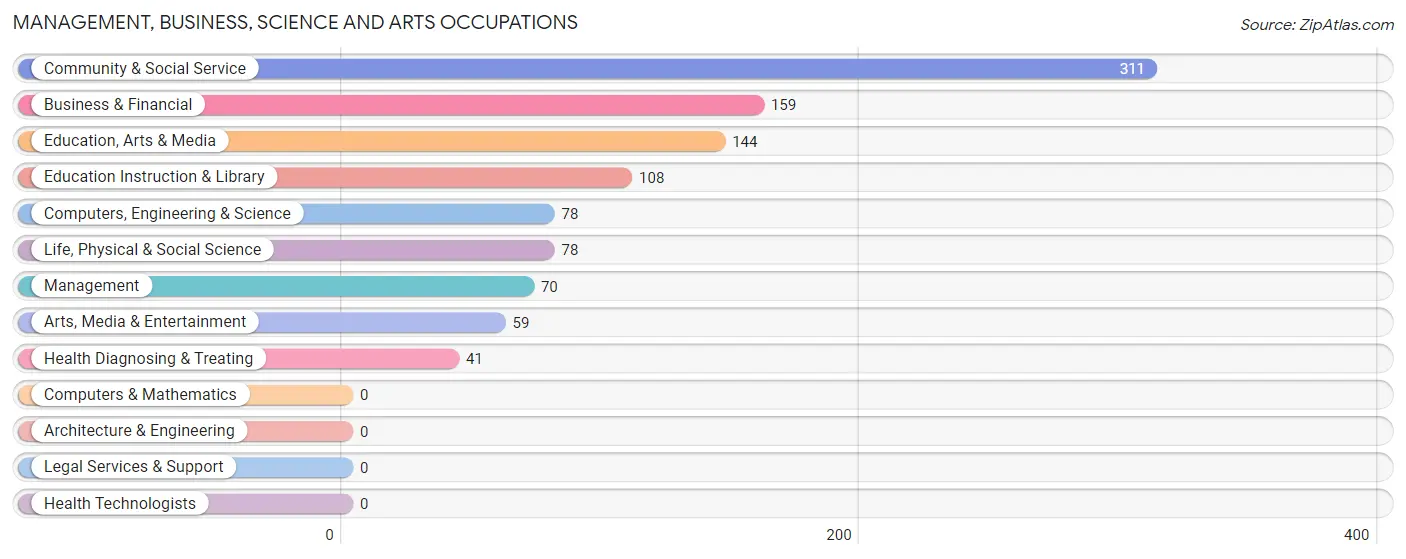
Management, Business, Science and Arts Occupations
The most common Management, Business, Science and Arts occupations in Dellwood are Community & Social Service (311 | 11.6%), Business & Financial (159 | 5.9%), Education, Arts & Media (144 | 5.3%), Education Instruction & Library (108 | 4.0%), and Computers, Engineering & Science (78 | 2.9%).
Management, Business, Science and Arts Occupations by Sex
Within the Management, Business, Science and Arts occupations in Dellwood, the most male-oriented occupations are Management (40.0%), Education, Arts & Media (6.9%), and Community & Social Service (3.2%), while the most female-oriented occupations are Business & Financial (100.0%), Computers, Engineering & Science (100.0%), and Life, Physical & Social Science (100.0%).
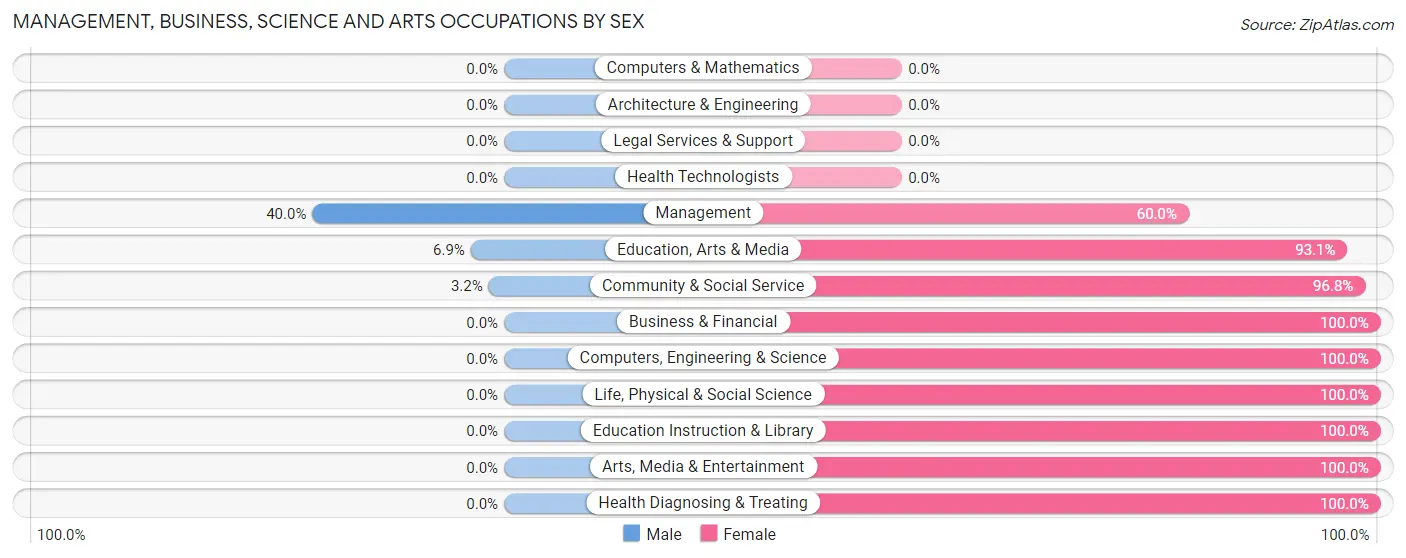
| Occupation | Male | Female |
| Management | 28 (40.0%) | 42 (60.0%) |
| Business & Financial | 0 (0.0%) | 159 (100.0%) |
| Computers, Engineering & Science | 0 (0.0%) | 78 (100.0%) |
| Computers & Mathematics | 0 (0.0%) | 0 (0.0%) |
| Architecture & Engineering | 0 (0.0%) | 0 (0.0%) |
| Life, Physical & Social Science | 0 (0.0%) | 78 (100.0%) |
| Community & Social Service | 10 (3.2%) | 301 (96.8%) |
| Education, Arts & Media | 10 (6.9%) | 134 (93.1%) |
| Legal Services & Support | 0 (0.0%) | 0 (0.0%) |
| Education Instruction & Library | 0 (0.0%) | 108 (100.0%) |
| Arts, Media & Entertainment | 0 (0.0%) | 59 (100.0%) |
| Health Diagnosing & Treating | 0 (0.0%) | 41 (100.0%) |
| Health Technologists | 0 (0.0%) | 0 (0.0%) |
| Total (Category) | 38 (5.8%) | 621 (94.2%) |
| Total (Overall) | 1,132 (42.0%) | 1,560 (58.0%) |
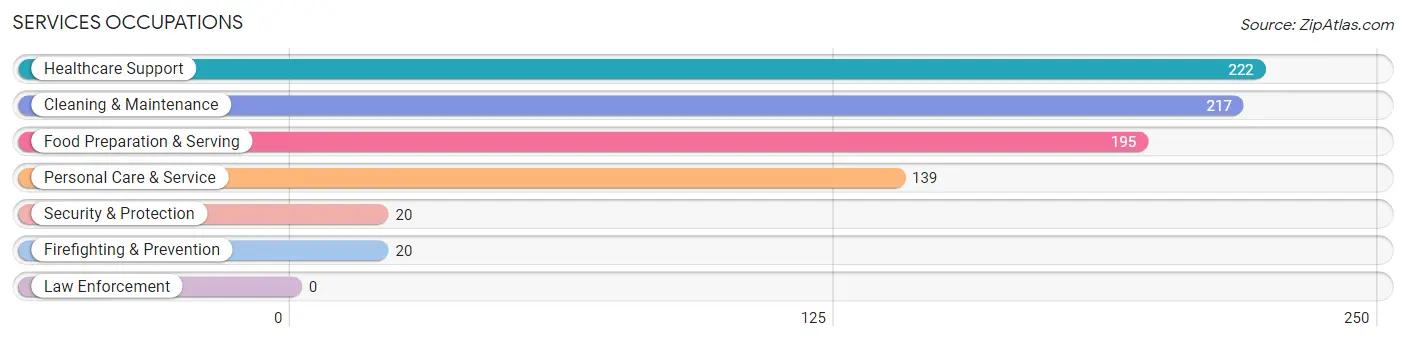
Services Occupations
The most common Services occupations in Dellwood are Healthcare Support (222 | 8.3%), Cleaning & Maintenance (217 | 8.1%), Food Preparation & Serving (195 | 7.2%), Personal Care & Service (139 | 5.2%), and Security & Protection (20 | 0.7%).
Services Occupations by Sex
Within the Services occupations in Dellwood, the most male-oriented occupations are Security & Protection (100.0%), Firefighting & Prevention (100.0%), and Food Preparation & Serving (95.9%), while the most female-oriented occupations are Personal Care & Service (69.8%), Healthcare Support (32.9%), and Cleaning & Maintenance (10.1%).
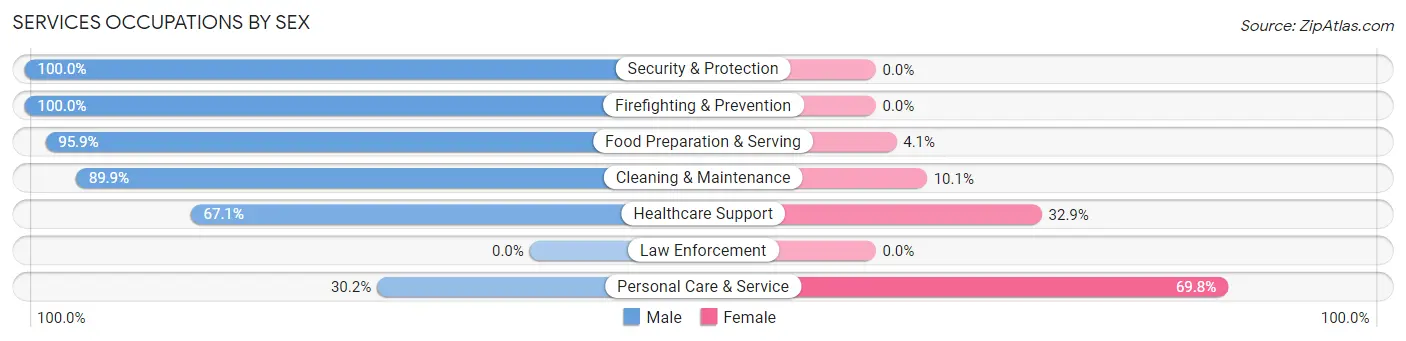
| Occupation | Male | Female |
| Healthcare Support | 149 (67.1%) | 73 (32.9%) |
| Security & Protection | 20 (100.0%) | 0 (0.0%) |
| Firefighting & Prevention | 20 (100.0%) | 0 (0.0%) |
| Law Enforcement | 0 (0.0%) | 0 (0.0%) |
| Food Preparation & Serving | 187 (95.9%) | 8 (4.1%) |
| Cleaning & Maintenance | 195 (89.9%) | 22 (10.1%) |
| Personal Care & Service | 42 (30.2%) | 97 (69.8%) |
| Total (Category) | 593 (74.8%) | 200 (25.2%) |
| Total (Overall) | 1,132 (42.0%) | 1,560 (58.0%) |
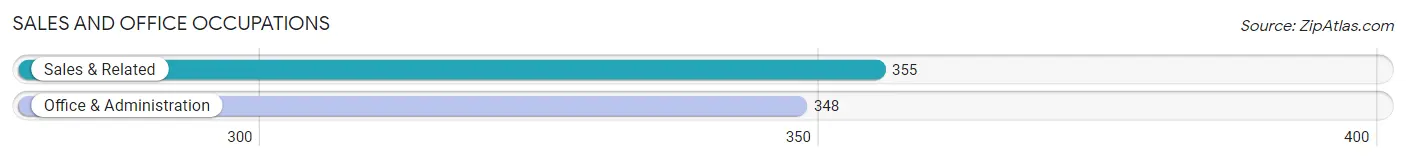
Sales and Office Occupations
The most common Sales and Office occupations in Dellwood are Sales & Related (355 | 13.2%), and Office & Administration (348 | 12.9%).
Sales and Office Occupations by Sex
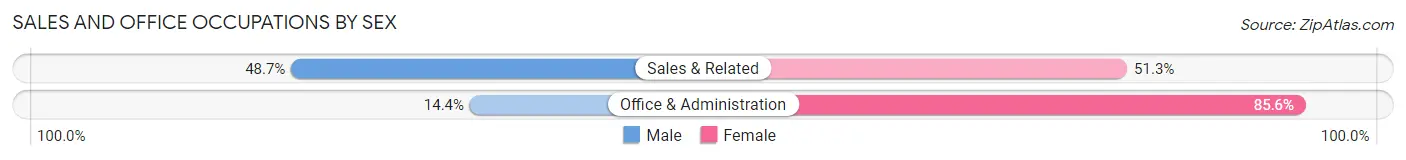
| Occupation | Male | Female |
| Sales & Related | 173 (48.7%) | 182 (51.3%) |
| Office & Administration | 50 (14.4%) | 298 (85.6%) |
| Total (Category) | 223 (31.7%) | 480 (68.3%) |
| Total (Overall) | 1,132 (42.0%) | 1,560 (58.0%) |
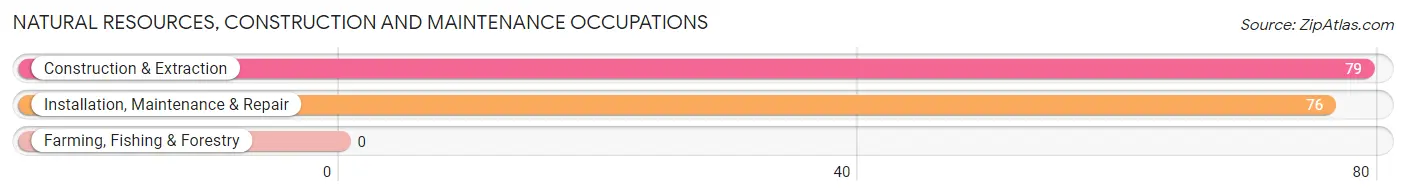
Natural Resources, Construction and Maintenance Occupations
The most common Natural Resources, Construction and Maintenance occupations in Dellwood are Construction & Extraction (79 | 2.9%), and Installation, Maintenance & Repair (76 | 2.8%).
Natural Resources, Construction and Maintenance Occupations by Sex
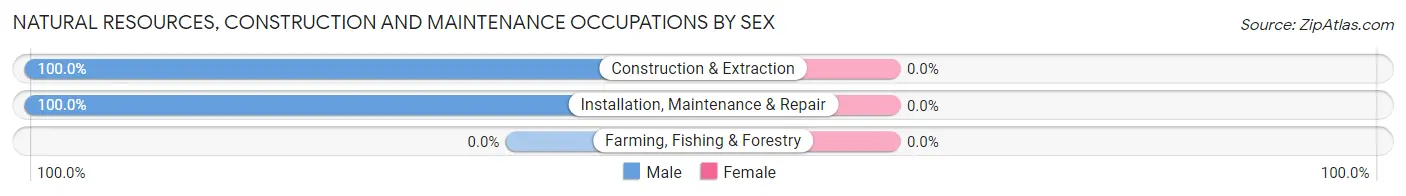
| Occupation | Male | Female |
| Farming, Fishing & Forestry | 0 (0.0%) | 0 (0.0%) |
| Construction & Extraction | 79 (100.0%) | 0 (0.0%) |
| Installation, Maintenance & Repair | 76 (100.0%) | 0 (0.0%) |
| Total (Category) | 155 (100.0%) | 0 (0.0%) |
| Total (Overall) | 1,132 (42.0%) | 1,560 (58.0%) |
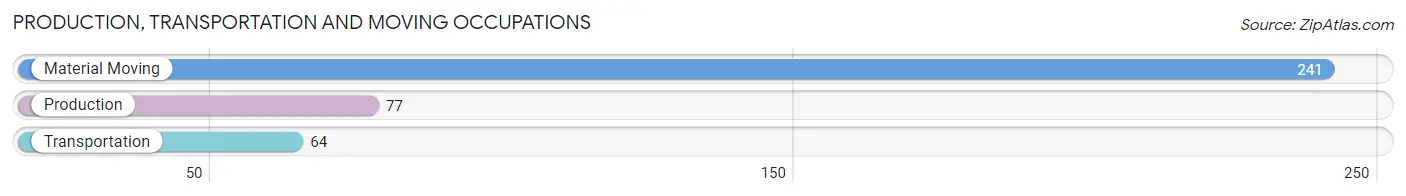
Production, Transportation and Moving Occupations
The most common Production, Transportation and Moving occupations in Dellwood are Material Moving (241 | 8.9%), Production (77 | 2.9%), and Transportation (64 | 2.4%).
Production, Transportation and Moving Occupations by Sex
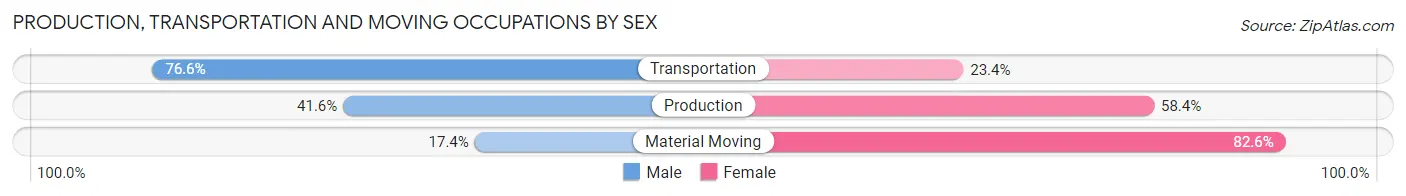
| Occupation | Male | Female |
| Production | 32 (41.6%) | 45 (58.4%) |
| Transportation | 49 (76.6%) | 15 (23.4%) |
| Material Moving | 42 (17.4%) | 199 (82.6%) |
| Total (Category) | 123 (32.2%) | 259 (67.8%) |
| Total (Overall) | 1,132 (42.0%) | 1,560 (58.0%) |
Employment Industries by Sex in Dellwood
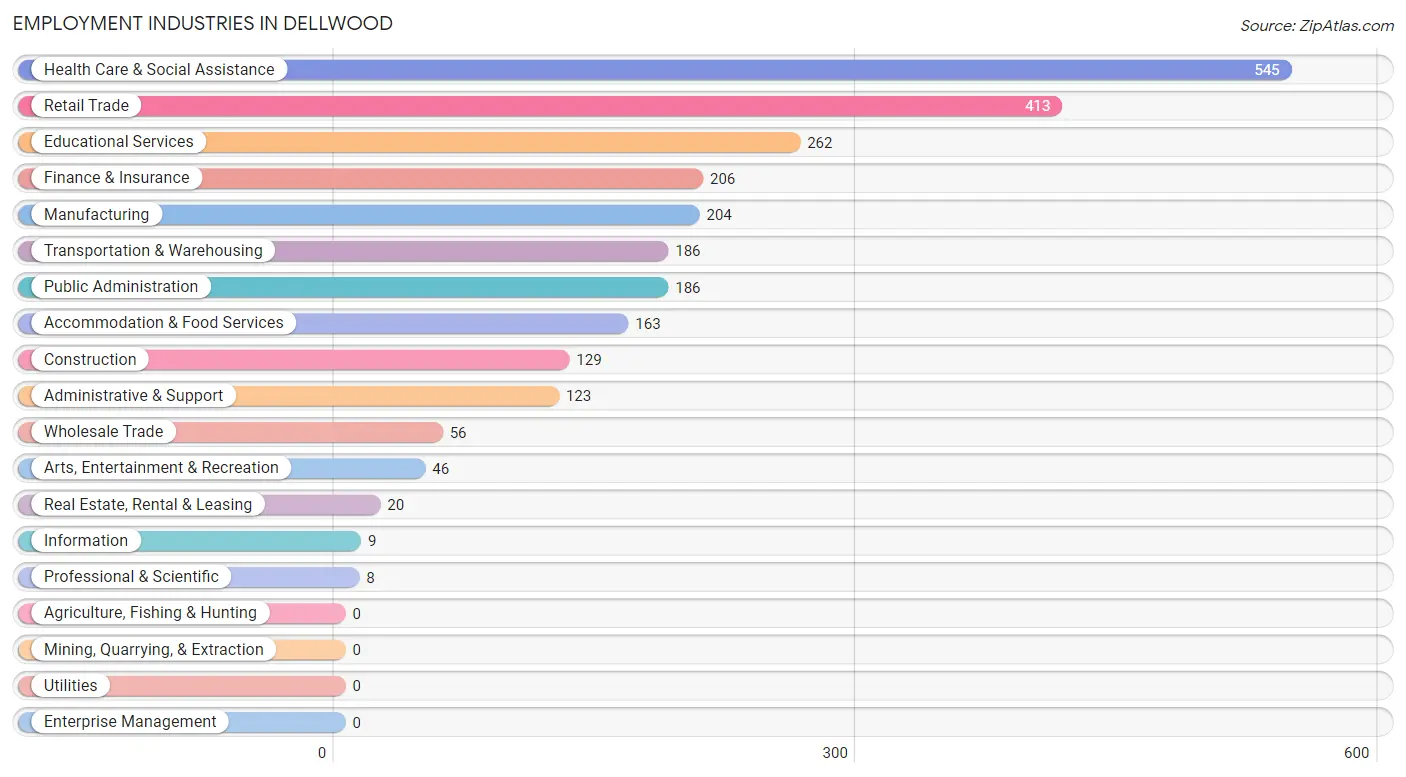
Employment Industries in Dellwood
The major employment industries in Dellwood include Health Care & Social Assistance (545 | 20.3%), Retail Trade (413 | 15.3%), Educational Services (262 | 9.7%), Finance & Insurance (206 | 7.6%), and Manufacturing (204 | 7.6%).
Employment Industries by Sex in Dellwood
The Dellwood industries that see more men than women are Construction (100.0%), Arts, Entertainment & Recreation (91.3%), and Accommodation & Food Services (80.4%), whereas the industries that tend to have a higher number of women are Information (100.0%), Finance & Insurance (100.0%), and Real Estate, Rental & Leasing (100.0%).
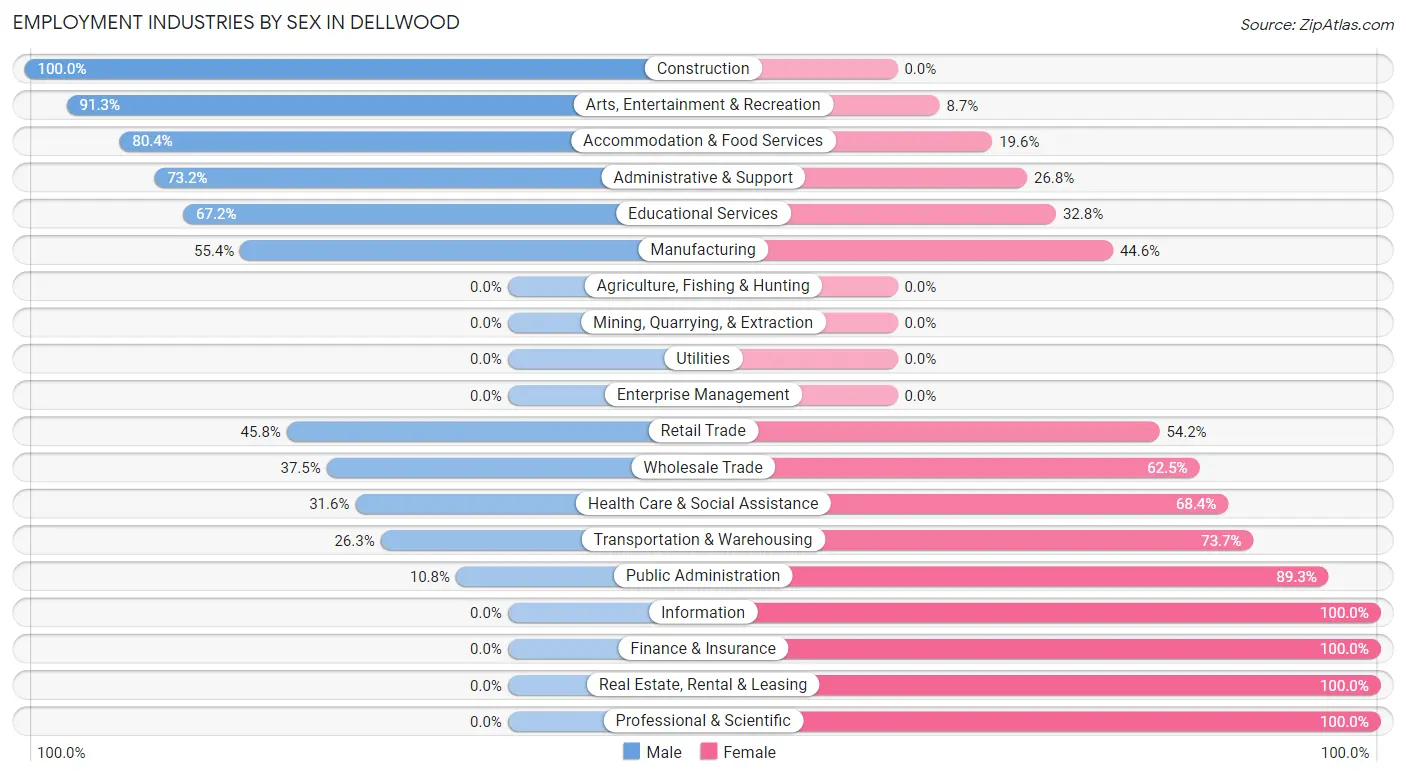
| Industry | Male | Female |
| Agriculture, Fishing & Hunting | 0 (0.0%) | 0 (0.0%) |
| Mining, Quarrying, & Extraction | 0 (0.0%) | 0 (0.0%) |
| Construction | 129 (100.0%) | 0 (0.0%) |
| Manufacturing | 113 (55.4%) | 91 (44.6%) |
| Wholesale Trade | 21 (37.5%) | 35 (62.5%) |
| Retail Trade | 189 (45.8%) | 224 (54.2%) |
| Transportation & Warehousing | 49 (26.3%) | 137 (73.7%) |
| Utilities | 0 (0.0%) | 0 (0.0%) |
| Information | 0 (0.0%) | 9 (100.0%) |
| Finance & Insurance | 0 (0.0%) | 206 (100.0%) |
| Real Estate, Rental & Leasing | 0 (0.0%) | 20 (100.0%) |
| Professional & Scientific | 0 (0.0%) | 8 (100.0%) |
| Enterprise Management | 0 (0.0%) | 0 (0.0%) |
| Administrative & Support | 90 (73.2%) | 33 (26.8%) |
| Educational Services | 176 (67.2%) | 86 (32.8%) |
| Health Care & Social Assistance | 172 (31.6%) | 373 (68.4%) |
| Arts, Entertainment & Recreation | 42 (91.3%) | 4 (8.7%) |
| Accommodation & Food Services | 131 (80.4%) | 32 (19.6%) |
| Public Administration | 20 (10.7%) | 166 (89.2%) |
| Total | 1,132 (42.0%) | 1,560 (58.0%) |
Education in Dellwood
School Enrollment in Dellwood
The most common levels of schooling among the 1,207 students in Dellwood are middle school (543 | 45.0%), elementary school (285 | 23.6%), and high school (255 | 21.1%).
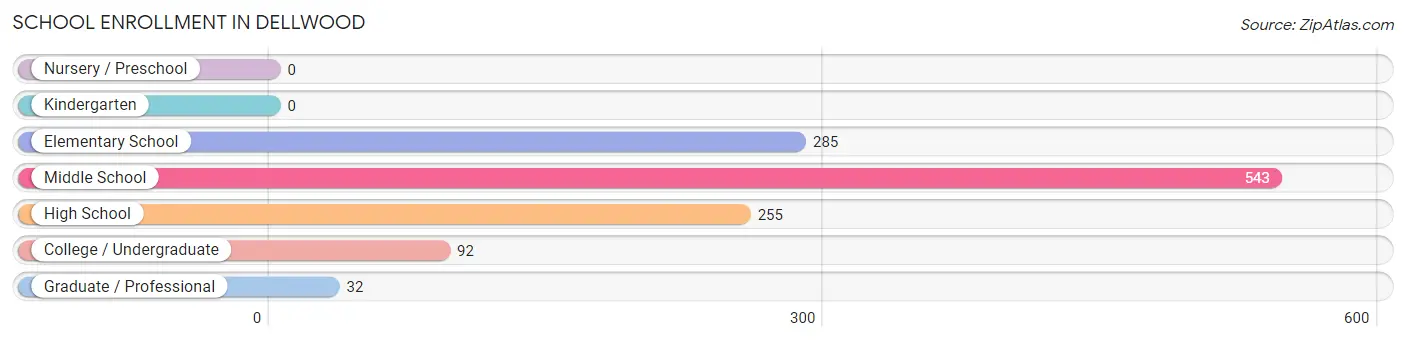
| School Level | # Students | % Students |
| Nursery / Preschool | 0 | 0.0% |
| Kindergarten | 0 | 0.0% |
| Elementary School | 285 | 23.6% |
| Middle School | 543 | 45.0% |
| High School | 255 | 21.1% |
| College / Undergraduate | 92 | 7.6% |
| Graduate / Professional | 32 | 2.6% |
| Total | 1,207 | 100.0% |
School Enrollment by Age by Funding Source in Dellwood
Out of a total of 1,207 students who are enrolled in schools in Dellwood, 142 (11.8%) attend a private institution, while the remaining 1,065 (88.2%) are enrolled in public schools. The age group of 35 years and over has the highest likelihood of being enrolled in private schools, with 32 (61.5% in the age bracket) enrolled. Conversely, the age group of 5 to 9 year old has the lowest likelihood of being enrolled in a private school, with 277 (100.0% in the age bracket) attending a public institution.
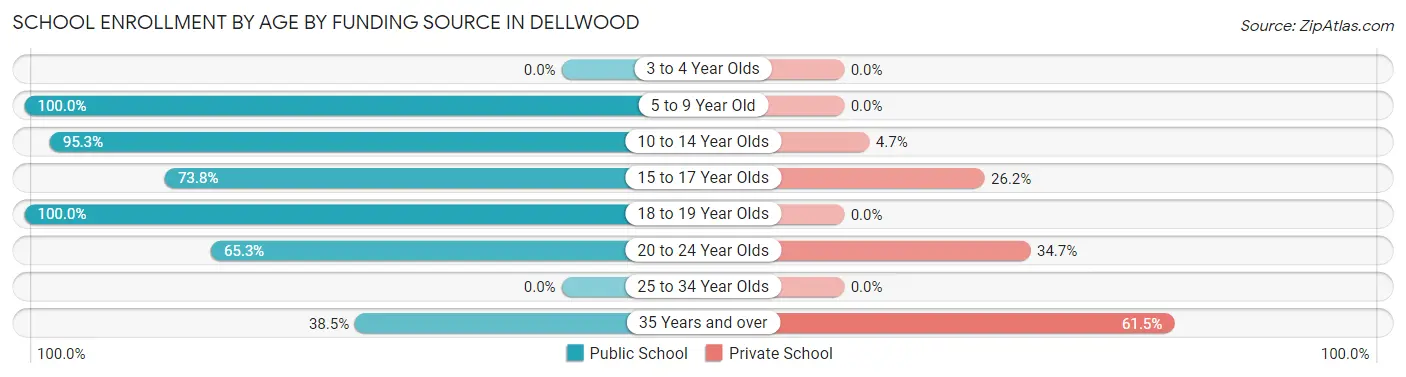
| Age Bracket | Public School | Private School |
| 3 to 4 Year Olds | 0 (0.0%) | 0 (0.0%) |
| 5 to 9 Year Old | 277 (100.0%) | 0 (0.0%) |
| 10 to 14 Year Olds | 466 (95.3%) | 23 (4.7%) |
| 15 to 17 Year Olds | 175 (73.8%) | 62 (26.2%) |
| 18 to 19 Year Olds | 80 (100.0%) | 0 (0.0%) |
| 20 to 24 Year Olds | 47 (65.3%) | 25 (34.7%) |
| 25 to 34 Year Olds | 0 (0.0%) | 0 (0.0%) |
| 35 Years and over | 20 (38.5%) | 32 (61.5%) |
| Total | 1,065 (88.2%) | 142 (11.8%) |
Educational Attainment by Field of Study in Dellwood
Business (282 | 36.3%), computers & mathematics (173 | 22.3%), arts & humanities (74 | 9.5%), education (59 | 7.6%), and social sciences (53 | 6.8%) are the most common fields of study among 776 individuals in Dellwood who have obtained a bachelor's degree or higher.
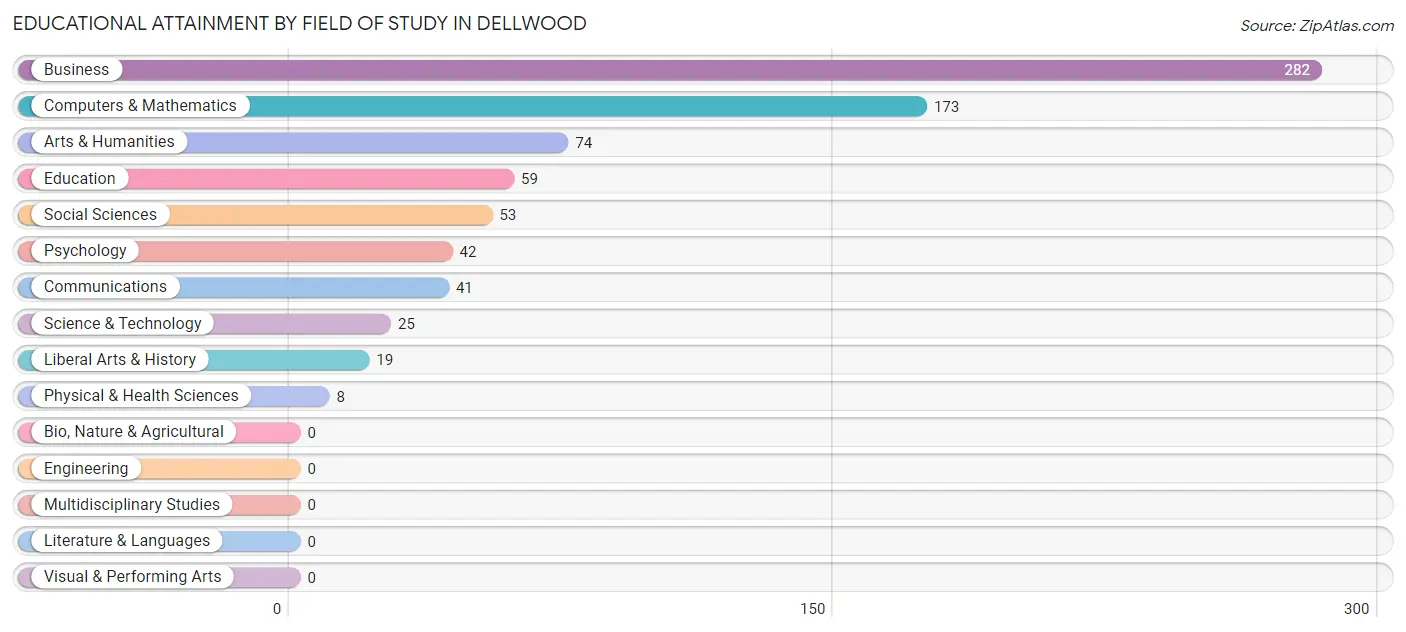
| Field of Study | # Graduates | % Graduates |
| Computers & Mathematics | 173 | 22.3% |
| Bio, Nature & Agricultural | 0 | 0.0% |
| Physical & Health Sciences | 8 | 1.0% |
| Psychology | 42 | 5.4% |
| Social Sciences | 53 | 6.8% |
| Engineering | 0 | 0.0% |
| Multidisciplinary Studies | 0 | 0.0% |
| Science & Technology | 25 | 3.2% |
| Business | 282 | 36.3% |
| Education | 59 | 7.6% |
| Literature & Languages | 0 | 0.0% |
| Liberal Arts & History | 19 | 2.5% |
| Visual & Performing Arts | 0 | 0.0% |
| Communications | 41 | 5.3% |
| Arts & Humanities | 74 | 9.5% |
| Total | 776 | 100.0% |
Transportation & Commute in Dellwood
Vehicle Availability by Sex in Dellwood
The most prevalent vehicle ownership categories in Dellwood are males with 2 vehicles (763, accounting for 68.3%) and females with 2 vehicles (645, making up 53.7%).
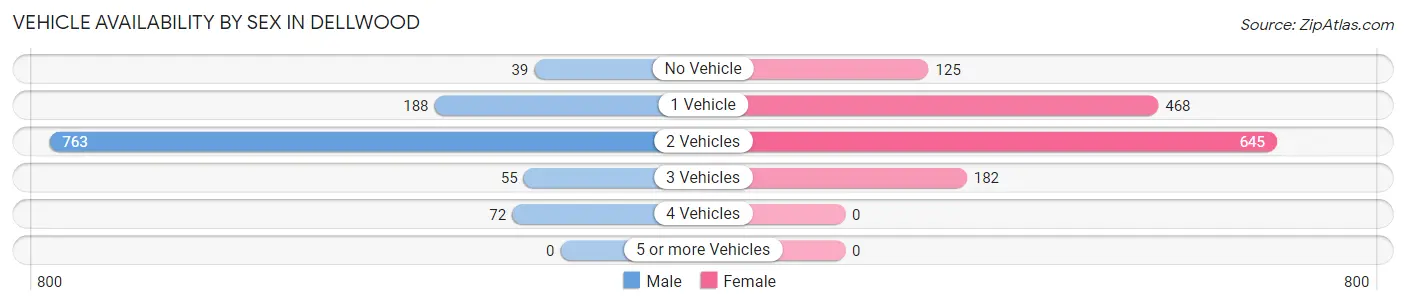
| Vehicles Available | Male | Female |
| No Vehicle | 39 (3.5%) | 125 (8.8%) |
| 1 Vehicle | 188 (16.8%) | 468 (33.0%) |
| 2 Vehicles | 763 (68.3%) | 645 (45.4%) |
| 3 Vehicles | 55 (4.9%) | 182 (12.8%) |
| 4 Vehicles | 72 (6.5%) | 0 (0.0%) |
| 5 or more Vehicles | 0 (0.0%) | 0 (0.0%) |
| Total | 1,117 (100.0%) | 1,420 (100.0%) |
Commute Time in Dellwood
The most frequently occuring commute durations in Dellwood are 20 to 24 minutes (619 commuters, 27.9%), 30 to 34 minutes (469 commuters, 21.1%), and 15 to 19 minutes (317 commuters, 14.3%).
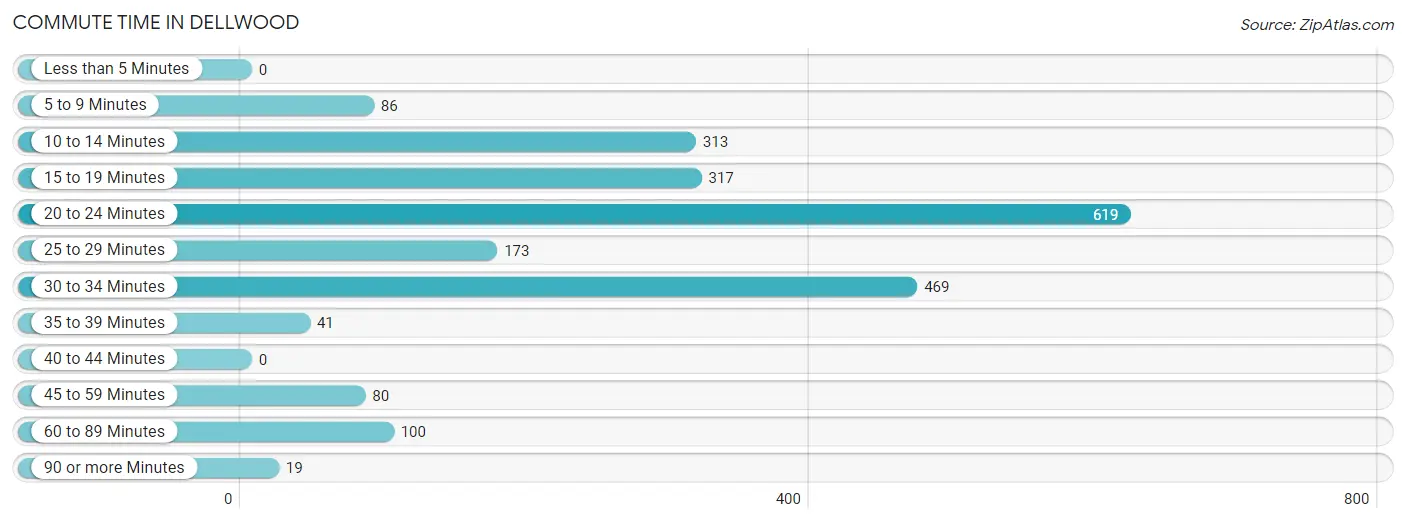
| Commute Time | # Commuters | % Commuters |
| Less than 5 Minutes | 0 | 0.0% |
| 5 to 9 Minutes | 86 | 3.9% |
| 10 to 14 Minutes | 313 | 14.1% |
| 15 to 19 Minutes | 317 | 14.3% |
| 20 to 24 Minutes | 619 | 27.9% |
| 25 to 29 Minutes | 173 | 7.8% |
| 30 to 34 Minutes | 469 | 21.1% |
| 35 to 39 Minutes | 41 | 1.8% |
| 40 to 44 Minutes | 0 | 0.0% |
| 45 to 59 Minutes | 80 | 3.6% |
| 60 to 89 Minutes | 100 | 4.5% |
| 90 or more Minutes | 19 | 0.9% |
Commute Time by Sex in Dellwood
The most common commute times in Dellwood are 20 to 24 minutes (279 commuters, 26.8%) for males and 20 to 24 minutes (340 commuters, 28.9%) for females.
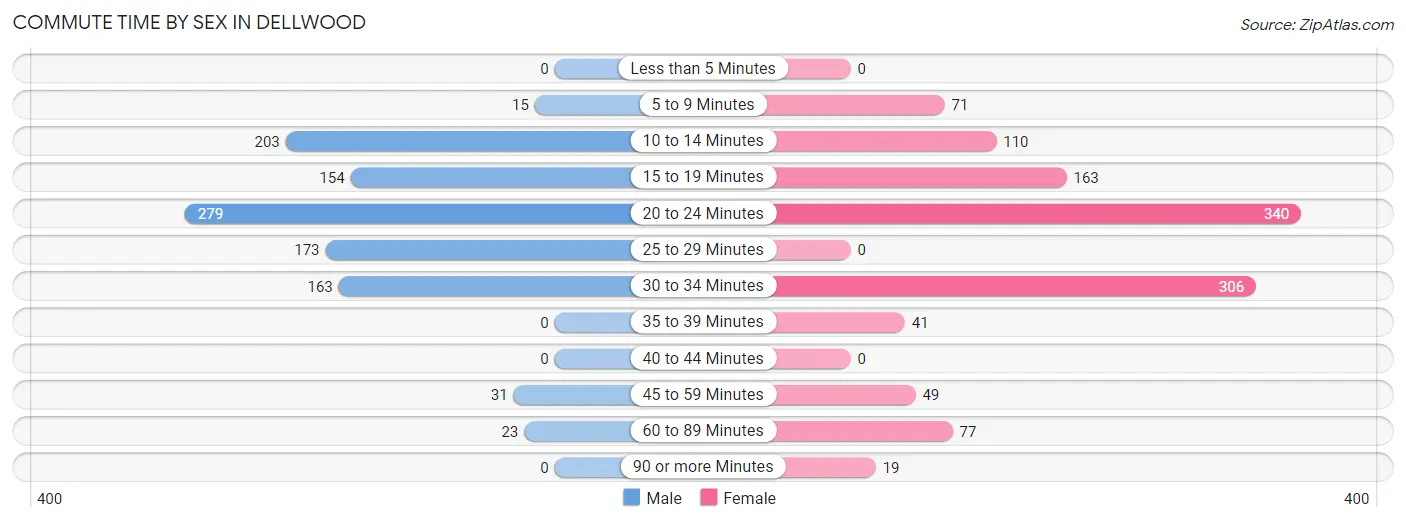
| Commute Time | Male | Female |
| Less than 5 Minutes | 0 (0.0%) | 0 (0.0%) |
| 5 to 9 Minutes | 15 (1.4%) | 71 (6.0%) |
| 10 to 14 Minutes | 203 (19.5%) | 110 (9.3%) |
| 15 to 19 Minutes | 154 (14.8%) | 163 (13.9%) |
| 20 to 24 Minutes | 279 (26.8%) | 340 (28.9%) |
| 25 to 29 Minutes | 173 (16.6%) | 0 (0.0%) |
| 30 to 34 Minutes | 163 (15.7%) | 306 (26.0%) |
| 35 to 39 Minutes | 0 (0.0%) | 41 (3.5%) |
| 40 to 44 Minutes | 0 (0.0%) | 0 (0.0%) |
| 45 to 59 Minutes | 31 (3.0%) | 49 (4.2%) |
| 60 to 89 Minutes | 23 (2.2%) | 77 (6.6%) |
| 90 or more Minutes | 0 (0.0%) | 19 (1.6%) |
Time of Departure to Work by Sex in Dellwood
The most frequent times of departure to work in Dellwood are 4:00 PM to 11:59 PM (207, 19.9%) for males and 8:00 AM to 8:29 AM (222, 18.9%) for females.
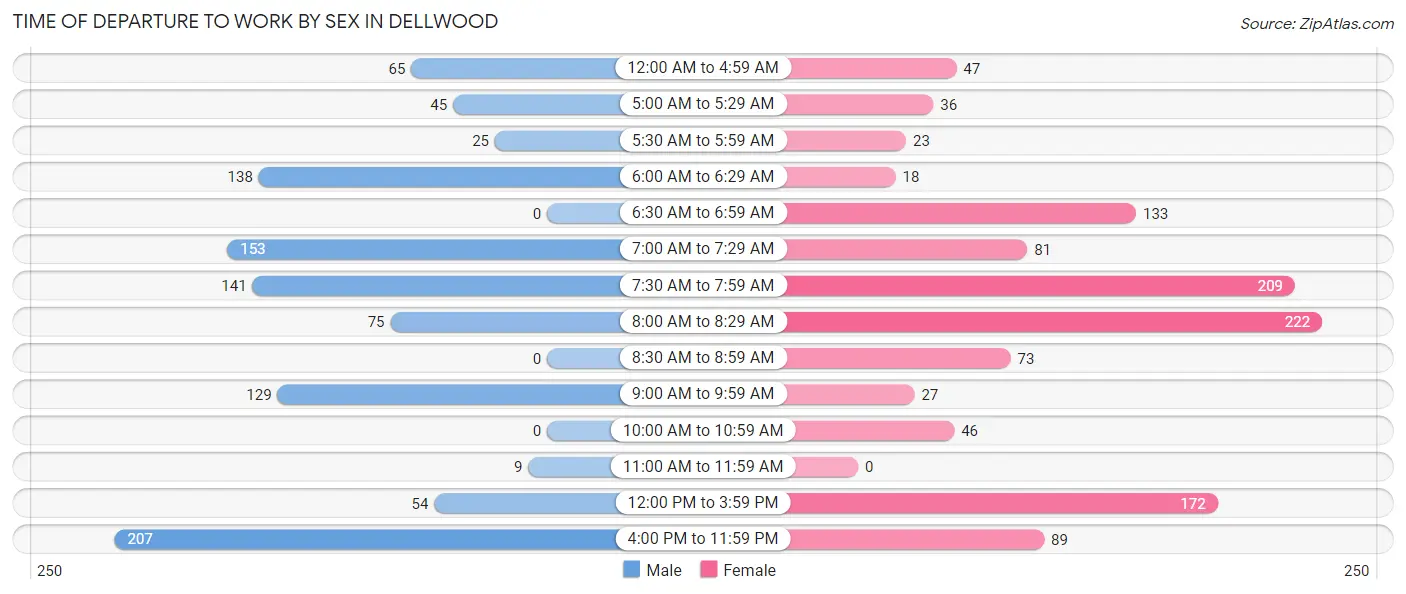
| Time of Departure | Male | Female |
| 12:00 AM to 4:59 AM | 65 (6.2%) | 47 (4.0%) |
| 5:00 AM to 5:29 AM | 45 (4.3%) | 36 (3.1%) |
| 5:30 AM to 5:59 AM | 25 (2.4%) | 23 (2.0%) |
| 6:00 AM to 6:29 AM | 138 (13.3%) | 18 (1.5%) |
| 6:30 AM to 6:59 AM | 0 (0.0%) | 133 (11.3%) |
| 7:00 AM to 7:29 AM | 153 (14.7%) | 81 (6.9%) |
| 7:30 AM to 7:59 AM | 141 (13.5%) | 209 (17.8%) |
| 8:00 AM to 8:29 AM | 75 (7.2%) | 222 (18.9%) |
| 8:30 AM to 8:59 AM | 0 (0.0%) | 73 (6.2%) |
| 9:00 AM to 9:59 AM | 129 (12.4%) | 27 (2.3%) |
| 10:00 AM to 10:59 AM | 0 (0.0%) | 46 (3.9%) |
| 11:00 AM to 11:59 AM | 9 (0.9%) | 0 (0.0%) |
| 12:00 PM to 3:59 PM | 54 (5.2%) | 172 (14.6%) |
| 4:00 PM to 11:59 PM | 207 (19.9%) | 89 (7.6%) |
| Total | 1,041 (100.0%) | 1,176 (100.0%) |
Housing Occupancy in Dellwood
Occupancy by Ownership in Dellwood
Of the total 1,923 dwellings in Dellwood, owner-occupied units account for 1,095 (56.9%), while renter-occupied units make up 828 (43.1%).
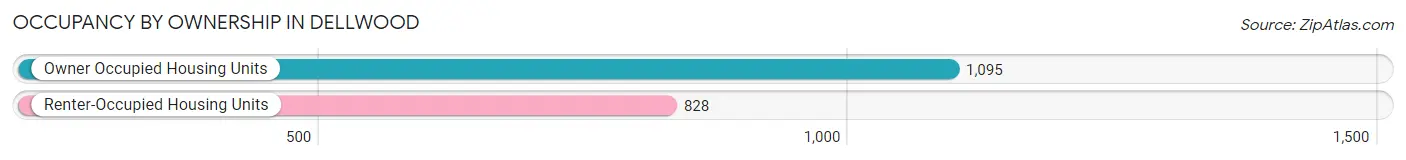
| Occupancy | # Housing Units | % Housing Units |
| Owner Occupied Housing Units | 1,095 | 56.9% |
| Renter-Occupied Housing Units | 828 | 43.1% |
| Total Occupied Housing Units | 1,923 | 100.0% |
Occupancy by Household Size in Dellwood
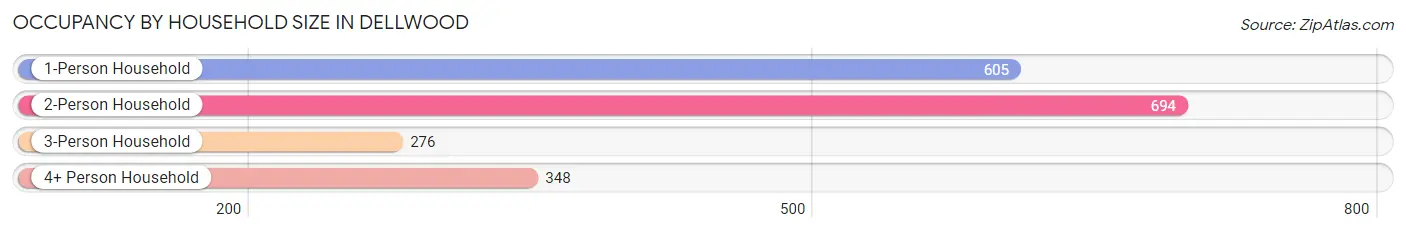
| Household Size | # Housing Units | % Housing Units |
| 1-Person Household | 605 | 31.5% |
| 2-Person Household | 694 | 36.1% |
| 3-Person Household | 276 | 14.3% |
| 4+ Person Household | 348 | 18.1% |
| Total Housing Units | 1,923 | 100.0% |
Occupancy by Ownership by Household Size in Dellwood
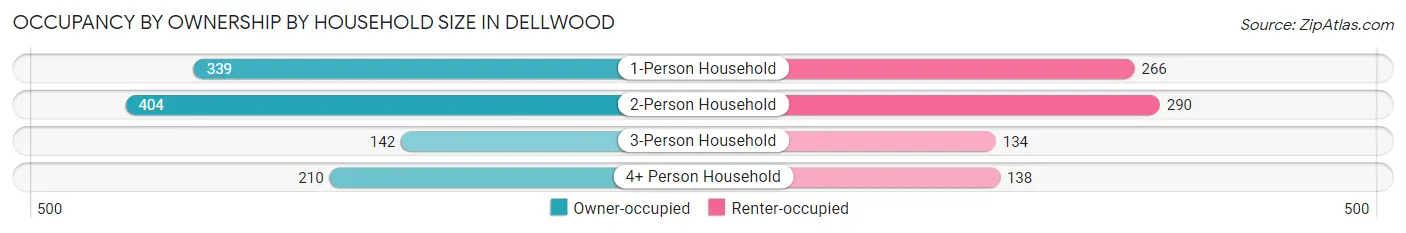
| Household Size | Owner-occupied | Renter-occupied |
| 1-Person Household | 339 (56.0%) | 266 (44.0%) |
| 2-Person Household | 404 (58.2%) | 290 (41.8%) |
| 3-Person Household | 142 (51.4%) | 134 (48.5%) |
| 4+ Person Household | 210 (60.3%) | 138 (39.7%) |
| Total Housing Units | 1,095 (56.9%) | 828 (43.1%) |
Occupancy by Educational Attainment in Dellwood
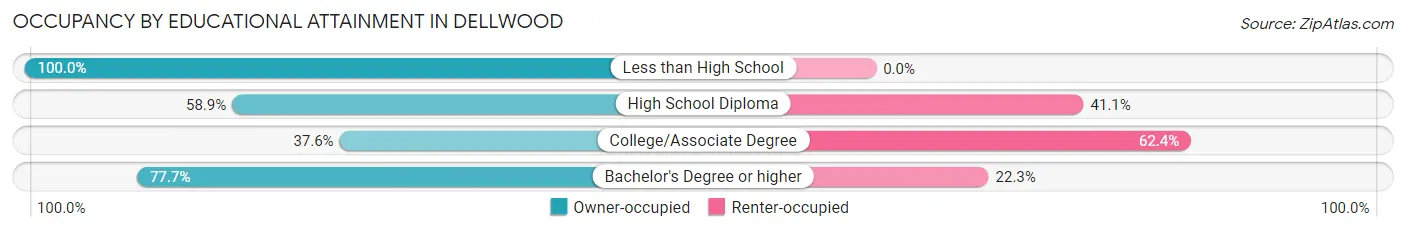
| Household Size | Owner-occupied | Renter-occupied |
| Less than High School | 83 (100.0%) | 0 (0.0%) |
| High School Diploma | 498 (58.9%) | 348 (41.1%) |
| College/Associate Degree | 242 (37.6%) | 402 (62.4%) |
| Bachelor's Degree or higher | 272 (77.7%) | 78 (22.3%) |
Occupancy by Age of Householder in Dellwood
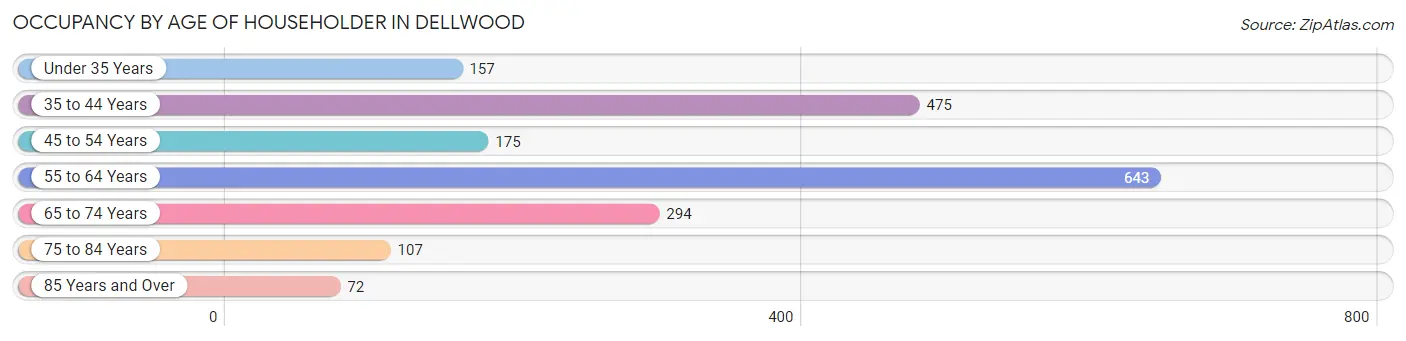
| Age Bracket | # Households | % Households |
| Under 35 Years | 157 | 8.2% |
| 35 to 44 Years | 475 | 24.7% |
| 45 to 54 Years | 175 | 9.1% |
| 55 to 64 Years | 643 | 33.4% |
| 65 to 74 Years | 294 | 15.3% |
| 75 to 84 Years | 107 | 5.6% |
| 85 Years and Over | 72 | 3.7% |
| Total | 1,923 | 100.0% |
Housing Finances in Dellwood
Median Income by Occupancy in Dellwood
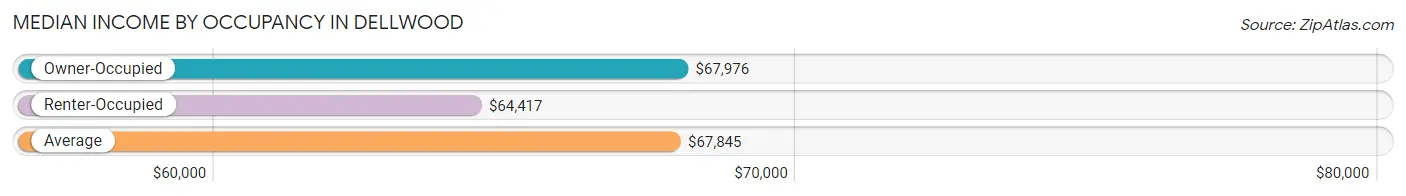
| Occupancy Type | # Households | Median Income |
| Owner-Occupied | 1,095 (56.9%) | $67,976 |
| Renter-Occupied | 828 (43.1%) | $64,417 |
| Average | 1,923 (100.0%) | $67,845 |
Occupancy by Householder Income Bracket in Dellwood
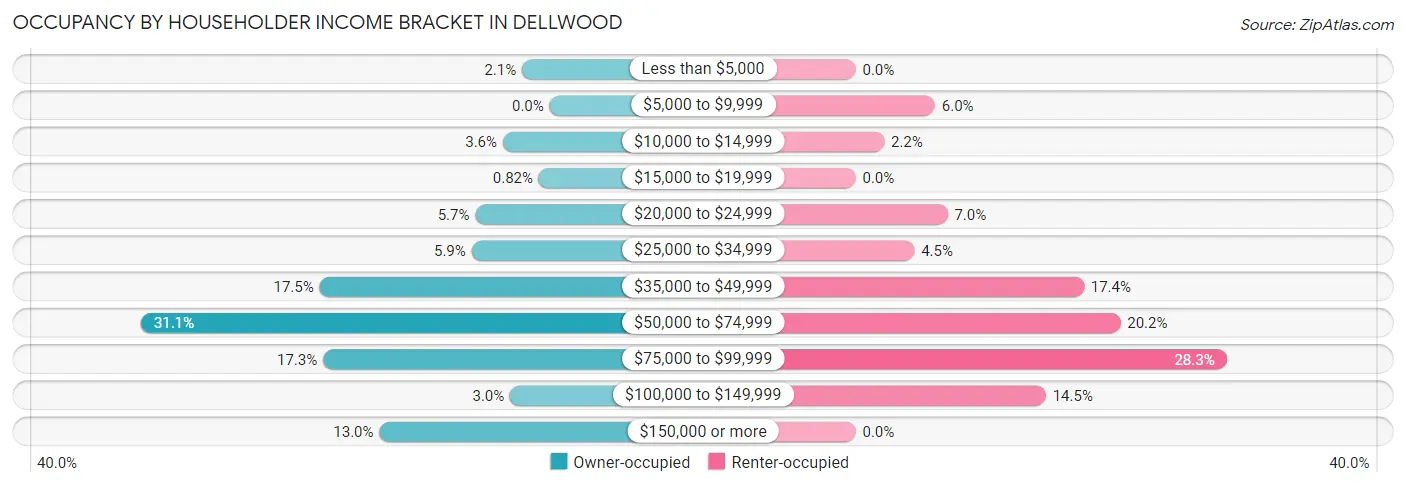
| Income Bracket | Owner-occupied | Renter-occupied |
| Less than $5,000 | 23 (2.1%) | 0 (0.0%) |
| $5,000 to $9,999 | 0 (0.0%) | 50 (6.0%) |
| $10,000 to $14,999 | 39 (3.6%) | 18 (2.2%) |
| $15,000 to $19,999 | 9 (0.8%) | 0 (0.0%) |
| $20,000 to $24,999 | 62 (5.7%) | 58 (7.0%) |
| $25,000 to $34,999 | 65 (5.9%) | 37 (4.5%) |
| $35,000 to $49,999 | 192 (17.5%) | 144 (17.4%) |
| $50,000 to $74,999 | 341 (31.1%) | 167 (20.2%) |
| $75,000 to $99,999 | 189 (17.3%) | 234 (28.3%) |
| $100,000 to $149,999 | 33 (3.0%) | 120 (14.5%) |
| $150,000 or more | 142 (13.0%) | 0 (0.0%) |
| Total | 1,095 (100.0%) | 828 (100.0%) |
Monthly Housing Cost Tiers in Dellwood
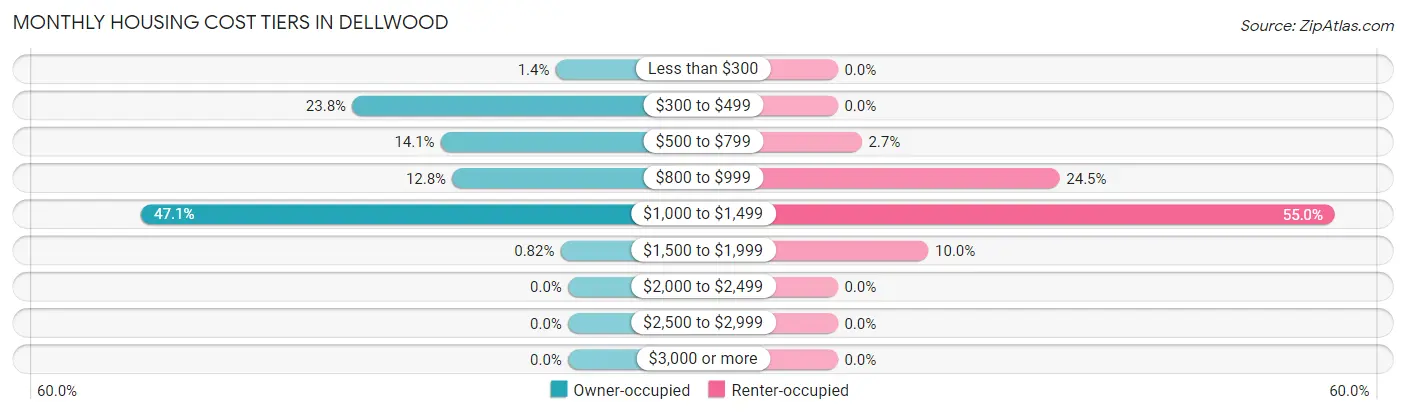
| Monthly Cost | Owner-occupied | Renter-occupied |
| Less than $300 | 15 (1.4%) | 0 (0.0%) |
| $300 to $499 | 261 (23.8%) | 0 (0.0%) |
| $500 to $799 | 154 (14.1%) | 22 (2.7%) |
| $800 to $999 | 140 (12.8%) | 203 (24.5%) |
| $1,000 to $1,499 | 516 (47.1%) | 455 (54.9%) |
| $1,500 to $1,999 | 9 (0.8%) | 83 (10.0%) |
| $2,000 to $2,499 | 0 (0.0%) | 0 (0.0%) |
| $2,500 to $2,999 | 0 (0.0%) | 0 (0.0%) |
| $3,000 or more | 0 (0.0%) | 0 (0.0%) |
| Total | 1,095 (100.0%) | 828 (100.0%) |
Physical Housing Characteristics in Dellwood
Housing Structures in Dellwood
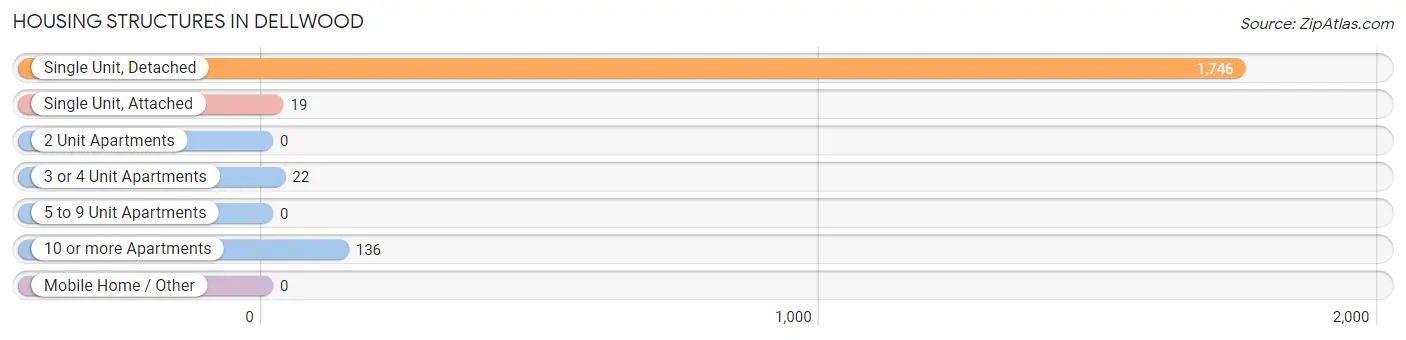
| Structure Type | # Housing Units | % Housing Units |
| Single Unit, Detached | 1,746 | 90.8% |
| Single Unit, Attached | 19 | 1.0% |
| 2 Unit Apartments | 0 | 0.0% |
| 3 or 4 Unit Apartments | 22 | 1.1% |
| 5 to 9 Unit Apartments | 0 | 0.0% |
| 10 or more Apartments | 136 | 7.1% |
| Mobile Home / Other | 0 | 0.0% |
| Total | 1,923 | 100.0% |
Housing Structures by Occupancy in Dellwood
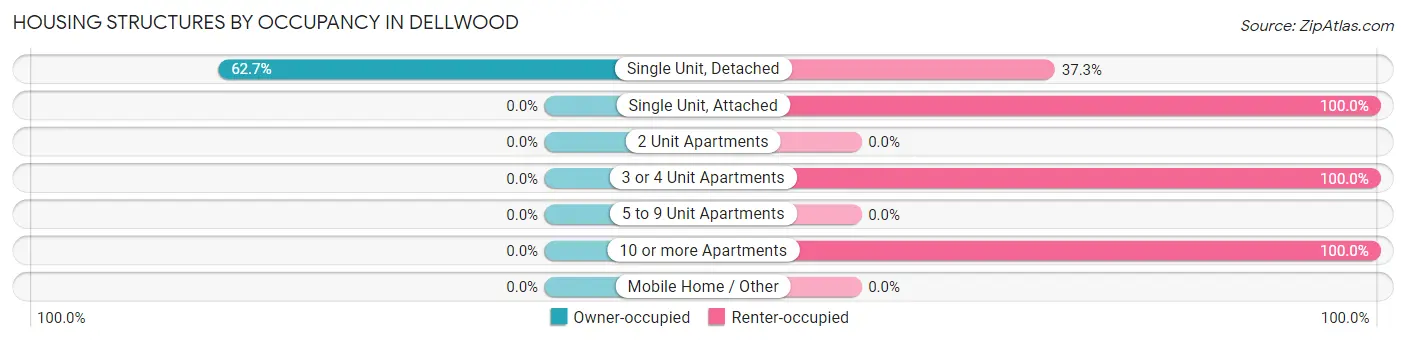
| Structure Type | Owner-occupied | Renter-occupied |
| Single Unit, Detached | 1,095 (62.7%) | 651 (37.3%) |
| Single Unit, Attached | 0 (0.0%) | 19 (100.0%) |
| 2 Unit Apartments | 0 (0.0%) | 0 (0.0%) |
| 3 or 4 Unit Apartments | 0 (0.0%) | 22 (100.0%) |
| 5 to 9 Unit Apartments | 0 (0.0%) | 0 (0.0%) |
| 10 or more Apartments | 0 (0.0%) | 136 (100.0%) |
| Mobile Home / Other | 0 (0.0%) | 0 (0.0%) |
| Total | 1,095 (56.9%) | 828 (43.1%) |
Housing Structures by Number of Rooms in Dellwood
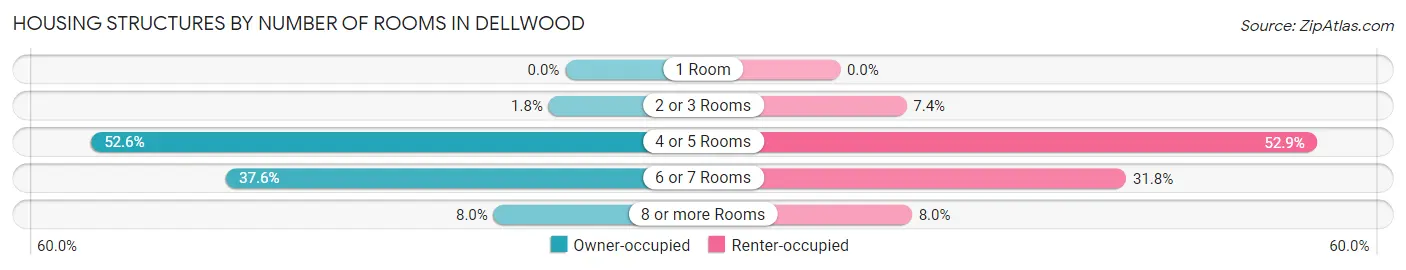
| Number of Rooms | Owner-occupied | Renter-occupied |
| 1 Room | 0 (0.0%) | 0 (0.0%) |
| 2 or 3 Rooms | 20 (1.8%) | 61 (7.4%) |
| 4 or 5 Rooms | 576 (52.6%) | 438 (52.9%) |
| 6 or 7 Rooms | 412 (37.6%) | 263 (31.8%) |
| 8 or more Rooms | 87 (8.0%) | 66 (8.0%) |
| Total | 1,095 (100.0%) | 828 (100.0%) |
Housing Structure by Heating Type in Dellwood
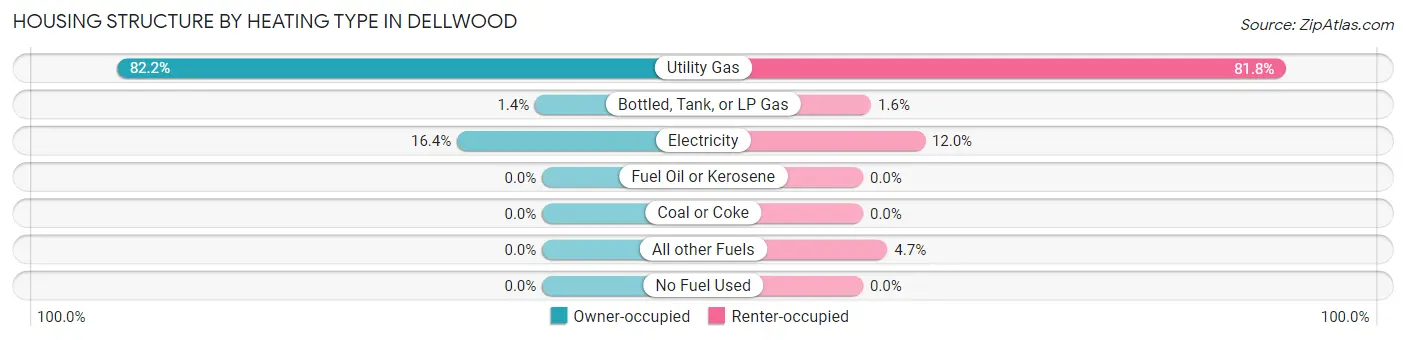
| Heating Type | Owner-occupied | Renter-occupied |
| Utility Gas | 900 (82.2%) | 677 (81.8%) |
| Bottled, Tank, or LP Gas | 15 (1.4%) | 13 (1.6%) |
| Electricity | 180 (16.4%) | 99 (12.0%) |
| Fuel Oil or Kerosene | 0 (0.0%) | 0 (0.0%) |
| Coal or Coke | 0 (0.0%) | 0 (0.0%) |
| All other Fuels | 0 (0.0%) | 39 (4.7%) |
| No Fuel Used | 0 (0.0%) | 0 (0.0%) |
| Total | 1,095 (100.0%) | 828 (100.0%) |
Household Vehicle Usage in Dellwood
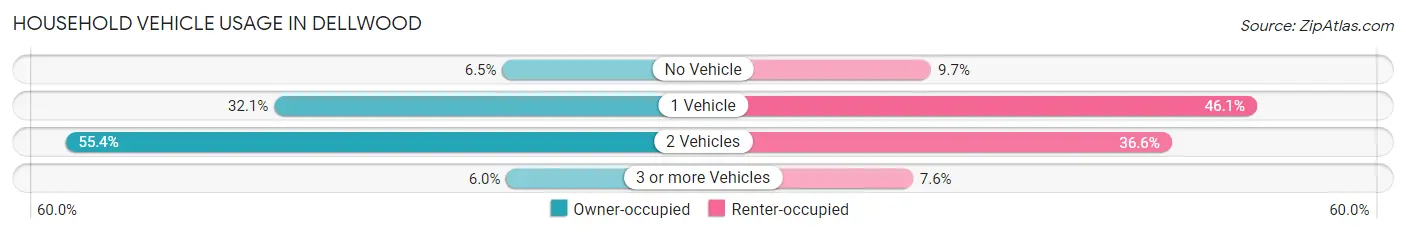
| Vehicles per Household | Owner-occupied | Renter-occupied |
| No Vehicle | 71 (6.5%) | 80 (9.7%) |
| 1 Vehicle | 351 (32.1%) | 382 (46.1%) |
| 2 Vehicles | 607 (55.4%) | 303 (36.6%) |
| 3 or more Vehicles | 66 (6.0%) | 63 (7.6%) |
| Total | 1,095 (100.0%) | 828 (100.0%) |
Real Estate & Mortgages in Dellwood
Real Estate and Mortgage Overview in Dellwood
| Characteristic | Without Mortgage | With Mortgage |
| Housing Units | 370 | 725 |
| Median Property Value | $69,300 | $76,300 |
| Median Household Income | $60,313 | $46 |
| Monthly Housing Costs | $446 | $0 |
| Real Estate Taxes | $1,668 | $1 |
Property Value by Mortgage Status in Dellwood
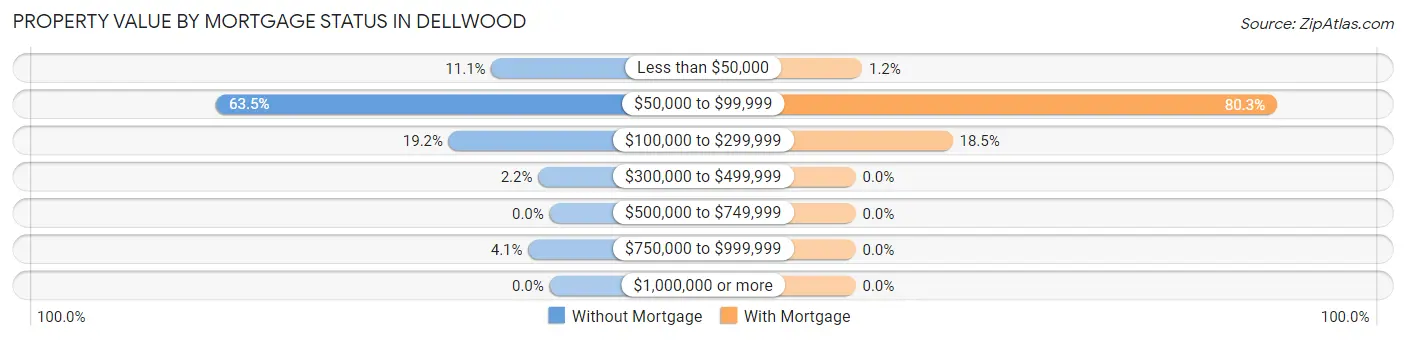
| Property Value | Without Mortgage | With Mortgage |
| Less than $50,000 | 41 (11.1%) | 9 (1.2%) |
| $50,000 to $99,999 | 235 (63.5%) | 582 (80.3%) |
| $100,000 to $299,999 | 71 (19.2%) | 134 (18.5%) |
| $300,000 to $499,999 | 8 (2.2%) | 0 (0.0%) |
| $500,000 to $749,999 | 0 (0.0%) | 0 (0.0%) |
| $750,000 to $999,999 | 15 (4.1%) | 0 (0.0%) |
| $1,000,000 or more | 0 (0.0%) | 0 (0.0%) |
| Total | 370 (100.0%) | 725 (100.0%) |
Household Income by Mortgage Status in Dellwood
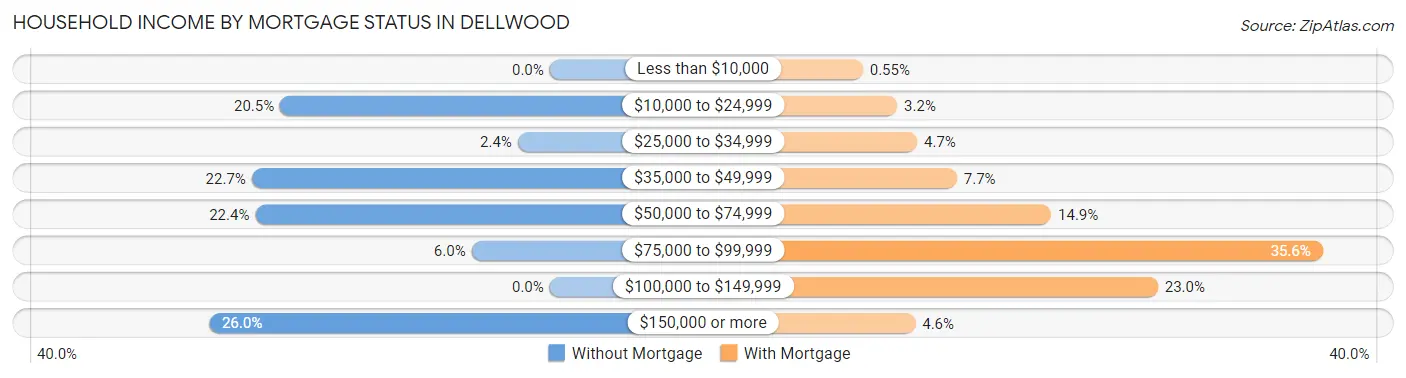
| Household Income | Without Mortgage | With Mortgage |
| Less than $10,000 | 0 (0.0%) | 4 (0.5%) |
| $10,000 to $24,999 | 76 (20.5%) | 23 (3.2%) |
| $25,000 to $34,999 | 9 (2.4%) | 34 (4.7%) |
| $35,000 to $49,999 | 84 (22.7%) | 56 (7.7%) |
| $50,000 to $74,999 | 83 (22.4%) | 108 (14.9%) |
| $75,000 to $99,999 | 22 (5.9%) | 258 (35.6%) |
| $100,000 to $149,999 | 0 (0.0%) | 167 (23.0%) |
| $150,000 or more | 96 (26.0%) | 33 (4.5%) |
| Total | 370 (100.0%) | 725 (100.0%) |
Property Value to Household Income Ratio in Dellwood
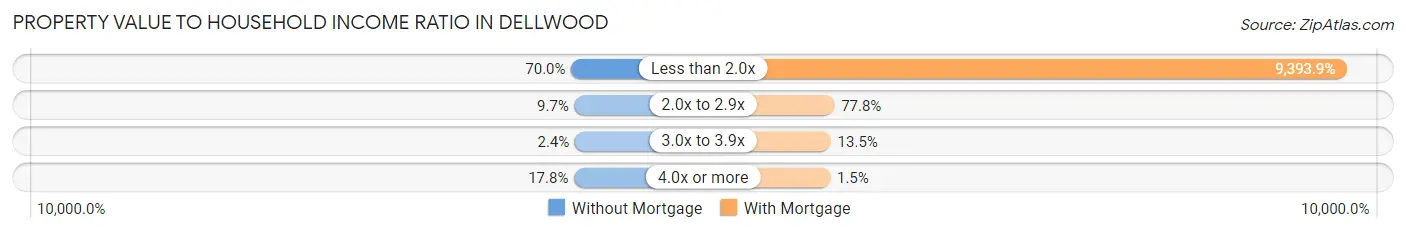
| Value-to-Income Ratio | Without Mortgage | With Mortgage |
| Less than 2.0x | 259 (70.0%) | 68,106 (9,393.9%) |
| 2.0x to 2.9x | 36 (9.7%) | 564 (77.8%) |
| 3.0x to 3.9x | 9 (2.4%) | 98 (13.5%) |
| 4.0x or more | 66 (17.8%) | 11 (1.5%) |
| Total | 370 (100.0%) | 725 (100.0%) |
Real Estate Taxes by Mortgage Status in Dellwood
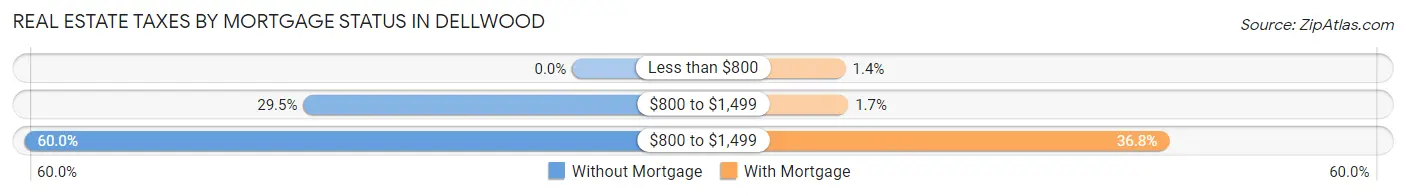
| Property Taxes | Without Mortgage | With Mortgage |
| Less than $800 | 0 (0.0%) | 10 (1.4%) |
| $800 to $1,499 | 109 (29.5%) | 12 (1.7%) |
| $800 to $1,499 | 222 (60.0%) | 267 (36.8%) |
| Total | 370 (100.0%) | 725 (100.0%) |
Health & Disability in Dellwood
Health Insurance Coverage by Age in Dellwood
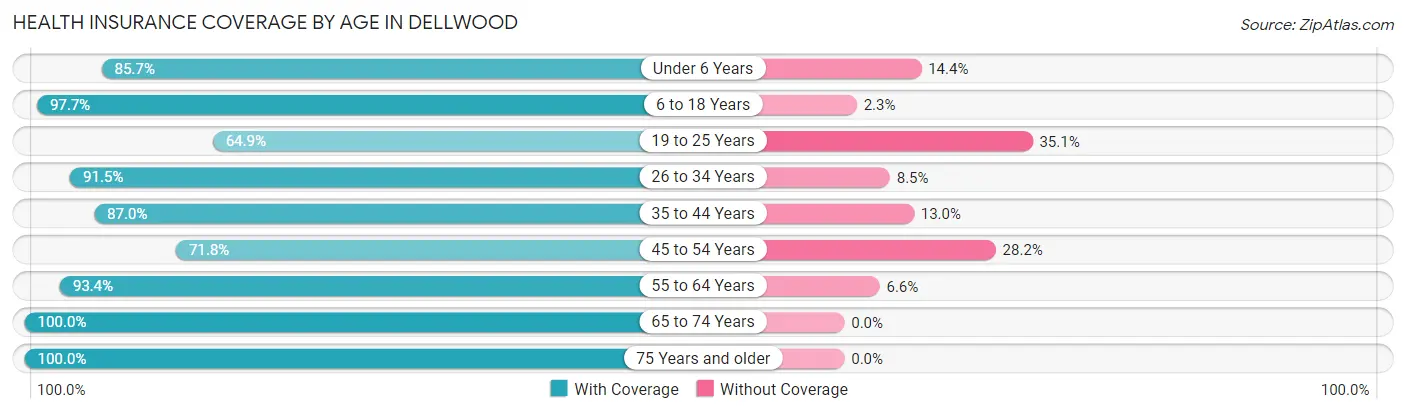
| Age Bracket | With Coverage | Without Coverage |
| Under 6 Years | 179 (85.7%) | 30 (14.3%) |
| 6 to 18 Years | 1,058 (97.7%) | 25 (2.3%) |
| 19 to 25 Years | 246 (64.9%) | 133 (35.1%) |
| 26 to 34 Years | 453 (91.5%) | 42 (8.5%) |
| 35 to 44 Years | 645 (87.0%) | 96 (13.0%) |
| 45 to 54 Years | 178 (71.8%) | 70 (28.2%) |
| 55 to 64 Years | 925 (93.4%) | 65 (6.6%) |
| 65 to 74 Years | 435 (100.0%) | 0 (0.0%) |
| 75 Years and older | 319 (100.0%) | 0 (0.0%) |
| Total | 4,438 (90.6%) | 461 (9.4%) |
Health Insurance Coverage by Citizenship Status in Dellwood
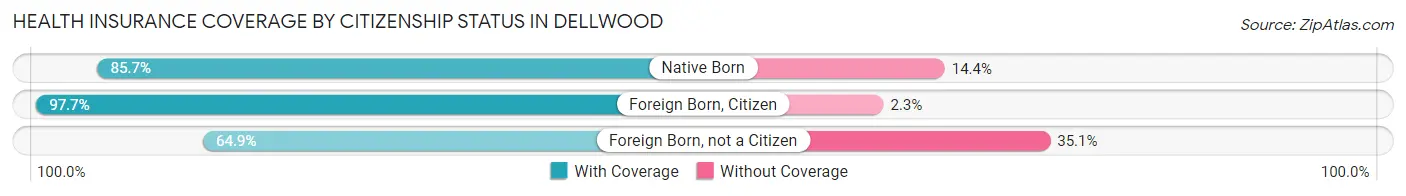
| Citizenship Status | With Coverage | Without Coverage |
| Native Born | 179 (85.7%) | 30 (14.3%) |
| Foreign Born, Citizen | 1,058 (97.7%) | 25 (2.3%) |
| Foreign Born, not a Citizen | 246 (64.9%) | 133 (35.1%) |
Health Insurance Coverage by Household Income in Dellwood
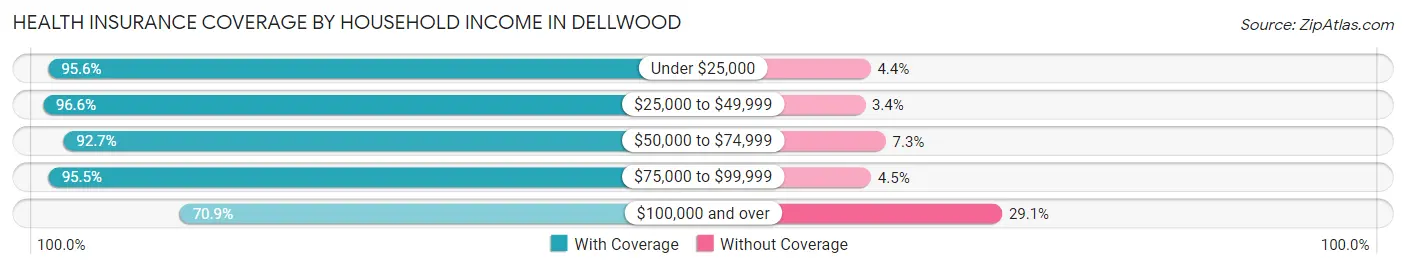
| Household Income | With Coverage | Without Coverage |
| Under $25,000 | 582 (95.6%) | 27 (4.4%) |
| $25,000 to $49,999 | 708 (96.6%) | 25 (3.4%) |
| $50,000 to $74,999 | 1,710 (92.7%) | 134 (7.3%) |
| $75,000 to $99,999 | 867 (95.5%) | 41 (4.5%) |
| $100,000 and over | 571 (70.9%) | 234 (29.1%) |
Public vs Private Health Insurance Coverage by Age in Dellwood
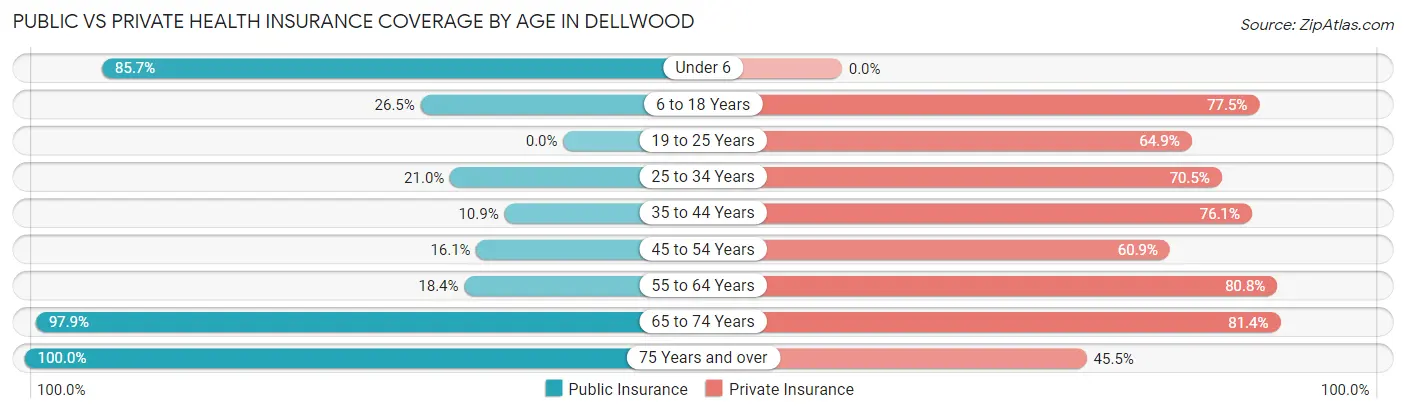
| Age Bracket | Public Insurance | Private Insurance |
| Under 6 | 179 (85.7%) | 0 (0.0%) |
| 6 to 18 Years | 287 (26.5%) | 839 (77.5%) |
| 19 to 25 Years | 0 (0.0%) | 246 (64.9%) |
| 25 to 34 Years | 104 (21.0%) | 349 (70.5%) |
| 35 to 44 Years | 81 (10.9%) | 564 (76.1%) |
| 45 to 54 Years | 40 (16.1%) | 151 (60.9%) |
| 55 to 64 Years | 182 (18.4%) | 800 (80.8%) |
| 65 to 74 Years | 426 (97.9%) | 354 (81.4%) |
| 75 Years and over | 319 (100.0%) | 145 (45.5%) |
| Total | 1,618 (33.0%) | 3,448 (70.4%) |
Disability Status by Sex by Age in Dellwood
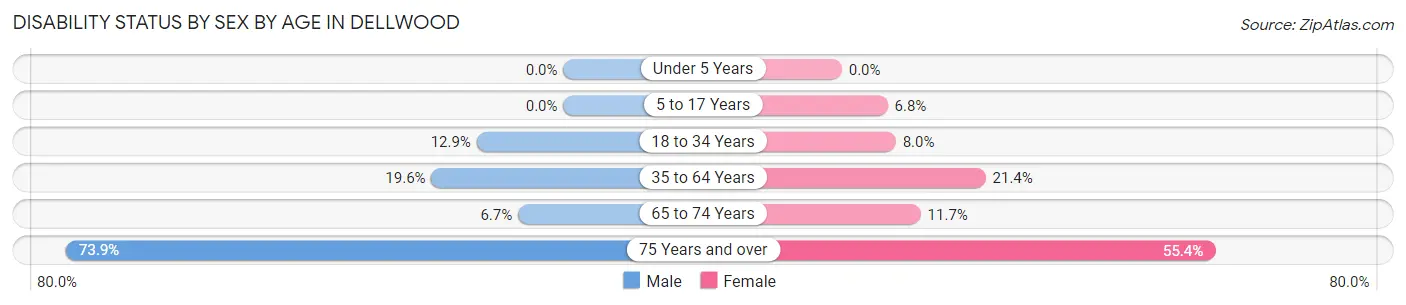
| Age Bracket | Male | Female |
| Under 5 Years | 0 (0.0%) | 0 (0.0%) |
| 5 to 17 Years | 0 (0.0%) | 21 (6.8%) |
| 18 to 34 Years | 73 (12.9%) | 31 (8.0%) |
| 35 to 64 Years | 163 (19.6%) | 245 (21.4%) |
| 65 to 74 Years | 8 (6.7%) | 37 (11.7%) |
| 75 Years and over | 113 (73.9%) | 92 (55.4%) |
Disability Class by Sex by Age in Dellwood
Disability Class: Hearing Difficulty
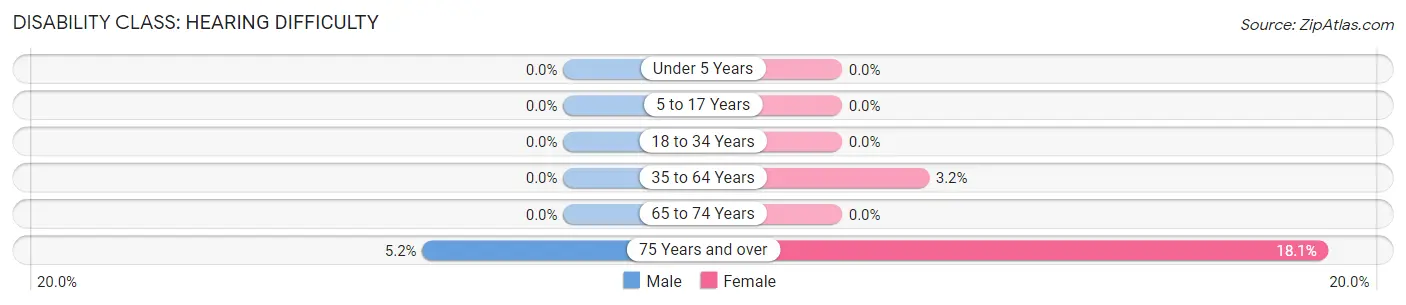
| Age Bracket | Male | Female |
| Under 5 Years | 0 (0.0%) | 0 (0.0%) |
| 5 to 17 Years | 0 (0.0%) | 0 (0.0%) |
| 18 to 34 Years | 0 (0.0%) | 0 (0.0%) |
| 35 to 64 Years | 0 (0.0%) | 37 (3.2%) |
| 65 to 74 Years | 0 (0.0%) | 0 (0.0%) |
| 75 Years and over | 8 (5.2%) | 30 (18.1%) |
Disability Class: Vision Difficulty
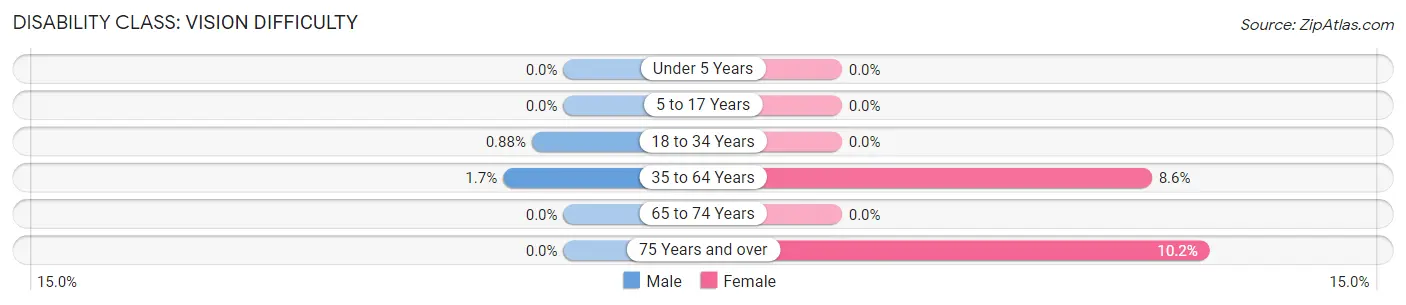
| Age Bracket | Male | Female |
| Under 5 Years | 0 (0.0%) | 0 (0.0%) |
| 5 to 17 Years | 0 (0.0%) | 0 (0.0%) |
| 18 to 34 Years | 5 (0.9%) | 0 (0.0%) |
| 35 to 64 Years | 14 (1.7%) | 99 (8.6%) |
| 65 to 74 Years | 0 (0.0%) | 0 (0.0%) |
| 75 Years and over | 0 (0.0%) | 17 (10.2%) |
Disability Class: Cognitive Difficulty
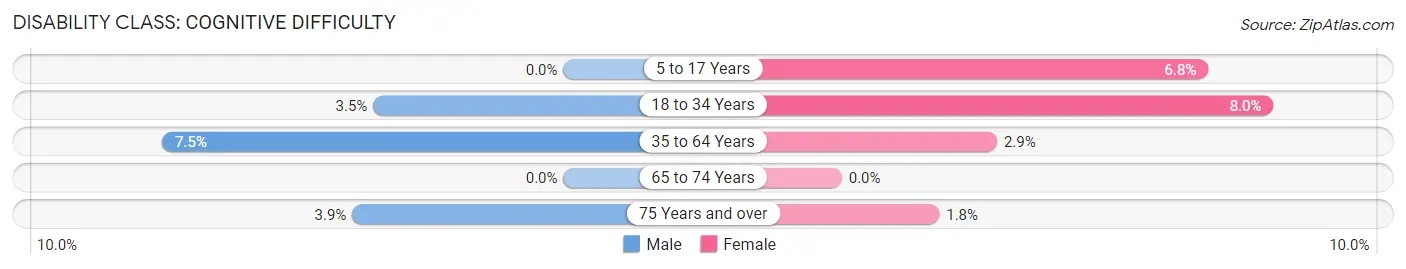
| Age Bracket | Male | Female |
| 5 to 17 Years | 0 (0.0%) | 21 (6.8%) |
| 18 to 34 Years | 20 (3.5%) | 31 (8.0%) |
| 35 to 64 Years | 62 (7.4%) | 33 (2.9%) |
| 65 to 74 Years | 0 (0.0%) | 0 (0.0%) |
| 75 Years and over | 6 (3.9%) | 3 (1.8%) |
Disability Class: Ambulatory Difficulty
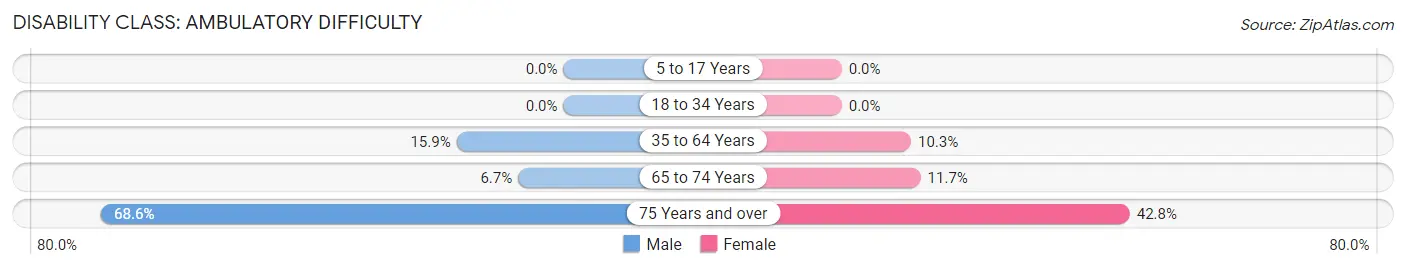
| Age Bracket | Male | Female |
| 5 to 17 Years | 0 (0.0%) | 0 (0.0%) |
| 18 to 34 Years | 0 (0.0%) | 0 (0.0%) |
| 35 to 64 Years | 132 (15.9%) | 118 (10.3%) |
| 65 to 74 Years | 8 (6.7%) | 37 (11.7%) |
| 75 Years and over | 105 (68.6%) | 71 (42.8%) |
Disability Class: Self-Care Difficulty
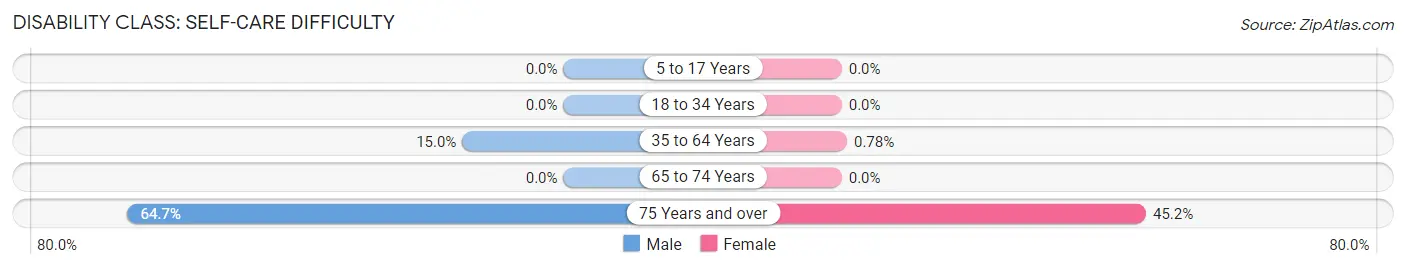
| Age Bracket | Male | Female |
| 5 to 17 Years | 0 (0.0%) | 0 (0.0%) |
| 18 to 34 Years | 0 (0.0%) | 0 (0.0%) |
| 35 to 64 Years | 125 (15.0%) | 9 (0.8%) |
| 65 to 74 Years | 0 (0.0%) | 0 (0.0%) |
| 75 Years and over | 99 (64.7%) | 75 (45.2%) |
Technology Access in Dellwood
Computing Device Access in Dellwood
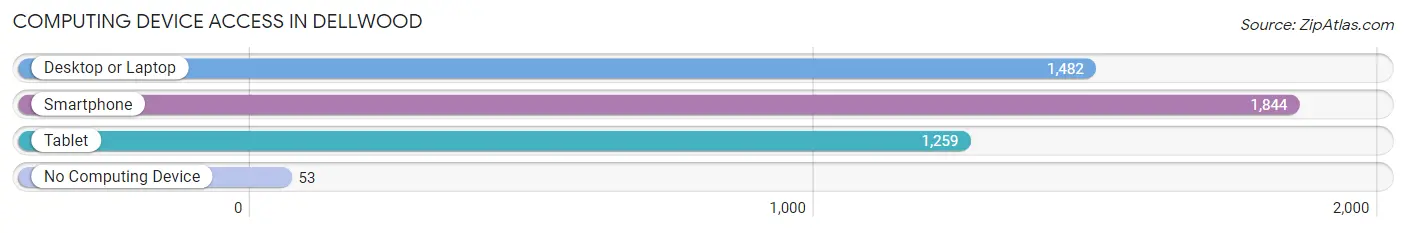
| Device Type | # Households | % Households |
| Desktop or Laptop | 1,482 | 77.1% |
| Smartphone | 1,844 | 95.9% |
| Tablet | 1,259 | 65.5% |
| No Computing Device | 53 | 2.8% |
| Total | 1,923 | 100.0% |
Internet Access in Dellwood
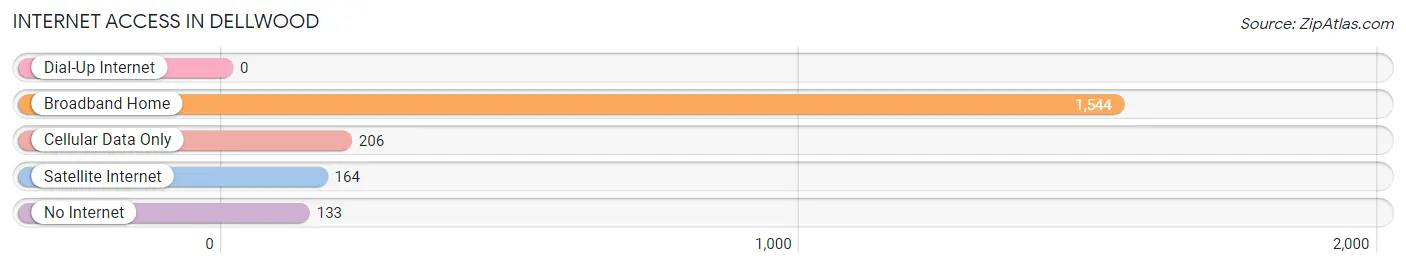
| Internet Type | # Households | % Households |
| Dial-Up Internet | 0 | 0.0% |
| Broadband Home | 1,544 | 80.3% |
| Cellular Data Only | 206 | 10.7% |
| Satellite Internet | 164 | 8.5% |
| No Internet | 133 | 6.9% |
| Total | 1,923 | 100.0% |
Dellwood Summary
Dellwood is a city located in St. Louis County, Missouri, United States. The population was 6,902 at the 2010 census. Dellwood is located in the northern part of the county, just south of the city of Ferguson.
History
Dellwood was founded in 1891 by William and Mary Dell, who purchased a large tract of land in the area. The city was incorporated in 1947.
Geography
Dellwood is located at 38 45 25 North 90 19 17 West 38 756944 90 321389
According to the United States Census Bureau, the city has a total area of 1.2 square miles (3.1 km2), all land.
Economy
Dellwood is home to a variety of businesses, including a number of small retail stores, restaurants, and professional services. The city is also home to a number of industrial and manufacturing businesses.
Demographics
As of the census of 2000, there were 6,902 people, 2,717 households, and 1,845 families residing in the city. The population density was 5,717.2 people per square mile (2,213.2/km2). There were 2,845 housing units at an average density of 2,346.2 per square mile (902.2/km2). The racial makeup of the city was 57.2% White, 37.7% African American, 0.2% Native American, 0.7% Asian, 0.1% Pacific Islander, 1.2% from other races, and 3.0% from two or more races. Hispanic or Latino of any race were 2.7% of the population.
There were 2,717 households, out of which 33.2% had children under the age of 18 living with them, 41.2% were married couples living together, 22.2% had a female householder with no husband present, and 31.2% were non-families. 26.2% of all households were made up of individuals, and 9.2% had someone living alone who was 65 years of age or older. The average household size was 2.54 and the average family size was 3.06.
In the city, the population was spread out, with 27.2% under the age of 18, 8.2% from 18 to 24, 28.7% from 25 to 44, 22.7% from 45 to 64, and 13.2% who were 65 years of age or older. The median age was 36 years. For every 100 females, there were 87.2 males. For every 100 females age 18 and over, there were 81.2 males.
The median income for a household in the city was $37,917, and the median income for a family was $45,938. Males had a median income of $35,938 versus $27,917 for females. The per capita income for the city was $18,917. About 8.2% of families and 10.2% of the population were below the poverty line, including 14.2% of those under age 18 and 8.2% of those age 65 or over.
Common Questions
What is Per Capita Income in Dellwood?
Per Capita income in Dellwood is $29,720.
What is the Median Family Income in Dellwood?
Median Family Income in Dellwood is $72,877.
What is the Median Household income in Dellwood?
Median Household Income in Dellwood is $67,845.
What is Income or Wage Gap in Dellwood?
Income or Wage Gap in Dellwood is 3.1%.
Women in Dellwood earn 96.9 cents for every dollar earned by a man.
What is Inequality or Gini Index in Dellwood?
Inequality or Gini Index in Dellwood is 0.35.
What is the Total Population of Dellwood?
Total Population of Dellwood is 4,899.
What is the Total Male Population of Dellwood?
Total Male Population of Dellwood is 2,574.
What is the Total Female Population of Dellwood?
Total Female Population of Dellwood is 2,325.
What is the Ratio of Males per 100 Females in Dellwood?
There are 110.71 Males per 100 Females in Dellwood.
What is the Ratio of Females per 100 Males in Dellwood?
There are 90.33 Females per 100 Males in Dellwood.
What is the Median Population Age in Dellwood?
Median Population Age in Dellwood is 40.8 Years.
What is the Average Family Size in Dellwood
Average Family Size in Dellwood is 3.2 People.
What is the Average Household Size in Dellwood
Average Household Size in Dellwood is 2.5 People.
How Large is the Labor Force in Dellwood?
There are 2,788 People in the Labor Forcein in Dellwood.
What is the Percentage of People in the Labor Force in Dellwood?
72.2% of People are in the Labor Force in Dellwood.
What is the Unemployment Rate in Dellwood?
Unemployment Rate in Dellwood is 3.4%.