Bayport, MN Map & Demographics
Bayport Map
Bayport Overview
$37,520
PER CAPITA INCOME
$130,147
AVG FAMILY INCOME
$105,114
AVG HOUSEHOLD INCOME
40.6%
WAGE / INCOME GAP [ % ]
59.4¢/ $1
WAGE / INCOME GAP [ $ ]
0.41
INEQUALITY / GINI INDEX
3,902
TOTAL POPULATION
2,525
MALE POPULATION
1,377
FEMALE POPULATION
183.37
MALES / 100 FEMALES
54.53
FEMALES / 100 MALES
40.0
MEDIAN AGE
2.8
AVG FAMILY SIZE
2.3
AVG HOUSEHOLD SIZE
1,467
LABOR FORCE [ PEOPLE ]
44.0%
PERCENT IN LABOR FORCE
2.4%
UNEMPLOYMENT RATE
Bayport Zip Codes
Bayport Area Codes
Income in Bayport
Income Overview in Bayport
Per Capita Income in Bayport is $37,520, while median incomes of families and households are $130,147 and $105,114 respectively.
| Characteristic | Number | Measure |
| Per Capita Income | 3,902 | $37,520 |
| Median Family Income | 764 | $130,147 |
| Mean Family Income | 764 | $143,588 |
| Median Household Income | 1,165 | $105,114 |
| Mean Household Income | 1,165 | $118,273 |
| Income Deficit | 764 | $0 |
| Wage / Income Gap (%) | 3,902 | 40.64% |
| Wage / Income Gap ($) | 3,902 | 59.36¢ per $1 |
| Gini / Inequality Index | 3,902 | 0.41 |
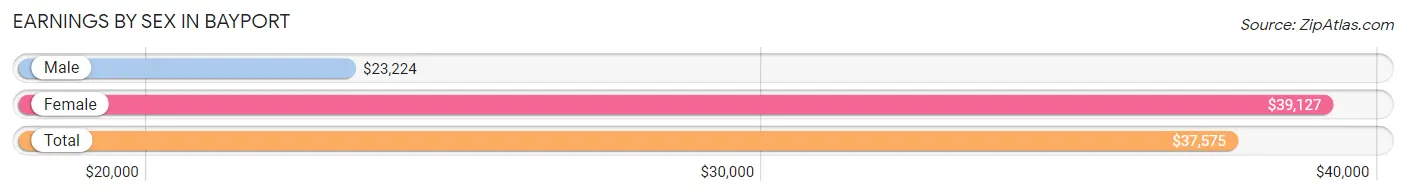
Earnings by Sex in Bayport
Average Earnings in Bayport are $37,575, $23,224 for men and $39,127 for women, a difference of 40.6%.
| Sex | Number | Average Earnings |
| Male | 1,603 (67.9%) | $23,224 |
| Female | 757 (32.1%) | $39,127 |
| Total | 2,360 (100.0%) | $37,575 |
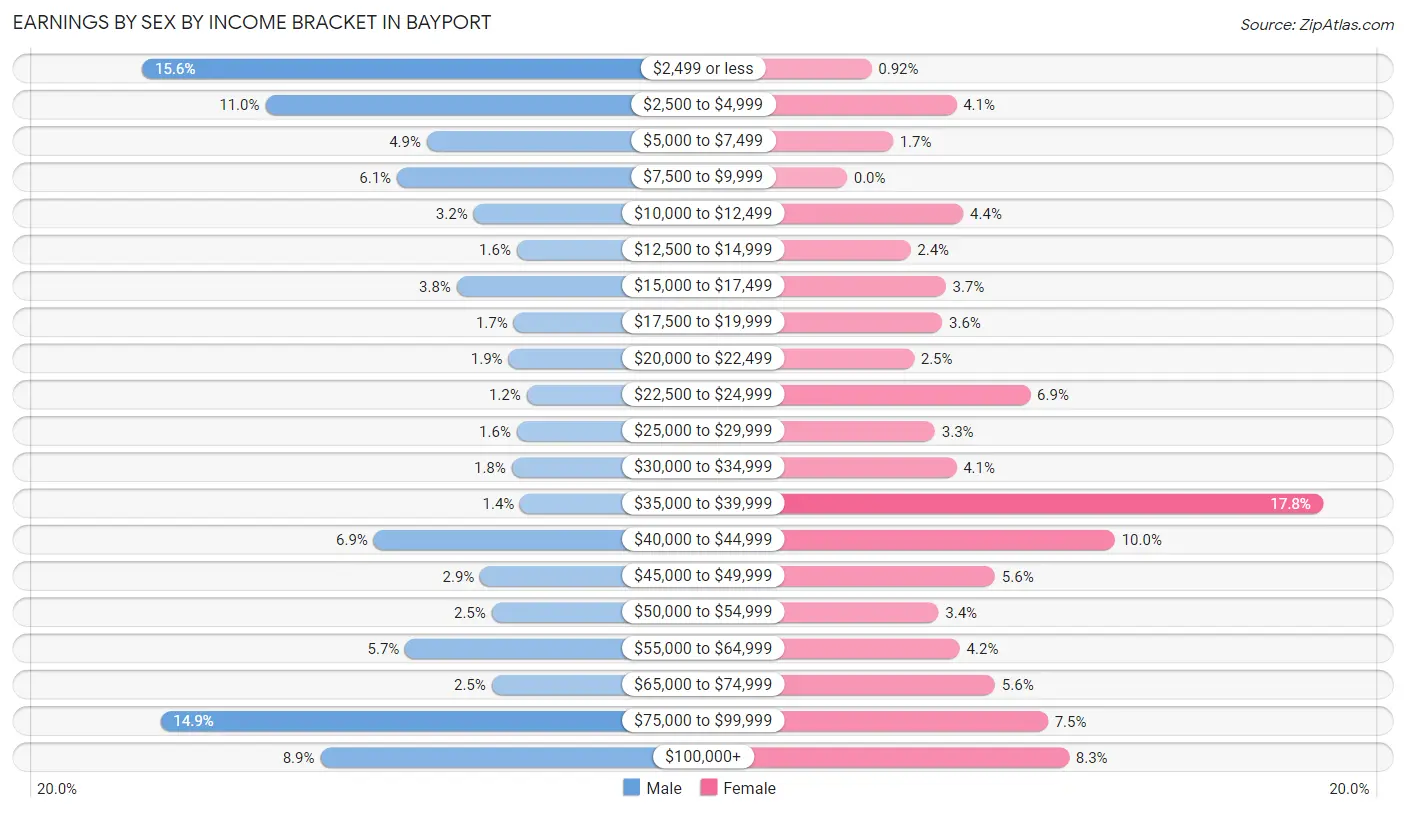
Earnings by Sex by Income Bracket in Bayport
The most common earnings brackets in Bayport are $2,499 or less for men (250 | 15.6%) and $35,000 to $39,999 for women (135 | 17.8%).
| Income | Male | Female |
| $2,499 or less | 250 (15.6%) | 7 (0.9%) |
| $2,500 to $4,999 | 176 (11.0%) | 31 (4.1%) |
| $5,000 to $7,499 | 79 (4.9%) | 13 (1.7%) |
| $7,500 to $9,999 | 97 (6.0%) | 0 (0.0%) |
| $10,000 to $12,499 | 51 (3.2%) | 33 (4.4%) |
| $12,500 to $14,999 | 25 (1.6%) | 18 (2.4%) |
| $15,000 to $17,499 | 61 (3.8%) | 28 (3.7%) |
| $17,500 to $19,999 | 27 (1.7%) | 27 (3.6%) |
| $20,000 to $22,499 | 30 (1.9%) | 19 (2.5%) |
| $22,500 to $24,999 | 19 (1.2%) | 52 (6.9%) |
| $25,000 to $29,999 | 25 (1.6%) | 25 (3.3%) |
| $30,000 to $34,999 | 28 (1.8%) | 31 (4.1%) |
| $35,000 to $39,999 | 23 (1.4%) | 135 (17.8%) |
| $40,000 to $44,999 | 111 (6.9%) | 76 (10.0%) |
| $45,000 to $49,999 | 47 (2.9%) | 42 (5.6%) |
| $50,000 to $54,999 | 40 (2.5%) | 26 (3.4%) |
| $55,000 to $64,999 | 92 (5.7%) | 32 (4.2%) |
| $65,000 to $74,999 | 40 (2.5%) | 42 (5.6%) |
| $75,000 to $99,999 | 239 (14.9%) | 57 (7.5%) |
| $100,000+ | 143 (8.9%) | 63 (8.3%) |
| Total | 1,603 (100.0%) | 757 (100.0%) |
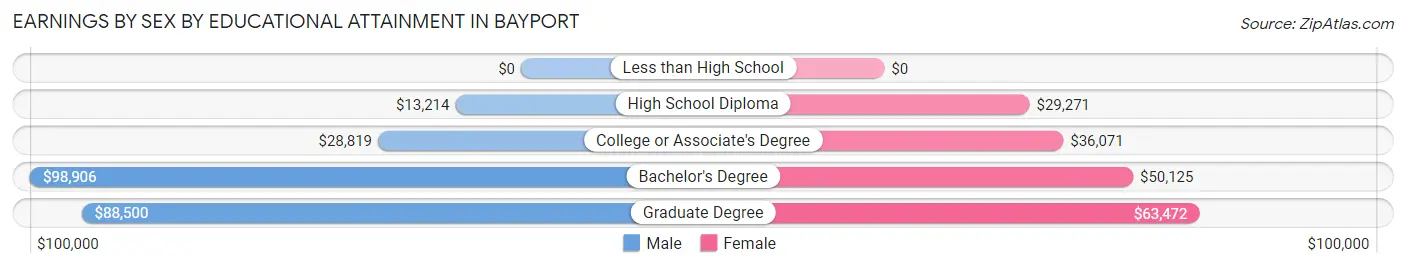
Earnings by Sex by Educational Attainment in Bayport
Average earnings in Bayport are $35,250 for men and $39,440 for women, a difference of 10.6%. Men with an educational attainment of bachelor's degree enjoy the highest average annual earnings of $98,906, while those with high school diploma education earn the least with $13,214. Women with an educational attainment of graduate degree earn the most with the average annual earnings of $63,472, while those with high school diploma education have the smallest earnings of $29,271.
| Educational Attainment | Male Income | Female Income |
| Less than High School | - | - |
| High School Diploma | $13,214 | $29,271 |
| College or Associate's Degree | $28,819 | $36,071 |
| Bachelor's Degree | $98,906 | $50,125 |
| Graduate Degree | $88,500 | $63,472 |
| Total | $35,250 | $39,440 |
Family Income in Bayport
Family Income Brackets in Bayport
According to the Bayport family income data, there are 203 families falling into the $150,000 to $199,999 income range, which is the most common income bracket and makes up 26.6% of all families. Conversely, the $10,000 to $14,999 income bracket is the least frequent group with only 10 families (1.3%) belonging to this category.
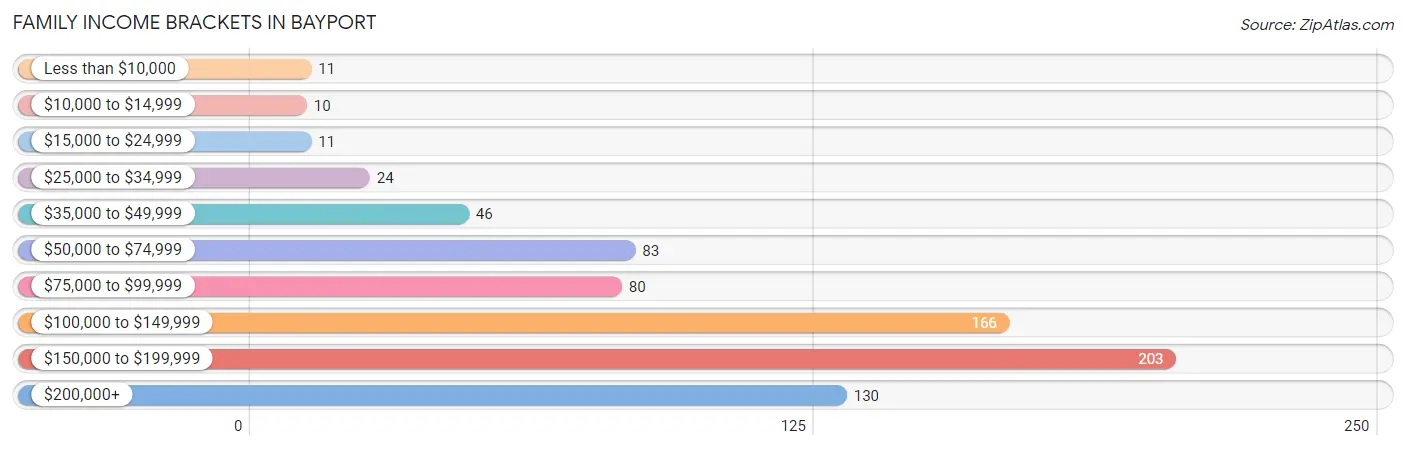
| Income Bracket | # Families | % Families |
| Less than $10,000 | 11 | 1.4% |
| $10,000 to $14,999 | 10 | 1.3% |
| $15,000 to $24,999 | 11 | 1.4% |
| $25,000 to $34,999 | 24 | 3.1% |
| $35,000 to $49,999 | 46 | 6.0% |
| $50,000 to $74,999 | 83 | 10.9% |
| $75,000 to $99,999 | 80 | 10.5% |
| $100,000 to $149,999 | 166 | 21.7% |
| $150,000 to $199,999 | 203 | 26.6% |
| $200,000+ | 130 | 17.0% |
Family Income by Famaliy Size in Bayport
4-person families (185 | 24.2%) account for the highest median family income in Bayport with $149,688 per family, while 2-person families (413 | 54.1%) have the highest median income of $67,578 per family member.
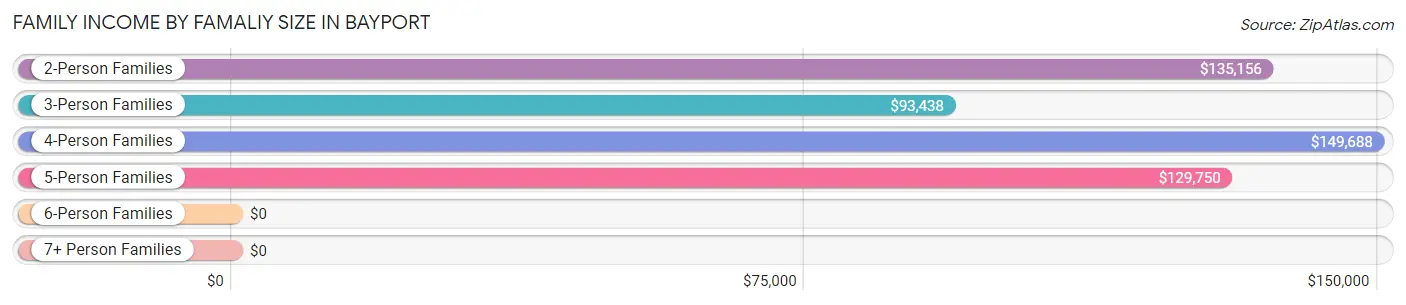
| Income Bracket | # Families | Median Income |
| 2-Person Families | 413 (54.1%) | $135,156 |
| 3-Person Families | 134 (17.5%) | $93,438 |
| 4-Person Families | 185 (24.2%) | $149,688 |
| 5-Person Families | 17 (2.2%) | $129,750 |
| 6-Person Families | 15 (2.0%) | $0 |
| 7+ Person Families | 0 (0.0%) | $0 |
| Total | 764 (100.0%) | $130,147 |
Family Income by Number of Earners in Bayport
The median family income in Bayport is $130,147, with families comprising 3+ earners (40) having the highest median family income of $203,056, while families with no earners (99) have the lowest median family income of $68,750, accounting for 5.2% and 13.0% of families, respectively.
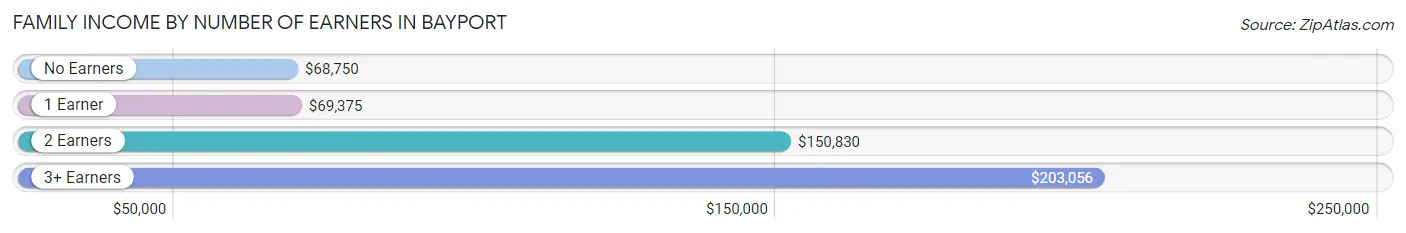
| Number of Earners | # Families | Median Income |
| No Earners | 99 (13.0%) | $68,750 |
| 1 Earner | 144 (18.9%) | $69,375 |
| 2 Earners | 481 (63.0%) | $150,830 |
| 3+ Earners | 40 (5.2%) | $203,056 |
| Total | 764 (100.0%) | $130,147 |
Household Income in Bayport
Household Income Brackets in Bayport
With 250 households falling in the category, the $100,000 to $149,999 income range is the most frequent in Bayport, accounting for 21.5% of all households. In contrast, only 16 households (1.4%) fall into the $10,000 to $14,999 income bracket, making it the least populous group.
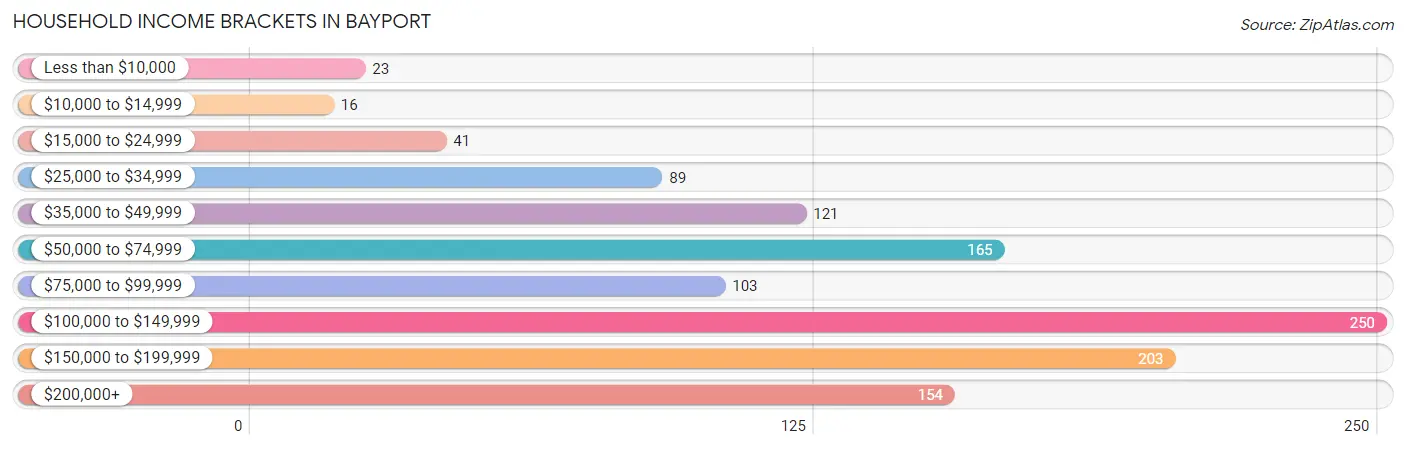
| Income Bracket | # Households | % Households |
| Less than $10,000 | 23 | 2.0% |
| $10,000 to $14,999 | 16 | 1.4% |
| $15,000 to $24,999 | 41 | 3.5% |
| $25,000 to $34,999 | 89 | 7.6% |
| $35,000 to $49,999 | 121 | 10.4% |
| $50,000 to $74,999 | 165 | 14.2% |
| $75,000 to $99,999 | 103 | 8.8% |
| $100,000 to $149,999 | 250 | 21.5% |
| $150,000 to $199,999 | 203 | 17.4% |
| $200,000+ | 154 | 13.2% |
Household Income by Householder Age in Bayport
The median household income in Bayport is $105,114, with the highest median household income of $150,028 found in the 45 to 64 years age bracket for the primary householder. A total of 487 households (41.8%) fall into this category. Meanwhile, the 15 to 24 years age bracket for the primary householder has the lowest median household income of $0, with 34 households (2.9%) in this group.
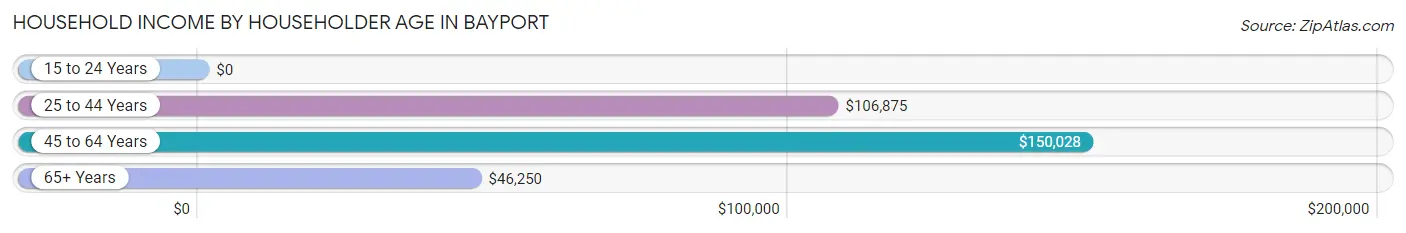
| Income Bracket | # Households | Median Income |
| 15 to 24 Years | 34 (2.9%) | $0 |
| 25 to 44 Years | 313 (26.9%) | $106,875 |
| 45 to 64 Years | 487 (41.8%) | $150,028 |
| 65+ Years | 331 (28.4%) | $46,250 |
| Total | 1,165 (100.0%) | $105,114 |
Poverty in Bayport
Income Below Poverty by Sex and Age in Bayport
With 3.5% poverty level for males and 6.5% for females among the residents of Bayport, 15 year old males and 16 and 17 year old females are the most vulnerable to poverty, with 3 males (13.6%) and 8 females (42.1%) in their respective age groups living below the poverty level.
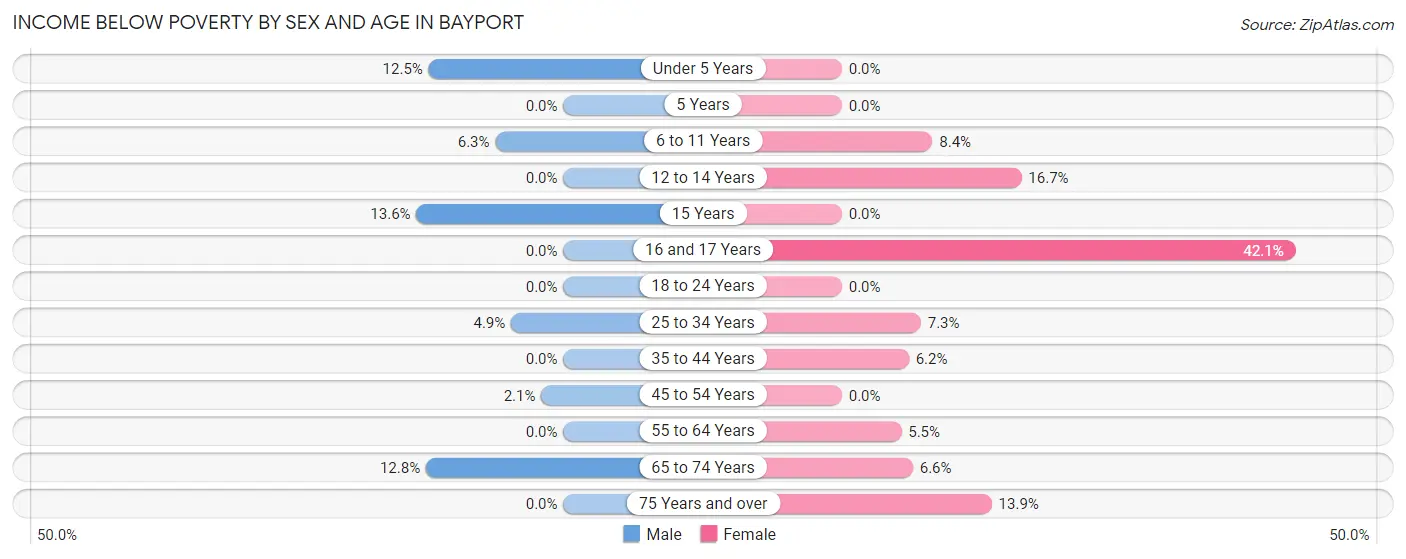
| Age Bracket | Male | Female |
| Under 5 Years | 6 (12.5%) | 0 (0.0%) |
| 5 Years | 0 (0.0%) | 0 (0.0%) |
| 6 to 11 Years | 7 (6.3%) | 11 (8.4%) |
| 12 to 14 Years | 0 (0.0%) | 9 (16.7%) |
| 15 Years | 3 (13.6%) | 0 (0.0%) |
| 16 and 17 Years | 0 (0.0%) | 8 (42.1%) |
| 18 to 24 Years | 0 (0.0%) | 0 (0.0%) |
| 25 to 34 Years | 5 (4.9%) | 11 (7.3%) |
| 35 to 44 Years | 0 (0.0%) | 18 (6.2%) |
| 45 to 54 Years | 6 (2.1%) | 0 (0.0%) |
| 55 to 64 Years | 0 (0.0%) | 10 (5.5%) |
| 65 to 74 Years | 19 (12.8%) | 6 (6.6%) |
| 75 Years and over | 0 (0.0%) | 16 (13.9%) |
| Total | 46 (3.5%) | 89 (6.5%) |
Income Above Poverty by Sex and Age in Bayport
According to the poverty statistics in Bayport, males aged 5 years and females aged under 5 years are the age groups that are most secure financially, with 100.0% of males and 100.0% of females in these age groups living above the poverty line.
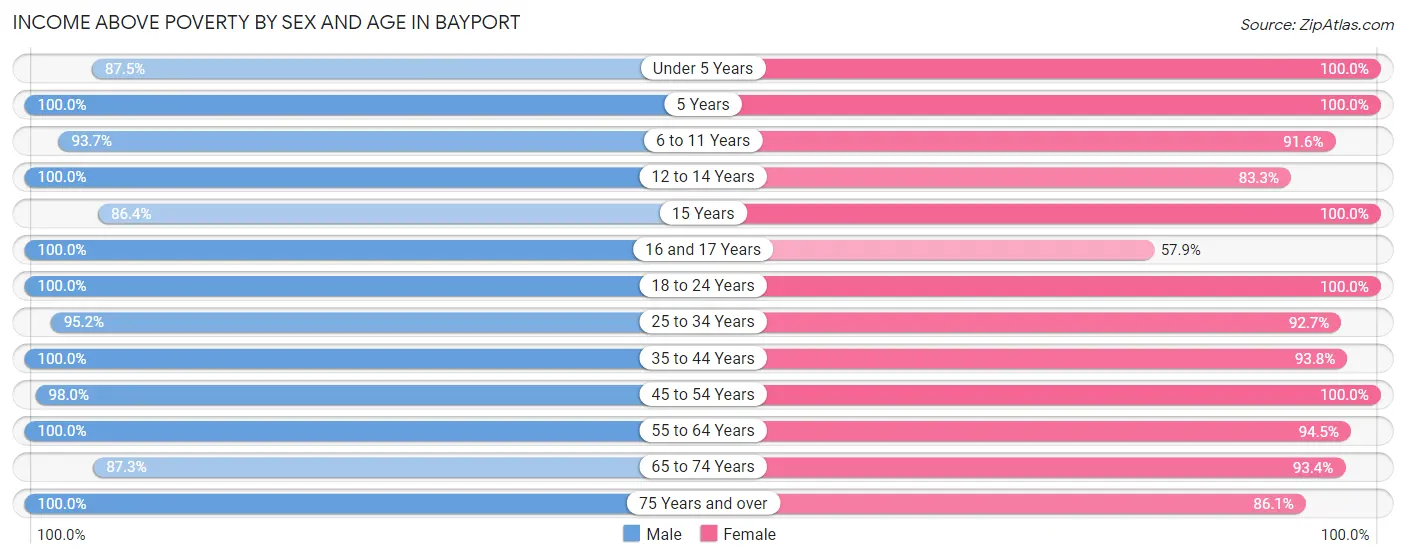
| Age Bracket | Male | Female |
| Under 5 Years | 42 (87.5%) | 62 (100.0%) |
| 5 Years | 16 (100.0%) | 31 (100.0%) |
| 6 to 11 Years | 104 (93.7%) | 120 (91.6%) |
| 12 to 14 Years | 52 (100.0%) | 45 (83.3%) |
| 15 Years | 19 (86.4%) | 27 (100.0%) |
| 16 and 17 Years | 25 (100.0%) | 11 (57.9%) |
| 18 to 24 Years | 30 (100.0%) | 100 (100.0%) |
| 25 to 34 Years | 98 (95.2%) | 139 (92.7%) |
| 35 to 44 Years | 215 (100.0%) | 272 (93.8%) |
| 45 to 54 Years | 286 (98.0%) | 115 (100.0%) |
| 55 to 64 Years | 161 (100.0%) | 171 (94.5%) |
| 65 to 74 Years | 130 (87.3%) | 85 (93.4%) |
| 75 Years and over | 86 (100.0%) | 99 (86.1%) |
| Total | 1,264 (96.5%) | 1,277 (93.5%) |
Income Below Poverty Among Married-Couple Families in Bayport
The poverty statistics for married-couple families in Bayport show that 1.0% or 7 of the total 677 families live below the poverty line. Families with no children have the highest poverty rate of 1.6%, comprising of 7 families. On the other hand, families with 1 or 2 children have the lowest poverty rate of 0.0%, which includes 0 families.
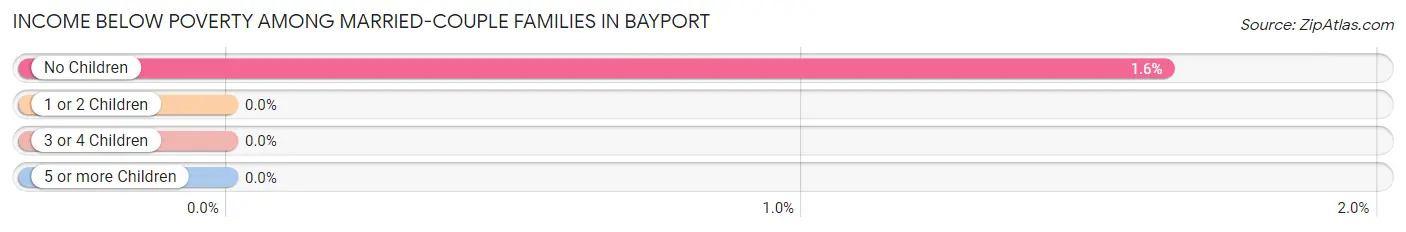
| Children | Above Poverty | Below Poverty |
| No Children | 423 (98.4%) | 7 (1.6%) |
| 1 or 2 Children | 226 (100.0%) | 0 (0.0%) |
| 3 or 4 Children | 21 (100.0%) | 0 (0.0%) |
| 5 or more Children | 0 (0.0%) | 0 (0.0%) |
| Total | 670 (99.0%) | 7 (1.0%) |
Income Below Poverty Among Single-Parent Households in Bayport
According to the poverty data in Bayport, 12.2% or 5 single-father households and 34.8% or 16 single-mother households are living below the poverty line. Among single-father households, those with 1 or 2 children have the highest poverty rate, with 5 households (13.5%) experiencing poverty. Likewise, among single-mother households, those with 1 or 2 children have the highest poverty rate, with 16 households (50.0%) falling below the poverty line.
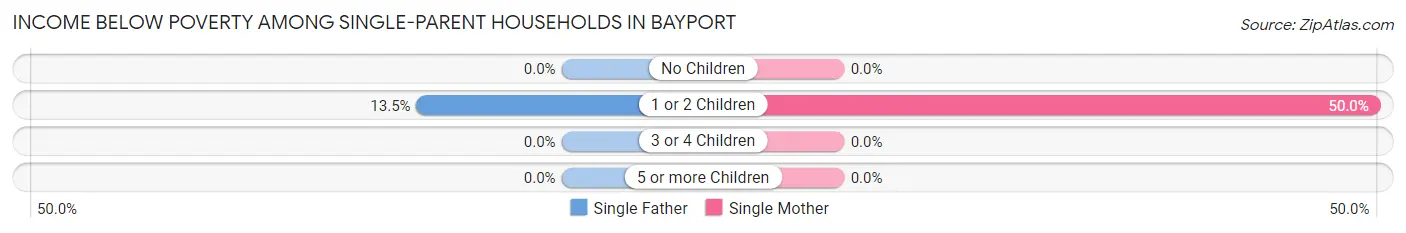
| Children | Single Father | Single Mother |
| No Children | 0 (0.0%) | 0 (0.0%) |
| 1 or 2 Children | 5 (13.5%) | 16 (50.0%) |
| 3 or 4 Children | 0 (0.0%) | 0 (0.0%) |
| 5 or more Children | 0 (0.0%) | 0 (0.0%) |
| Total | 5 (12.2%) | 16 (34.8%) |
Income Below Poverty Among Married-Couple vs Single-Parent Households in Bayport
The poverty data for Bayport shows that 7 of the married-couple family households (1.0%) and 21 of the single-parent households (24.1%) are living below the poverty level. Within the married-couple family households, those with no children have the highest poverty rate, with 7 households (1.6%) falling below the poverty line. Among the single-parent households, those with 1 or 2 children have the highest poverty rate, with 21 household (30.4%) living below poverty.
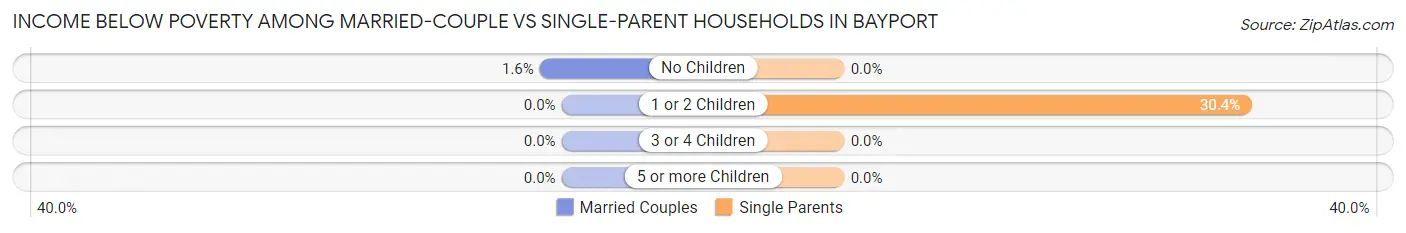
| Children | Married-Couple Families | Single-Parent Households |
| No Children | 7 (1.6%) | 0 (0.0%) |
| 1 or 2 Children | 0 (0.0%) | 21 (30.4%) |
| 3 or 4 Children | 0 (0.0%) | 0 (0.0%) |
| 5 or more Children | 0 (0.0%) | 0 (0.0%) |
| Total | 7 (1.0%) | 21 (24.1%) |
Race in Bayport
The most populous races in Bayport are White / Caucasian (2,945 | 75.5%), Black / African American (631 | 16.2%), and Two or more Races (142 | 3.6%).
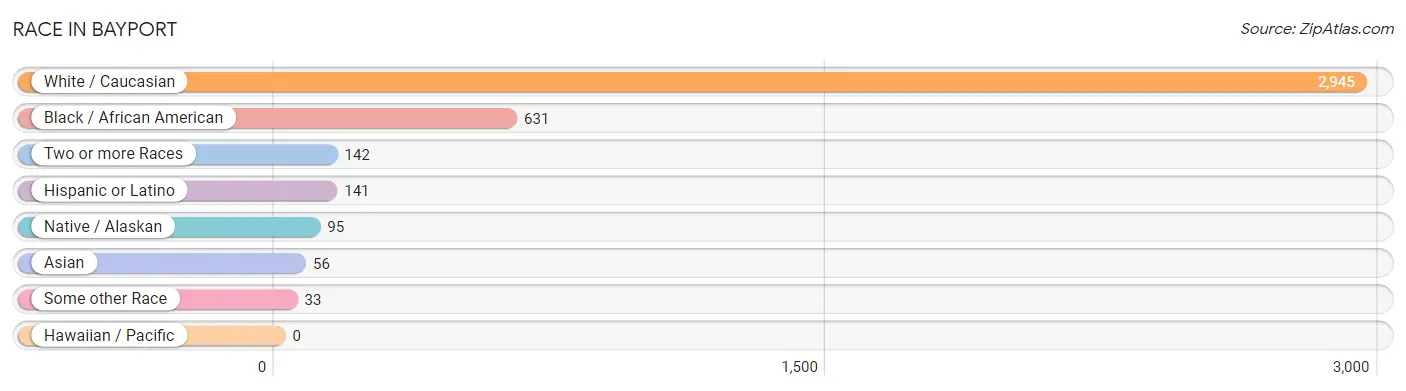
| Race | # Population | % Population |
| Asian | 56 | 1.4% |
| Black / African American | 631 | 16.2% |
| Hawaiian / Pacific | 0 | 0.0% |
| Hispanic or Latino | 141 | 3.6% |
| Native / Alaskan | 95 | 2.4% |
| White / Caucasian | 2,945 | 75.5% |
| Two or more Races | 142 | 3.6% |
| Some other Race | 33 | 0.9% |
| Total | 3,902 | 100.0% |
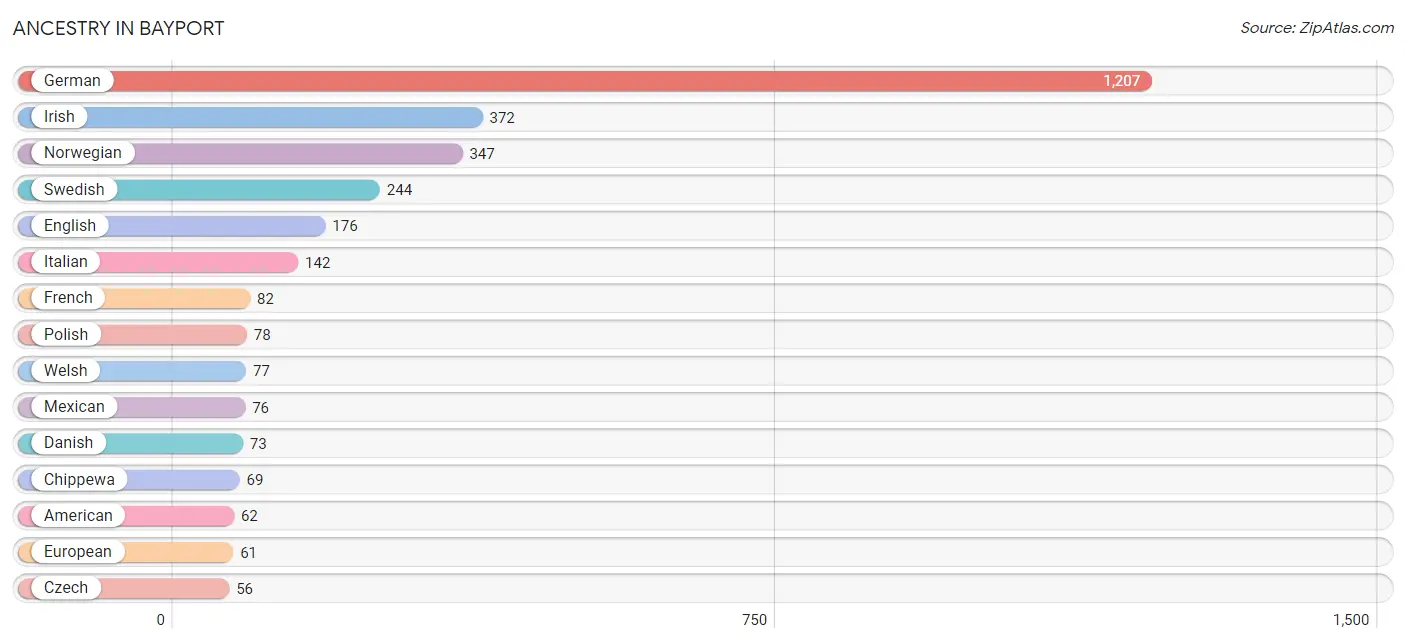
Ancestry in Bayport
The most populous ancestries reported in Bayport are German (1,207 | 30.9%), Irish (372 | 9.5%), Norwegian (347 | 8.9%), Swedish (244 | 6.2%), and English (176 | 4.5%), together accounting for 60.1% of all Bayport residents.
| Ancestry | # Population | % Population |
| American | 62 | 1.6% |
| Austrian | 15 | 0.4% |
| Bangladeshi | 4 | 0.1% |
| Bhutanese | 15 | 0.4% |
| Bolivian | 21 | 0.5% |
| British | 7 | 0.2% |
| Burmese | 8 | 0.2% |
| Canadian | 2 | 0.1% |
| Celtic | 25 | 0.6% |
| Central American | 17 | 0.4% |
| Chippewa | 69 | 1.8% |
| Croatian | 5 | 0.1% |
| Czech | 56 | 1.4% |
| Danish | 73 | 1.9% |
| Dutch | 30 | 0.8% |
| English | 176 | 4.5% |
| European | 61 | 1.6% |
| Finnish | 13 | 0.3% |
| French | 82 | 2.1% |
| French Canadian | 34 | 0.9% |
| German | 1,207 | 30.9% |
| Greek | 21 | 0.5% |
| Guatemalan | 5 | 0.1% |
| Haitian | 32 | 0.8% |
| Honduran | 12 | 0.3% |
| Hungarian | 4 | 0.1% |
| Indian (Asian) | 30 | 0.8% |
| Irish | 372 | 9.5% |
| Italian | 142 | 3.6% |
| Japanese | 9 | 0.2% |
| Mexican | 76 | 1.9% |
| Norwegian | 347 | 8.9% |
| Polish | 78 | 2.0% |
| Russian | 18 | 0.5% |
| Scandinavian | 35 | 0.9% |
| Scotch-Irish | 21 | 0.5% |
| Scottish | 35 | 0.9% |
| Sioux | 15 | 0.4% |
| Slovene | 5 | 0.1% |
| Somali | 55 | 1.4% |
| South American | 21 | 0.5% |
| Spaniard | 4 | 0.1% |
| Sri Lankan | 18 | 0.5% |
| Subsaharan African | 55 | 1.4% |
| Swedish | 244 | 6.2% |
| Swiss | 6 | 0.2% |
| Welsh | 77 | 2.0% | View All 47 Rows |
Immigrants in Bayport
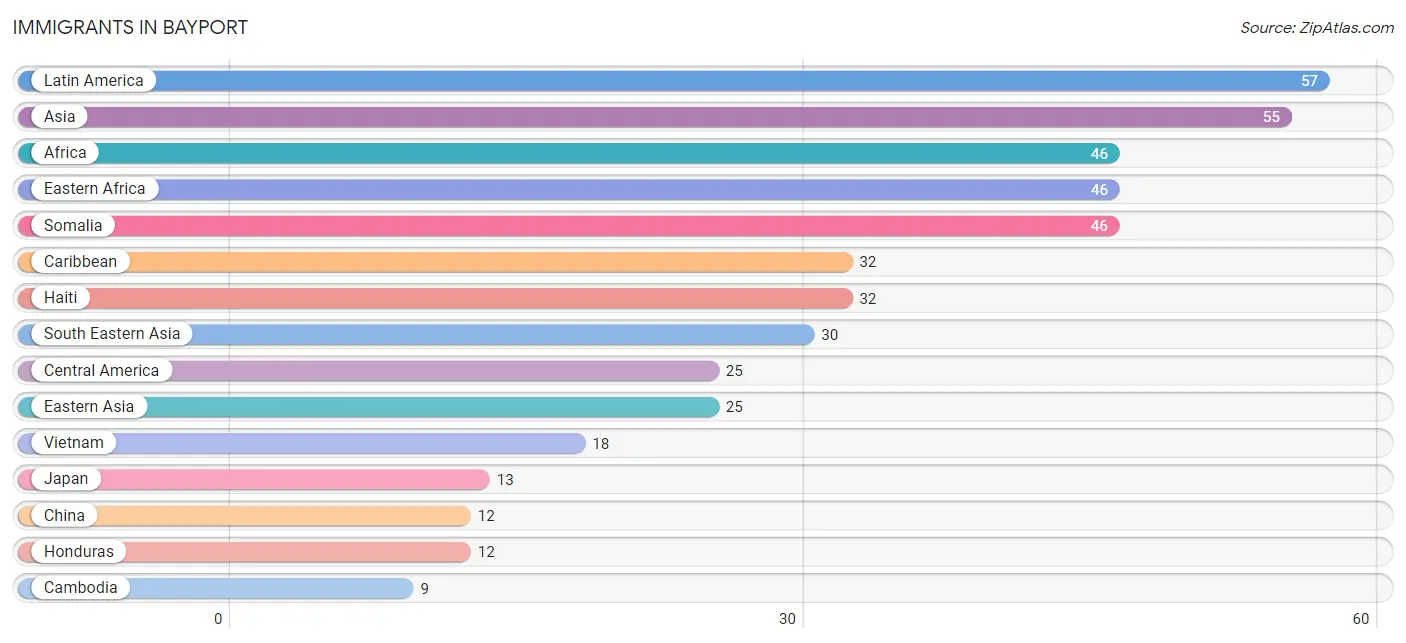
The most numerous immigrant groups reported in Bayport came from Latin America (57 | 1.5%), Asia (55 | 1.4%), Africa (46 | 1.2%), Eastern Africa (46 | 1.2%), and Somalia (46 | 1.2%), together accounting for 6.4% of all Bayport residents.
| Immigration Origin | # Population | % Population |
| Africa | 46 | 1.2% |
| Asia | 55 | 1.4% |
| Cambodia | 9 | 0.2% |
| Canada | 2 | 0.1% |
| Caribbean | 32 | 0.8% |
| Central America | 25 | 0.6% |
| China | 12 | 0.3% |
| Eastern Africa | 46 | 1.2% |
| Eastern Asia | 25 | 0.6% |
| Guatemala | 5 | 0.1% |
| Haiti | 32 | 0.8% |
| Honduras | 12 | 0.3% |
| Japan | 13 | 0.3% |
| Latin America | 57 | 1.5% |
| Mexico | 8 | 0.2% |
| Oceania | 9 | 0.2% |
| Somalia | 46 | 1.2% |
| South Eastern Asia | 30 | 0.8% |
| Thailand | 3 | 0.1% |
| Vietnam | 18 | 0.5% | View All 20 Rows |
Sex and Age in Bayport
Sex and Age in Bayport
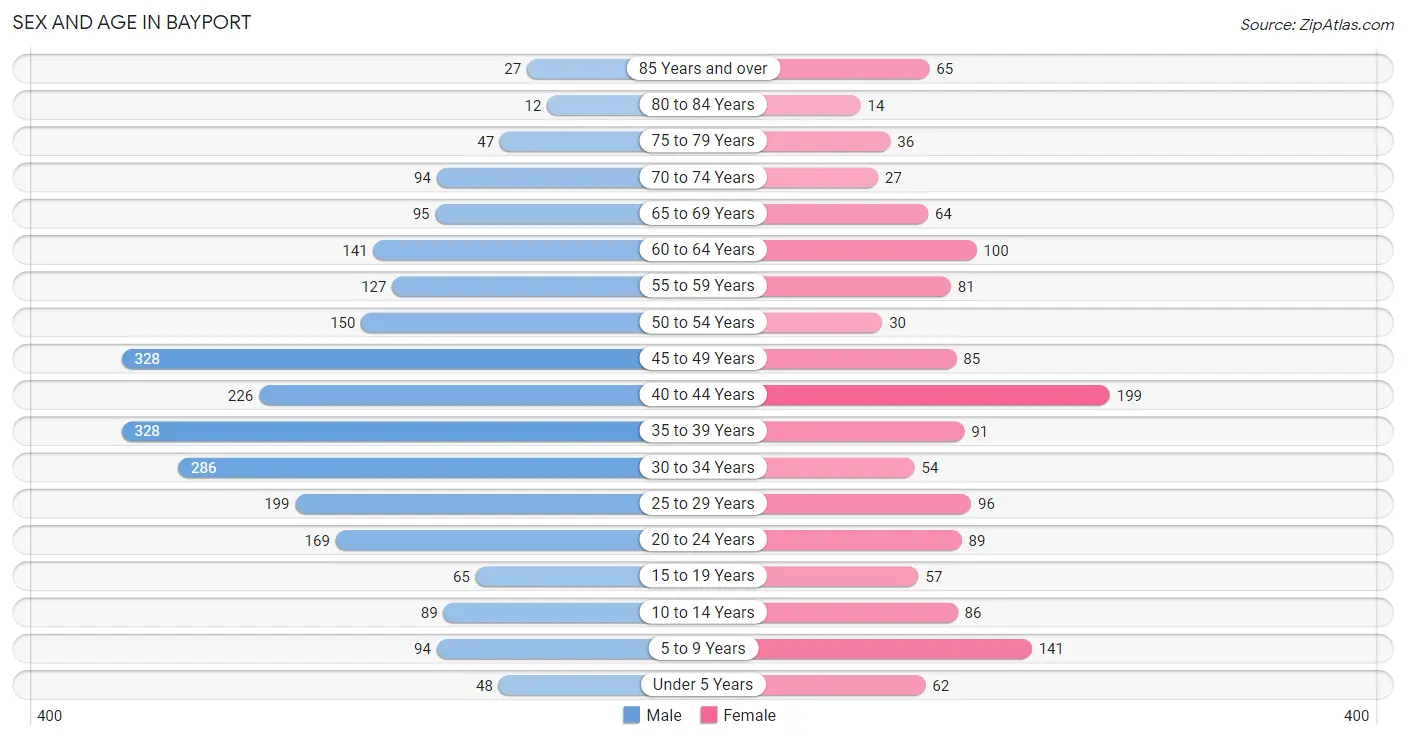
The most populous age groups in Bayport are 35 to 39 Years (328 | 13.0%) for men and 40 to 44 Years (199 | 14.4%) for women.
| Age Bracket | Male | Female |
| Under 5 Years | 48 (1.9%) | 62 (4.5%) |
| 5 to 9 Years | 94 (3.7%) | 141 (10.2%) |
| 10 to 14 Years | 89 (3.5%) | 86 (6.2%) |
| 15 to 19 Years | 65 (2.6%) | 57 (4.1%) |
| 20 to 24 Years | 169 (6.7%) | 89 (6.5%) |
| 25 to 29 Years | 199 (7.9%) | 96 (7.0%) |
| 30 to 34 Years | 286 (11.3%) | 54 (3.9%) |
| 35 to 39 Years | 328 (13.0%) | 91 (6.6%) |
| 40 to 44 Years | 226 (8.9%) | 199 (14.4%) |
| 45 to 49 Years | 328 (13.0%) | 85 (6.2%) |
| 50 to 54 Years | 150 (5.9%) | 30 (2.2%) |
| 55 to 59 Years | 127 (5.0%) | 81 (5.9%) |
| 60 to 64 Years | 141 (5.6%) | 100 (7.3%) |
| 65 to 69 Years | 95 (3.8%) | 64 (4.6%) |
| 70 to 74 Years | 94 (3.7%) | 27 (2.0%) |
| 75 to 79 Years | 47 (1.9%) | 36 (2.6%) |
| 80 to 84 Years | 12 (0.5%) | 14 (1.0%) |
| 85 Years and over | 27 (1.1%) | 65 (4.7%) |
| Total | 2,525 (100.0%) | 1,377 (100.0%) |
Families and Households in Bayport
Median Family Size in Bayport
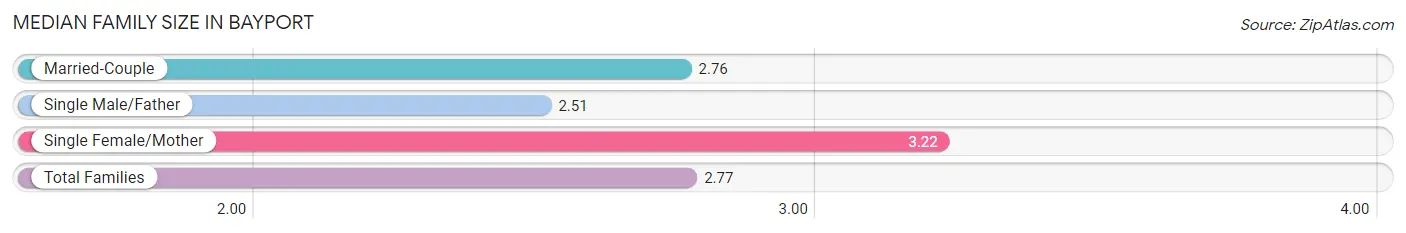
The median family size in Bayport is 2.77 persons per family, with single female/mother families (46 | 6.0%) accounting for the largest median family size of 3.22 persons per family. On the other hand, single male/father families (41 | 5.4%) represent the smallest median family size with 2.51 persons per family.
| Family Type | # Families | Family Size |
| Married-Couple | 677 (88.6%) | 2.76 |
| Single Male/Father | 41 (5.4%) | 2.51 |
| Single Female/Mother | 46 (6.0%) | 3.22 |
| Total Families | 764 (100.0%) | 2.77 |
Median Household Size in Bayport
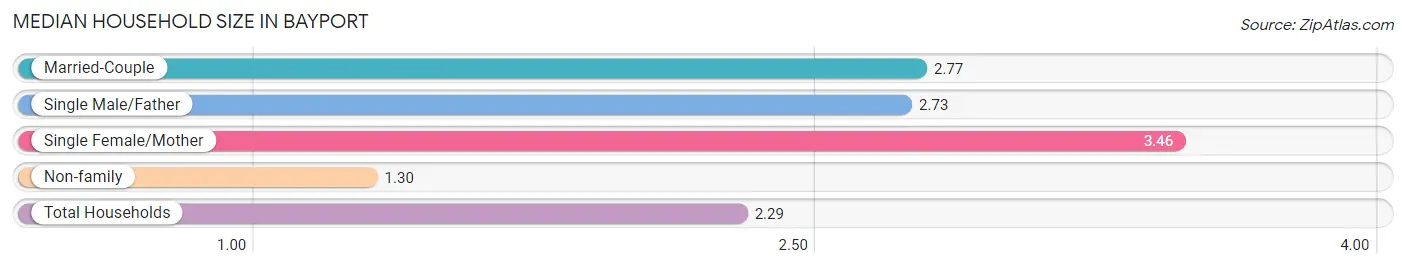
The median household size in Bayport is 2.29 persons per household, with single female/mother households (46 | 4.0%) accounting for the largest median household size of 3.46 persons per household. non-family households (401 | 34.4%) represent the smallest median household size with 1.30 persons per household.
| Household Type | # Households | Household Size |
| Married-Couple | 677 (58.1%) | 2.77 |
| Single Male/Father | 41 (3.5%) | 2.73 |
| Single Female/Mother | 46 (4.0%) | 3.46 |
| Non-family | 401 (34.4%) | 1.30 |
| Total Households | 1,165 (100.0%) | 2.29 |
Household Size by Marriage Status in Bayport
Out of a total of 1,165 households in Bayport, 764 (65.6%) are family households, while 401 (34.4%) are nonfamily households. The most numerous type of family households are 2-person households, comprising 408, and the most common type of nonfamily households are 1-person households, comprising 314.
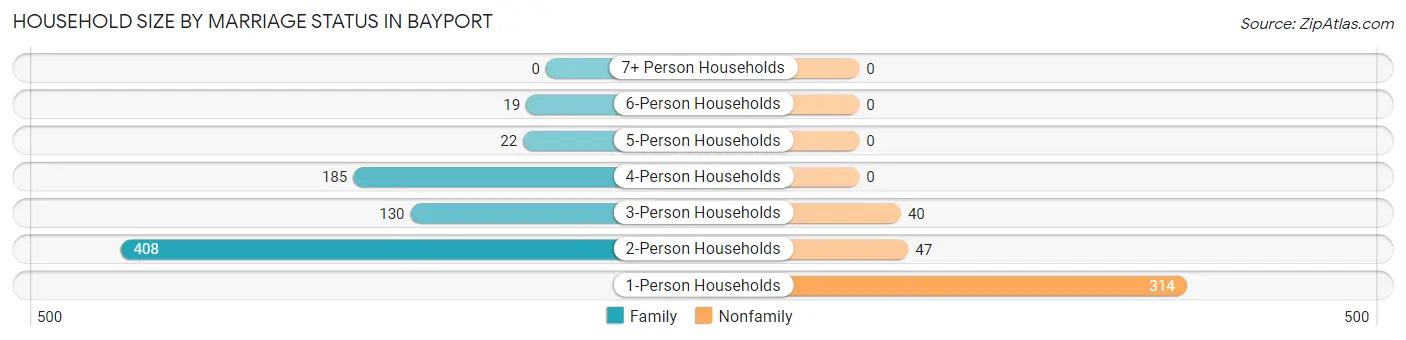
| Household Size | Family Households | Nonfamily Households |
| 1-Person Households | - | 314 (27.0%) |
| 2-Person Households | 408 (35.0%) | 47 (4.0%) |
| 3-Person Households | 130 (11.2%) | 40 (3.4%) |
| 4-Person Households | 185 (15.9%) | 0 (0.0%) |
| 5-Person Households | 22 (1.9%) | 0 (0.0%) |
| 6-Person Households | 19 (1.6%) | 0 (0.0%) |
| 7+ Person Households | 0 (0.0%) | 0 (0.0%) |
| Total | 764 (65.6%) | 401 (34.4%) |
Female Fertility in Bayport
Fertility by Age in Bayport
Average fertility rate in Bayport is 47.0 births per 1,000 women. Women in the age bracket of 20 to 34 years have the highest fertility rate with 117.0 births per 1,000 women. Women in the age bracket of 20 to 34 years acount for 84.9% of all women with births.
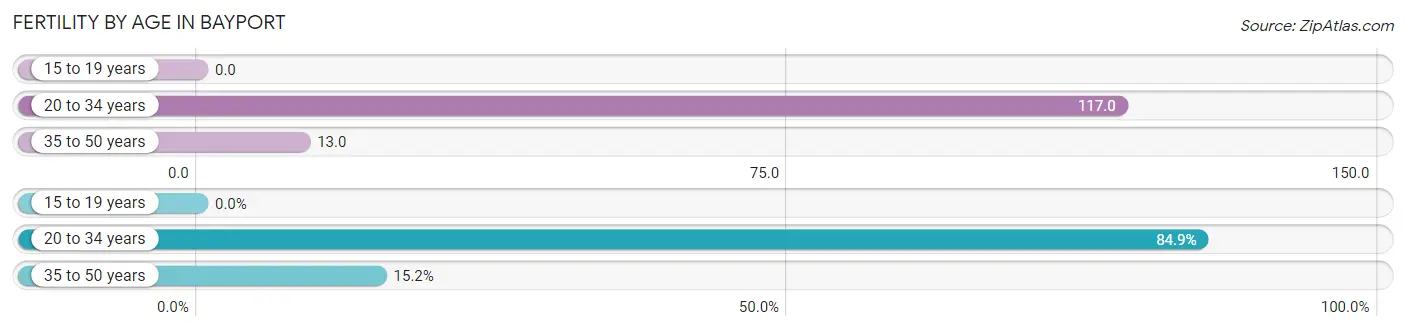
| Age Bracket | Women with Births | Births / 1,000 Women |
| 15 to 19 years | 0 (0.0%) | 0.0 |
| 20 to 34 years | 28 (84.9%) | 117.0 |
| 35 to 50 years | 5 (15.1%) | 13.0 |
| Total | 33 (100.0%) | 47.0 |
Fertility by Age by Marriage Status in Bayport
90.9% of women with births (33) in Bayport are married. The highest percentage of unmarried women with births falls into 20 to 34 years age bracket with 10.7% of them unmarried at the time of birth, while the lowest percentage of unmarried women with births belong to 35 to 50 years age bracket with 0.0% of them unmarried.
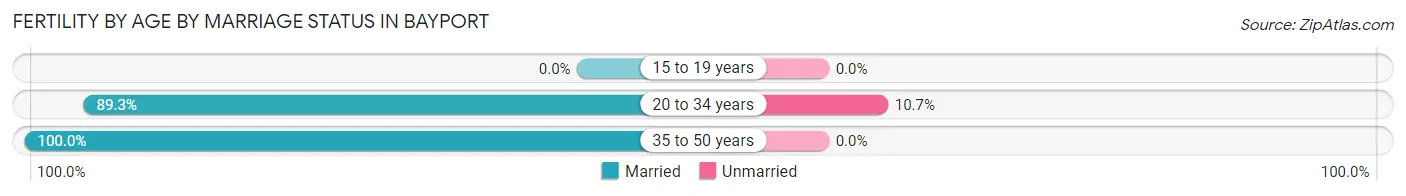
| Age Bracket | Married | Unmarried |
| 15 to 19 years | 0 (0.0%) | 0 (0.0%) |
| 20 to 34 years | 25 (89.3%) | 3 (10.7%) |
| 35 to 50 years | 5 (100.0%) | 0 (0.0%) |
| Total | 30 (90.9%) | 3 (9.1%) |
Fertility by Education in Bayport
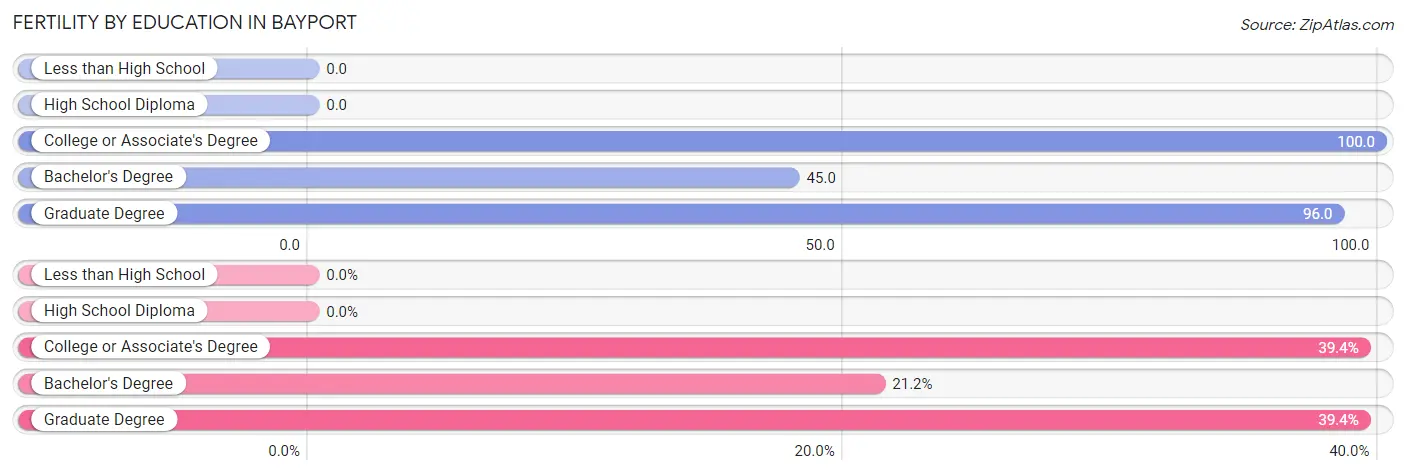
| Educational Attainment | Women with Births | Births / 1,000 Women |
| Less than High School | 0 (0.0%) | 0.0 |
| High School Diploma | 0 (0.0%) | 0.0 |
| College or Associate's Degree | 13 (39.4%) | 100.0 |
| Bachelor's Degree | 7 (21.2%) | 45.0 |
| Graduate Degree | 13 (39.4%) | 96.0 |
| Total | 33 (100.0%) | 47.0 |
Fertility by Education by Marriage Status in Bayport
9.1% of women with births in Bayport are unmarried. Women with the educational attainment of bachelor's degree are most likely to be married with 100.0% of them married at childbirth, while women with the educational attainment of college or associate's degree are least likely to be married with 23.1% of them unmarried at childbirth.
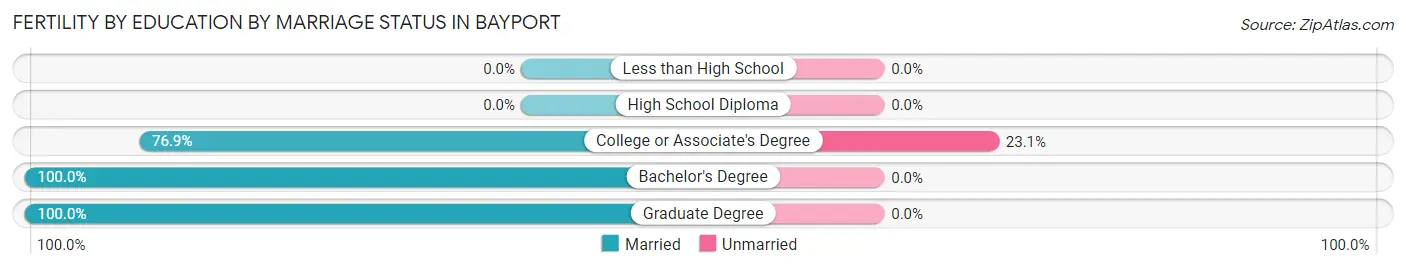
| Educational Attainment | Married | Unmarried |
| Less than High School | 0 (0.0%) | 0 (0.0%) |
| High School Diploma | 0 (0.0%) | 0 (0.0%) |
| College or Associate's Degree | 10 (76.9%) | 3 (23.1%) |
| Bachelor's Degree | 7 (100.0%) | 0 (0.0%) |
| Graduate Degree | 13 (100.0%) | 0 (0.0%) |
| Total | 30 (90.9%) | 3 (9.1%) |
Employment Characteristics in Bayport
Employment by Class of Employer in Bayport
Among the 1,414 employed individuals in Bayport, private company employees (792 | 56.0%), self-employed (incorporated) (311 | 22.0%), and not-for-profit organizations (118 | 8.4%) make up the most common classes of employment.
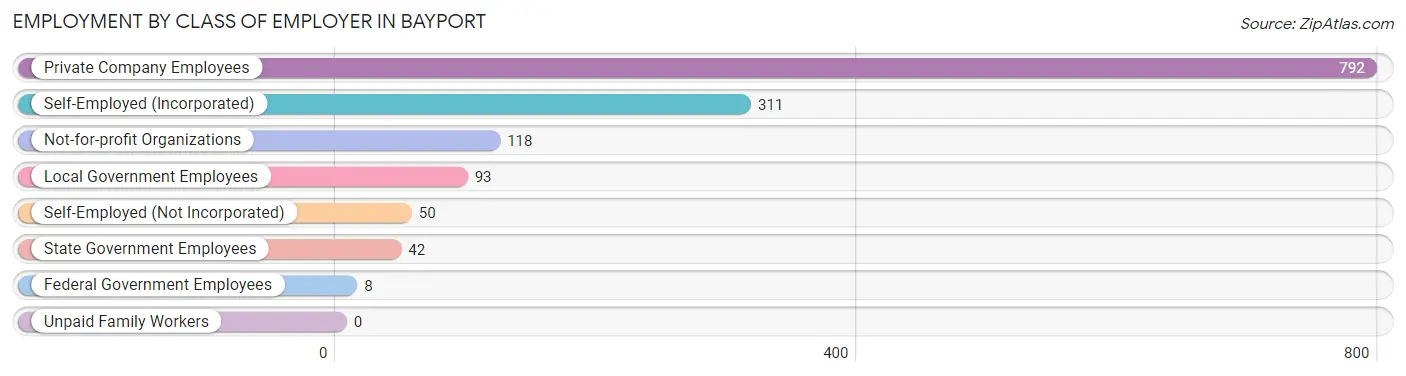
| Employer Class | # Employees | % Employees |
| Private Company Employees | 792 | 56.0% |
| Self-Employed (Incorporated) | 311 | 22.0% |
| Self-Employed (Not Incorporated) | 50 | 3.5% |
| Not-for-profit Organizations | 118 | 8.4% |
| Local Government Employees | 93 | 6.6% |
| State Government Employees | 42 | 3.0% |
| Federal Government Employees | 8 | 0.6% |
| Unpaid Family Workers | 0 | 0.0% |
| Total | 1,414 | 100.0% |
Employment Status by Age in Bayport
According to the labor force statistics for Bayport, out of the total population over 16 years of age (3,333), 44.0% or 1,467 individuals are in the labor force, with 2.4% or 35 of them unemployed. The age group with the highest labor force participation rate is 45 to 54 years, with 67.3% or 399 individuals in the labor force. Within the labor force, the 16 to 19 years age range has the highest percentage of unemployed individuals, with 21.4% or 6 of them being unemployed.
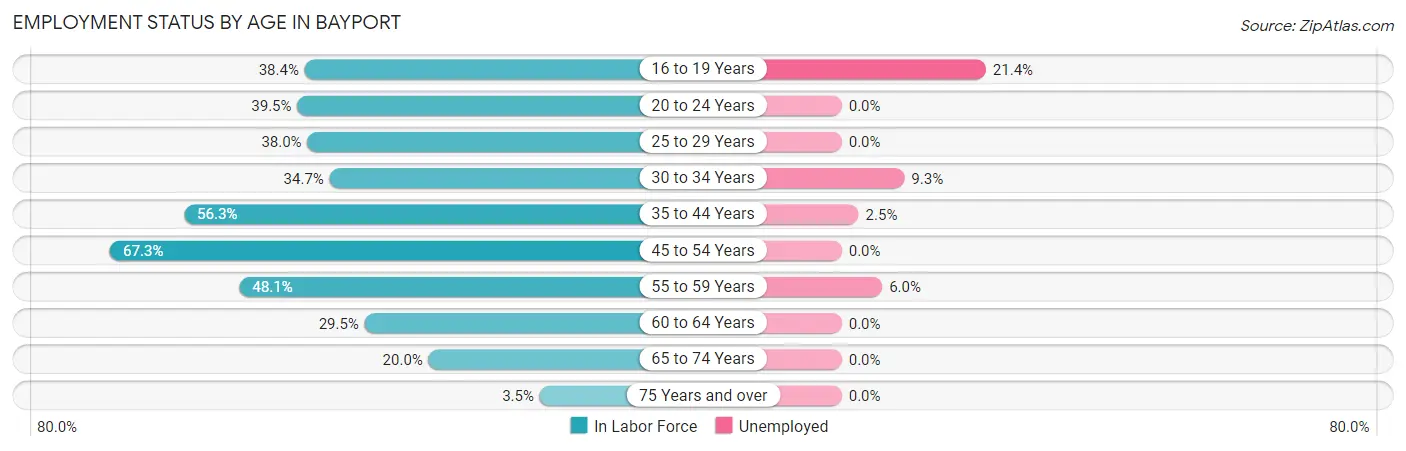
| Age Bracket | In Labor Force | Unemployed |
| 16 to 19 Years | 28 (38.4%) | 6 (21.4%) |
| 20 to 24 Years | 102 (39.5%) | 0 (0.0%) |
| 25 to 29 Years | 112 (38.0%) | 0 (0.0%) |
| 30 to 34 Years | 118 (34.7%) | 11 (9.3%) |
| 35 to 44 Years | 475 (56.3%) | 12 (2.5%) |
| 45 to 54 Years | 399 (67.3%) | 0 (0.0%) |
| 55 to 59 Years | 100 (48.1%) | 6 (6.0%) |
| 60 to 64 Years | 71 (29.5%) | 0 (0.0%) |
| 65 to 74 Years | 56 (20.0%) | 0 (0.0%) |
| 75 Years and over | 7 (3.5%) | 0 (0.0%) |
| Total | 1,467 (44.0%) | 35 (2.4%) |
Employment Status by Educational Attainment in Bayport
According to labor force statistics for Bayport, 50.6% of individuals (1,276) out of the total population between 25 and 64 years of age (2,521) are in the labor force, with 2.3% or 29 of them being unemployed. The group with the highest labor force participation rate are those with the educational attainment of bachelor's degree or higher, with 85.8% or 544 individuals in the labor force. Within the labor force, individuals with college / associate degree education have the highest percentage of unemployment, with 6.8% or 20 of them being unemployed.
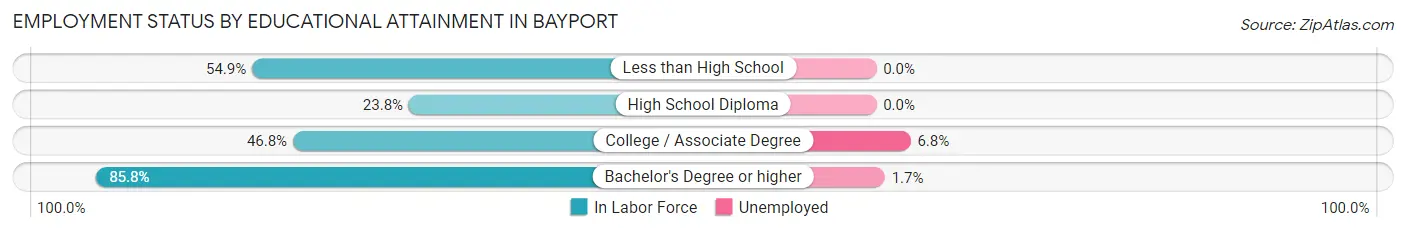
| Educational Attainment | In Labor Force | Unemployed |
| Less than High School | 242 (54.9%) | 0 (0.0%) |
| High School Diploma | 194 (23.8%) | 0 (0.0%) |
| College / Associate Degree | 295 (46.8%) | 43 (6.8%) |
| Bachelor's Degree or higher | 544 (85.8%) | 11 (1.7%) |
| Total | 1,276 (50.6%) | 58 (2.3%) |
Employment Occupations by Sex in Bayport
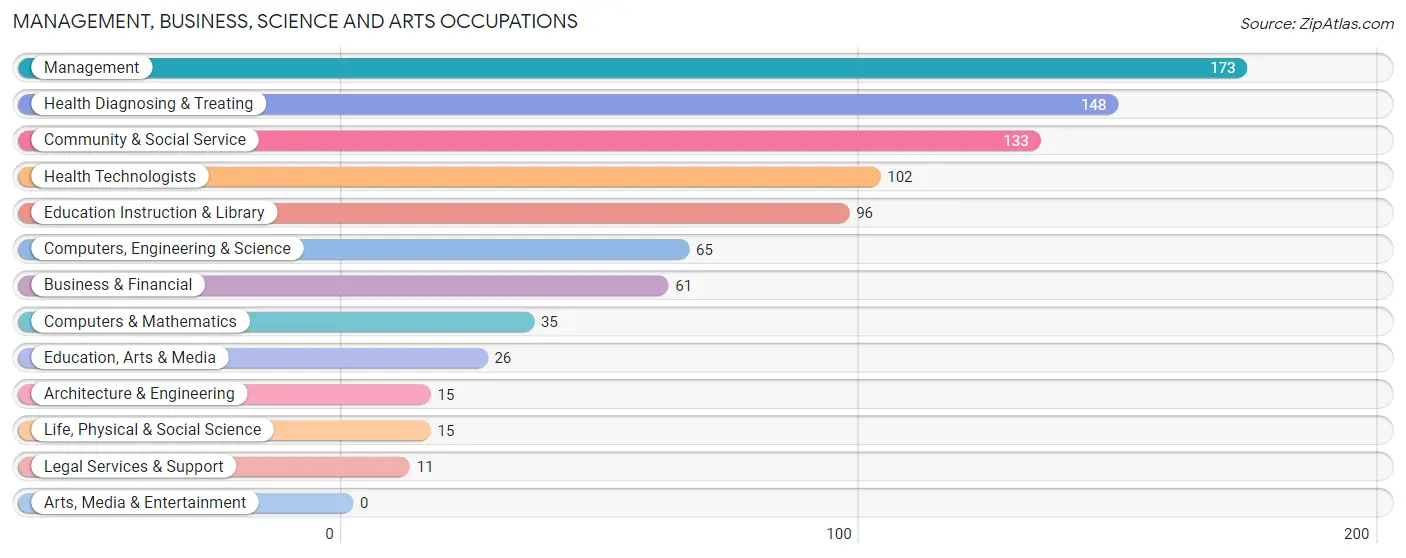
Management, Business, Science and Arts Occupations
The most common Management, Business, Science and Arts occupations in Bayport are Management (173 | 12.1%), Health Diagnosing & Treating (148 | 10.3%), Community & Social Service (133 | 9.3%), Health Technologists (102 | 7.1%), and Education Instruction & Library (96 | 6.7%).
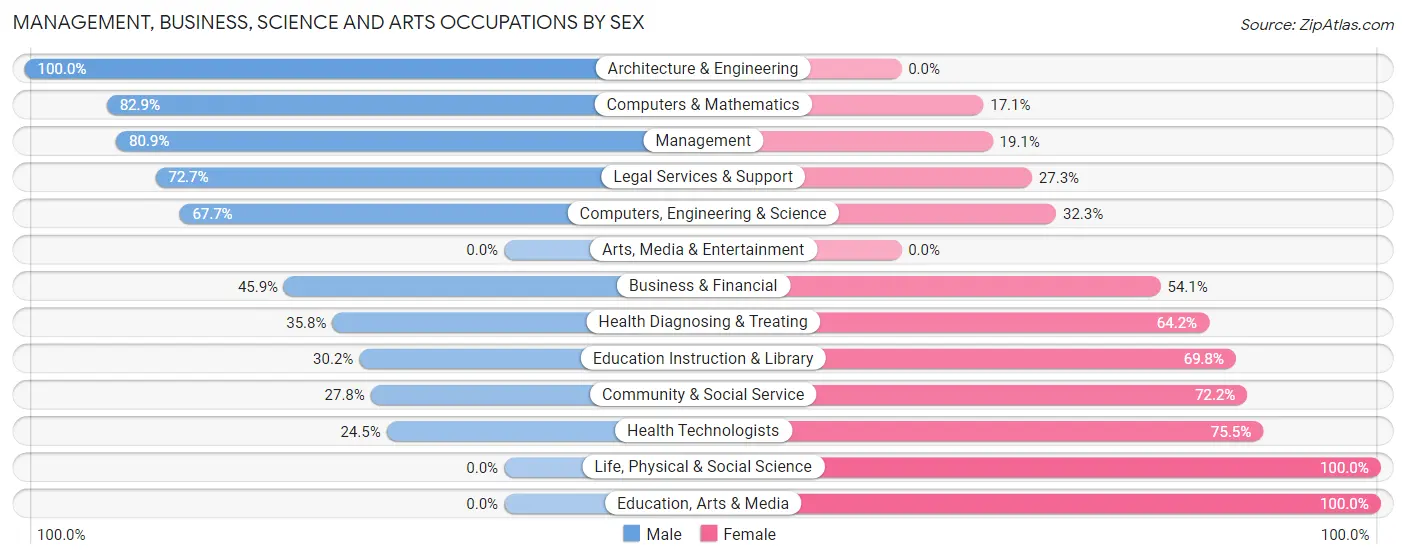
Management, Business, Science and Arts Occupations by Sex
Within the Management, Business, Science and Arts occupations in Bayport, the most male-oriented occupations are Architecture & Engineering (100.0%), Computers & Mathematics (82.9%), and Management (80.9%), while the most female-oriented occupations are Life, Physical & Social Science (100.0%), Education, Arts & Media (100.0%), and Health Technologists (75.5%).
| Occupation | Male | Female |
| Management | 140 (80.9%) | 33 (19.1%) |
| Business & Financial | 28 (45.9%) | 33 (54.1%) |
| Computers, Engineering & Science | 44 (67.7%) | 21 (32.3%) |
| Computers & Mathematics | 29 (82.9%) | 6 (17.1%) |
| Architecture & Engineering | 15 (100.0%) | 0 (0.0%) |
| Life, Physical & Social Science | 0 (0.0%) | 15 (100.0%) |
| Community & Social Service | 37 (27.8%) | 96 (72.2%) |
| Education, Arts & Media | 0 (0.0%) | 26 (100.0%) |
| Legal Services & Support | 8 (72.7%) | 3 (27.3%) |
| Education Instruction & Library | 29 (30.2%) | 67 (69.8%) |
| Arts, Media & Entertainment | 0 (0.0%) | 0 (0.0%) |
| Health Diagnosing & Treating | 53 (35.8%) | 95 (64.2%) |
| Health Technologists | 25 (24.5%) | 77 (75.5%) |
| Total (Category) | 302 (52.1%) | 278 (47.9%) |
| Total (Overall) | 742 (51.8%) | 691 (48.2%) |
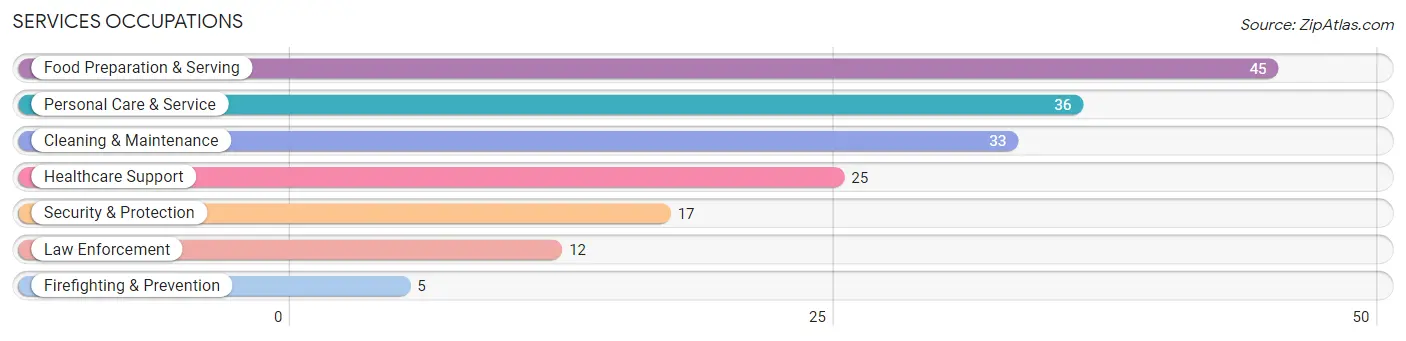
Services Occupations
The most common Services occupations in Bayport are Food Preparation & Serving (45 | 3.1%), Personal Care & Service (36 | 2.5%), Cleaning & Maintenance (33 | 2.3%), Healthcare Support (25 | 1.7%), and Security & Protection (17 | 1.2%).
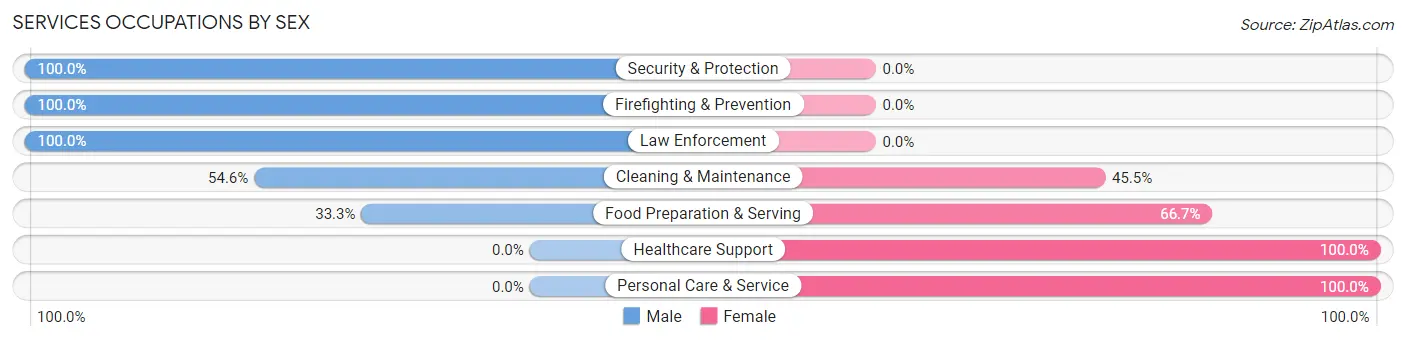
Services Occupations by Sex
Within the Services occupations in Bayport, the most male-oriented occupations are Security & Protection (100.0%), Firefighting & Prevention (100.0%), and Law Enforcement (100.0%), while the most female-oriented occupations are Healthcare Support (100.0%), Personal Care & Service (100.0%), and Food Preparation & Serving (66.7%).
| Occupation | Male | Female |
| Healthcare Support | 0 (0.0%) | 25 (100.0%) |
| Security & Protection | 17 (100.0%) | 0 (0.0%) |
| Firefighting & Prevention | 5 (100.0%) | 0 (0.0%) |
| Law Enforcement | 12 (100.0%) | 0 (0.0%) |
| Food Preparation & Serving | 15 (33.3%) | 30 (66.7%) |
| Cleaning & Maintenance | 18 (54.5%) | 15 (45.5%) |
| Personal Care & Service | 0 (0.0%) | 36 (100.0%) |
| Total (Category) | 50 (32.1%) | 106 (67.9%) |
| Total (Overall) | 742 (51.8%) | 691 (48.2%) |
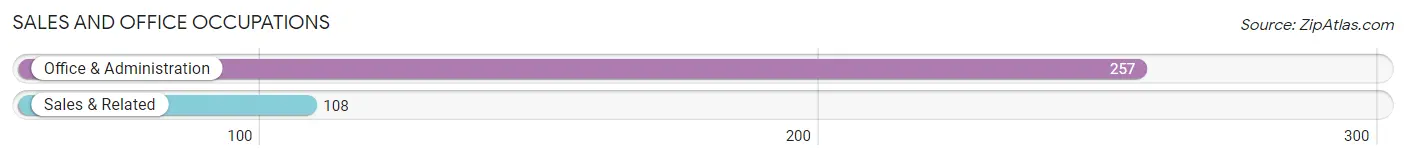
Sales and Office Occupations
The most common Sales and Office occupations in Bayport are Office & Administration (257 | 17.9%), and Sales & Related (108 | 7.5%).
Sales and Office Occupations by Sex

| Occupation | Male | Female |
| Sales & Related | 69 (63.9%) | 39 (36.1%) |
| Office & Administration | 19 (7.4%) | 238 (92.6%) |
| Total (Category) | 88 (24.1%) | 277 (75.9%) |
| Total (Overall) | 742 (51.8%) | 691 (48.2%) |
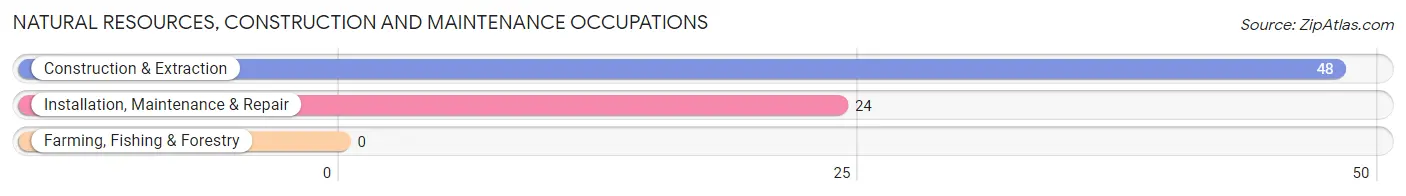
Natural Resources, Construction and Maintenance Occupations
The most common Natural Resources, Construction and Maintenance occupations in Bayport are Construction & Extraction (48 | 3.4%), and Installation, Maintenance & Repair (24 | 1.7%).
Natural Resources, Construction and Maintenance Occupations by Sex
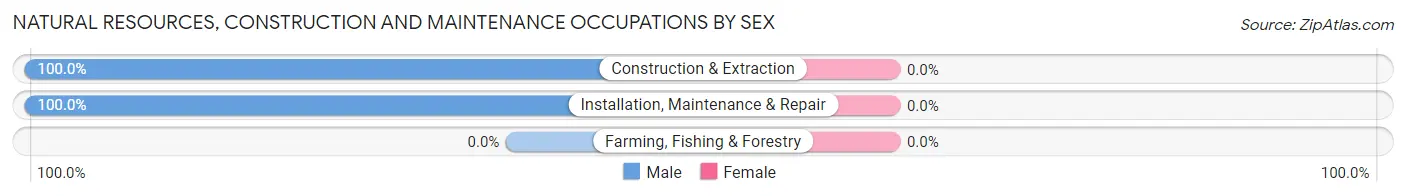
| Occupation | Male | Female |
| Farming, Fishing & Forestry | 0 (0.0%) | 0 (0.0%) |
| Construction & Extraction | 48 (100.0%) | 0 (0.0%) |
| Installation, Maintenance & Repair | 24 (100.0%) | 0 (0.0%) |
| Total (Category) | 72 (100.0%) | 0 (0.0%) |
| Total (Overall) | 742 (51.8%) | 691 (48.2%) |
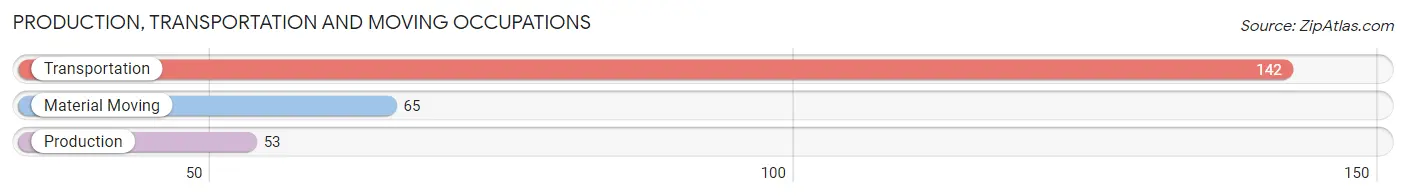
Production, Transportation and Moving Occupations
The most common Production, Transportation and Moving occupations in Bayport are Transportation (142 | 9.9%), Material Moving (65 | 4.5%), and Production (53 | 3.7%).
Production, Transportation and Moving Occupations by Sex
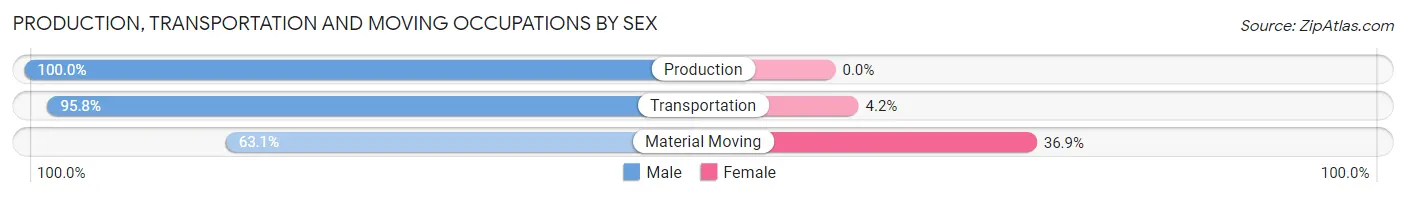
| Occupation | Male | Female |
| Production | 53 (100.0%) | 0 (0.0%) |
| Transportation | 136 (95.8%) | 6 (4.2%) |
| Material Moving | 41 (63.1%) | 24 (36.9%) |
| Total (Category) | 230 (88.5%) | 30 (11.5%) |
| Total (Overall) | 742 (51.8%) | 691 (48.2%) |
Employment Industries by Sex in Bayport
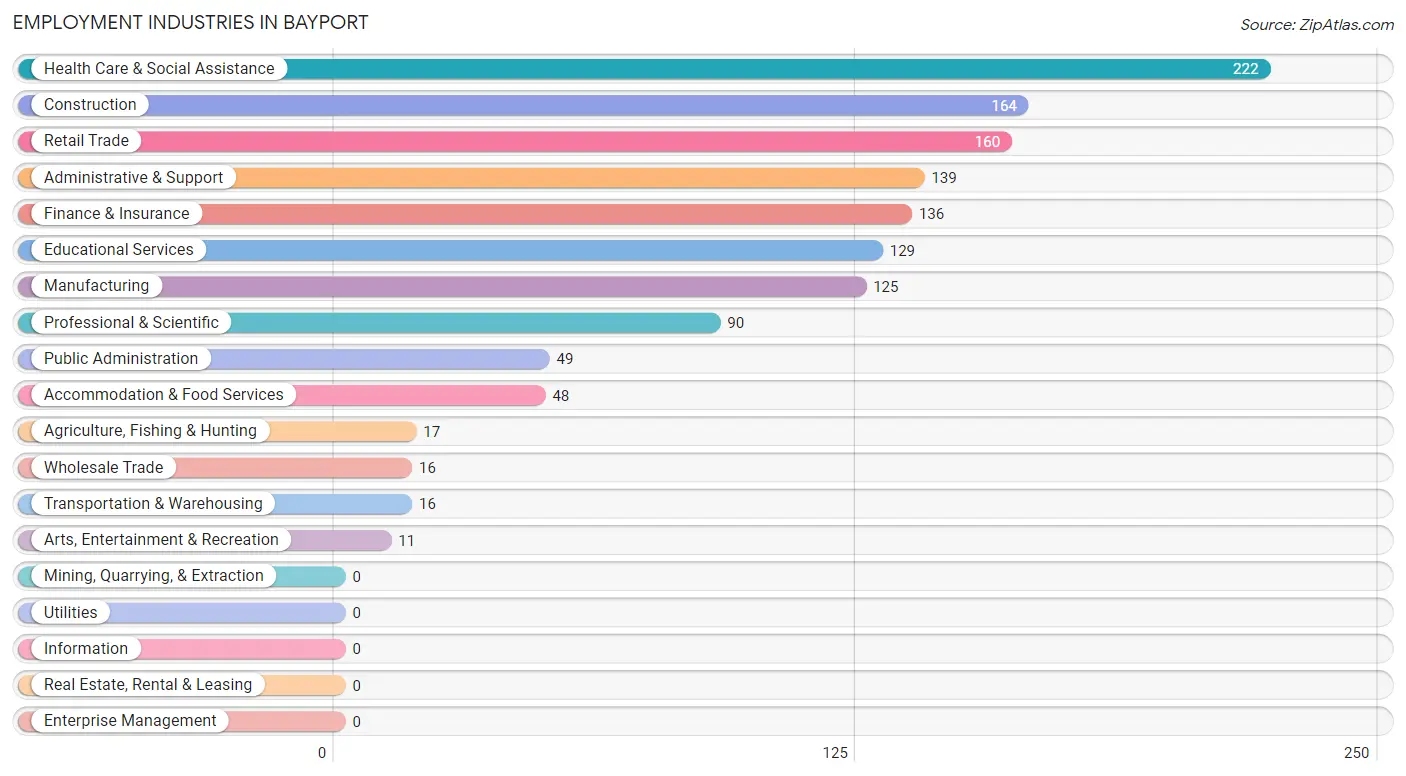
Employment Industries in Bayport
The major employment industries in Bayport include Health Care & Social Assistance (222 | 15.5%), Construction (164 | 11.4%), Retail Trade (160 | 11.2%), Administrative & Support (139 | 9.7%), and Finance & Insurance (136 | 9.5%).
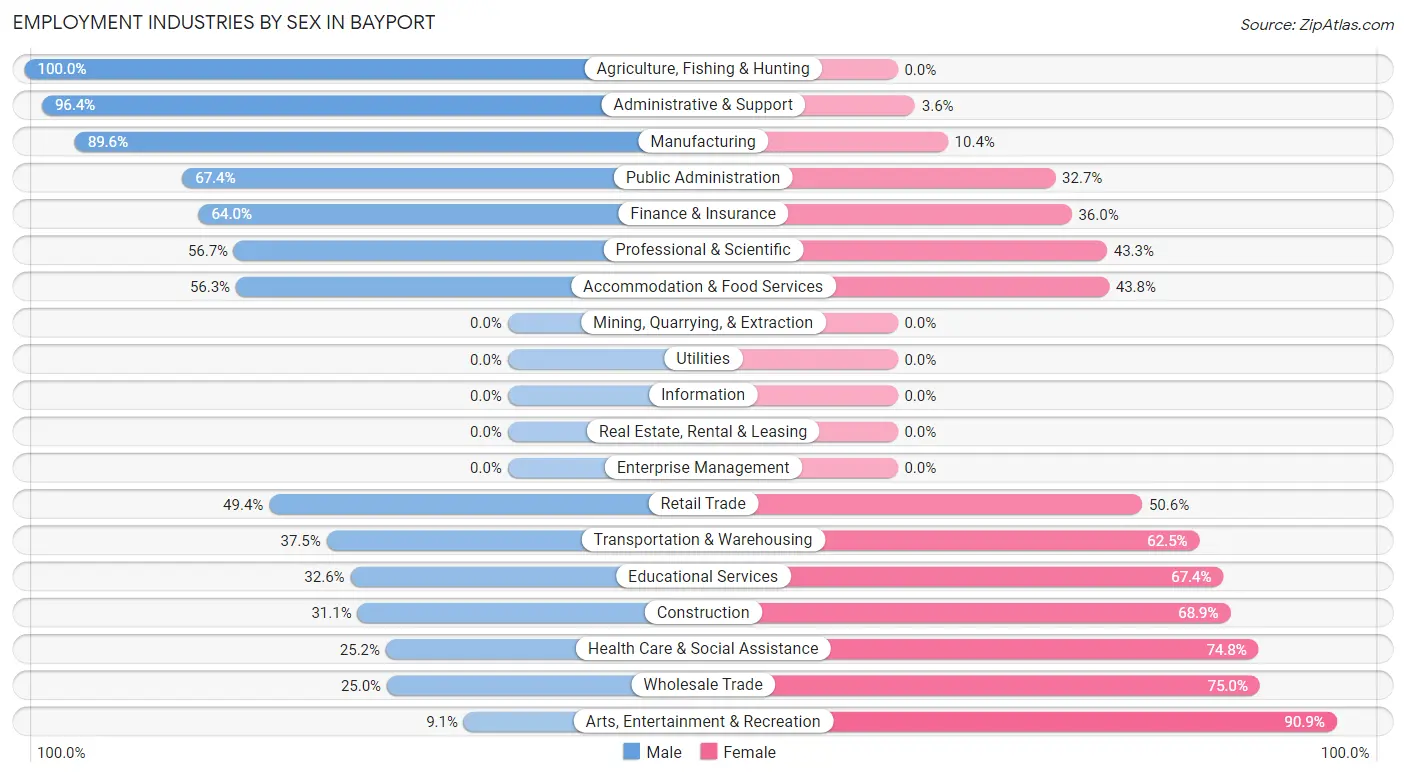
Employment Industries by Sex in Bayport
The Bayport industries that see more men than women are Agriculture, Fishing & Hunting (100.0%), Administrative & Support (96.4%), and Manufacturing (89.6%), whereas the industries that tend to have a higher number of women are Arts, Entertainment & Recreation (90.9%), Wholesale Trade (75.0%), and Health Care & Social Assistance (74.8%).
| Industry | Male | Female |
| Agriculture, Fishing & Hunting | 17 (100.0%) | 0 (0.0%) |
| Mining, Quarrying, & Extraction | 0 (0.0%) | 0 (0.0%) |
| Construction | 51 (31.1%) | 113 (68.9%) |
| Manufacturing | 112 (89.6%) | 13 (10.4%) |
| Wholesale Trade | 4 (25.0%) | 12 (75.0%) |
| Retail Trade | 79 (49.4%) | 81 (50.6%) |
| Transportation & Warehousing | 6 (37.5%) | 10 (62.5%) |
| Utilities | 0 (0.0%) | 0 (0.0%) |
| Information | 0 (0.0%) | 0 (0.0%) |
| Finance & Insurance | 87 (64.0%) | 49 (36.0%) |
| Real Estate, Rental & Leasing | 0 (0.0%) | 0 (0.0%) |
| Professional & Scientific | 51 (56.7%) | 39 (43.3%) |
| Enterprise Management | 0 (0.0%) | 0 (0.0%) |
| Administrative & Support | 134 (96.4%) | 5 (3.6%) |
| Educational Services | 42 (32.6%) | 87 (67.4%) |
| Health Care & Social Assistance | 56 (25.2%) | 166 (74.8%) |
| Arts, Entertainment & Recreation | 1 (9.1%) | 10 (90.9%) |
| Accommodation & Food Services | 27 (56.2%) | 21 (43.8%) |
| Public Administration | 33 (67.3%) | 16 (32.7%) |
| Total | 742 (51.8%) | 691 (48.2%) |
Education in Bayport
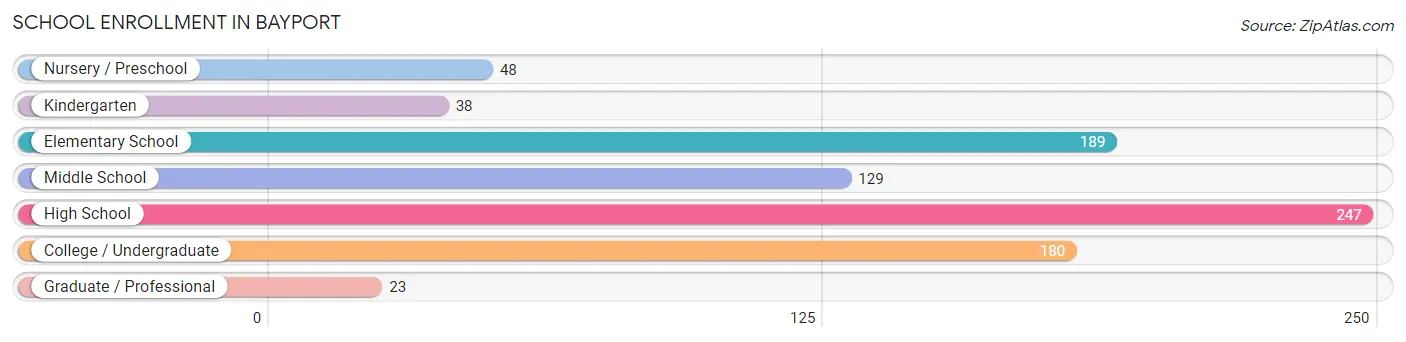
School Enrollment in Bayport
The most common levels of schooling among the 854 students in Bayport are high school (247 | 28.9%), elementary school (189 | 22.1%), and college / undergraduate (180 | 21.1%).
| School Level | # Students | % Students |
| Nursery / Preschool | 48 | 5.6% |
| Kindergarten | 38 | 4.4% |
| Elementary School | 189 | 22.1% |
| Middle School | 129 | 15.1% |
| High School | 247 | 28.9% |
| College / Undergraduate | 180 | 21.1% |
| Graduate / Professional | 23 | 2.7% |
| Total | 854 | 100.0% |
School Enrollment by Age by Funding Source in Bayport
Out of a total of 854 students who are enrolled in schools in Bayport, 165 (19.3%) attend a private institution, while the remaining 689 (80.7%) are enrolled in public schools. The age group of 3 to 4 year olds has the highest likelihood of being enrolled in private schools, with 11 (68.8% in the age bracket) enrolled. Conversely, the age group of 18 to 19 year olds has the lowest likelihood of being enrolled in a private school, with 18 (100.0% in the age bracket) attending a public institution.
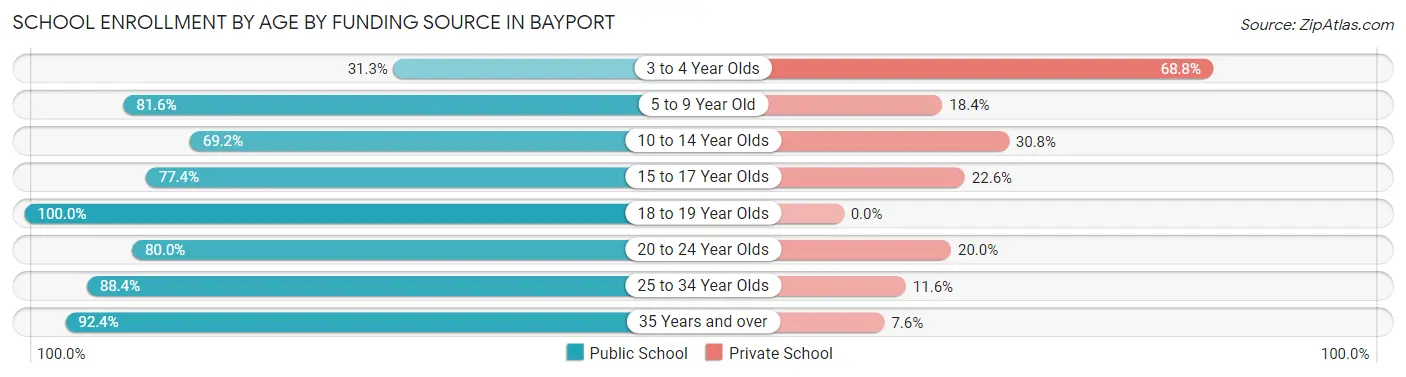
| Age Bracket | Public School | Private School |
| 3 to 4 Year Olds | 5 (31.2%) | 11 (68.8%) |
| 5 to 9 Year Old | 182 (81.6%) | 41 (18.4%) |
| 10 to 14 Year Olds | 117 (69.2%) | 52 (30.8%) |
| 15 to 17 Year Olds | 72 (77.4%) | 21 (22.6%) |
| 18 to 19 Year Olds | 18 (100.0%) | 0 (0.0%) |
| 20 to 24 Year Olds | 76 (80.0%) | 19 (20.0%) |
| 25 to 34 Year Olds | 61 (88.4%) | 8 (11.6%) |
| 35 Years and over | 158 (92.4%) | 13 (7.6%) |
| Total | 689 (80.7%) | 165 (19.3%) |
Educational Attainment by Field of Study in Bayport
Education (139 | 16.8%), computers & mathematics (103 | 12.5%), science & technology (92 | 11.1%), business (92 | 11.1%), and social sciences (66 | 8.0%) are the most common fields of study among 826 individuals in Bayport who have obtained a bachelor's degree or higher.
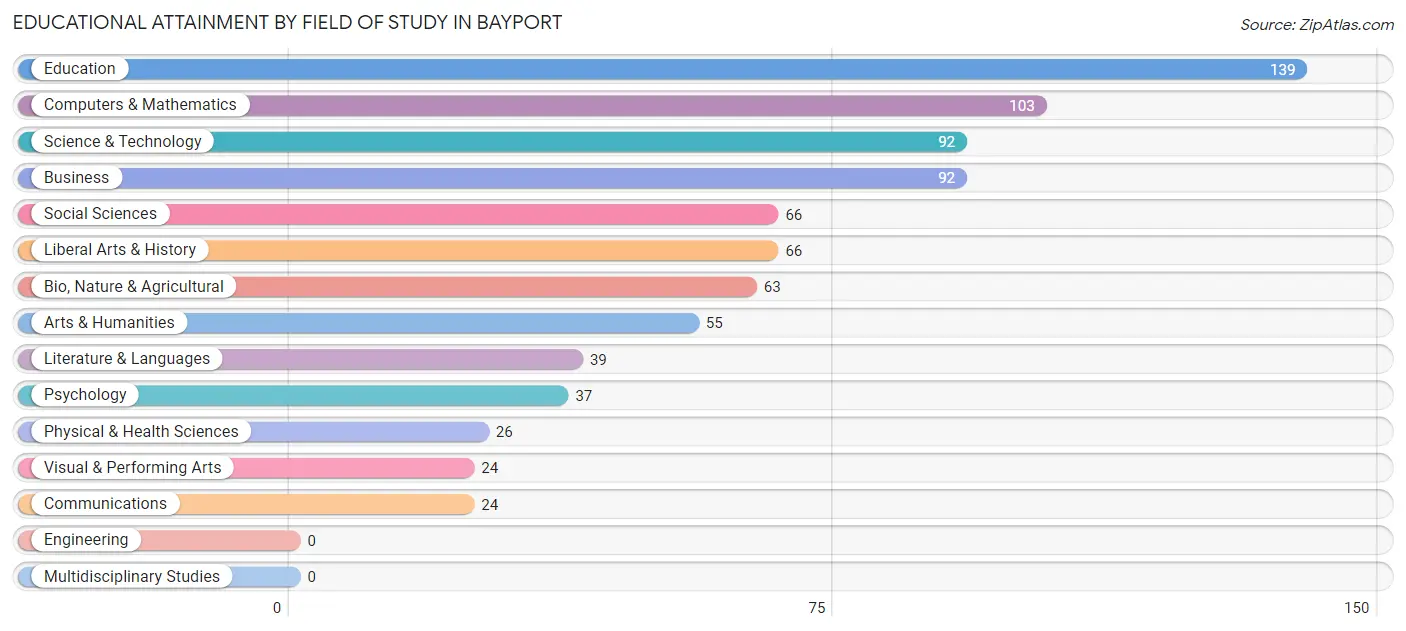
| Field of Study | # Graduates | % Graduates |
| Computers & Mathematics | 103 | 12.5% |
| Bio, Nature & Agricultural | 63 | 7.6% |
| Physical & Health Sciences | 26 | 3.2% |
| Psychology | 37 | 4.5% |
| Social Sciences | 66 | 8.0% |
| Engineering | 0 | 0.0% |
| Multidisciplinary Studies | 0 | 0.0% |
| Science & Technology | 92 | 11.1% |
| Business | 92 | 11.1% |
| Education | 139 | 16.8% |
| Literature & Languages | 39 | 4.7% |
| Liberal Arts & History | 66 | 8.0% |
| Visual & Performing Arts | 24 | 2.9% |
| Communications | 24 | 2.9% |
| Arts & Humanities | 55 | 6.7% |
| Total | 826 | 100.0% |
Transportation & Commute in Bayport
Vehicle Availability by Sex in Bayport
The most prevalent vehicle ownership categories in Bayport are males with 2 vehicles (455, accounting for 61.9%) and females with 2 vehicles (468, making up 67.1%).
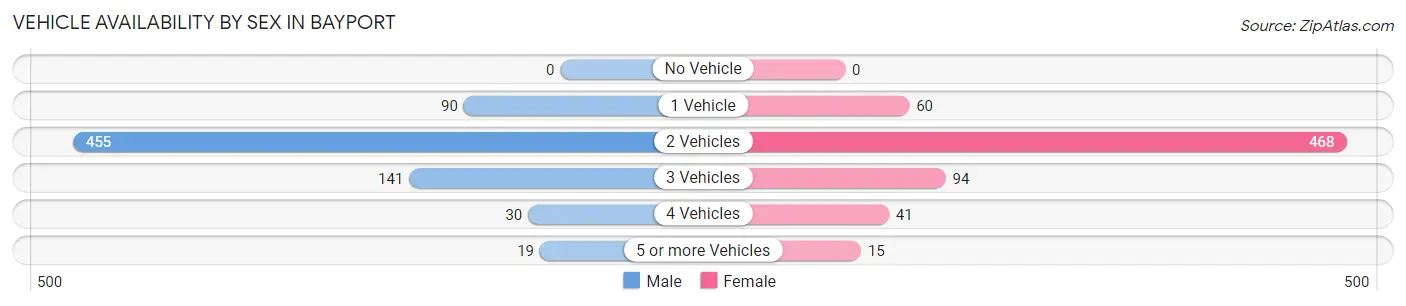
| Vehicles Available | Male | Female |
| No Vehicle | 0 (0.0%) | 0 (0.0%) |
| 1 Vehicle | 90 (12.2%) | 60 (8.8%) |
| 2 Vehicles | 455 (61.9%) | 468 (69.0%) |
| 3 Vehicles | 141 (19.2%) | 94 (13.9%) |
| 4 Vehicles | 30 (4.1%) | 41 (6.0%) |
| 5 or more Vehicles | 19 (2.6%) | 15 (2.2%) |
| Total | 735 (100.0%) | 678 (100.0%) |
Commute Time in Bayport
The most frequently occuring commute durations in Bayport are 30 to 34 minutes (294 commuters, 24.1%), 25 to 29 minutes (226 commuters, 18.5%), and 15 to 19 minutes (205 commuters, 16.8%).
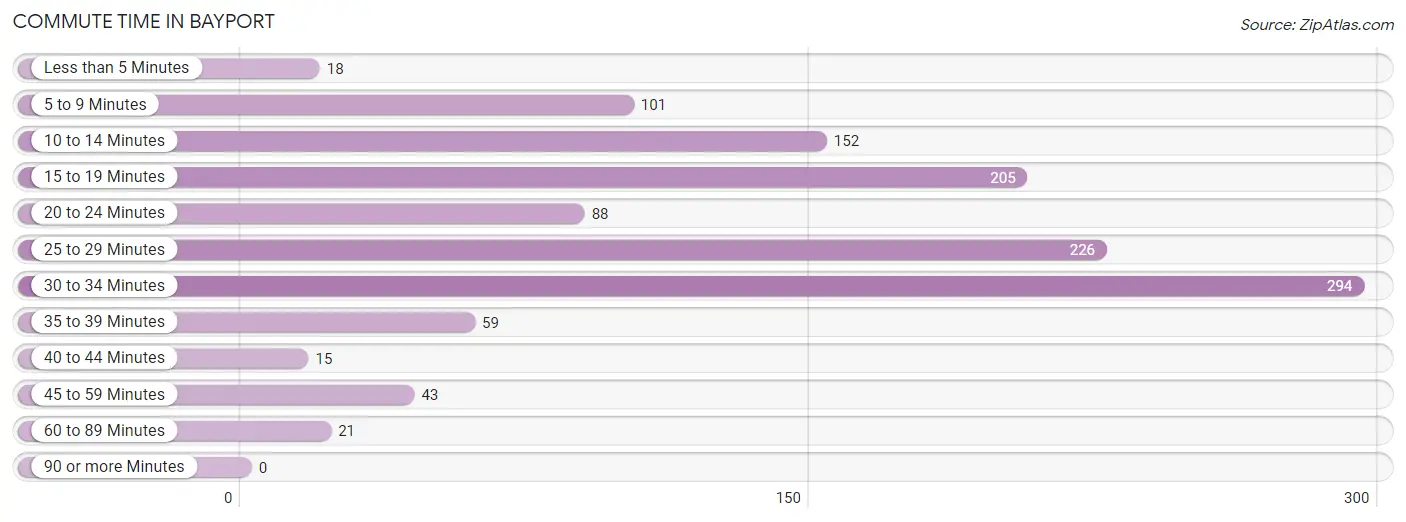
| Commute Time | # Commuters | % Commuters |
| Less than 5 Minutes | 18 | 1.5% |
| 5 to 9 Minutes | 101 | 8.3% |
| 10 to 14 Minutes | 152 | 12.4% |
| 15 to 19 Minutes | 205 | 16.8% |
| 20 to 24 Minutes | 88 | 7.2% |
| 25 to 29 Minutes | 226 | 18.5% |
| 30 to 34 Minutes | 294 | 24.1% |
| 35 to 39 Minutes | 59 | 4.8% |
| 40 to 44 Minutes | 15 | 1.2% |
| 45 to 59 Minutes | 43 | 3.5% |
| 60 to 89 Minutes | 21 | 1.7% |
| 90 or more Minutes | 0 | 0.0% |
Commute Time by Sex in Bayport
The most common commute times in Bayport are 30 to 34 minutes (242 commuters, 39.0%) for males and 25 to 29 minutes (175 commuters, 29.1%) for females.
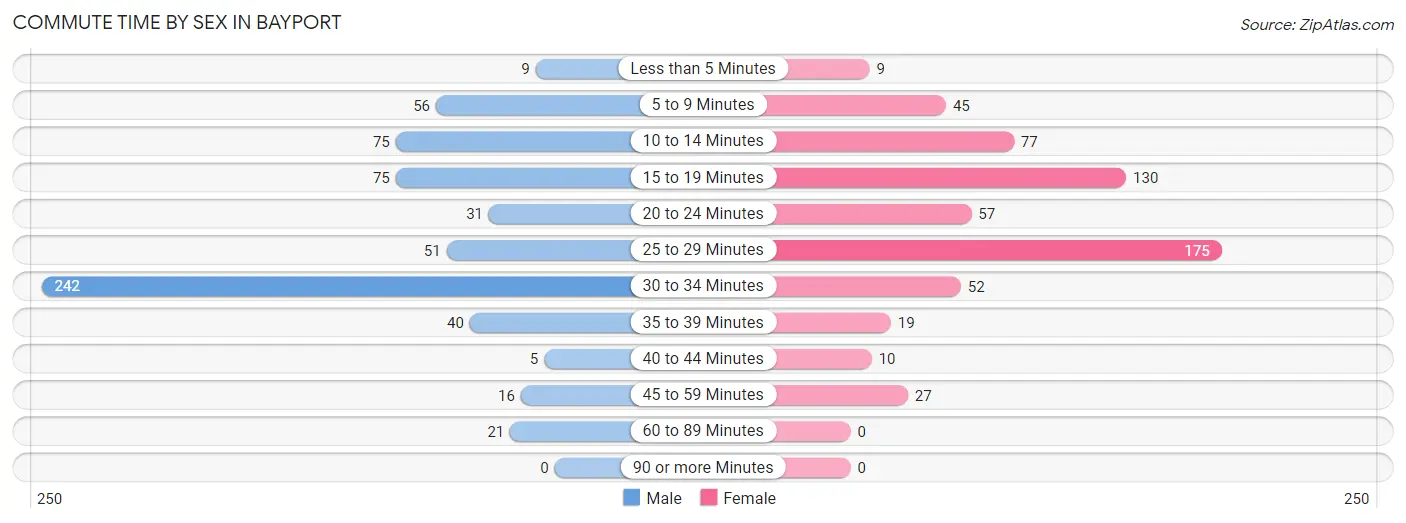
| Commute Time | Male | Female |
| Less than 5 Minutes | 9 (1.5%) | 9 (1.5%) |
| 5 to 9 Minutes | 56 (9.0%) | 45 (7.5%) |
| 10 to 14 Minutes | 75 (12.1%) | 77 (12.8%) |
| 15 to 19 Minutes | 75 (12.1%) | 130 (21.6%) |
| 20 to 24 Minutes | 31 (5.0%) | 57 (9.5%) |
| 25 to 29 Minutes | 51 (8.2%) | 175 (29.1%) |
| 30 to 34 Minutes | 242 (39.0%) | 52 (8.6%) |
| 35 to 39 Minutes | 40 (6.4%) | 19 (3.2%) |
| 40 to 44 Minutes | 5 (0.8%) | 10 (1.7%) |
| 45 to 59 Minutes | 16 (2.6%) | 27 (4.5%) |
| 60 to 89 Minutes | 21 (3.4%) | 0 (0.0%) |
| 90 or more Minutes | 0 (0.0%) | 0 (0.0%) |
Time of Departure to Work by Sex in Bayport
The most frequent times of departure to work in Bayport are 12:00 AM to 4:59 AM (144, 23.2%) for males and 5:30 AM to 5:59 AM (127, 21.1%) for females.
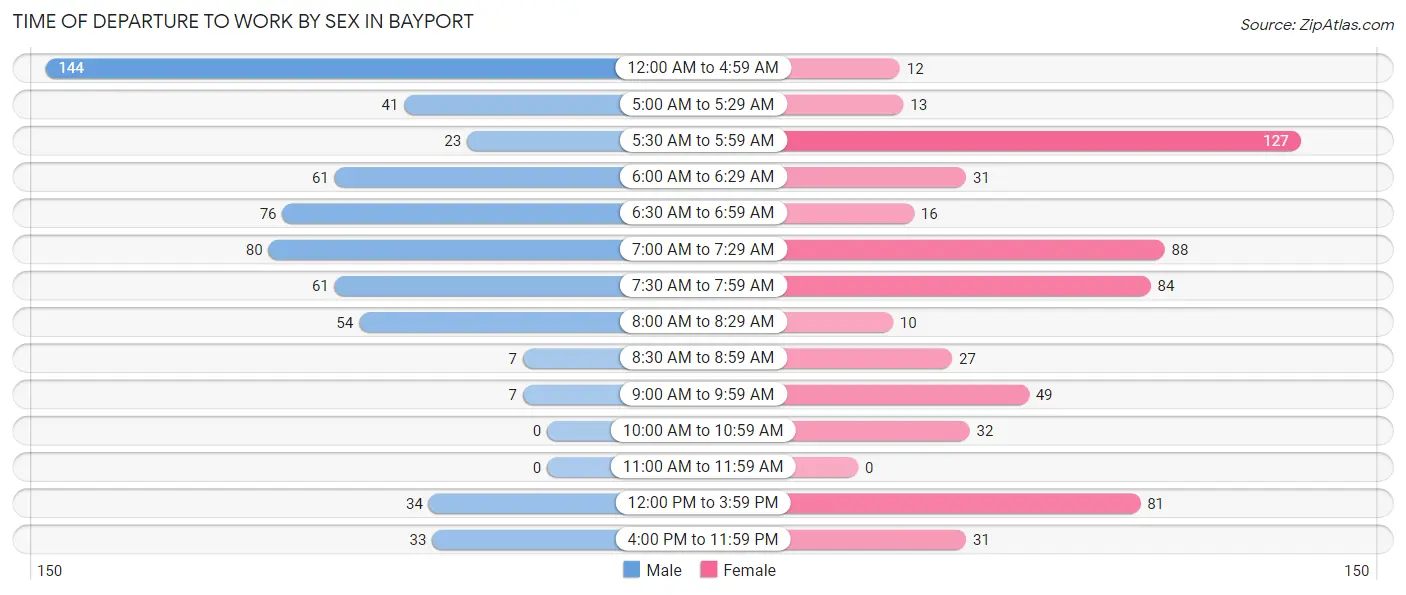
| Time of Departure | Male | Female |
| 12:00 AM to 4:59 AM | 144 (23.2%) | 12 (2.0%) |
| 5:00 AM to 5:29 AM | 41 (6.6%) | 13 (2.2%) |
| 5:30 AM to 5:59 AM | 23 (3.7%) | 127 (21.1%) |
| 6:00 AM to 6:29 AM | 61 (9.8%) | 31 (5.2%) |
| 6:30 AM to 6:59 AM | 76 (12.2%) | 16 (2.7%) |
| 7:00 AM to 7:29 AM | 80 (12.9%) | 88 (14.6%) |
| 7:30 AM to 7:59 AM | 61 (9.8%) | 84 (14.0%) |
| 8:00 AM to 8:29 AM | 54 (8.7%) | 10 (1.7%) |
| 8:30 AM to 8:59 AM | 7 (1.1%) | 27 (4.5%) |
| 9:00 AM to 9:59 AM | 7 (1.1%) | 49 (8.2%) |
| 10:00 AM to 10:59 AM | 0 (0.0%) | 32 (5.3%) |
| 11:00 AM to 11:59 AM | 0 (0.0%) | 0 (0.0%) |
| 12:00 PM to 3:59 PM | 34 (5.5%) | 81 (13.5%) |
| 4:00 PM to 11:59 PM | 33 (5.3%) | 31 (5.2%) |
| Total | 621 (100.0%) | 601 (100.0%) |
Housing Occupancy in Bayport
Occupancy by Ownership in Bayport
Of the total 1,165 dwellings in Bayport, owner-occupied units account for 955 (82.0%), while renter-occupied units make up 210 (18.0%).
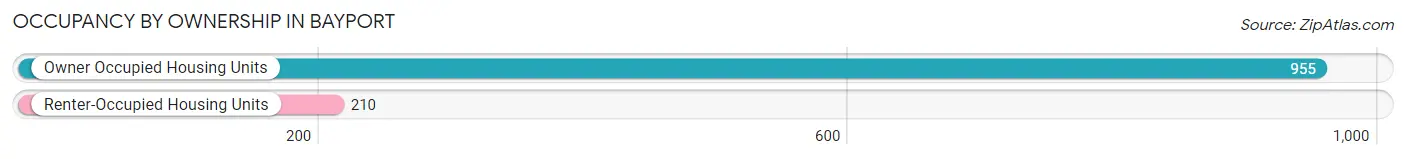
| Occupancy | # Housing Units | % Housing Units |
| Owner Occupied Housing Units | 955 | 82.0% |
| Renter-Occupied Housing Units | 210 | 18.0% |
| Total Occupied Housing Units | 1,165 | 100.0% |
Occupancy by Household Size in Bayport
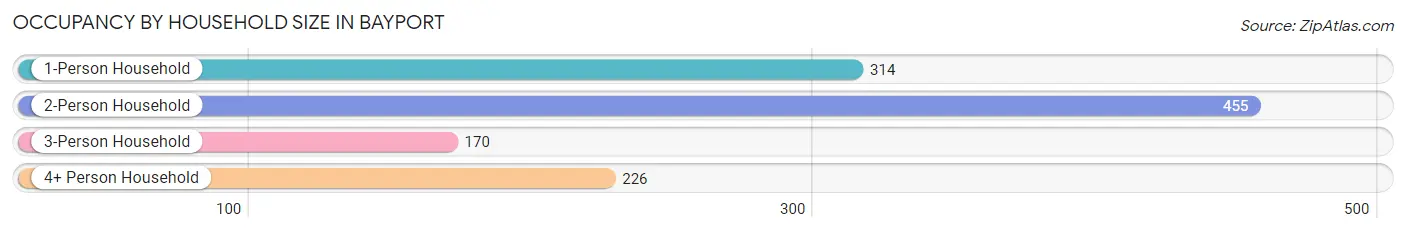
| Household Size | # Housing Units | % Housing Units |
| 1-Person Household | 314 | 27.0% |
| 2-Person Household | 455 | 39.1% |
| 3-Person Household | 170 | 14.6% |
| 4+ Person Household | 226 | 19.4% |
| Total Housing Units | 1,165 | 100.0% |
Occupancy by Ownership by Household Size in Bayport
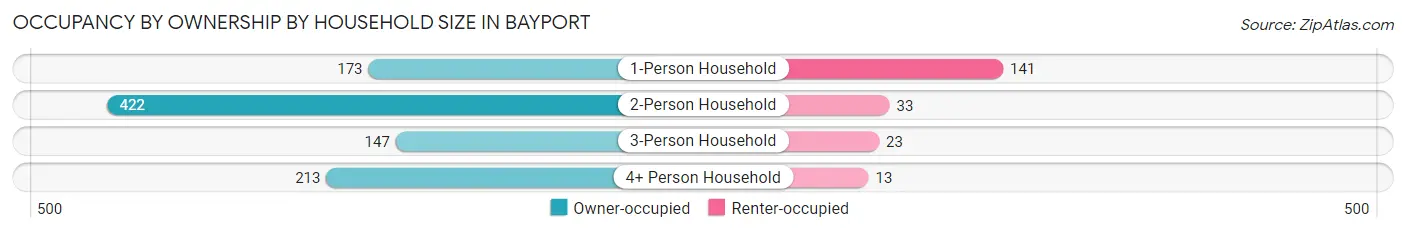
| Household Size | Owner-occupied | Renter-occupied |
| 1-Person Household | 173 (55.1%) | 141 (44.9%) |
| 2-Person Household | 422 (92.7%) | 33 (7.2%) |
| 3-Person Household | 147 (86.5%) | 23 (13.5%) |
| 4+ Person Household | 213 (94.3%) | 13 (5.8%) |
| Total Housing Units | 955 (82.0%) | 210 (18.0%) |
Occupancy by Educational Attainment in Bayport
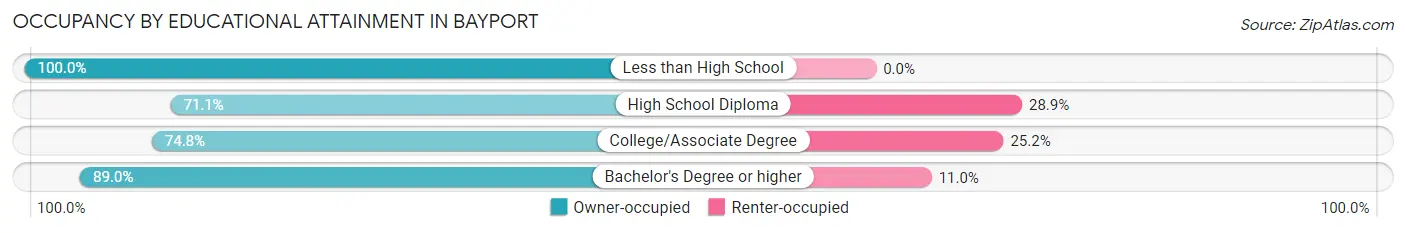
| Household Size | Owner-occupied | Renter-occupied |
| Less than High School | 134 (100.0%) | 0 (0.0%) |
| High School Diploma | 204 (71.1%) | 83 (28.9%) |
| College/Associate Degree | 237 (74.8%) | 80 (25.2%) |
| Bachelor's Degree or higher | 380 (89.0%) | 47 (11.0%) |
Occupancy by Age of Householder in Bayport
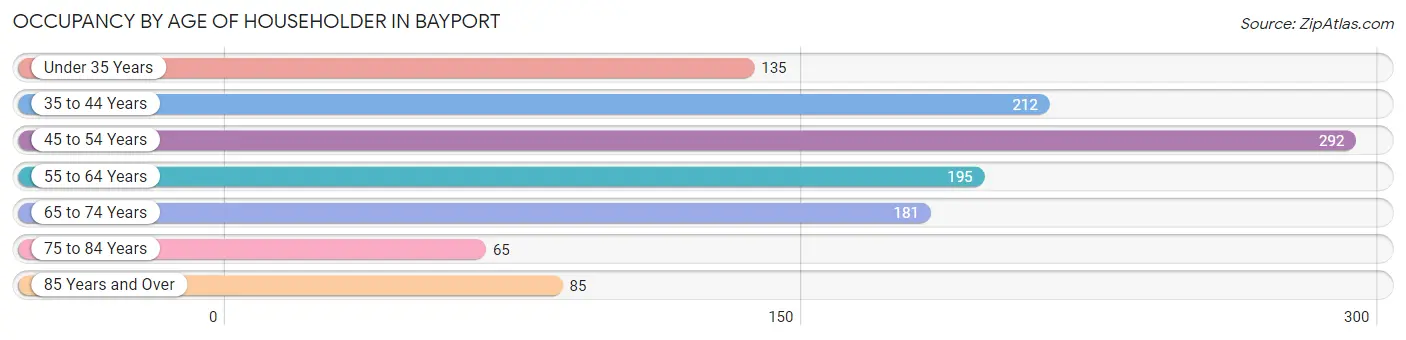
| Age Bracket | # Households | % Households |
| Under 35 Years | 135 | 11.6% |
| 35 to 44 Years | 212 | 18.2% |
| 45 to 54 Years | 292 | 25.1% |
| 55 to 64 Years | 195 | 16.7% |
| 65 to 74 Years | 181 | 15.5% |
| 75 to 84 Years | 65 | 5.6% |
| 85 Years and Over | 85 | 7.3% |
| Total | 1,165 | 100.0% |
Housing Finances in Bayport
Median Income by Occupancy in Bayport
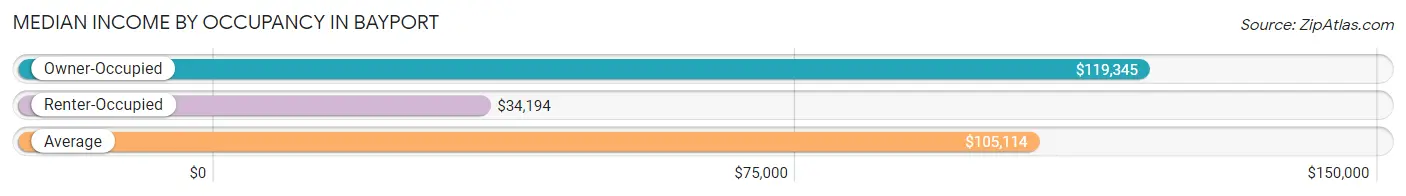
| Occupancy Type | # Households | Median Income |
| Owner-Occupied | 955 (82.0%) | $119,345 |
| Renter-Occupied | 210 (18.0%) | $34,194 |
| Average | 1,165 (100.0%) | $105,114 |
Occupancy by Householder Income Bracket in Bayport
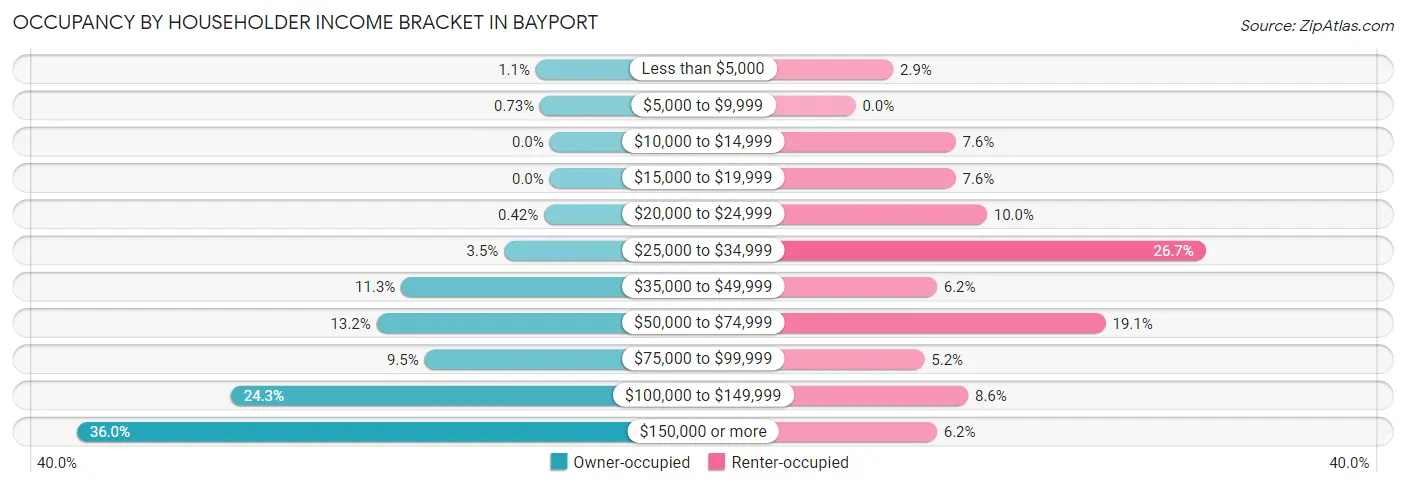
| Income Bracket | Owner-occupied | Renter-occupied |
| Less than $5,000 | 10 (1.1%) | 6 (2.9%) |
| $5,000 to $9,999 | 7 (0.7%) | 0 (0.0%) |
| $10,000 to $14,999 | 0 (0.0%) | 16 (7.6%) |
| $15,000 to $19,999 | 0 (0.0%) | 16 (7.6%) |
| $20,000 to $24,999 | 4 (0.4%) | 21 (10.0%) |
| $25,000 to $34,999 | 33 (3.5%) | 56 (26.7%) |
| $35,000 to $49,999 | 108 (11.3%) | 13 (6.2%) |
| $50,000 to $74,999 | 126 (13.2%) | 40 (19.1%) |
| $75,000 to $99,999 | 91 (9.5%) | 11 (5.2%) |
| $100,000 to $149,999 | 232 (24.3%) | 18 (8.6%) |
| $150,000 or more | 344 (36.0%) | 13 (6.2%) |
| Total | 955 (100.0%) | 210 (100.0%) |
Monthly Housing Cost Tiers in Bayport
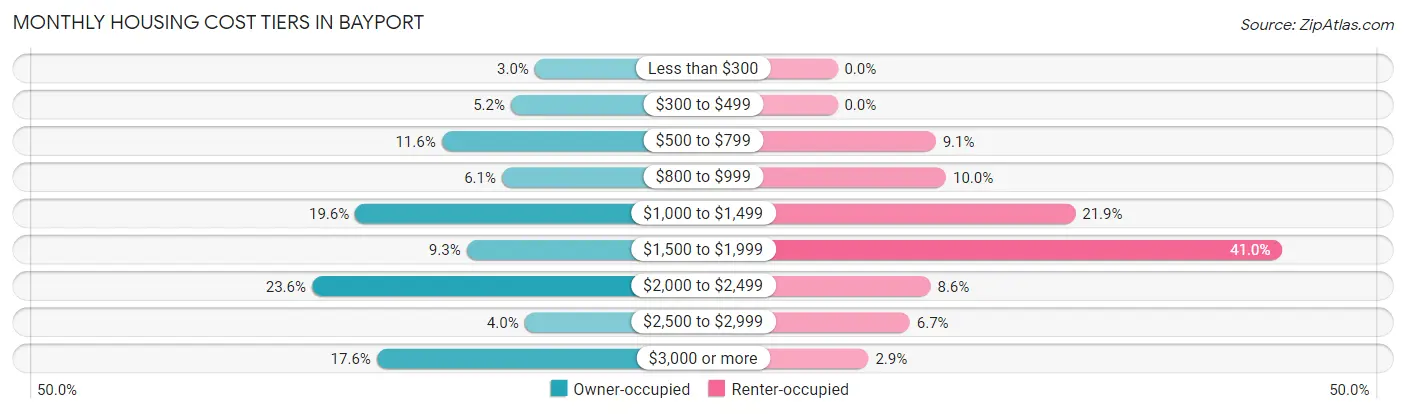
| Monthly Cost | Owner-occupied | Renter-occupied |
| Less than $300 | 29 (3.0%) | 0 (0.0%) |
| $300 to $499 | 50 (5.2%) | 0 (0.0%) |
| $500 to $799 | 111 (11.6%) | 19 (9.0%) |
| $800 to $999 | 58 (6.1%) | 21 (10.0%) |
| $1,000 to $1,499 | 187 (19.6%) | 46 (21.9%) |
| $1,500 to $1,999 | 89 (9.3%) | 86 (40.9%) |
| $2,000 to $2,499 | 225 (23.6%) | 18 (8.6%) |
| $2,500 to $2,999 | 38 (4.0%) | 14 (6.7%) |
| $3,000 or more | 168 (17.6%) | 6 (2.9%) |
| Total | 955 (100.0%) | 210 (100.0%) |
Physical Housing Characteristics in Bayport
Housing Structures in Bayport
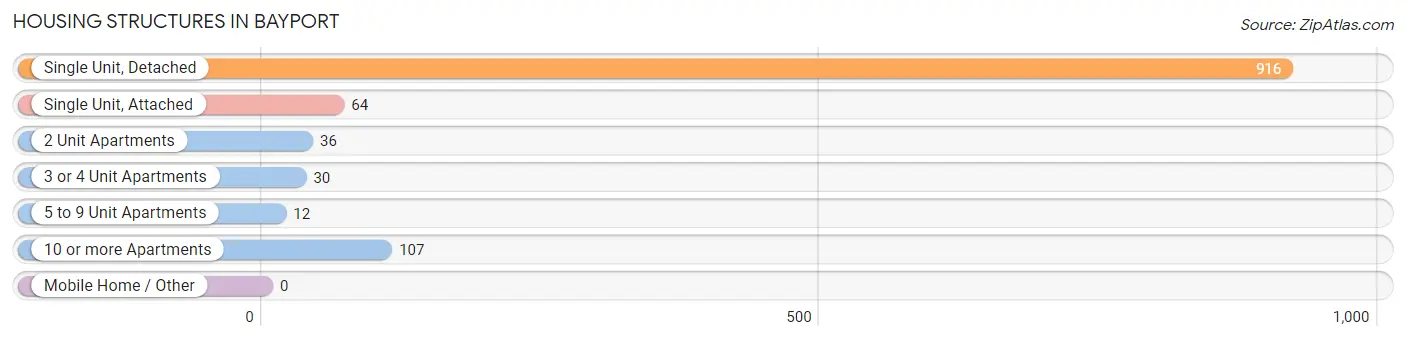
| Structure Type | # Housing Units | % Housing Units |
| Single Unit, Detached | 916 | 78.6% |
| Single Unit, Attached | 64 | 5.5% |
| 2 Unit Apartments | 36 | 3.1% |
| 3 or 4 Unit Apartments | 30 | 2.6% |
| 5 to 9 Unit Apartments | 12 | 1.0% |
| 10 or more Apartments | 107 | 9.2% |
| Mobile Home / Other | 0 | 0.0% |
| Total | 1,165 | 100.0% |
Housing Structures by Occupancy in Bayport
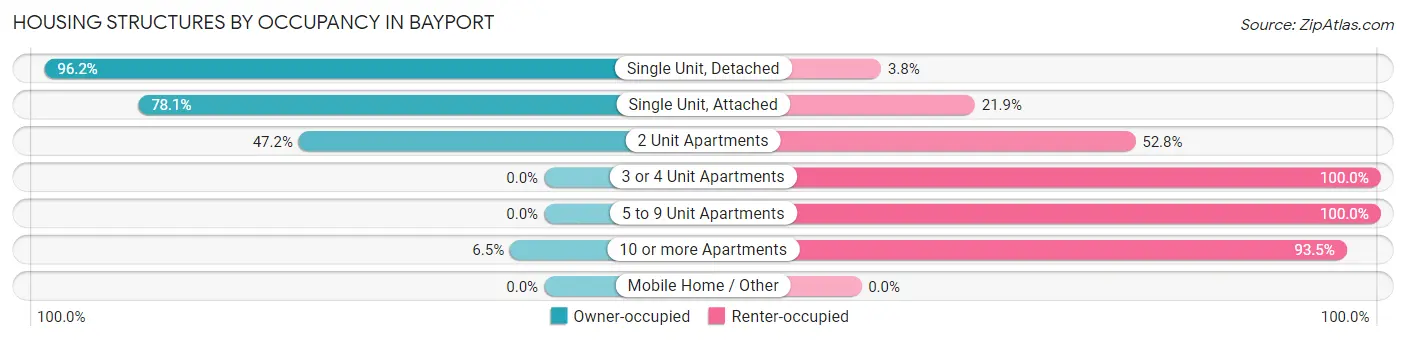
| Structure Type | Owner-occupied | Renter-occupied |
| Single Unit, Detached | 881 (96.2%) | 35 (3.8%) |
| Single Unit, Attached | 50 (78.1%) | 14 (21.9%) |
| 2 Unit Apartments | 17 (47.2%) | 19 (52.8%) |
| 3 or 4 Unit Apartments | 0 (0.0%) | 30 (100.0%) |
| 5 to 9 Unit Apartments | 0 (0.0%) | 12 (100.0%) |
| 10 or more Apartments | 7 (6.5%) | 100 (93.5%) |
| Mobile Home / Other | 0 (0.0%) | 0 (0.0%) |
| Total | 955 (82.0%) | 210 (18.0%) |
Housing Structures by Number of Rooms in Bayport
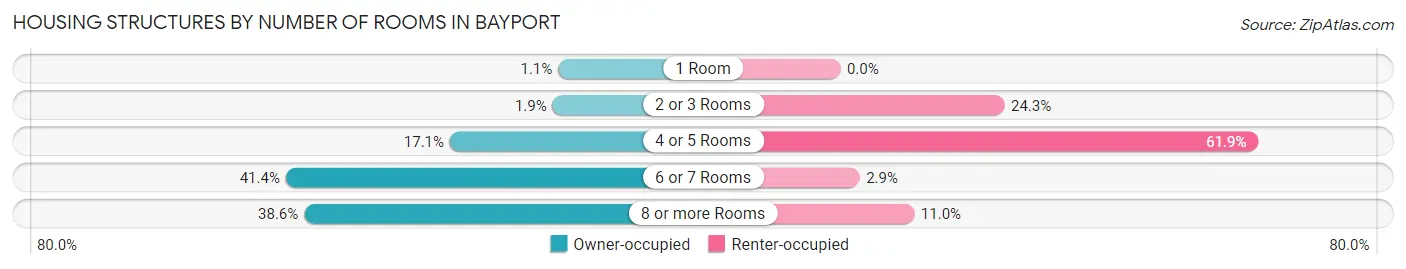
| Number of Rooms | Owner-occupied | Renter-occupied |
| 1 Room | 10 (1.1%) | 0 (0.0%) |
| 2 or 3 Rooms | 18 (1.9%) | 51 (24.3%) |
| 4 or 5 Rooms | 163 (17.1%) | 130 (61.9%) |
| 6 or 7 Rooms | 395 (41.4%) | 6 (2.9%) |
| 8 or more Rooms | 369 (38.6%) | 23 (11.0%) |
| Total | 955 (100.0%) | 210 (100.0%) |
Housing Structure by Heating Type in Bayport
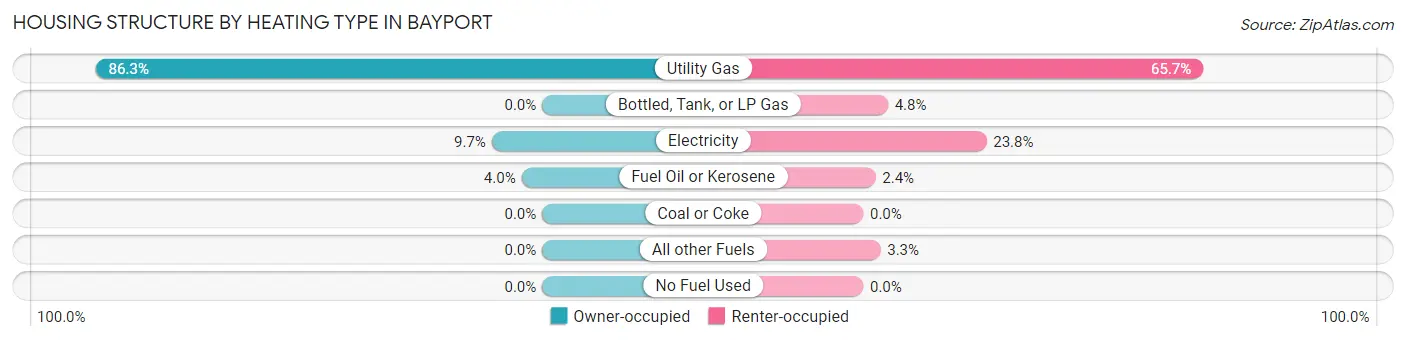
| Heating Type | Owner-occupied | Renter-occupied |
| Utility Gas | 824 (86.3%) | 138 (65.7%) |
| Bottled, Tank, or LP Gas | 0 (0.0%) | 10 (4.8%) |
| Electricity | 93 (9.7%) | 50 (23.8%) |
| Fuel Oil or Kerosene | 38 (4.0%) | 5 (2.4%) |
| Coal or Coke | 0 (0.0%) | 0 (0.0%) |
| All other Fuels | 0 (0.0%) | 7 (3.3%) |
| No Fuel Used | 0 (0.0%) | 0 (0.0%) |
| Total | 955 (100.0%) | 210 (100.0%) |
Household Vehicle Usage in Bayport
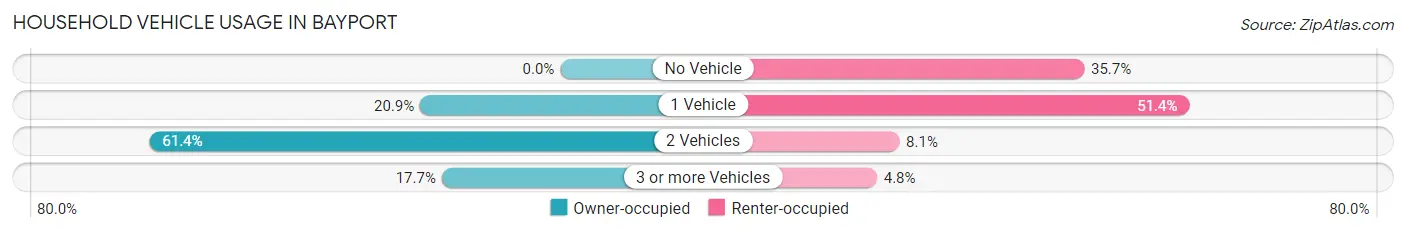
| Vehicles per Household | Owner-occupied | Renter-occupied |
| No Vehicle | 0 (0.0%) | 75 (35.7%) |
| 1 Vehicle | 200 (20.9%) | 108 (51.4%) |
| 2 Vehicles | 586 (61.4%) | 17 (8.1%) |
| 3 or more Vehicles | 169 (17.7%) | 10 (4.8%) |
| Total | 955 (100.0%) | 210 (100.0%) |
Real Estate & Mortgages in Bayport
Real Estate and Mortgage Overview in Bayport
| Characteristic | Without Mortgage | With Mortgage |
| Housing Units | 289 | 666 |
| Median Property Value | $342,500 | $354,100 |
| Median Household Income | $69,432 | $305 |
| Monthly Housing Costs | $701 | $168 |
| Real Estate Taxes | $2,726 | $0 |
Property Value by Mortgage Status in Bayport
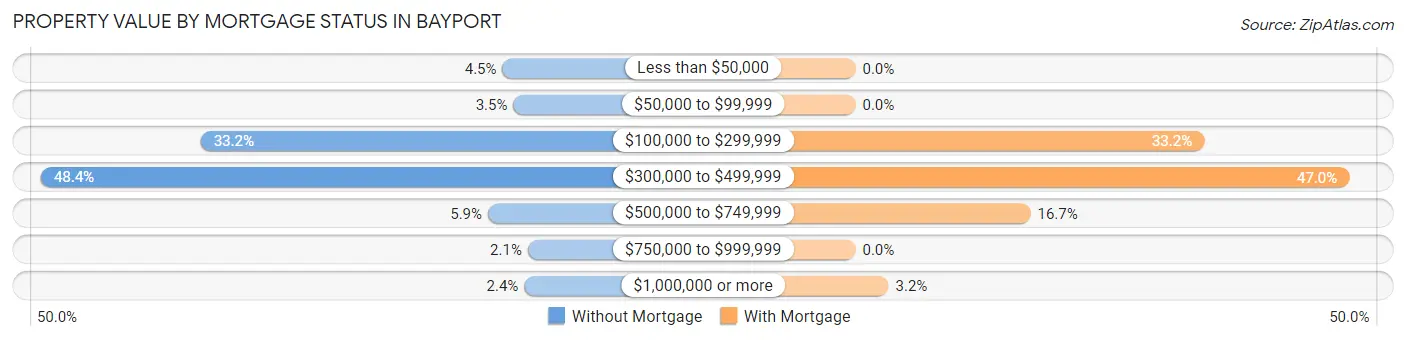
| Property Value | Without Mortgage | With Mortgage |
| Less than $50,000 | 13 (4.5%) | 0 (0.0%) |
| $50,000 to $99,999 | 10 (3.5%) | 0 (0.0%) |
| $100,000 to $299,999 | 96 (33.2%) | 221 (33.2%) |
| $300,000 to $499,999 | 140 (48.4%) | 313 (47.0%) |
| $500,000 to $749,999 | 17 (5.9%) | 111 (16.7%) |
| $750,000 to $999,999 | 6 (2.1%) | 0 (0.0%) |
| $1,000,000 or more | 7 (2.4%) | 21 (3.2%) |
| Total | 289 (100.0%) | 666 (100.0%) |
Household Income by Mortgage Status in Bayport
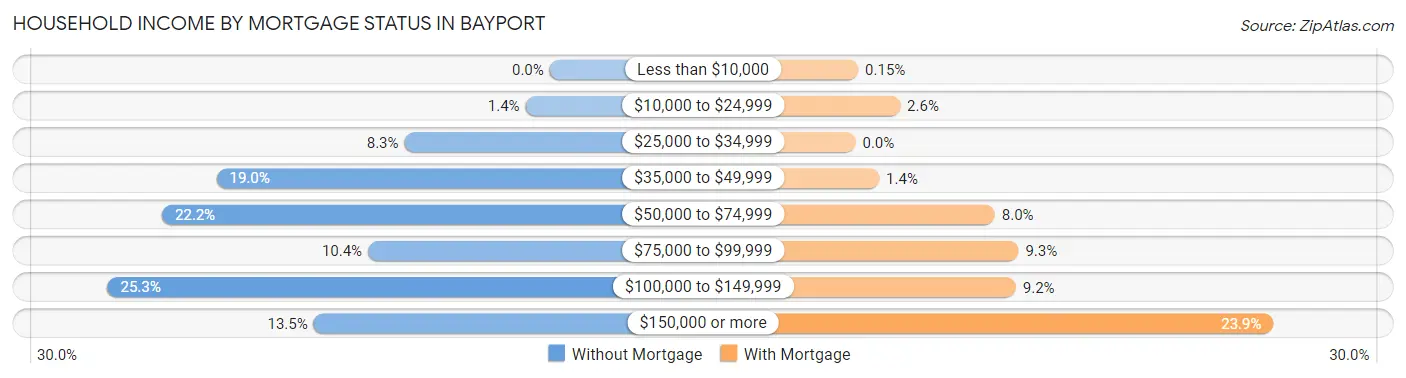
| Household Income | Without Mortgage | With Mortgage |
| Less than $10,000 | 0 (0.0%) | 1 (0.2%) |
| $10,000 to $24,999 | 4 (1.4%) | 17 (2.5%) |
| $25,000 to $34,999 | 24 (8.3%) | 0 (0.0%) |
| $35,000 to $49,999 | 55 (19.0%) | 9 (1.3%) |
| $50,000 to $74,999 | 64 (22.2%) | 53 (8.0%) |
| $75,000 to $99,999 | 30 (10.4%) | 62 (9.3%) |
| $100,000 to $149,999 | 73 (25.3%) | 61 (9.2%) |
| $150,000 or more | 39 (13.5%) | 159 (23.9%) |
| Total | 289 (100.0%) | 666 (100.0%) |
Property Value to Household Income Ratio in Bayport
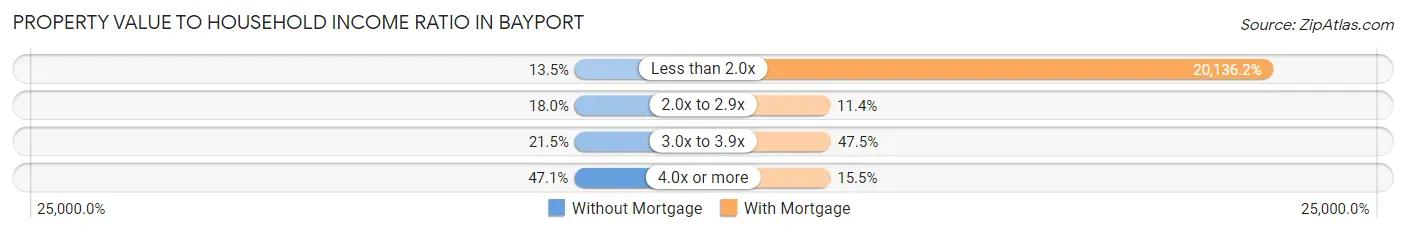
| Value-to-Income Ratio | Without Mortgage | With Mortgage |
| Less than 2.0x | 39 (13.5%) | 134,107 (20,136.2%) |
| 2.0x to 2.9x | 52 (18.0%) | 76 (11.4%) |
| 3.0x to 3.9x | 62 (21.4%) | 316 (47.4%) |
| 4.0x or more | 136 (47.1%) | 103 (15.5%) |
| Total | 289 (100.0%) | 666 (100.0%) |
Real Estate Taxes by Mortgage Status in Bayport

| Property Taxes | Without Mortgage | With Mortgage |
| Less than $800 | 0 (0.0%) | 4 (0.6%) |
| $800 to $1,499 | 28 (9.7%) | 0 (0.0%) |
| $800 to $1,499 | 254 (87.9%) | 31 (4.6%) |
| Total | 289 (100.0%) | 666 (100.0%) |
Health & Disability in Bayport
Health Insurance Coverage by Age in Bayport
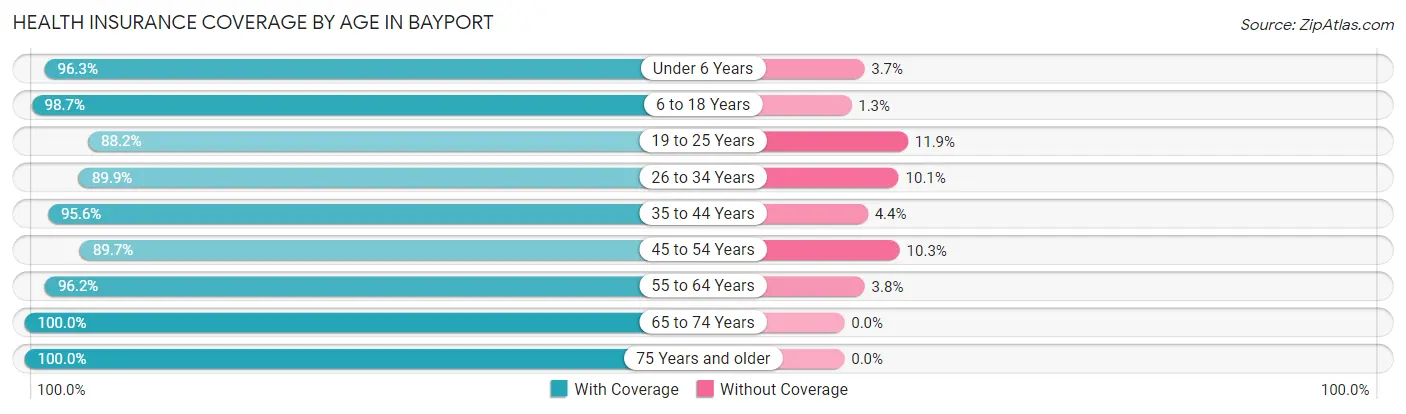
| Age Bracket | With Coverage | Without Coverage |
| Under 6 Years | 155 (96.3%) | 6 (3.7%) |
| 6 to 18 Years | 457 (98.7%) | 6 (1.3%) |
| 19 to 25 Years | 119 (88.1%) | 16 (11.8%) |
| 26 to 34 Years | 213 (89.9%) | 24 (10.1%) |
| 35 to 44 Years | 483 (95.6%) | 22 (4.4%) |
| 45 to 54 Years | 365 (89.7%) | 42 (10.3%) |
| 55 to 64 Years | 329 (96.2%) | 13 (3.8%) |
| 65 to 74 Years | 240 (100.0%) | 0 (0.0%) |
| 75 Years and older | 201 (100.0%) | 0 (0.0%) |
| Total | 2,562 (95.2%) | 129 (4.8%) |
Health Insurance Coverage by Citizenship Status in Bayport
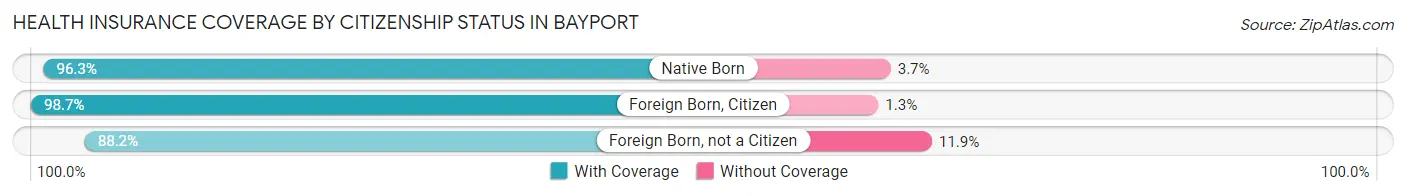
| Citizenship Status | With Coverage | Without Coverage |
| Native Born | 155 (96.3%) | 6 (3.7%) |
| Foreign Born, Citizen | 457 (98.7%) | 6 (1.3%) |
| Foreign Born, not a Citizen | 119 (88.1%) | 16 (11.8%) |
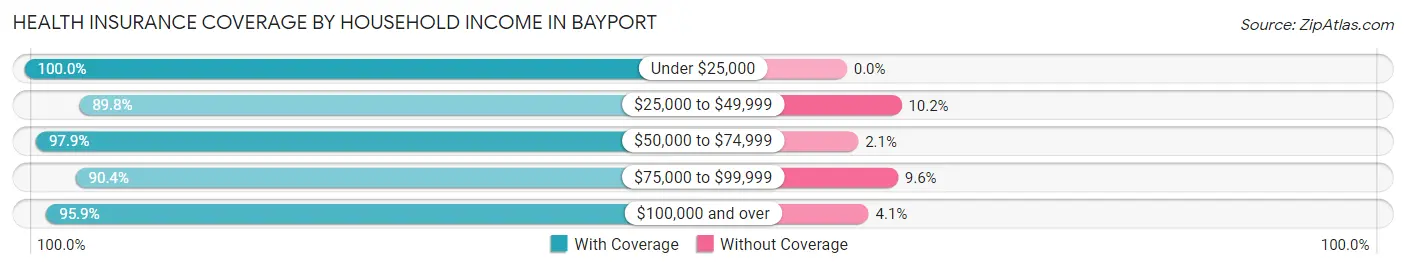
Health Insurance Coverage by Household Income in Bayport
| Household Income | With Coverage | Without Coverage |
| Under $25,000 | 131 (100.0%) | 0 (0.0%) |
| $25,000 to $49,999 | 263 (89.8%) | 30 (10.2%) |
| $50,000 to $74,999 | 320 (97.9%) | 7 (2.1%) |
| $75,000 to $99,999 | 227 (90.4%) | 24 (9.6%) |
| $100,000 and over | 1,599 (95.9%) | 68 (4.1%) |
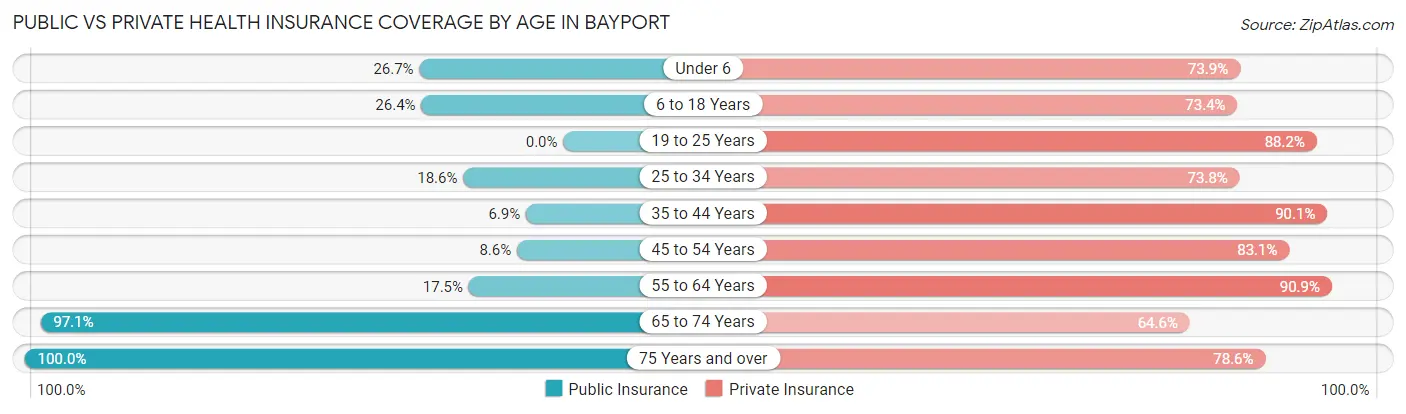
Public vs Private Health Insurance Coverage by Age in Bayport
| Age Bracket | Public Insurance | Private Insurance |
| Under 6 | 43 (26.7%) | 119 (73.9%) |
| 6 to 18 Years | 122 (26.4%) | 340 (73.4%) |
| 19 to 25 Years | 0 (0.0%) | 119 (88.1%) |
| 25 to 34 Years | 44 (18.6%) | 175 (73.8%) |
| 35 to 44 Years | 35 (6.9%) | 455 (90.1%) |
| 45 to 54 Years | 35 (8.6%) | 338 (83.1%) |
| 55 to 64 Years | 60 (17.5%) | 311 (90.9%) |
| 65 to 74 Years | 233 (97.1%) | 155 (64.6%) |
| 75 Years and over | 201 (100.0%) | 158 (78.6%) |
| Total | 773 (28.7%) | 2,170 (80.6%) |
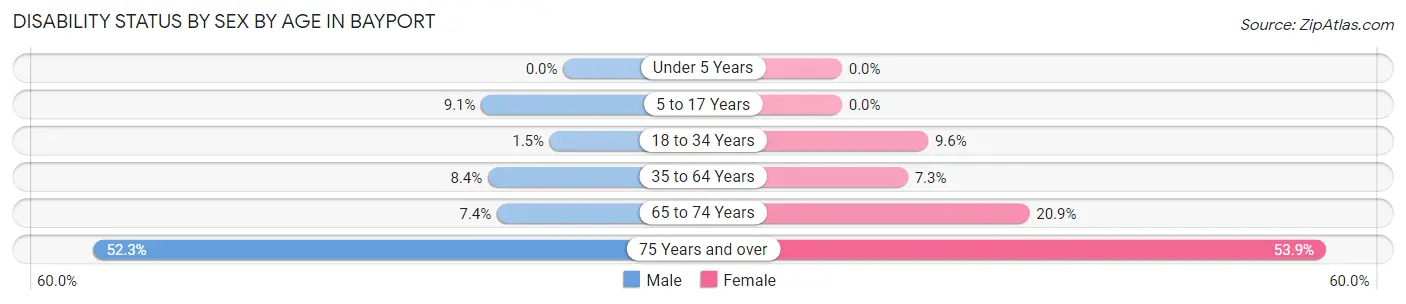
Disability Status by Sex by Age in Bayport
| Age Bracket | Male | Female |
| Under 5 Years | 0 (0.0%) | 0 (0.0%) |
| 5 to 17 Years | 21 (9.1%) | 0 (0.0%) |
| 18 to 34 Years | 2 (1.5%) | 24 (9.6%) |
| 35 to 64 Years | 56 (8.4%) | 43 (7.3%) |
| 65 to 74 Years | 11 (7.4%) | 19 (20.9%) |
| 75 Years and over | 45 (52.3%) | 62 (53.9%) |
Disability Class by Sex by Age in Bayport
Disability Class: Hearing Difficulty
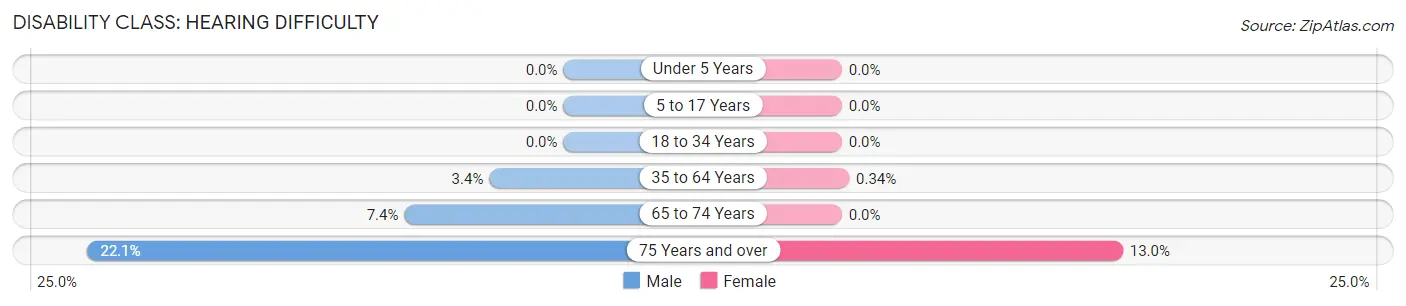
| Age Bracket | Male | Female |
| Under 5 Years | 0 (0.0%) | 0 (0.0%) |
| 5 to 17 Years | 0 (0.0%) | 0 (0.0%) |
| 18 to 34 Years | 0 (0.0%) | 0 (0.0%) |
| 35 to 64 Years | 23 (3.4%) | 2 (0.3%) |
| 65 to 74 Years | 11 (7.4%) | 0 (0.0%) |
| 75 Years and over | 19 (22.1%) | 15 (13.0%) |
Disability Class: Vision Difficulty
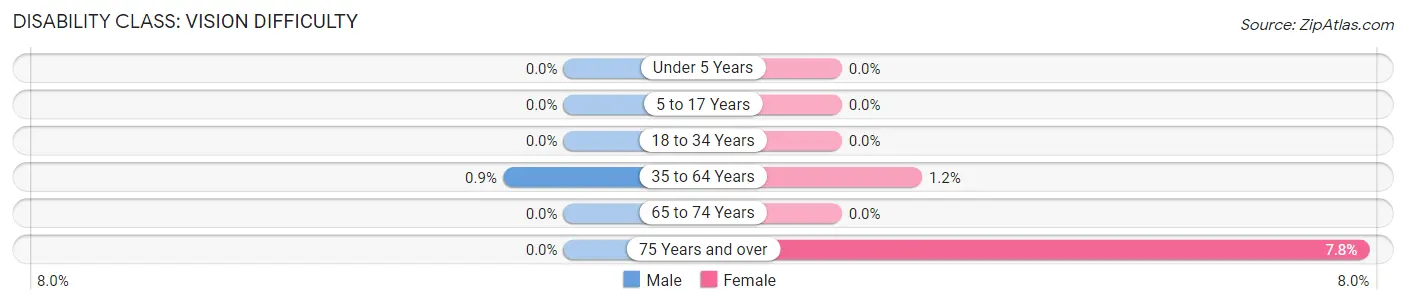
| Age Bracket | Male | Female |
| Under 5 Years | 0 (0.0%) | 0 (0.0%) |
| 5 to 17 Years | 0 (0.0%) | 0 (0.0%) |
| 18 to 34 Years | 0 (0.0%) | 0 (0.0%) |
| 35 to 64 Years | 6 (0.9%) | 7 (1.2%) |
| 65 to 74 Years | 0 (0.0%) | 0 (0.0%) |
| 75 Years and over | 0 (0.0%) | 9 (7.8%) |
Disability Class: Cognitive Difficulty
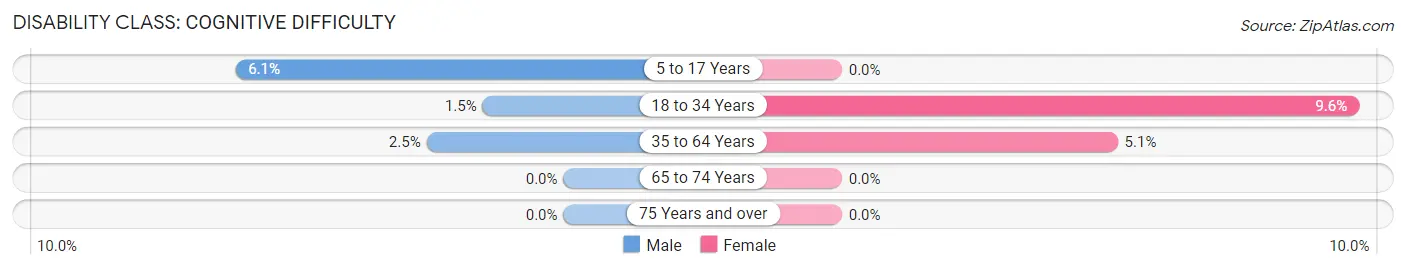
| Age Bracket | Male | Female |
| 5 to 17 Years | 14 (6.1%) | 0 (0.0%) |
| 18 to 34 Years | 2 (1.5%) | 24 (9.6%) |
| 35 to 64 Years | 17 (2.5%) | 30 (5.1%) |
| 65 to 74 Years | 0 (0.0%) | 0 (0.0%) |
| 75 Years and over | 0 (0.0%) | 0 (0.0%) |
Disability Class: Ambulatory Difficulty
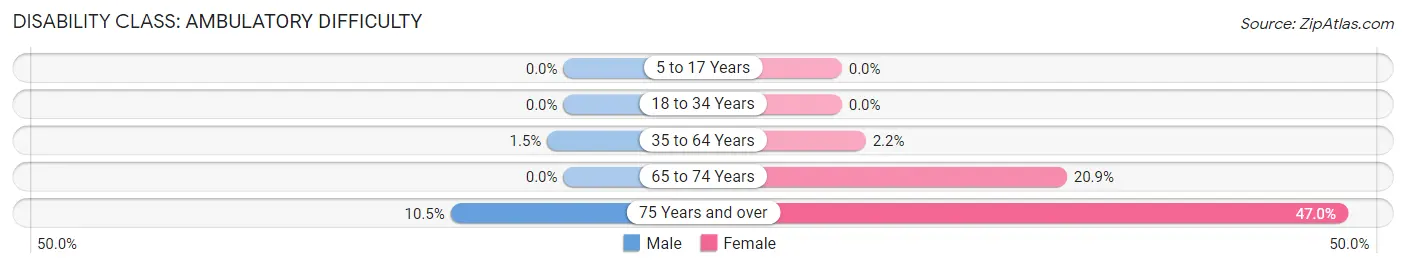
| Age Bracket | Male | Female |
| 5 to 17 Years | 0 (0.0%) | 0 (0.0%) |
| 18 to 34 Years | 0 (0.0%) | 0 (0.0%) |
| 35 to 64 Years | 10 (1.5%) | 13 (2.2%) |
| 65 to 74 Years | 0 (0.0%) | 19 (20.9%) |
| 75 Years and over | 9 (10.5%) | 54 (47.0%) |
Disability Class: Self-Care Difficulty
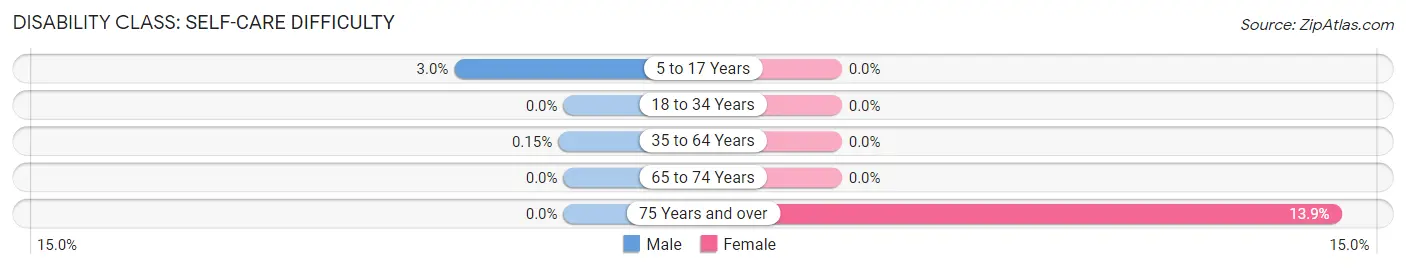
| Age Bracket | Male | Female |
| 5 to 17 Years | 7 (3.0%) | 0 (0.0%) |
| 18 to 34 Years | 0 (0.0%) | 0 (0.0%) |
| 35 to 64 Years | 1 (0.2%) | 0 (0.0%) |
| 65 to 74 Years | 0 (0.0%) | 0 (0.0%) |
| 75 Years and over | 0 (0.0%) | 16 (13.9%) |
Technology Access in Bayport
Computing Device Access in Bayport
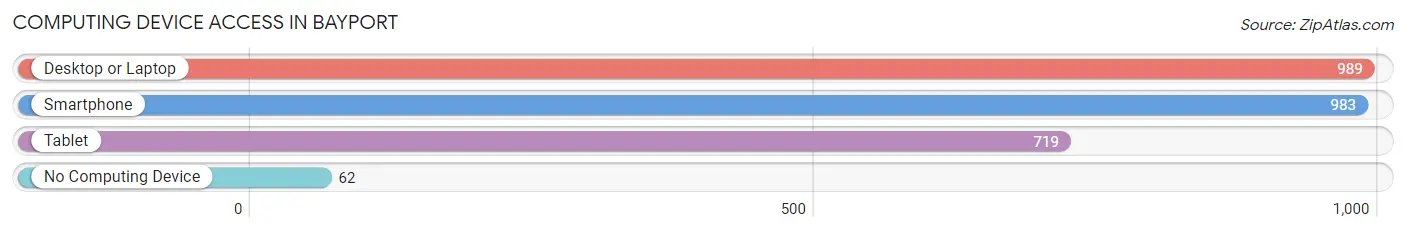
| Device Type | # Households | % Households |
| Desktop or Laptop | 989 | 84.9% |
| Smartphone | 983 | 84.4% |
| Tablet | 719 | 61.7% |
| No Computing Device | 62 | 5.3% |
| Total | 1,165 | 100.0% |
Internet Access in Bayport
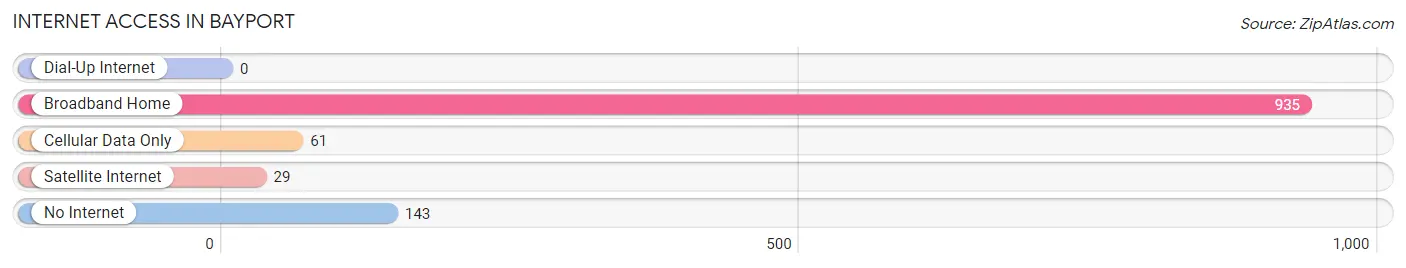
| Internet Type | # Households | % Households |
| Dial-Up Internet | 0 | 0.0% |
| Broadband Home | 935 | 80.3% |
| Cellular Data Only | 61 | 5.2% |
| Satellite Internet | 29 | 2.5% |
| No Internet | 143 | 12.3% |
| Total | 1,165 | 100.0% |
Bayport Summary
Bayport, Minnesota is a small city located in Washington County, Minnesota, United States. It is situated on the St. Croix River, which forms the border between Minnesota and Wisconsin. The city is part of the Twin Cities metropolitan area and is located approximately 20 miles northeast of Minneapolis. As of the 2010 census, the population of Bayport was 2,521.
History
The area that is now Bayport was first settled in the early 1800s by French-Canadian fur traders. The first permanent settlers arrived in the area in 1844, and the town was officially platted in 1854. The town was originally named “Bayport” because of its location on the St. Croix River, which was a major shipping port at the time.
In the late 1800s, Bayport became a popular summer resort destination for wealthy families from the Twin Cities. The town was home to several large resorts, including the Bayport Hotel, which was built in 1887 and was one of the largest hotels in the state at the time.
In the early 1900s, Bayport became a popular destination for ice fishing and other winter sports. The town was also home to several large factories, including a paper mill and a canning factory.
Geography
Bayport is located in Washington County, Minnesota, United States. It is situated on the St. Croix River, which forms the border between Minnesota and Wisconsin. The city is part of the Twin Cities metropolitan area and is located approximately 20 miles northeast of Minneapolis.
The city has a total area of 2.2 square miles, all of which is land. The terrain is mostly flat, with some rolling hills. The city is located in the St. Croix River Valley, which is part of the Driftless Area.
Economy
The economy of Bayport is largely based on tourism and manufacturing. The city is home to several large factories, including a paper mill and a canning factory. The city is also home to several small businesses, including restaurants, retail stores, and service providers.
The city is also home to several large employers, including 3M, Andersen Windows, and the St. Croix Valley Medical Center.
Demographics
As of the 2010 census, the population of Bayport was 2,521. The racial makeup of the city was 94.3% White, 1.2% African American, 0.3% Native American, 1.2% Asian, 0.1% Pacific Islander, 1.2% from other races, and 1.9% from two or more races. Hispanic or Latino of any race were 3.2% of the population.
The median income for a household in the city was $50,938, and the median income for a family was $60,938. The per capita income for the city was $25,938. About 4.3% of families and 5.7% of the population were below the poverty line, including 6.3% of those under age 18 and 4.3% of those age 65 or over.
Common Questions
What is Per Capita Income in Bayport?
Per Capita income in Bayport is $37,520.
What is the Median Family Income in Bayport?
Median Family Income in Bayport is $130,147.
What is the Median Household income in Bayport?
Median Household Income in Bayport is $105,114.
What is Income or Wage Gap in Bayport?
Income or Wage Gap in Bayport is 40.6%.
Women in Bayport earn 59.4 cents for every dollar earned by a man.
What is Inequality or Gini Index in Bayport?
Inequality or Gini Index in Bayport is 0.41.
What is the Total Population of Bayport?
Total Population of Bayport is 3,902.
What is the Total Male Population of Bayport?
Total Male Population of Bayport is 2,525.
What is the Total Female Population of Bayport?
Total Female Population of Bayport is 1,377.
What is the Ratio of Males per 100 Females in Bayport?
There are 183.37 Males per 100 Females in Bayport.
What is the Ratio of Females per 100 Males in Bayport?
There are 54.53 Females per 100 Males in Bayport.
What is the Median Population Age in Bayport?
Median Population Age in Bayport is 40.0 Years.
What is the Average Family Size in Bayport
Average Family Size in Bayport is 2.8 People.
What is the Average Household Size in Bayport
Average Household Size in Bayport is 2.3 People.
How Large is the Labor Force in Bayport?
There are 1,467 People in the Labor Forcein in Bayport.
What is the Percentage of People in the Labor Force in Bayport?
44.0% of People are in the Labor Force in Bayport.
What is the Unemployment Rate in Bayport?
Unemployment Rate in Bayport is 2.4%.