Lilydale, MN Map & Demographics
Lilydale Map
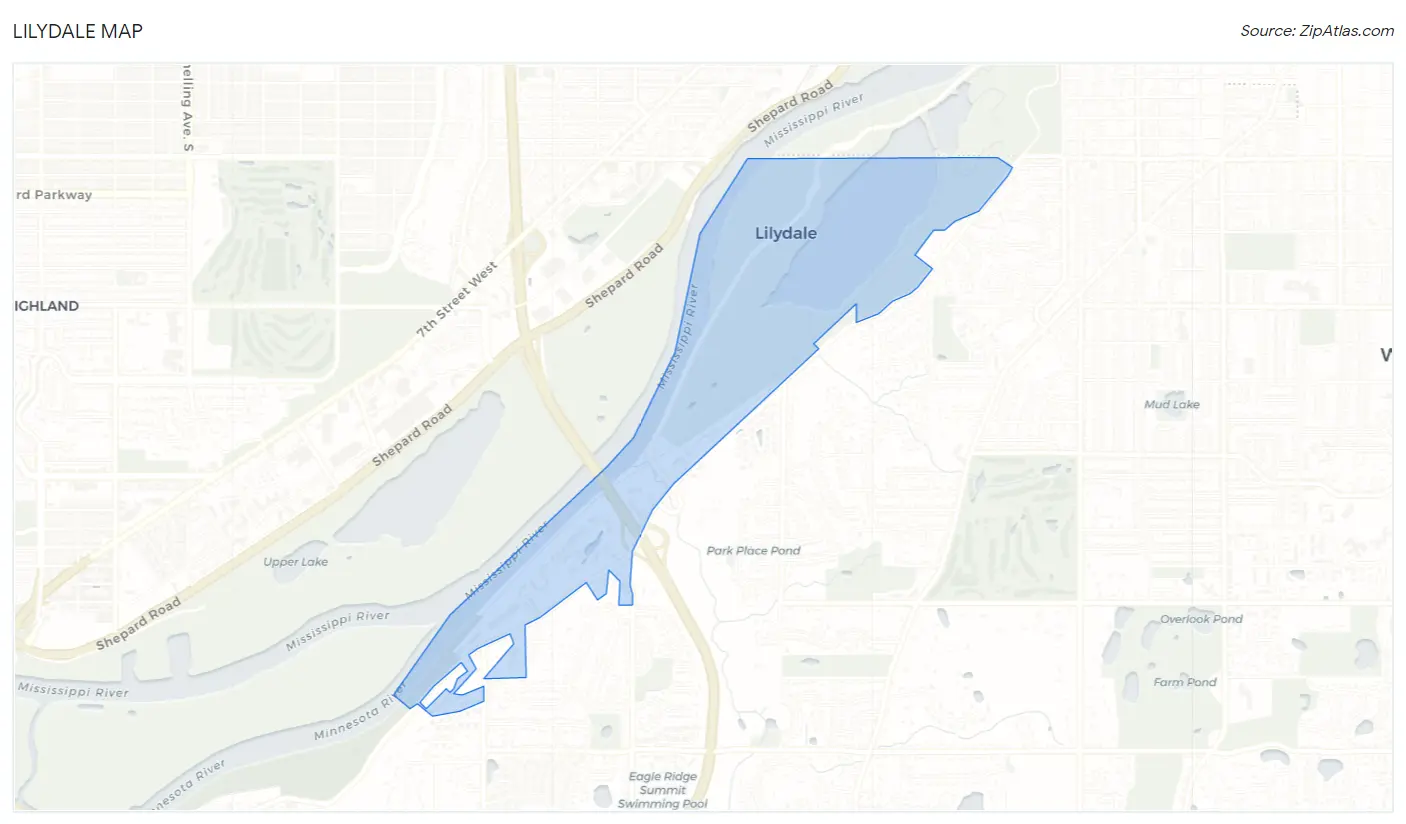
Lilydale Overview
$84,631
PER CAPITA INCOME
$113,125
AVG FAMILY INCOME
$86,875
AVG HOUSEHOLD INCOME
28.9%
WAGE / INCOME GAP [ % ]
71.1¢/ $1
WAGE / INCOME GAP [ $ ]
0.50
INEQUALITY / GINI INDEX
761
TOTAL POPULATION
288
MALE POPULATION
473
FEMALE POPULATION
60.89
MALES / 100 FEMALES
164.24
FEMALES / 100 MALES
74.4
MEDIAN AGE
2.2
AVG FAMILY SIZE
1.5
AVG HOUSEHOLD SIZE
209
LABOR FORCE [ PEOPLE ]
28.4%
PERCENT IN LABOR FORCE
5.7%
UNEMPLOYMENT RATE
Lilydale Area Codes
Income in Lilydale
Income Overview in Lilydale
Per Capita Income in Lilydale is $84,631, while median incomes of families and households are $113,125 and $86,875 respectively.
| Characteristic | Number | Measure |
| Per Capita Income | 761 | $84,631 |
| Median Family Income | 189 | $113,125 |
| Mean Family Income | 189 | $191,805 |
| Median Household Income | 514 | $86,875 |
| Mean Household Income | 514 | $124,707 |
| Income Deficit | 189 | $0 |
| Wage / Income Gap (%) | 761 | 28.92% |
| Wage / Income Gap ($) | 761 | 71.08¢ per $1 |
| Gini / Inequality Index | 761 | 0.50 |
Earnings by Sex in Lilydale
Average Earnings in Lilydale are $64,583, $81,250 for men and $57,750 for women, a difference of 28.9%.
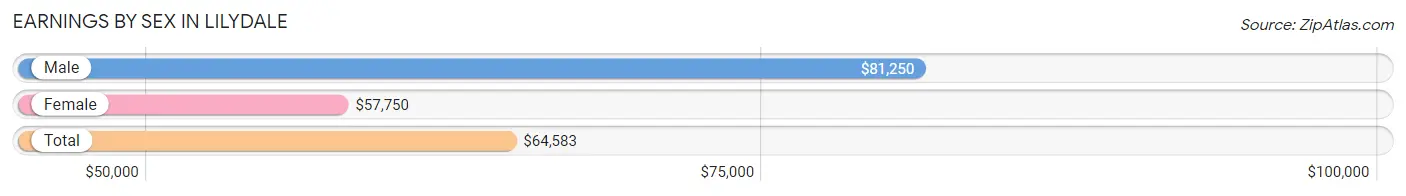
| Sex | Number | Average Earnings |
| Male | 114 (51.1%) | $81,250 |
| Female | 109 (48.9%) | $57,750 |
| Total | 223 (100.0%) | $64,583 |
Earnings by Sex by Income Bracket in Lilydale
The most common earnings brackets in Lilydale are $100,000+ for men (36 | 31.6%) and $100,000+ for women (27 | 24.8%).
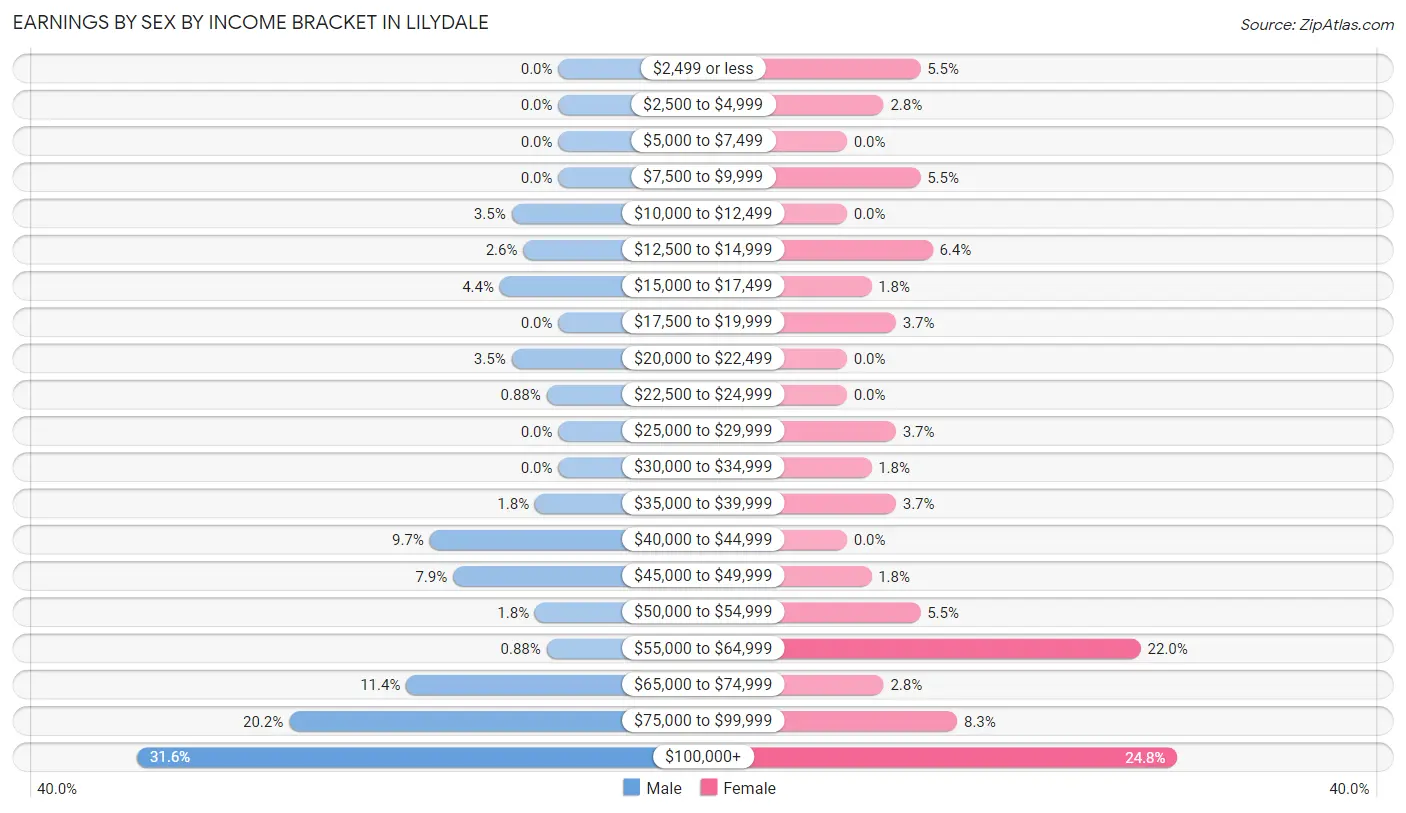
| Income | Male | Female |
| $2,499 or less | 0 (0.0%) | 6 (5.5%) |
| $2,500 to $4,999 | 0 (0.0%) | 3 (2.8%) |
| $5,000 to $7,499 | 0 (0.0%) | 0 (0.0%) |
| $7,500 to $9,999 | 0 (0.0%) | 6 (5.5%) |
| $10,000 to $12,499 | 4 (3.5%) | 0 (0.0%) |
| $12,500 to $14,999 | 3 (2.6%) | 7 (6.4%) |
| $15,000 to $17,499 | 5 (4.4%) | 2 (1.8%) |
| $17,500 to $19,999 | 0 (0.0%) | 4 (3.7%) |
| $20,000 to $22,499 | 4 (3.5%) | 0 (0.0%) |
| $22,500 to $24,999 | 1 (0.9%) | 0 (0.0%) |
| $25,000 to $29,999 | 0 (0.0%) | 4 (3.7%) |
| $30,000 to $34,999 | 0 (0.0%) | 2 (1.8%) |
| $35,000 to $39,999 | 2 (1.8%) | 4 (3.7%) |
| $40,000 to $44,999 | 11 (9.7%) | 0 (0.0%) |
| $45,000 to $49,999 | 9 (7.9%) | 2 (1.8%) |
| $50,000 to $54,999 | 2 (1.8%) | 6 (5.5%) |
| $55,000 to $64,999 | 1 (0.9%) | 24 (22.0%) |
| $65,000 to $74,999 | 13 (11.4%) | 3 (2.8%) |
| $75,000 to $99,999 | 23 (20.2%) | 9 (8.3%) |
| $100,000+ | 36 (31.6%) | 27 (24.8%) |
| Total | 114 (100.0%) | 109 (100.0%) |
Earnings by Sex by Educational Attainment in Lilydale
Average earnings in Lilydale are $83,750 for men and $58,250 for women, a difference of 30.4%. Men with an educational attainment of bachelor's degree enjoy the highest average annual earnings of $91,875, while those with high school diploma education earn the least with $43,750. Women with an educational attainment of graduate degree earn the most with the average annual earnings of $63,333, while those with college or associate's degree education have the smallest earnings of $38,438.
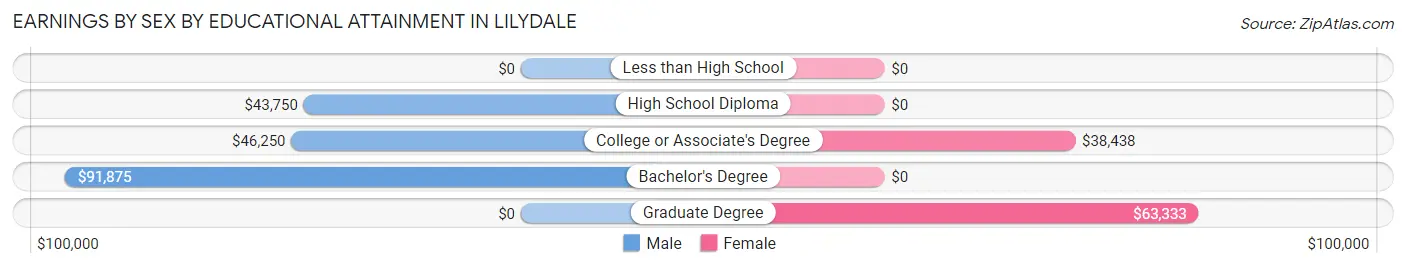
| Educational Attainment | Male Income | Female Income |
| Less than High School | - | - |
| High School Diploma | $43,750 | $0 |
| College or Associate's Degree | $46,250 | $38,438 |
| Bachelor's Degree | $91,875 | $0 |
| Graduate Degree | - | - |
| Total | $83,750 | $58,250 |
Family Income in Lilydale
Family Income Brackets in Lilydale
According to the Lilydale family income data, there are 43 families falling into the $200,000+ income range, which is the most common income bracket and makes up 22.8% of all families.
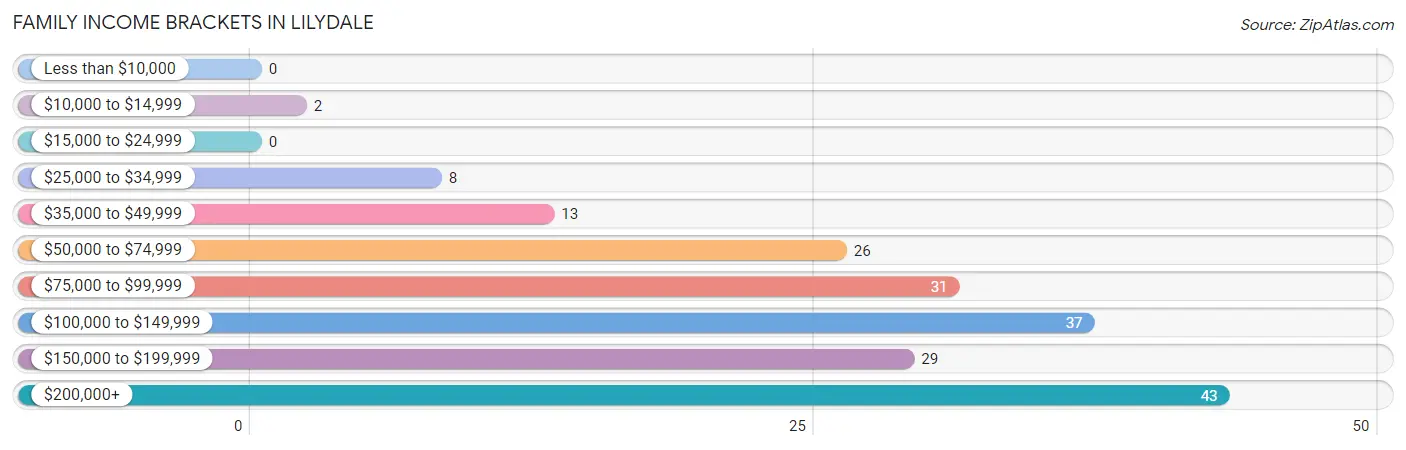
| Income Bracket | # Families | % Families |
| Less than $10,000 | 0 | 0.0% |
| $10,000 to $14,999 | 2 | 1.1% |
| $15,000 to $24,999 | 0 | 0.0% |
| $25,000 to $34,999 | 8 | 4.2% |
| $35,000 to $49,999 | 13 | 6.9% |
| $50,000 to $74,999 | 26 | 13.8% |
| $75,000 to $99,999 | 31 | 16.4% |
| $100,000 to $149,999 | 37 | 19.6% |
| $150,000 to $199,999 | 29 | 15.3% |
| $200,000+ | 43 | 22.8% |
Family Income by Famaliy Size in Lilydale
3-person families (18 | 9.5%) account for the highest median family income in Lilydale with $250,001 per family, while 3-person families (18 | 9.5%) have the highest median income of $83,334 per family member.
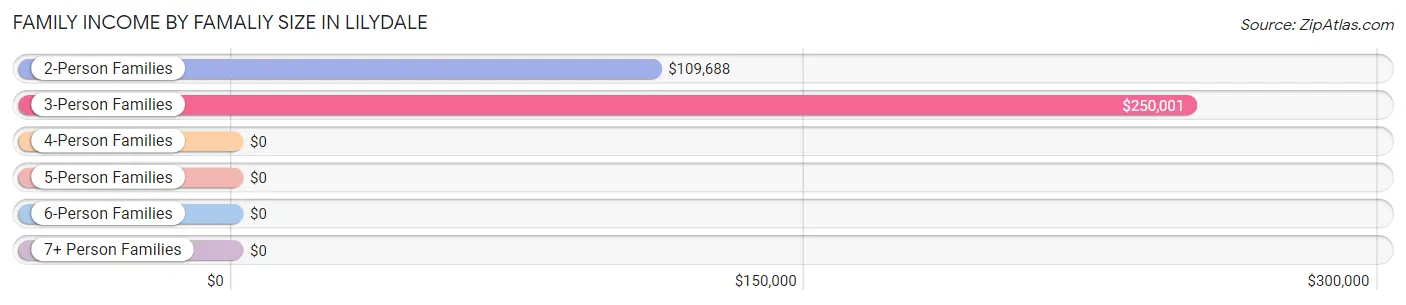
| Income Bracket | # Families | Median Income |
| 2-Person Families | 165 (87.3%) | $109,688 |
| 3-Person Families | 18 (9.5%) | $250,001 |
| 4-Person Families | 3 (1.6%) | $0 |
| 5-Person Families | 3 (1.6%) | $0 |
| 6-Person Families | 0 (0.0%) | $0 |
| 7+ Person Families | 0 (0.0%) | $0 |
| Total | 189 (100.0%) | $113,125 |
Family Income by Number of Earners in Lilydale
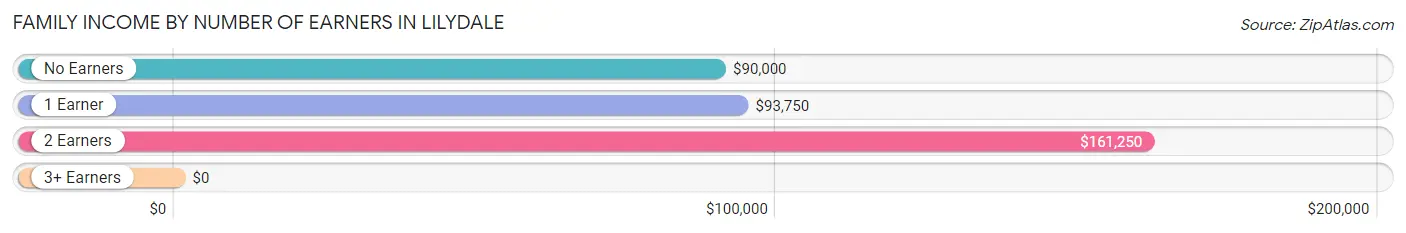
| Number of Earners | # Families | Median Income |
| No Earners | 98 (51.8%) | $90,000 |
| 1 Earner | 44 (23.3%) | $93,750 |
| 2 Earners | 47 (24.9%) | $161,250 |
| 3+ Earners | 0 (0.0%) | $0 |
| Total | 189 (100.0%) | $113,125 |
Household Income in Lilydale
Household Income Brackets in Lilydale
With 131 households falling in the category, the $100,000 to $149,999 income range is the most frequent in Lilydale, accounting for 25.5% of all households. In contrast, only 13 households (2.5%) fall into the $10,000 to $14,999 income bracket, making it the least populous group.
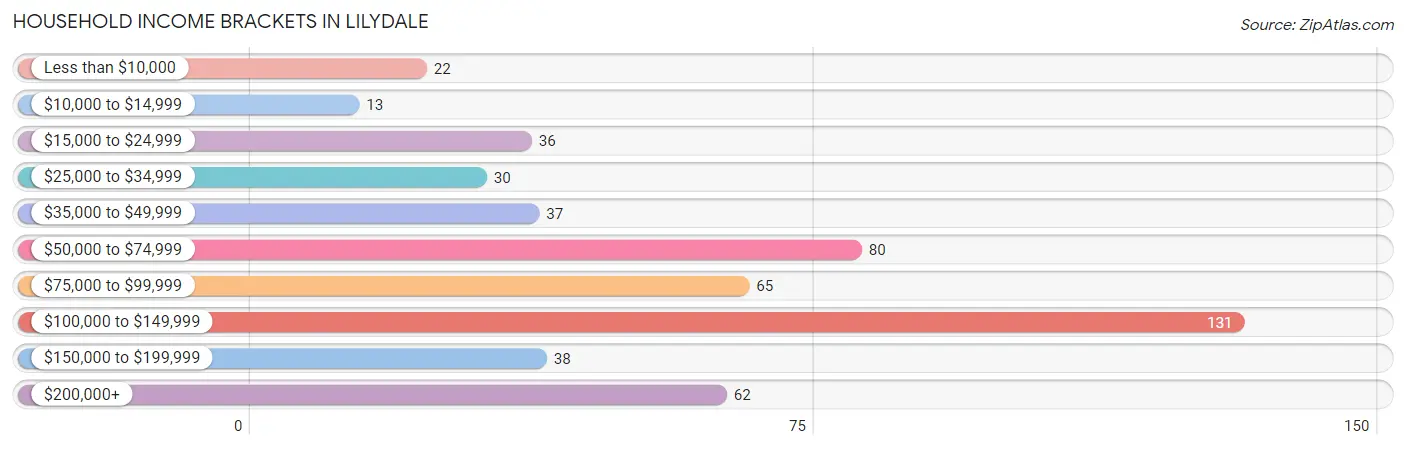
| Income Bracket | # Households | % Households |
| Less than $10,000 | 22 | 4.3% |
| $10,000 to $14,999 | 13 | 2.5% |
| $15,000 to $24,999 | 36 | 7.0% |
| $25,000 to $34,999 | 30 | 5.8% |
| $35,000 to $49,999 | 37 | 7.2% |
| $50,000 to $74,999 | 80 | 15.6% |
| $75,000 to $99,999 | 65 | 12.6% |
| $100,000 to $149,999 | 131 | 25.5% |
| $150,000 to $199,999 | 38 | 7.4% |
| $200,000+ | 62 | 12.1% |
Household Income by Householder Age in Lilydale
The median household income in Lilydale is $86,875, with the highest median household income of $115,000 found in the 45 to 64 years age bracket for the primary householder. A total of 80 households (15.6%) fall into this category. Meanwhile, the 15 to 24 years age bracket for the primary householder has the lowest median household income of $0, with 3 households (0.6%) in this group.
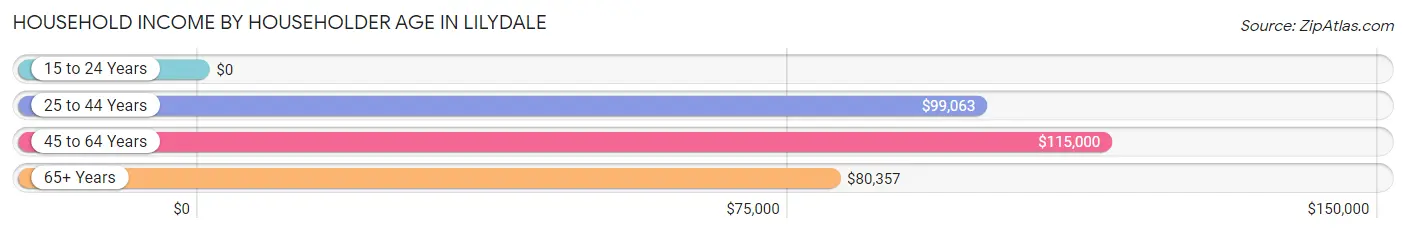
| Income Bracket | # Households | Median Income |
| 15 to 24 Years | 3 (0.6%) | $0 |
| 25 to 44 Years | 39 (7.6%) | $99,063 |
| 45 to 64 Years | 80 (15.6%) | $115,000 |
| 65+ Years | 392 (76.3%) | $80,357 |
| Total | 514 (100.0%) | $86,875 |
Poverty in Lilydale
Income Below Poverty by Sex and Age in Lilydale
With 4.2% poverty level for males and 3.8% for females among the residents of Lilydale, 35 to 44 year old males and 25 to 34 year old females are the most vulnerable to poverty, with 10 males (45.5%) and 1 females (14.3%) in their respective age groups living below the poverty level.
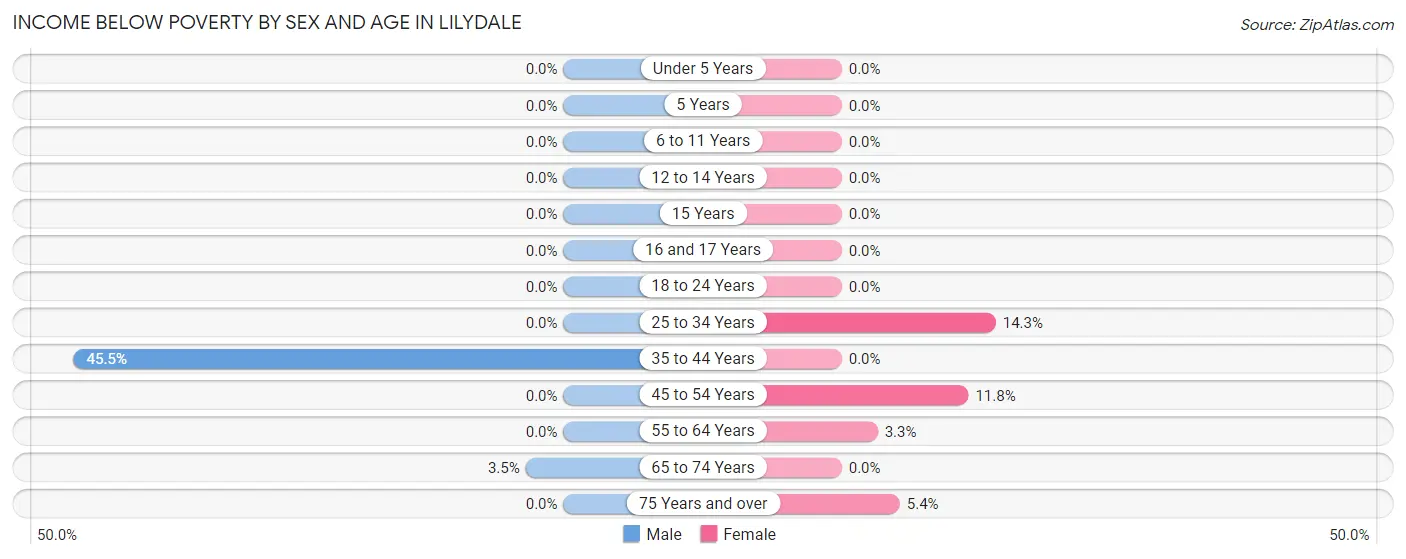
| Age Bracket | Male | Female |
| Under 5 Years | 0 (0.0%) | 0 (0.0%) |
| 5 Years | 0 (0.0%) | 0 (0.0%) |
| 6 to 11 Years | 0 (0.0%) | 0 (0.0%) |
| 12 to 14 Years | 0 (0.0%) | 0 (0.0%) |
| 15 Years | 0 (0.0%) | 0 (0.0%) |
| 16 and 17 Years | 0 (0.0%) | 0 (0.0%) |
| 18 to 24 Years | 0 (0.0%) | 0 (0.0%) |
| 25 to 34 Years | 0 (0.0%) | 1 (14.3%) |
| 35 to 44 Years | 10 (45.5%) | 0 (0.0%) |
| 45 to 54 Years | 0 (0.0%) | 2 (11.8%) |
| 55 to 64 Years | 0 (0.0%) | 2 (3.3%) |
| 65 to 74 Years | 2 (3.5%) | 0 (0.0%) |
| 75 Years and over | 0 (0.0%) | 13 (5.4%) |
| Total | 12 (4.2%) | 18 (3.8%) |
Income Above Poverty by Sex and Age in Lilydale
According to the poverty statistics in Lilydale, males aged under 5 years and females aged under 5 years are the age groups that are most secure financially, with 100.0% of males and 100.0% of females in these age groups living above the poverty line.
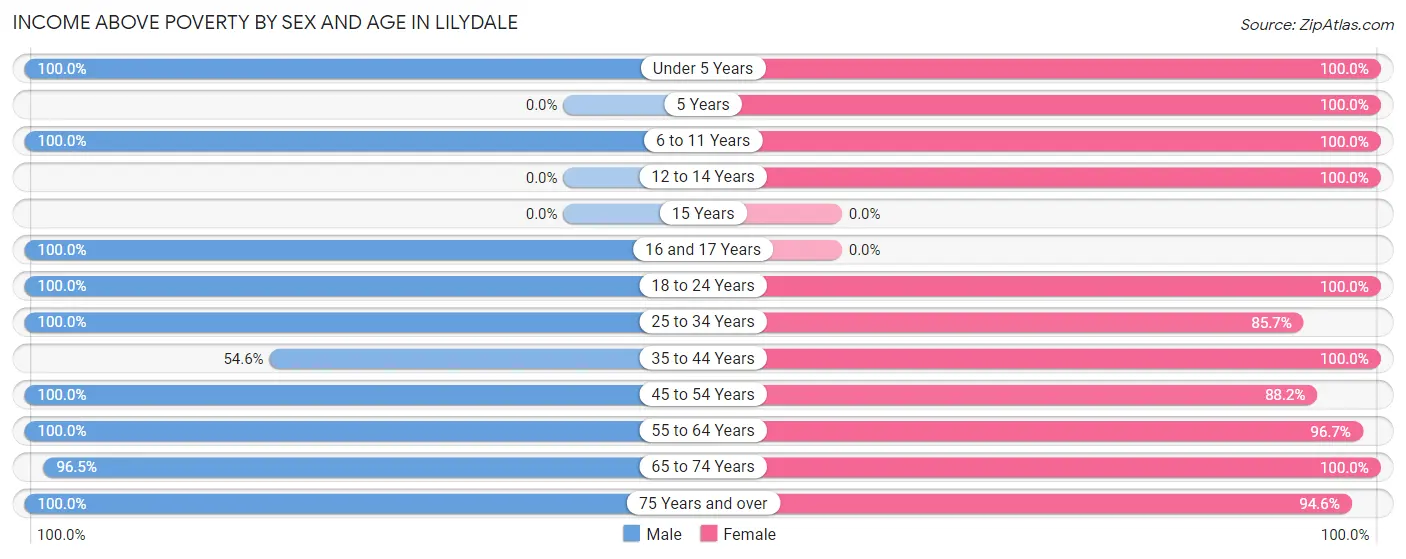
| Age Bracket | Male | Female |
| Under 5 Years | 5 (100.0%) | 3 (100.0%) |
| 5 Years | 0 (0.0%) | 3 (100.0%) |
| 6 to 11 Years | 1 (100.0%) | 10 (100.0%) |
| 12 to 14 Years | 0 (0.0%) | 4 (100.0%) |
| 15 Years | 0 (0.0%) | 0 (0.0%) |
| 16 and 17 Years | 3 (100.0%) | 0 (0.0%) |
| 18 to 24 Years | 7 (100.0%) | 2 (100.0%) |
| 25 to 34 Years | 16 (100.0%) | 6 (85.7%) |
| 35 to 44 Years | 12 (54.5%) | 16 (100.0%) |
| 45 to 54 Years | 6 (100.0%) | 15 (88.2%) |
| 55 to 64 Years | 43 (100.0%) | 58 (96.7%) |
| 65 to 74 Years | 55 (96.5%) | 110 (100.0%) |
| 75 Years and over | 128 (100.0%) | 228 (94.6%) |
| Total | 276 (95.8%) | 455 (96.2%) |
Income Below Poverty Among Married-Couple Families in Lilydale
The poverty statistics for married-couple families in Lilydale show that 1.2% or 2 of the total 172 families live below the poverty line. Families with no children have the highest poverty rate of 1.2%, comprising of 2 families. On the other hand, families with 1 or 2 children have the lowest poverty rate of 0.0%, which includes 0 families.
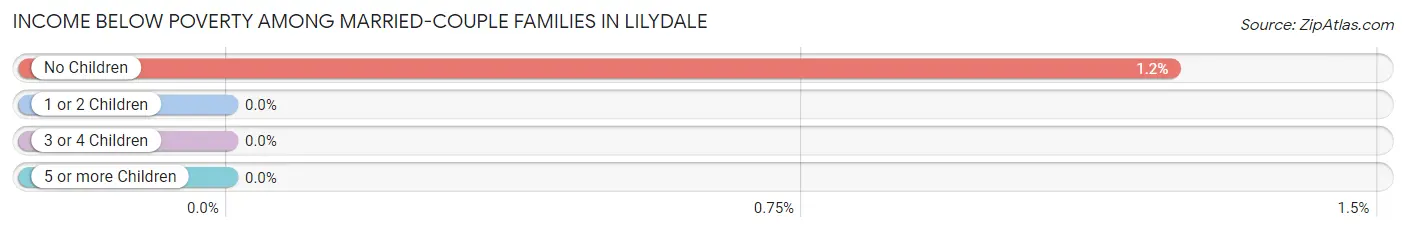
| Children | Above Poverty | Below Poverty |
| No Children | 160 (98.8%) | 2 (1.2%) |
| 1 or 2 Children | 7 (100.0%) | 0 (0.0%) |
| 3 or 4 Children | 3 (100.0%) | 0 (0.0%) |
| 5 or more Children | 0 (0.0%) | 0 (0.0%) |
| Total | 170 (98.8%) | 2 (1.2%) |
Income Below Poverty Among Single-Parent Households in Lilydale
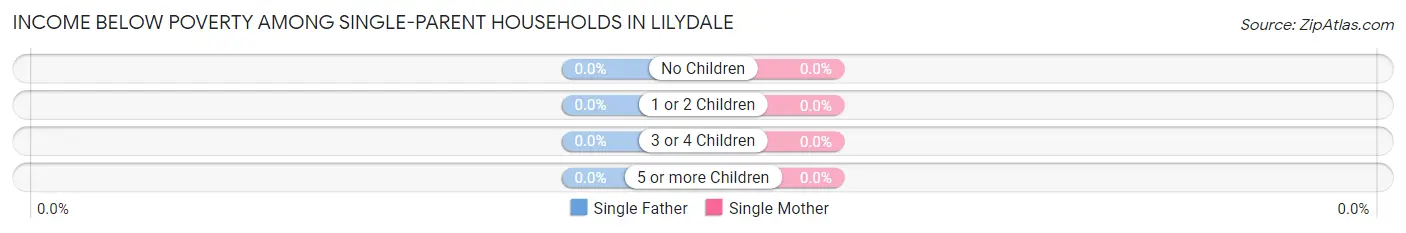
| Children | Single Father | Single Mother |
| No Children | 0 (0.0%) | 0 (0.0%) |
| 1 or 2 Children | 0 (0.0%) | 0 (0.0%) |
| 3 or 4 Children | 0 (0.0%) | 0 (0.0%) |
| 5 or more Children | 0 (0.0%) | 0 (0.0%) |
| Total | 0 (0.0%) | 0 (0.0%) |
Income Below Poverty Among Married-Couple vs Single-Parent Households in Lilydale
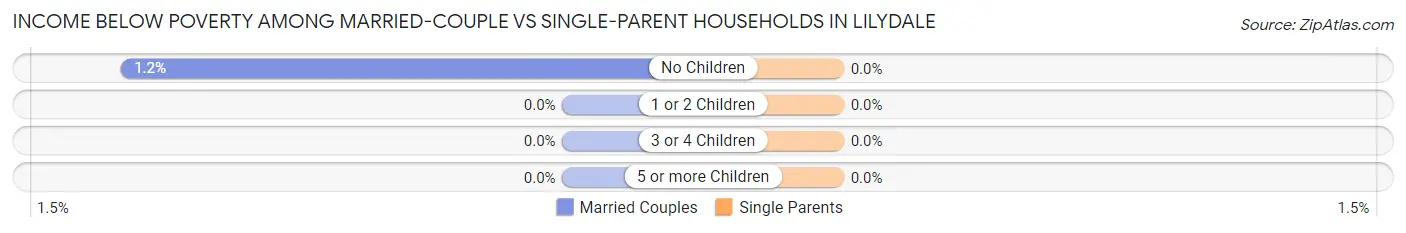
| Children | Married-Couple Families | Single-Parent Households |
| No Children | 2 (1.2%) | 0 (0.0%) |
| 1 or 2 Children | 0 (0.0%) | 0 (0.0%) |
| 3 or 4 Children | 0 (0.0%) | 0 (0.0%) |
| 5 or more Children | 0 (0.0%) | 0 (0.0%) |
| Total | 2 (1.2%) | 0 (0.0%) |
Race in Lilydale
The most populous races in Lilydale are White / Caucasian (653 | 85.8%), Two or more Races (77 | 10.1%), and Asian (16 | 2.1%).
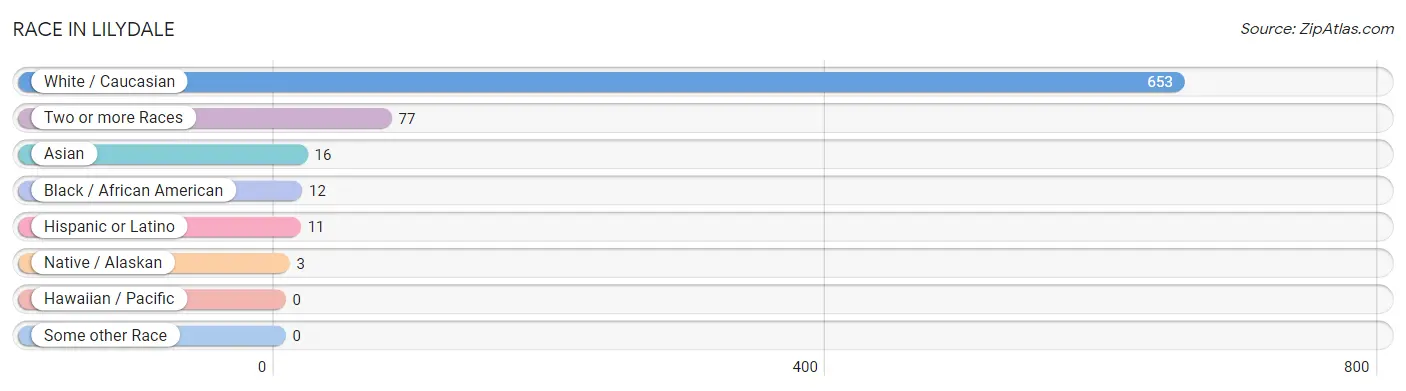
| Race | # Population | % Population |
| Asian | 16 | 2.1% |
| Black / African American | 12 | 1.6% |
| Hawaiian / Pacific | 0 | 0.0% |
| Hispanic or Latino | 11 | 1.5% |
| Native / Alaskan | 3 | 0.4% |
| White / Caucasian | 653 | 85.8% |
| Two or more Races | 77 | 10.1% |
| Some other Race | 0 | 0.0% |
| Total | 761 | 100.0% |
Ancestry in Lilydale
The most populous ancestries reported in Lilydale are German (223 | 29.3%), Irish (149 | 19.6%), English (106 | 13.9%), Norwegian (43 | 5.7%), and French (37 | 4.9%), together accounting for 73.3% of all Lilydale residents.
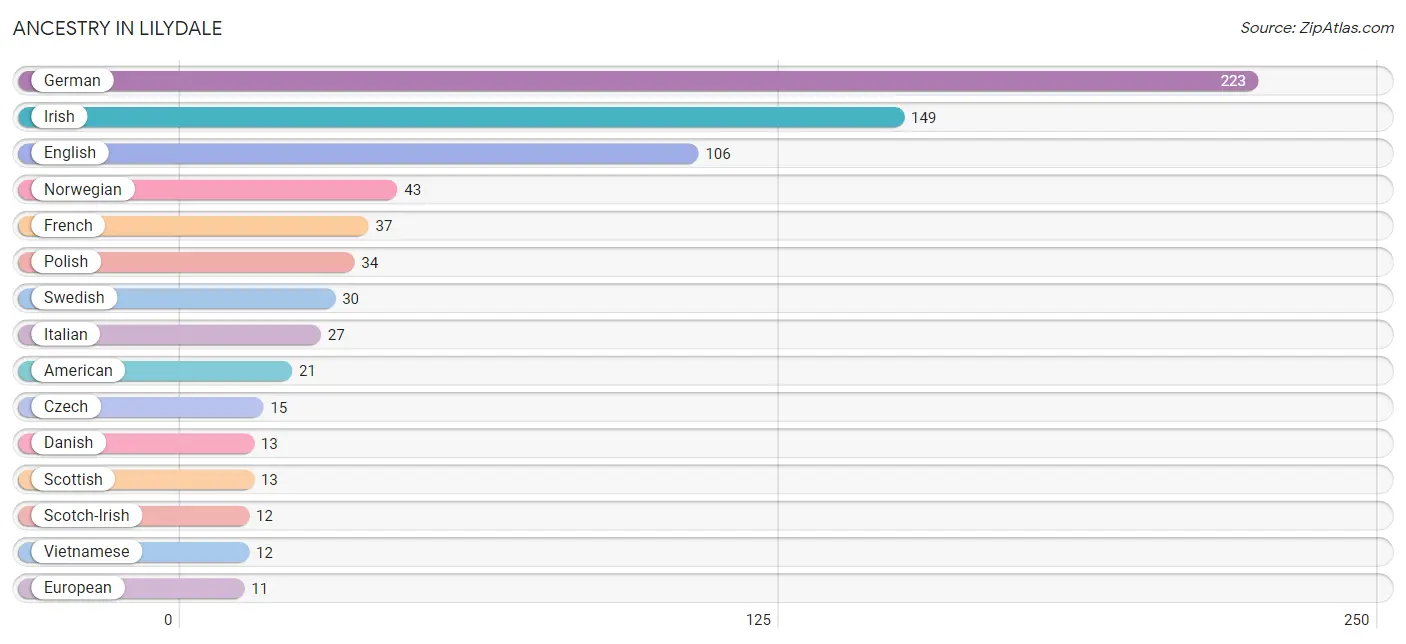
| Ancestry | # Population | % Population |
| Alsatian | 2 | 0.3% |
| American | 21 | 2.8% |
| Arab | 2 | 0.3% |
| Austrian | 5 | 0.7% |
| Bangladeshi | 3 | 0.4% |
| British | 5 | 0.7% |
| Canadian | 2 | 0.3% |
| Cuban | 3 | 0.4% |
| Czech | 15 | 2.0% |
| Czechoslovakian | 4 | 0.5% |
| Danish | 13 | 1.7% |
| Dutch | 4 | 0.5% |
| Eastern European | 10 | 1.3% |
| English | 106 | 13.9% |
| European | 11 | 1.5% |
| Finnish | 5 | 0.7% |
| French | 37 | 4.9% |
| French Canadian | 3 | 0.4% |
| German | 223 | 29.3% |
| Greek | 2 | 0.3% |
| Hungarian | 3 | 0.4% |
| Icelander | 4 | 0.5% |
| Indian (Asian) | 7 | 0.9% |
| Irish | 149 | 19.6% |
| Italian | 27 | 3.5% |
| Lebanese | 2 | 0.3% |
| Lithuanian | 2 | 0.3% |
| Mexican | 4 | 0.5% |
| Norwegian | 43 | 5.7% |
| Pennsylvania German | 2 | 0.3% |
| Pima | 3 | 0.4% |
| Polish | 34 | 4.5% |
| Puerto Rican | 4 | 0.5% |
| Romanian | 2 | 0.3% |
| Russian | 5 | 0.7% |
| Scandinavian | 10 | 1.3% |
| Scotch-Irish | 12 | 1.6% |
| Scottish | 13 | 1.7% |
| Serbian | 1 | 0.1% |
| Somali | 10 | 1.3% |
| Sri Lankan | 5 | 0.7% |
| Subsaharan African | 10 | 1.3% |
| Swedish | 30 | 3.9% |
| Swiss | 3 | 0.4% |
| Turkish | 3 | 0.4% |
| Ukrainian | 6 | 0.8% |
| Vietnamese | 12 | 1.6% |
| Welsh | 1 | 0.1% | View All 48 Rows |
Immigrants in Lilydale
The most numerous immigrant groups reported in Lilydale came from Asia (27 | 3.5%), Bangladesh (12 | 1.6%), South Central Asia (12 | 1.6%), Africa (10 | 1.3%), and Eastern Africa (10 | 1.3%), together accounting for 9.3% of all Lilydale residents.
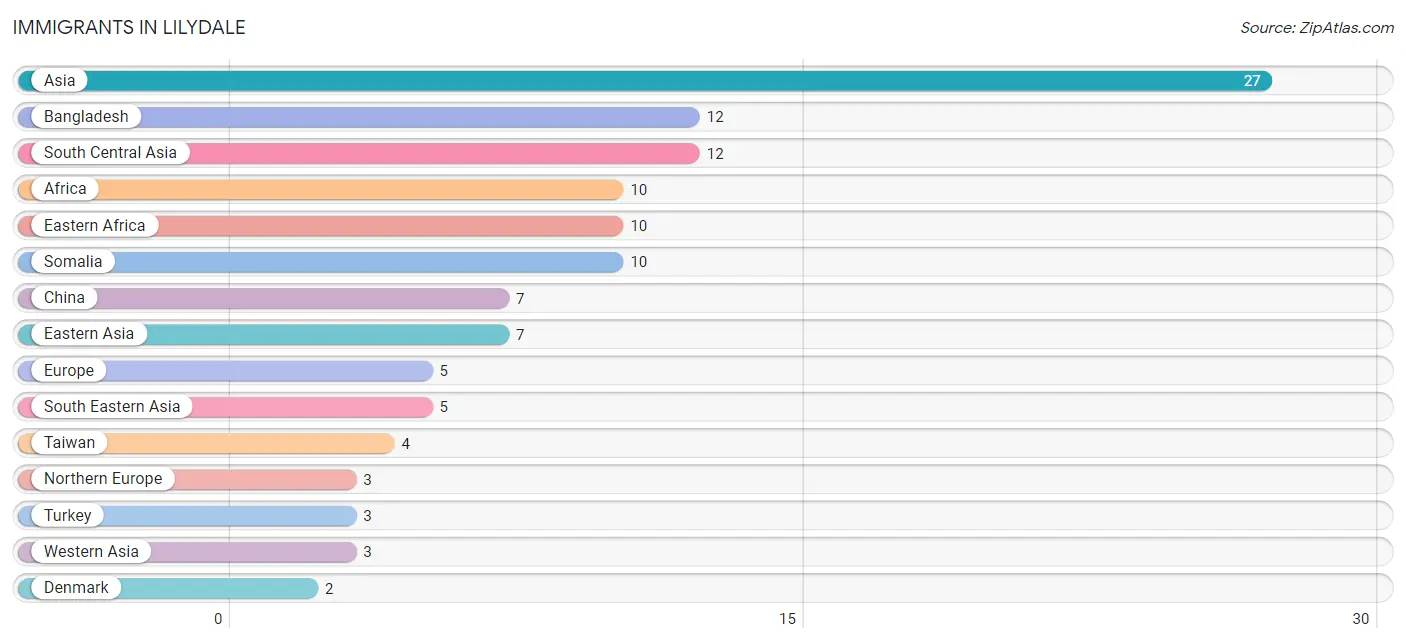
| Immigration Origin | # Population | % Population |
| Africa | 10 | 1.3% |
| Asia | 27 | 3.5% |
| Bangladesh | 12 | 1.6% |
| Canada | 1 | 0.1% |
| China | 7 | 0.9% |
| Denmark | 2 | 0.3% |
| Eastern Africa | 10 | 1.3% |
| Eastern Asia | 7 | 0.9% |
| Europe | 5 | 0.7% |
| France | 2 | 0.3% |
| Northern Europe | 3 | 0.4% |
| Somalia | 10 | 1.3% |
| South Central Asia | 12 | 1.6% |
| South Eastern Asia | 5 | 0.7% |
| Taiwan | 4 | 0.5% |
| Turkey | 3 | 0.4% |
| Vietnam | 2 | 0.3% |
| Western Asia | 3 | 0.4% |
| Western Europe | 2 | 0.3% | View All 19 Rows |
Sex and Age in Lilydale
Sex and Age in Lilydale
The most populous age groups in Lilydale are 85 Years and over (45 | 15.6%) for men and 75 to 79 Years (99 | 20.9%) for women.
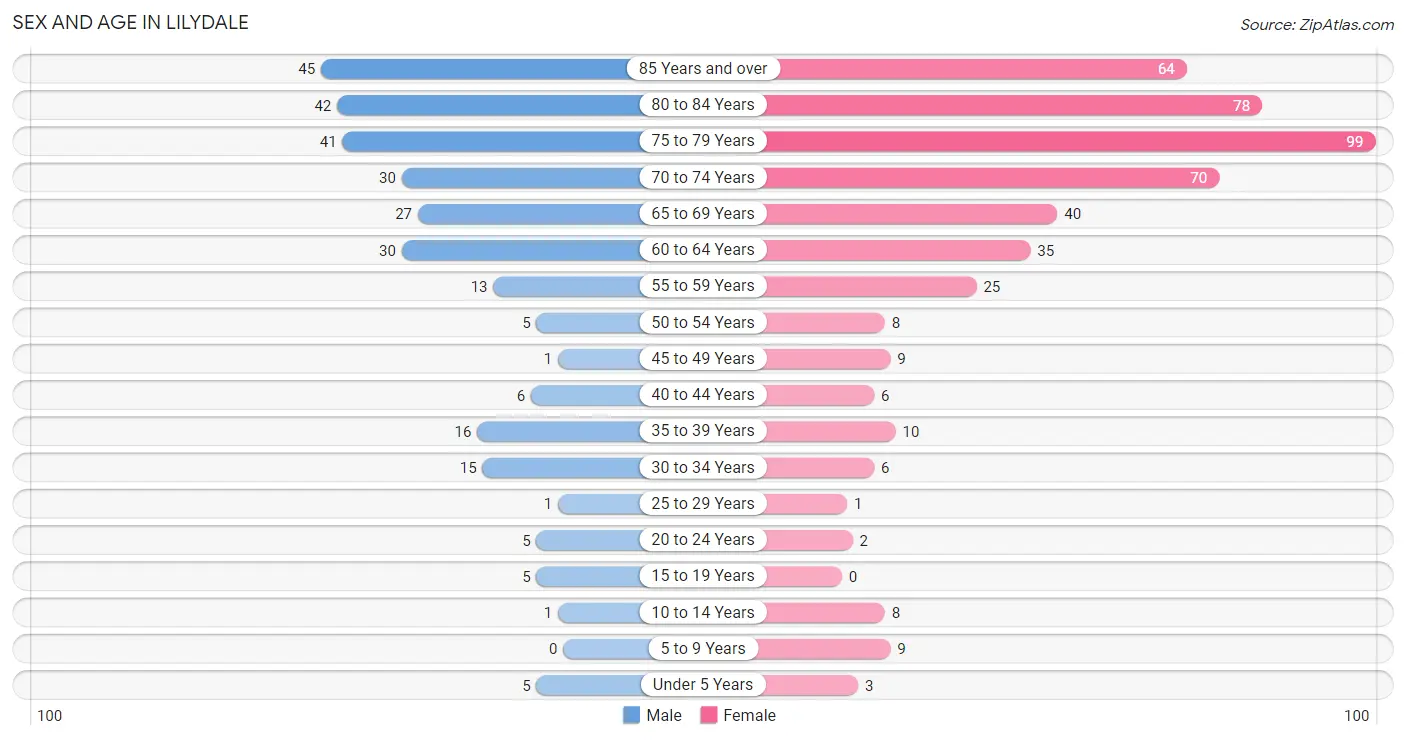
| Age Bracket | Male | Female |
| Under 5 Years | 5 (1.7%) | 3 (0.6%) |
| 5 to 9 Years | 0 (0.0%) | 9 (1.9%) |
| 10 to 14 Years | 1 (0.4%) | 8 (1.7%) |
| 15 to 19 Years | 5 (1.7%) | 0 (0.0%) |
| 20 to 24 Years | 5 (1.7%) | 2 (0.4%) |
| 25 to 29 Years | 1 (0.4%) | 1 (0.2%) |
| 30 to 34 Years | 15 (5.2%) | 6 (1.3%) |
| 35 to 39 Years | 16 (5.6%) | 10 (2.1%) |
| 40 to 44 Years | 6 (2.1%) | 6 (1.3%) |
| 45 to 49 Years | 1 (0.4%) | 9 (1.9%) |
| 50 to 54 Years | 5 (1.7%) | 8 (1.7%) |
| 55 to 59 Years | 13 (4.5%) | 25 (5.3%) |
| 60 to 64 Years | 30 (10.4%) | 35 (7.4%) |
| 65 to 69 Years | 27 (9.4%) | 40 (8.5%) |
| 70 to 74 Years | 30 (10.4%) | 70 (14.8%) |
| 75 to 79 Years | 41 (14.2%) | 99 (20.9%) |
| 80 to 84 Years | 42 (14.6%) | 78 (16.5%) |
| 85 Years and over | 45 (15.6%) | 64 (13.5%) |
| Total | 288 (100.0%) | 473 (100.0%) |
Families and Households in Lilydale
Median Family Size in Lilydale
The median family size in Lilydale is 2.23 persons per family, with single male/father families (4 | 2.1%) accounting for the largest median family size of 2.5 persons per family. On the other hand, single female/mother families (13 | 6.9%) represent the smallest median family size with 1.92 persons per family.
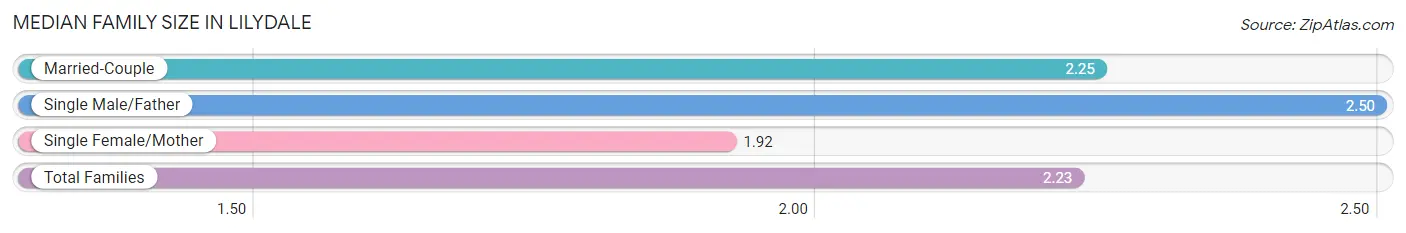
| Family Type | # Families | Family Size |
| Married-Couple | 172 (91.0%) | 2.25 |
| Single Male/Father | 4 (2.1%) | 2.50 |
| Single Female/Mother | 13 (6.9%) | 1.92 |
| Total Families | 189 (100.0%) | 2.23 |
Median Household Size in Lilydale
The median household size in Lilydale is 1.48 persons per household, with single male/father households (4 | 0.8%) accounting for the largest median household size of 3 persons per household. non-family households (325 | 63.2%) represent the smallest median household size with 1.04 persons per household.
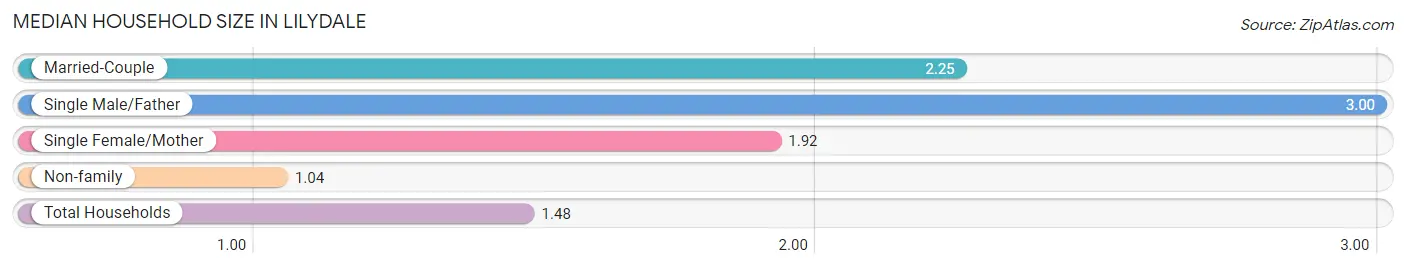
| Household Type | # Households | Household Size |
| Married-Couple | 172 (33.5%) | 2.25 |
| Single Male/Father | 4 (0.8%) | 3.00 |
| Single Female/Mother | 13 (2.5%) | 1.92 |
| Non-family | 325 (63.2%) | 1.04 |
| Total Households | 514 (100.0%) | 1.48 |
Household Size by Marriage Status in Lilydale
Out of a total of 514 households in Lilydale, 189 (36.8%) are family households, while 325 (63.2%) are nonfamily households. The most numerous type of family households are 2-person households, comprising 162, and the most common type of nonfamily households are 1-person households, comprising 316.
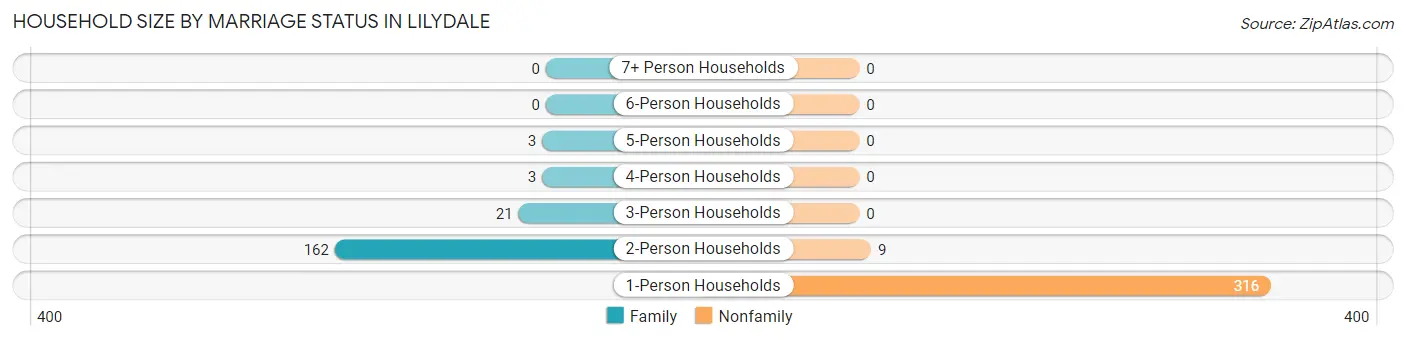
| Household Size | Family Households | Nonfamily Households |
| 1-Person Households | - | 316 (61.5%) |
| 2-Person Households | 162 (31.5%) | 9 (1.8%) |
| 3-Person Households | 21 (4.1%) | 0 (0.0%) |
| 4-Person Households | 3 (0.6%) | 0 (0.0%) |
| 5-Person Households | 3 (0.6%) | 0 (0.0%) |
| 6-Person Households | 0 (0.0%) | 0 (0.0%) |
| 7+ Person Households | 0 (0.0%) | 0 (0.0%) |
| Total | 189 (36.8%) | 325 (63.2%) |
Female Fertility in Lilydale
Fertility by Age in Lilydale
Average fertility rate in Lilydale is 59.0 births per 1,000 women. Women in the age bracket of 20 to 34 years have the highest fertility rate with 222.0 births per 1,000 women. Women in the age bracket of 20 to 34 years acount for 100.0% of all women with births.
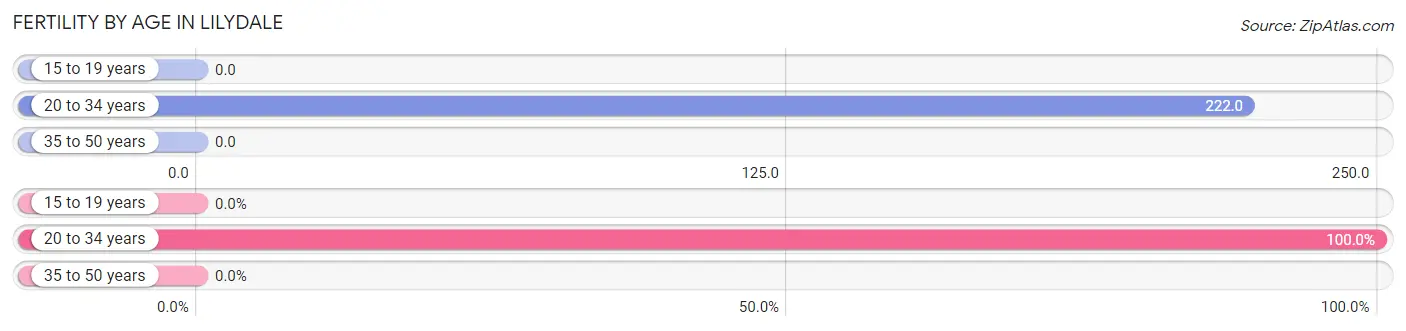
| Age Bracket | Women with Births | Births / 1,000 Women |
| 15 to 19 years | 0 (0.0%) | 0.0 |
| 20 to 34 years | 2 (100.0%) | 222.0 |
| 35 to 50 years | 0 (0.0%) | 0.0 |
| Total | 2 (100.0%) | 59.0 |
Fertility by Age by Marriage Status in Lilydale
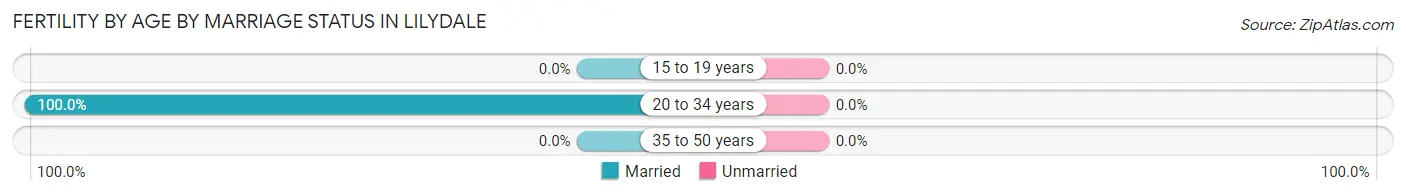
| Age Bracket | Married | Unmarried |
| 15 to 19 years | 0 (0.0%) | 0 (0.0%) |
| 20 to 34 years | 2 (100.0%) | 0 (0.0%) |
| 35 to 50 years | 0 (0.0%) | 0 (0.0%) |
| Total | 2 (100.0%) | 0 (0.0%) |
Fertility by Education in Lilydale
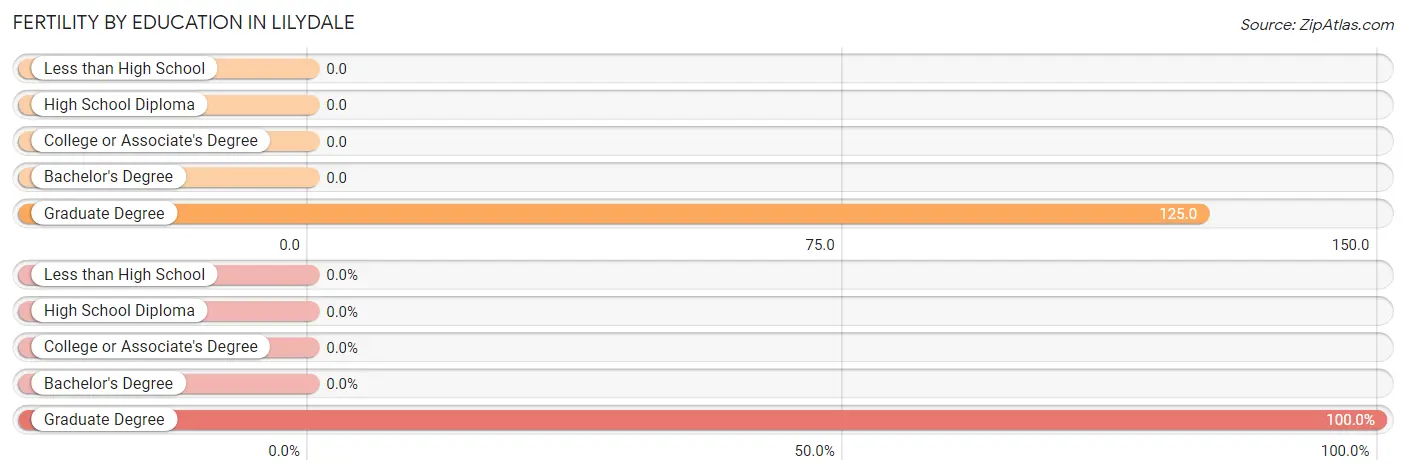
| Educational Attainment | Women with Births | Births / 1,000 Women |
| Less than High School | 0 (0.0%) | 0.0 |
| High School Diploma | 0 (0.0%) | 0.0 |
| College or Associate's Degree | 0 (0.0%) | 0.0 |
| Bachelor's Degree | 0 (0.0%) | 0.0 |
| Graduate Degree | 2 (100.0%) | 125.0 |
| Total | 2 (100.0%) | 59.0 |
Fertility by Education by Marriage Status in Lilydale
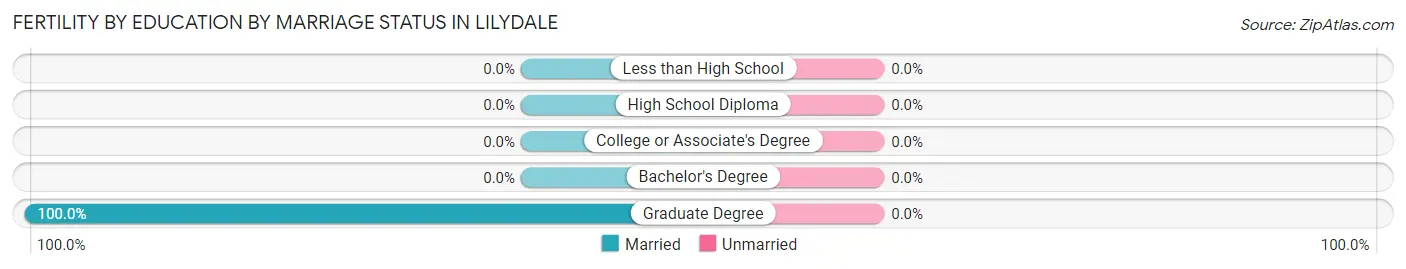
| Educational Attainment | Married | Unmarried |
| Less than High School | 0 (0.0%) | 0 (0.0%) |
| High School Diploma | 0 (0.0%) | 0 (0.0%) |
| College or Associate's Degree | 0 (0.0%) | 0 (0.0%) |
| Bachelor's Degree | 0 (0.0%) | 0 (0.0%) |
| Graduate Degree | 2 (100.0%) | 0 (0.0%) |
| Total | 2 (100.0%) | 0 (0.0%) |
Employment Characteristics in Lilydale
Employment by Class of Employer in Lilydale
Among the 193 employed individuals in Lilydale, private company employees (88 | 45.6%), not-for-profit organizations (42 | 21.8%), and self-employed (incorporated) (23 | 11.9%) make up the most common classes of employment.
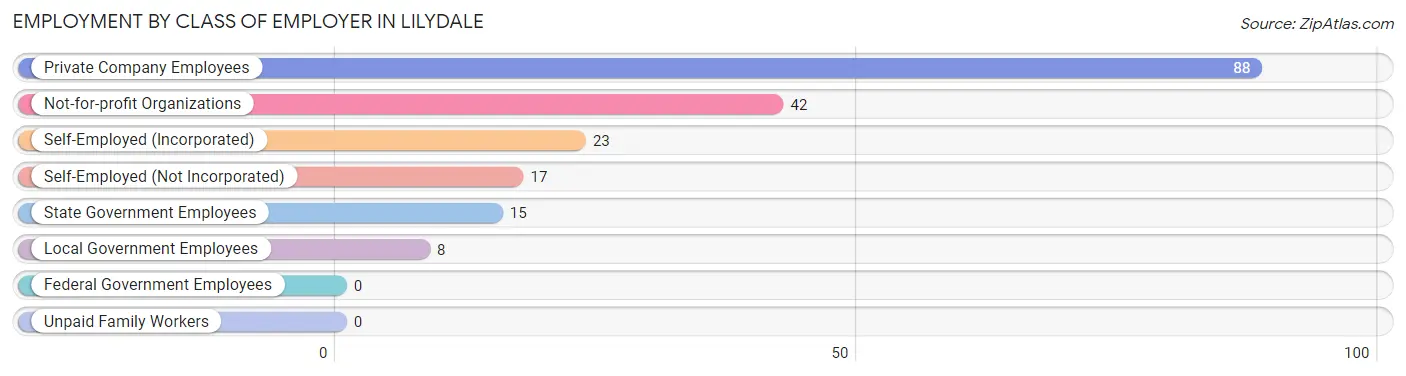
| Employer Class | # Employees | % Employees |
| Private Company Employees | 88 | 45.6% |
| Self-Employed (Incorporated) | 23 | 11.9% |
| Self-Employed (Not Incorporated) | 17 | 8.8% |
| Not-for-profit Organizations | 42 | 21.8% |
| Local Government Employees | 8 | 4.2% |
| State Government Employees | 15 | 7.8% |
| Federal Government Employees | 0 | 0.0% |
| Unpaid Family Workers | 0 | 0.0% |
| Total | 193 | 100.0% |
Employment Status by Age in Lilydale
According to the labor force statistics for Lilydale, out of the total population over 16 years of age (735), 28.4% or 209 individuals are in the labor force, with 5.7% or 12 of them unemployed. The age group with the highest labor force participation rate is 20 to 24 years, with 100.0% or 7 individuals in the labor force. Within the labor force, the 45 to 54 years age range has the highest percentage of unemployed individuals, with 22.2% or 4 of them being unemployed.
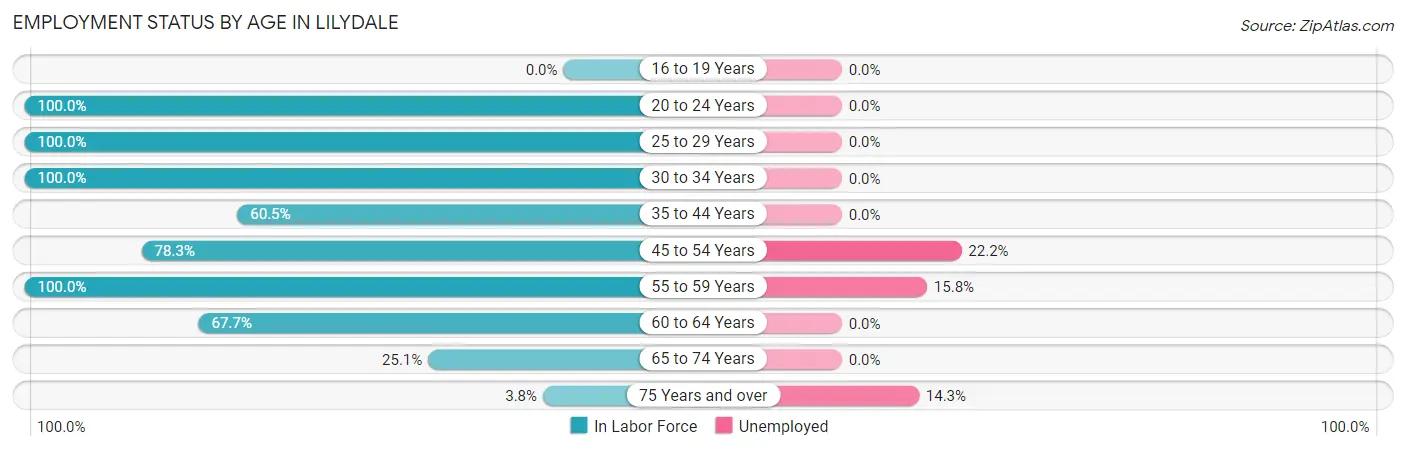
| Age Bracket | In Labor Force | Unemployed |
| 16 to 19 Years | 0 (0.0%) | 0 (0.0%) |
| 20 to 24 Years | 7 (100.0%) | 0 (0.0%) |
| 25 to 29 Years | 2 (100.0%) | 0 (0.0%) |
| 30 to 34 Years | 21 (100.0%) | 0 (0.0%) |
| 35 to 44 Years | 23 (60.5%) | 0 (0.0%) |
| 45 to 54 Years | 18 (78.3%) | 4 (22.2%) |
| 55 to 59 Years | 38 (100.0%) | 6 (15.8%) |
| 60 to 64 Years | 44 (67.7%) | 0 (0.0%) |
| 65 to 74 Years | 42 (25.1%) | 0 (0.0%) |
| 75 Years and over | 14 (3.8%) | 2 (14.3%) |
| Total | 209 (28.4%) | 12 (5.7%) |
Employment Status by Educational Attainment in Lilydale
According to labor force statistics for Lilydale, 78.1% of individuals (146) out of the total population between 25 and 64 years of age (187) are in the labor force, with 6.8% or 10 of them being unemployed. The group with the highest labor force participation rate are those with the educational attainment of less than high school, with 100.0% or 7 individuals in the labor force. Within the labor force, individuals with bachelor's degree or higher education have the highest percentage of unemployment, with 9.2% or 10 of them being unemployed.
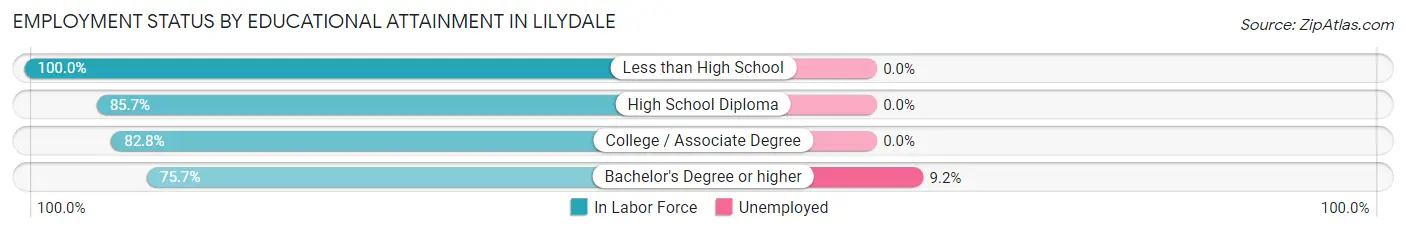
| Educational Attainment | In Labor Force | Unemployed |
| Less than High School | 7 (100.0%) | 0 (0.0%) |
| High School Diploma | 6 (85.7%) | 0 (0.0%) |
| College / Associate Degree | 24 (82.8%) | 0 (0.0%) |
| Bachelor's Degree or higher | 109 (75.7%) | 13 (9.2%) |
| Total | 146 (78.1%) | 13 (6.8%) |
Employment Occupations by Sex in Lilydale
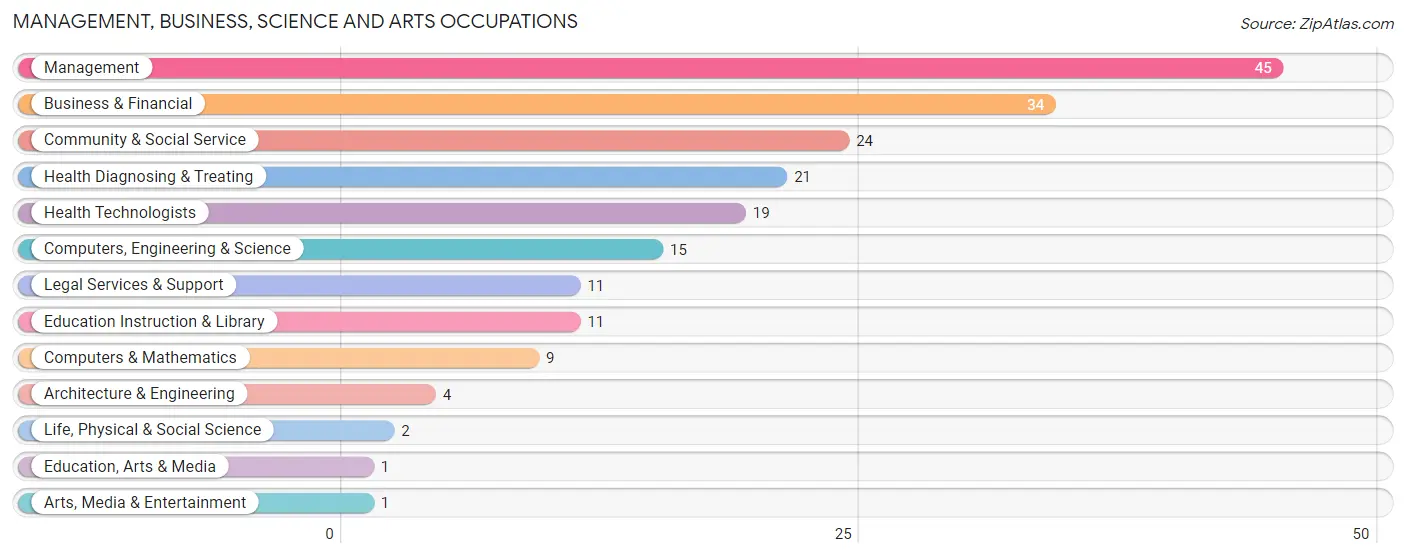
Management, Business, Science and Arts Occupations
The most common Management, Business, Science and Arts occupations in Lilydale are Management (45 | 22.8%), Business & Financial (34 | 17.3%), Community & Social Service (24 | 12.2%), Health Diagnosing & Treating (21 | 10.7%), and Health Technologists (19 | 9.6%).
Management, Business, Science and Arts Occupations by Sex
Within the Management, Business, Science and Arts occupations in Lilydale, the most male-oriented occupations are Architecture & Engineering (100.0%), Education, Arts & Media (100.0%), and Legal Services & Support (100.0%), while the most female-oriented occupations are Life, Physical & Social Science (100.0%), Education Instruction & Library (81.8%), and Business & Financial (52.9%).
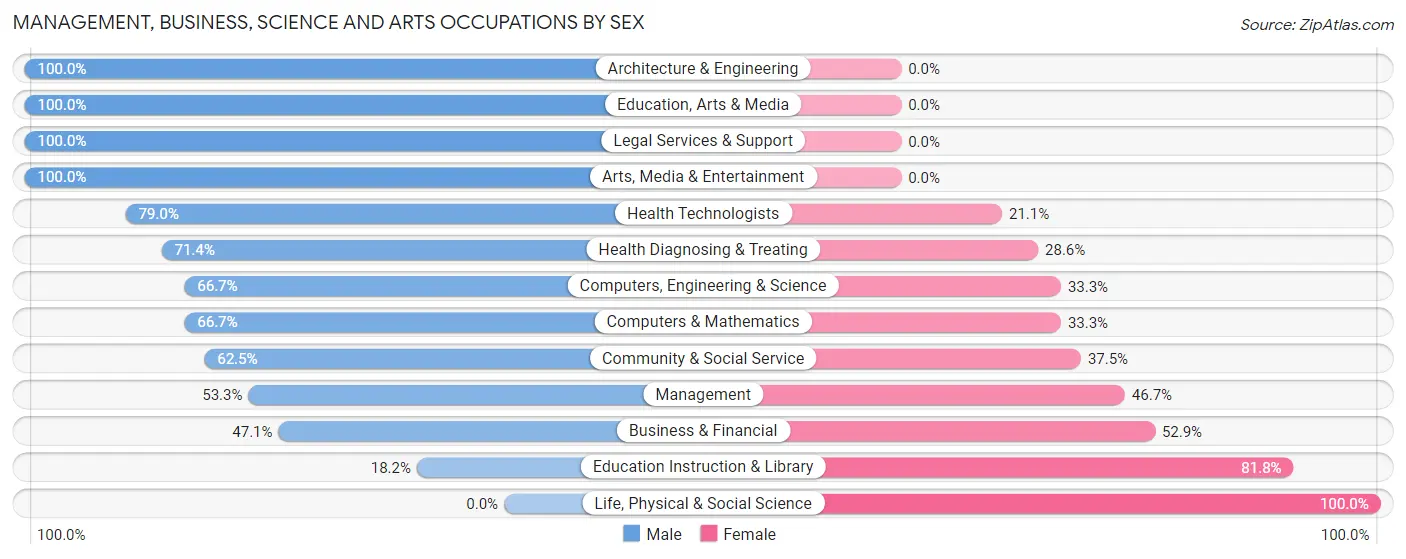
| Occupation | Male | Female |
| Management | 24 (53.3%) | 21 (46.7%) |
| Business & Financial | 16 (47.1%) | 18 (52.9%) |
| Computers, Engineering & Science | 10 (66.7%) | 5 (33.3%) |
| Computers & Mathematics | 6 (66.7%) | 3 (33.3%) |
| Architecture & Engineering | 4 (100.0%) | 0 (0.0%) |
| Life, Physical & Social Science | 0 (0.0%) | 2 (100.0%) |
| Community & Social Service | 15 (62.5%) | 9 (37.5%) |
| Education, Arts & Media | 1 (100.0%) | 0 (0.0%) |
| Legal Services & Support | 11 (100.0%) | 0 (0.0%) |
| Education Instruction & Library | 2 (18.2%) | 9 (81.8%) |
| Arts, Media & Entertainment | 1 (100.0%) | 0 (0.0%) |
| Health Diagnosing & Treating | 15 (71.4%) | 6 (28.6%) |
| Health Technologists | 15 (78.9%) | 4 (21.0%) |
| Total (Category) | 80 (57.6%) | 59 (42.4%) |
| Total (Overall) | 105 (53.3%) | 92 (46.7%) |
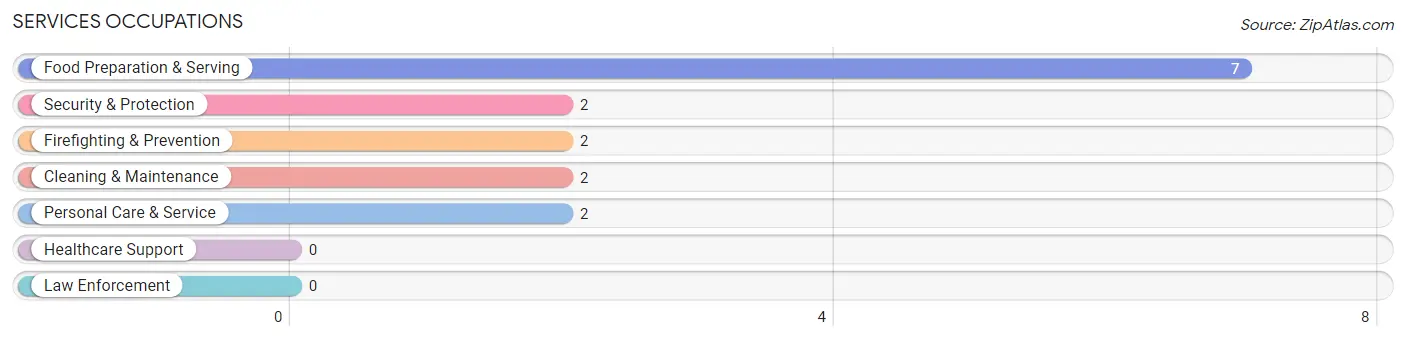
Services Occupations
The most common Services occupations in Lilydale are Food Preparation & Serving (7 | 3.5%), Security & Protection (2 | 1.0%), Firefighting & Prevention (2 | 1.0%), Cleaning & Maintenance (2 | 1.0%), and Personal Care & Service (2 | 1.0%).
Services Occupations by Sex
Within the Services occupations in Lilydale, the most male-oriented occupations are Security & Protection (100.0%), Firefighting & Prevention (100.0%), and Food Preparation & Serving (28.6%), while the most female-oriented occupations are Cleaning & Maintenance (100.0%), Personal Care & Service (100.0%), and Food Preparation & Serving (71.4%).
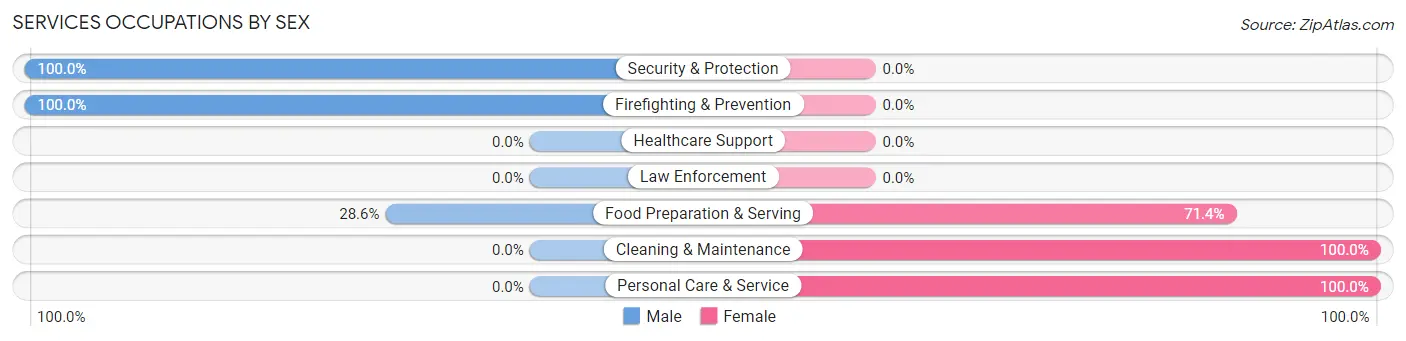
| Occupation | Male | Female |
| Healthcare Support | 0 (0.0%) | 0 (0.0%) |
| Security & Protection | 2 (100.0%) | 0 (0.0%) |
| Firefighting & Prevention | 2 (100.0%) | 0 (0.0%) |
| Law Enforcement | 0 (0.0%) | 0 (0.0%) |
| Food Preparation & Serving | 2 (28.6%) | 5 (71.4%) |
| Cleaning & Maintenance | 0 (0.0%) | 2 (100.0%) |
| Personal Care & Service | 0 (0.0%) | 2 (100.0%) |
| Total (Category) | 4 (30.8%) | 9 (69.2%) |
| Total (Overall) | 105 (53.3%) | 92 (46.7%) |
Sales and Office Occupations
The most common Sales and Office occupations in Lilydale are Office & Administration (21 | 10.7%), and Sales & Related (13 | 6.6%).
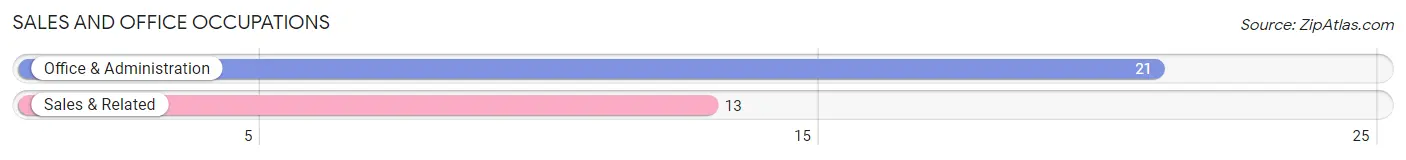
Sales and Office Occupations by Sex
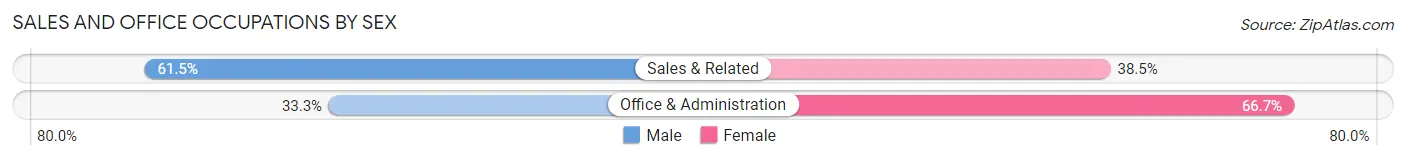
| Occupation | Male | Female |
| Sales & Related | 8 (61.5%) | 5 (38.5%) |
| Office & Administration | 7 (33.3%) | 14 (66.7%) |
| Total (Category) | 15 (44.1%) | 19 (55.9%) |
| Total (Overall) | 105 (53.3%) | 92 (46.7%) |
Natural Resources, Construction and Maintenance Occupations
The most common Natural Resources, Construction and Maintenance occupations in Lilydale are Construction & Extraction (3 | 1.5%), and Installation, Maintenance & Repair (3 | 1.5%).
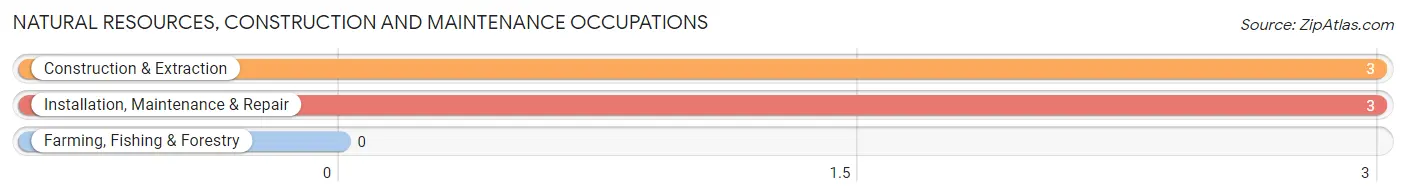
Natural Resources, Construction and Maintenance Occupations by Sex
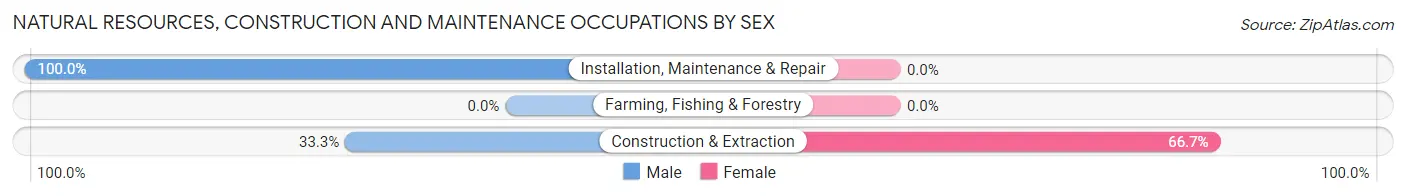
| Occupation | Male | Female |
| Farming, Fishing & Forestry | 0 (0.0%) | 0 (0.0%) |
| Construction & Extraction | 1 (33.3%) | 2 (66.7%) |
| Installation, Maintenance & Repair | 3 (100.0%) | 0 (0.0%) |
| Total (Category) | 4 (66.7%) | 2 (33.3%) |
| Total (Overall) | 105 (53.3%) | 92 (46.7%) |
Production, Transportation and Moving Occupations
The most common Production, Transportation and Moving occupations in Lilydale are Transportation (3 | 1.5%), and Production (2 | 1.0%).
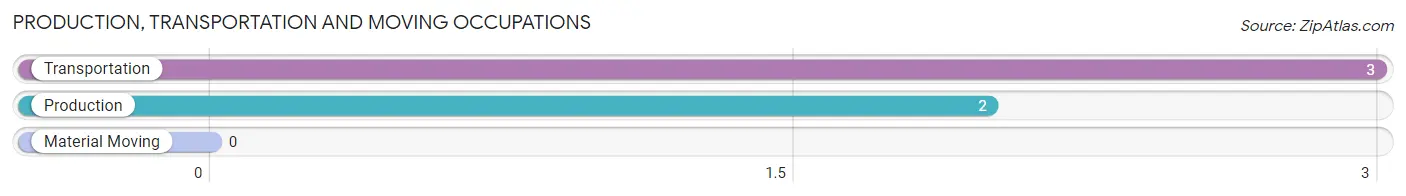
Production, Transportation and Moving Occupations by Sex
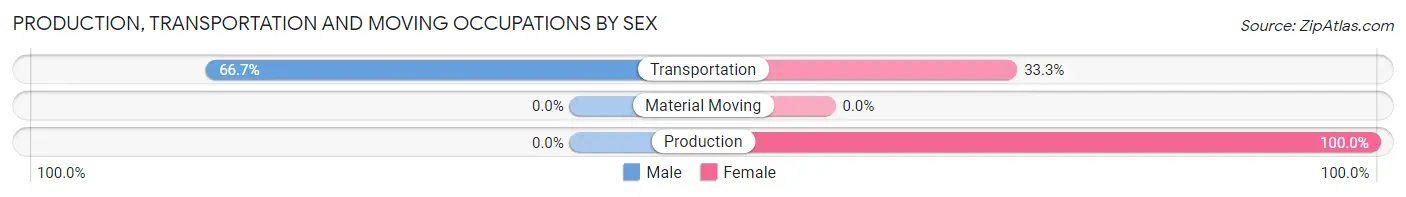
| Occupation | Male | Female |
| Production | 0 (0.0%) | 2 (100.0%) |
| Transportation | 2 (66.7%) | 1 (33.3%) |
| Material Moving | 0 (0.0%) | 0 (0.0%) |
| Total (Category) | 2 (40.0%) | 3 (60.0%) |
| Total (Overall) | 105 (53.3%) | 92 (46.7%) |
Employment Industries by Sex in Lilydale
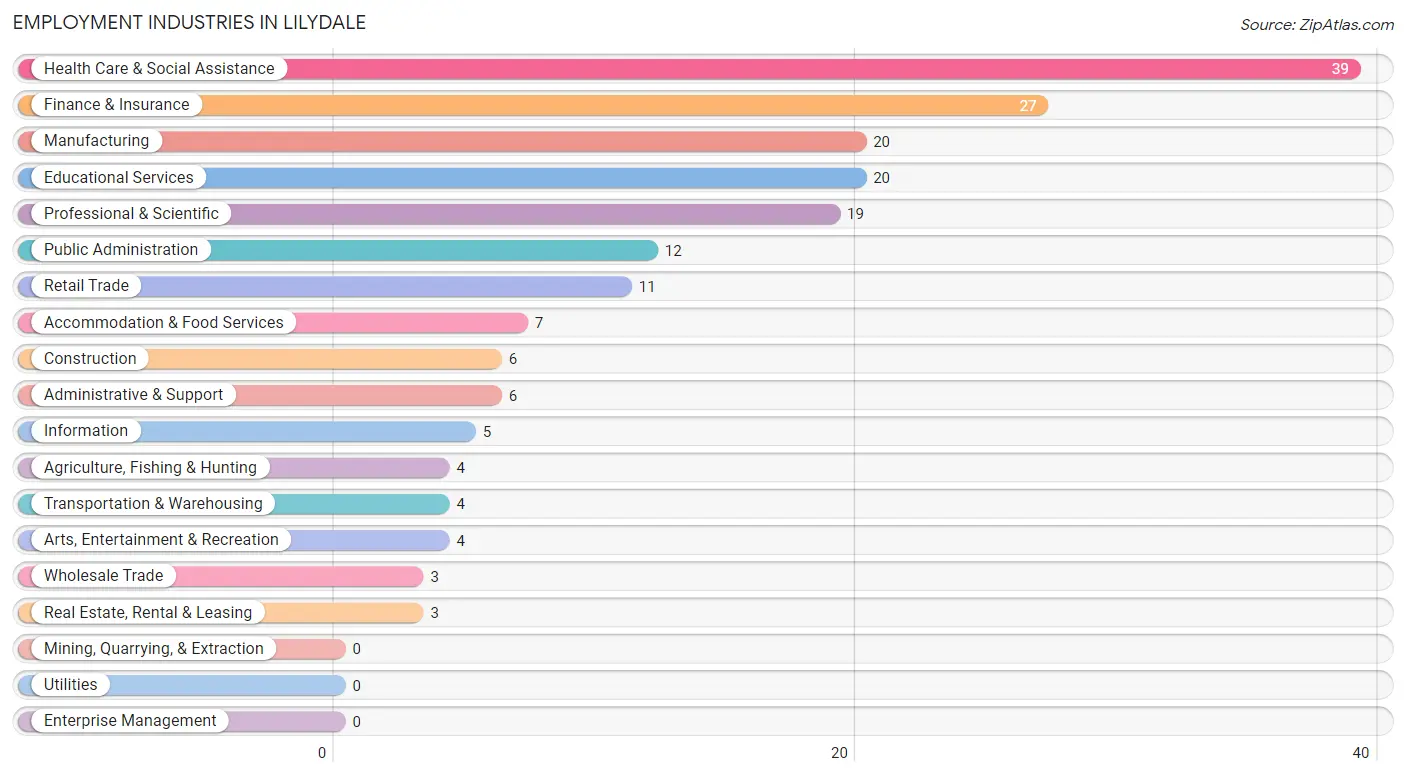
Employment Industries in Lilydale
The major employment industries in Lilydale include Health Care & Social Assistance (39 | 19.8%), Finance & Insurance (27 | 13.7%), Manufacturing (20 | 10.2%), Educational Services (20 | 10.2%), and Professional & Scientific (19 | 9.6%).
Employment Industries by Sex in Lilydale
The Lilydale industries that see more men than women are Agriculture, Fishing & Hunting (100.0%), Information (100.0%), and Administrative & Support (100.0%), whereas the industries that tend to have a higher number of women are Wholesale Trade (100.0%), Arts, Entertainment & Recreation (100.0%), and Construction (83.3%).
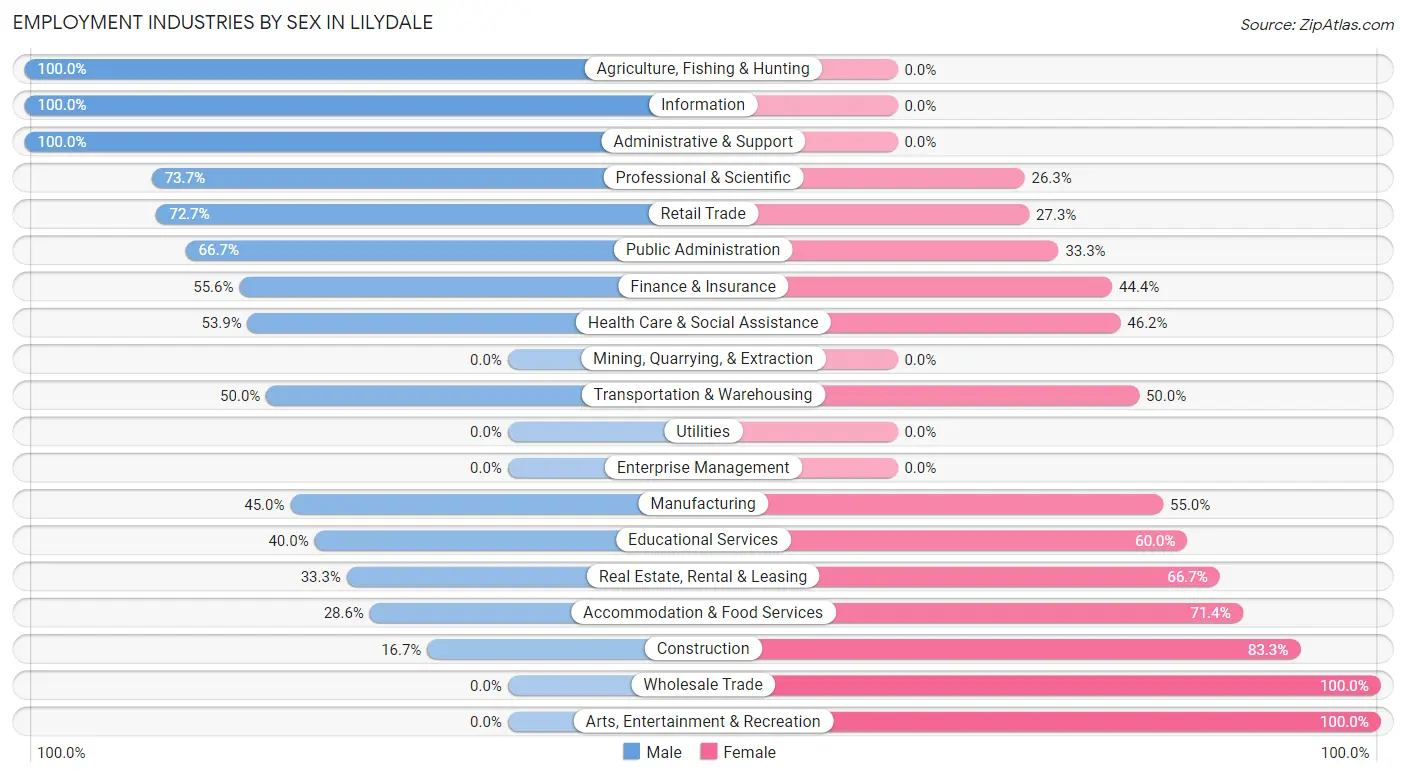
| Industry | Male | Female |
| Agriculture, Fishing & Hunting | 4 (100.0%) | 0 (0.0%) |
| Mining, Quarrying, & Extraction | 0 (0.0%) | 0 (0.0%) |
| Construction | 1 (16.7%) | 5 (83.3%) |
| Manufacturing | 9 (45.0%) | 11 (55.0%) |
| Wholesale Trade | 0 (0.0%) | 3 (100.0%) |
| Retail Trade | 8 (72.7%) | 3 (27.3%) |
| Transportation & Warehousing | 2 (50.0%) | 2 (50.0%) |
| Utilities | 0 (0.0%) | 0 (0.0%) |
| Information | 5 (100.0%) | 0 (0.0%) |
| Finance & Insurance | 15 (55.6%) | 12 (44.4%) |
| Real Estate, Rental & Leasing | 1 (33.3%) | 2 (66.7%) |
| Professional & Scientific | 14 (73.7%) | 5 (26.3%) |
| Enterprise Management | 0 (0.0%) | 0 (0.0%) |
| Administrative & Support | 6 (100.0%) | 0 (0.0%) |
| Educational Services | 8 (40.0%) | 12 (60.0%) |
| Health Care & Social Assistance | 21 (53.8%) | 18 (46.2%) |
| Arts, Entertainment & Recreation | 0 (0.0%) | 4 (100.0%) |
| Accommodation & Food Services | 2 (28.6%) | 5 (71.4%) |
| Public Administration | 8 (66.7%) | 4 (33.3%) |
| Total | 105 (53.3%) | 92 (46.7%) |
Education in Lilydale
School Enrollment in Lilydale
The most common levels of schooling among the 42 students in Lilydale are graduate / professional (10 | 23.8%), college / undergraduate (8 | 19.1%), and middle school (7 | 16.7%).
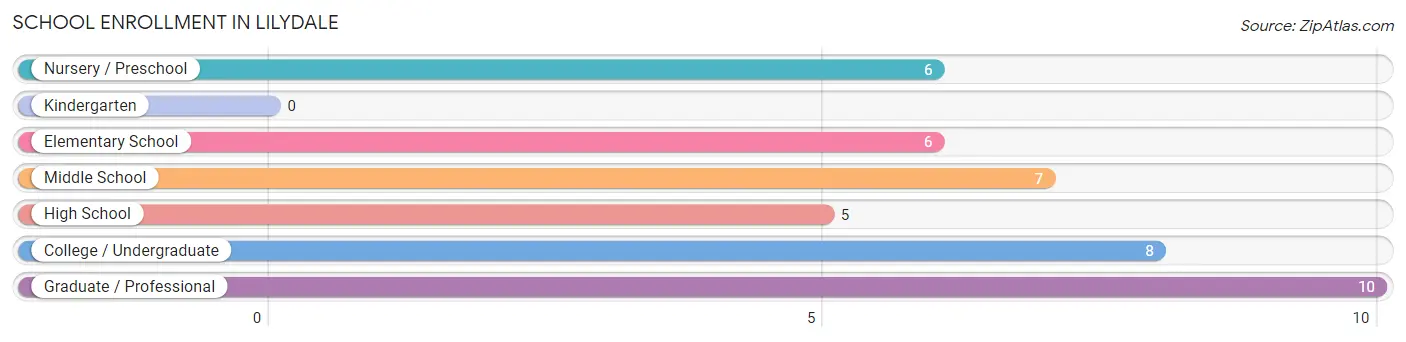
| School Level | # Students | % Students |
| Nursery / Preschool | 6 | 14.3% |
| Kindergarten | 0 | 0.0% |
| Elementary School | 6 | 14.3% |
| Middle School | 7 | 16.7% |
| High School | 5 | 11.9% |
| College / Undergraduate | 8 | 19.1% |
| Graduate / Professional | 10 | 23.8% |
| Total | 42 | 100.0% |
School Enrollment by Age by Funding Source in Lilydale
Out of a total of 42 students who are enrolled in schools in Lilydale, 23 (54.8%) attend a private institution, while the remaining 19 (45.2%) are enrolled in public schools. The age group of 3 to 4 year olds has the highest likelihood of being enrolled in private schools, with 3 (100.0% in the age bracket) enrolled. Conversely, the age group of 18 to 19 year olds has the lowest likelihood of being enrolled in a private school, with 2 (100.0% in the age bracket) attending a public institution.
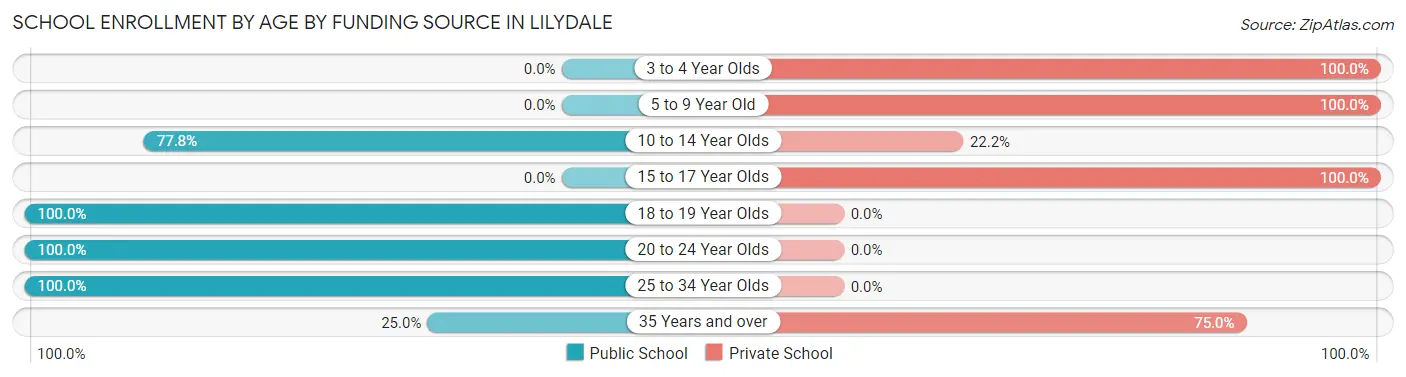
| Age Bracket | Public School | Private School |
| 3 to 4 Year Olds | 0 (0.0%) | 3 (100.0%) |
| 5 to 9 Year Old | 0 (0.0%) | 9 (100.0%) |
| 10 to 14 Year Olds | 7 (77.8%) | 2 (22.2%) |
| 15 to 17 Year Olds | 0 (0.0%) | 3 (100.0%) |
| 18 to 19 Year Olds | 2 (100.0%) | 0 (0.0%) |
| 20 to 24 Year Olds | 3 (100.0%) | 0 (0.0%) |
| 25 to 34 Year Olds | 5 (100.0%) | 0 (0.0%) |
| 35 Years and over | 2 (25.0%) | 6 (75.0%) |
| Total | 19 (45.2%) | 23 (54.8%) |
Educational Attainment by Field of Study in Lilydale
Business (97 | 21.2%), social sciences (71 | 15.5%), education (58 | 12.7%), liberal arts & history (38 | 8.3%), and science & technology (36 | 7.9%) are the most common fields of study among 458 individuals in Lilydale who have obtained a bachelor's degree or higher.
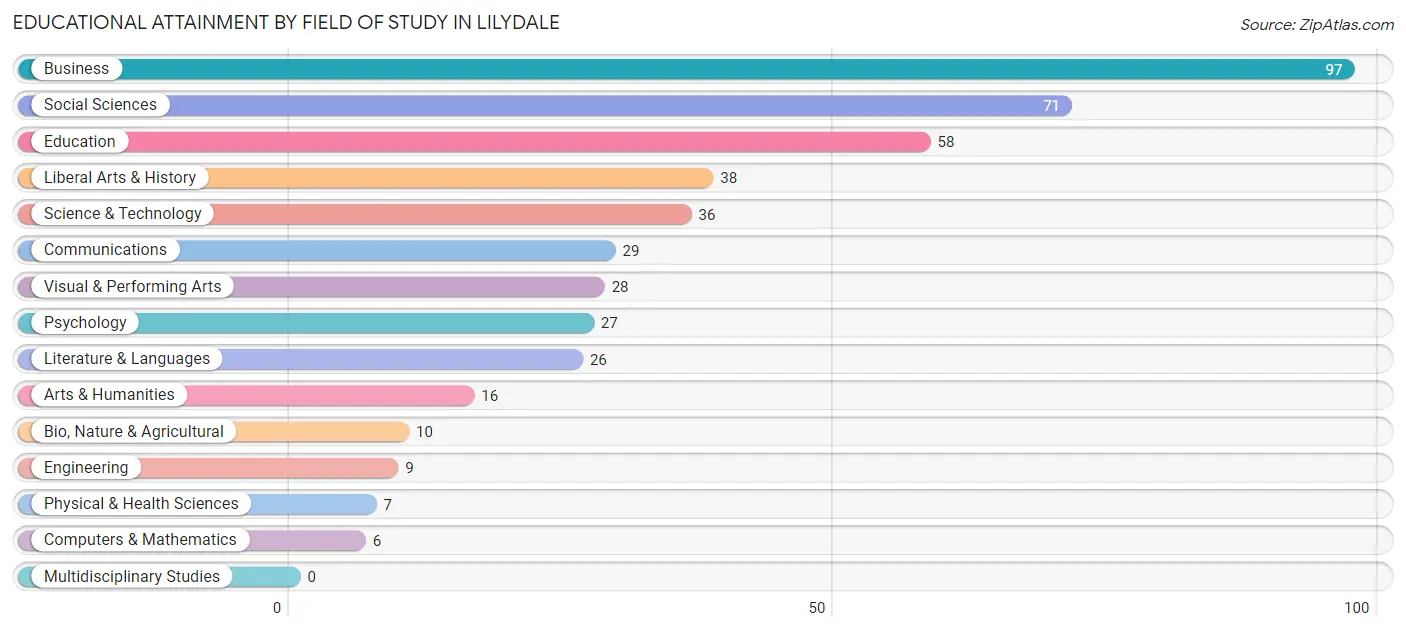
| Field of Study | # Graduates | % Graduates |
| Computers & Mathematics | 6 | 1.3% |
| Bio, Nature & Agricultural | 10 | 2.2% |
| Physical & Health Sciences | 7 | 1.5% |
| Psychology | 27 | 5.9% |
| Social Sciences | 71 | 15.5% |
| Engineering | 9 | 2.0% |
| Multidisciplinary Studies | 0 | 0.0% |
| Science & Technology | 36 | 7.9% |
| Business | 97 | 21.2% |
| Education | 58 | 12.7% |
| Literature & Languages | 26 | 5.7% |
| Liberal Arts & History | 38 | 8.3% |
| Visual & Performing Arts | 28 | 6.1% |
| Communications | 29 | 6.3% |
| Arts & Humanities | 16 | 3.5% |
| Total | 458 | 100.0% |
Transportation & Commute in Lilydale
Vehicle Availability by Sex in Lilydale
The most prevalent vehicle ownership categories in Lilydale are males with 2 vehicles (40, accounting for 38.1%) and females with 2 vehicles (29, making up 45.5%).
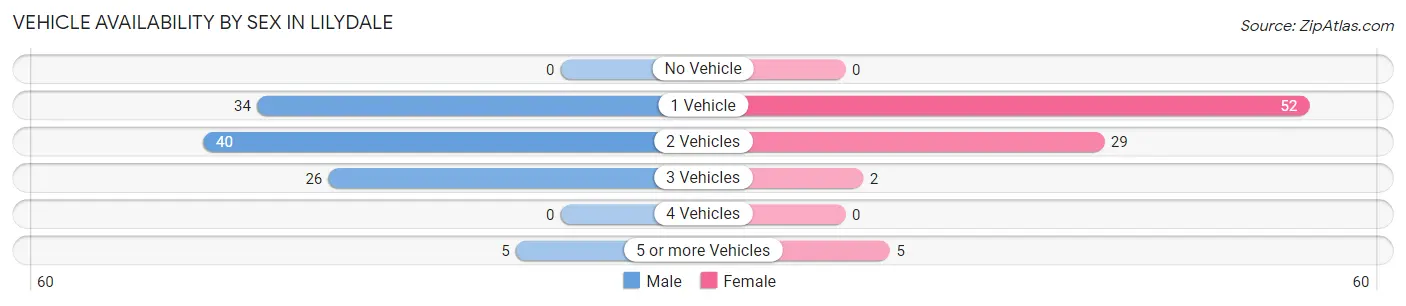
| Vehicles Available | Male | Female |
| No Vehicle | 0 (0.0%) | 0 (0.0%) |
| 1 Vehicle | 34 (32.4%) | 52 (59.1%) |
| 2 Vehicles | 40 (38.1%) | 29 (33.0%) |
| 3 Vehicles | 26 (24.8%) | 2 (2.3%) |
| 4 Vehicles | 0 (0.0%) | 0 (0.0%) |
| 5 or more Vehicles | 5 (4.8%) | 5 (5.7%) |
| Total | 105 (100.0%) | 88 (100.0%) |
Commute Time in Lilydale
The most frequently occuring commute durations in Lilydale are 20 to 24 minutes (41 commuters, 28.3%), 15 to 19 minutes (35 commuters, 24.1%), and 10 to 14 minutes (22 commuters, 15.2%).
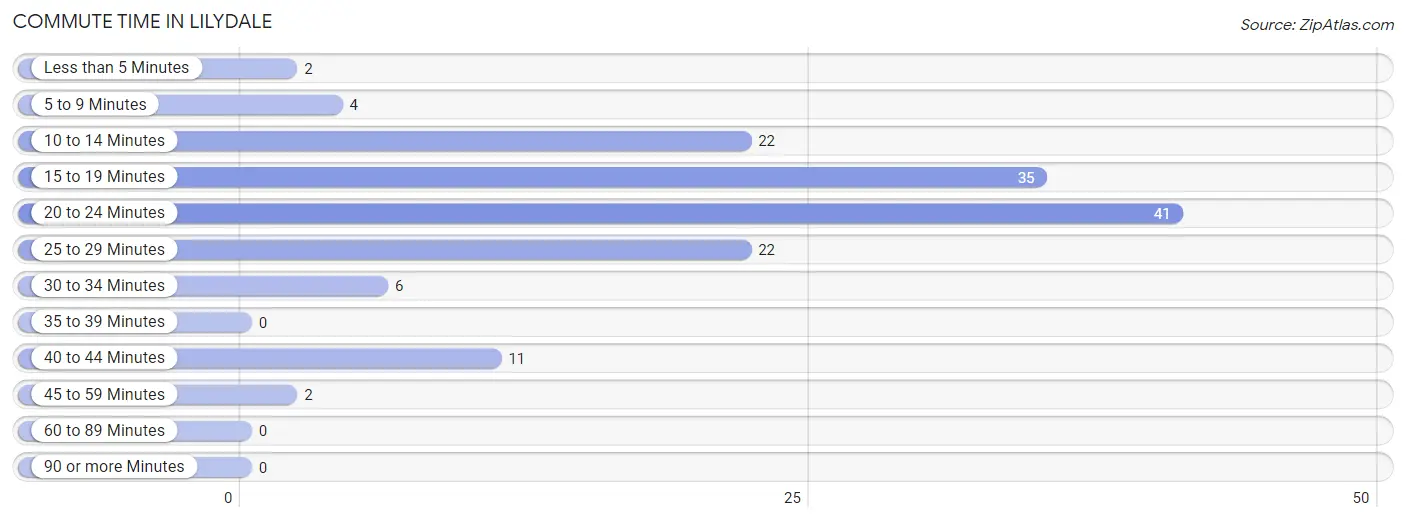
| Commute Time | # Commuters | % Commuters |
| Less than 5 Minutes | 2 | 1.4% |
| 5 to 9 Minutes | 4 | 2.8% |
| 10 to 14 Minutes | 22 | 15.2% |
| 15 to 19 Minutes | 35 | 24.1% |
| 20 to 24 Minutes | 41 | 28.3% |
| 25 to 29 Minutes | 22 | 15.2% |
| 30 to 34 Minutes | 6 | 4.1% |
| 35 to 39 Minutes | 0 | 0.0% |
| 40 to 44 Minutes | 11 | 7.6% |
| 45 to 59 Minutes | 2 | 1.4% |
| 60 to 89 Minutes | 0 | 0.0% |
| 90 or more Minutes | 0 | 0.0% |
Commute Time by Sex in Lilydale
The most common commute times in Lilydale are 15 to 19 minutes (29 commuters, 37.7%) for males and 20 to 24 minutes (20 commuters, 29.4%) for females.
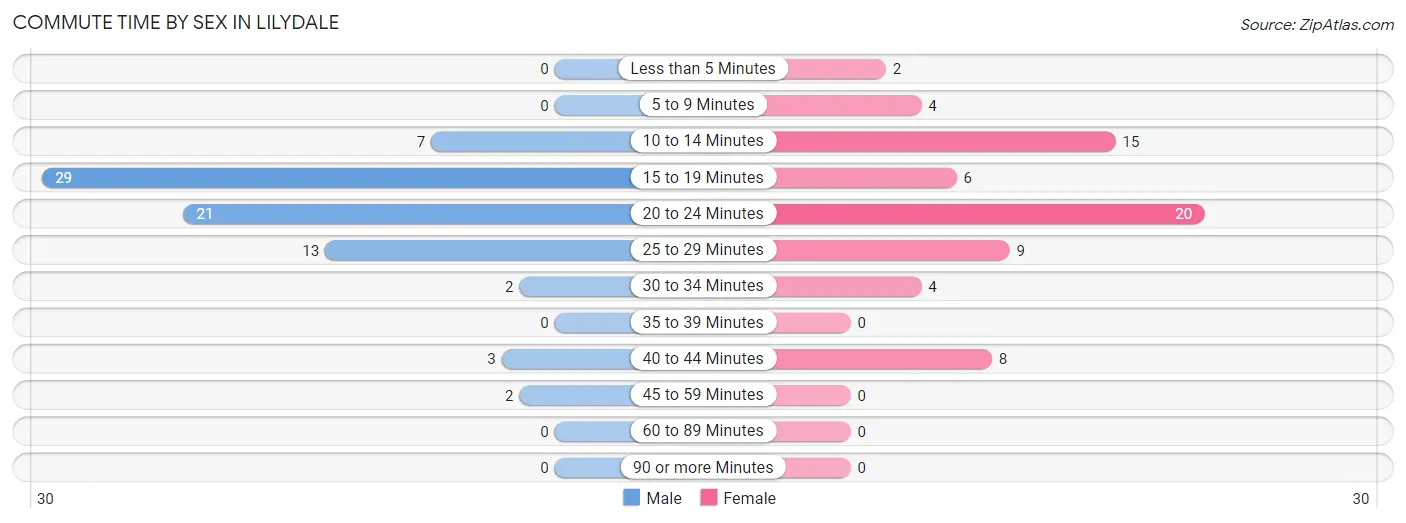
| Commute Time | Male | Female |
| Less than 5 Minutes | 0 (0.0%) | 2 (2.9%) |
| 5 to 9 Minutes | 0 (0.0%) | 4 (5.9%) |
| 10 to 14 Minutes | 7 (9.1%) | 15 (22.1%) |
| 15 to 19 Minutes | 29 (37.7%) | 6 (8.8%) |
| 20 to 24 Minutes | 21 (27.3%) | 20 (29.4%) |
| 25 to 29 Minutes | 13 (16.9%) | 9 (13.2%) |
| 30 to 34 Minutes | 2 (2.6%) | 4 (5.9%) |
| 35 to 39 Minutes | 0 (0.0%) | 0 (0.0%) |
| 40 to 44 Minutes | 3 (3.9%) | 8 (11.8%) |
| 45 to 59 Minutes | 2 (2.6%) | 0 (0.0%) |
| 60 to 89 Minutes | 0 (0.0%) | 0 (0.0%) |
| 90 or more Minutes | 0 (0.0%) | 0 (0.0%) |
Time of Departure to Work by Sex in Lilydale
The most frequent times of departure to work in Lilydale are 6:30 AM to 6:59 AM (24, 31.2%) for males and 7:30 AM to 7:59 AM (18, 26.5%) for females.
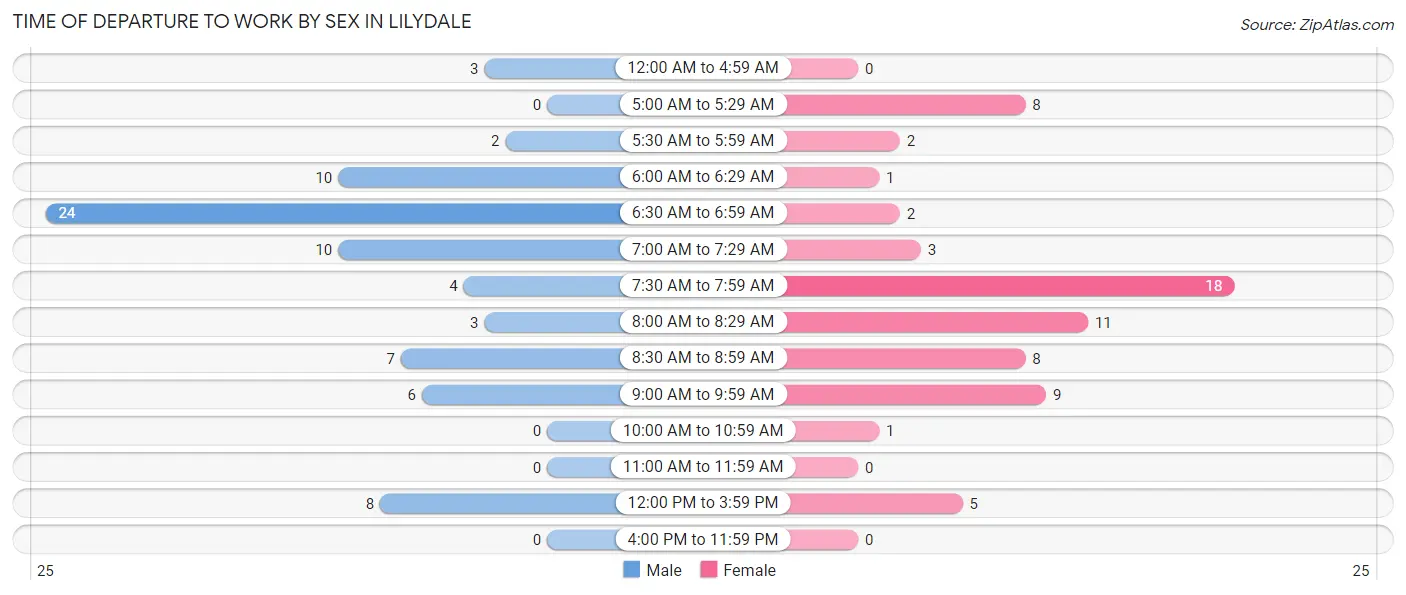
| Time of Departure | Male | Female |
| 12:00 AM to 4:59 AM | 3 (3.9%) | 0 (0.0%) |
| 5:00 AM to 5:29 AM | 0 (0.0%) | 8 (11.8%) |
| 5:30 AM to 5:59 AM | 2 (2.6%) | 2 (2.9%) |
| 6:00 AM to 6:29 AM | 10 (13.0%) | 1 (1.5%) |
| 6:30 AM to 6:59 AM | 24 (31.2%) | 2 (2.9%) |
| 7:00 AM to 7:29 AM | 10 (13.0%) | 3 (4.4%) |
| 7:30 AM to 7:59 AM | 4 (5.2%) | 18 (26.5%) |
| 8:00 AM to 8:29 AM | 3 (3.9%) | 11 (16.2%) |
| 8:30 AM to 8:59 AM | 7 (9.1%) | 8 (11.8%) |
| 9:00 AM to 9:59 AM | 6 (7.8%) | 9 (13.2%) |
| 10:00 AM to 10:59 AM | 0 (0.0%) | 1 (1.5%) |
| 11:00 AM to 11:59 AM | 0 (0.0%) | 0 (0.0%) |
| 12:00 PM to 3:59 PM | 8 (10.4%) | 5 (7.3%) |
| 4:00 PM to 11:59 PM | 0 (0.0%) | 0 (0.0%) |
| Total | 77 (100.0%) | 68 (100.0%) |
Housing Occupancy in Lilydale
Occupancy by Ownership in Lilydale
Of the total 514 dwellings in Lilydale, owner-occupied units account for 269 (52.3%), while renter-occupied units make up 245 (47.7%).
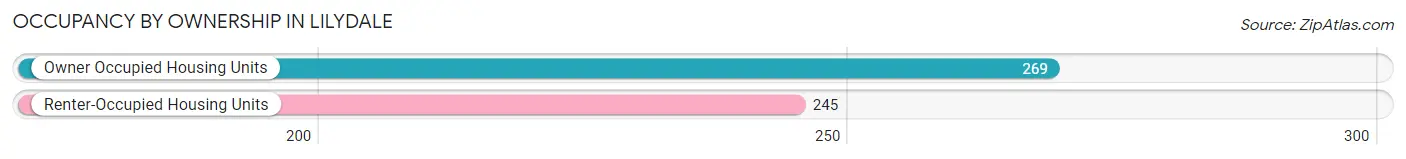
| Occupancy | # Housing Units | % Housing Units |
| Owner Occupied Housing Units | 269 | 52.3% |
| Renter-Occupied Housing Units | 245 | 47.7% |
| Total Occupied Housing Units | 514 | 100.0% |
Occupancy by Household Size in Lilydale
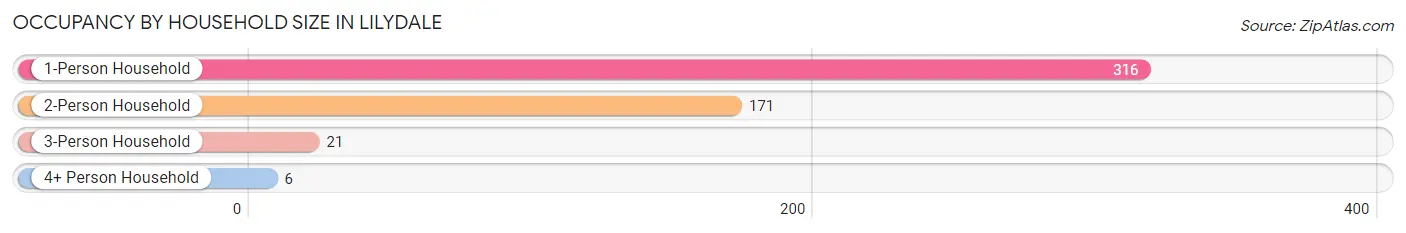
| Household Size | # Housing Units | % Housing Units |
| 1-Person Household | 316 | 61.5% |
| 2-Person Household | 171 | 33.3% |
| 3-Person Household | 21 | 4.1% |
| 4+ Person Household | 6 | 1.2% |
| Total Housing Units | 514 | 100.0% |
Occupancy by Ownership by Household Size in Lilydale
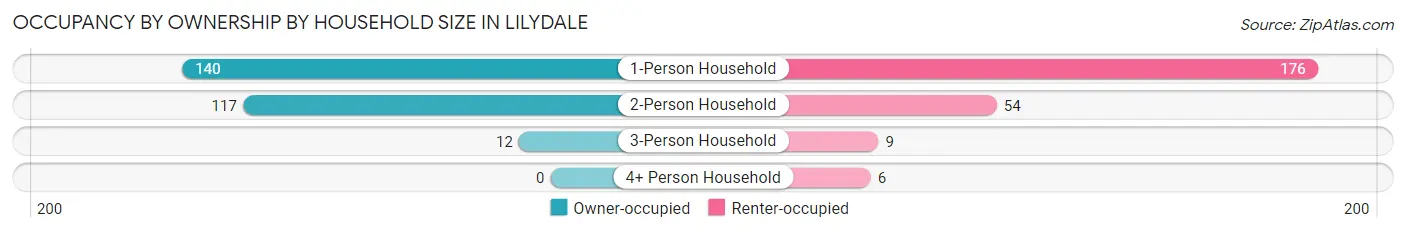
| Household Size | Owner-occupied | Renter-occupied |
| 1-Person Household | 140 (44.3%) | 176 (55.7%) |
| 2-Person Household | 117 (68.4%) | 54 (31.6%) |
| 3-Person Household | 12 (57.1%) | 9 (42.9%) |
| 4+ Person Household | 0 (0.0%) | 6 (100.0%) |
| Total Housing Units | 269 (52.3%) | 245 (47.7%) |
Occupancy by Educational Attainment in Lilydale
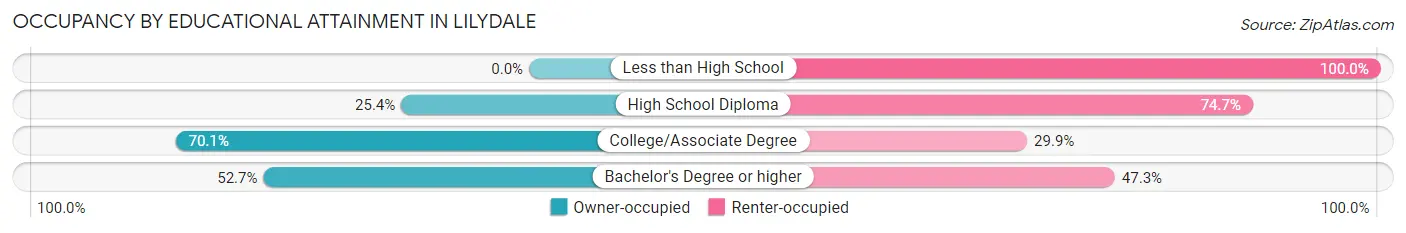
| Household Size | Owner-occupied | Renter-occupied |
| Less than High School | 0 (0.0%) | 15 (100.0%) |
| High School Diploma | 18 (25.4%) | 53 (74.7%) |
| College/Associate Degree | 103 (70.1%) | 44 (29.9%) |
| Bachelor's Degree or higher | 148 (52.7%) | 133 (47.3%) |
Occupancy by Age of Householder in Lilydale
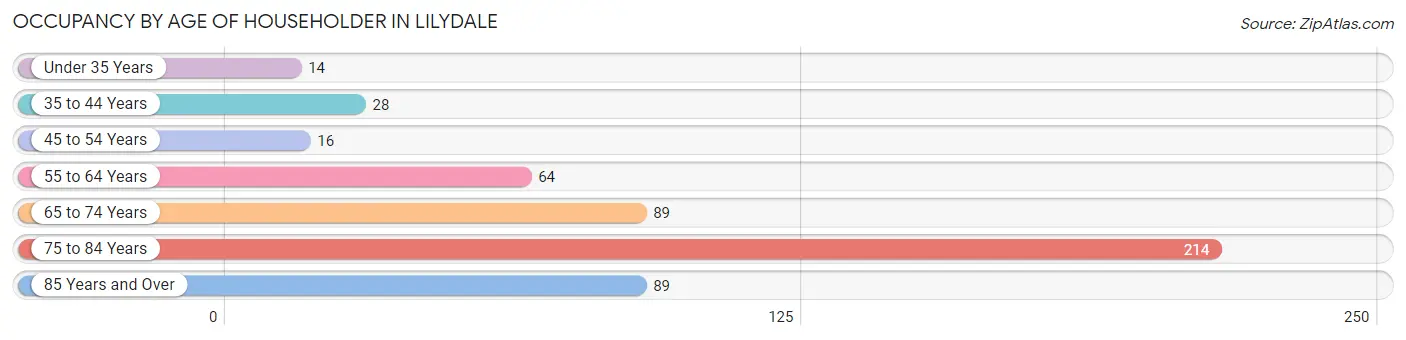
| Age Bracket | # Households | % Households |
| Under 35 Years | 14 | 2.7% |
| 35 to 44 Years | 28 | 5.4% |
| 45 to 54 Years | 16 | 3.1% |
| 55 to 64 Years | 64 | 12.4% |
| 65 to 74 Years | 89 | 17.3% |
| 75 to 84 Years | 214 | 41.6% |
| 85 Years and Over | 89 | 17.3% |
| Total | 514 | 100.0% |
Housing Finances in Lilydale
Median Income by Occupancy in Lilydale
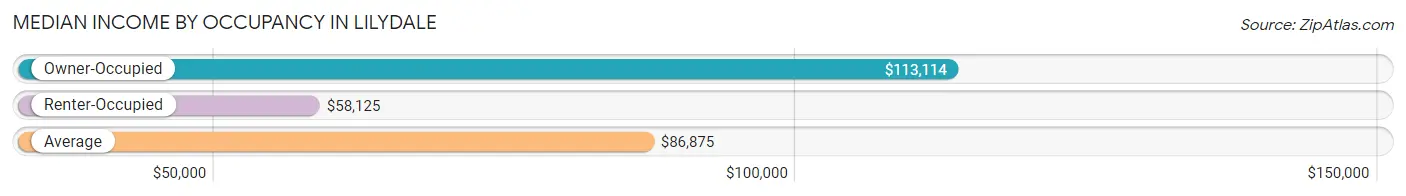
| Occupancy Type | # Households | Median Income |
| Owner-Occupied | 269 (52.3%) | $113,114 |
| Renter-Occupied | 245 (47.7%) | $58,125 |
| Average | 514 (100.0%) | $86,875 |
Occupancy by Householder Income Bracket in Lilydale
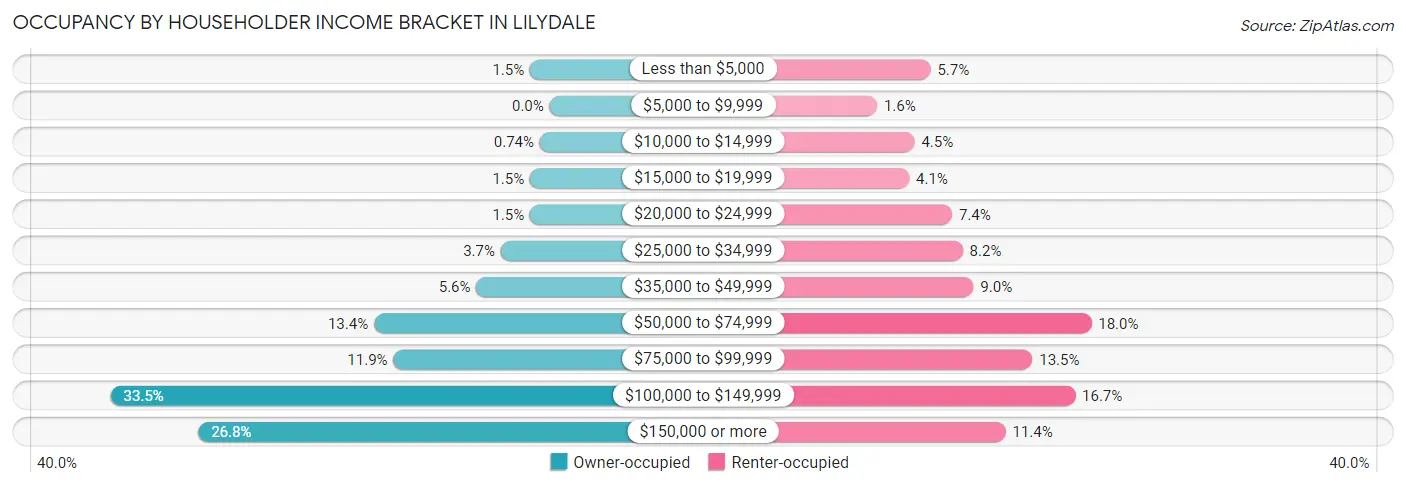
| Income Bracket | Owner-occupied | Renter-occupied |
| Less than $5,000 | 4 (1.5%) | 14 (5.7%) |
| $5,000 to $9,999 | 0 (0.0%) | 4 (1.6%) |
| $10,000 to $14,999 | 2 (0.7%) | 11 (4.5%) |
| $15,000 to $19,999 | 4 (1.5%) | 10 (4.1%) |
| $20,000 to $24,999 | 4 (1.5%) | 18 (7.3%) |
| $25,000 to $34,999 | 10 (3.7%) | 20 (8.2%) |
| $35,000 to $49,999 | 15 (5.6%) | 22 (9.0%) |
| $50,000 to $74,999 | 36 (13.4%) | 44 (18.0%) |
| $75,000 to $99,999 | 32 (11.9%) | 33 (13.5%) |
| $100,000 to $149,999 | 90 (33.5%) | 41 (16.7%) |
| $150,000 or more | 72 (26.8%) | 28 (11.4%) |
| Total | 269 (100.0%) | 245 (100.0%) |
Monthly Housing Cost Tiers in Lilydale
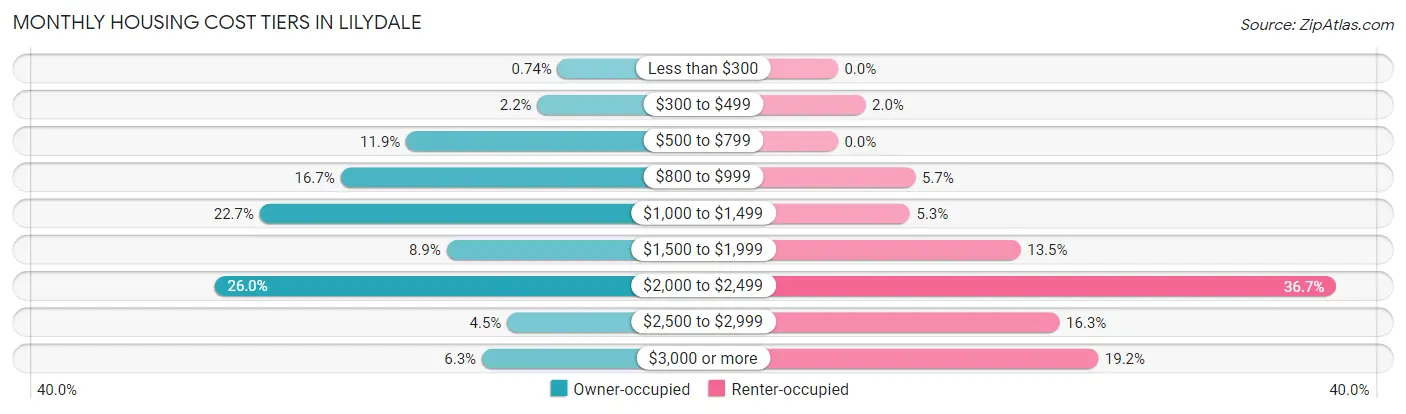
| Monthly Cost | Owner-occupied | Renter-occupied |
| Less than $300 | 2 (0.7%) | 0 (0.0%) |
| $300 to $499 | 6 (2.2%) | 5 (2.0%) |
| $500 to $799 | 32 (11.9%) | 0 (0.0%) |
| $800 to $999 | 45 (16.7%) | 14 (5.7%) |
| $1,000 to $1,499 | 61 (22.7%) | 13 (5.3%) |
| $1,500 to $1,999 | 24 (8.9%) | 33 (13.5%) |
| $2,000 to $2,499 | 70 (26.0%) | 90 (36.7%) |
| $2,500 to $2,999 | 12 (4.5%) | 40 (16.3%) |
| $3,000 or more | 17 (6.3%) | 47 (19.2%) |
| Total | 269 (100.0%) | 245 (100.0%) |
Physical Housing Characteristics in Lilydale
Housing Structures in Lilydale
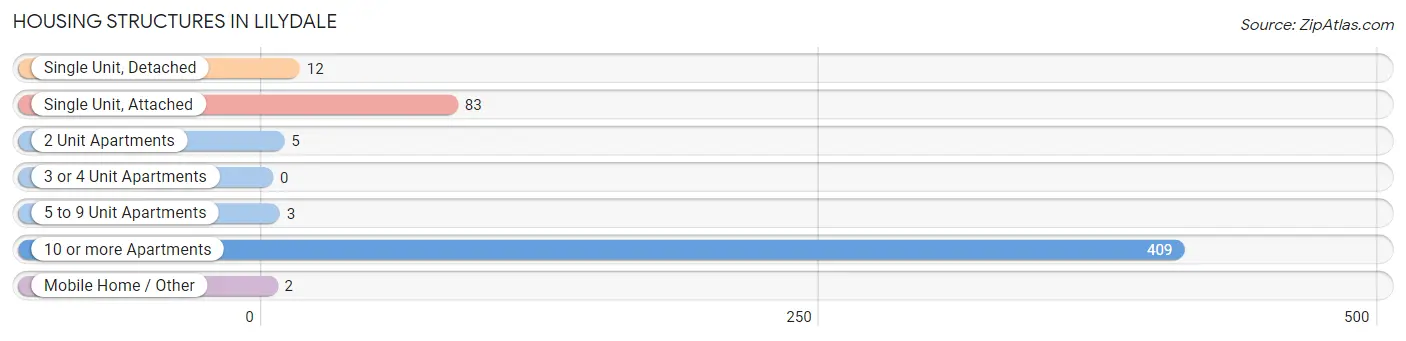
| Structure Type | # Housing Units | % Housing Units |
| Single Unit, Detached | 12 | 2.3% |
| Single Unit, Attached | 83 | 16.2% |
| 2 Unit Apartments | 5 | 1.0% |
| 3 or 4 Unit Apartments | 0 | 0.0% |
| 5 to 9 Unit Apartments | 3 | 0.6% |
| 10 or more Apartments | 409 | 79.6% |
| Mobile Home / Other | 2 | 0.4% |
| Total | 514 | 100.0% |
Housing Structures by Occupancy in Lilydale
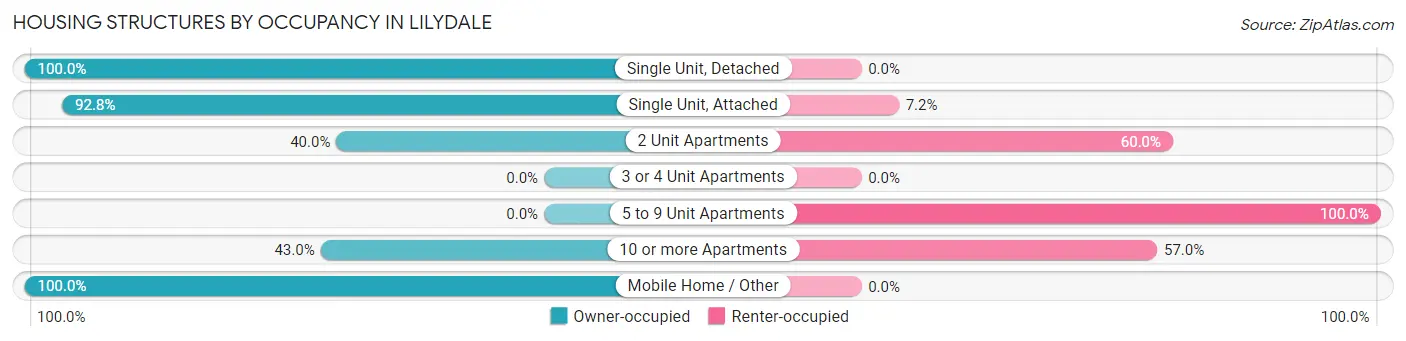
| Structure Type | Owner-occupied | Renter-occupied |
| Single Unit, Detached | 12 (100.0%) | 0 (0.0%) |
| Single Unit, Attached | 77 (92.8%) | 6 (7.2%) |
| 2 Unit Apartments | 2 (40.0%) | 3 (60.0%) |
| 3 or 4 Unit Apartments | 0 (0.0%) | 0 (0.0%) |
| 5 to 9 Unit Apartments | 0 (0.0%) | 3 (100.0%) |
| 10 or more Apartments | 176 (43.0%) | 233 (57.0%) |
| Mobile Home / Other | 2 (100.0%) | 0 (0.0%) |
| Total | 269 (52.3%) | 245 (47.7%) |
Housing Structures by Number of Rooms in Lilydale
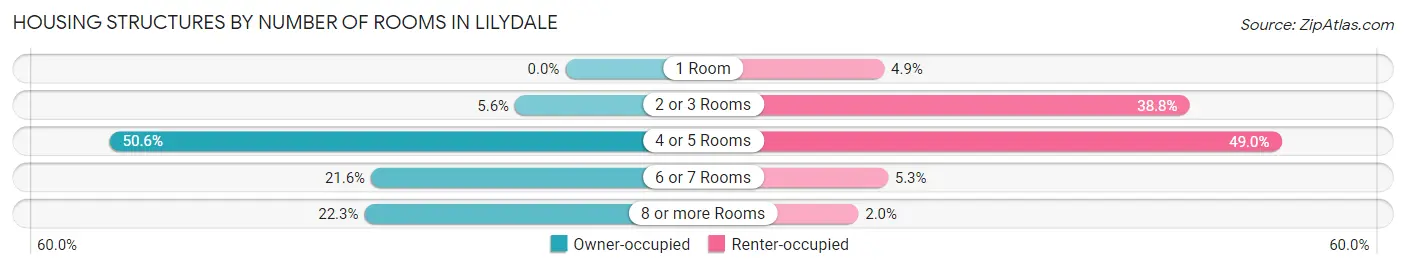
| Number of Rooms | Owner-occupied | Renter-occupied |
| 1 Room | 0 (0.0%) | 12 (4.9%) |
| 2 or 3 Rooms | 15 (5.6%) | 95 (38.8%) |
| 4 or 5 Rooms | 136 (50.6%) | 120 (49.0%) |
| 6 or 7 Rooms | 58 (21.6%) | 13 (5.3%) |
| 8 or more Rooms | 60 (22.3%) | 5 (2.0%) |
| Total | 269 (100.0%) | 245 (100.0%) |
Housing Structure by Heating Type in Lilydale
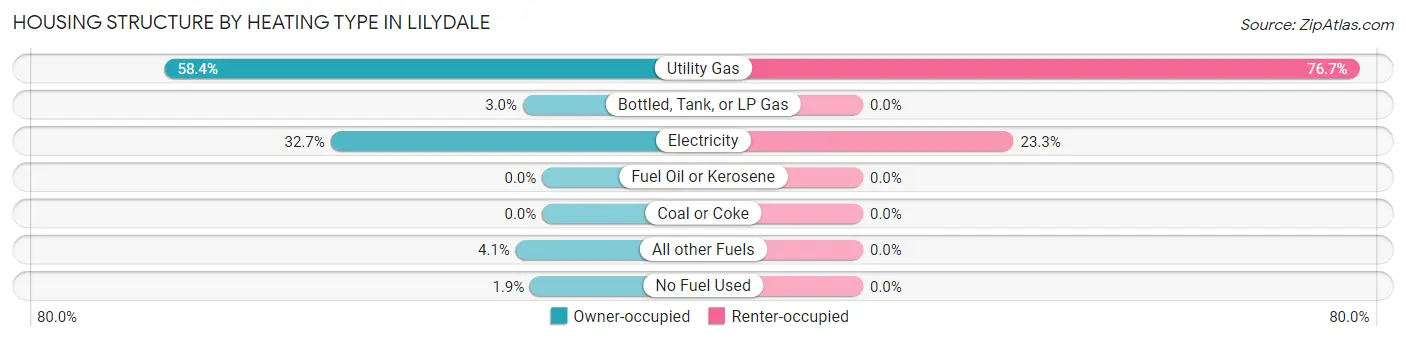
| Heating Type | Owner-occupied | Renter-occupied |
| Utility Gas | 157 (58.4%) | 188 (76.7%) |
| Bottled, Tank, or LP Gas | 8 (3.0%) | 0 (0.0%) |
| Electricity | 88 (32.7%) | 57 (23.3%) |
| Fuel Oil or Kerosene | 0 (0.0%) | 0 (0.0%) |
| Coal or Coke | 0 (0.0%) | 0 (0.0%) |
| All other Fuels | 11 (4.1%) | 0 (0.0%) |
| No Fuel Used | 5 (1.9%) | 0 (0.0%) |
| Total | 269 (100.0%) | 245 (100.0%) |
Household Vehicle Usage in Lilydale
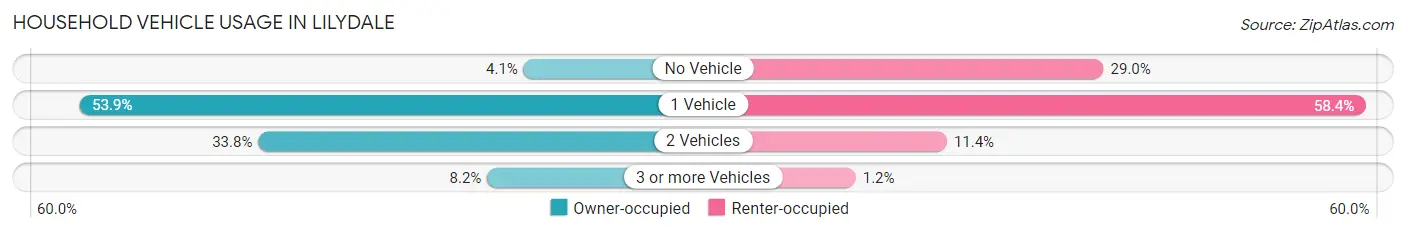
| Vehicles per Household | Owner-occupied | Renter-occupied |
| No Vehicle | 11 (4.1%) | 71 (29.0%) |
| 1 Vehicle | 145 (53.9%) | 143 (58.4%) |
| 2 Vehicles | 91 (33.8%) | 28 (11.4%) |
| 3 or more Vehicles | 22 (8.2%) | 3 (1.2%) |
| Total | 269 (100.0%) | 245 (100.0%) |
Real Estate & Mortgages in Lilydale
Real Estate and Mortgage Overview in Lilydale
| Characteristic | Without Mortgage | With Mortgage |
| Housing Units | 138 | 131 |
| Median Property Value | $394,100 | $372,500 |
| Median Household Income | $99,375 | $23 |
| Monthly Housing Costs | $907 | $17 |
| Real Estate Taxes | $3,267 | $0 |
Property Value by Mortgage Status in Lilydale
| Property Value | Without Mortgage | With Mortgage |
| Less than $50,000 | 0 (0.0%) | 2 (1.5%) |
| $50,000 to $99,999 | 0 (0.0%) | 0 (0.0%) |
| $100,000 to $299,999 | 37 (26.8%) | 12 (9.2%) |
| $300,000 to $499,999 | 54 (39.1%) | 82 (62.6%) |
| $500,000 to $749,999 | 21 (15.2%) | 18 (13.7%) |
| $750,000 to $999,999 | 20 (14.5%) | 12 (9.2%) |
| $1,000,000 or more | 6 (4.3%) | 5 (3.8%) |
| Total | 138 (100.0%) | 131 (100.0%) |
Household Income by Mortgage Status in Lilydale
| Household Income | Without Mortgage | With Mortgage |
| Less than $10,000 | 4 (2.9%) | 3 (2.3%) |
| $10,000 to $24,999 | 8 (5.8%) | 0 (0.0%) |
| $25,000 to $34,999 | 5 (3.6%) | 2 (1.5%) |
| $35,000 to $49,999 | 8 (5.8%) | 5 (3.8%) |
| $50,000 to $74,999 | 26 (18.8%) | 7 (5.3%) |
| $75,000 to $99,999 | 19 (13.8%) | 10 (7.6%) |
| $100,000 to $149,999 | 19 (13.8%) | 13 (9.9%) |
| $150,000 or more | 49 (35.5%) | 71 (54.2%) |
| Total | 138 (100.0%) | 131 (100.0%) |
Property Value to Household Income Ratio in Lilydale
| Value-to-Income Ratio | Without Mortgage | With Mortgage |
| Less than 2.0x | 24 (17.4%) | 113,467 (86,616.0%) |
| 2.0x to 2.9x | 26 (18.8%) | 17 (13.0%) |
| 3.0x to 3.9x | 21 (15.2%) | 9 (6.9%) |
| 4.0x or more | 67 (48.5%) | 72 (55.0%) |
| Total | 138 (100.0%) | 131 (100.0%) |
Real Estate Taxes by Mortgage Status in Lilydale
| Property Taxes | Without Mortgage | With Mortgage |
| Less than $800 | 0 (0.0%) | 0 (0.0%) |
| $800 to $1,499 | 12 (8.7%) | 0 (0.0%) |
| $800 to $1,499 | 124 (89.9%) | 8 (6.1%) |
| Total | 138 (100.0%) | 131 (100.0%) |
Health & Disability in Lilydale
Health Insurance Coverage by Age in Lilydale
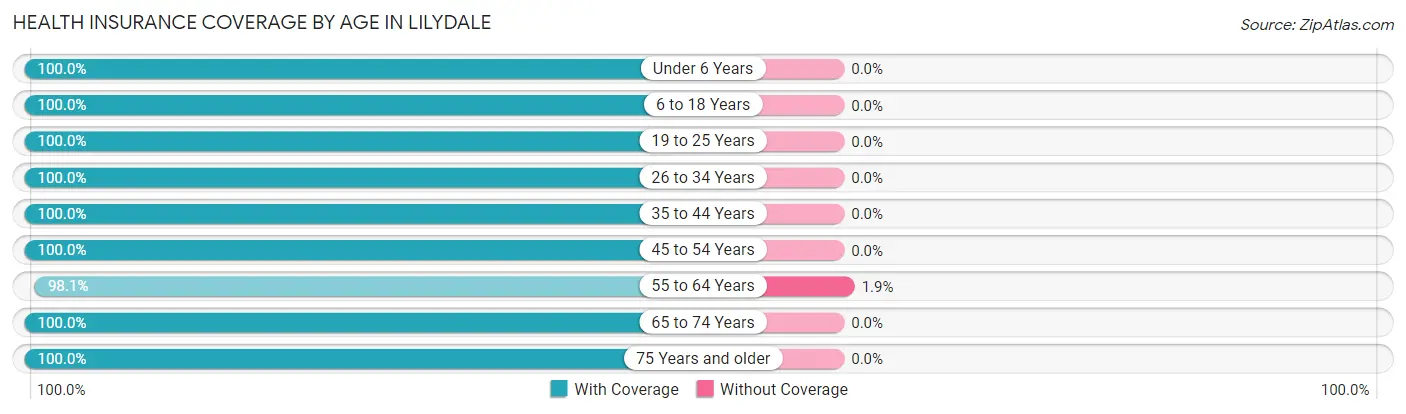
| Age Bracket | With Coverage | Without Coverage |
| Under 6 Years | 11 (100.0%) | 0 (0.0%) |
| 6 to 18 Years | 18 (100.0%) | 0 (0.0%) |
| 19 to 25 Years | 9 (100.0%) | 0 (0.0%) |
| 26 to 34 Years | 23 (100.0%) | 0 (0.0%) |
| 35 to 44 Years | 38 (100.0%) | 0 (0.0%) |
| 45 to 54 Years | 23 (100.0%) | 0 (0.0%) |
| 55 to 64 Years | 101 (98.1%) | 2 (1.9%) |
| 65 to 74 Years | 167 (100.0%) | 0 (0.0%) |
| 75 Years and older | 369 (100.0%) | 0 (0.0%) |
| Total | 759 (99.7%) | 2 (0.3%) |
Health Insurance Coverage by Citizenship Status in Lilydale
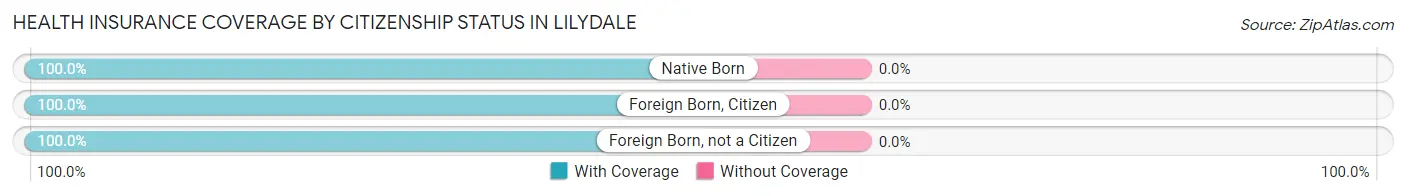
| Citizenship Status | With Coverage | Without Coverage |
| Native Born | 11 (100.0%) | 0 (0.0%) |
| Foreign Born, Citizen | 18 (100.0%) | 0 (0.0%) |
| Foreign Born, not a Citizen | 9 (100.0%) | 0 (0.0%) |
Health Insurance Coverage by Household Income in Lilydale
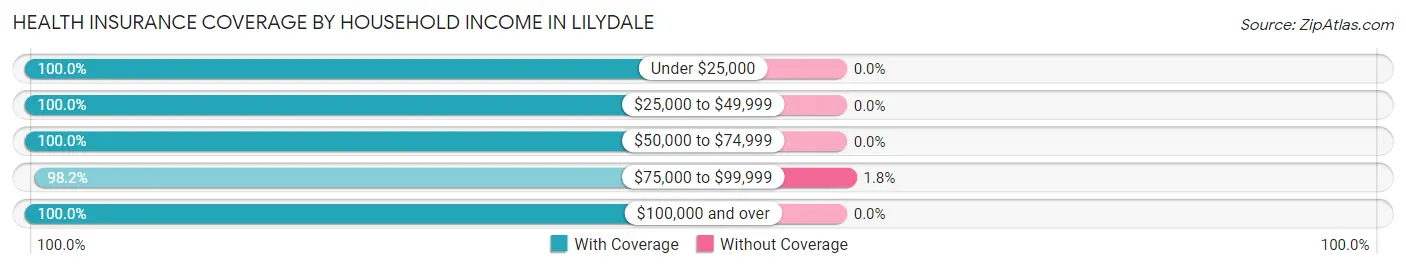
| Household Income | With Coverage | Without Coverage |
| Under $25,000 | 73 (100.0%) | 0 (0.0%) |
| $25,000 to $49,999 | 90 (100.0%) | 0 (0.0%) |
| $50,000 to $74,999 | 113 (100.0%) | 0 (0.0%) |
| $75,000 to $99,999 | 108 (98.2%) | 2 (1.8%) |
| $100,000 and over | 375 (100.0%) | 0 (0.0%) |
Public vs Private Health Insurance Coverage by Age in Lilydale
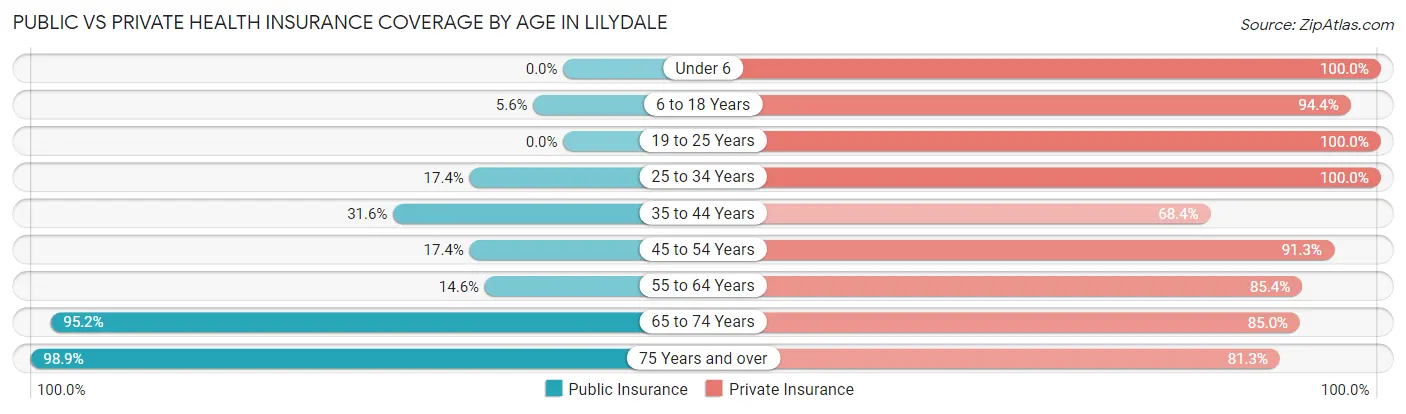
| Age Bracket | Public Insurance | Private Insurance |
| Under 6 | 0 (0.0%) | 11 (100.0%) |
| 6 to 18 Years | 1 (5.6%) | 17 (94.4%) |
| 19 to 25 Years | 0 (0.0%) | 9 (100.0%) |
| 25 to 34 Years | 4 (17.4%) | 23 (100.0%) |
| 35 to 44 Years | 12 (31.6%) | 26 (68.4%) |
| 45 to 54 Years | 4 (17.4%) | 21 (91.3%) |
| 55 to 64 Years | 15 (14.6%) | 88 (85.4%) |
| 65 to 74 Years | 159 (95.2%) | 142 (85.0%) |
| 75 Years and over | 365 (98.9%) | 300 (81.3%) |
| Total | 560 (73.6%) | 637 (83.7%) |
Disability Status by Sex by Age in Lilydale
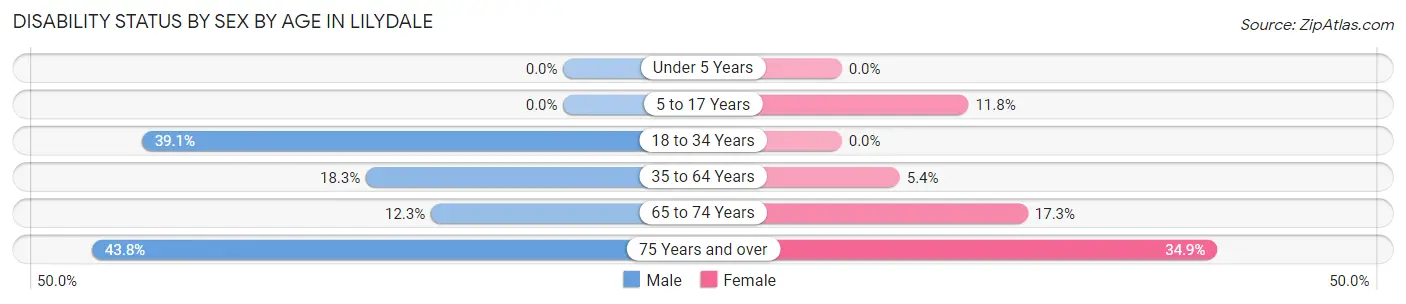
| Age Bracket | Male | Female |
| Under 5 Years | 0 (0.0%) | 0 (0.0%) |
| 5 to 17 Years | 0 (0.0%) | 2 (11.8%) |
| 18 to 34 Years | 9 (39.1%) | 0 (0.0%) |
| 35 to 64 Years | 13 (18.3%) | 5 (5.4%) |
| 65 to 74 Years | 7 (12.3%) | 19 (17.3%) |
| 75 Years and over | 56 (43.8%) | 84 (34.8%) |
Disability Class by Sex by Age in Lilydale
Disability Class: Hearing Difficulty
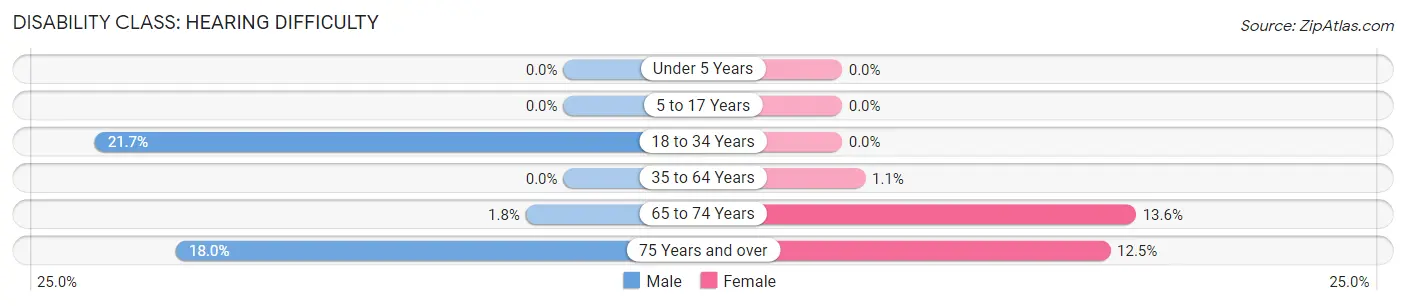
| Age Bracket | Male | Female |
| Under 5 Years | 0 (0.0%) | 0 (0.0%) |
| 5 to 17 Years | 0 (0.0%) | 0 (0.0%) |
| 18 to 34 Years | 5 (21.7%) | 0 (0.0%) |
| 35 to 64 Years | 0 (0.0%) | 1 (1.1%) |
| 65 to 74 Years | 1 (1.8%) | 15 (13.6%) |
| 75 Years and over | 23 (18.0%) | 30 (12.4%) |
Disability Class: Vision Difficulty
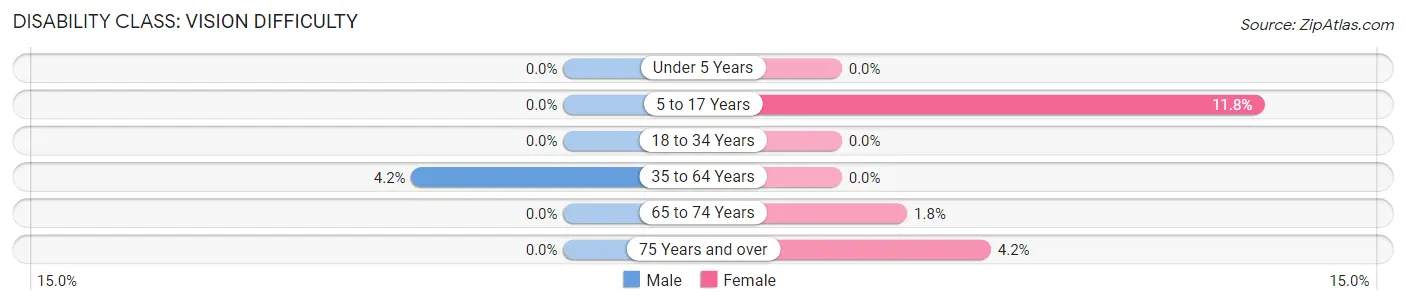
| Age Bracket | Male | Female |
| Under 5 Years | 0 (0.0%) | 0 (0.0%) |
| 5 to 17 Years | 0 (0.0%) | 2 (11.8%) |
| 18 to 34 Years | 0 (0.0%) | 0 (0.0%) |
| 35 to 64 Years | 3 (4.2%) | 0 (0.0%) |
| 65 to 74 Years | 0 (0.0%) | 2 (1.8%) |
| 75 Years and over | 0 (0.0%) | 10 (4.2%) |
Disability Class: Cognitive Difficulty
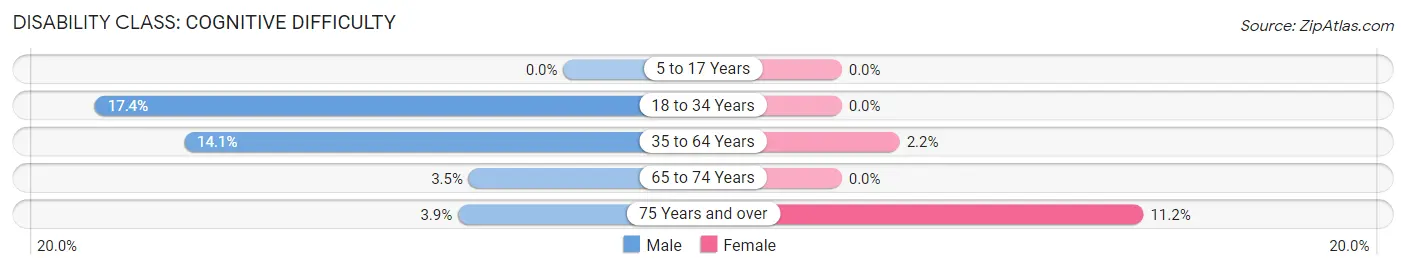
| Age Bracket | Male | Female |
| 5 to 17 Years | 0 (0.0%) | 0 (0.0%) |
| 18 to 34 Years | 4 (17.4%) | 0 (0.0%) |
| 35 to 64 Years | 10 (14.1%) | 2 (2.1%) |
| 65 to 74 Years | 2 (3.5%) | 0 (0.0%) |
| 75 Years and over | 5 (3.9%) | 27 (11.2%) |
Disability Class: Ambulatory Difficulty
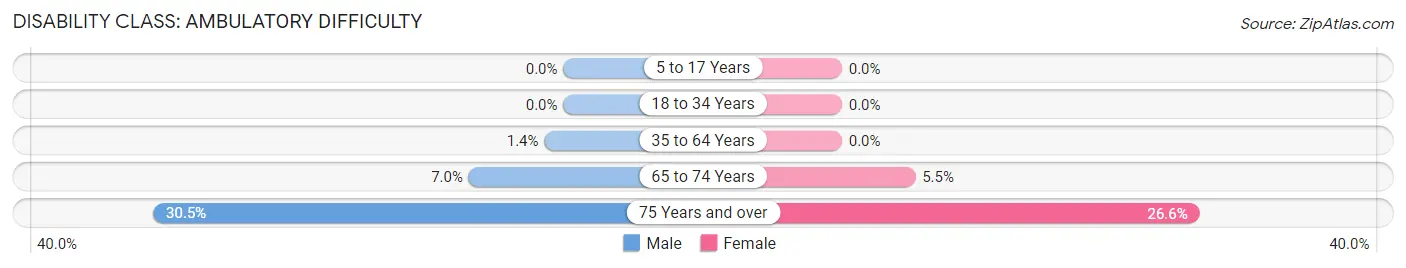
| Age Bracket | Male | Female |
| 5 to 17 Years | 0 (0.0%) | 0 (0.0%) |
| 18 to 34 Years | 0 (0.0%) | 0 (0.0%) |
| 35 to 64 Years | 1 (1.4%) | 0 (0.0%) |
| 65 to 74 Years | 4 (7.0%) | 6 (5.4%) |
| 75 Years and over | 39 (30.5%) | 64 (26.6%) |
Disability Class: Self-Care Difficulty
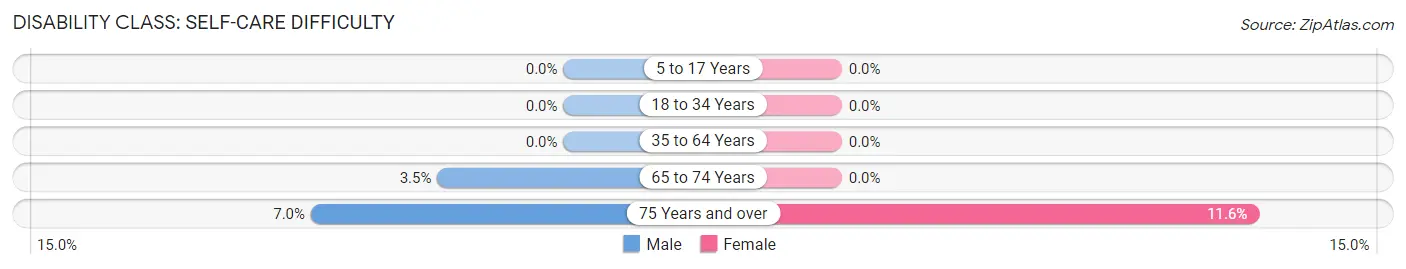
| Age Bracket | Male | Female |
| 5 to 17 Years | 0 (0.0%) | 0 (0.0%) |
| 18 to 34 Years | 0 (0.0%) | 0 (0.0%) |
| 35 to 64 Years | 0 (0.0%) | 0 (0.0%) |
| 65 to 74 Years | 2 (3.5%) | 0 (0.0%) |
| 75 Years and over | 9 (7.0%) | 28 (11.6%) |
Technology Access in Lilydale
Computing Device Access in Lilydale
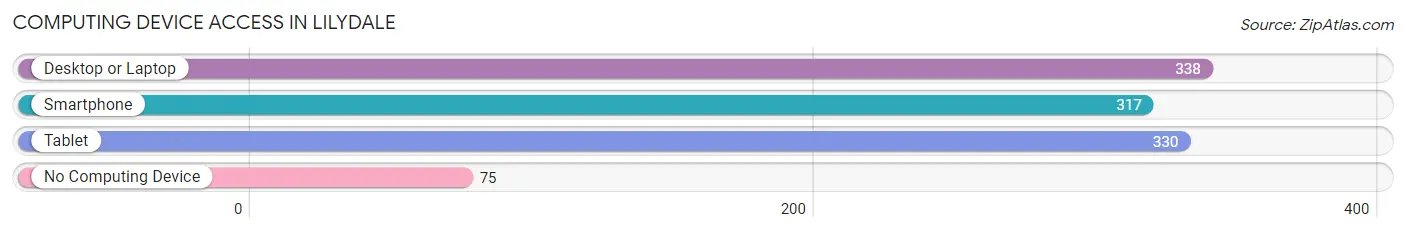
| Device Type | # Households | % Households |
| Desktop or Laptop | 338 | 65.8% |
| Smartphone | 317 | 61.7% |
| Tablet | 330 | 64.2% |
| No Computing Device | 75 | 14.6% |
| Total | 514 | 100.0% |
Internet Access in Lilydale
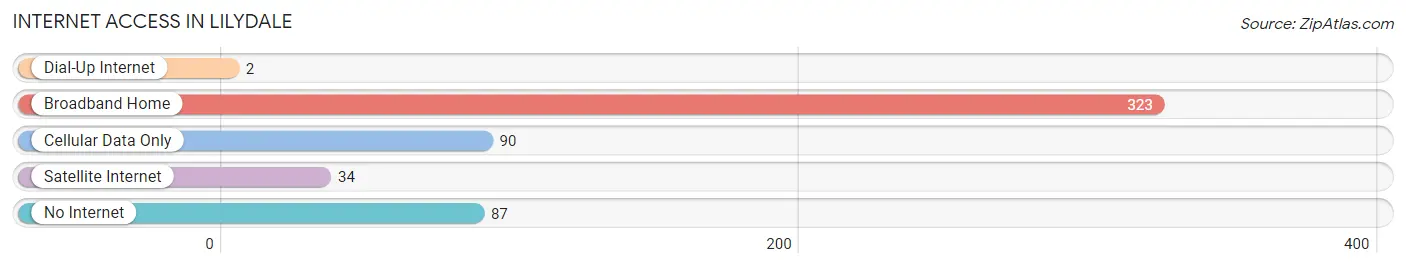
| Internet Type | # Households | % Households |
| Dial-Up Internet | 2 | 0.4% |
| Broadband Home | 323 | 62.8% |
| Cellular Data Only | 90 | 17.5% |
| Satellite Internet | 34 | 6.6% |
| No Internet | 87 | 16.9% |
| Total | 514 | 100.0% |
Lilydale Summary
Lilydale, Minnesota is a small city located in the Twin Cities metropolitan area of Minnesota. It is located in the southeastern corner of Ramsey County, just north of the Mississippi River. The city is bordered by the cities of St. Paul, Maplewood, and North St. Paul. The population of Lilydale was 8,845 at the 2010 census.
History
Lilydale was first settled in 1854 by a group of French-Canadian immigrants. The city was named after the lilies that grew in the area. The first post office was established in 1856. In 1872, the first railroad line was built through the city, connecting it to St. Paul.
In the late 19th century, Lilydale was a popular summer resort destination for wealthy St. Paul residents. The city was home to several large resorts, including the Lilydale Hotel, which was built in 1887. The hotel was destroyed by fire in 1895.
In the early 20th century, Lilydale became a popular destination for immigrants from Eastern Europe. The city was home to a large Jewish population, and several synagogues were built in the area.
Geography
Lilydale is located in the southeastern corner of Ramsey County, just north of the Mississippi River. The city is bordered by the cities of St. Paul, Maplewood, and North St. Paul. The city has a total area of 2.2 square miles, all of which is land.
The city is located in the St. Croix River Valley, and is surrounded by rolling hills and bluffs. The city is located in the Anoka Sand Plain, which is composed of sandy soils.
Economy
Lilydale is home to several large employers, including 3M, Xcel Energy, and the University of Minnesota. The city is also home to several small businesses, including restaurants, retail stores, and professional services.
The city is home to several industrial parks, including the Lilydale Industrial Park and the St. Paul Industrial Park. The city is also home to several large shopping centers, including the Rosedale Shopping Center and the Maplewood Mall.
Demographics
As of the 2010 census, the population of Lilydale was 8,845. The racial makeup of the city was 79.2% White, 8.3% African American, 0.3% Native American, 5.2% Asian, 0.1% Pacific Islander, 4.2% from other races, and 2.8% from two or more races. Hispanic or Latino of any race were 8.7% of the population.
The median income for a household in the city was $50,945, and the median income for a family was $60,945. The per capita income for the city was $25,945. About 8.2% of families and 10.2% of the population were below the poverty line, including 14.2% of those under age 18 and 6.2% of those age 65 or over.
Common Questions
What is Per Capita Income in Lilydale?
Per Capita income in Lilydale is $84,631.
What is the Median Family Income in Lilydale?
Median Family Income in Lilydale is $113,125.
What is the Median Household income in Lilydale?
Median Household Income in Lilydale is $86,875.
What is Income or Wage Gap in Lilydale?
Income or Wage Gap in Lilydale is 28.9%.
Women in Lilydale earn 71.1 cents for every dollar earned by a man.
What is Inequality or Gini Index in Lilydale?
Inequality or Gini Index in Lilydale is 0.50.
What is the Total Population of Lilydale?
Total Population of Lilydale is 761.
What is the Total Male Population of Lilydale?
Total Male Population of Lilydale is 288.
What is the Total Female Population of Lilydale?
Total Female Population of Lilydale is 473.
What is the Ratio of Males per 100 Females in Lilydale?
There are 60.89 Males per 100 Females in Lilydale.
What is the Ratio of Females per 100 Males in Lilydale?
There are 164.24 Females per 100 Males in Lilydale.
What is the Median Population Age in Lilydale?
Median Population Age in Lilydale is 74.4 Years.
What is the Average Family Size in Lilydale
Average Family Size in Lilydale is 2.2 People.
What is the Average Household Size in Lilydale
Average Household Size in Lilydale is 1.5 People.
How Large is the Labor Force in Lilydale?
There are 209 People in the Labor Forcein in Lilydale.
What is the Percentage of People in the Labor Force in Lilydale?
28.4% of People are in the Labor Force in Lilydale.
What is the Unemployment Rate in Lilydale?
Unemployment Rate in Lilydale is 5.7%.