Lansing, IA Map & Demographics
Lansing Map
Lansing Overview
$31,202
PER CAPITA INCOME
$49,286
AVG FAMILY INCOME
$47,730
AVG HOUSEHOLD INCOME
17.9%
WAGE / INCOME GAP [ % ]
82.1¢/ $1
WAGE / INCOME GAP [ $ ]
0.47
INEQUALITY / GINI INDEX
1,053
TOTAL POPULATION
508
MALE POPULATION
545
FEMALE POPULATION
93.21
MALES / 100 FEMALES
107.28
FEMALES / 100 MALES
49.5
MEDIAN AGE
2.8
AVG FAMILY SIZE
2.2
AVG HOUSEHOLD SIZE
486
LABOR FORCE [ PEOPLE ]
57.2%
PERCENT IN LABOR FORCE
4.9%
UNEMPLOYMENT RATE
Lansing Zip Codes
Lansing Area Codes
Income in Lansing
Income Overview in Lansing
Per Capita Income in Lansing is $31,202, while median incomes of families and households are $49,286 and $47,730 respectively.
| Characteristic | Number | Measure |
| Per Capita Income | 1,053 | $31,202 |
| Median Family Income | 272 | $49,286 |
| Mean Family Income | 272 | $89,260 |
| Median Household Income | 461 | $47,730 |
| Mean Household Income | 461 | $70,025 |
| Income Deficit | 272 | $0 |
| Wage / Income Gap (%) | 1,053 | 17.93% |
| Wage / Income Gap ($) | 1,053 | 82.07¢ per $1 |
| Gini / Inequality Index | 1,053 | 0.47 |
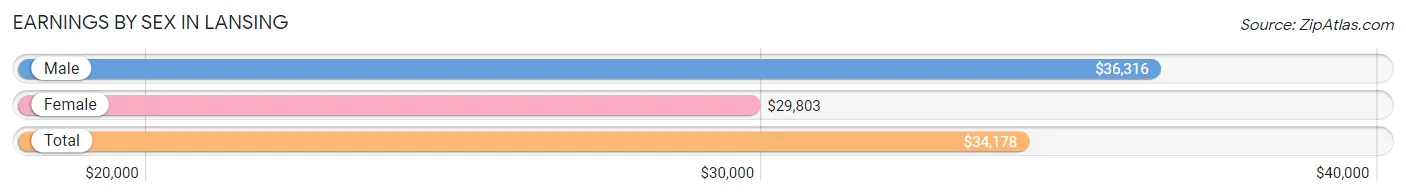
Earnings by Sex in Lansing
Average Earnings in Lansing are $34,178, $36,316 for men and $29,803 for women, a difference of 17.9%.
| Sex | Number | Average Earnings |
| Male | 270 (56.1%) | $36,316 |
| Female | 211 (43.9%) | $29,803 |
| Total | 481 (100.0%) | $34,178 |
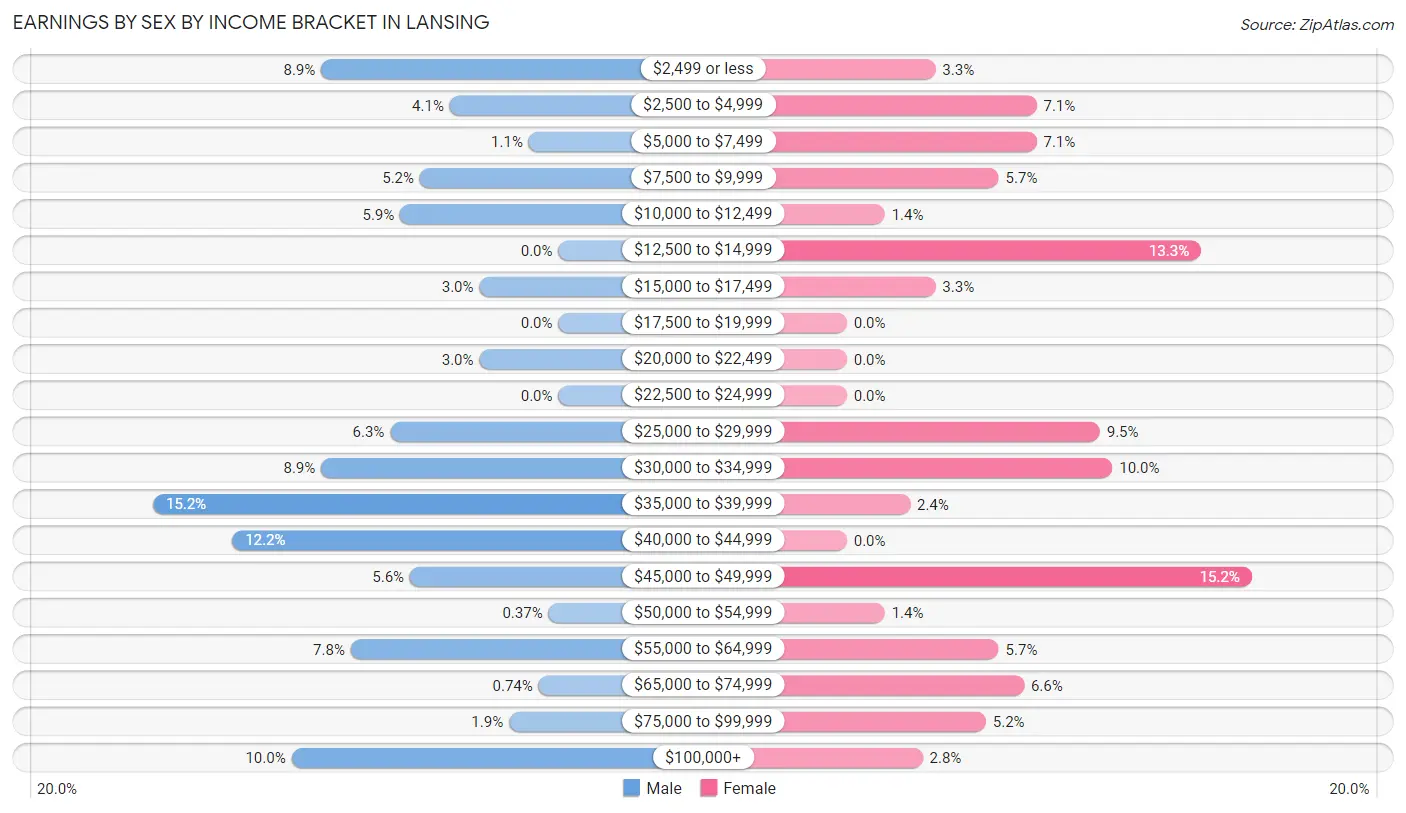
Earnings by Sex by Income Bracket in Lansing
The most common earnings brackets in Lansing are $35,000 to $39,999 for men (41 | 15.2%) and $45,000 to $49,999 for women (32 | 15.2%).
| Income | Male | Female |
| $2,499 or less | 24 (8.9%) | 7 (3.3%) |
| $2,500 to $4,999 | 11 (4.1%) | 15 (7.1%) |
| $5,000 to $7,499 | 3 (1.1%) | 15 (7.1%) |
| $7,500 to $9,999 | 14 (5.2%) | 12 (5.7%) |
| $10,000 to $12,499 | 16 (5.9%) | 3 (1.4%) |
| $12,500 to $14,999 | 0 (0.0%) | 28 (13.3%) |
| $15,000 to $17,499 | 8 (3.0%) | 7 (3.3%) |
| $17,500 to $19,999 | 0 (0.0%) | 0 (0.0%) |
| $20,000 to $22,499 | 8 (3.0%) | 0 (0.0%) |
| $22,500 to $24,999 | 0 (0.0%) | 0 (0.0%) |
| $25,000 to $29,999 | 17 (6.3%) | 20 (9.5%) |
| $30,000 to $34,999 | 24 (8.9%) | 21 (10.0%) |
| $35,000 to $39,999 | 41 (15.2%) | 5 (2.4%) |
| $40,000 to $44,999 | 33 (12.2%) | 0 (0.0%) |
| $45,000 to $49,999 | 15 (5.6%) | 32 (15.2%) |
| $50,000 to $54,999 | 1 (0.4%) | 3 (1.4%) |
| $55,000 to $64,999 | 21 (7.8%) | 12 (5.7%) |
| $65,000 to $74,999 | 2 (0.7%) | 14 (6.6%) |
| $75,000 to $99,999 | 5 (1.8%) | 11 (5.2%) |
| $100,000+ | 27 (10.0%) | 6 (2.8%) |
| Total | 270 (100.0%) | 211 (100.0%) |
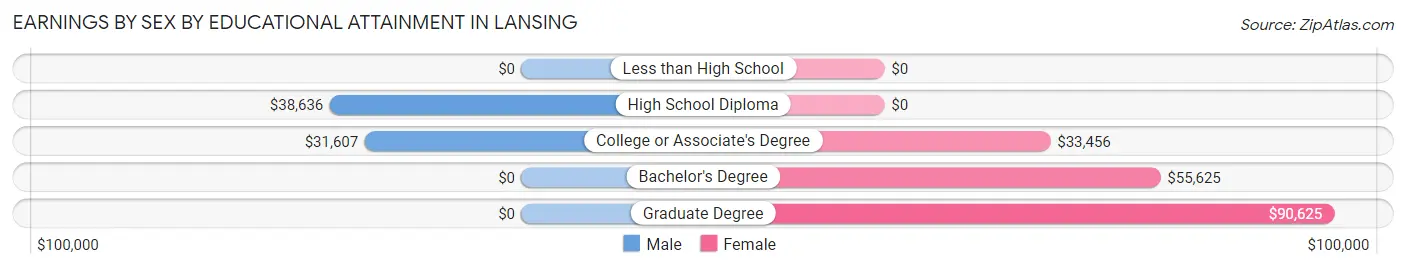
Earnings by Sex by Educational Attainment in Lansing
Average earnings in Lansing are $36,447 for men and $33,274 for women, a difference of 8.7%. Men with an educational attainment of high school diploma enjoy the highest average annual earnings of $38,636, while those with college or associate's degree education earn the least with $31,607. Women with an educational attainment of graduate degree earn the most with the average annual earnings of $90,625, while those with college or associate's degree education have the smallest earnings of $33,456.
| Educational Attainment | Male Income | Female Income |
| Less than High School | - | - |
| High School Diploma | $38,636 | $0 |
| College or Associate's Degree | $31,607 | $33,456 |
| Bachelor's Degree | - | - |
| Graduate Degree | - | - |
| Total | $36,447 | $33,274 |
Family Income in Lansing
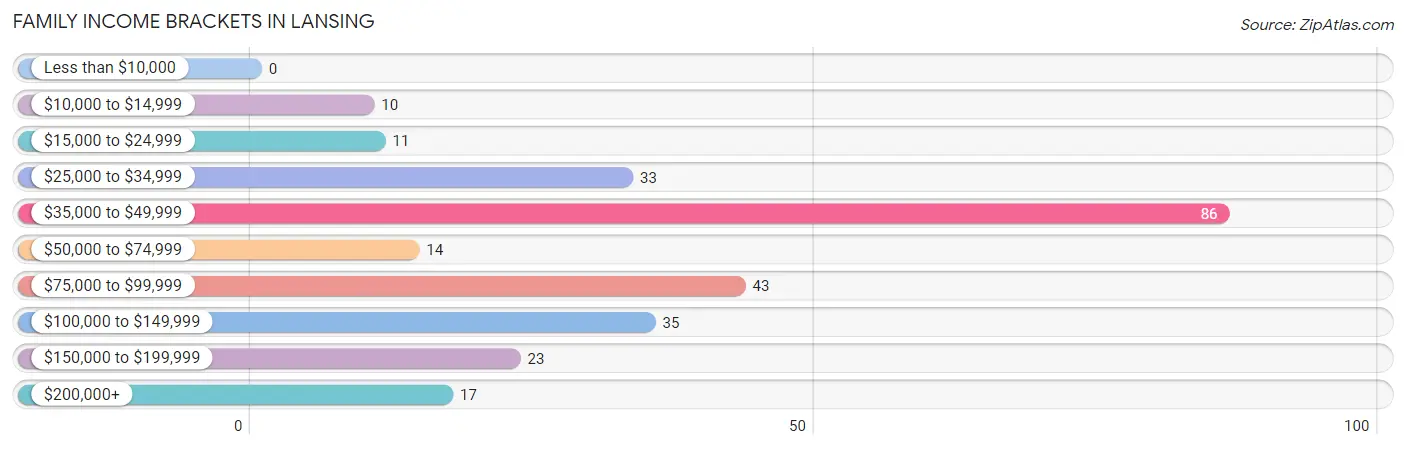
Family Income Brackets in Lansing
According to the Lansing family income data, there are 86 families falling into the $35,000 to $49,999 income range, which is the most common income bracket and makes up 31.6% of all families.
| Income Bracket | # Families | % Families |
| Less than $10,000 | 0 | 0.0% |
| $10,000 to $14,999 | 10 | 3.7% |
| $15,000 to $24,999 | 11 | 4.0% |
| $25,000 to $34,999 | 33 | 12.1% |
| $35,000 to $49,999 | 86 | 31.6% |
| $50,000 to $74,999 | 14 | 5.1% |
| $75,000 to $99,999 | 43 | 15.8% |
| $100,000 to $149,999 | 35 | 12.9% |
| $150,000 to $199,999 | 23 | 8.5% |
| $200,000+ | 17 | 6.3% |
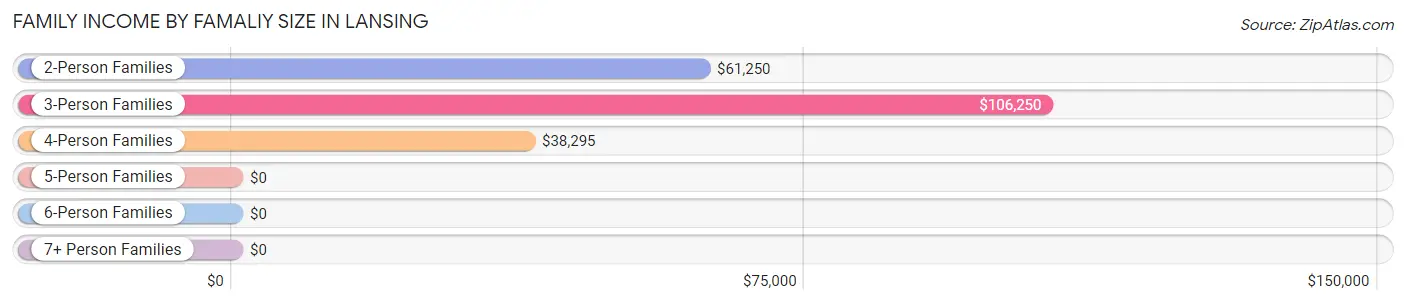
Family Income by Famaliy Size in Lansing
3-person families (27 | 9.9%) account for the highest median family income in Lansing with $106,250 per family, while 3-person families (27 | 9.9%) have the highest median income of $35,417 per family member.
| Income Bracket | # Families | Median Income |
| 2-Person Families | 150 (55.1%) | $61,250 |
| 3-Person Families | 27 (9.9%) | $106,250 |
| 4-Person Families | 82 (30.1%) | $38,295 |
| 5-Person Families | 8 (2.9%) | $0 |
| 6-Person Families | 5 (1.8%) | $0 |
| 7+ Person Families | 0 (0.0%) | $0 |
| Total | 272 (100.0%) | $49,286 |
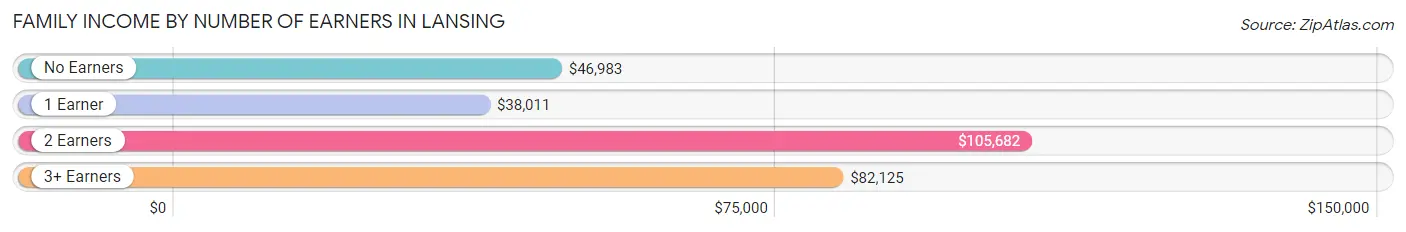
Family Income by Number of Earners in Lansing
The median family income in Lansing is $49,286, with families comprising 2 earners (78) having the highest median family income of $105,682, while families with 1 earner (99) have the lowest median family income of $38,011, accounting for 28.7% and 36.4% of families, respectively.
| Number of Earners | # Families | Median Income |
| No Earners | 70 (25.7%) | $46,983 |
| 1 Earner | 99 (36.4%) | $38,011 |
| 2 Earners | 78 (28.7%) | $105,682 |
| 3+ Earners | 25 (9.2%) | $82,125 |
| Total | 272 (100.0%) | $49,286 |
Household Income in Lansing
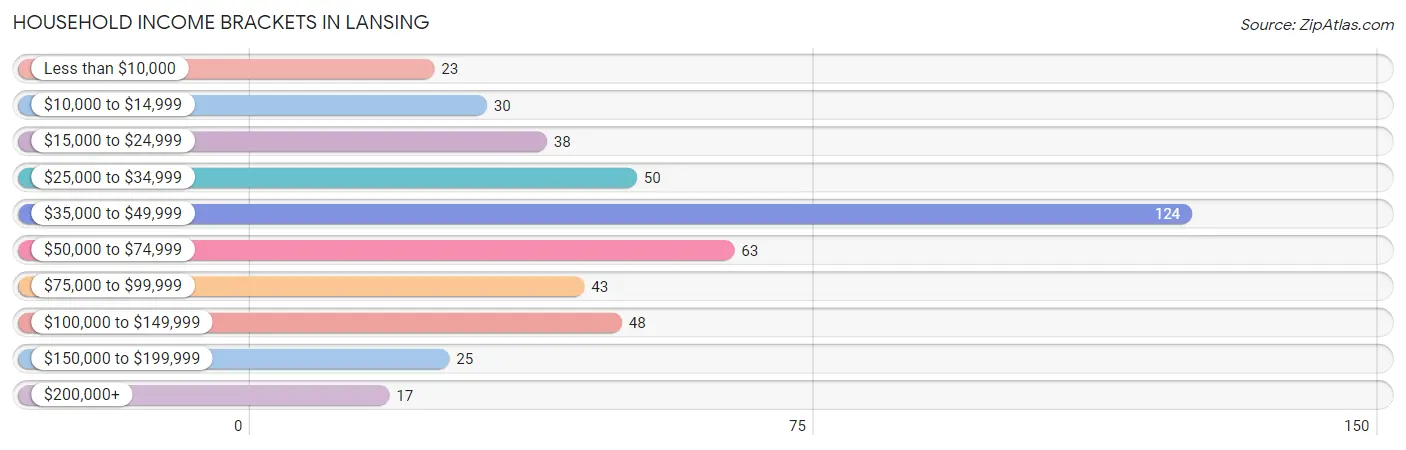
Household Income Brackets in Lansing
With 124 households falling in the category, the $35,000 to $49,999 income range is the most frequent in Lansing, accounting for 26.9% of all households. In contrast, only 17 households (3.7%) fall into the $200,000+ income bracket, making it the least populous group.
| Income Bracket | # Households | % Households |
| Less than $10,000 | 23 | 5.0% |
| $10,000 to $14,999 | 30 | 6.5% |
| $15,000 to $24,999 | 38 | 8.2% |
| $25,000 to $34,999 | 50 | 10.8% |
| $35,000 to $49,999 | 124 | 26.9% |
| $50,000 to $74,999 | 63 | 13.7% |
| $75,000 to $99,999 | 43 | 9.3% |
| $100,000 to $149,999 | 48 | 10.4% |
| $150,000 to $199,999 | 25 | 5.4% |
| $200,000+ | 17 | 3.7% |
Household Income by Householder Age in Lansing
The median household income in Lansing is $47,730, with the highest median household income of $66,786 found in the 45 to 64 years age bracket for the primary householder. A total of 170 households (36.9%) fall into this category. Meanwhile, the 15 to 24 years age bracket for the primary householder has the lowest median household income of $0, with 17 households (3.7%) in this group.
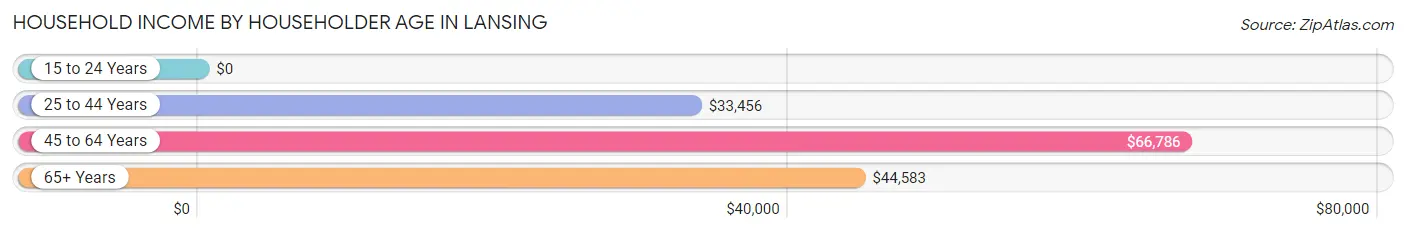
| Income Bracket | # Households | Median Income |
| 15 to 24 Years | 17 (3.7%) | $0 |
| 25 to 44 Years | 89 (19.3%) | $33,456 |
| 45 to 64 Years | 170 (36.9%) | $66,786 |
| 65+ Years | 185 (40.1%) | $44,583 |
| Total | 461 (100.0%) | $47,730 |
Poverty in Lansing
Income Below Poverty by Sex and Age in Lansing
With 18.9% poverty level for males and 25.4% for females among the residents of Lansing, 6 to 11 year old males and 18 to 24 year old females are the most vulnerable to poverty, with 15 males (100.0%) and 11 females (100.0%) in their respective age groups living below the poverty level.
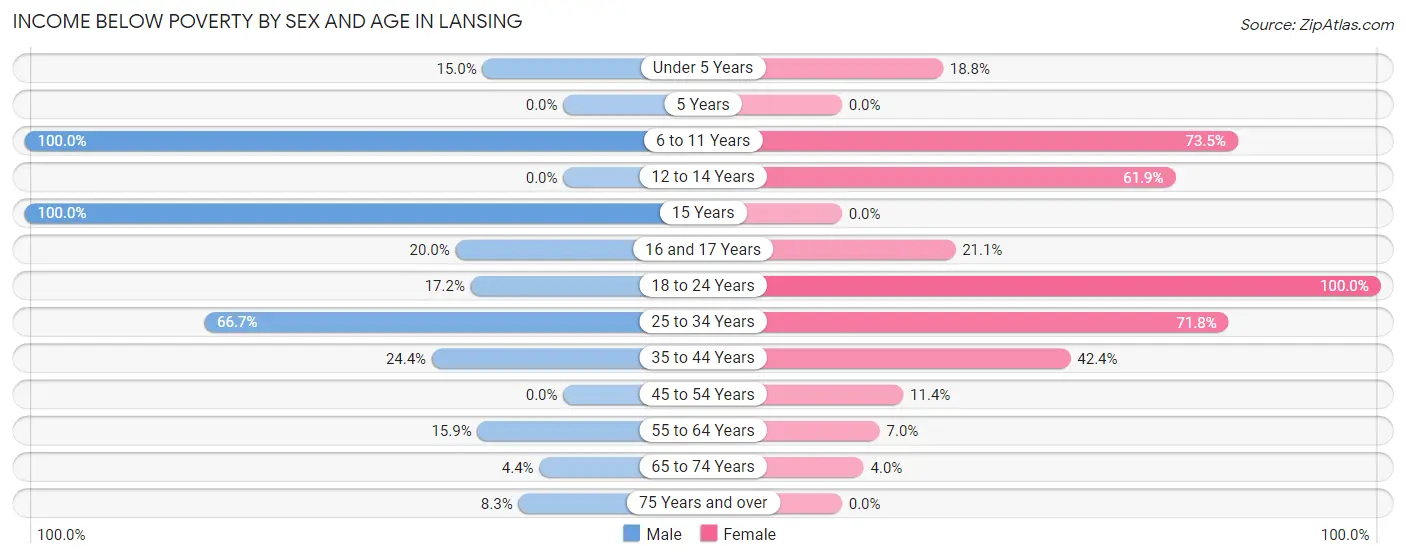
| Age Bracket | Male | Female |
| Under 5 Years | 6 (15.0%) | 12 (18.8%) |
| 5 Years | 0 (0.0%) | 0 (0.0%) |
| 6 to 11 Years | 15 (100.0%) | 36 (73.5%) |
| 12 to 14 Years | 0 (0.0%) | 13 (61.9%) |
| 15 Years | 9 (100.0%) | 0 (0.0%) |
| 16 and 17 Years | 4 (20.0%) | 4 (21.0%) |
| 18 to 24 Years | 11 (17.2%) | 11 (100.0%) |
| 25 to 34 Years | 18 (66.7%) | 28 (71.8%) |
| 35 to 44 Years | 10 (24.4%) | 14 (42.4%) |
| 45 to 54 Years | 0 (0.0%) | 9 (11.4%) |
| 55 to 64 Years | 11 (15.9%) | 4 (7.0%) |
| 65 to 74 Years | 4 (4.4%) | 4 (4.0%) |
| 75 Years and over | 3 (8.3%) | 0 (0.0%) |
| Total | 91 (18.9%) | 135 (25.4%) |
Income Above Poverty by Sex and Age in Lansing
According to the poverty statistics in Lansing, males aged 45 to 54 years and females aged 5 years are the age groups that are most secure financially, with 100.0% of males and 100.0% of females in these age groups living above the poverty line.
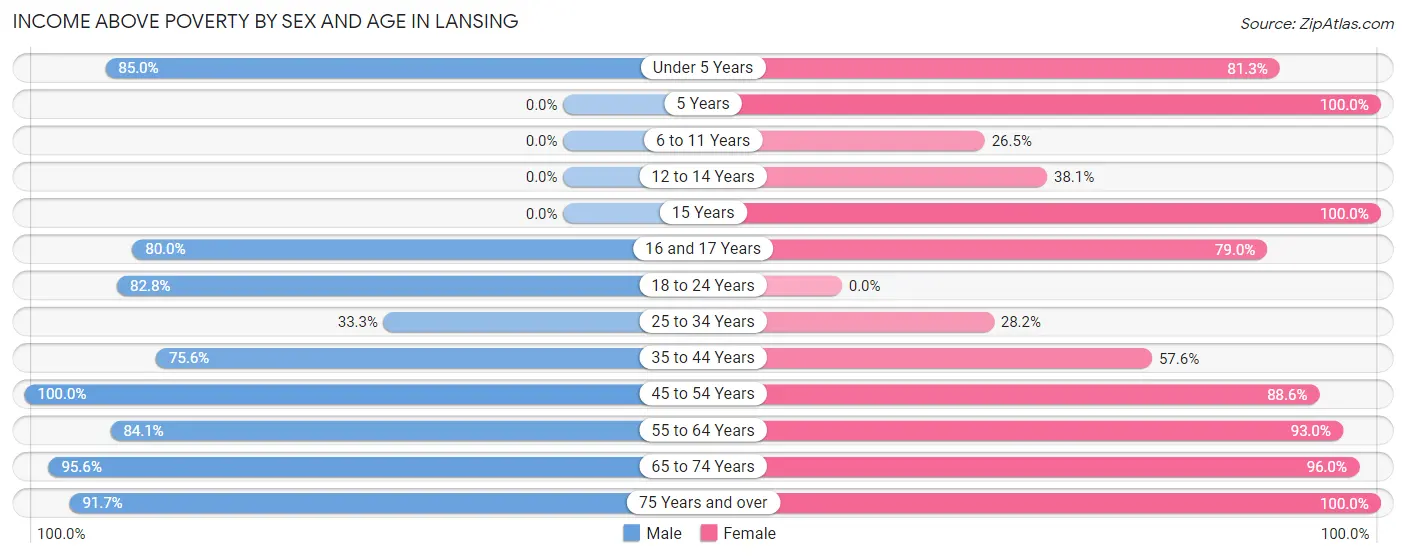
| Age Bracket | Male | Female |
| Under 5 Years | 34 (85.0%) | 52 (81.2%) |
| 5 Years | 0 (0.0%) | 2 (100.0%) |
| 6 to 11 Years | 0 (0.0%) | 13 (26.5%) |
| 12 to 14 Years | 0 (0.0%) | 8 (38.1%) |
| 15 Years | 0 (0.0%) | 4 (100.0%) |
| 16 and 17 Years | 16 (80.0%) | 15 (78.9%) |
| 18 to 24 Years | 53 (82.8%) | 0 (0.0%) |
| 25 to 34 Years | 9 (33.3%) | 11 (28.2%) |
| 35 to 44 Years | 31 (75.6%) | 19 (57.6%) |
| 45 to 54 Years | 70 (100.0%) | 70 (88.6%) |
| 55 to 64 Years | 58 (84.1%) | 53 (93.0%) |
| 65 to 74 Years | 86 (95.6%) | 95 (96.0%) |
| 75 Years and over | 33 (91.7%) | 55 (100.0%) |
| Total | 390 (81.1%) | 397 (74.6%) |
Income Below Poverty Among Married-Couple Families in Lansing
The poverty statistics for married-couple families in Lansing show that 7.1% or 13 of the total 182 families live below the poverty line. Families with 3 or 4 children have the highest poverty rate of 100.0%, comprising of 13 families. On the other hand, families with no children have the lowest poverty rate of 0.0%, which includes 0 families.
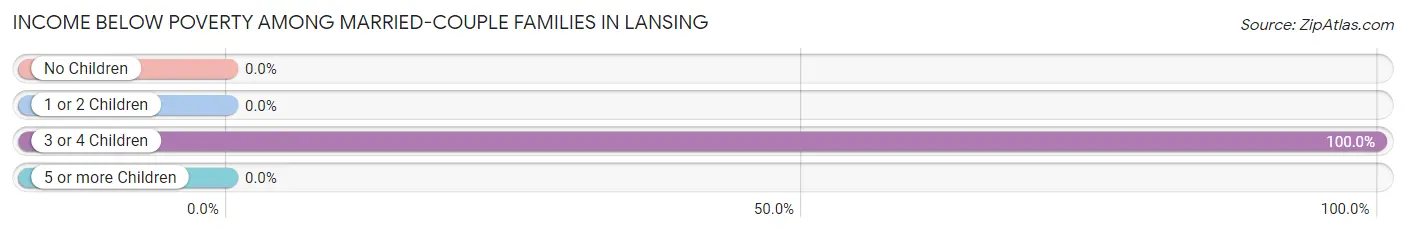
| Children | Above Poverty | Below Poverty |
| No Children | 132 (100.0%) | 0 (0.0%) |
| 1 or 2 Children | 37 (100.0%) | 0 (0.0%) |
| 3 or 4 Children | 0 (0.0%) | 13 (100.0%) |
| 5 or more Children | 0 (0.0%) | 0 (0.0%) |
| Total | 169 (92.9%) | 13 (7.1%) |
Income Below Poverty Among Single-Parent Households in Lansing
According to the poverty data in Lansing, 17.0% or 10 single-father households and 45.2% or 14 single-mother households are living below the poverty line. Among single-father households, those with no children have the highest poverty rate, with 10 households (47.6%) experiencing poverty. Likewise, among single-mother households, those with 3 or 4 children have the highest poverty rate, with 14 households (100.0%) falling below the poverty line.
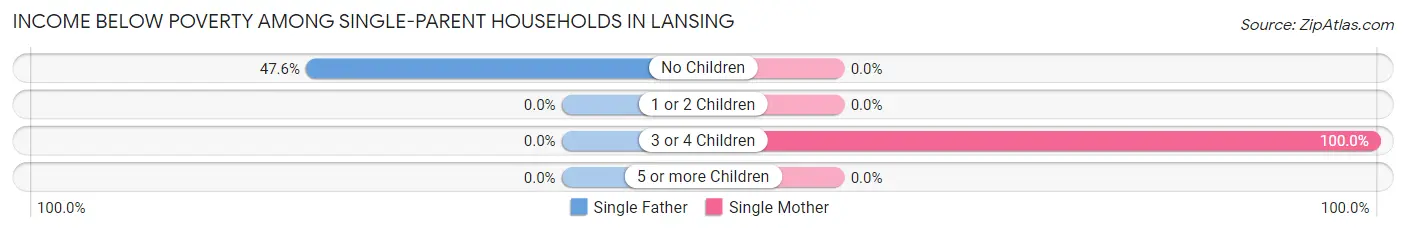
| Children | Single Father | Single Mother |
| No Children | 10 (47.6%) | 0 (0.0%) |
| 1 or 2 Children | 0 (0.0%) | 0 (0.0%) |
| 3 or 4 Children | 0 (0.0%) | 14 (100.0%) |
| 5 or more Children | 0 (0.0%) | 0 (0.0%) |
| Total | 10 (17.0%) | 14 (45.2%) |
Income Below Poverty Among Married-Couple vs Single-Parent Households in Lansing
The poverty data for Lansing shows that 13 of the married-couple family households (7.1%) and 24 of the single-parent households (26.7%) are living below the poverty level. Within the married-couple family households, those with 3 or 4 children have the highest poverty rate, with 13 households (100.0%) falling below the poverty line. Among the single-parent households, those with 3 or 4 children have the highest poverty rate, with 14 household (26.9%) living below poverty.
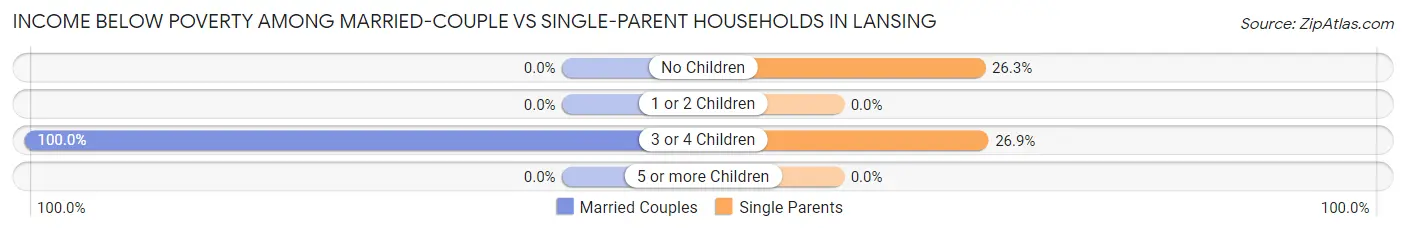
| Children | Married-Couple Families | Single-Parent Households |
| No Children | 0 (0.0%) | 10 (26.3%) |
| 1 or 2 Children | 0 (0.0%) | 0 (0.0%) |
| 3 or 4 Children | 13 (100.0%) | 14 (26.9%) |
| 5 or more Children | 0 (0.0%) | 0 (0.0%) |
| Total | 13 (7.1%) | 24 (26.7%) |
Race in Lansing
The most populous races in Lansing are White / Caucasian (1,029 | 97.7%), Black / African American (15 | 1.4%), and Hispanic or Latino (9 | 0.9%).
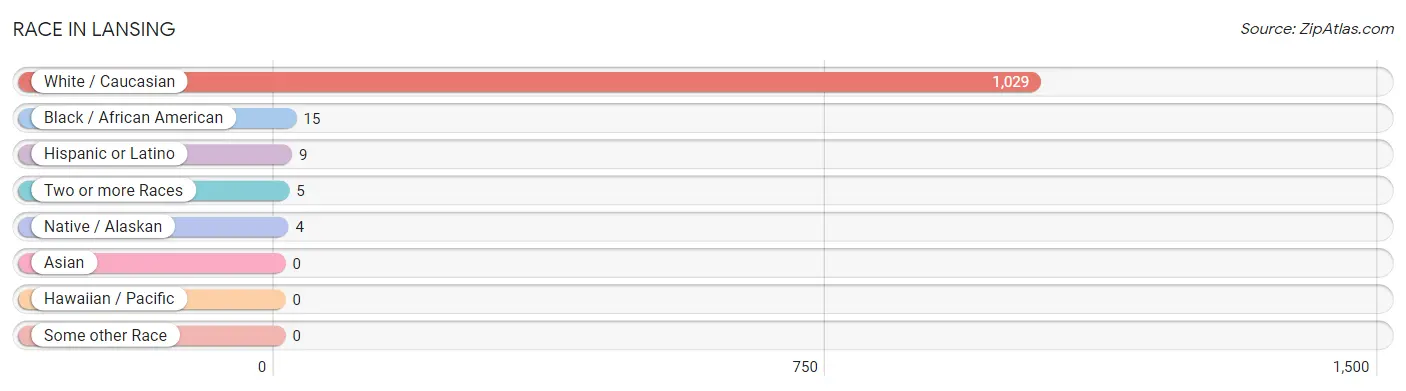
| Race | # Population | % Population |
| Asian | 0 | 0.0% |
| Black / African American | 15 | 1.4% |
| Hawaiian / Pacific | 0 | 0.0% |
| Hispanic or Latino | 9 | 0.9% |
| Native / Alaskan | 4 | 0.4% |
| White / Caucasian | 1,029 | 97.7% |
| Two or more Races | 5 | 0.5% |
| Some other Race | 0 | 0.0% |
| Total | 1,053 | 100.0% |
Ancestry in Lansing
The most populous ancestries reported in Lansing are German (568 | 53.9%), Irish (227 | 21.6%), Norwegian (106 | 10.1%), English (59 | 5.6%), and Welsh (49 | 4.6%), together accounting for 95.8% of all Lansing residents.
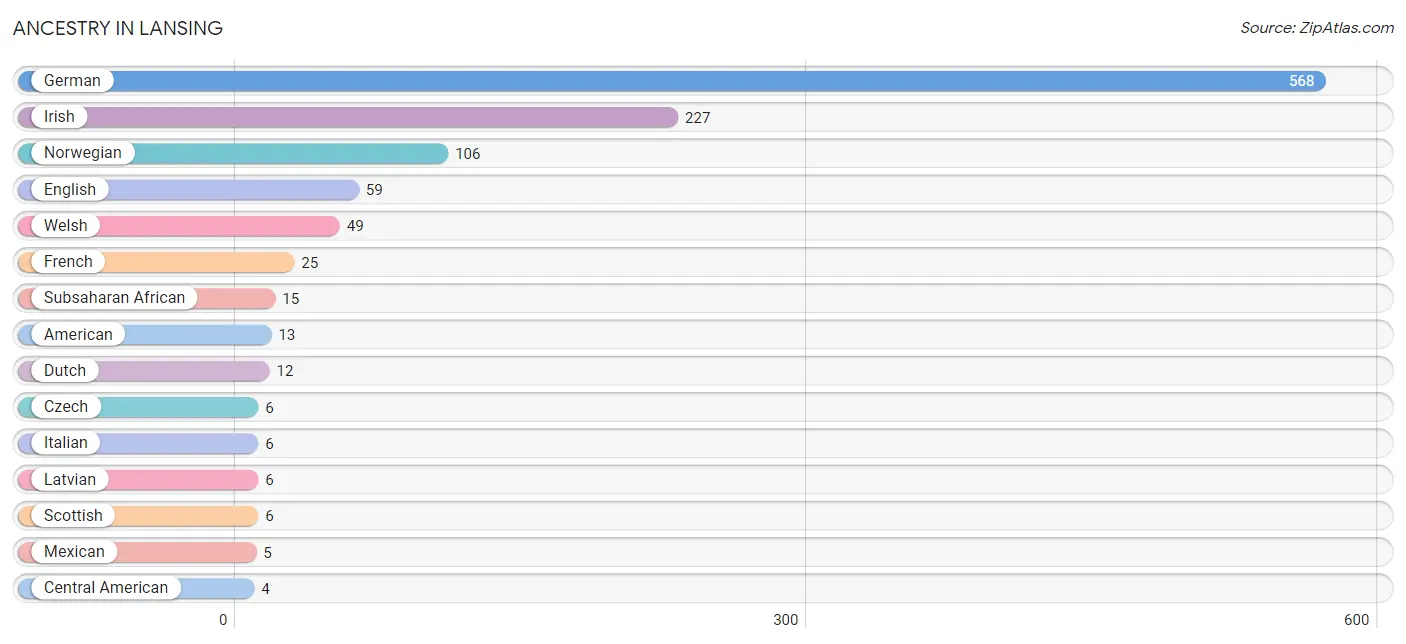
| Ancestry | # Population | % Population |
| American | 13 | 1.2% |
| Central American | 4 | 0.4% |
| Central American Indian | 4 | 0.4% |
| Czech | 6 | 0.6% |
| Danish | 3 | 0.3% |
| Dutch | 12 | 1.1% |
| English | 59 | 5.6% |
| French | 25 | 2.4% |
| German | 568 | 53.9% |
| Guatemalan | 4 | 0.4% |
| Irish | 227 | 21.6% |
| Italian | 6 | 0.6% |
| Latvian | 6 | 0.6% |
| Mexican | 5 | 0.5% |
| Norwegian | 106 | 10.1% |
| Polish | 3 | 0.3% |
| Scottish | 6 | 0.6% |
| Slovene | 3 | 0.3% |
| Subsaharan African | 15 | 1.4% |
| Swiss | 4 | 0.4% |
| Welsh | 49 | 4.6% | View All 21 Rows |
Immigrants in Lansing
The most numerous immigrant groups reported in Lansing came from Africa (15 | 1.4%), Middle Africa (15 | 1.4%), Zaire (15 | 1.4%), Central America (5 | 0.5%), and Latin America (5 | 0.5%), together accounting for 5.2% of all Lansing residents.
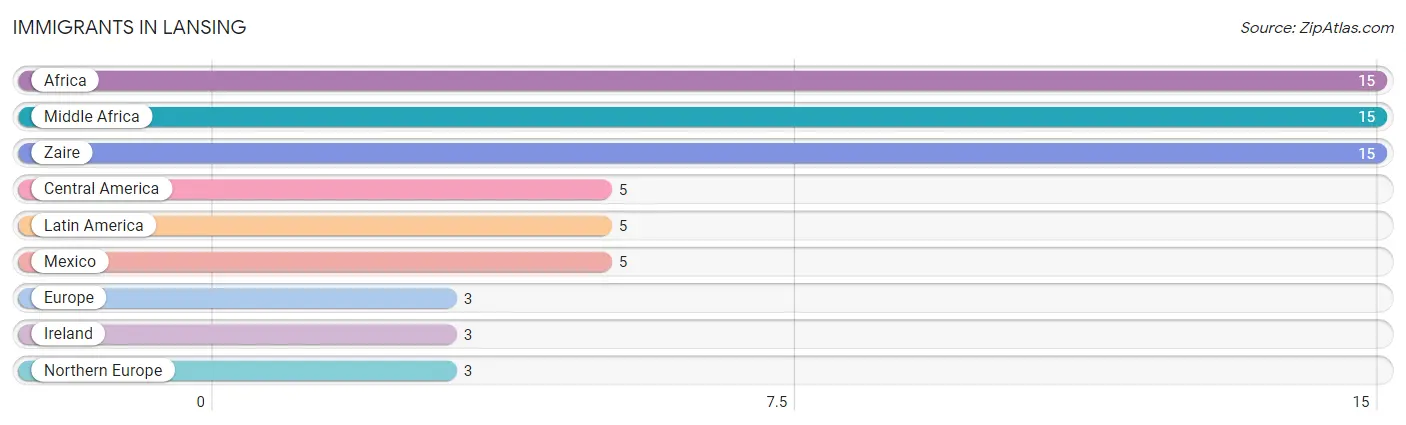
| Immigration Origin | # Population | % Population |
| Africa | 15 | 1.4% |
| Central America | 5 | 0.5% |
| Europe | 3 | 0.3% |
| Ireland | 3 | 0.3% |
| Latin America | 5 | 0.5% |
| Mexico | 5 | 0.5% |
| Middle Africa | 15 | 1.4% |
| Northern Europe | 3 | 0.3% |
| Zaire | 15 | 1.4% | View All 9 Rows |
Sex and Age in Lansing
Sex and Age in Lansing
The most populous age groups in Lansing are 65 to 69 Years (69 | 13.6%) for men and Under 5 Years (64 | 11.7%) for women.
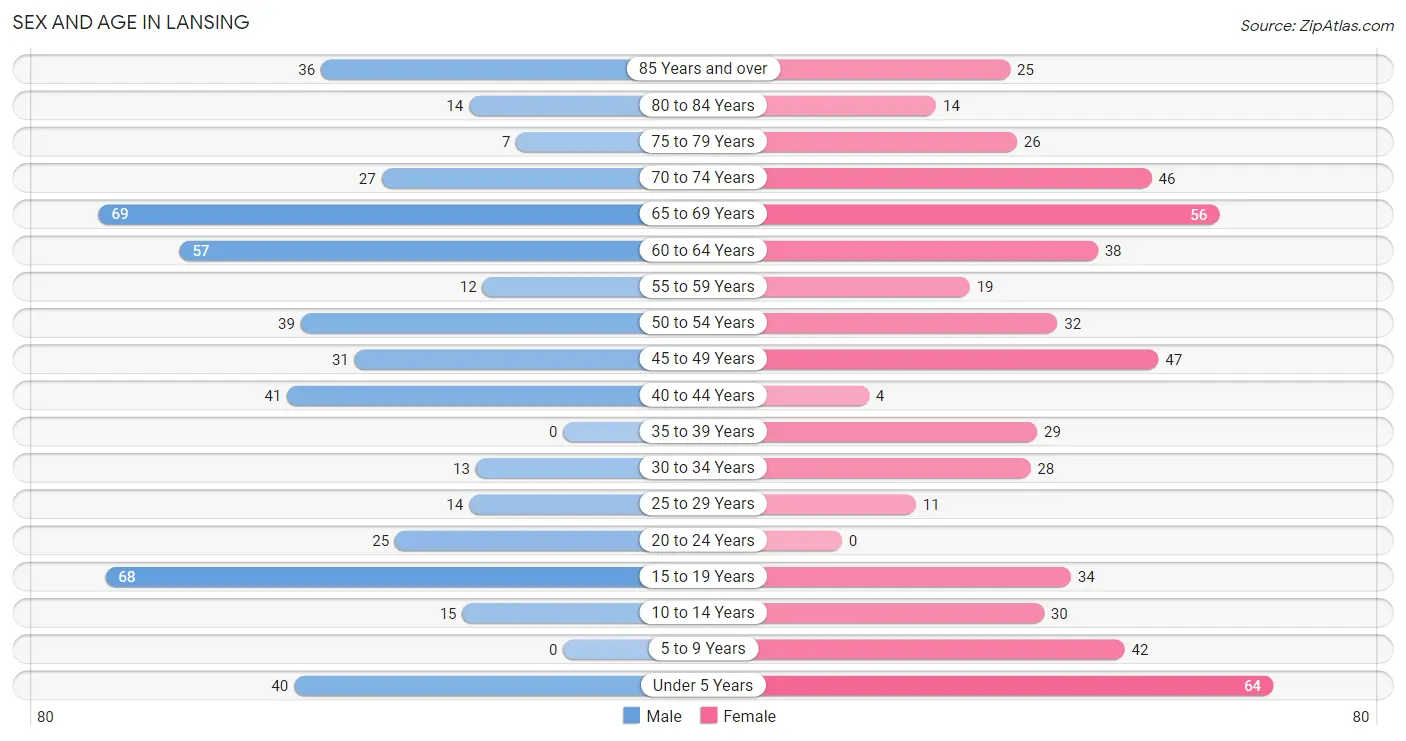
| Age Bracket | Male | Female |
| Under 5 Years | 40 (7.9%) | 64 (11.7%) |
| 5 to 9 Years | 0 (0.0%) | 42 (7.7%) |
| 10 to 14 Years | 15 (2.9%) | 30 (5.5%) |
| 15 to 19 Years | 68 (13.4%) | 34 (6.2%) |
| 20 to 24 Years | 25 (4.9%) | 0 (0.0%) |
| 25 to 29 Years | 14 (2.8%) | 11 (2.0%) |
| 30 to 34 Years | 13 (2.6%) | 28 (5.1%) |
| 35 to 39 Years | 0 (0.0%) | 29 (5.3%) |
| 40 to 44 Years | 41 (8.1%) | 4 (0.7%) |
| 45 to 49 Years | 31 (6.1%) | 47 (8.6%) |
| 50 to 54 Years | 39 (7.7%) | 32 (5.9%) |
| 55 to 59 Years | 12 (2.4%) | 19 (3.5%) |
| 60 to 64 Years | 57 (11.2%) | 38 (7.0%) |
| 65 to 69 Years | 69 (13.6%) | 56 (10.3%) |
| 70 to 74 Years | 27 (5.3%) | 46 (8.4%) |
| 75 to 79 Years | 7 (1.4%) | 26 (4.8%) |
| 80 to 84 Years | 14 (2.8%) | 14 (2.6%) |
| 85 Years and over | 36 (7.1%) | 25 (4.6%) |
| Total | 508 (100.0%) | 545 (100.0%) |
Families and Households in Lansing
Median Family Size in Lansing
The median family size in Lansing is 2.79 persons per family, with single male/father families (59 | 21.7%) accounting for the largest median family size of 2.88 persons per family. On the other hand, single female/mother families (31 | 11.4%) represent the smallest median family size with 2.61 persons per family.
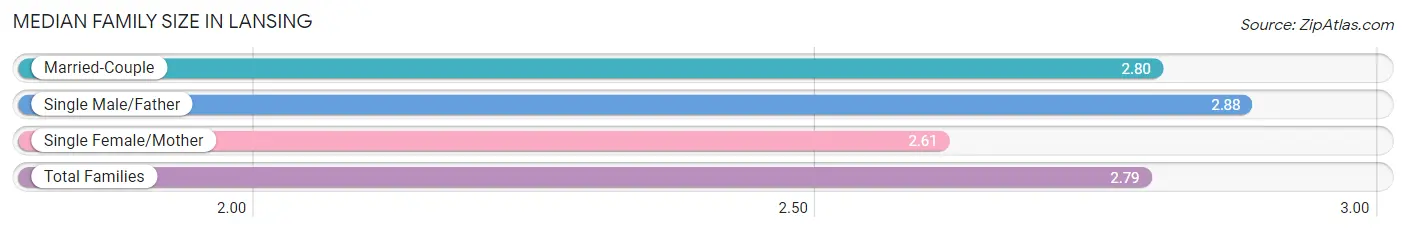
| Family Type | # Families | Family Size |
| Married-Couple | 182 (66.9%) | 2.80 |
| Single Male/Father | 59 (21.7%) | 2.88 |
| Single Female/Mother | 31 (11.4%) | 2.61 |
| Total Families | 272 (100.0%) | 2.79 |
Median Household Size in Lansing
The median household size in Lansing is 2.20 persons per household, with single male/father households (59 | 12.8%) accounting for the largest median household size of 3.31 persons per household. non-family households (189 | 41.0%) represent the smallest median household size with 1.20 persons per household.
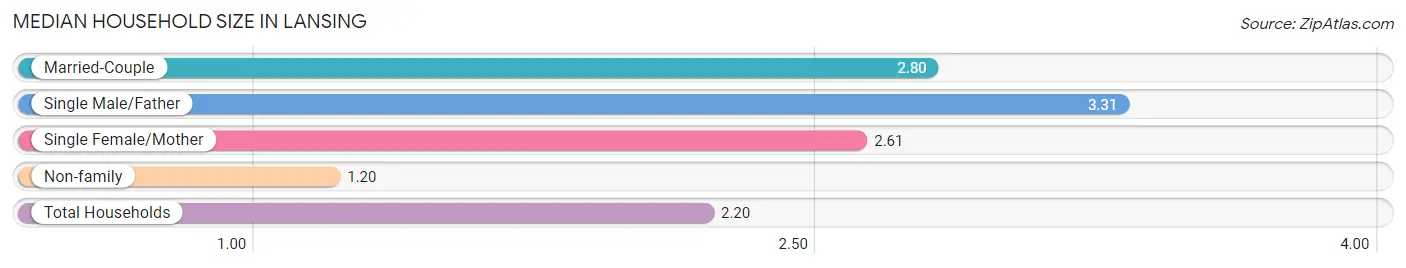
| Household Type | # Households | Household Size |
| Married-Couple | 182 (39.5%) | 2.80 |
| Single Male/Father | 59 (12.8%) | 3.31 |
| Single Female/Mother | 31 (6.7%) | 2.61 |
| Non-family | 189 (41.0%) | 1.20 |
| Total Households | 461 (100.0%) | 2.20 |
Household Size by Marriage Status in Lansing
Out of a total of 461 households in Lansing, 272 (59.0%) are family households, while 189 (41.0%) are nonfamily households. The most numerous type of family households are 2-person households, comprising 150, and the most common type of nonfamily households are 1-person households, comprising 161.
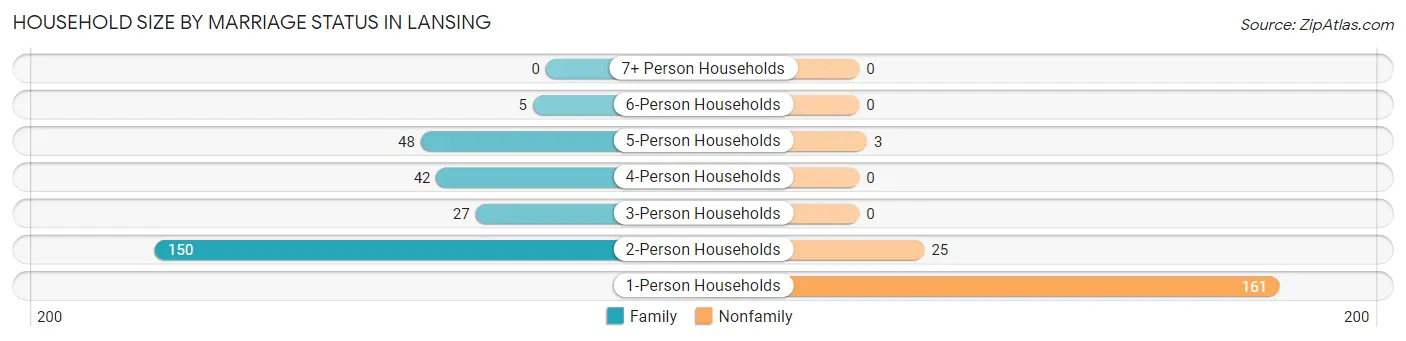
| Household Size | Family Households | Nonfamily Households |
| 1-Person Households | - | 161 (34.9%) |
| 2-Person Households | 150 (32.5%) | 25 (5.4%) |
| 3-Person Households | 27 (5.9%) | 0 (0.0%) |
| 4-Person Households | 42 (9.1%) | 0 (0.0%) |
| 5-Person Households | 48 (10.4%) | 3 (0.6%) |
| 6-Person Households | 5 (1.1%) | 0 (0.0%) |
| 7+ Person Households | 0 (0.0%) | 0 (0.0%) |
| Total | 272 (59.0%) | 189 (41.0%) |
Female Fertility in Lansing
Fertility by Age in Lansing
Average fertility rate in Lansing is 103.0 births per 1,000 women. Women in the age bracket of 20 to 34 years have the highest fertility rate with 436.0 births per 1,000 women. Women in the age bracket of 20 to 34 years acount for 100.0% of all women with births.
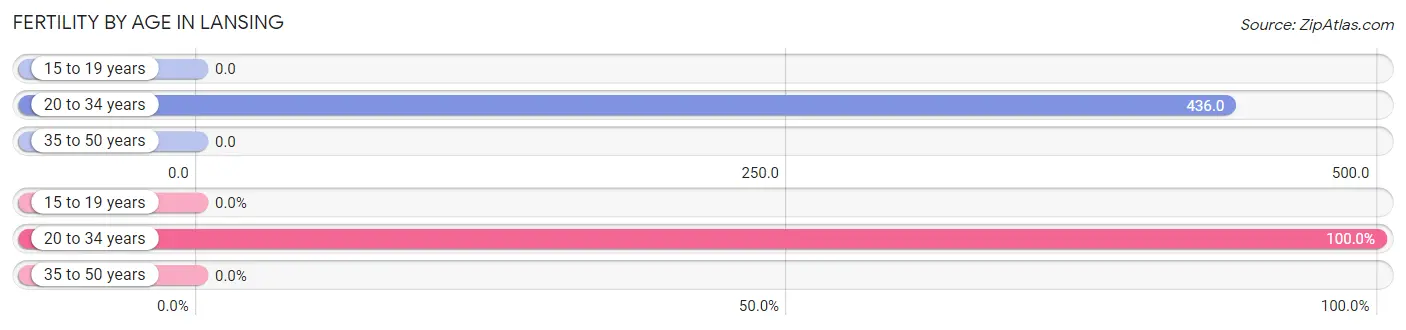
| Age Bracket | Women with Births | Births / 1,000 Women |
| 15 to 19 years | 0 (0.0%) | 0.0 |
| 20 to 34 years | 17 (100.0%) | 436.0 |
| 35 to 50 years | 0 (0.0%) | 0.0 |
| Total | 17 (100.0%) | 103.0 |
Fertility by Age by Marriage Status in Lansing
29.4% of women with births (17) in Lansing are married. The highest percentage of unmarried women with births falls into 20 to 34 years age bracket with 70.6% of them unmarried at the time of birth, while the lowest percentage of unmarried women with births belong to 20 to 34 years age bracket with 70.6% of them unmarried.
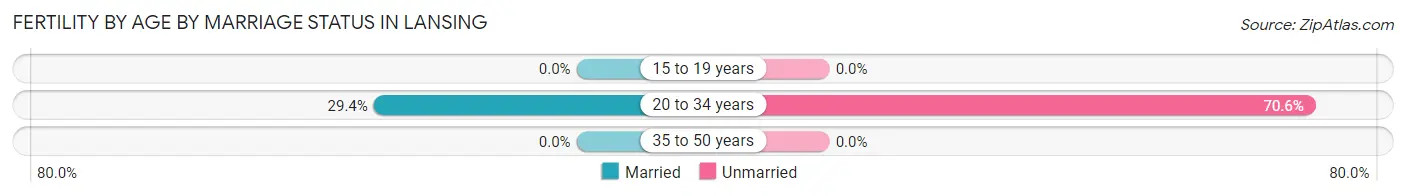
| Age Bracket | Married | Unmarried |
| 15 to 19 years | 0 (0.0%) | 0 (0.0%) |
| 20 to 34 years | 5 (29.4%) | 12 (70.6%) |
| 35 to 50 years | 0 (0.0%) | 0 (0.0%) |
| Total | 5 (29.4%) | 12 (70.6%) |
Fertility by Education in Lansing
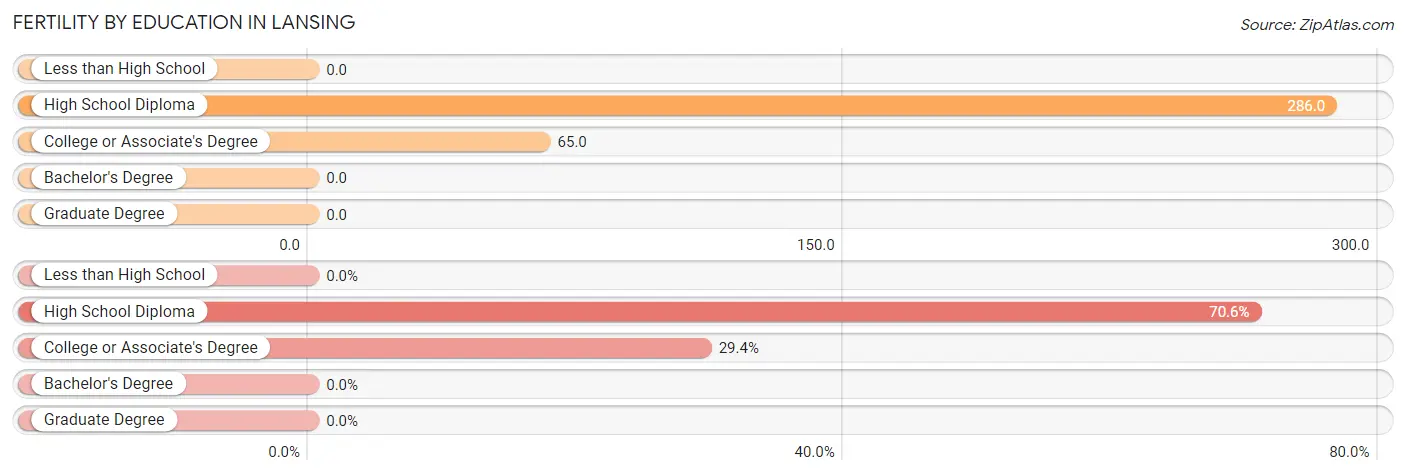
| Educational Attainment | Women with Births | Births / 1,000 Women |
| Less than High School | 0 (0.0%) | 0.0 |
| High School Diploma | 12 (70.6%) | 286.0 |
| College or Associate's Degree | 5 (29.4%) | 65.0 |
| Bachelor's Degree | 0 (0.0%) | 0.0 |
| Graduate Degree | 0 (0.0%) | 0.0 |
| Total | 17 (100.0%) | 103.0 |
Fertility by Education by Marriage Status in Lansing
70.6% of women with births in Lansing are unmarried. Women with the educational attainment of college or associate's degree are most likely to be married with 100.0% of them married at childbirth, while women with the educational attainment of high school diploma are least likely to be married with 100.0% of them unmarried at childbirth.
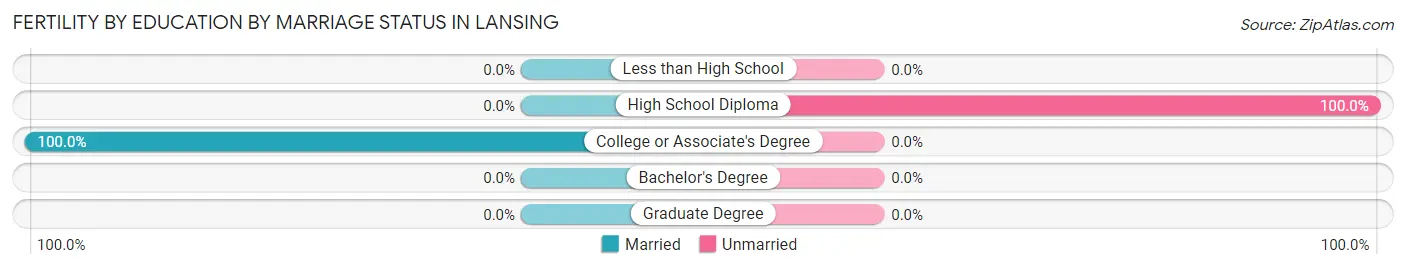
| Educational Attainment | Married | Unmarried |
| Less than High School | 0 (0.0%) | 0 (0.0%) |
| High School Diploma | 0 (0.0%) | 12 (100.0%) |
| College or Associate's Degree | 5 (100.0%) | 0 (0.0%) |
| Bachelor's Degree | 0 (0.0%) | 0 (0.0%) |
| Graduate Degree | 0 (0.0%) | 0 (0.0%) |
| Total | 5 (29.4%) | 12 (70.6%) |
Employment Characteristics in Lansing
Employment by Class of Employer in Lansing
Among the 454 employed individuals in Lansing, private company employees (271 | 59.7%), self-employed (not incorporated) (78 | 17.2%), and not-for-profit organizations (60 | 13.2%) make up the most common classes of employment.
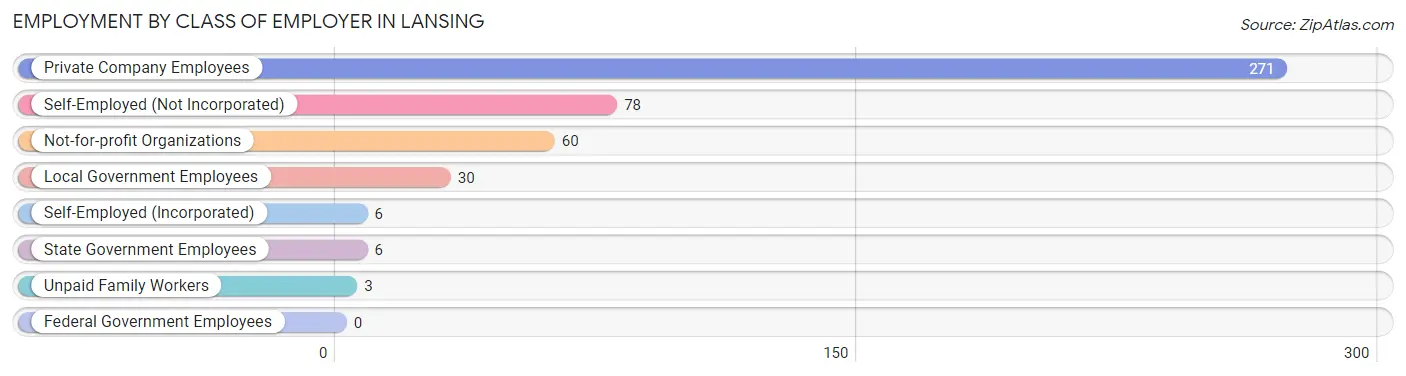
| Employer Class | # Employees | % Employees |
| Private Company Employees | 271 | 59.7% |
| Self-Employed (Incorporated) | 6 | 1.3% |
| Self-Employed (Not Incorporated) | 78 | 17.2% |
| Not-for-profit Organizations | 60 | 13.2% |
| Local Government Employees | 30 | 6.6% |
| State Government Employees | 6 | 1.3% |
| Federal Government Employees | 0 | 0.0% |
| Unpaid Family Workers | 3 | 0.7% |
| Total | 454 | 100.0% |
Employment Status by Age in Lansing
According to the labor force statistics for Lansing, out of the total population over 16 years of age (849), 57.2% or 486 individuals are in the labor force, with 4.9% or 24 of them unemployed. The age group with the highest labor force participation rate is 30 to 34 years, with 100.0% or 41 individuals in the labor force. Within the labor force, the 16 to 19 years age range has the highest percentage of unemployed individuals, with 19.6% or 11 of them being unemployed.
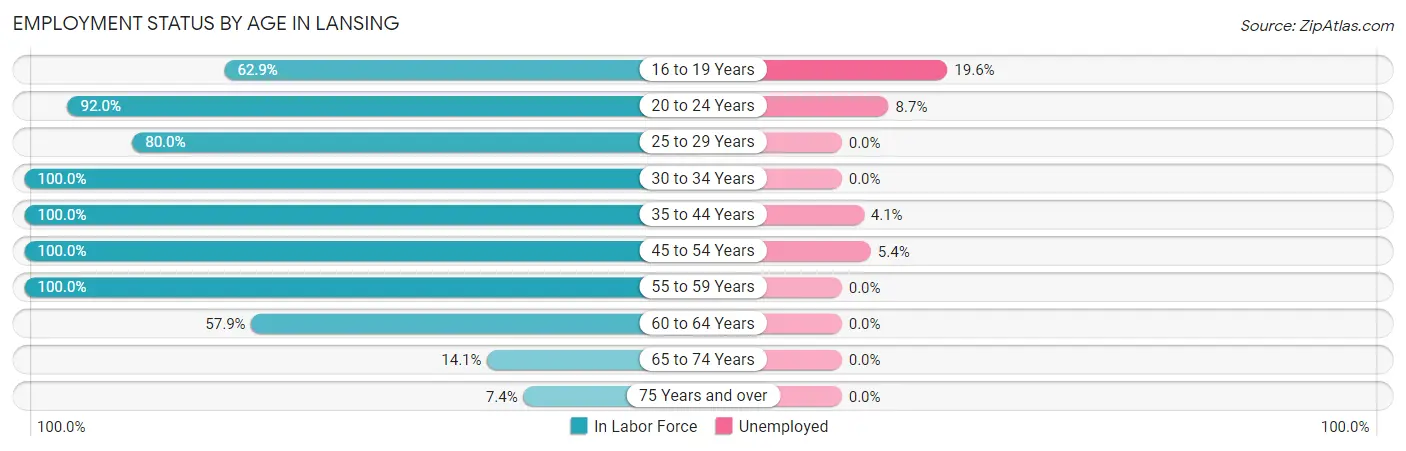
| Age Bracket | In Labor Force | Unemployed |
| 16 to 19 Years | 56 (62.9%) | 11 (19.6%) |
| 20 to 24 Years | 23 (92.0%) | 2 (8.7%) |
| 25 to 29 Years | 20 (80.0%) | 0 (0.0%) |
| 30 to 34 Years | 41 (100.0%) | 0 (0.0%) |
| 35 to 44 Years | 74 (100.0%) | 3 (4.1%) |
| 45 to 54 Years | 149 (100.0%) | 8 (5.4%) |
| 55 to 59 Years | 31 (100.0%) | 0 (0.0%) |
| 60 to 64 Years | 55 (57.9%) | 0 (0.0%) |
| 65 to 74 Years | 28 (14.1%) | 0 (0.0%) |
| 75 Years and over | 9 (7.4%) | 0 (0.0%) |
| Total | 486 (57.2%) | 24 (4.9%) |
Employment Status by Educational Attainment in Lansing
According to labor force statistics for Lansing, 89.2% of individuals (370) out of the total population between 25 and 64 years of age (415) are in the labor force, with 3.0% or 11 of them being unemployed. The group with the highest labor force participation rate are those with the educational attainment of less than high school, with 100.0% or 12 individuals in the labor force. Within the labor force, individuals with less than high school education have the highest percentage of unemployment, with 25.0% or 3 of them being unemployed.
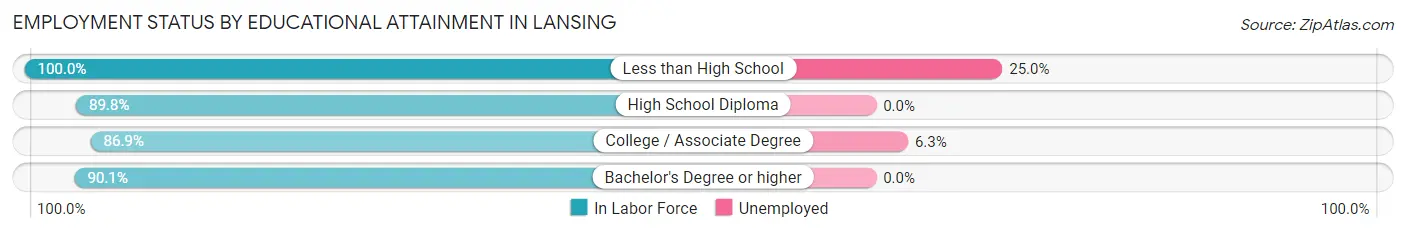
| Educational Attainment | In Labor Force | Unemployed |
| Less than High School | 12 (100.0%) | 3 (25.0%) |
| High School Diploma | 159 (89.8%) | 0 (0.0%) |
| College / Associate Degree | 126 (86.9%) | 9 (6.3%) |
| Bachelor's Degree or higher | 73 (90.1%) | 0 (0.0%) |
| Total | 370 (89.2%) | 12 (3.0%) |
Employment Occupations by Sex in Lansing
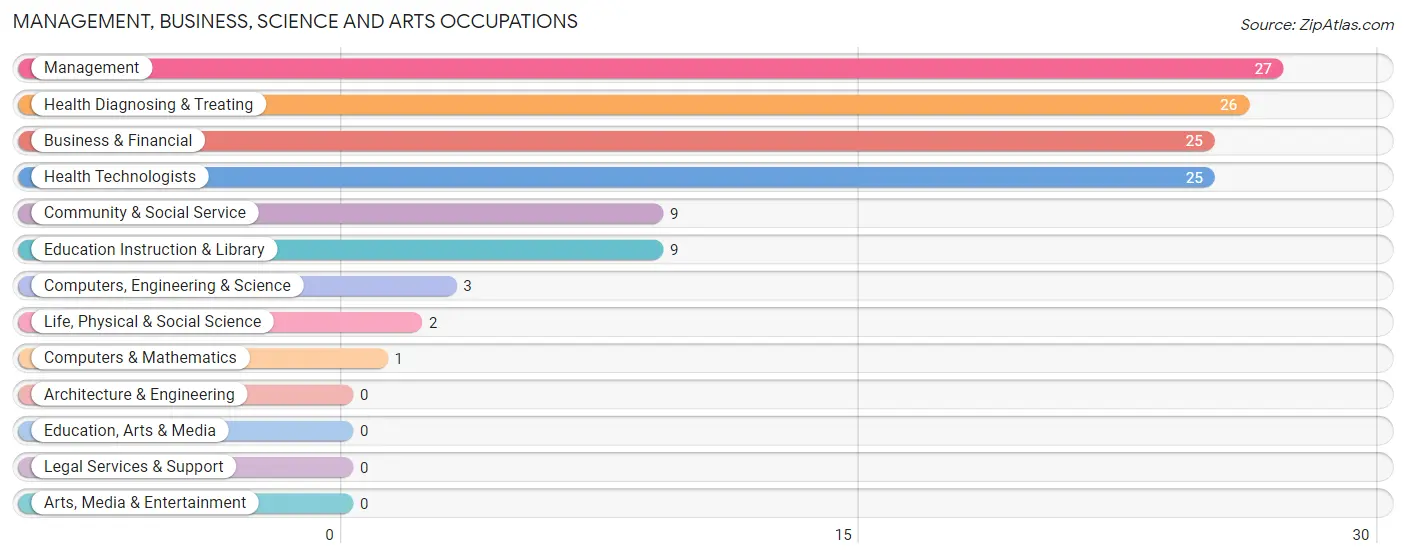
Management, Business, Science and Arts Occupations
The most common Management, Business, Science and Arts occupations in Lansing are Management (27 | 5.8%), Health Diagnosing & Treating (26 | 5.6%), Business & Financial (25 | 5.4%), Health Technologists (25 | 5.4%), and Community & Social Service (9 | 1.9%).
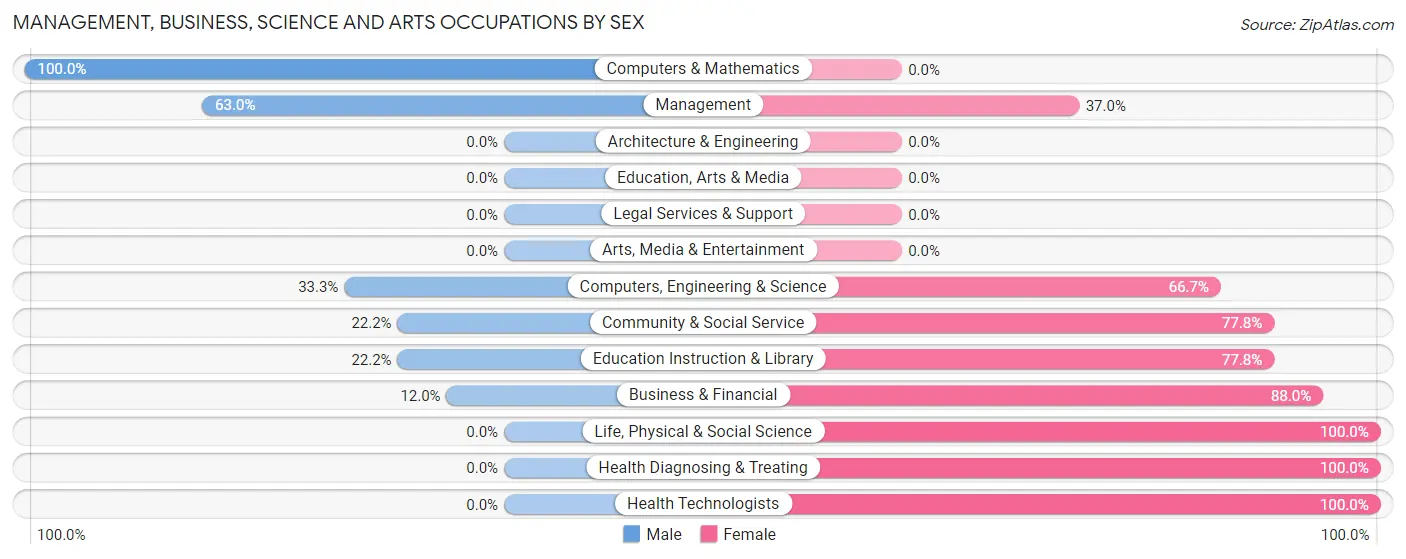
Management, Business, Science and Arts Occupations by Sex
Within the Management, Business, Science and Arts occupations in Lansing, the most male-oriented occupations are Computers & Mathematics (100.0%), Management (63.0%), and Computers, Engineering & Science (33.3%), while the most female-oriented occupations are Life, Physical & Social Science (100.0%), Health Diagnosing & Treating (100.0%), and Health Technologists (100.0%).
| Occupation | Male | Female |
| Management | 17 (63.0%) | 10 (37.0%) |
| Business & Financial | 3 (12.0%) | 22 (88.0%) |
| Computers, Engineering & Science | 1 (33.3%) | 2 (66.7%) |
| Computers & Mathematics | 1 (100.0%) | 0 (0.0%) |
| Architecture & Engineering | 0 (0.0%) | 0 (0.0%) |
| Life, Physical & Social Science | 0 (0.0%) | 2 (100.0%) |
| Community & Social Service | 2 (22.2%) | 7 (77.8%) |
| Education, Arts & Media | 0 (0.0%) | 0 (0.0%) |
| Legal Services & Support | 0 (0.0%) | 0 (0.0%) |
| Education Instruction & Library | 2 (22.2%) | 7 (77.8%) |
| Arts, Media & Entertainment | 0 (0.0%) | 0 (0.0%) |
| Health Diagnosing & Treating | 0 (0.0%) | 26 (100.0%) |
| Health Technologists | 0 (0.0%) | 25 (100.0%) |
| Total (Category) | 23 (25.6%) | 67 (74.4%) |
| Total (Overall) | 254 (55.0%) | 208 (45.0%) |
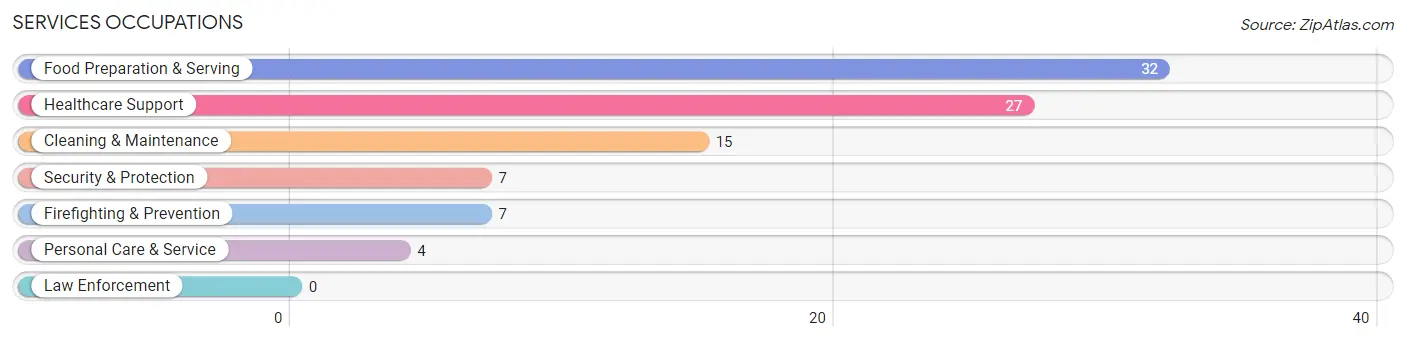
Services Occupations
The most common Services occupations in Lansing are Food Preparation & Serving (32 | 6.9%), Healthcare Support (27 | 5.8%), Cleaning & Maintenance (15 | 3.3%), Security & Protection (7 | 1.5%), and Firefighting & Prevention (7 | 1.5%).
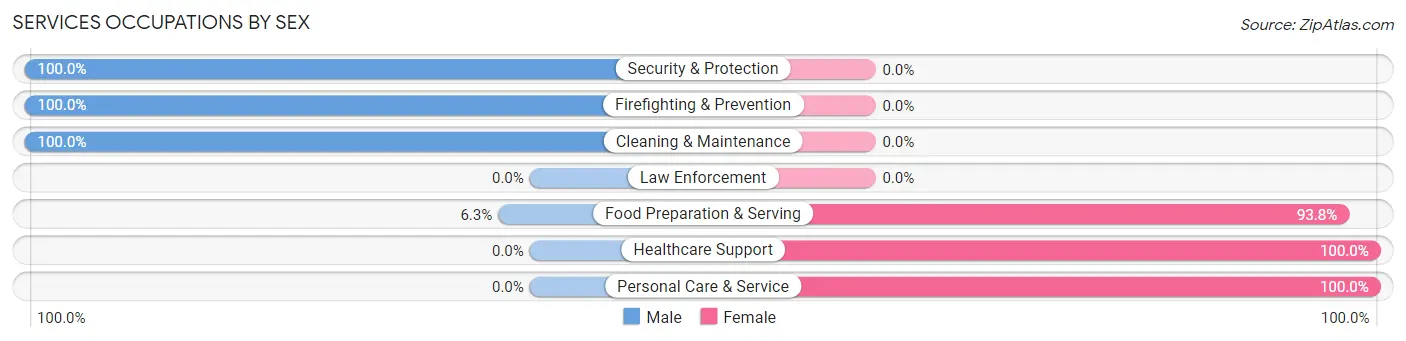
Services Occupations by Sex
Within the Services occupations in Lansing, the most male-oriented occupations are Security & Protection (100.0%), Firefighting & Prevention (100.0%), and Cleaning & Maintenance (100.0%), while the most female-oriented occupations are Healthcare Support (100.0%), Personal Care & Service (100.0%), and Food Preparation & Serving (93.8%).
| Occupation | Male | Female |
| Healthcare Support | 0 (0.0%) | 27 (100.0%) |
| Security & Protection | 7 (100.0%) | 0 (0.0%) |
| Firefighting & Prevention | 7 (100.0%) | 0 (0.0%) |
| Law Enforcement | 0 (0.0%) | 0 (0.0%) |
| Food Preparation & Serving | 2 (6.2%) | 30 (93.8%) |
| Cleaning & Maintenance | 15 (100.0%) | 0 (0.0%) |
| Personal Care & Service | 0 (0.0%) | 4 (100.0%) |
| Total (Category) | 24 (28.2%) | 61 (71.8%) |
| Total (Overall) | 254 (55.0%) | 208 (45.0%) |
Sales and Office Occupations
The most common Sales and Office occupations in Lansing are Office & Administration (60 | 13.0%), and Sales & Related (20 | 4.3%).
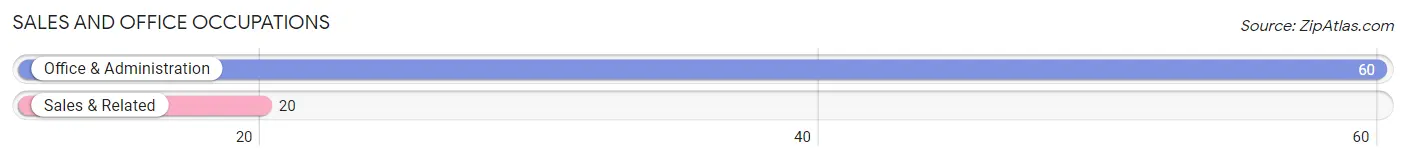
Sales and Office Occupations by Sex
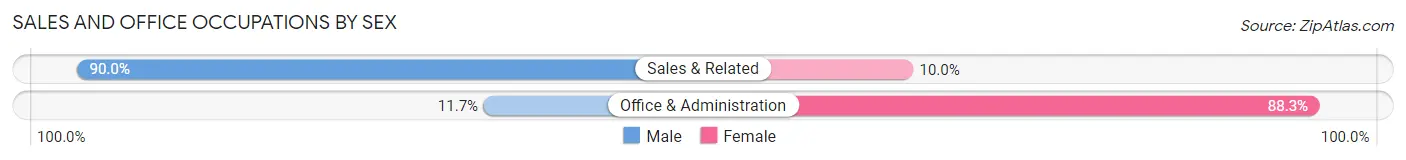
| Occupation | Male | Female |
| Sales & Related | 18 (90.0%) | 2 (10.0%) |
| Office & Administration | 7 (11.7%) | 53 (88.3%) |
| Total (Category) | 25 (31.2%) | 55 (68.8%) |
| Total (Overall) | 254 (55.0%) | 208 (45.0%) |
Natural Resources, Construction and Maintenance Occupations
The most common Natural Resources, Construction and Maintenance occupations in Lansing are Construction & Extraction (70 | 15.1%), Farming, Fishing & Forestry (28 | 6.1%), and Installation, Maintenance & Repair (14 | 3.0%).
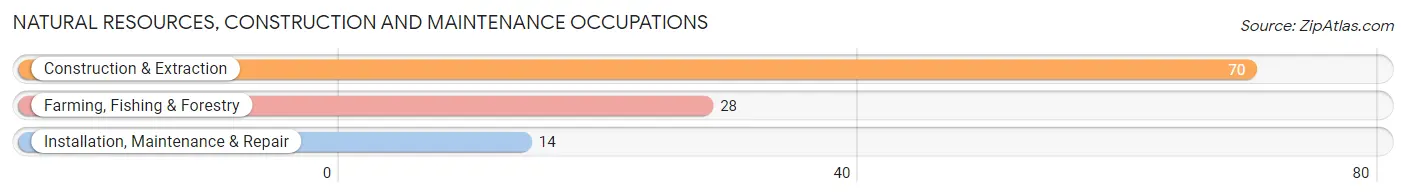
Natural Resources, Construction and Maintenance Occupations by Sex
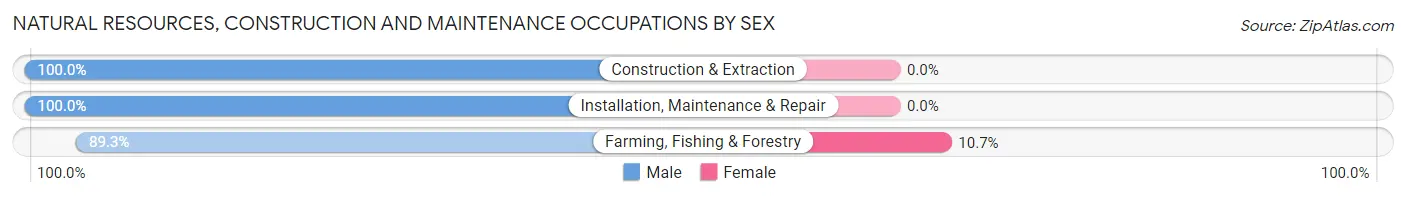
| Occupation | Male | Female |
| Farming, Fishing & Forestry | 25 (89.3%) | 3 (10.7%) |
| Construction & Extraction | 70 (100.0%) | 0 (0.0%) |
| Installation, Maintenance & Repair | 14 (100.0%) | 0 (0.0%) |
| Total (Category) | 109 (97.3%) | 3 (2.7%) |
| Total (Overall) | 254 (55.0%) | 208 (45.0%) |
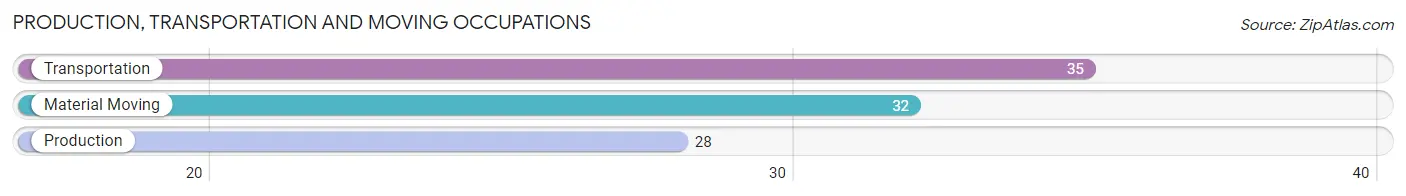
Production, Transportation and Moving Occupations
The most common Production, Transportation and Moving occupations in Lansing are Transportation (35 | 7.6%), Material Moving (32 | 6.9%), and Production (28 | 6.1%).
Production, Transportation and Moving Occupations by Sex
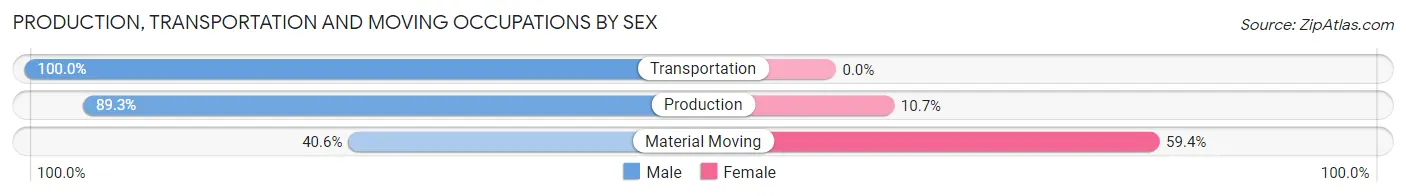
| Occupation | Male | Female |
| Production | 25 (89.3%) | 3 (10.7%) |
| Transportation | 35 (100.0%) | 0 (0.0%) |
| Material Moving | 13 (40.6%) | 19 (59.4%) |
| Total (Category) | 73 (76.8%) | 22 (23.2%) |
| Total (Overall) | 254 (55.0%) | 208 (45.0%) |
Employment Industries by Sex in Lansing
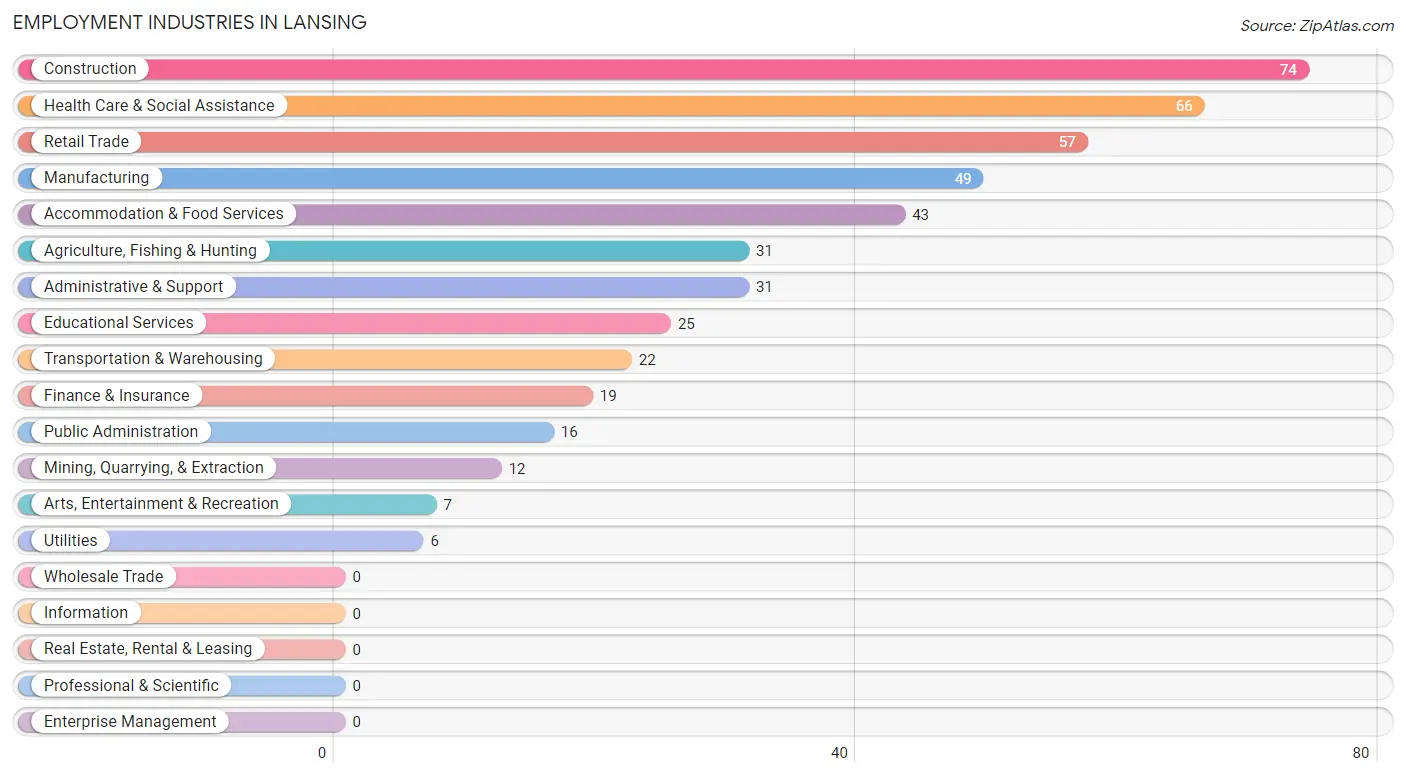
Employment Industries in Lansing
The major employment industries in Lansing include Construction (74 | 16.0%), Health Care & Social Assistance (66 | 14.3%), Retail Trade (57 | 12.3%), Manufacturing (49 | 10.6%), and Accommodation & Food Services (43 | 9.3%).
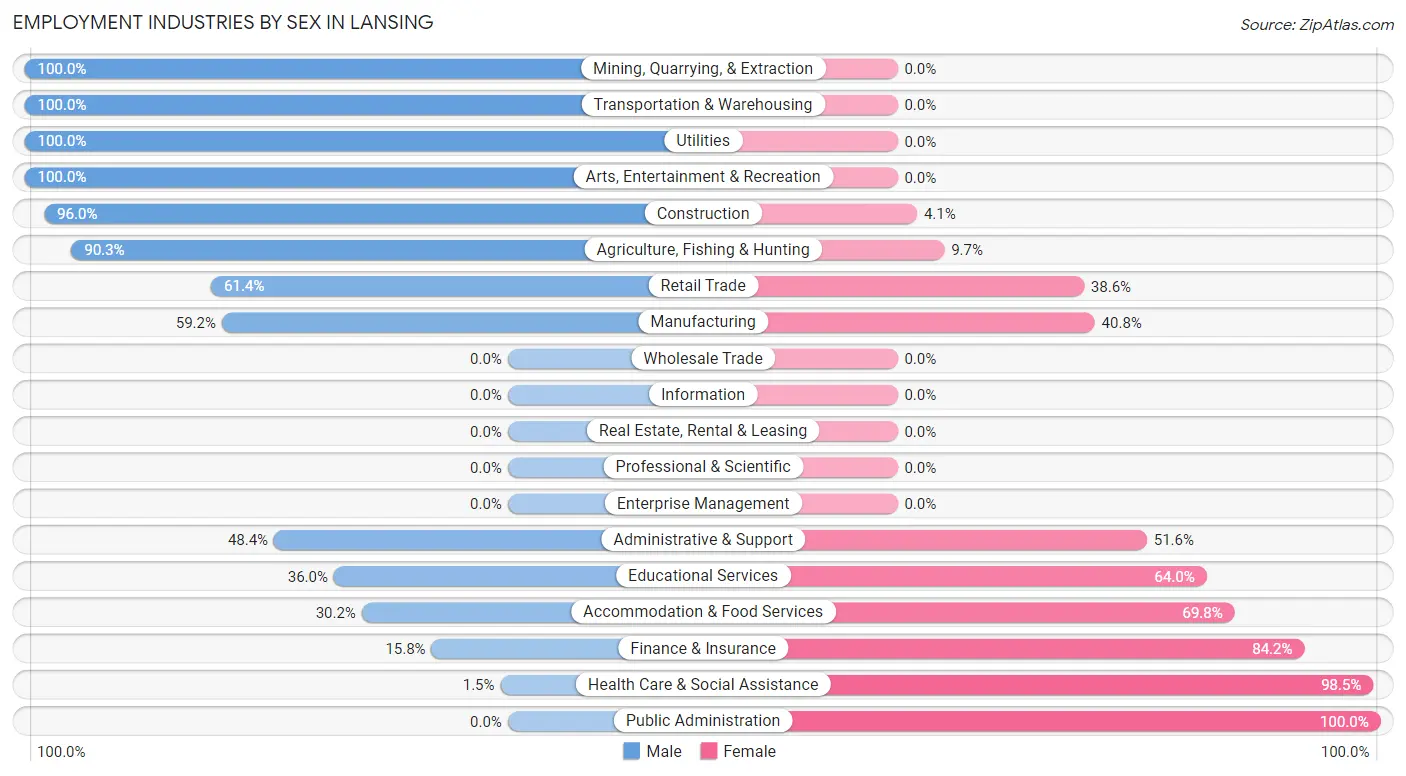
Employment Industries by Sex in Lansing
The Lansing industries that see more men than women are Mining, Quarrying, & Extraction (100.0%), Transportation & Warehousing (100.0%), and Utilities (100.0%), whereas the industries that tend to have a higher number of women are Public Administration (100.0%), Health Care & Social Assistance (98.5%), and Finance & Insurance (84.2%).
| Industry | Male | Female |
| Agriculture, Fishing & Hunting | 28 (90.3%) | 3 (9.7%) |
| Mining, Quarrying, & Extraction | 12 (100.0%) | 0 (0.0%) |
| Construction | 71 (96.0%) | 3 (4.1%) |
| Manufacturing | 29 (59.2%) | 20 (40.8%) |
| Wholesale Trade | 0 (0.0%) | 0 (0.0%) |
| Retail Trade | 35 (61.4%) | 22 (38.6%) |
| Transportation & Warehousing | 22 (100.0%) | 0 (0.0%) |
| Utilities | 6 (100.0%) | 0 (0.0%) |
| Information | 0 (0.0%) | 0 (0.0%) |
| Finance & Insurance | 3 (15.8%) | 16 (84.2%) |
| Real Estate, Rental & Leasing | 0 (0.0%) | 0 (0.0%) |
| Professional & Scientific | 0 (0.0%) | 0 (0.0%) |
| Enterprise Management | 0 (0.0%) | 0 (0.0%) |
| Administrative & Support | 15 (48.4%) | 16 (51.6%) |
| Educational Services | 9 (36.0%) | 16 (64.0%) |
| Health Care & Social Assistance | 1 (1.5%) | 65 (98.5%) |
| Arts, Entertainment & Recreation | 7 (100.0%) | 0 (0.0%) |
| Accommodation & Food Services | 13 (30.2%) | 30 (69.8%) |
| Public Administration | 0 (0.0%) | 16 (100.0%) |
| Total | 254 (55.0%) | 208 (45.0%) |
Education in Lansing
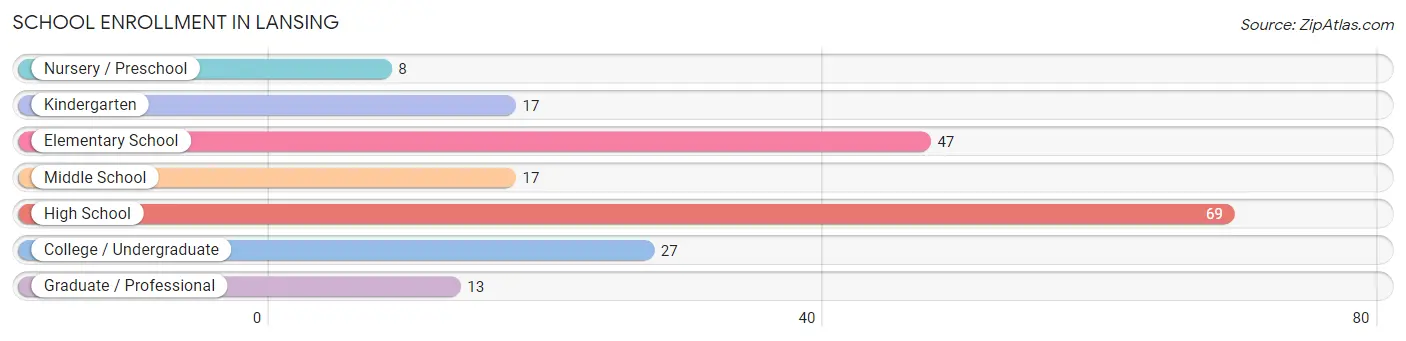
School Enrollment in Lansing
The most common levels of schooling among the 198 students in Lansing are high school (69 | 34.8%), elementary school (47 | 23.7%), and college / undergraduate (27 | 13.6%).
| School Level | # Students | % Students |
| Nursery / Preschool | 8 | 4.0% |
| Kindergarten | 17 | 8.6% |
| Elementary School | 47 | 23.7% |
| Middle School | 17 | 8.6% |
| High School | 69 | 34.8% |
| College / Undergraduate | 27 | 13.6% |
| Graduate / Professional | 13 | 6.6% |
| Total | 198 | 100.0% |
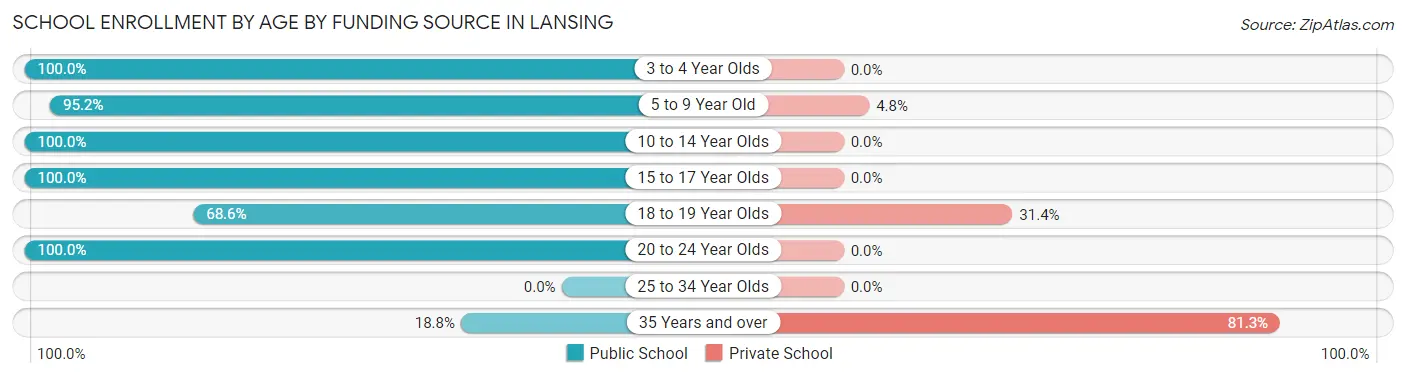
School Enrollment by Age by Funding Source in Lansing
Out of a total of 198 students who are enrolled in schools in Lansing, 26 (13.1%) attend a private institution, while the remaining 172 (86.9%) are enrolled in public schools. The age group of 35 years and over has the highest likelihood of being enrolled in private schools, with 13 (81.2% in the age bracket) enrolled. Conversely, the age group of 3 to 4 year olds has the lowest likelihood of being enrolled in a private school, with 6 (100.0% in the age bracket) attending a public institution.
| Age Bracket | Public School | Private School |
| 3 to 4 Year Olds | 6 (100.0%) | 0 (0.0%) |
| 5 to 9 Year Old | 40 (95.2%) | 2 (4.8%) |
| 10 to 14 Year Olds | 45 (100.0%) | 0 (0.0%) |
| 15 to 17 Year Olds | 52 (100.0%) | 0 (0.0%) |
| 18 to 19 Year Olds | 24 (68.6%) | 11 (31.4%) |
| 20 to 24 Year Olds | 2 (100.0%) | 0 (0.0%) |
| 25 to 34 Year Olds | 0 (0.0%) | 0 (0.0%) |
| 35 Years and over | 3 (18.8%) | 13 (81.2%) |
| Total | 172 (86.9%) | 26 (13.1%) |
Educational Attainment by Field of Study in Lansing
Business (31 | 22.1%), science & technology (23 | 16.4%), social sciences (21 | 15.0%), liberal arts & history (16 | 11.4%), and literature & languages (13 | 9.3%) are the most common fields of study among 140 individuals in Lansing who have obtained a bachelor's degree or higher.
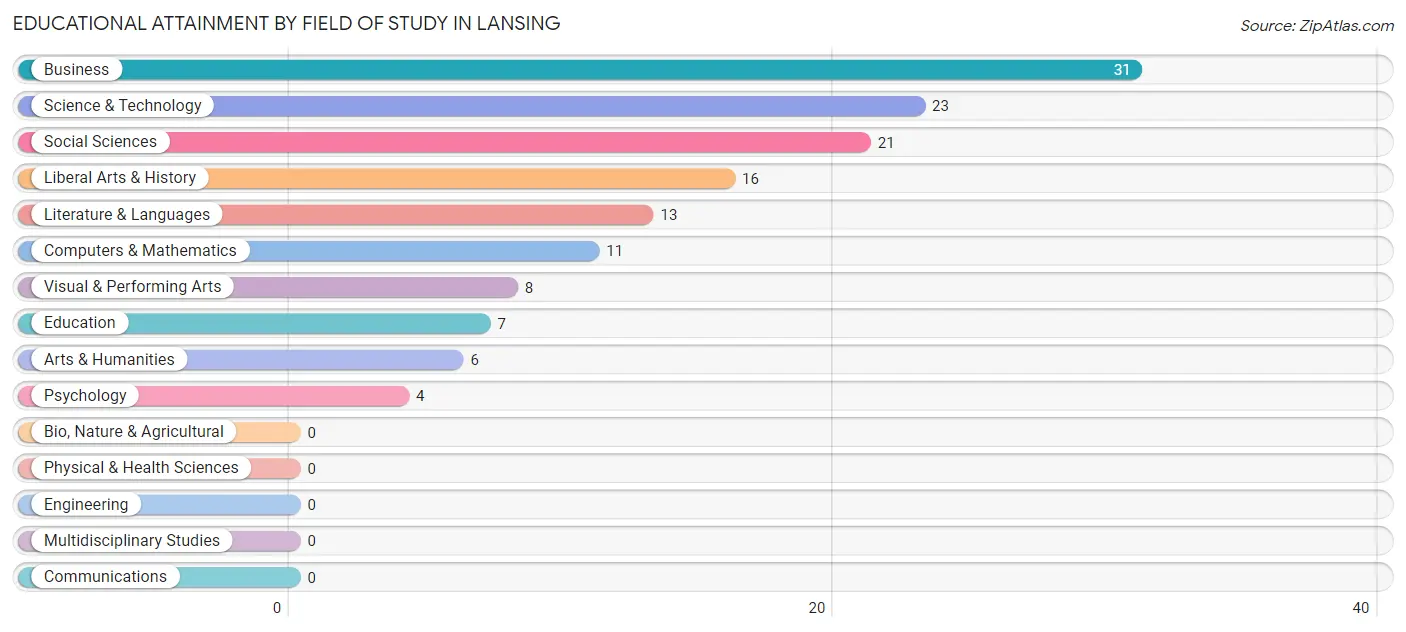
| Field of Study | # Graduates | % Graduates |
| Computers & Mathematics | 11 | 7.9% |
| Bio, Nature & Agricultural | 0 | 0.0% |
| Physical & Health Sciences | 0 | 0.0% |
| Psychology | 4 | 2.9% |
| Social Sciences | 21 | 15.0% |
| Engineering | 0 | 0.0% |
| Multidisciplinary Studies | 0 | 0.0% |
| Science & Technology | 23 | 16.4% |
| Business | 31 | 22.1% |
| Education | 7 | 5.0% |
| Literature & Languages | 13 | 9.3% |
| Liberal Arts & History | 16 | 11.4% |
| Visual & Performing Arts | 8 | 5.7% |
| Communications | 0 | 0.0% |
| Arts & Humanities | 6 | 4.3% |
| Total | 140 | 100.0% |
Transportation & Commute in Lansing
Vehicle Availability by Sex in Lansing
The most prevalent vehicle ownership categories in Lansing are males with 2 vehicles (97, accounting for 38.2%) and females with 2 vehicles (92, making up 48.5%).
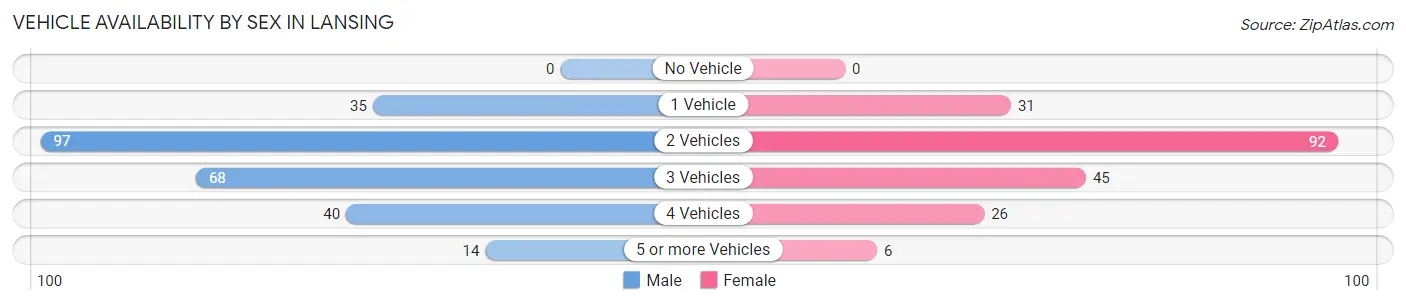
| Vehicles Available | Male | Female |
| No Vehicle | 0 (0.0%) | 0 (0.0%) |
| 1 Vehicle | 35 (13.8%) | 31 (15.5%) |
| 2 Vehicles | 97 (38.2%) | 92 (46.0%) |
| 3 Vehicles | 68 (26.8%) | 45 (22.5%) |
| 4 Vehicles | 40 (15.8%) | 26 (13.0%) |
| 5 or more Vehicles | 14 (5.5%) | 6 (3.0%) |
| Total | 254 (100.0%) | 200 (100.0%) |
Commute Time in Lansing
The most frequently occuring commute durations in Lansing are 5 to 9 minutes (127 commuters, 30.0%), 45 to 59 minutes (62 commuters, 14.7%), and 60 to 89 minutes (52 commuters, 12.3%).
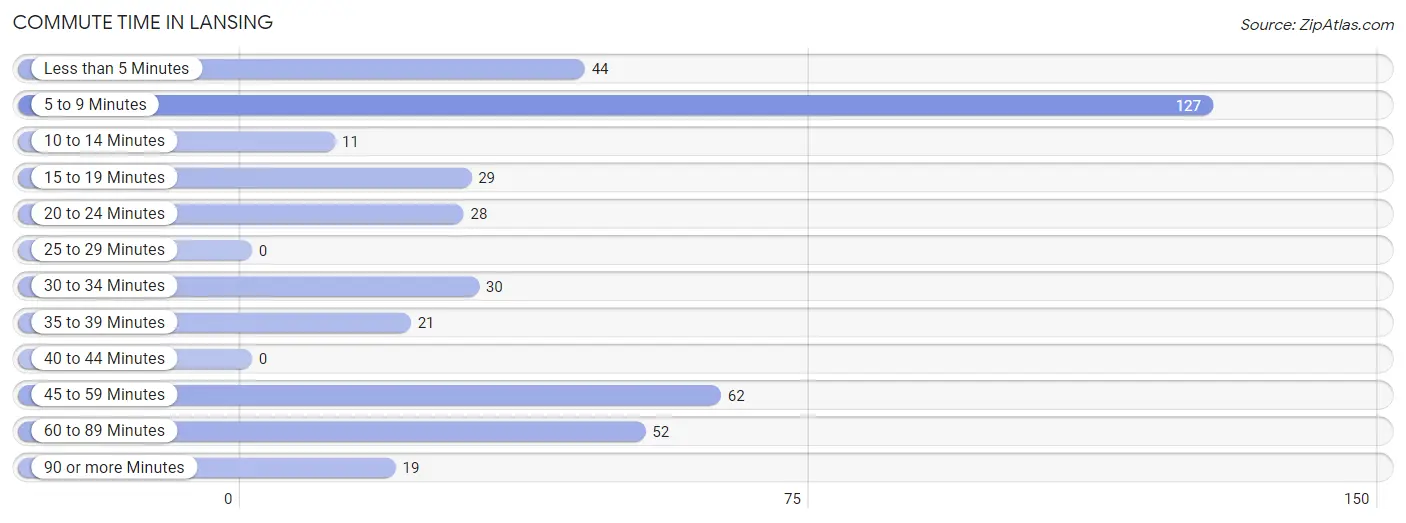
| Commute Time | # Commuters | % Commuters |
| Less than 5 Minutes | 44 | 10.4% |
| 5 to 9 Minutes | 127 | 30.0% |
| 10 to 14 Minutes | 11 | 2.6% |
| 15 to 19 Minutes | 29 | 6.9% |
| 20 to 24 Minutes | 28 | 6.6% |
| 25 to 29 Minutes | 0 | 0.0% |
| 30 to 34 Minutes | 30 | 7.1% |
| 35 to 39 Minutes | 21 | 5.0% |
| 40 to 44 Minutes | 0 | 0.0% |
| 45 to 59 Minutes | 62 | 14.7% |
| 60 to 89 Minutes | 52 | 12.3% |
| 90 or more Minutes | 19 | 4.5% |
Commute Time by Sex in Lansing
The most common commute times in Lansing are 5 to 9 minutes (55 commuters, 23.7%) for males and 5 to 9 minutes (72 commuters, 37.7%) for females.
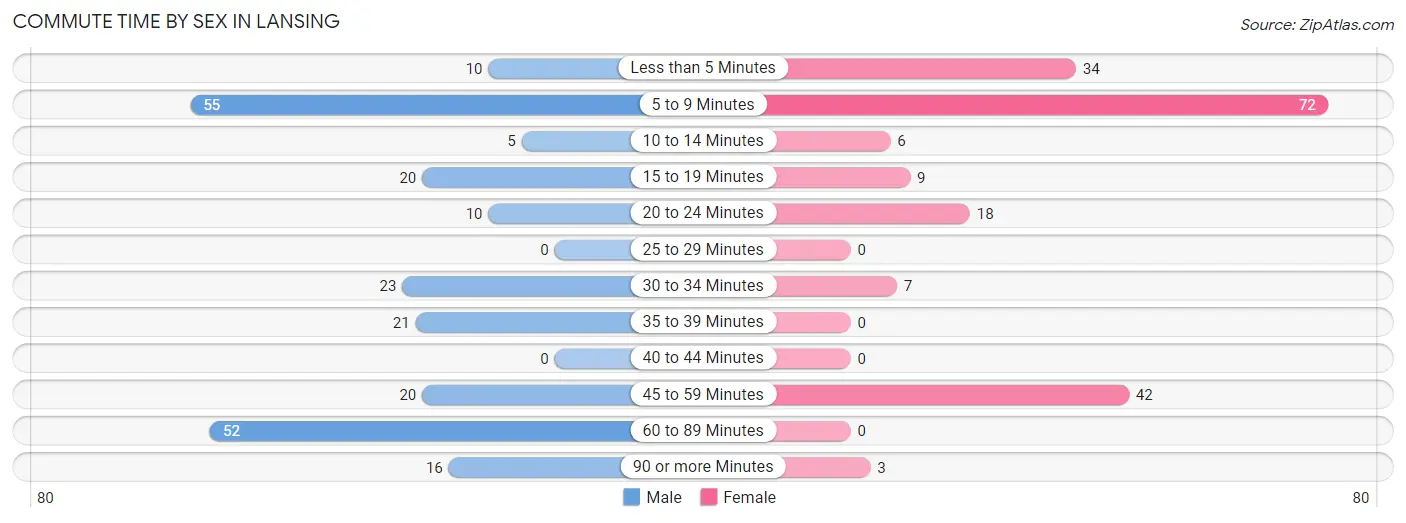
| Commute Time | Male | Female |
| Less than 5 Minutes | 10 (4.3%) | 34 (17.8%) |
| 5 to 9 Minutes | 55 (23.7%) | 72 (37.7%) |
| 10 to 14 Minutes | 5 (2.2%) | 6 (3.1%) |
| 15 to 19 Minutes | 20 (8.6%) | 9 (4.7%) |
| 20 to 24 Minutes | 10 (4.3%) | 18 (9.4%) |
| 25 to 29 Minutes | 0 (0.0%) | 0 (0.0%) |
| 30 to 34 Minutes | 23 (9.9%) | 7 (3.7%) |
| 35 to 39 Minutes | 21 (9.0%) | 0 (0.0%) |
| 40 to 44 Minutes | 0 (0.0%) | 0 (0.0%) |
| 45 to 59 Minutes | 20 (8.6%) | 42 (22.0%) |
| 60 to 89 Minutes | 52 (22.4%) | 0 (0.0%) |
| 90 or more Minutes | 16 (6.9%) | 3 (1.6%) |
Time of Departure to Work by Sex in Lansing
The most frequent times of departure to work in Lansing are 6:00 AM to 6:29 AM (41, 17.7%) for males and 7:30 AM to 7:59 AM (79, 41.4%) for females.
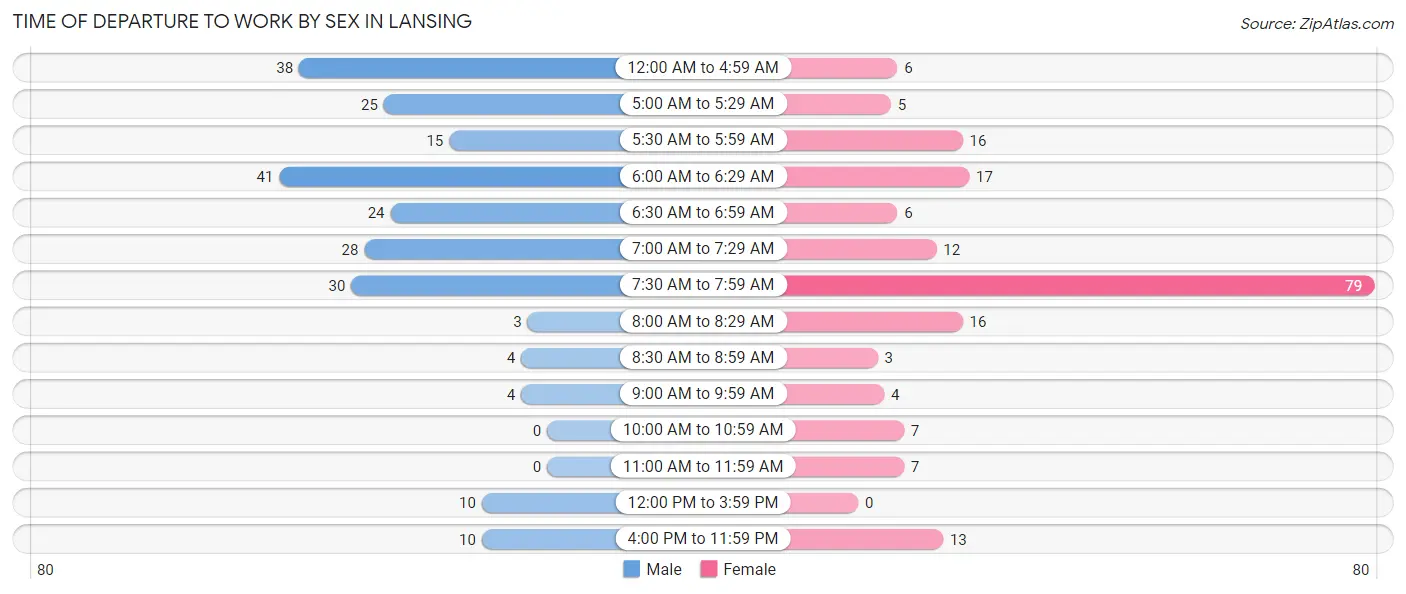
| Time of Departure | Male | Female |
| 12:00 AM to 4:59 AM | 38 (16.4%) | 6 (3.1%) |
| 5:00 AM to 5:29 AM | 25 (10.8%) | 5 (2.6%) |
| 5:30 AM to 5:59 AM | 15 (6.5%) | 16 (8.4%) |
| 6:00 AM to 6:29 AM | 41 (17.7%) | 17 (8.9%) |
| 6:30 AM to 6:59 AM | 24 (10.3%) | 6 (3.1%) |
| 7:00 AM to 7:29 AM | 28 (12.1%) | 12 (6.3%) |
| 7:30 AM to 7:59 AM | 30 (12.9%) | 79 (41.4%) |
| 8:00 AM to 8:29 AM | 3 (1.3%) | 16 (8.4%) |
| 8:30 AM to 8:59 AM | 4 (1.7%) | 3 (1.6%) |
| 9:00 AM to 9:59 AM | 4 (1.7%) | 4 (2.1%) |
| 10:00 AM to 10:59 AM | 0 (0.0%) | 7 (3.7%) |
| 11:00 AM to 11:59 AM | 0 (0.0%) | 7 (3.7%) |
| 12:00 PM to 3:59 PM | 10 (4.3%) | 0 (0.0%) |
| 4:00 PM to 11:59 PM | 10 (4.3%) | 13 (6.8%) |
| Total | 232 (100.0%) | 191 (100.0%) |
Housing Occupancy in Lansing
Occupancy by Ownership in Lansing
Of the total 461 dwellings in Lansing, owner-occupied units account for 350 (75.9%), while renter-occupied units make up 111 (24.1%).
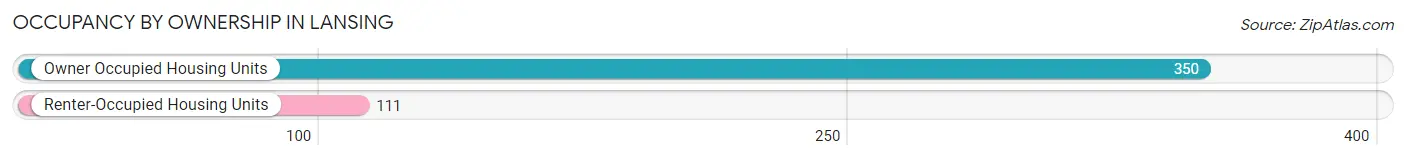
| Occupancy | # Housing Units | % Housing Units |
| Owner Occupied Housing Units | 350 | 75.9% |
| Renter-Occupied Housing Units | 111 | 24.1% |
| Total Occupied Housing Units | 461 | 100.0% |
Occupancy by Household Size in Lansing
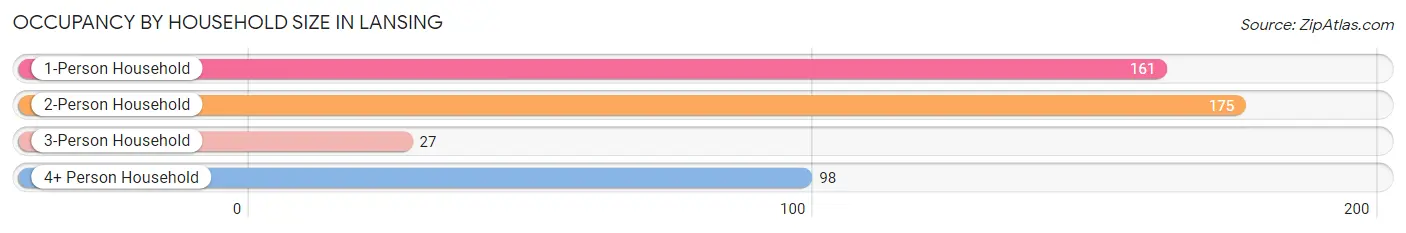
| Household Size | # Housing Units | % Housing Units |
| 1-Person Household | 161 | 34.9% |
| 2-Person Household | 175 | 38.0% |
| 3-Person Household | 27 | 5.9% |
| 4+ Person Household | 98 | 21.3% |
| Total Housing Units | 461 | 100.0% |
Occupancy by Ownership by Household Size in Lansing
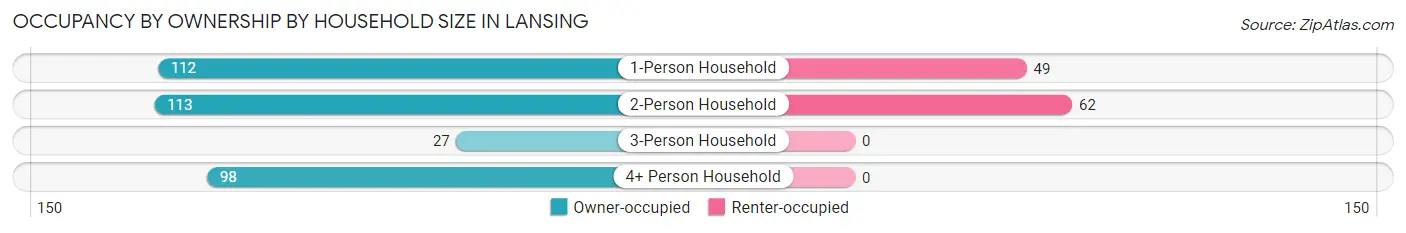
| Household Size | Owner-occupied | Renter-occupied |
| 1-Person Household | 112 (69.6%) | 49 (30.4%) |
| 2-Person Household | 113 (64.6%) | 62 (35.4%) |
| 3-Person Household | 27 (100.0%) | 0 (0.0%) |
| 4+ Person Household | 98 (100.0%) | 0 (0.0%) |
| Total Housing Units | 350 (75.9%) | 111 (24.1%) |
Occupancy by Educational Attainment in Lansing
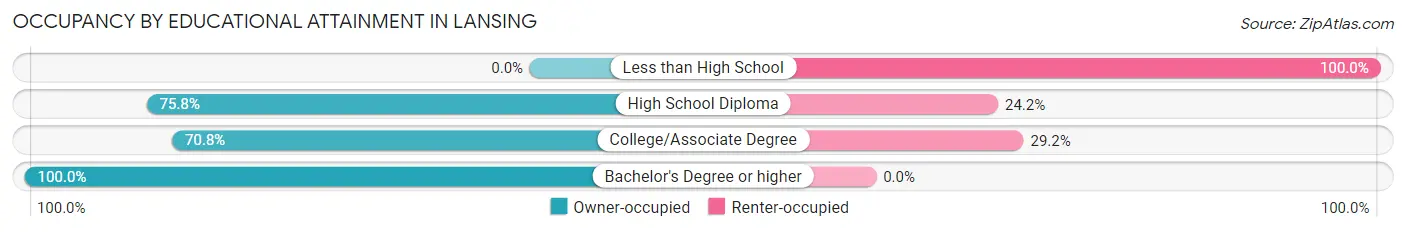
| Household Size | Owner-occupied | Renter-occupied |
| Less than High School | 0 (0.0%) | 15 (100.0%) |
| High School Diploma | 160 (75.8%) | 51 (24.2%) |
| College/Associate Degree | 109 (70.8%) | 45 (29.2%) |
| Bachelor's Degree or higher | 81 (100.0%) | 0 (0.0%) |
Occupancy by Age of Householder in Lansing
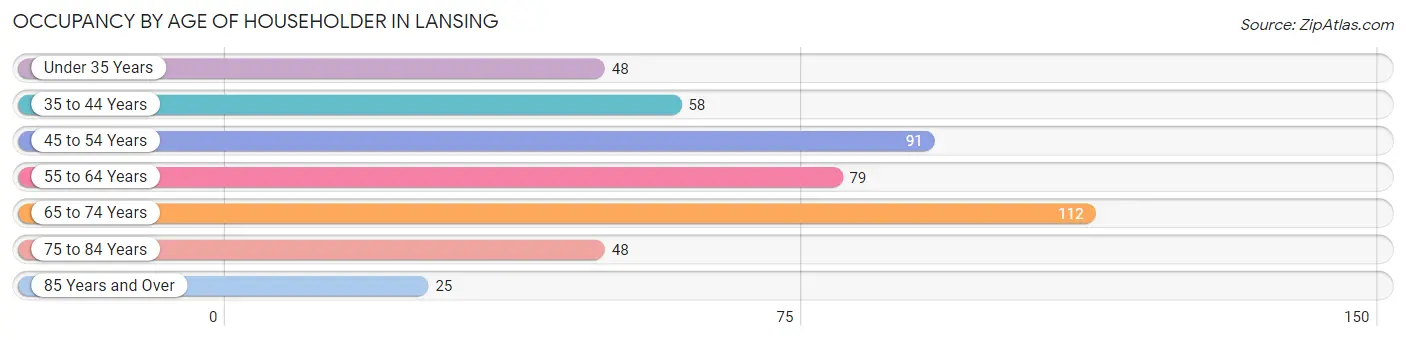
| Age Bracket | # Households | % Households |
| Under 35 Years | 48 | 10.4% |
| 35 to 44 Years | 58 | 12.6% |
| 45 to 54 Years | 91 | 19.7% |
| 55 to 64 Years | 79 | 17.1% |
| 65 to 74 Years | 112 | 24.3% |
| 75 to 84 Years | 48 | 10.4% |
| 85 Years and Over | 25 | 5.4% |
| Total | 461 | 100.0% |
Housing Finances in Lansing
Median Income by Occupancy in Lansing
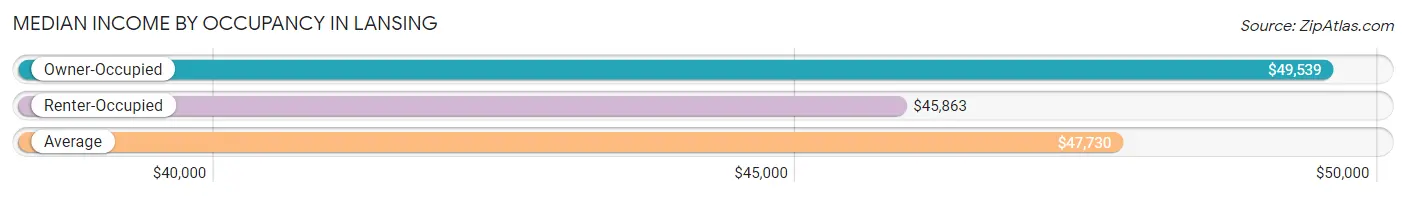
| Occupancy Type | # Households | Median Income |
| Owner-Occupied | 350 (75.9%) | $49,539 |
| Renter-Occupied | 111 (24.1%) | $45,863 |
| Average | 461 (100.0%) | $47,730 |
Occupancy by Householder Income Bracket in Lansing
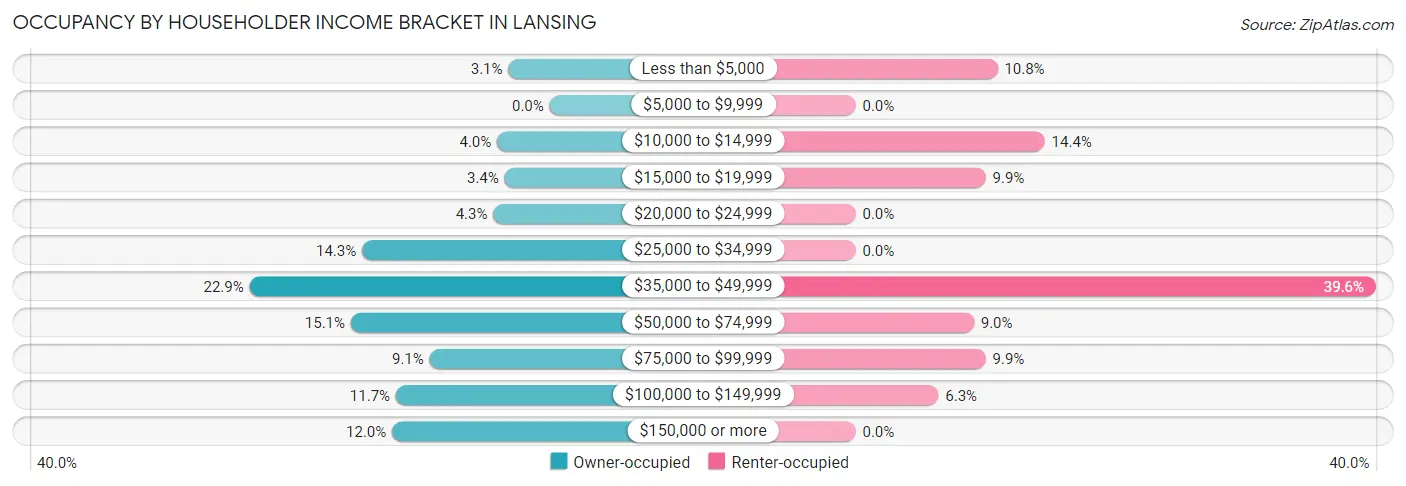
| Income Bracket | Owner-occupied | Renter-occupied |
| Less than $5,000 | 11 (3.1%) | 12 (10.8%) |
| $5,000 to $9,999 | 0 (0.0%) | 0 (0.0%) |
| $10,000 to $14,999 | 14 (4.0%) | 16 (14.4%) |
| $15,000 to $19,999 | 12 (3.4%) | 11 (9.9%) |
| $20,000 to $24,999 | 15 (4.3%) | 0 (0.0%) |
| $25,000 to $34,999 | 50 (14.3%) | 0 (0.0%) |
| $35,000 to $49,999 | 80 (22.9%) | 44 (39.6%) |
| $50,000 to $74,999 | 53 (15.1%) | 10 (9.0%) |
| $75,000 to $99,999 | 32 (9.1%) | 11 (9.9%) |
| $100,000 to $149,999 | 41 (11.7%) | 7 (6.3%) |
| $150,000 or more | 42 (12.0%) | 0 (0.0%) |
| Total | 350 (100.0%) | 111 (100.0%) |
Monthly Housing Cost Tiers in Lansing
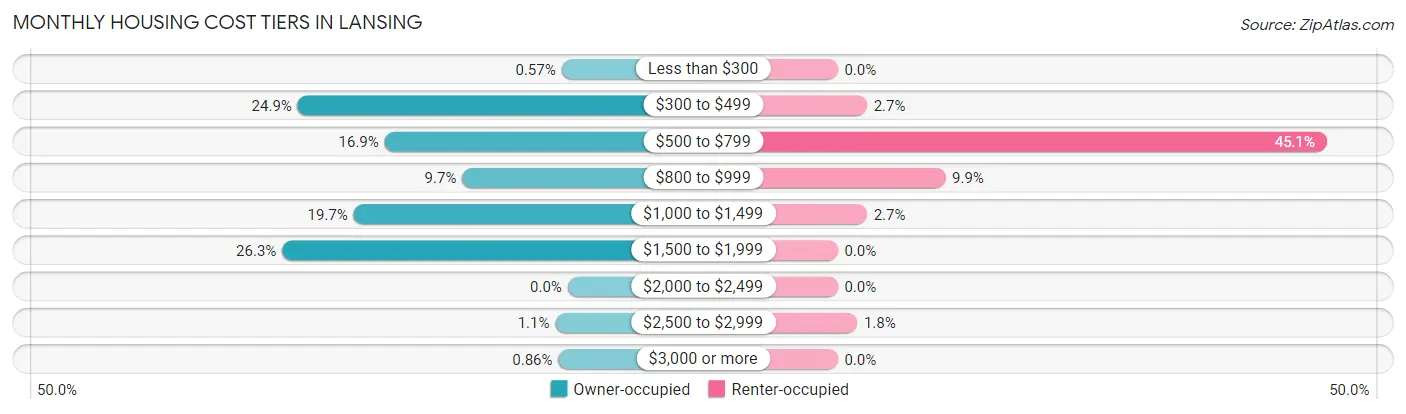
| Monthly Cost | Owner-occupied | Renter-occupied |
| Less than $300 | 2 (0.6%) | 0 (0.0%) |
| $300 to $499 | 87 (24.9%) | 3 (2.7%) |
| $500 to $799 | 59 (16.9%) | 50 (45.1%) |
| $800 to $999 | 34 (9.7%) | 11 (9.9%) |
| $1,000 to $1,499 | 69 (19.7%) | 3 (2.7%) |
| $1,500 to $1,999 | 92 (26.3%) | 0 (0.0%) |
| $2,000 to $2,499 | 0 (0.0%) | 0 (0.0%) |
| $2,500 to $2,999 | 4 (1.1%) | 2 (1.8%) |
| $3,000 or more | 3 (0.9%) | 0 (0.0%) |
| Total | 350 (100.0%) | 111 (100.0%) |
Physical Housing Characteristics in Lansing
Housing Structures in Lansing
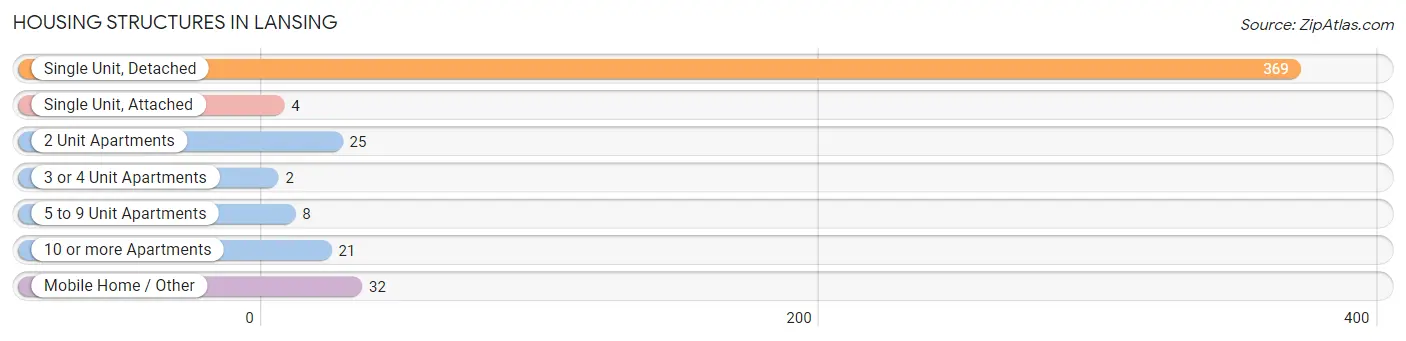
| Structure Type | # Housing Units | % Housing Units |
| Single Unit, Detached | 369 | 80.0% |
| Single Unit, Attached | 4 | 0.9% |
| 2 Unit Apartments | 25 | 5.4% |
| 3 or 4 Unit Apartments | 2 | 0.4% |
| 5 to 9 Unit Apartments | 8 | 1.7% |
| 10 or more Apartments | 21 | 4.6% |
| Mobile Home / Other | 32 | 6.9% |
| Total | 461 | 100.0% |
Housing Structures by Occupancy in Lansing
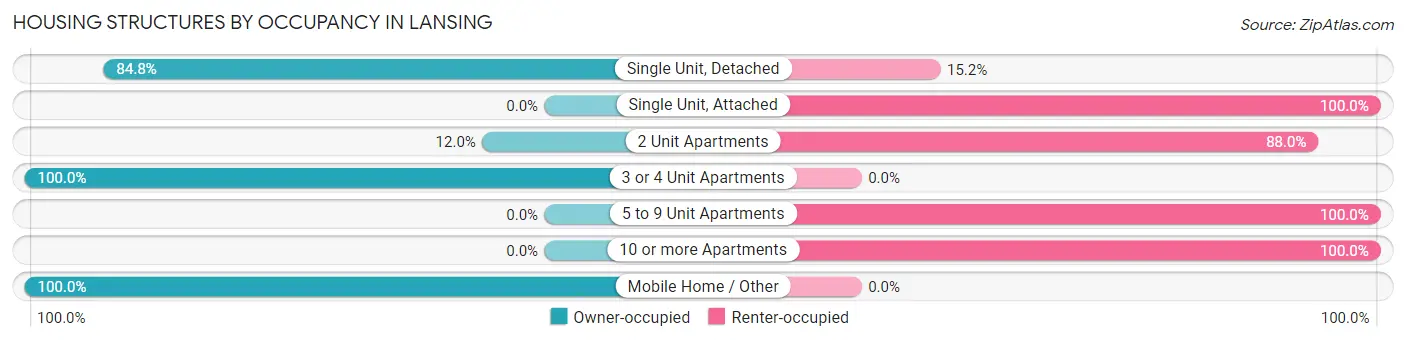
| Structure Type | Owner-occupied | Renter-occupied |
| Single Unit, Detached | 313 (84.8%) | 56 (15.2%) |
| Single Unit, Attached | 0 (0.0%) | 4 (100.0%) |
| 2 Unit Apartments | 3 (12.0%) | 22 (88.0%) |
| 3 or 4 Unit Apartments | 2 (100.0%) | 0 (0.0%) |
| 5 to 9 Unit Apartments | 0 (0.0%) | 8 (100.0%) |
| 10 or more Apartments | 0 (0.0%) | 21 (100.0%) |
| Mobile Home / Other | 32 (100.0%) | 0 (0.0%) |
| Total | 350 (75.9%) | 111 (24.1%) |
Housing Structures by Number of Rooms in Lansing
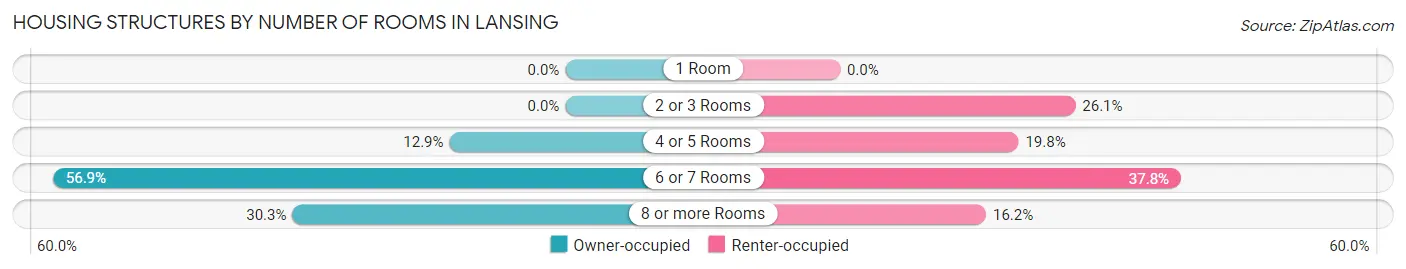
| Number of Rooms | Owner-occupied | Renter-occupied |
| 1 Room | 0 (0.0%) | 0 (0.0%) |
| 2 or 3 Rooms | 0 (0.0%) | 29 (26.1%) |
| 4 or 5 Rooms | 45 (12.9%) | 22 (19.8%) |
| 6 or 7 Rooms | 199 (56.9%) | 42 (37.8%) |
| 8 or more Rooms | 106 (30.3%) | 18 (16.2%) |
| Total | 350 (100.0%) | 111 (100.0%) |
Housing Structure by Heating Type in Lansing
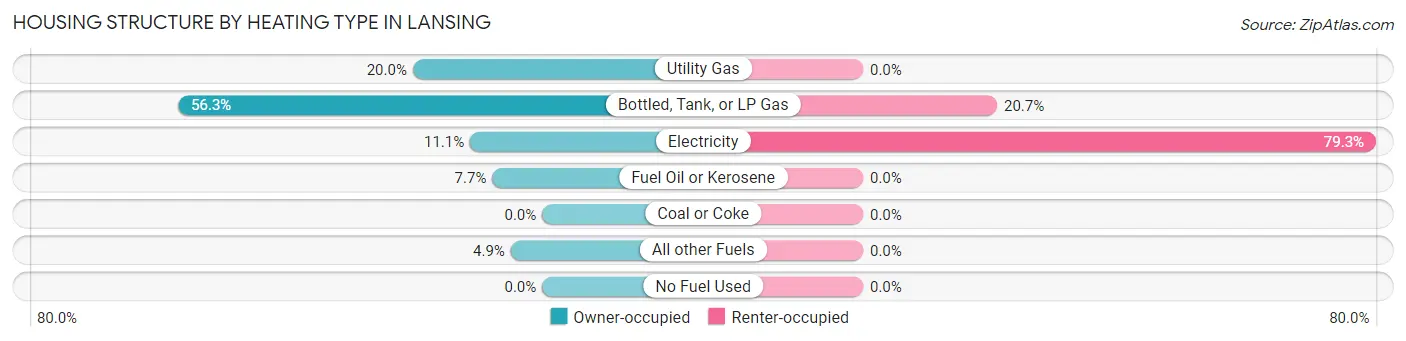
| Heating Type | Owner-occupied | Renter-occupied |
| Utility Gas | 70 (20.0%) | 0 (0.0%) |
| Bottled, Tank, or LP Gas | 197 (56.3%) | 23 (20.7%) |
| Electricity | 39 (11.1%) | 88 (79.3%) |
| Fuel Oil or Kerosene | 27 (7.7%) | 0 (0.0%) |
| Coal or Coke | 0 (0.0%) | 0 (0.0%) |
| All other Fuels | 17 (4.9%) | 0 (0.0%) |
| No Fuel Used | 0 (0.0%) | 0 (0.0%) |
| Total | 350 (100.0%) | 111 (100.0%) |
Household Vehicle Usage in Lansing
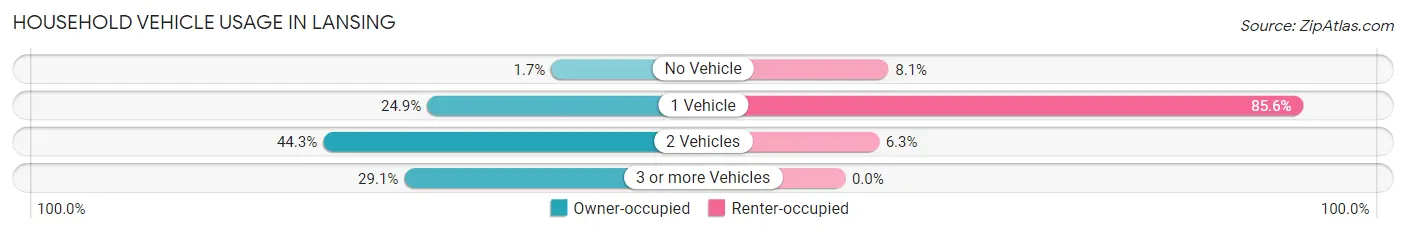
| Vehicles per Household | Owner-occupied | Renter-occupied |
| No Vehicle | 6 (1.7%) | 9 (8.1%) |
| 1 Vehicle | 87 (24.9%) | 95 (85.6%) |
| 2 Vehicles | 155 (44.3%) | 7 (6.3%) |
| 3 or more Vehicles | 102 (29.1%) | 0 (0.0%) |
| Total | 350 (100.0%) | 111 (100.0%) |
Real Estate & Mortgages in Lansing
Real Estate and Mortgage Overview in Lansing
| Characteristic | Without Mortgage | With Mortgage |
| Housing Units | 164 | 186 |
| Median Property Value | $131,500 | $116,100 |
| Median Household Income | $47,969 | $8 |
| Monthly Housing Costs | $490 | $3 |
| Real Estate Taxes | $2,250 | $0 |
Property Value by Mortgage Status in Lansing
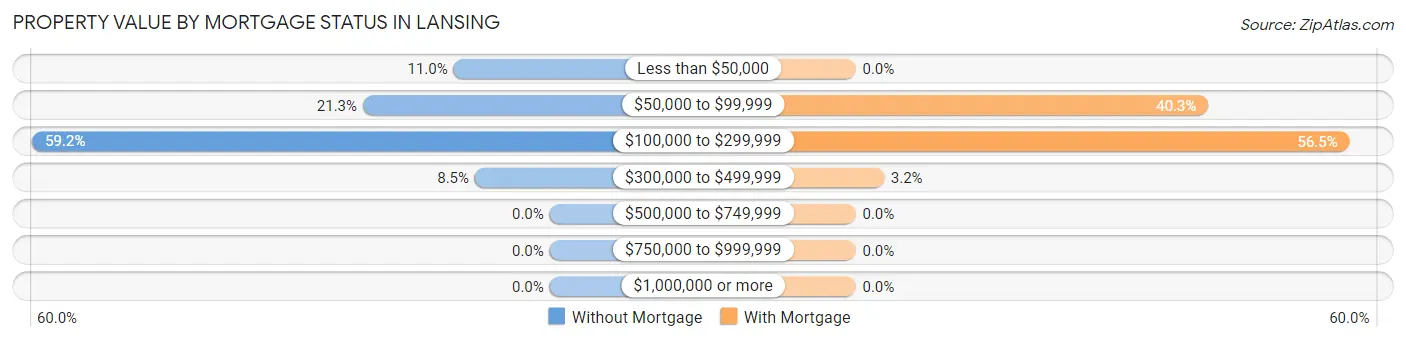
| Property Value | Without Mortgage | With Mortgage |
| Less than $50,000 | 18 (11.0%) | 0 (0.0%) |
| $50,000 to $99,999 | 35 (21.3%) | 75 (40.3%) |
| $100,000 to $299,999 | 97 (59.2%) | 105 (56.5%) |
| $300,000 to $499,999 | 14 (8.5%) | 6 (3.2%) |
| $500,000 to $749,999 | 0 (0.0%) | 0 (0.0%) |
| $750,000 to $999,999 | 0 (0.0%) | 0 (0.0%) |
| $1,000,000 or more | 0 (0.0%) | 0 (0.0%) |
| Total | 164 (100.0%) | 186 (100.0%) |
Household Income by Mortgage Status in Lansing
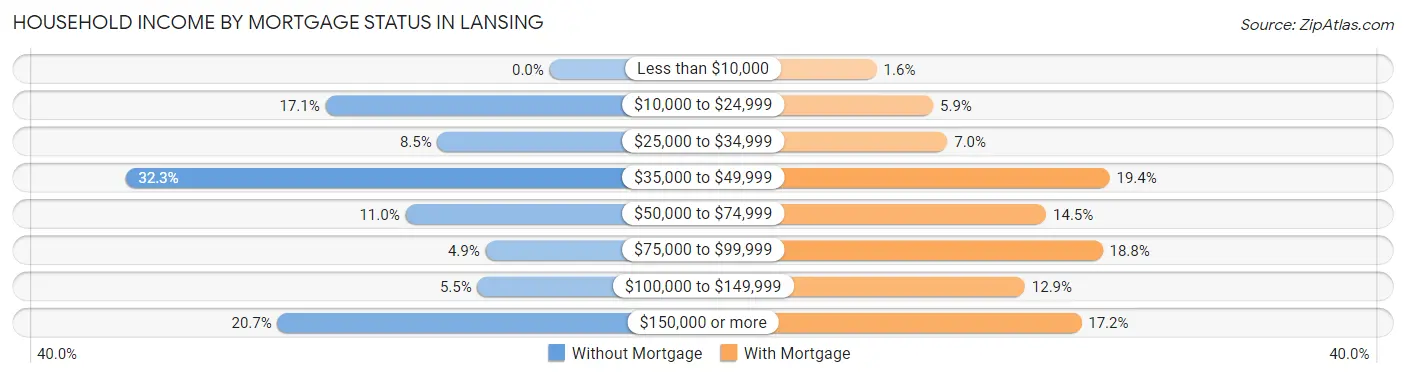
| Household Income | Without Mortgage | With Mortgage |
| Less than $10,000 | 0 (0.0%) | 3 (1.6%) |
| $10,000 to $24,999 | 28 (17.1%) | 11 (5.9%) |
| $25,000 to $34,999 | 14 (8.5%) | 13 (7.0%) |
| $35,000 to $49,999 | 53 (32.3%) | 36 (19.4%) |
| $50,000 to $74,999 | 18 (11.0%) | 27 (14.5%) |
| $75,000 to $99,999 | 8 (4.9%) | 35 (18.8%) |
| $100,000 to $149,999 | 9 (5.5%) | 24 (12.9%) |
| $150,000 or more | 34 (20.7%) | 32 (17.2%) |
| Total | 164 (100.0%) | 186 (100.0%) |
Property Value to Household Income Ratio in Lansing
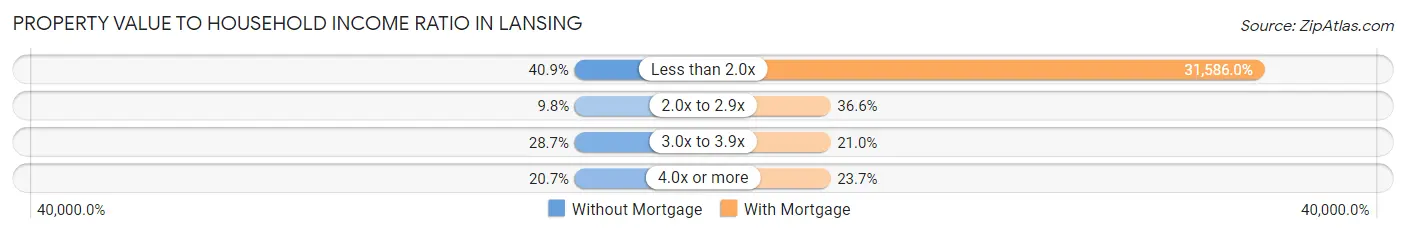
| Value-to-Income Ratio | Without Mortgage | With Mortgage |
| Less than 2.0x | 67 (40.8%) | 58,750 (31,586.0%) |
| 2.0x to 2.9x | 16 (9.8%) | 68 (36.6%) |
| 3.0x to 3.9x | 47 (28.7%) | 39 (21.0%) |
| 4.0x or more | 34 (20.7%) | 44 (23.7%) |
| Total | 164 (100.0%) | 186 (100.0%) |
Real Estate Taxes by Mortgage Status in Lansing
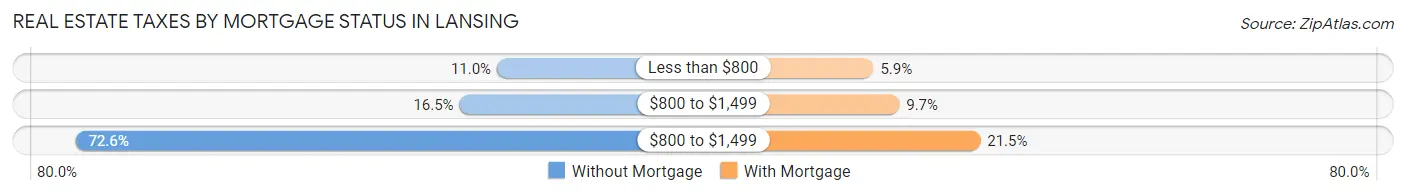
| Property Taxes | Without Mortgage | With Mortgage |
| Less than $800 | 18 (11.0%) | 11 (5.9%) |
| $800 to $1,499 | 27 (16.5%) | 18 (9.7%) |
| $800 to $1,499 | 119 (72.6%) | 40 (21.5%) |
| Total | 164 (100.0%) | 186 (100.0%) |
Health & Disability in Lansing
Health Insurance Coverage by Age in Lansing
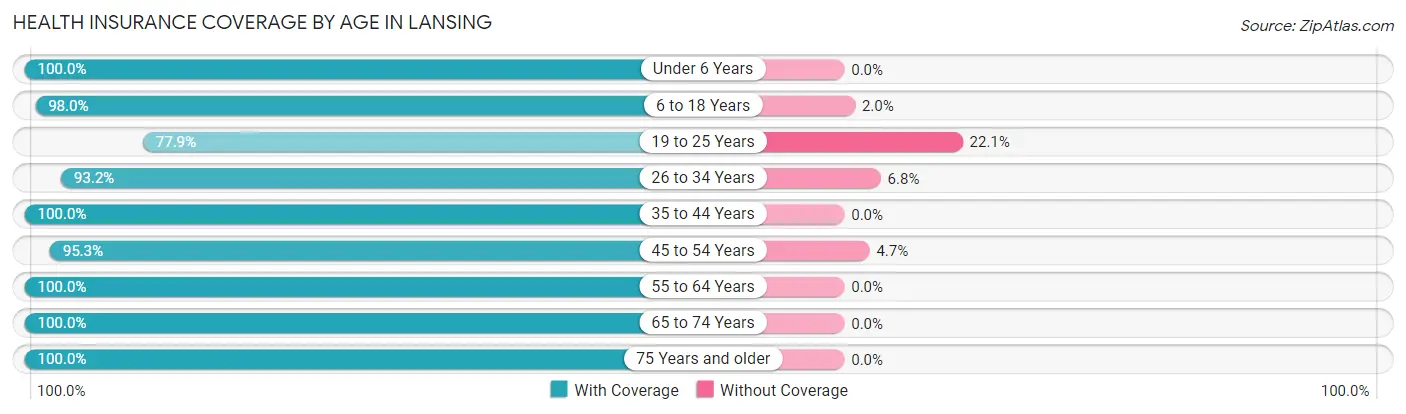
| Age Bracket | With Coverage | Without Coverage |
| Under 6 Years | 106 (100.0%) | 0 (0.0%) |
| 6 to 18 Years | 148 (98.0%) | 3 (2.0%) |
| 19 to 25 Years | 53 (77.9%) | 15 (22.1%) |
| 26 to 34 Years | 55 (93.2%) | 4 (6.8%) |
| 35 to 44 Years | 74 (100.0%) | 0 (0.0%) |
| 45 to 54 Years | 142 (95.3%) | 7 (4.7%) |
| 55 to 64 Years | 126 (100.0%) | 0 (0.0%) |
| 65 to 74 Years | 189 (100.0%) | 0 (0.0%) |
| 75 Years and older | 91 (100.0%) | 0 (0.0%) |
| Total | 984 (97.1%) | 29 (2.9%) |
Health Insurance Coverage by Citizenship Status in Lansing
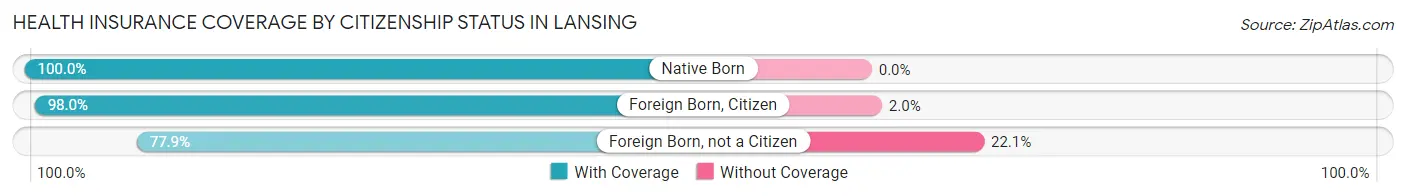
| Citizenship Status | With Coverage | Without Coverage |
| Native Born | 106 (100.0%) | 0 (0.0%) |
| Foreign Born, Citizen | 148 (98.0%) | 3 (2.0%) |
| Foreign Born, not a Citizen | 53 (77.9%) | 15 (22.1%) |
Health Insurance Coverage by Household Income in Lansing
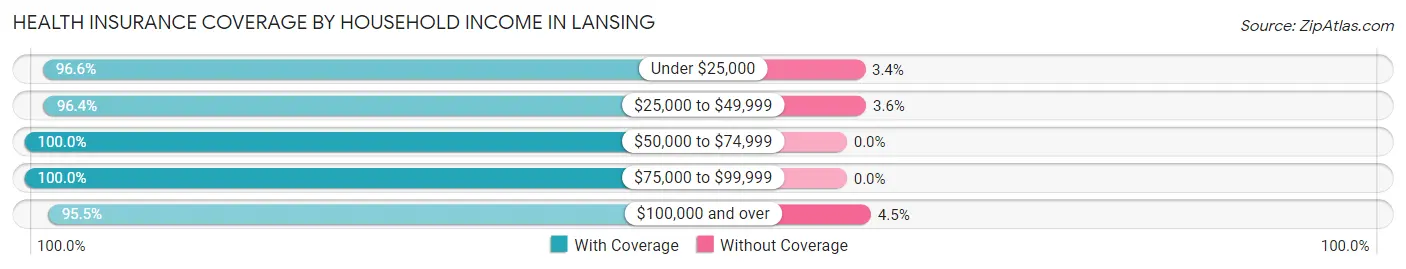
| Household Income | With Coverage | Without Coverage |
| Under $25,000 | 113 (96.6%) | 4 (3.4%) |
| $25,000 to $49,999 | 401 (96.4%) | 15 (3.6%) |
| $50,000 to $74,999 | 151 (100.0%) | 0 (0.0%) |
| $75,000 to $99,999 | 108 (100.0%) | 0 (0.0%) |
| $100,000 and over | 211 (95.5%) | 10 (4.5%) |
Public vs Private Health Insurance Coverage by Age in Lansing
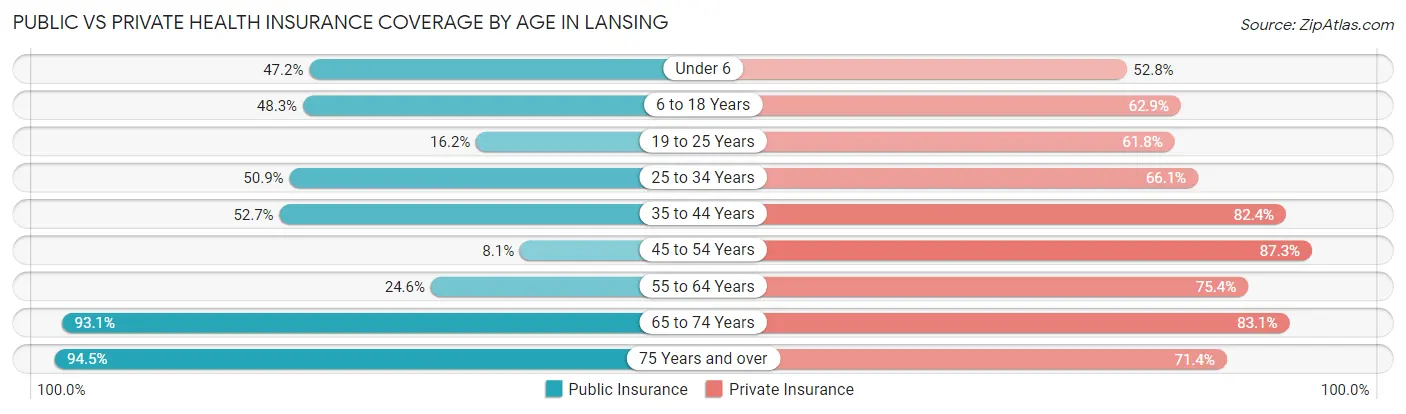
| Age Bracket | Public Insurance | Private Insurance |
| Under 6 | 50 (47.2%) | 56 (52.8%) |
| 6 to 18 Years | 73 (48.3%) | 95 (62.9%) |
| 19 to 25 Years | 11 (16.2%) | 42 (61.8%) |
| 25 to 34 Years | 30 (50.8%) | 39 (66.1%) |
| 35 to 44 Years | 39 (52.7%) | 61 (82.4%) |
| 45 to 54 Years | 12 (8.1%) | 130 (87.3%) |
| 55 to 64 Years | 31 (24.6%) | 95 (75.4%) |
| 65 to 74 Years | 176 (93.1%) | 157 (83.1%) |
| 75 Years and over | 86 (94.5%) | 65 (71.4%) |
| Total | 508 (50.1%) | 740 (73.1%) |
Disability Status by Sex by Age in Lansing
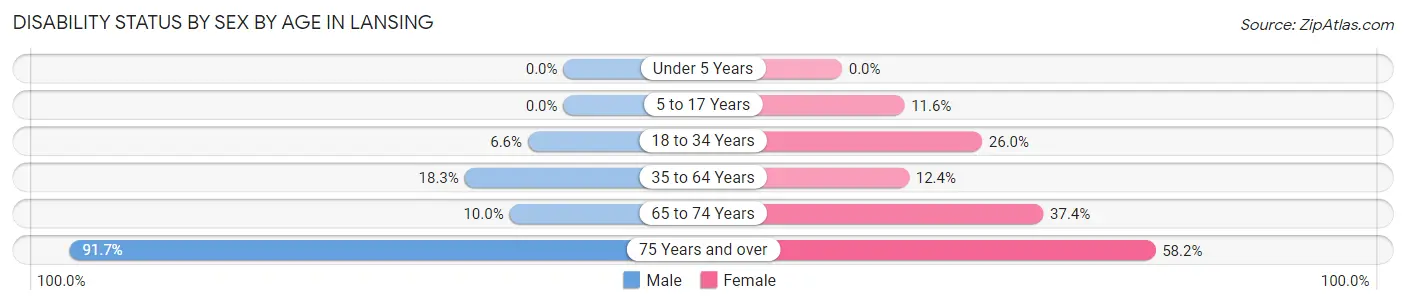
| Age Bracket | Male | Female |
| Under 5 Years | 0 (0.0%) | 0 (0.0%) |
| 5 to 17 Years | 0 (0.0%) | 11 (11.6%) |
| 18 to 34 Years | 6 (6.6%) | 13 (26.0%) |
| 35 to 64 Years | 33 (18.3%) | 21 (12.4%) |
| 65 to 74 Years | 9 (10.0%) | 37 (37.4%) |
| 75 Years and over | 33 (91.7%) | 32 (58.2%) |
Disability Class by Sex by Age in Lansing
Disability Class: Hearing Difficulty
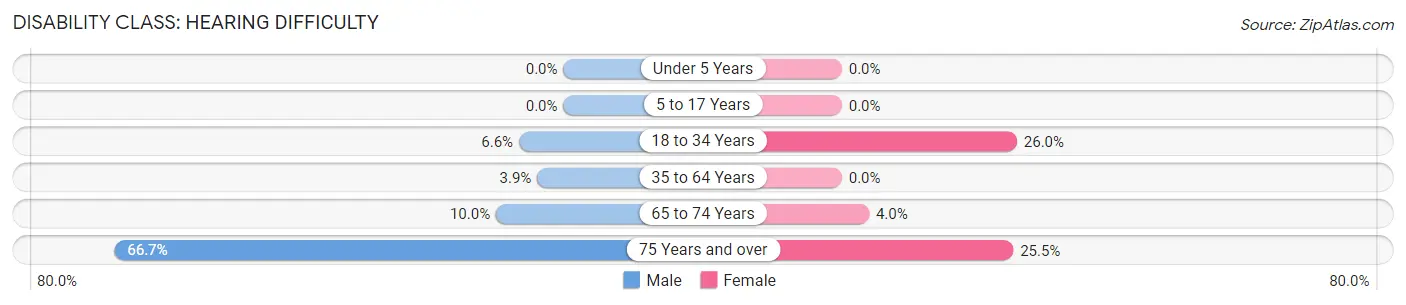
| Age Bracket | Male | Female |
| Under 5 Years | 0 (0.0%) | 0 (0.0%) |
| 5 to 17 Years | 0 (0.0%) | 0 (0.0%) |
| 18 to 34 Years | 6 (6.6%) | 13 (26.0%) |
| 35 to 64 Years | 7 (3.9%) | 0 (0.0%) |
| 65 to 74 Years | 9 (10.0%) | 4 (4.0%) |
| 75 Years and over | 24 (66.7%) | 14 (25.5%) |
Disability Class: Vision Difficulty
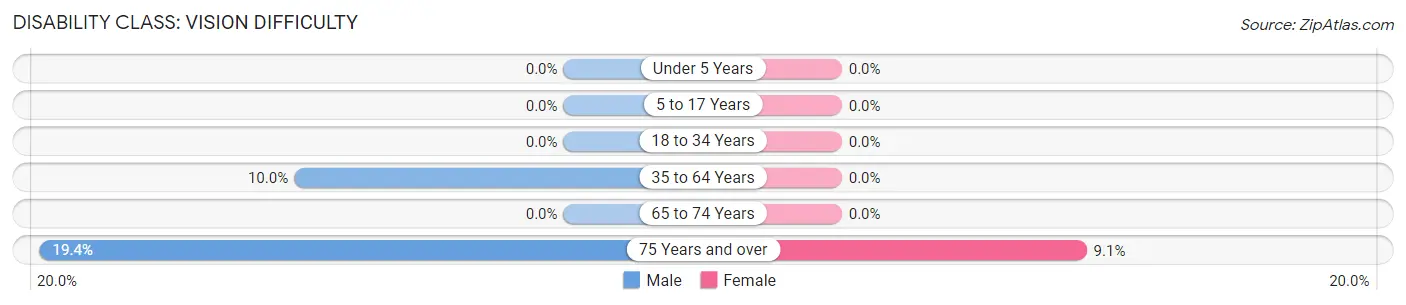
| Age Bracket | Male | Female |
| Under 5 Years | 0 (0.0%) | 0 (0.0%) |
| 5 to 17 Years | 0 (0.0%) | 0 (0.0%) |
| 18 to 34 Years | 0 (0.0%) | 0 (0.0%) |
| 35 to 64 Years | 18 (10.0%) | 0 (0.0%) |
| 65 to 74 Years | 0 (0.0%) | 0 (0.0%) |
| 75 Years and over | 7 (19.4%) | 5 (9.1%) |
Disability Class: Cognitive Difficulty
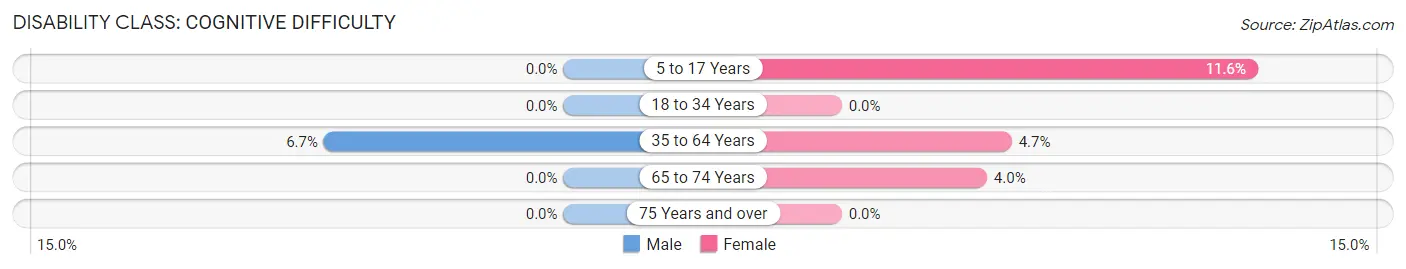
| Age Bracket | Male | Female |
| 5 to 17 Years | 0 (0.0%) | 11 (11.6%) |
| 18 to 34 Years | 0 (0.0%) | 0 (0.0%) |
| 35 to 64 Years | 12 (6.7%) | 8 (4.7%) |
| 65 to 74 Years | 0 (0.0%) | 4 (4.0%) |
| 75 Years and over | 0 (0.0%) | 0 (0.0%) |
Disability Class: Ambulatory Difficulty
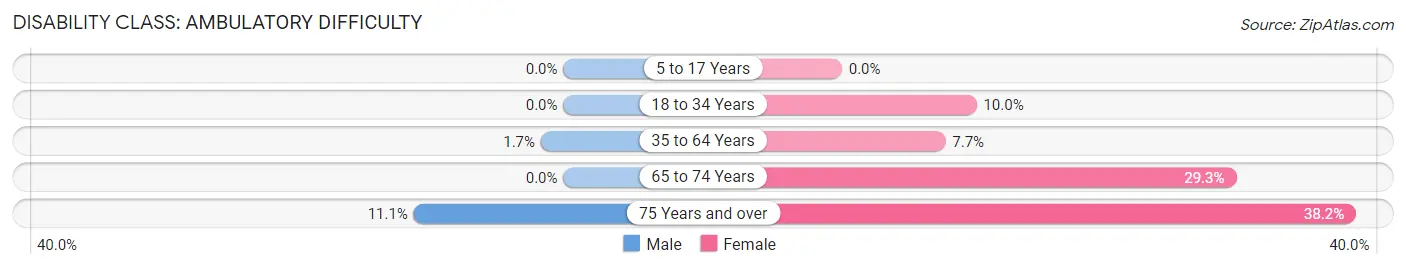
| Age Bracket | Male | Female |
| 5 to 17 Years | 0 (0.0%) | 0 (0.0%) |
| 18 to 34 Years | 0 (0.0%) | 5 (10.0%) |
| 35 to 64 Years | 3 (1.7%) | 13 (7.7%) |
| 65 to 74 Years | 0 (0.0%) | 29 (29.3%) |
| 75 Years and over | 4 (11.1%) | 21 (38.2%) |
Disability Class: Self-Care Difficulty
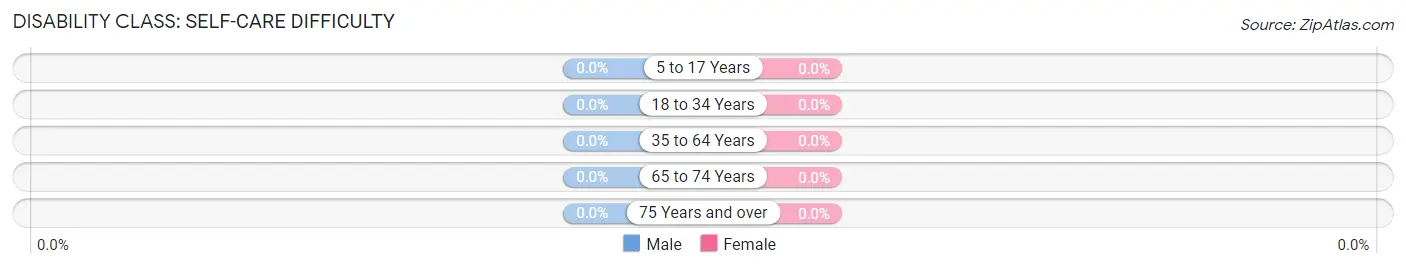
| Age Bracket | Male | Female |
| 5 to 17 Years | 0 (0.0%) | 0 (0.0%) |
| 18 to 34 Years | 0 (0.0%) | 0 (0.0%) |
| 35 to 64 Years | 0 (0.0%) | 0 (0.0%) |
| 65 to 74 Years | 0 (0.0%) | 0 (0.0%) |
| 75 Years and over | 0 (0.0%) | 0 (0.0%) |
Technology Access in Lansing
Computing Device Access in Lansing
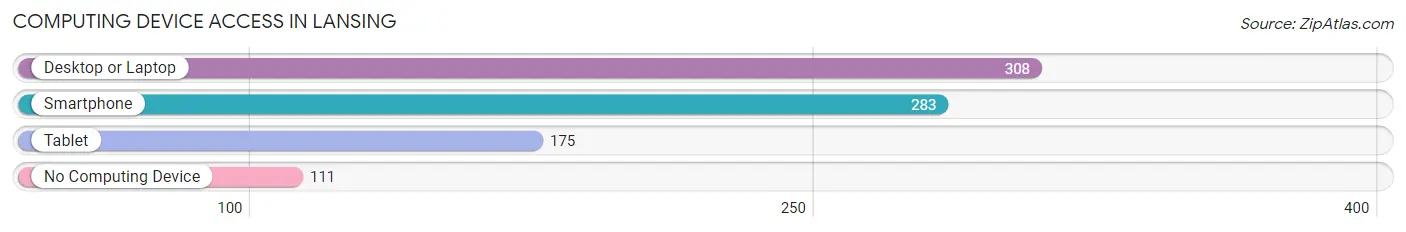
| Device Type | # Households | % Households |
| Desktop or Laptop | 308 | 66.8% |
| Smartphone | 283 | 61.4% |
| Tablet | 175 | 38.0% |
| No Computing Device | 111 | 24.1% |
| Total | 461 | 100.0% |
Internet Access in Lansing
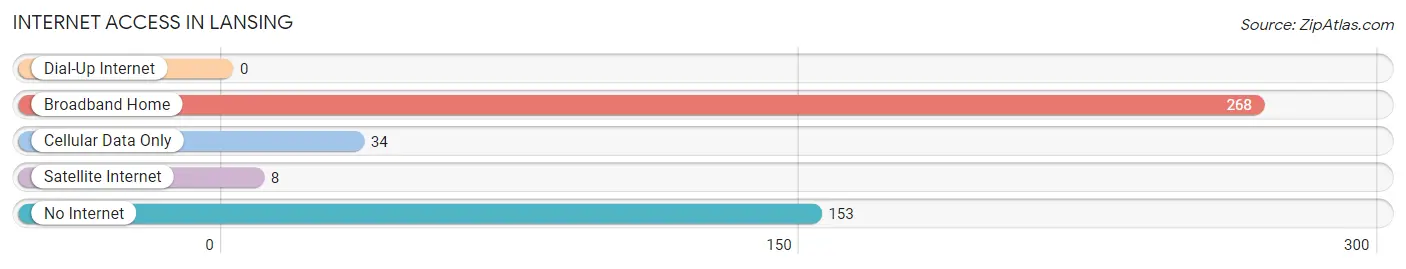
| Internet Type | # Households | % Households |
| Dial-Up Internet | 0 | 0.0% |
| Broadband Home | 268 | 58.1% |
| Cellular Data Only | 34 | 7.4% |
| Satellite Internet | 8 | 1.7% |
| No Internet | 153 | 33.2% |
| Total | 461 | 100.0% |
Lansing Summary
Lansing is a city located in Allamakee County, Iowa, United States. The population was 1,072 at the 2010 census. It is the county seat of Allamakee County.
Geography
Lansing is located at the intersection of U.S. Route 18 and Iowa Highway 76. It is situated on the banks of the Upper Iowa River, which flows through the city. The city is located in the Driftless Area, a region of the Midwest that was not glaciated during the last ice age. The city is surrounded by rolling hills and bluffs, and is known for its scenic beauty.
The city has a total area of 1 2 square miles 3 2 km2 all of it land
History
Lansing was founded in 1851 by a group of settlers from Lansing, Michigan. The city was named after the Michigan city, and was incorporated in 1858.
The city was an important stop on the Upper Iowa River, and was a major trading center for the region. The city was also an important stop on the stagecoach route between Dubuque and La Crosse, Wisconsin.
The city was the site of a major Civil War battle in 1862, when Union forces defeated Confederate forces in the Battle of Lansing.
Economy
Lansing is a small, rural community with a diverse economy. The city is home to several small businesses, including a grocery store, a hardware store, a lumber yard, and a variety of restaurants and bars.
The city is also home to several manufacturing companies, including a furniture manufacturer, a metal fabrication company, and a plastics manufacturer.
The city is also home to a number of agricultural businesses, including a dairy farm, a hog farm, and a grain elevator.
Demographics
As of the 2010 census, there were 1,072 people, 441 households, and 279 families residing in the city. The population density was 890.2 people per square mile (344.3/km2). There were 476 housing units at an average density of 393.3 per square mile (151.7/km2). The racial makeup of the city was 98.3% White, 0.2% African American, 0.2% Native American, 0.2% Asian, 0.2% from other races, and 0.9% from two or more races. Hispanic or Latino of any race were 0.7% of the population.
There were 441 households, out of which 28.2% had children under the age of 18 living with them, 51.6% were married couples living together, 8.4% had a female householder with no husband present, and 36.2% were non-families. 32.2% of all households were made up of individuals, and 17.3% had someone living alone who was 65 years of age or older. The average household size was 2.31 and the average family size was 2.90.
In the city, the population was spread out, with 24.2% under the age of 18, 6.2% from 18 to 24, 24.2% from 25 to 44, 24.2% from 45 to 64, and 21.2% who were 65 years of age or older. The median age was 42 years. For every 100 females, there were 91.2 males. For every 100 females age 18 and over, there were 87.2 males.
The median income for a household in the city was $35,000, and the median income for a family was $41,250. Males had a median income of $30,000 versus $20,000 for females. The per capita income for the city was $17,845. About 6.2% of families and 8.2% of the population were below the poverty line, including 10.2% of those under age 18 and 8.2% of those age 65 or over.
Common Questions
What is Per Capita Income in Lansing?
Per Capita income in Lansing is $31,202.
What is the Median Family Income in Lansing?
Median Family Income in Lansing is $49,286.
What is the Median Household income in Lansing?
Median Household Income in Lansing is $47,730.
What is Income or Wage Gap in Lansing?
Income or Wage Gap in Lansing is 17.9%.
Women in Lansing earn 82.1 cents for every dollar earned by a man.
What is Inequality or Gini Index in Lansing?
Inequality or Gini Index in Lansing is 0.47.
What is the Total Population of Lansing?
Total Population of Lansing is 1,053.
What is the Total Male Population of Lansing?
Total Male Population of Lansing is 508.
What is the Total Female Population of Lansing?
Total Female Population of Lansing is 545.
What is the Ratio of Males per 100 Females in Lansing?
There are 93.21 Males per 100 Females in Lansing.
What is the Ratio of Females per 100 Males in Lansing?
There are 107.28 Females per 100 Males in Lansing.
What is the Median Population Age in Lansing?
Median Population Age in Lansing is 49.5 Years.
What is the Average Family Size in Lansing
Average Family Size in Lansing is 2.8 People.
What is the Average Household Size in Lansing
Average Household Size in Lansing is 2.2 People.
How Large is the Labor Force in Lansing?
There are 486 People in the Labor Forcein in Lansing.
What is the Percentage of People in the Labor Force in Lansing?
57.2% of People are in the Labor Force in Lansing.
What is the Unemployment Rate in Lansing?
Unemployment Rate in Lansing is 4.9%.