Takoma Park, MD Map & Demographics
Takoma Park Map
Takoma Park Overview
$55,631
PER CAPITA INCOME
$137,738
AVG FAMILY INCOME
$95,316
AVG HOUSEHOLD INCOME
20.5%
WAGE / INCOME GAP [ % ]
79.5¢/ $1
WAGE / INCOME GAP [ $ ]
0.49
INEQUALITY / GINI INDEX
17,542
TOTAL POPULATION
8,304
MALE POPULATION
9,238
FEMALE POPULATION
89.89
MALES / 100 FEMALES
111.25
FEMALES / 100 MALES
41.2
MEDIAN AGE
3.2
AVG FAMILY SIZE
2.5
AVG HOUSEHOLD SIZE
9,784
LABOR FORCE [ PEOPLE ]
72.9%
PERCENT IN LABOR FORCE
5.1%
UNEMPLOYMENT RATE
Takoma Park Zip Codes
Income in Takoma Park
Income Overview in Takoma Park
Per Capita Income in Takoma Park is $55,631, while median incomes of families and households are $137,738 and $95,316 respectively.
| Characteristic | Number | Measure |
| Per Capita Income | 17,542 | $55,631 |
| Median Family Income | 4,310 | $137,738 |
| Mean Family Income | 4,310 | $173,335 |
| Median Household Income | 6,898 | $95,316 |
| Mean Household Income | 6,898 | $139,050 |
| Income Deficit | 4,310 | $0 |
| Wage / Income Gap (%) | 17,542 | 20.53% |
| Wage / Income Gap ($) | 17,542 | 79.47¢ per $1 |
| Gini / Inequality Index | 17,542 | 0.49 |
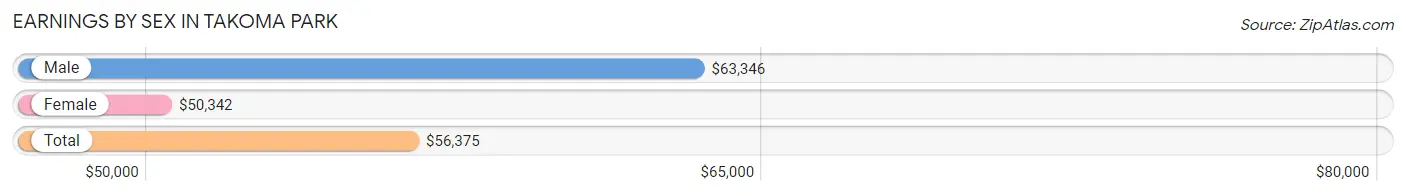
Earnings by Sex in Takoma Park
Average Earnings in Takoma Park are $56,375, $63,346 for men and $50,342 for women, a difference of 20.5%.
| Sex | Number | Average Earnings |
| Male | 4,938 (48.8%) | $63,346 |
| Female | 5,171 (51.1%) | $50,342 |
| Total | 10,109 (100.0%) | $56,375 |
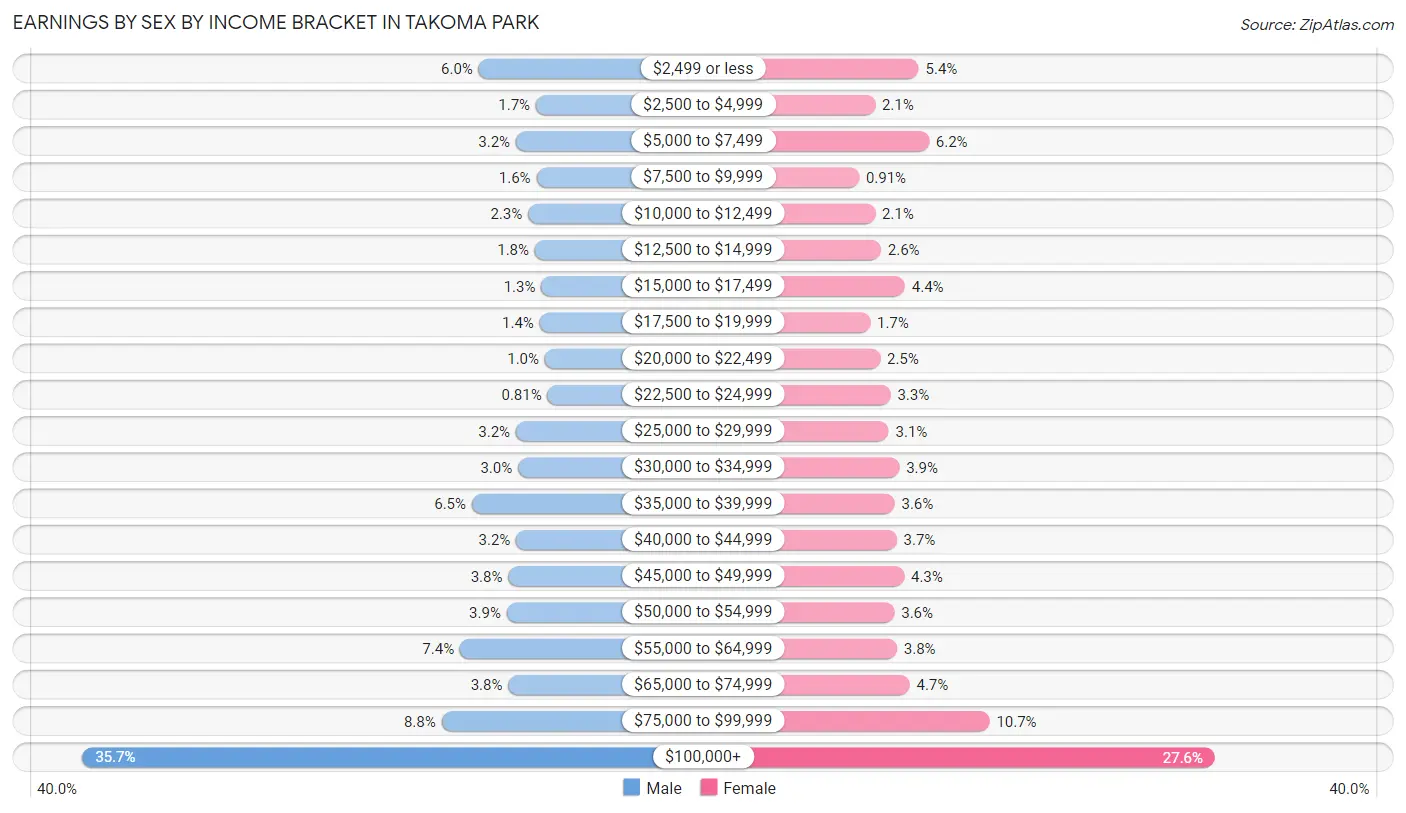
Earnings by Sex by Income Bracket in Takoma Park
The most common earnings brackets in Takoma Park are $100,000+ for men (1,762 | 35.7%) and $100,000+ for women (1,426 | 27.6%).
| Income | Male | Female |
| $2,499 or less | 295 (6.0%) | 278 (5.4%) |
| $2,500 to $4,999 | 83 (1.7%) | 109 (2.1%) |
| $5,000 to $7,499 | 157 (3.2%) | 318 (6.1%) |
| $7,500 to $9,999 | 81 (1.6%) | 47 (0.9%) |
| $10,000 to $12,499 | 112 (2.3%) | 109 (2.1%) |
| $12,500 to $14,999 | 87 (1.8%) | 132 (2.5%) |
| $15,000 to $17,499 | 63 (1.3%) | 225 (4.3%) |
| $17,500 to $19,999 | 69 (1.4%) | 90 (1.7%) |
| $20,000 to $22,499 | 50 (1.0%) | 129 (2.5%) |
| $22,500 to $24,999 | 40 (0.8%) | 169 (3.3%) |
| $25,000 to $29,999 | 157 (3.2%) | 162 (3.1%) |
| $30,000 to $34,999 | 149 (3.0%) | 203 (3.9%) |
| $35,000 to $39,999 | 320 (6.5%) | 185 (3.6%) |
| $40,000 to $44,999 | 156 (3.2%) | 193 (3.7%) |
| $45,000 to $49,999 | 185 (3.7%) | 222 (4.3%) |
| $50,000 to $54,999 | 191 (3.9%) | 184 (3.6%) |
| $55,000 to $64,999 | 364 (7.4%) | 194 (3.7%) |
| $65,000 to $74,999 | 185 (3.7%) | 243 (4.7%) |
| $75,000 to $99,999 | 432 (8.7%) | 553 (10.7%) |
| $100,000+ | 1,762 (35.7%) | 1,426 (27.6%) |
| Total | 4,938 (100.0%) | 5,171 (100.0%) |
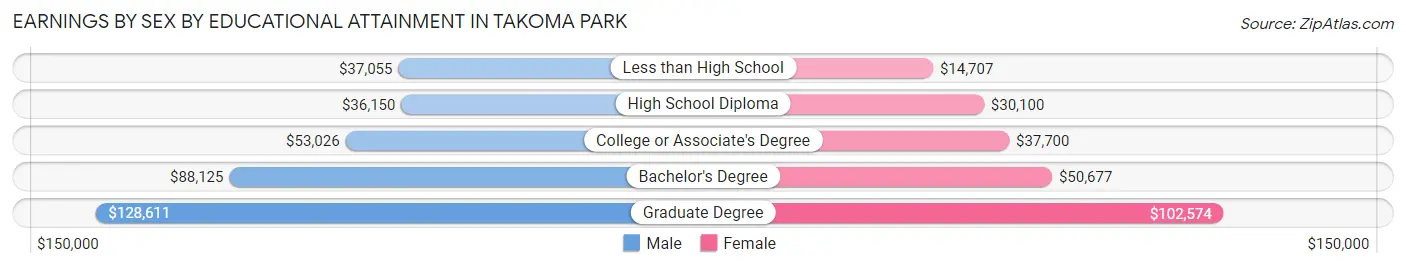
Earnings by Sex by Educational Attainment in Takoma Park
Average earnings in Takoma Park are $70,110 for men and $55,833 for women, a difference of 20.4%. Men with an educational attainment of graduate degree enjoy the highest average annual earnings of $128,611, while those with high school diploma education earn the least with $36,150. Women with an educational attainment of graduate degree earn the most with the average annual earnings of $102,574, while those with less than high school education have the smallest earnings of $14,707.
| Educational Attainment | Male Income | Female Income |
| Less than High School | $37,055 | $14,707 |
| High School Diploma | $36,150 | $30,100 |
| College or Associate's Degree | $53,026 | $37,700 |
| Bachelor's Degree | $88,125 | $50,677 |
| Graduate Degree | $128,611 | $102,574 |
| Total | $70,110 | $55,833 |
Family Income in Takoma Park
Family Income Brackets in Takoma Park
According to the Takoma Park family income data, there are 1,431 families falling into the $200,000+ income range, which is the most common income bracket and makes up 33.2% of all families. Conversely, the $10,000 to $14,999 income bracket is the least frequent group with only 56 families (1.3%) belonging to this category.
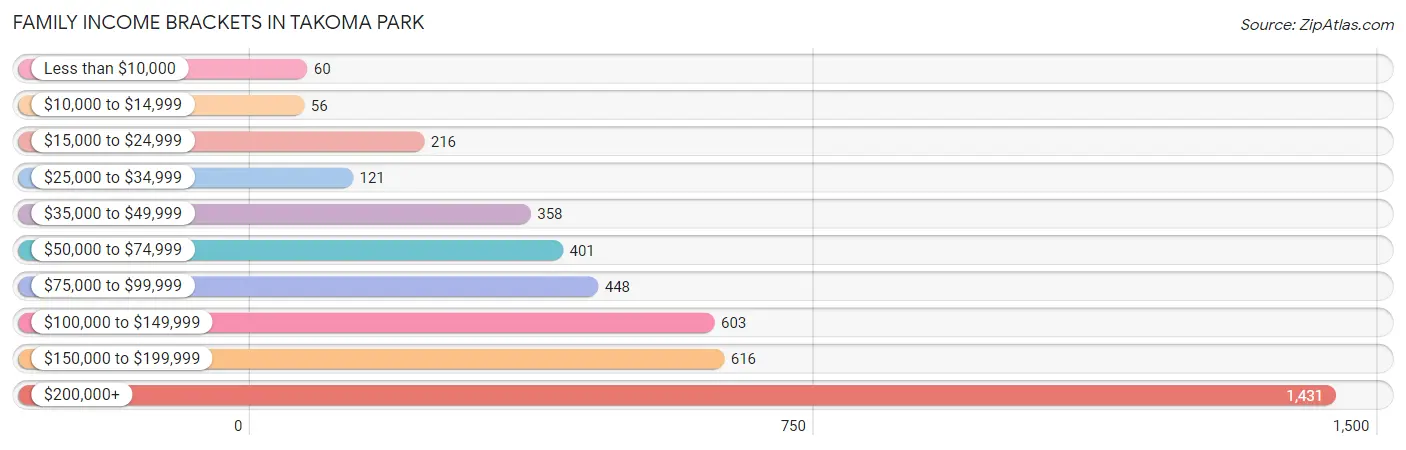
| Income Bracket | # Families | % Families |
| Less than $10,000 | 60 | 1.4% |
| $10,000 to $14,999 | 56 | 1.3% |
| $15,000 to $24,999 | 216 | 5.0% |
| $25,000 to $34,999 | 121 | 2.8% |
| $35,000 to $49,999 | 358 | 8.3% |
| $50,000 to $74,999 | 401 | 9.3% |
| $75,000 to $99,999 | 448 | 10.4% |
| $100,000 to $149,999 | 603 | 14.0% |
| $150,000 to $199,999 | 616 | 14.3% |
| $200,000+ | 1,431 | 33.2% |
Family Income by Famaliy Size in Takoma Park
5-person families (236 | 5.5%) account for the highest median family income in Takoma Park with $188,500 per family, while 2-person families (1,723 | 40.0%) have the highest median income of $54,688 per family member.
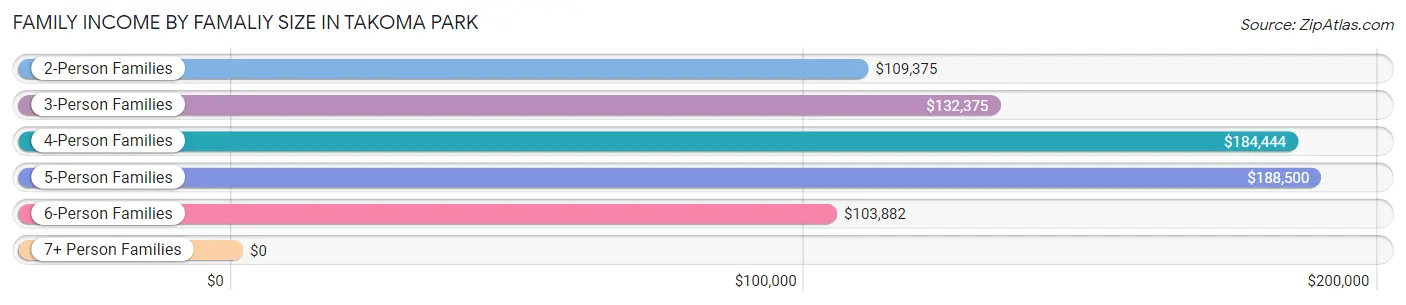
| Income Bracket | # Families | Median Income |
| 2-Person Families | 1,723 (40.0%) | $109,375 |
| 3-Person Families | 991 (23.0%) | $132,375 |
| 4-Person Families | 1,200 (27.8%) | $184,444 |
| 5-Person Families | 236 (5.5%) | $188,500 |
| 6-Person Families | 133 (3.1%) | $103,882 |
| 7+ Person Families | 27 (0.6%) | $0 |
| Total | 4,310 (100.0%) | $137,738 |
Family Income by Number of Earners in Takoma Park
The median family income in Takoma Park is $137,738, with families comprising 3+ earners (405) having the highest median family income of $220,625, while families with 1 earner (1,239) have the lowest median family income of $57,488, accounting for 9.4% and 28.7% of families, respectively.
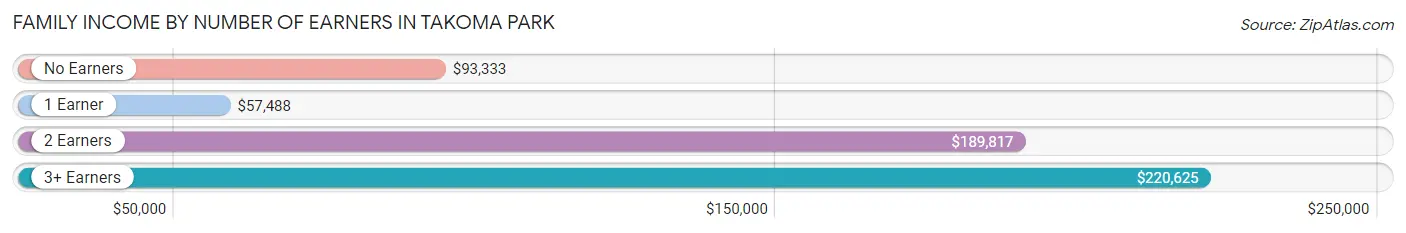
| Number of Earners | # Families | Median Income |
| No Earners | 356 (8.3%) | $93,333 |
| 1 Earner | 1,239 (28.7%) | $57,488 |
| 2 Earners | 2,310 (53.6%) | $189,817 |
| 3+ Earners | 405 (9.4%) | $220,625 |
| Total | 4,310 (100.0%) | $137,738 |
Household Income in Takoma Park
Household Income Brackets in Takoma Park
With 1,697 households falling in the category, the $200,000+ income range is the most frequent in Takoma Park, accounting for 24.6% of all households. In contrast, only 352 households (5.1%) fall into the $10,000 to $14,999 income bracket, making it the least populous group.
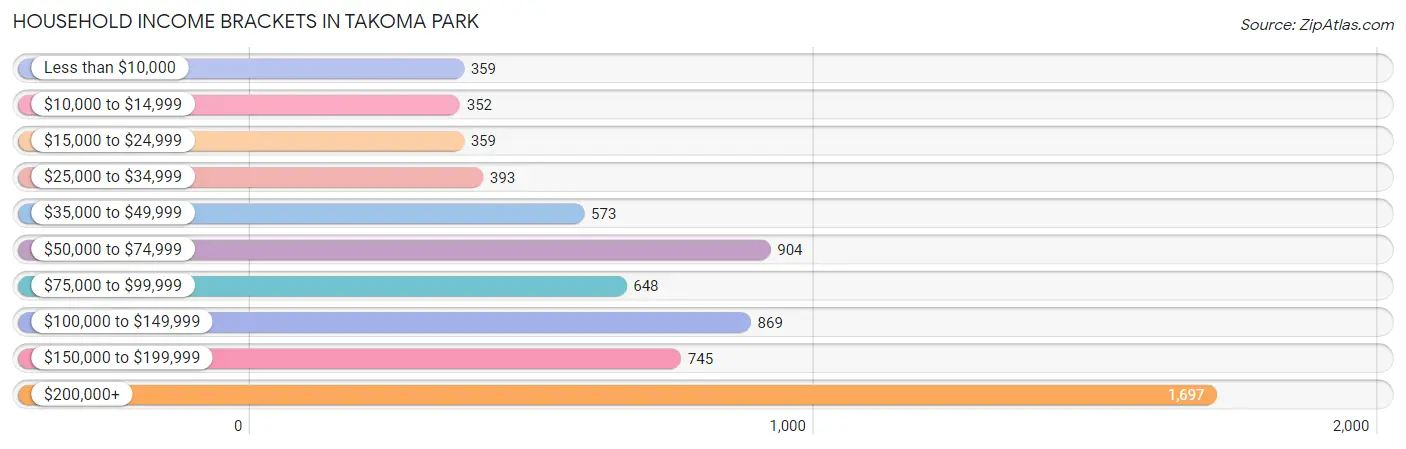
| Income Bracket | # Households | % Households |
| Less than $10,000 | 359 | 5.2% |
| $10,000 to $14,999 | 352 | 5.1% |
| $15,000 to $24,999 | 359 | 5.2% |
| $25,000 to $34,999 | 393 | 5.7% |
| $35,000 to $49,999 | 573 | 8.3% |
| $50,000 to $74,999 | 904 | 13.1% |
| $75,000 to $99,999 | 648 | 9.4% |
| $100,000 to $149,999 | 869 | 12.6% |
| $150,000 to $199,999 | 745 | 10.8% |
| $200,000+ | 1,697 | 24.6% |
Household Income by Householder Age in Takoma Park
The median household income in Takoma Park is $95,316, with the highest median household income of $116,400 found in the 45 to 64 years age bracket for the primary householder. A total of 3,068 households (44.5%) fall into this category. Meanwhile, the 15 to 24 years age bracket for the primary householder has the lowest median household income of $40,238, with 114 households (1.7%) in this group.
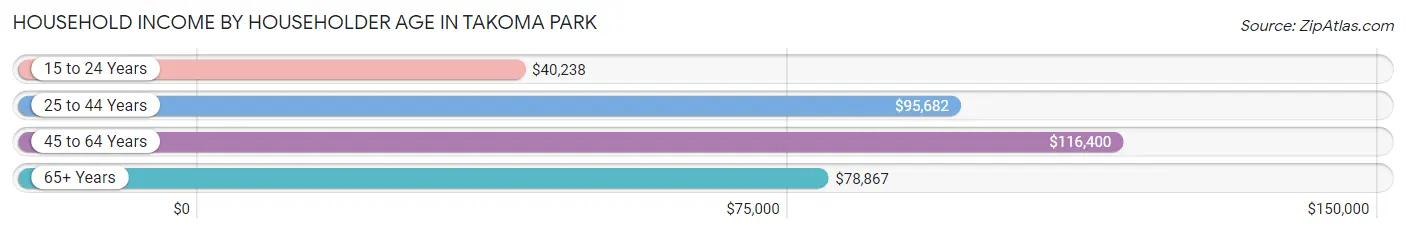
| Income Bracket | # Households | Median Income |
| 15 to 24 Years | 114 (1.7%) | $40,238 |
| 25 to 44 Years | 2,216 (32.1%) | $95,682 |
| 45 to 64 Years | 3,068 (44.5%) | $116,400 |
| 65+ Years | 1,500 (21.7%) | $78,867 |
| Total | 6,898 (100.0%) | $95,316 |
Poverty in Takoma Park
Income Below Poverty by Sex and Age in Takoma Park
With 8.0% poverty level for males and 9.8% for females among the residents of Takoma Park, 5 year old males and 18 to 24 year old females are the most vulnerable to poverty, with 34 males (23.0%) and 115 females (33.0%) in their respective age groups living below the poverty level.
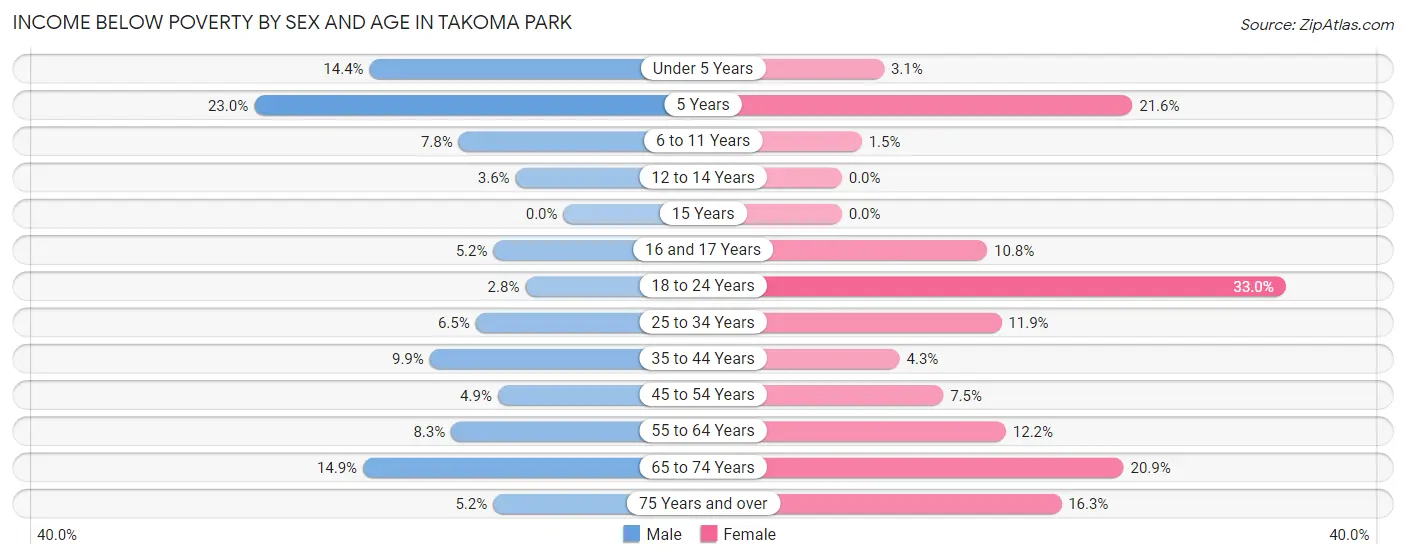
| Age Bracket | Male | Female |
| Under 5 Years | 73 (14.4%) | 23 (3.1%) |
| 5 Years | 34 (23.0%) | 33 (21.6%) |
| 6 to 11 Years | 64 (7.8%) | 11 (1.5%) |
| 12 to 14 Years | 13 (3.6%) | 0 (0.0%) |
| 15 Years | 0 (0.0%) | 0 (0.0%) |
| 16 and 17 Years | 9 (5.2%) | 30 (10.8%) |
| 18 to 24 Years | 13 (2.8%) | 115 (33.0%) |
| 25 to 34 Years | 42 (6.5%) | 104 (11.8%) |
| 35 to 44 Years | 134 (9.9%) | 64 (4.3%) |
| 45 to 54 Years | 70 (4.9%) | 109 (7.5%) |
| 55 to 64 Years | 88 (8.3%) | 154 (12.2%) |
| 65 to 74 Years | 100 (14.9%) | 163 (20.9%) |
| 75 Years and over | 18 (5.2%) | 87 (16.3%) |
| Total | 658 (8.0%) | 893 (9.8%) |
Income Above Poverty by Sex and Age in Takoma Park
According to the poverty statistics in Takoma Park, males aged 15 years and females aged 12 to 14 years are the age groups that are most secure financially, with 100.0% of males and 100.0% of females in these age groups living above the poverty line.
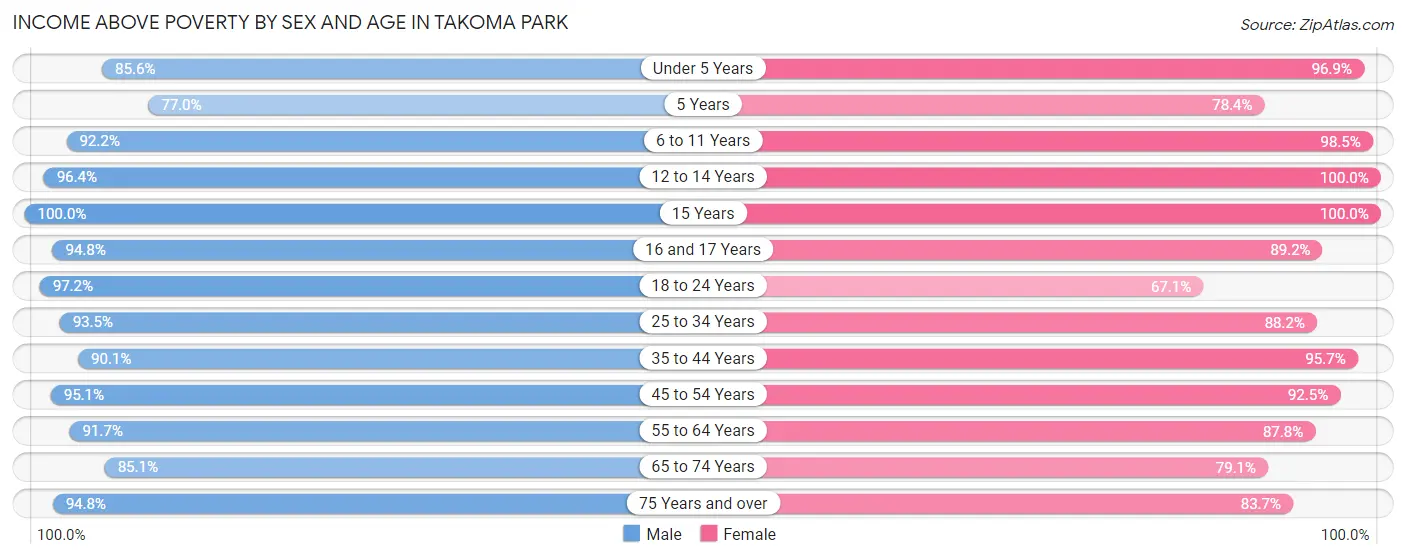
| Age Bracket | Male | Female |
| Under 5 Years | 434 (85.6%) | 711 (96.9%) |
| 5 Years | 114 (77.0%) | 120 (78.4%) |
| 6 to 11 Years | 759 (92.2%) | 730 (98.5%) |
| 12 to 14 Years | 352 (96.4%) | 330 (100.0%) |
| 15 Years | 203 (100.0%) | 113 (100.0%) |
| 16 and 17 Years | 164 (94.8%) | 248 (89.2%) |
| 18 to 24 Years | 447 (97.2%) | 234 (67.0%) |
| 25 to 34 Years | 602 (93.5%) | 774 (88.1%) |
| 35 to 44 Years | 1,215 (90.1%) | 1,427 (95.7%) |
| 45 to 54 Years | 1,367 (95.1%) | 1,339 (92.5%) |
| 55 to 64 Years | 967 (91.7%) | 1,110 (87.8%) |
| 65 to 74 Years | 572 (85.1%) | 616 (79.1%) |
| 75 Years and over | 327 (94.8%) | 447 (83.7%) |
| Total | 7,523 (92.0%) | 8,199 (90.2%) |
Income Below Poverty Among Married-Couple Families in Takoma Park
The poverty statistics for married-couple families in Takoma Park show that 4.0% or 132 of the total 3,284 families live below the poverty line. Families with 3 or 4 children have the highest poverty rate of 13.7%, comprising of 27 families. On the other hand, families with no children have the lowest poverty rate of 2.9%, which includes 41 families.
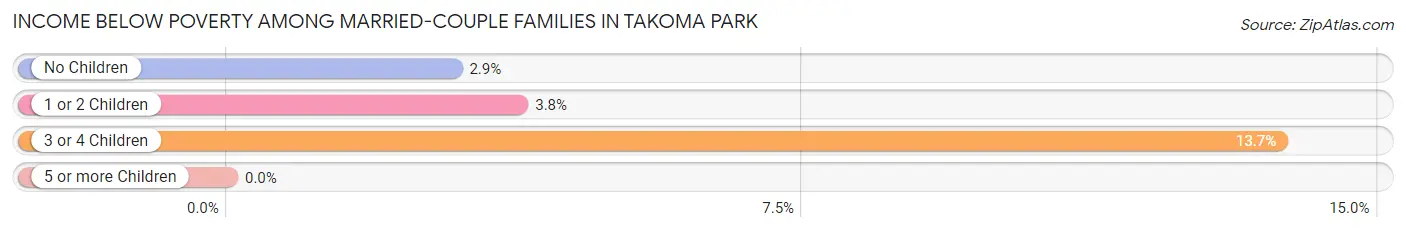
| Children | Above Poverty | Below Poverty |
| No Children | 1,356 (97.1%) | 41 (2.9%) |
| 1 or 2 Children | 1,626 (96.2%) | 64 (3.8%) |
| 3 or 4 Children | 170 (86.3%) | 27 (13.7%) |
| 5 or more Children | 0 (0.0%) | 0 (0.0%) |
| Total | 3,152 (96.0%) | 132 (4.0%) |
Income Below Poverty Among Single-Parent Households in Takoma Park
According to the poverty data in Takoma Park, 11.4% or 31 single-father households and 9.4% or 71 single-mother households are living below the poverty line. Among single-father households, those with 1 or 2 children have the highest poverty rate, with 31 households (15.0%) experiencing poverty. Likewise, among single-mother households, those with 1 or 2 children have the highest poverty rate, with 71 households (16.1%) falling below the poverty line.
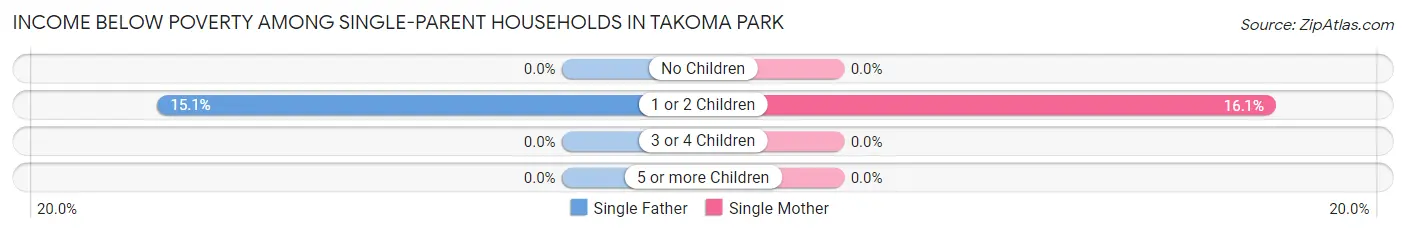
| Children | Single Father | Single Mother |
| No Children | 0 (0.0%) | 0 (0.0%) |
| 1 or 2 Children | 31 (15.0%) | 71 (16.1%) |
| 3 or 4 Children | 0 (0.0%) | 0 (0.0%) |
| 5 or more Children | 0 (0.0%) | 0 (0.0%) |
| Total | 31 (11.4%) | 71 (9.4%) |
Income Below Poverty Among Married-Couple vs Single-Parent Households in Takoma Park
The poverty data for Takoma Park shows that 132 of the married-couple family households (4.0%) and 102 of the single-parent households (9.9%) are living below the poverty level. Within the married-couple family households, those with 3 or 4 children have the highest poverty rate, with 27 households (13.7%) falling below the poverty line. Among the single-parent households, those with 1 or 2 children have the highest poverty rate, with 102 household (15.8%) living below poverty.
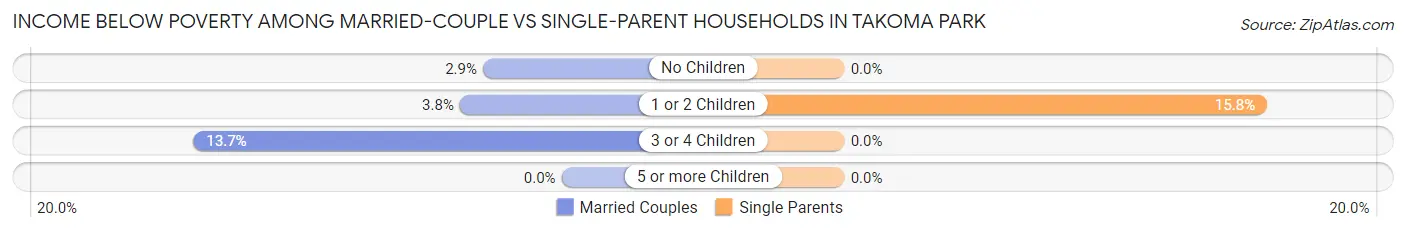
| Children | Married-Couple Families | Single-Parent Households |
| No Children | 41 (2.9%) | 0 (0.0%) |
| 1 or 2 Children | 64 (3.8%) | 102 (15.8%) |
| 3 or 4 Children | 27 (13.7%) | 0 (0.0%) |
| 5 or more Children | 0 (0.0%) | 0 (0.0%) |
| Total | 132 (4.0%) | 102 (9.9%) |
Race in Takoma Park
The most populous races in Takoma Park are White / Caucasian (7,672 | 43.7%), Black / African American (6,011 | 34.3%), and Hispanic or Latino (2,147 | 12.2%).
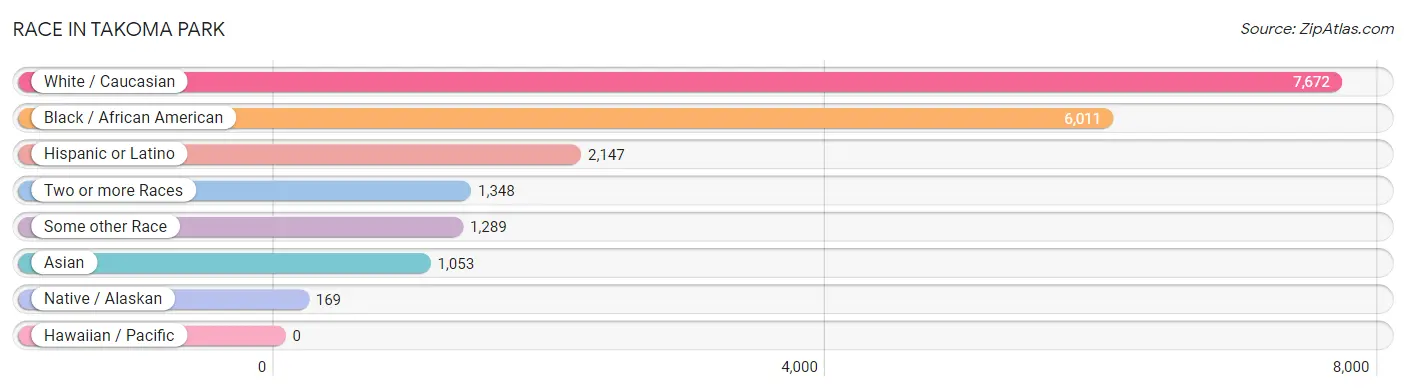
| Race | # Population | % Population |
| Asian | 1,053 | 6.0% |
| Black / African American | 6,011 | 34.3% |
| Hawaiian / Pacific | 0 | 0.0% |
| Hispanic or Latino | 2,147 | 12.2% |
| Native / Alaskan | 169 | 1.0% |
| White / Caucasian | 7,672 | 43.7% |
| Two or more Races | 1,348 | 7.7% |
| Some other Race | 1,289 | 7.3% |
| Total | 17,542 | 100.0% |
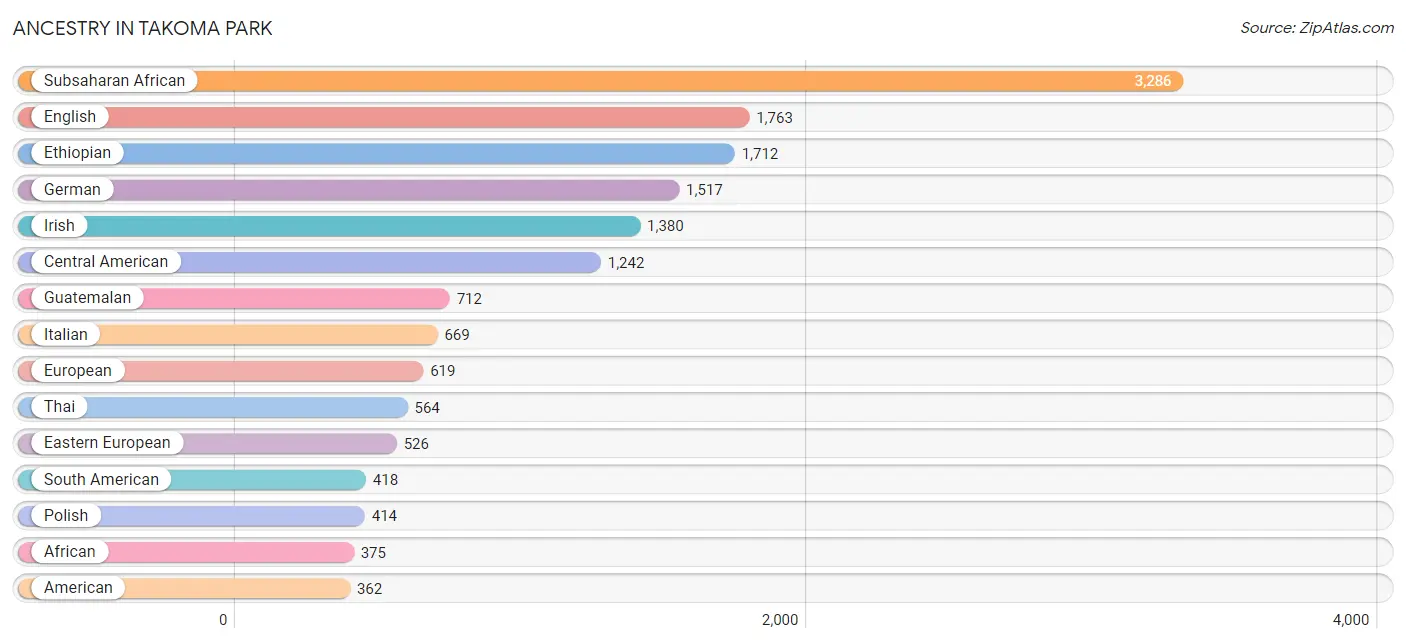
Ancestry in Takoma Park
The most populous ancestries reported in Takoma Park are Subsaharan African (3,286 | 18.7%), English (1,763 | 10.1%), Ethiopian (1,712 | 9.8%), German (1,517 | 8.6%), and Irish (1,380 | 7.9%), together accounting for 55.1% of all Takoma Park residents.
| Ancestry | # Population | % Population |
| African | 375 | 2.1% |
| American | 362 | 2.1% |
| Apache | 48 | 0.3% |
| Arab | 140 | 0.8% |
| Argentinean | 47 | 0.3% |
| Armenian | 5 | 0.0% |
| Australian | 32 | 0.2% |
| Austrian | 13 | 0.1% |
| Belgian | 31 | 0.2% |
| Belizean | 8 | 0.1% |
| Bhutanese | 42 | 0.2% |
| Brazilian | 69 | 0.4% |
| British | 135 | 0.8% |
| British West Indian | 6 | 0.0% |
| Burmese | 101 | 0.6% |
| Cajun | 7 | 0.0% |
| Canadian | 16 | 0.1% |
| Central American | 1,242 | 7.1% |
| Central American Indian | 35 | 0.2% |
| Cherokee | 10 | 0.1% |
| Chilean | 9 | 0.1% |
| Colombian | 249 | 1.4% |
| Croatian | 86 | 0.5% |
| Cuban | 27 | 0.2% |
| Czech | 100 | 0.6% |
| Czechoslovakian | 6 | 0.0% |
| Danish | 18 | 0.1% |
| Dominican | 52 | 0.3% |
| Dutch | 111 | 0.6% |
| Eastern European | 526 | 3.0% |
| Ecuadorian | 56 | 0.3% |
| Egyptian | 26 | 0.2% |
| English | 1,763 | 10.1% |
| Ethiopian | 1,712 | 9.8% |
| European | 619 | 3.5% |
| Filipino | 5 | 0.0% |
| Finnish | 44 | 0.3% |
| French | 314 | 1.8% |
| French Canadian | 83 | 0.5% |
| German | 1,517 | 8.6% |
| Ghanaian | 37 | 0.2% |
| Greek | 34 | 0.2% |
| Guatemalan | 712 | 4.1% |
| Guyanese | 14 | 0.1% |
| Haitian | 332 | 1.9% |
| Honduran | 126 | 0.7% |
| Hungarian | 64 | 0.4% |
| Indian (Asian) | 191 | 1.1% |
| Indonesian | 7 | 0.0% |
| Iranian | 10 | 0.1% |
| Irish | 1,380 | 7.9% |
| Italian | 669 | 3.8% |
| Jamaican | 166 | 0.9% |
| Korean | 237 | 1.3% |
| Lebanese | 31 | 0.2% |
| Liberian | 34 | 0.2% |
| Lithuanian | 109 | 0.6% |
| Lumbee | 21 | 0.1% |
| Mexican | 114 | 0.6% |
| Mexican American Indian | 80 | 0.5% |
| Nicaraguan | 17 | 0.1% |
| Nigerian | 30 | 0.2% |
| Northern European | 51 | 0.3% |
| Norwegian | 228 | 1.3% |
| Pakistani | 19 | 0.1% |
| Palestinian | 11 | 0.1% |
| Panamanian | 36 | 0.2% |
| Peruvian | 27 | 0.2% |
| Polish | 414 | 2.4% |
| Portuguese | 51 | 0.3% |
| Puerto Rican | 70 | 0.4% |
| Romanian | 6 | 0.0% |
| Russian | 311 | 1.8% |
| Salvadoran | 351 | 2.0% |
| Scandinavian | 22 | 0.1% |
| Scotch-Irish | 282 | 1.6% |
| Scottish | 184 | 1.1% |
| Senegalese | 15 | 0.1% |
| Sierra Leonean | 36 | 0.2% |
| Sioux | 8 | 0.1% |
| Slovak | 35 | 0.2% |
| South African | 10 | 0.1% |
| South American | 418 | 2.4% |
| South American Indian | 27 | 0.2% |
| Spaniard | 35 | 0.2% |
| Spanish | 10 | 0.1% |
| Sri Lankan | 133 | 0.8% |
| Subsaharan African | 3,286 | 18.7% |
| Swedish | 130 | 0.7% |
| Swiss | 31 | 0.2% |
| Thai | 564 | 3.2% |
| Trinidadian and Tobagonian | 66 | 0.4% |
| Turkish | 33 | 0.2% |
| Ukrainian | 115 | 0.7% |
| Venezuelan | 30 | 0.2% |
| Vietnamese | 34 | 0.2% |
| Welsh | 125 | 0.7% |
| West Indian | 155 | 0.9% |
| Yugoslavian | 30 | 0.2% | View All 99 Rows |
Immigrants in Takoma Park
The most numerous immigrant groups reported in Takoma Park came from Africa (2,429 | 13.9%), Latin America (1,805 | 10.3%), Eastern Africa (1,437 | 8.2%), Ethiopia (1,322 | 7.5%), and Central America (917 | 5.2%), together accounting for 45.1% of all Takoma Park residents.
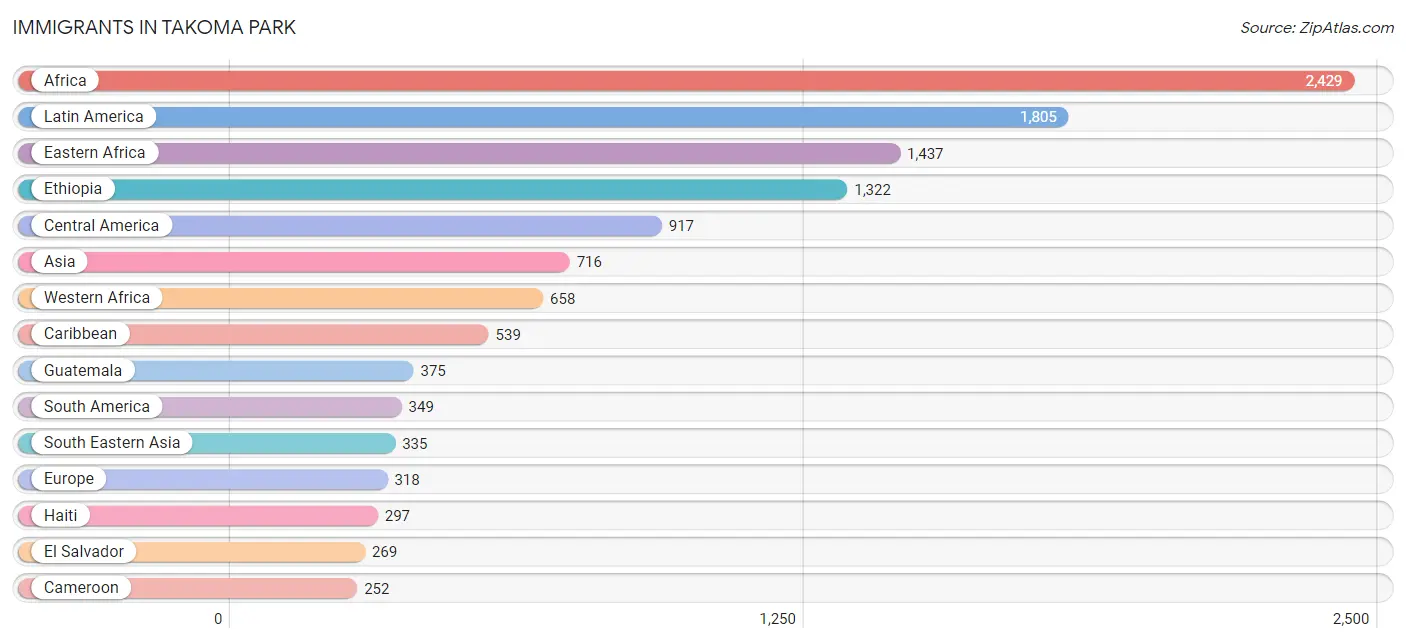
| Immigration Origin | # Population | % Population |
| Africa | 2,429 | 13.9% |
| Argentina | 15 | 0.1% |
| Armenia | 5 | 0.0% |
| Asia | 716 | 4.1% |
| Australia | 22 | 0.1% |
| Bangladesh | 39 | 0.2% |
| Belgium | 66 | 0.4% |
| Bosnia and Herzegovina | 15 | 0.1% |
| Brazil | 58 | 0.3% |
| Cameroon | 252 | 1.4% |
| Canada | 46 | 0.3% |
| Caribbean | 539 | 3.1% |
| Central America | 917 | 5.2% |
| Chile | 13 | 0.1% |
| China | 57 | 0.3% |
| Colombia | 114 | 0.6% |
| Croatia | 27 | 0.2% |
| Cuba | 9 | 0.1% |
| Dominican Republic | 8 | 0.1% |
| Eastern Africa | 1,437 | 8.2% |
| Eastern Asia | 167 | 0.9% |
| Eastern Europe | 91 | 0.5% |
| Ecuador | 48 | 0.3% |
| Egypt | 14 | 0.1% |
| El Salvador | 269 | 1.5% |
| England | 13 | 0.1% |
| Eritrea | 38 | 0.2% |
| Ethiopia | 1,322 | 7.5% |
| Europe | 318 | 1.8% |
| France | 44 | 0.3% |
| Germany | 18 | 0.1% |
| Ghana | 68 | 0.4% |
| Greece | 18 | 0.1% |
| Guatemala | 375 | 2.1% |
| Guyana | 58 | 0.3% |
| Haiti | 297 | 1.7% |
| Honduras | 202 | 1.1% |
| India | 138 | 0.8% |
| Iran | 3 | 0.0% |
| Italy | 24 | 0.1% |
| Jamaica | 116 | 0.7% |
| Japan | 13 | 0.1% |
| Kenya | 54 | 0.3% |
| Korea | 97 | 0.5% |
| Latin America | 1,805 | 10.3% |
| Liberia | 127 | 0.7% |
| Malaysia | 6 | 0.0% |
| Mexico | 53 | 0.3% |
| Middle Africa | 252 | 1.4% |
| Nicaragua | 11 | 0.1% |
| Nigeria | 19 | 0.1% |
| Northern Africa | 14 | 0.1% |
| Northern Europe | 52 | 0.3% |
| Oceania | 22 | 0.1% |
| Pakistan | 9 | 0.1% |
| Panama | 7 | 0.0% |
| Peru | 13 | 0.1% |
| Philippines | 213 | 1.2% |
| Poland | 17 | 0.1% |
| Russia | 32 | 0.2% |
| Scotland | 11 | 0.1% |
| Senegal | 15 | 0.1% |
| Sierra Leone | 57 | 0.3% |
| Singapore | 6 | 0.0% |
| South Africa | 8 | 0.1% |
| South America | 349 | 2.0% |
| South Central Asia | 198 | 1.1% |
| South Eastern Asia | 335 | 1.9% |
| Southern Europe | 42 | 0.2% |
| Sri Lanka | 9 | 0.1% |
| Sweden | 19 | 0.1% |
| Switzerland | 5 | 0.0% |
| Taiwan | 14 | 0.1% |
| Thailand | 9 | 0.1% |
| Trinidad and Tobago | 109 | 0.6% |
| Turkey | 11 | 0.1% |
| Venezuela | 30 | 0.2% |
| Vietnam | 94 | 0.5% |
| Western Africa | 658 | 3.7% |
| Western Asia | 16 | 0.1% |
| Western Europe | 133 | 0.8% | View All 81 Rows |
Sex and Age in Takoma Park
Sex and Age in Takoma Park
The most populous age groups in Takoma Park are 5 to 9 Years (761 | 9.2%) for men and 45 to 49 Years (884 | 9.6%) for women.
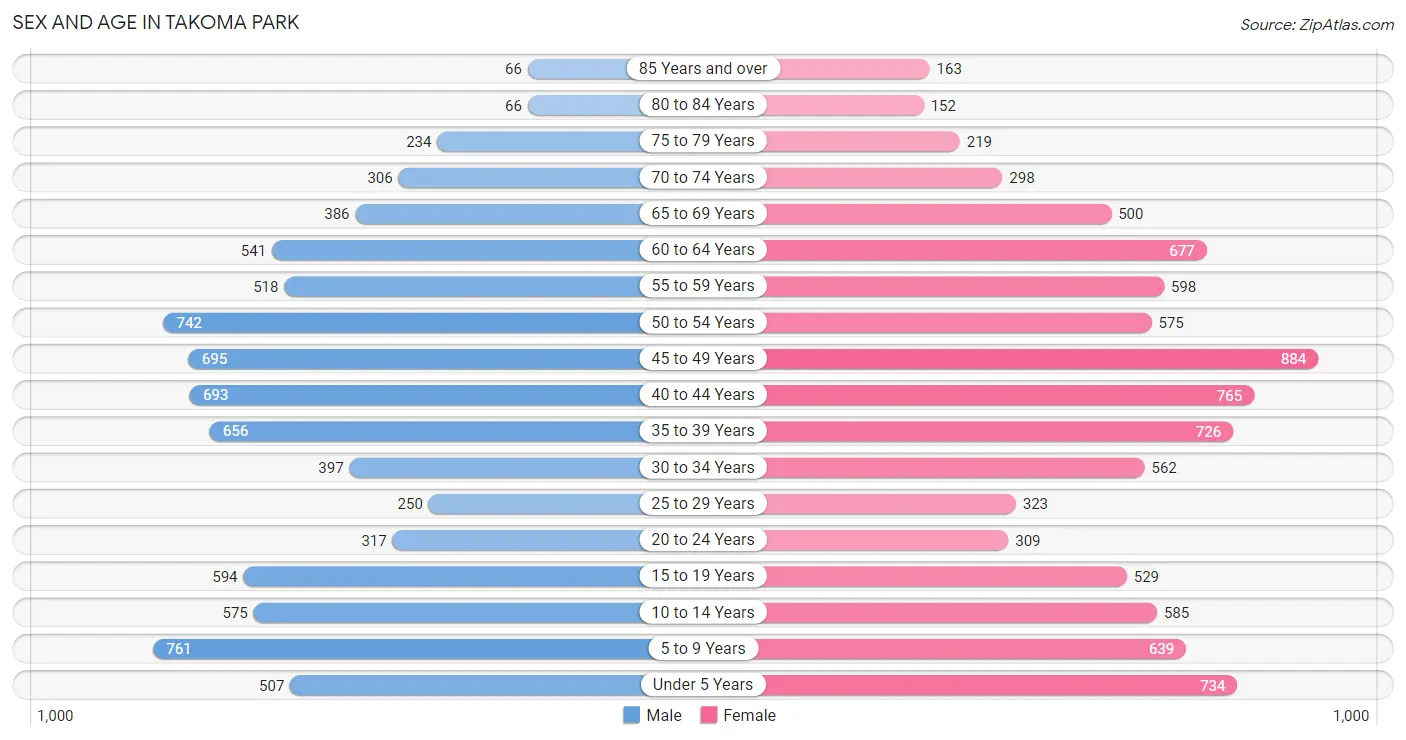
| Age Bracket | Male | Female |
| Under 5 Years | 507 (6.1%) | 734 (8.0%) |
| 5 to 9 Years | 761 (9.2%) | 639 (6.9%) |
| 10 to 14 Years | 575 (6.9%) | 585 (6.3%) |
| 15 to 19 Years | 594 (7.1%) | 529 (5.7%) |
| 20 to 24 Years | 317 (3.8%) | 309 (3.3%) |
| 25 to 29 Years | 250 (3.0%) | 323 (3.5%) |
| 30 to 34 Years | 397 (4.8%) | 562 (6.1%) |
| 35 to 39 Years | 656 (7.9%) | 726 (7.9%) |
| 40 to 44 Years | 693 (8.4%) | 765 (8.3%) |
| 45 to 49 Years | 695 (8.4%) | 884 (9.6%) |
| 50 to 54 Years | 742 (8.9%) | 575 (6.2%) |
| 55 to 59 Years | 518 (6.2%) | 598 (6.5%) |
| 60 to 64 Years | 541 (6.5%) | 677 (7.3%) |
| 65 to 69 Years | 386 (4.6%) | 500 (5.4%) |
| 70 to 74 Years | 306 (3.7%) | 298 (3.2%) |
| 75 to 79 Years | 234 (2.8%) | 219 (2.4%) |
| 80 to 84 Years | 66 (0.8%) | 152 (1.7%) |
| 85 Years and over | 66 (0.8%) | 163 (1.8%) |
| Total | 8,304 (100.0%) | 9,238 (100.0%) |
Families and Households in Takoma Park
Median Family Size in Takoma Park
The median family size in Takoma Park is 3.19 persons per family, with married-couple families (3,284 | 76.2%) accounting for the largest median family size of 3.25 persons per family. On the other hand, single female/mother families (753 | 17.5%) represent the smallest median family size with 2.94 persons per family.
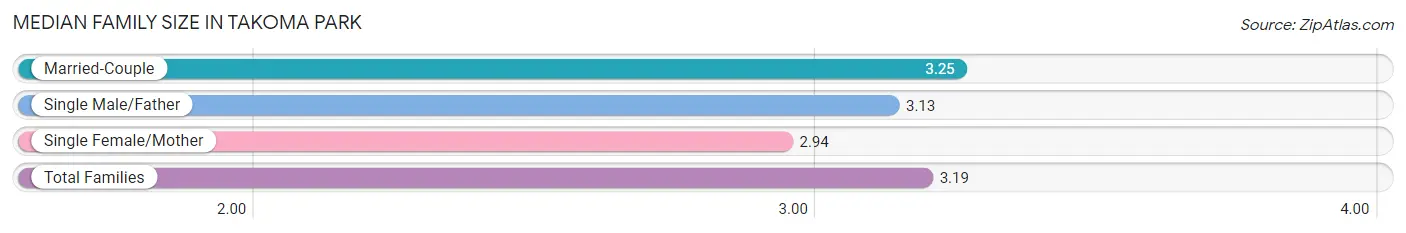
| Family Type | # Families | Family Size |
| Married-Couple | 3,284 (76.2%) | 3.25 |
| Single Male/Father | 273 (6.3%) | 3.13 |
| Single Female/Mother | 753 (17.5%) | 2.94 |
| Total Families | 4,310 (100.0%) | 3.19 |
Median Household Size in Takoma Park
The median household size in Takoma Park is 2.50 persons per household, with single male/father households (273 | 4.0%) accounting for the largest median household size of 3.41 persons per household. non-family households (2,588 | 37.5%) represent the smallest median household size with 1.19 persons per household.
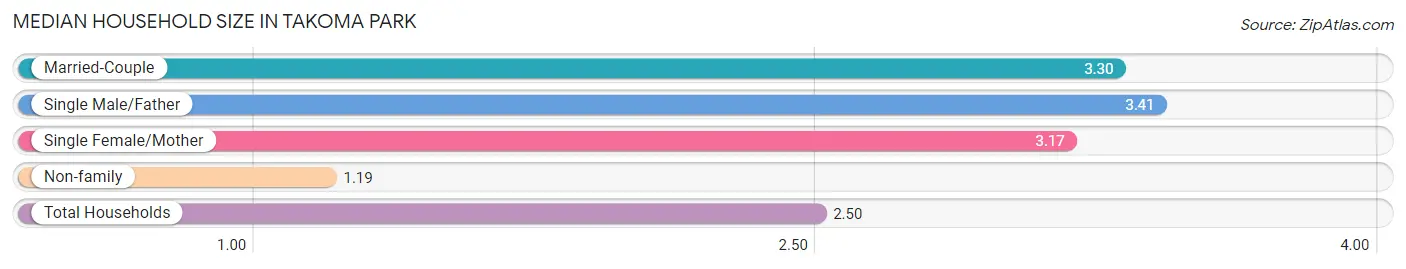
| Household Type | # Households | Household Size |
| Married-Couple | 3,284 (47.6%) | 3.30 |
| Single Male/Father | 273 (4.0%) | 3.41 |
| Single Female/Mother | 753 (10.9%) | 3.17 |
| Non-family | 2,588 (37.5%) | 1.19 |
| Total Households | 6,898 (100.0%) | 2.50 |
Household Size by Marriage Status in Takoma Park
Out of a total of 6,898 households in Takoma Park, 4,310 (62.5%) are family households, while 2,588 (37.5%) are nonfamily households. The most numerous type of family households are 2-person households, comprising 1,618, and the most common type of nonfamily households are 1-person households, comprising 2,195.
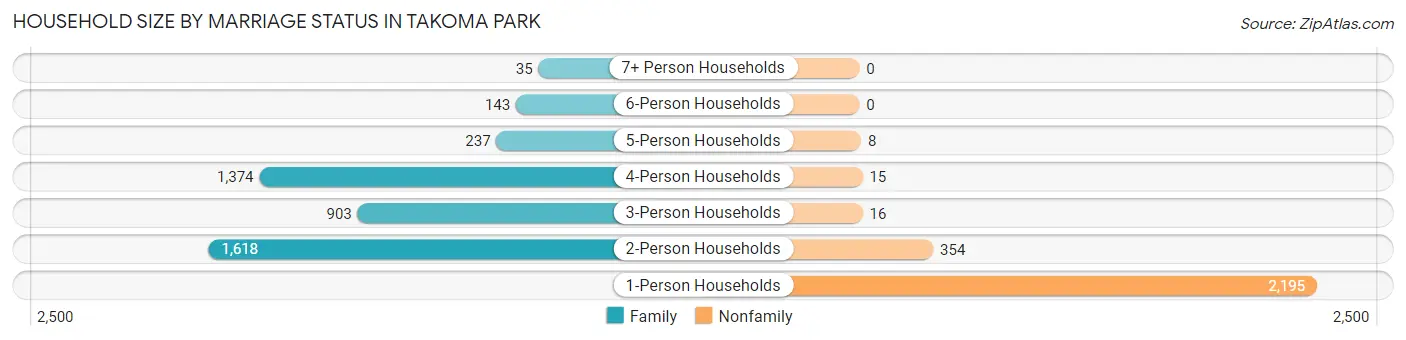
| Household Size | Family Households | Nonfamily Households |
| 1-Person Households | - | 2,195 (31.8%) |
| 2-Person Households | 1,618 (23.5%) | 354 (5.1%) |
| 3-Person Households | 903 (13.1%) | 16 (0.2%) |
| 4-Person Households | 1,374 (19.9%) | 15 (0.2%) |
| 5-Person Households | 237 (3.4%) | 8 (0.1%) |
| 6-Person Households | 143 (2.1%) | 0 (0.0%) |
| 7+ Person Households | 35 (0.5%) | 0 (0.0%) |
| Total | 4,310 (62.5%) | 2,588 (37.5%) |
Female Fertility in Takoma Park
Fertility by Age in Takoma Park
Average fertility rate in Takoma Park is 85.0 births per 1,000 women. Women in the age bracket of 20 to 34 years have the highest fertility rate with 198.0 births per 1,000 women. Women in the age bracket of 20 to 34 years acount for 65.6% of all women with births.
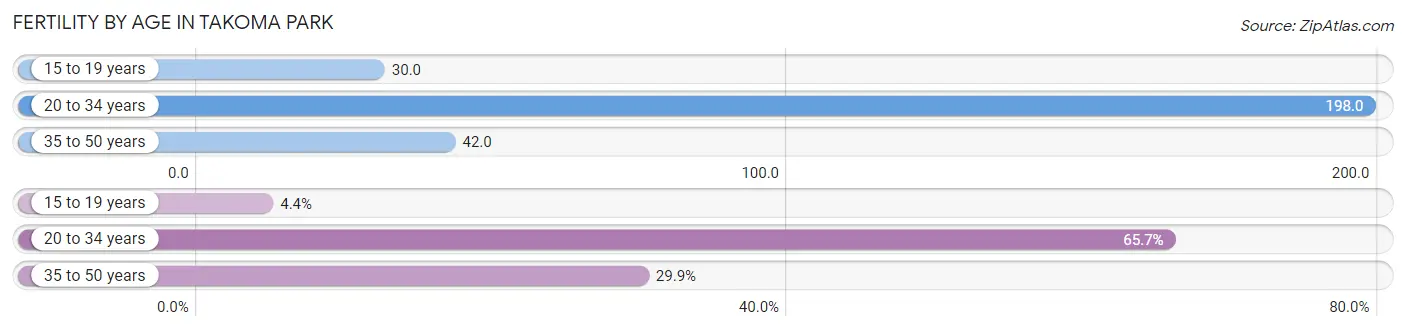
| Age Bracket | Women with Births | Births / 1,000 Women |
| 15 to 19 years | 16 (4.4%) | 30.0 |
| 20 to 34 years | 237 (65.6%) | 198.0 |
| 35 to 50 years | 108 (29.9%) | 42.0 |
| Total | 361 (100.0%) | 85.0 |
Fertility by Age by Marriage Status in Takoma Park
89.2% of women with births (361) in Takoma Park are married. The highest percentage of unmarried women with births falls into 15 to 19 years age bracket with 100.0% of them unmarried at the time of birth, while the lowest percentage of unmarried women with births belong to 20 to 34 years age bracket with 2.5% of them unmarried.
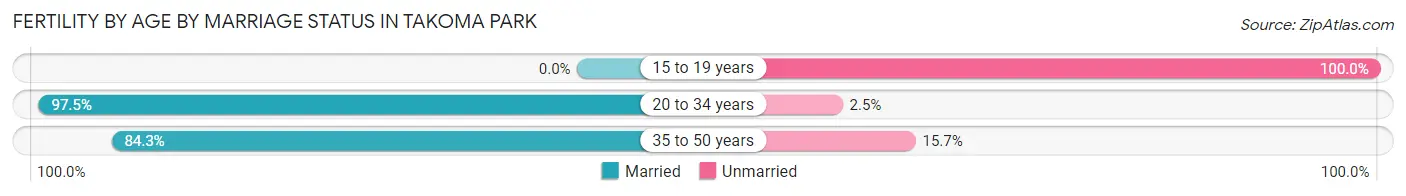
| Age Bracket | Married | Unmarried |
| 15 to 19 years | 0 (0.0%) | 16 (100.0%) |
| 20 to 34 years | 231 (97.5%) | 6 (2.5%) |
| 35 to 50 years | 91 (84.3%) | 17 (15.7%) |
| Total | 322 (89.2%) | 39 (10.8%) |
Fertility by Education in Takoma Park
Average fertility rate in Takoma Park is 85.0 births per 1,000 women. Women with the education attainment of high school diploma have the highest fertility rate of 352.0 births per 1,000 women, while women with the education attainment of graduate degree have the lowest fertility at 31.0 births per 1,000 women. Women with the education attainment of high school diploma represent 55.1% of all women with births.
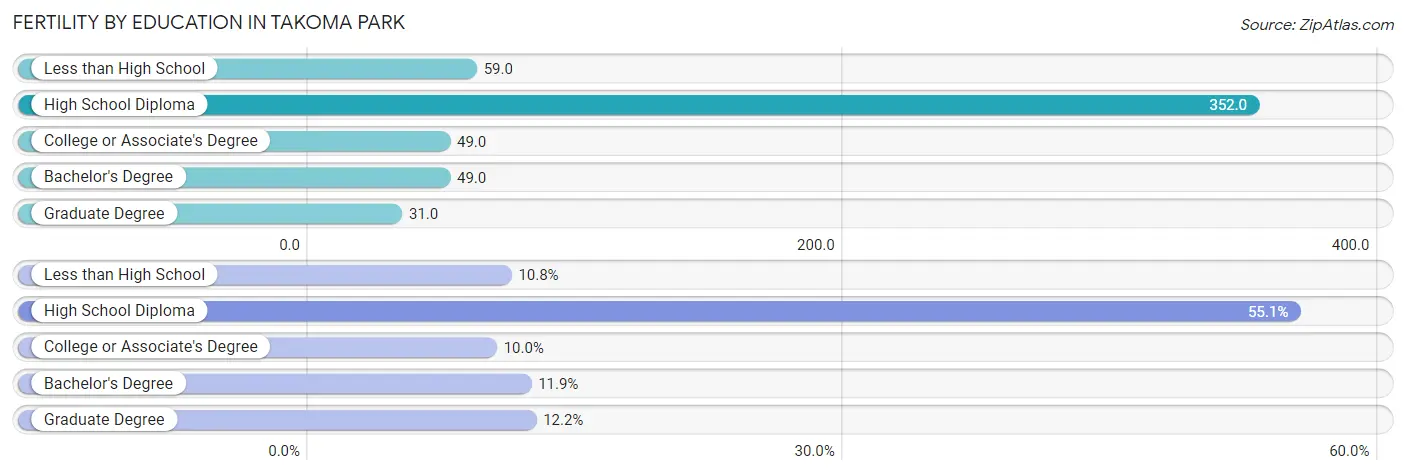
| Educational Attainment | Women with Births | Births / 1,000 Women |
| Less than High School | 39 (10.8%) | 59.0 |
| High School Diploma | 199 (55.1%) | 352.0 |
| College or Associate's Degree | 36 (10.0%) | 49.0 |
| Bachelor's Degree | 43 (11.9%) | 49.0 |
| Graduate Degree | 44 (12.2%) | 31.0 |
| Total | 361 (100.0%) | 85.0 |
Fertility by Education by Marriage Status in Takoma Park
10.8% of women with births in Takoma Park are unmarried. Women with the educational attainment of college or associate's degree are most likely to be married with 100.0% of them married at childbirth, while women with the educational attainment of less than high school are least likely to be married with 41.0% of them unmarried at childbirth.
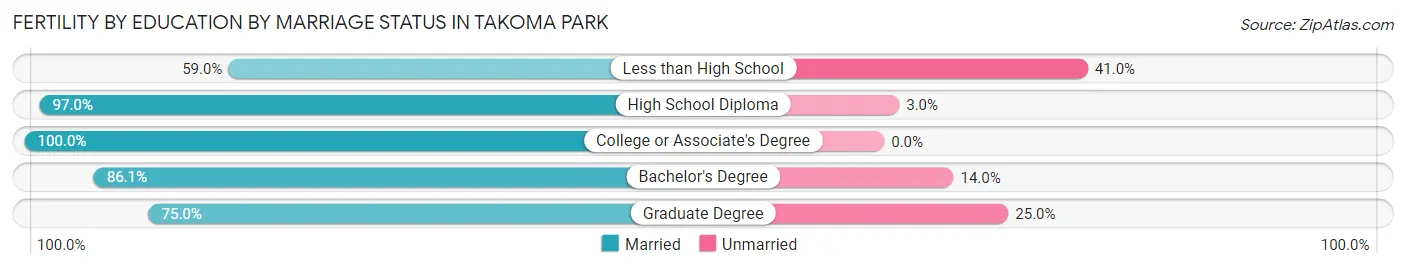
| Educational Attainment | Married | Unmarried |
| Less than High School | 23 (59.0%) | 16 (41.0%) |
| High School Diploma | 193 (97.0%) | 6 (3.0%) |
| College or Associate's Degree | 36 (100.0%) | 0 (0.0%) |
| Bachelor's Degree | 37 (86.1%) | 6 (14.0%) |
| Graduate Degree | 33 (75.0%) | 11 (25.0%) |
| Total | 322 (89.2%) | 39 (10.8%) |
Employment Characteristics in Takoma Park
Employment by Class of Employer in Takoma Park
Among the 8,954 employed individuals in Takoma Park, private company employees (3,944 | 44.1%), not-for-profit organizations (1,686 | 18.8%), and federal government employees (1,353 | 15.1%) make up the most common classes of employment.
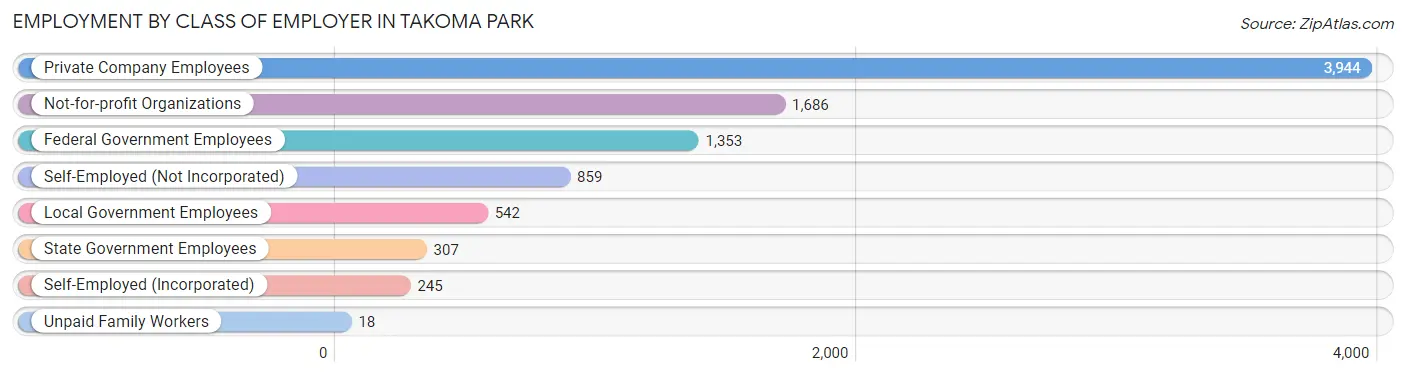
| Employer Class | # Employees | % Employees |
| Private Company Employees | 3,944 | 44.1% |
| Self-Employed (Incorporated) | 245 | 2.7% |
| Self-Employed (Not Incorporated) | 859 | 9.6% |
| Not-for-profit Organizations | 1,686 | 18.8% |
| Local Government Employees | 542 | 6.0% |
| State Government Employees | 307 | 3.4% |
| Federal Government Employees | 1,353 | 15.1% |
| Unpaid Family Workers | 18 | 0.2% |
| Total | 8,954 | 100.0% |
Employment Status by Age in Takoma Park
According to the labor force statistics for Takoma Park, out of the total population over 16 years of age (13,421), 72.9% or 9,784 individuals are in the labor force, with 5.1% or 499 of them unemployed. The age group with the highest labor force participation rate is 45 to 54 years, with 93.9% or 2,719 individuals in the labor force. Within the labor force, the 75 years and over age range has the highest percentage of unemployed individuals, with 16.0% or 8 of them being unemployed.
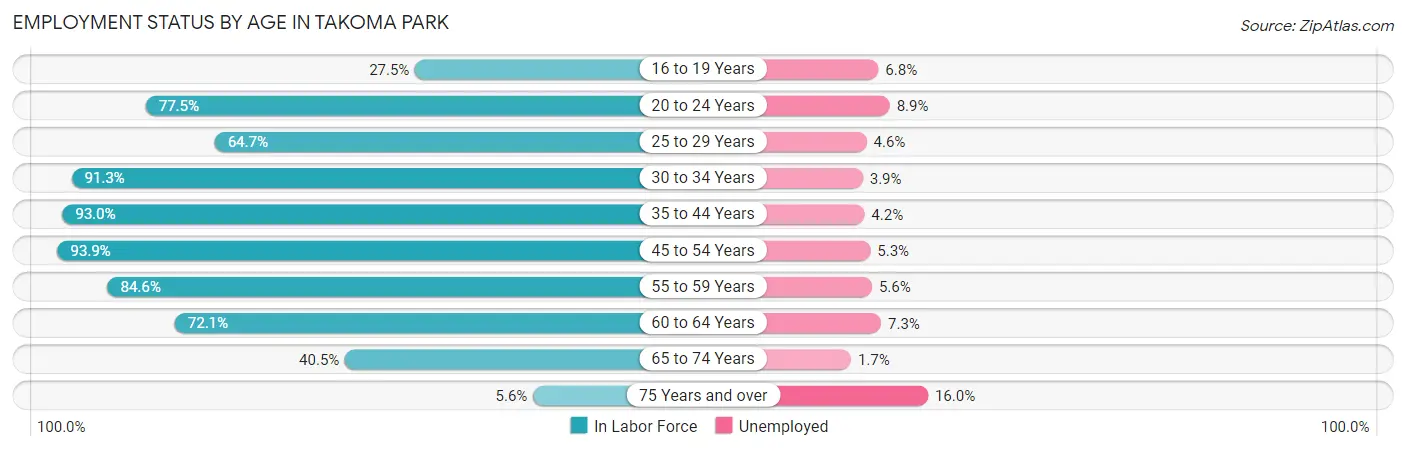
| Age Bracket | In Labor Force | Unemployed |
| 16 to 19 Years | 221 (27.5%) | 15 (6.8%) |
| 20 to 24 Years | 485 (77.5%) | 43 (8.9%) |
| 25 to 29 Years | 371 (64.7%) | 17 (4.6%) |
| 30 to 34 Years | 876 (91.3%) | 34 (3.9%) |
| 35 to 44 Years | 2,641 (93.0%) | 111 (4.2%) |
| 45 to 54 Years | 2,719 (93.9%) | 144 (5.3%) |
| 55 to 59 Years | 944 (84.6%) | 53 (5.6%) |
| 60 to 64 Years | 878 (72.1%) | 64 (7.3%) |
| 65 to 74 Years | 603 (40.5%) | 10 (1.7%) |
| 75 Years and over | 50 (5.6%) | 8 (16.0%) |
| Total | 9,784 (72.9%) | 499 (5.1%) |
Employment Status by Educational Attainment in Takoma Park
According to labor force statistics for Takoma Park, 87.8% of individuals (8,431) out of the total population between 25 and 64 years of age (9,602) are in the labor force, with 5.0% or 422 of them being unemployed. The group with the highest labor force participation rate are those with the educational attainment of bachelor's degree or higher, with 92.7% or 5,557 individuals in the labor force. Within the labor force, individuals with college / associate degree education have the highest percentage of unemployment, with 14.5% or 173 of them being unemployed.
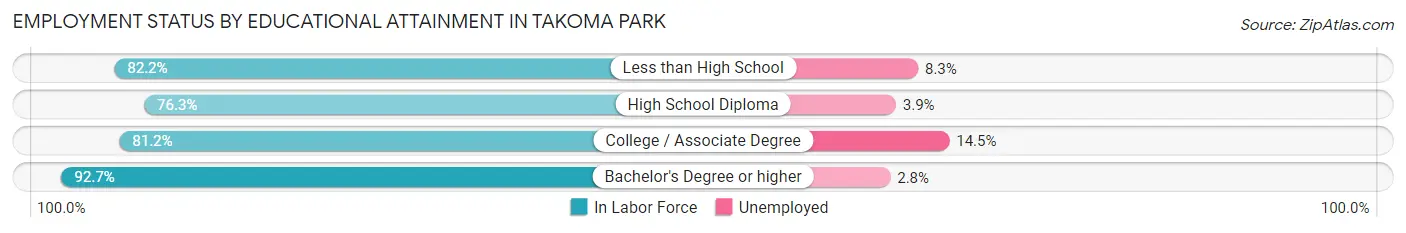
| Educational Attainment | In Labor Force | Unemployed |
| Less than High School | 671 (82.2%) | 68 (8.3%) |
| High School Diploma | 1,006 (76.3%) | 51 (3.9%) |
| College / Associate Degree | 1,196 (81.2%) | 214 (14.5%) |
| Bachelor's Degree or higher | 5,557 (92.7%) | 168 (2.8%) |
| Total | 8,431 (87.8%) | 480 (5.0%) |
Employment Occupations by Sex in Takoma Park
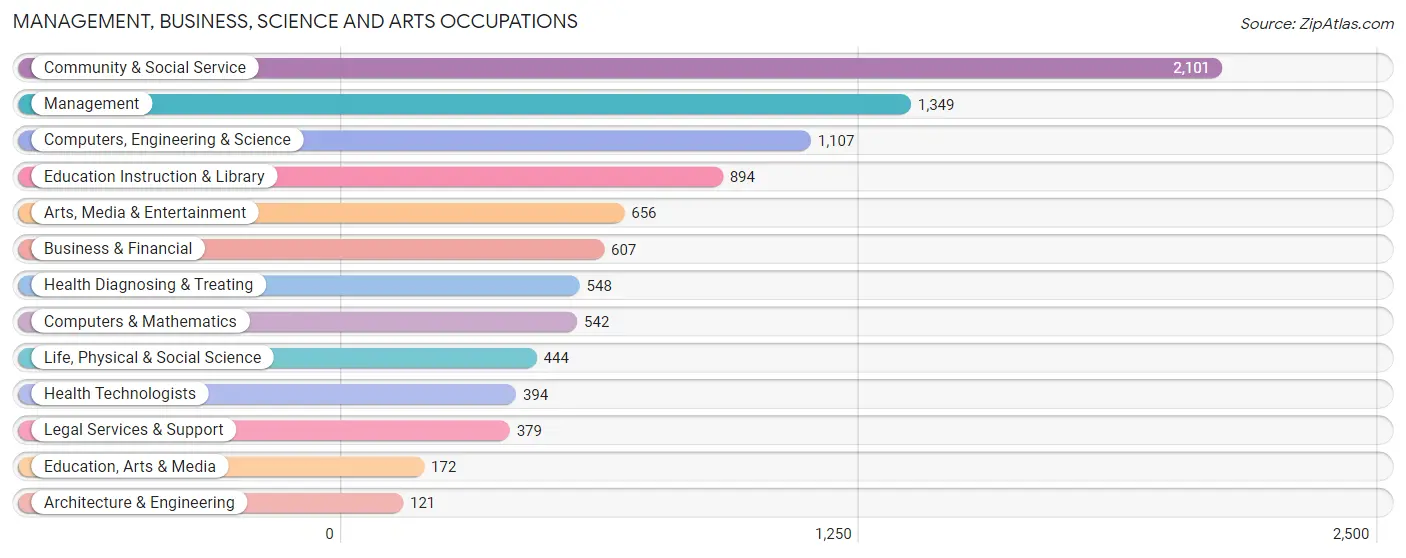
Management, Business, Science and Arts Occupations
The most common Management, Business, Science and Arts occupations in Takoma Park are Community & Social Service (2,101 | 22.6%), Management (1,349 | 14.5%), Computers, Engineering & Science (1,107 | 11.9%), Education Instruction & Library (894 | 9.6%), and Arts, Media & Entertainment (656 | 7.1%).
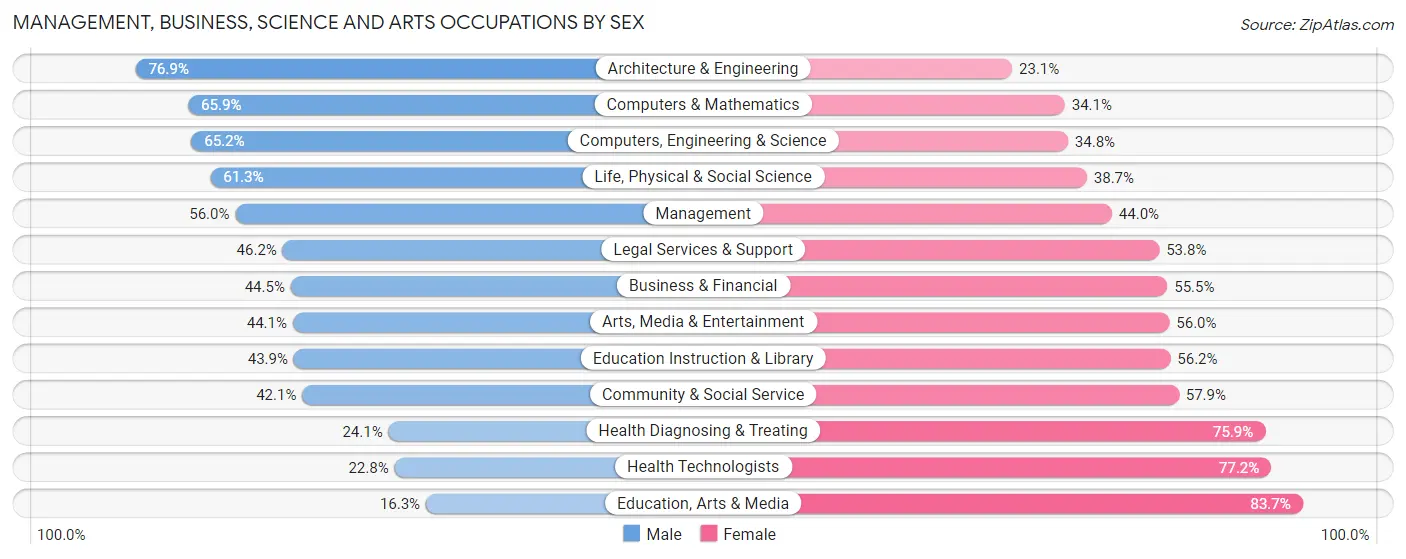
Management, Business, Science and Arts Occupations by Sex
Within the Management, Business, Science and Arts occupations in Takoma Park, the most male-oriented occupations are Architecture & Engineering (76.9%), Computers & Mathematics (65.9%), and Computers, Engineering & Science (65.2%), while the most female-oriented occupations are Education, Arts & Media (83.7%), Health Technologists (77.2%), and Health Diagnosing & Treating (75.9%).
| Occupation | Male | Female |
| Management | 756 (56.0%) | 593 (44.0%) |
| Business & Financial | 270 (44.5%) | 337 (55.5%) |
| Computers, Engineering & Science | 722 (65.2%) | 385 (34.8%) |
| Computers & Mathematics | 357 (65.9%) | 185 (34.1%) |
| Architecture & Engineering | 93 (76.9%) | 28 (23.1%) |
| Life, Physical & Social Science | 272 (61.3%) | 172 (38.7%) |
| Community & Social Service | 884 (42.1%) | 1,217 (57.9%) |
| Education, Arts & Media | 28 (16.3%) | 144 (83.7%) |
| Legal Services & Support | 175 (46.2%) | 204 (53.8%) |
| Education Instruction & Library | 392 (43.9%) | 502 (56.1%) |
| Arts, Media & Entertainment | 289 (44.1%) | 367 (55.9%) |
| Health Diagnosing & Treating | 132 (24.1%) | 416 (75.9%) |
| Health Technologists | 90 (22.8%) | 304 (77.2%) |
| Total (Category) | 2,764 (48.4%) | 2,948 (51.6%) |
| Total (Overall) | 4,478 (48.2%) | 4,812 (51.8%) |
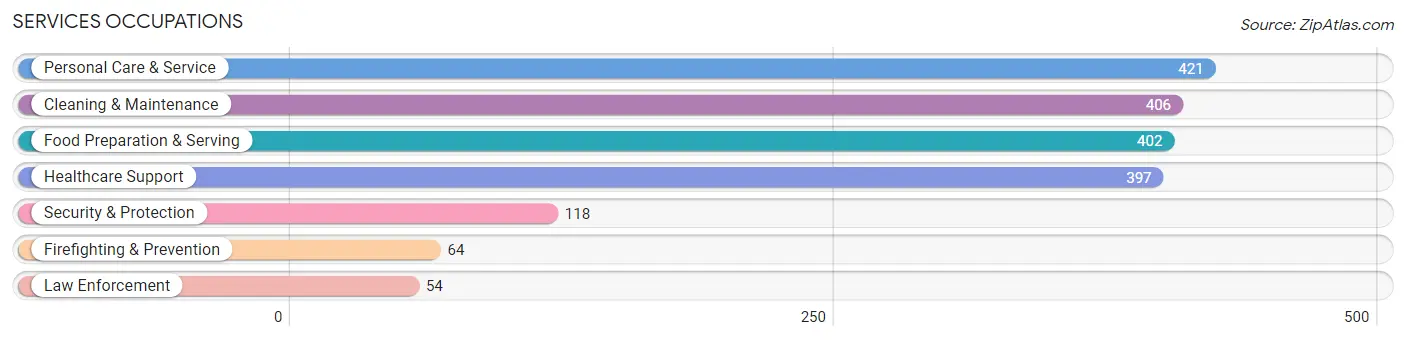
Services Occupations
The most common Services occupations in Takoma Park are Personal Care & Service (421 | 4.5%), Cleaning & Maintenance (406 | 4.4%), Food Preparation & Serving (402 | 4.3%), Healthcare Support (397 | 4.3%), and Security & Protection (118 | 1.3%).
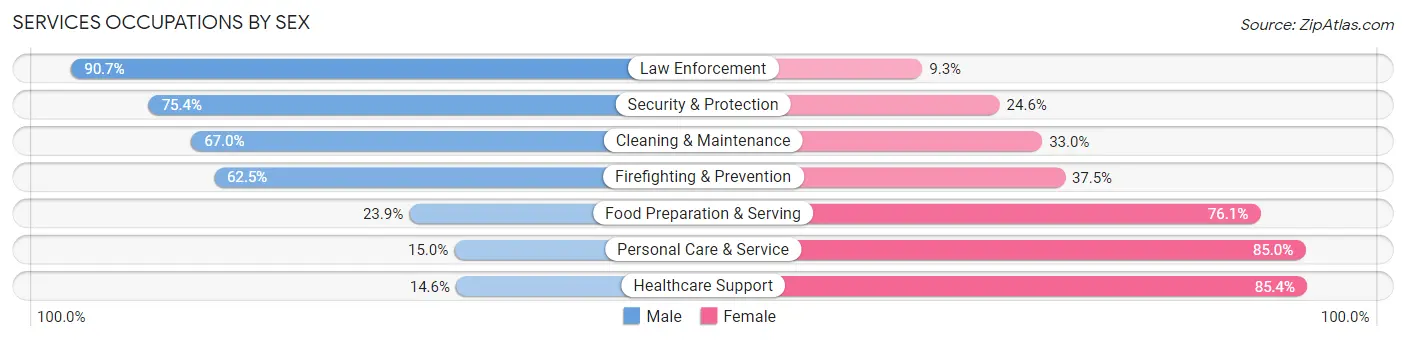
Services Occupations by Sex
Within the Services occupations in Takoma Park, the most male-oriented occupations are Law Enforcement (90.7%), Security & Protection (75.4%), and Cleaning & Maintenance (67.0%), while the most female-oriented occupations are Healthcare Support (85.4%), Personal Care & Service (85.0%), and Food Preparation & Serving (76.1%).
| Occupation | Male | Female |
| Healthcare Support | 58 (14.6%) | 339 (85.4%) |
| Security & Protection | 89 (75.4%) | 29 (24.6%) |
| Firefighting & Prevention | 40 (62.5%) | 24 (37.5%) |
| Law Enforcement | 49 (90.7%) | 5 (9.3%) |
| Food Preparation & Serving | 96 (23.9%) | 306 (76.1%) |
| Cleaning & Maintenance | 272 (67.0%) | 134 (33.0%) |
| Personal Care & Service | 63 (15.0%) | 358 (85.0%) |
| Total (Category) | 578 (33.1%) | 1,166 (66.9%) |
| Total (Overall) | 4,478 (48.2%) | 4,812 (51.8%) |
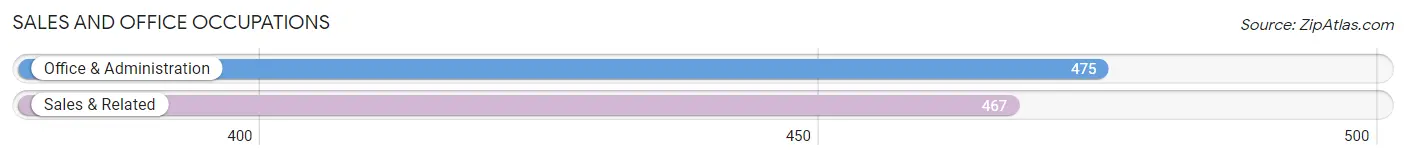
Sales and Office Occupations
The most common Sales and Office occupations in Takoma Park are Office & Administration (475 | 5.1%), and Sales & Related (467 | 5.0%).
Sales and Office Occupations by Sex
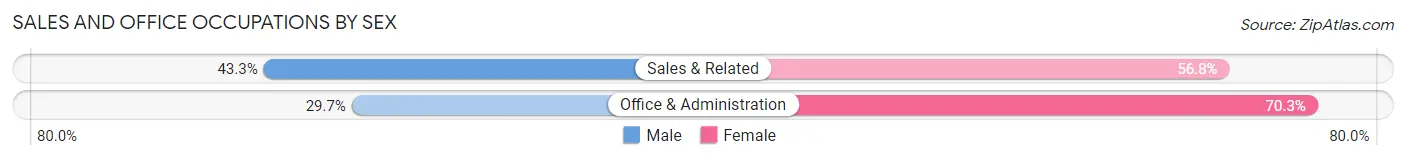
| Occupation | Male | Female |
| Sales & Related | 202 (43.2%) | 265 (56.8%) |
| Office & Administration | 141 (29.7%) | 334 (70.3%) |
| Total (Category) | 343 (36.4%) | 599 (63.6%) |
| Total (Overall) | 4,478 (48.2%) | 4,812 (51.8%) |
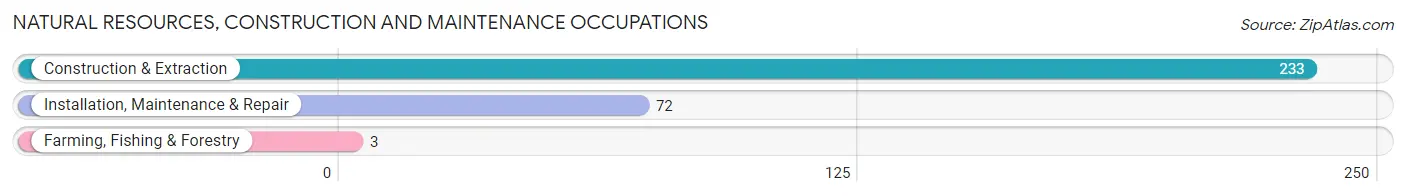
Natural Resources, Construction and Maintenance Occupations
The most common Natural Resources, Construction and Maintenance occupations in Takoma Park are Construction & Extraction (233 | 2.5%), Installation, Maintenance & Repair (72 | 0.8%), and Farming, Fishing & Forestry (3 | 0.0%).
Natural Resources, Construction and Maintenance Occupations by Sex
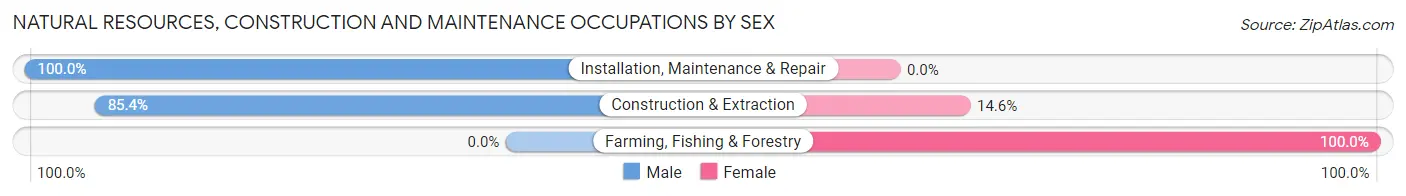
| Occupation | Male | Female |
| Farming, Fishing & Forestry | 0 (0.0%) | 3 (100.0%) |
| Construction & Extraction | 199 (85.4%) | 34 (14.6%) |
| Installation, Maintenance & Repair | 72 (100.0%) | 0 (0.0%) |
| Total (Category) | 271 (88.0%) | 37 (12.0%) |
| Total (Overall) | 4,478 (48.2%) | 4,812 (51.8%) |
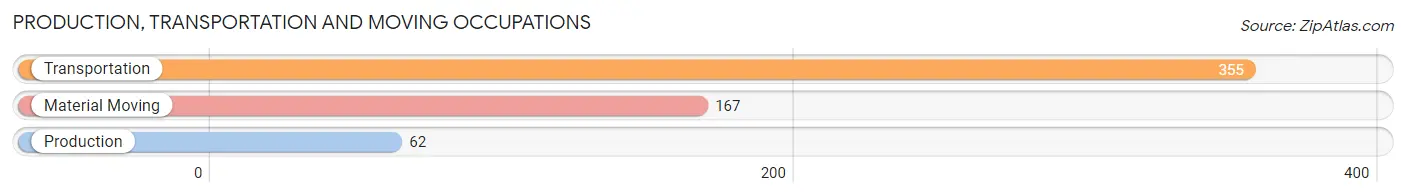
Production, Transportation and Moving Occupations
The most common Production, Transportation and Moving occupations in Takoma Park are Transportation (355 | 3.8%), Material Moving (167 | 1.8%), and Production (62 | 0.7%).
Production, Transportation and Moving Occupations by Sex
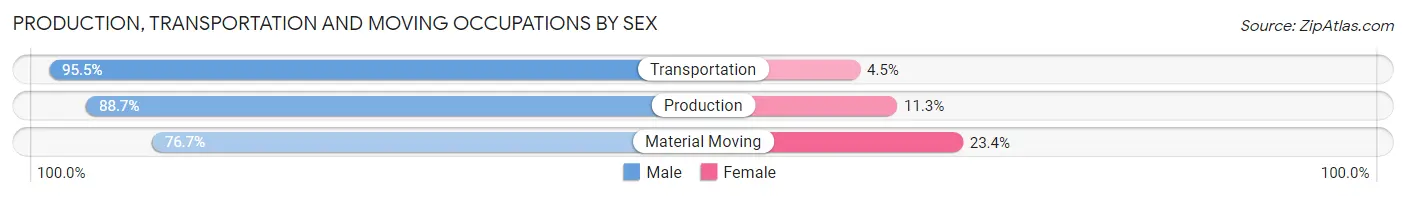
| Occupation | Male | Female |
| Production | 55 (88.7%) | 7 (11.3%) |
| Transportation | 339 (95.5%) | 16 (4.5%) |
| Material Moving | 128 (76.6%) | 39 (23.4%) |
| Total (Category) | 522 (89.4%) | 62 (10.6%) |
| Total (Overall) | 4,478 (48.2%) | 4,812 (51.8%) |
Employment Industries by Sex in Takoma Park
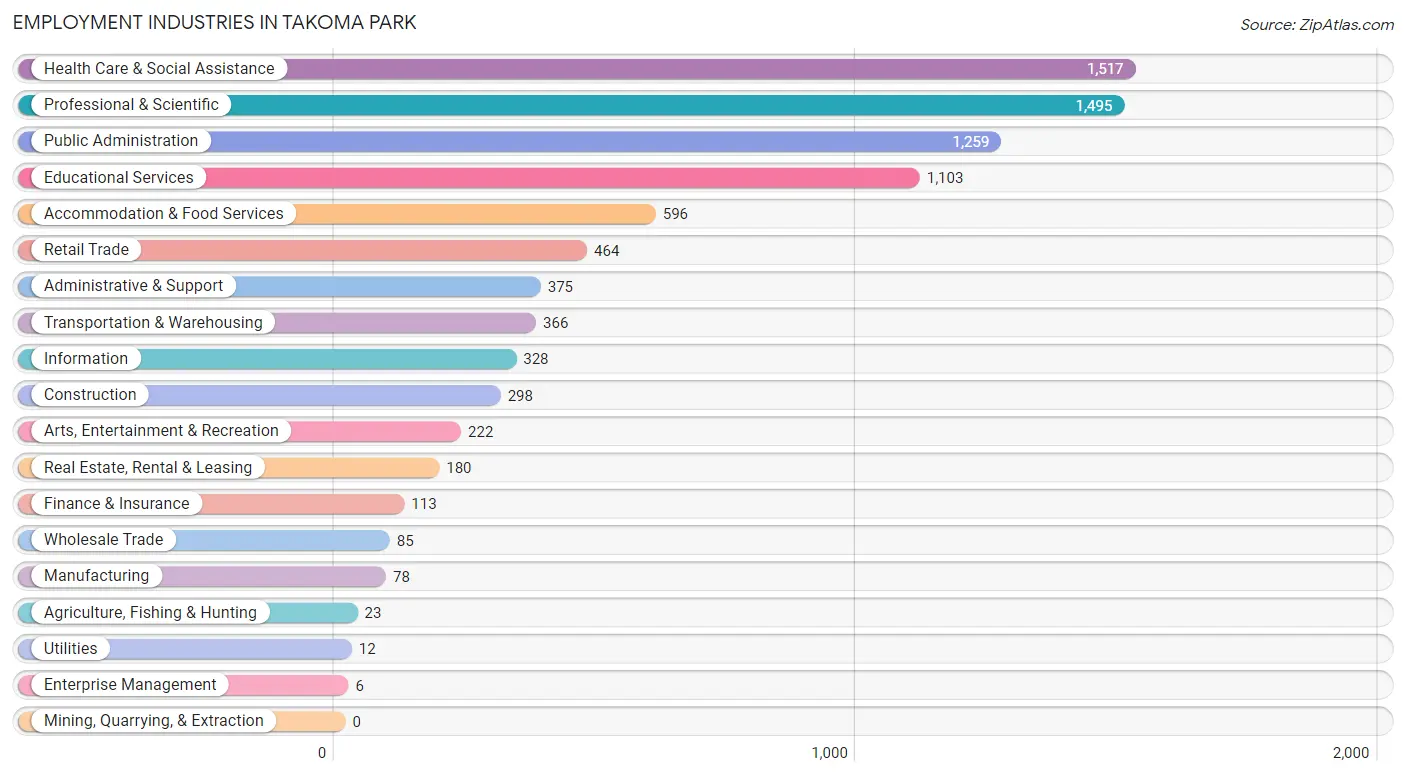
Employment Industries in Takoma Park
The major employment industries in Takoma Park include Health Care & Social Assistance (1,517 | 16.3%), Professional & Scientific (1,495 | 16.1%), Public Administration (1,259 | 13.6%), Educational Services (1,103 | 11.9%), and Accommodation & Food Services (596 | 6.4%).
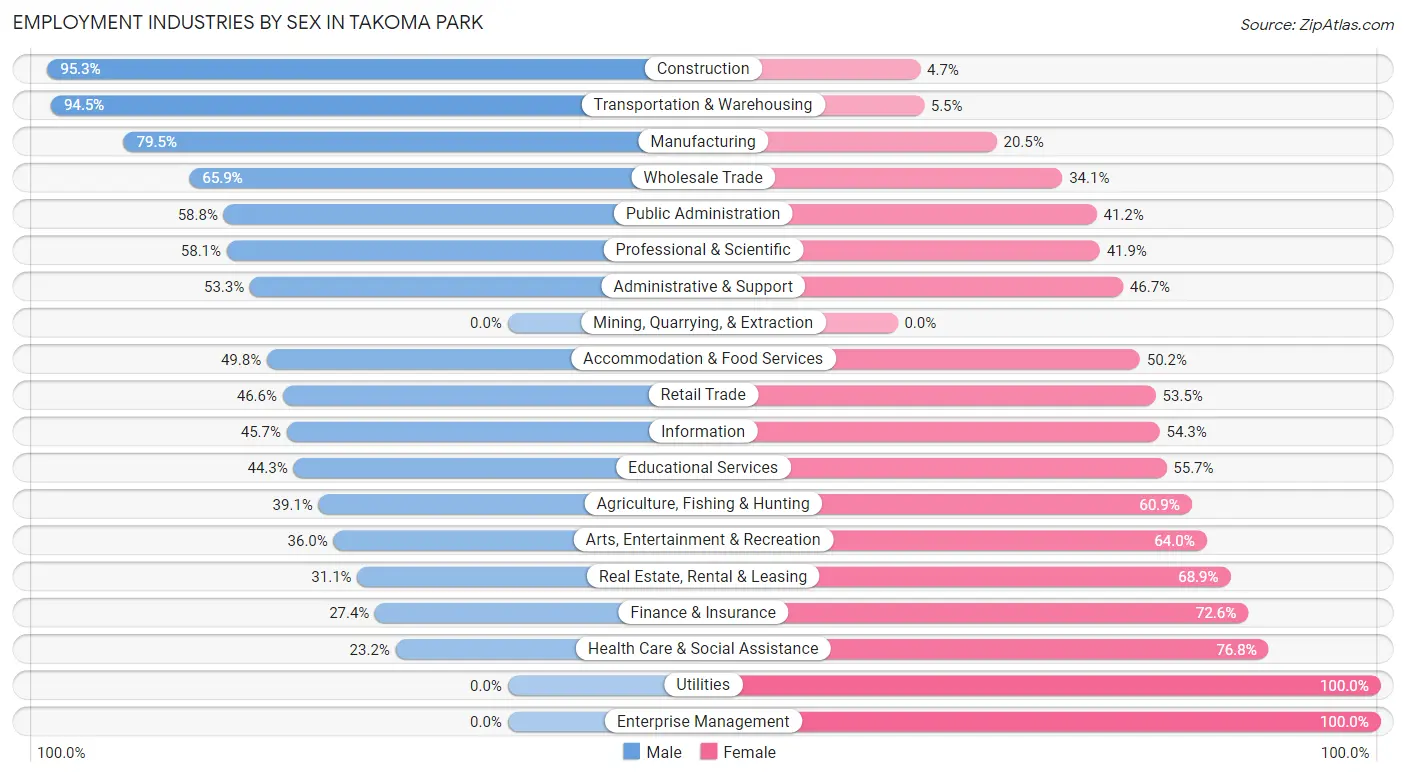
Employment Industries by Sex in Takoma Park
The Takoma Park industries that see more men than women are Construction (95.3%), Transportation & Warehousing (94.5%), and Manufacturing (79.5%), whereas the industries that tend to have a higher number of women are Utilities (100.0%), Enterprise Management (100.0%), and Health Care & Social Assistance (76.8%).
| Industry | Male | Female |
| Agriculture, Fishing & Hunting | 9 (39.1%) | 14 (60.9%) |
| Mining, Quarrying, & Extraction | 0 (0.0%) | 0 (0.0%) |
| Construction | 284 (95.3%) | 14 (4.7%) |
| Manufacturing | 62 (79.5%) | 16 (20.5%) |
| Wholesale Trade | 56 (65.9%) | 29 (34.1%) |
| Retail Trade | 216 (46.6%) | 248 (53.4%) |
| Transportation & Warehousing | 346 (94.5%) | 20 (5.5%) |
| Utilities | 0 (0.0%) | 12 (100.0%) |
| Information | 150 (45.7%) | 178 (54.3%) |
| Finance & Insurance | 31 (27.4%) | 82 (72.6%) |
| Real Estate, Rental & Leasing | 56 (31.1%) | 124 (68.9%) |
| Professional & Scientific | 869 (58.1%) | 626 (41.9%) |
| Enterprise Management | 0 (0.0%) | 6 (100.0%) |
| Administrative & Support | 200 (53.3%) | 175 (46.7%) |
| Educational Services | 489 (44.3%) | 614 (55.7%) |
| Health Care & Social Assistance | 352 (23.2%) | 1,165 (76.8%) |
| Arts, Entertainment & Recreation | 80 (36.0%) | 142 (64.0%) |
| Accommodation & Food Services | 297 (49.8%) | 299 (50.2%) |
| Public Administration | 740 (58.8%) | 519 (41.2%) |
| Total | 4,478 (48.2%) | 4,812 (51.8%) |
Education in Takoma Park
School Enrollment in Takoma Park
The most common levels of schooling among the 4,611 students in Takoma Park are elementary school (1,088 | 23.6%), high school (997 | 21.6%), and middle school (878 | 19.0%).
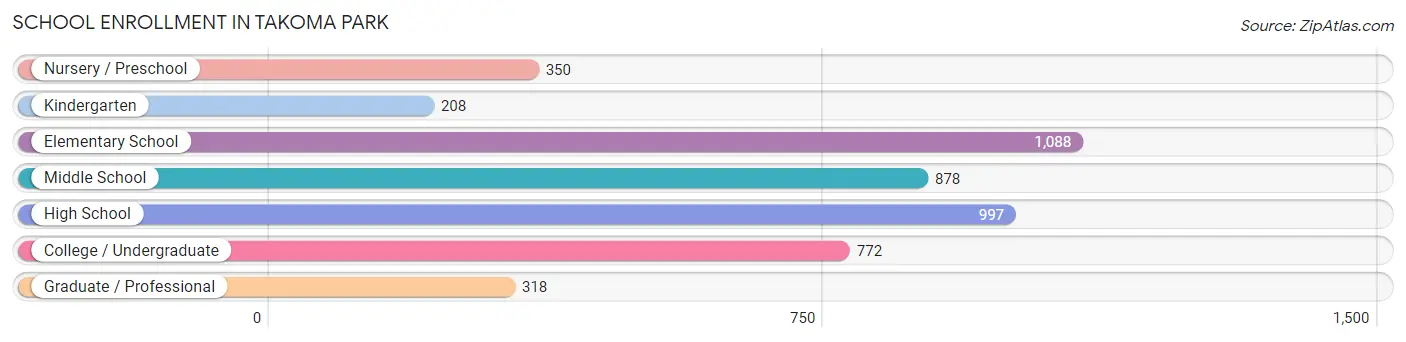
| School Level | # Students | % Students |
| Nursery / Preschool | 350 | 7.6% |
| Kindergarten | 208 | 4.5% |
| Elementary School | 1,088 | 23.6% |
| Middle School | 878 | 19.0% |
| High School | 997 | 21.6% |
| College / Undergraduate | 772 | 16.7% |
| Graduate / Professional | 318 | 6.9% |
| Total | 4,611 | 100.0% |
School Enrollment by Age by Funding Source in Takoma Park
Out of a total of 4,611 students who are enrolled in schools in Takoma Park, 1,010 (21.9%) attend a private institution, while the remaining 3,601 (78.1%) are enrolled in public schools. The age group of 35 years and over has the highest likelihood of being enrolled in private schools, with 193 (61.5% in the age bracket) enrolled. Conversely, the age group of 15 to 17 year olds has the lowest likelihood of being enrolled in a private school, with 697 (90.3% in the age bracket) attending a public institution.
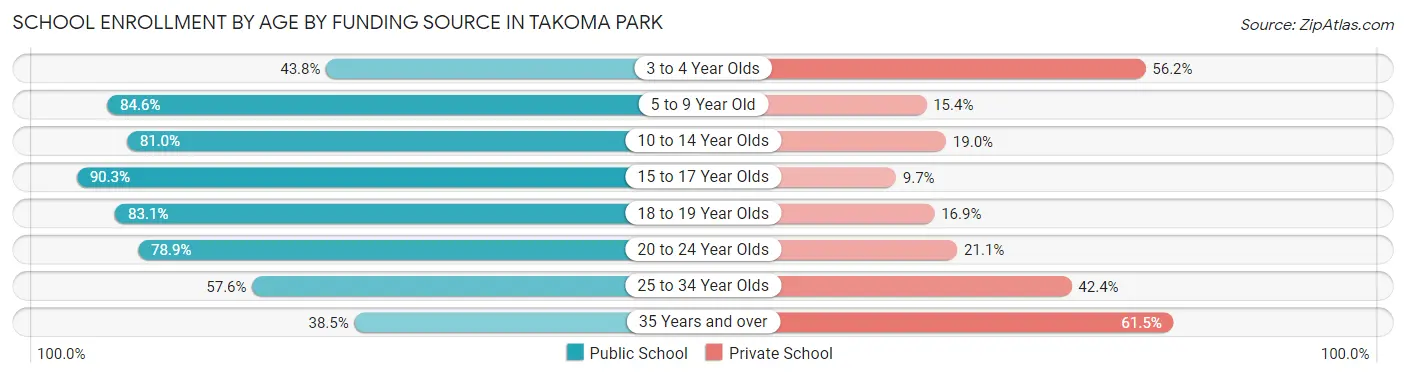
| Age Bracket | Public School | Private School |
| 3 to 4 Year Olds | 85 (43.8%) | 109 (56.2%) |
| 5 to 9 Year Old | 1,128 (84.6%) | 205 (15.4%) |
| 10 to 14 Year Olds | 910 (81.0%) | 214 (19.0%) |
| 15 to 17 Year Olds | 697 (90.3%) | 75 (9.7%) |
| 18 to 19 Year Olds | 271 (83.1%) | 55 (16.9%) |
| 20 to 24 Year Olds | 276 (78.9%) | 74 (21.1%) |
| 25 to 34 Year Olds | 114 (57.6%) | 84 (42.4%) |
| 35 Years and over | 121 (38.5%) | 193 (61.5%) |
| Total | 3,601 (78.1%) | 1,010 (21.9%) |
Educational Attainment by Field of Study in Takoma Park
Social sciences (1,382 | 16.9%), liberal arts & history (912 | 11.2%), literature & languages (874 | 10.7%), bio, nature & agricultural (645 | 7.9%), and science & technology (574 | 7.0%) are the most common fields of study among 8,157 individuals in Takoma Park who have obtained a bachelor's degree or higher.
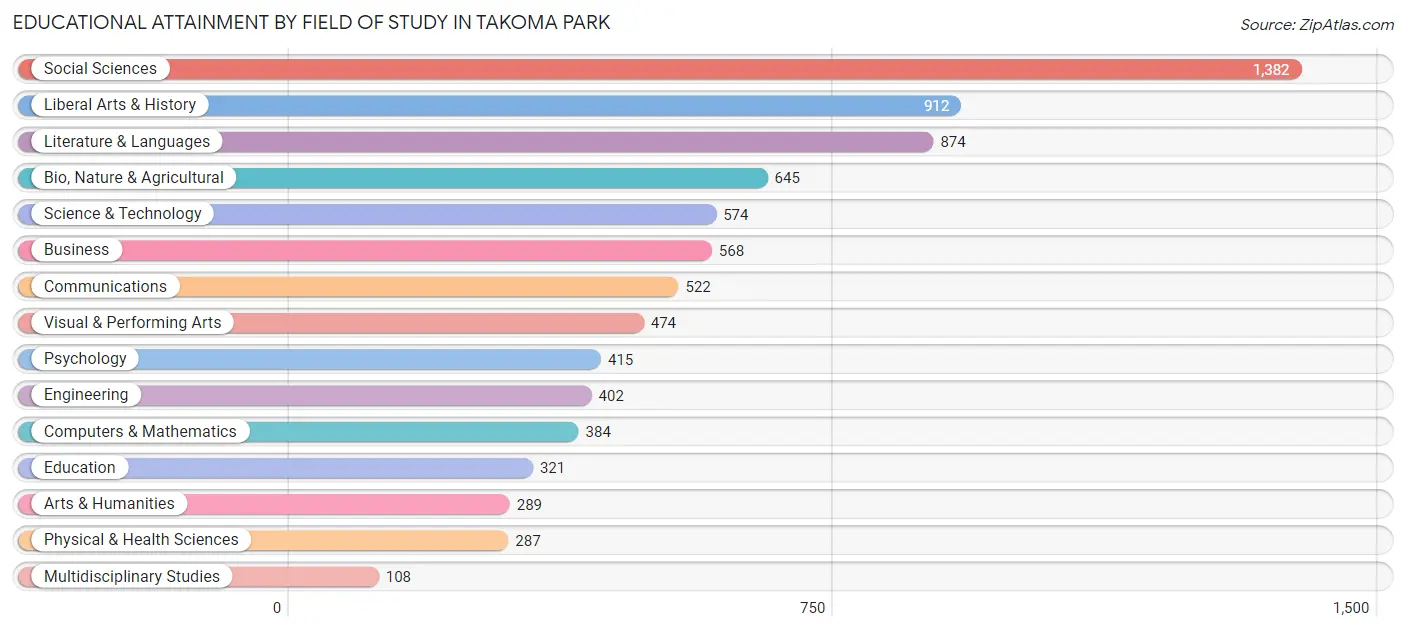
| Field of Study | # Graduates | % Graduates |
| Computers & Mathematics | 384 | 4.7% |
| Bio, Nature & Agricultural | 645 | 7.9% |
| Physical & Health Sciences | 287 | 3.5% |
| Psychology | 415 | 5.1% |
| Social Sciences | 1,382 | 16.9% |
| Engineering | 402 | 4.9% |
| Multidisciplinary Studies | 108 | 1.3% |
| Science & Technology | 574 | 7.0% |
| Business | 568 | 7.0% |
| Education | 321 | 3.9% |
| Literature & Languages | 874 | 10.7% |
| Liberal Arts & History | 912 | 11.2% |
| Visual & Performing Arts | 474 | 5.8% |
| Communications | 522 | 6.4% |
| Arts & Humanities | 289 | 3.5% |
| Total | 8,157 | 100.0% |
Transportation & Commute in Takoma Park
Vehicle Availability by Sex in Takoma Park
The most prevalent vehicle ownership categories in Takoma Park are males with 2 vehicles (1,702, accounting for 39.7%) and females with 2 vehicles (1,980, making up 37.2%).
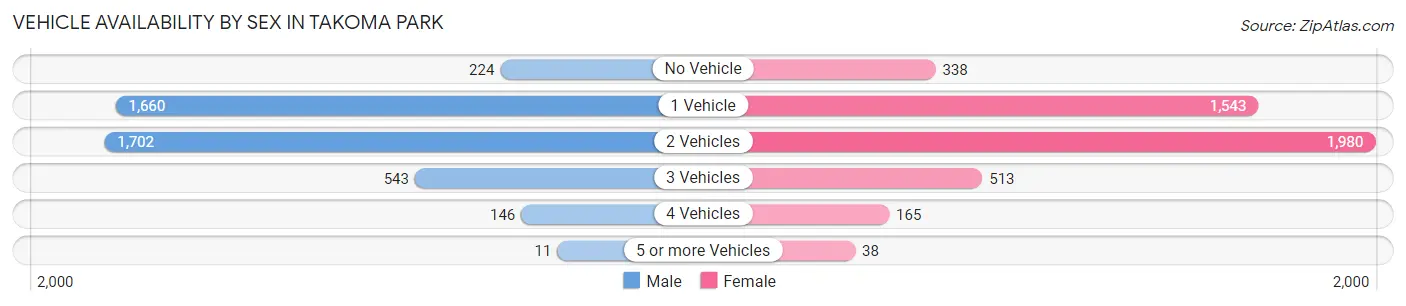
| Vehicles Available | Male | Female |
| No Vehicle | 224 (5.2%) | 338 (7.4%) |
| 1 Vehicle | 1,660 (38.7%) | 1,543 (33.7%) |
| 2 Vehicles | 1,702 (39.7%) | 1,980 (43.3%) |
| 3 Vehicles | 543 (12.7%) | 513 (11.2%) |
| 4 Vehicles | 146 (3.4%) | 165 (3.6%) |
| 5 or more Vehicles | 11 (0.3%) | 38 (0.8%) |
| Total | 4,286 (100.0%) | 4,577 (100.0%) |
Commute Time in Takoma Park
The most frequently occuring commute durations in Takoma Park are 30 to 34 minutes (1,164 commuters, 17.2%), 45 to 59 minutes (1,121 commuters, 16.6%), and 20 to 24 minutes (852 commuters, 12.6%).
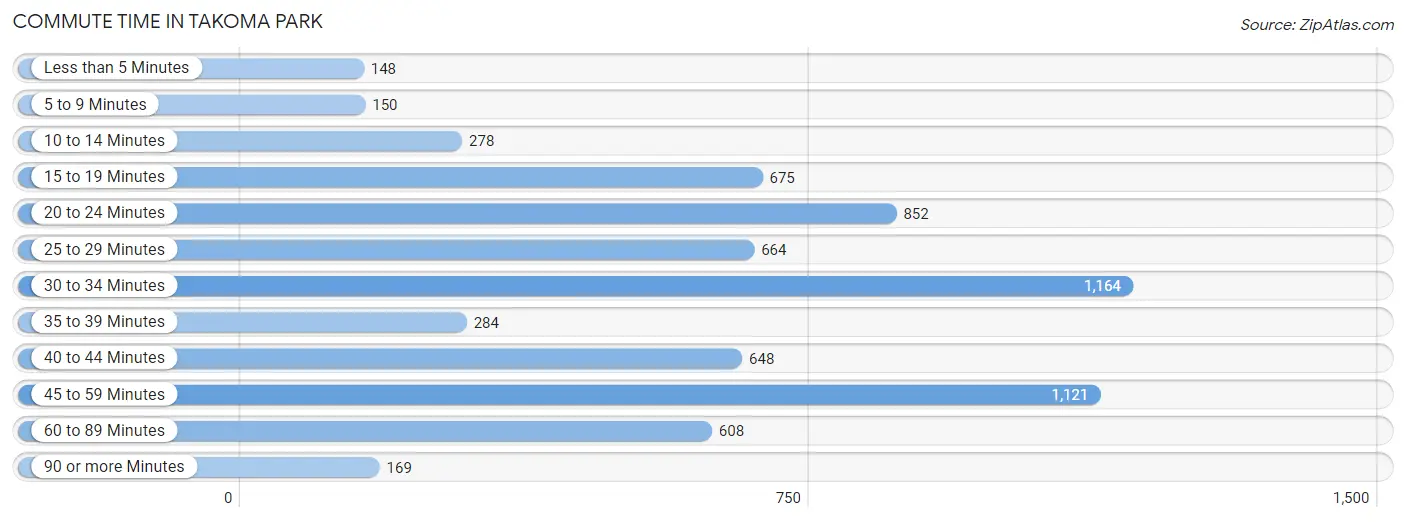
| Commute Time | # Commuters | % Commuters |
| Less than 5 Minutes | 148 | 2.2% |
| 5 to 9 Minutes | 150 | 2.2% |
| 10 to 14 Minutes | 278 | 4.1% |
| 15 to 19 Minutes | 675 | 10.0% |
| 20 to 24 Minutes | 852 | 12.6% |
| 25 to 29 Minutes | 664 | 9.8% |
| 30 to 34 Minutes | 1,164 | 17.2% |
| 35 to 39 Minutes | 284 | 4.2% |
| 40 to 44 Minutes | 648 | 9.6% |
| 45 to 59 Minutes | 1,121 | 16.6% |
| 60 to 89 Minutes | 608 | 9.0% |
| 90 or more Minutes | 169 | 2.5% |
Commute Time by Sex in Takoma Park
The most common commute times in Takoma Park are 45 to 59 minutes (626 commuters, 19.0%) for males and 30 to 34 minutes (779 commuters, 22.4%) for females.
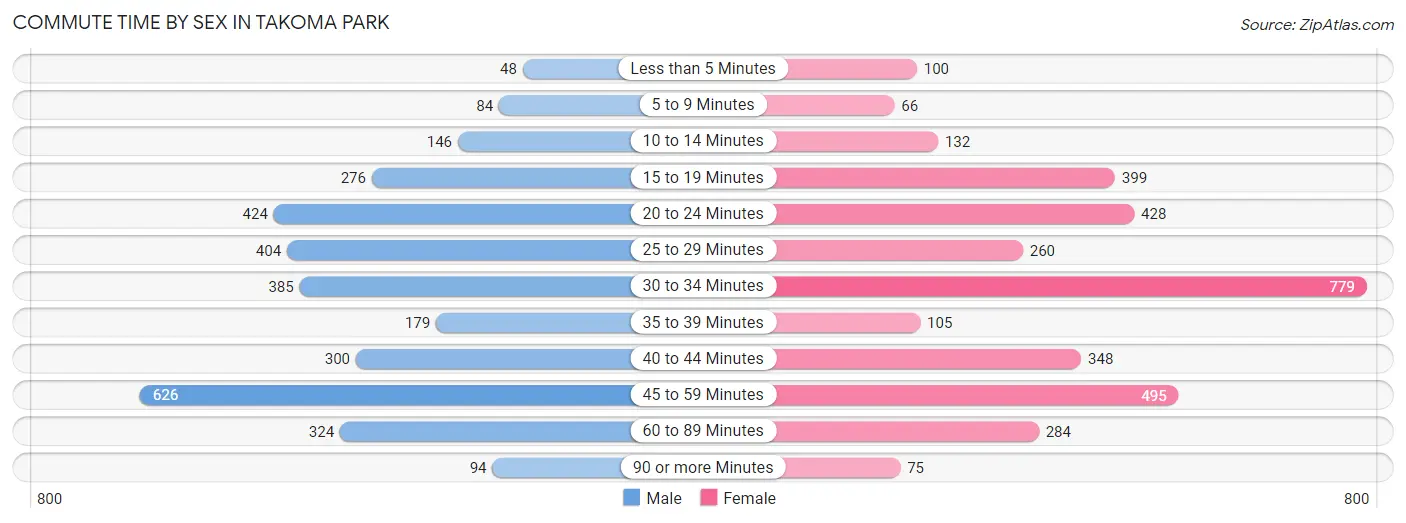
| Commute Time | Male | Female |
| Less than 5 Minutes | 48 (1.5%) | 100 (2.9%) |
| 5 to 9 Minutes | 84 (2.5%) | 66 (1.9%) |
| 10 to 14 Minutes | 146 (4.4%) | 132 (3.8%) |
| 15 to 19 Minutes | 276 (8.4%) | 399 (11.5%) |
| 20 to 24 Minutes | 424 (12.9%) | 428 (12.3%) |
| 25 to 29 Minutes | 404 (12.3%) | 260 (7.5%) |
| 30 to 34 Minutes | 385 (11.7%) | 779 (22.4%) |
| 35 to 39 Minutes | 179 (5.4%) | 105 (3.0%) |
| 40 to 44 Minutes | 300 (9.1%) | 348 (10.0%) |
| 45 to 59 Minutes | 626 (19.0%) | 495 (14.3%) |
| 60 to 89 Minutes | 324 (9.9%) | 284 (8.2%) |
| 90 or more Minutes | 94 (2.9%) | 75 (2.2%) |
Time of Departure to Work by Sex in Takoma Park
The most frequent times of departure to work in Takoma Park are 8:00 AM to 8:29 AM (549, 16.7%) for males and 7:00 AM to 7:29 AM (757, 21.8%) for females.

| Time of Departure | Male | Female |
| 12:00 AM to 4:59 AM | 159 (4.8%) | 51 (1.5%) |
| 5:00 AM to 5:29 AM | 143 (4.3%) | 60 (1.7%) |
| 5:30 AM to 5:59 AM | 81 (2.5%) | 74 (2.1%) |
| 6:00 AM to 6:29 AM | 346 (10.5%) | 219 (6.3%) |
| 6:30 AM to 6:59 AM | 133 (4.0%) | 106 (3.0%) |
| 7:00 AM to 7:29 AM | 413 (12.6%) | 757 (21.8%) |
| 7:30 AM to 7:59 AM | 257 (7.8%) | 251 (7.2%) |
| 8:00 AM to 8:29 AM | 549 (16.7%) | 492 (14.2%) |
| 8:30 AM to 8:59 AM | 268 (8.2%) | 393 (11.3%) |
| 9:00 AM to 9:59 AM | 235 (7.1%) | 233 (6.7%) |
| 10:00 AM to 10:59 AM | 152 (4.6%) | 144 (4.2%) |
| 11:00 AM to 11:59 AM | 38 (1.2%) | 92 (2.6%) |
| 12:00 PM to 3:59 PM | 270 (8.2%) | 359 (10.3%) |
| 4:00 PM to 11:59 PM | 246 (7.5%) | 240 (6.9%) |
| Total | 3,290 (100.0%) | 3,471 (100.0%) |
Housing Occupancy in Takoma Park
Occupancy by Ownership in Takoma Park
Of the total 6,898 dwellings in Takoma Park, owner-occupied units account for 3,541 (51.3%), while renter-occupied units make up 3,357 (48.7%).
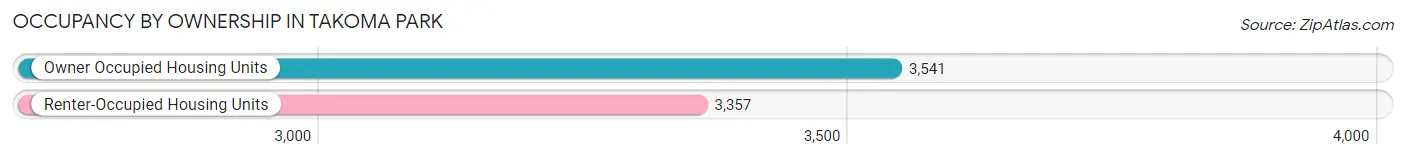
| Occupancy | # Housing Units | % Housing Units |
| Owner Occupied Housing Units | 3,541 | 51.3% |
| Renter-Occupied Housing Units | 3,357 | 48.7% |
| Total Occupied Housing Units | 6,898 | 100.0% |
Occupancy by Household Size in Takoma Park
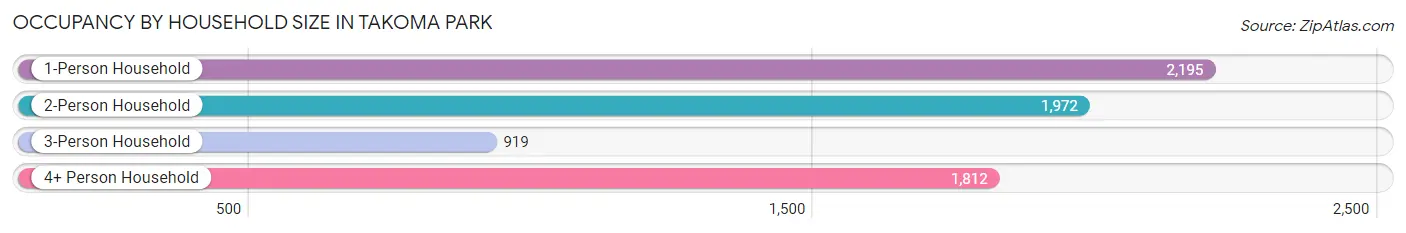
| Household Size | # Housing Units | % Housing Units |
| 1-Person Household | 2,195 | 31.8% |
| 2-Person Household | 1,972 | 28.6% |
| 3-Person Household | 919 | 13.3% |
| 4+ Person Household | 1,812 | 26.3% |
| Total Housing Units | 6,898 | 100.0% |
Occupancy by Ownership by Household Size in Takoma Park
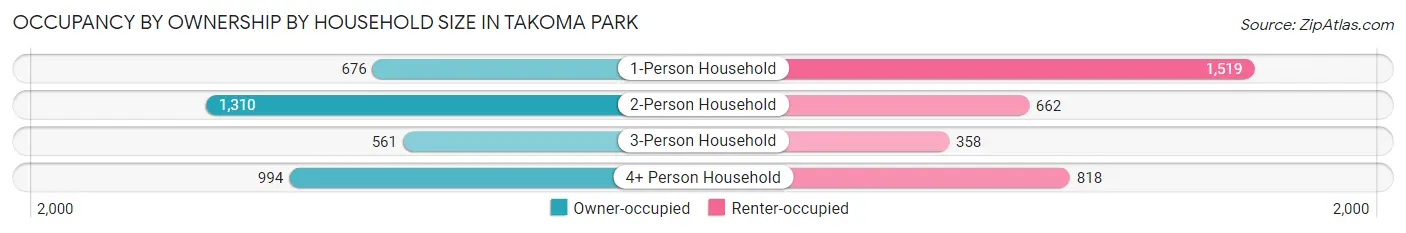
| Household Size | Owner-occupied | Renter-occupied |
| 1-Person Household | 676 (30.8%) | 1,519 (69.2%) |
| 2-Person Household | 1,310 (66.4%) | 662 (33.6%) |
| 3-Person Household | 561 (61.0%) | 358 (39.0%) |
| 4+ Person Household | 994 (54.9%) | 818 (45.1%) |
| Total Housing Units | 3,541 (51.3%) | 3,357 (48.7%) |
Occupancy by Educational Attainment in Takoma Park
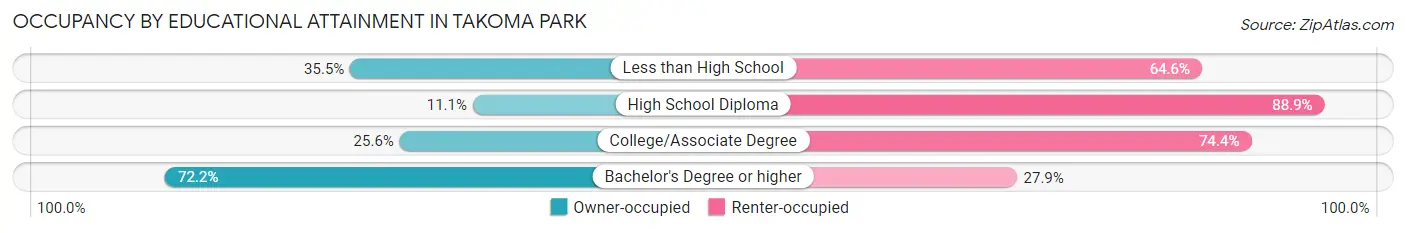
| Household Size | Owner-occupied | Renter-occupied |
| Less than High School | 190 (35.4%) | 346 (64.5%) |
| High School Diploma | 116 (11.1%) | 925 (88.9%) |
| College/Associate Degree | 333 (25.6%) | 966 (74.4%) |
| Bachelor's Degree or higher | 2,902 (72.2%) | 1,120 (27.9%) |
Occupancy by Age of Householder in Takoma Park
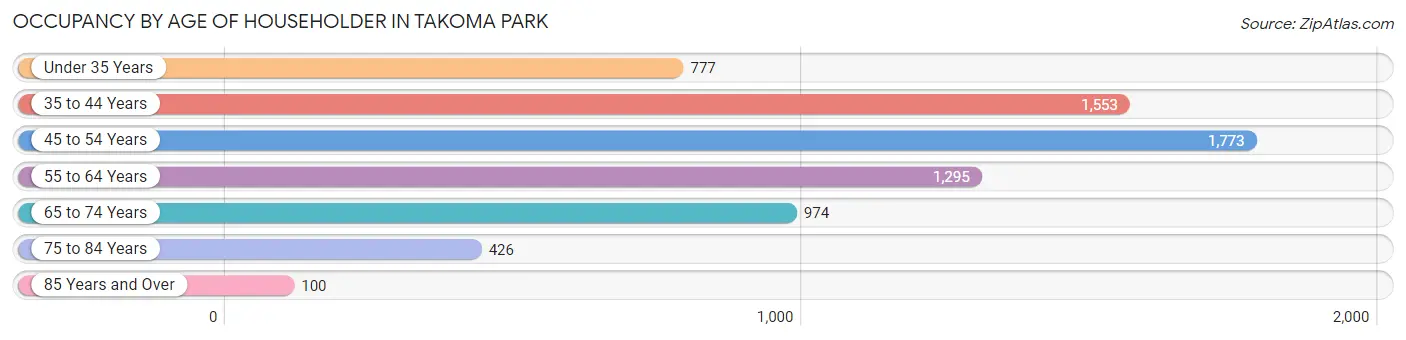
| Age Bracket | # Households | % Households |
| Under 35 Years | 777 | 11.3% |
| 35 to 44 Years | 1,553 | 22.5% |
| 45 to 54 Years | 1,773 | 25.7% |
| 55 to 64 Years | 1,295 | 18.8% |
| 65 to 74 Years | 974 | 14.1% |
| 75 to 84 Years | 426 | 6.2% |
| 85 Years and Over | 100 | 1.5% |
| Total | 6,898 | 100.0% |
Housing Finances in Takoma Park
Median Income by Occupancy in Takoma Park
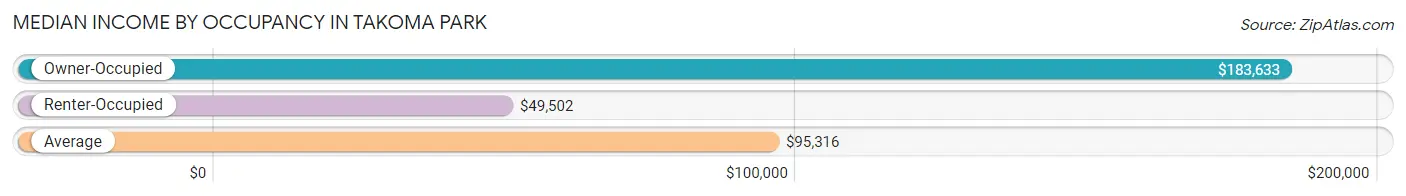
| Occupancy Type | # Households | Median Income |
| Owner-Occupied | 3,541 (51.3%) | $183,633 |
| Renter-Occupied | 3,357 (48.7%) | $49,502 |
| Average | 6,898 (100.0%) | $95,316 |
Occupancy by Householder Income Bracket in Takoma Park
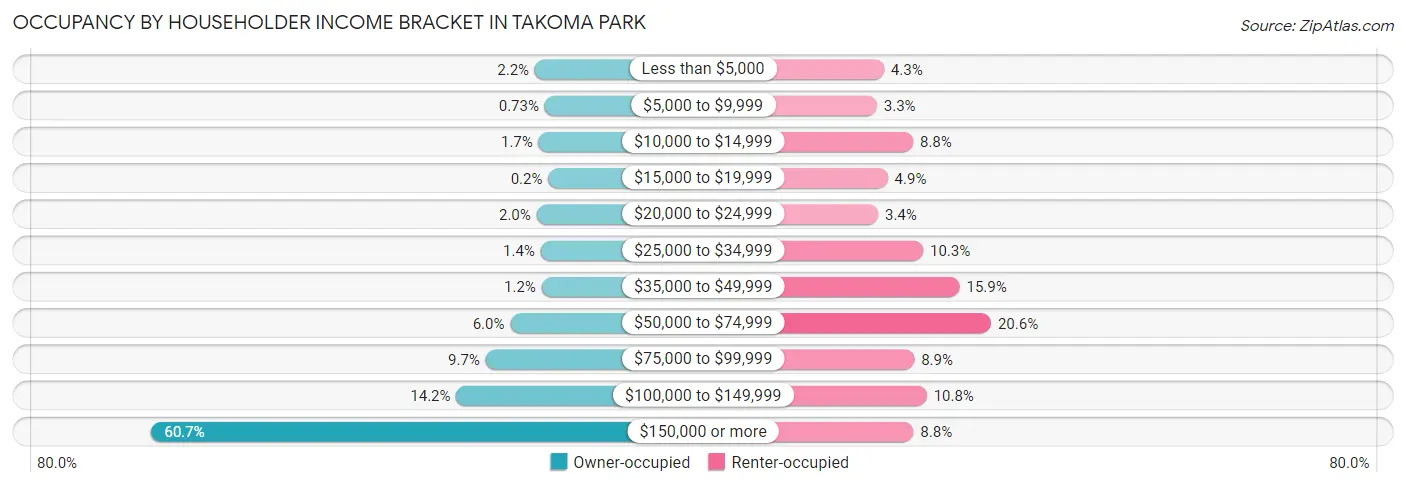
| Income Bracket | Owner-occupied | Renter-occupied |
| Less than $5,000 | 79 (2.2%) | 145 (4.3%) |
| $5,000 to $9,999 | 26 (0.7%) | 109 (3.3%) |
| $10,000 to $14,999 | 59 (1.7%) | 294 (8.8%) |
| $15,000 to $19,999 | 7 (0.2%) | 164 (4.9%) |
| $20,000 to $24,999 | 70 (2.0%) | 115 (3.4%) |
| $25,000 to $34,999 | 48 (1.4%) | 345 (10.3%) |
| $35,000 to $49,999 | 43 (1.2%) | 532 (15.9%) |
| $50,000 to $74,999 | 212 (6.0%) | 693 (20.6%) |
| $75,000 to $99,999 | 345 (9.7%) | 300 (8.9%) |
| $100,000 to $149,999 | 503 (14.2%) | 364 (10.8%) |
| $150,000 or more | 2,149 (60.7%) | 296 (8.8%) |
| Total | 3,541 (100.0%) | 3,357 (100.0%) |
Monthly Housing Cost Tiers in Takoma Park
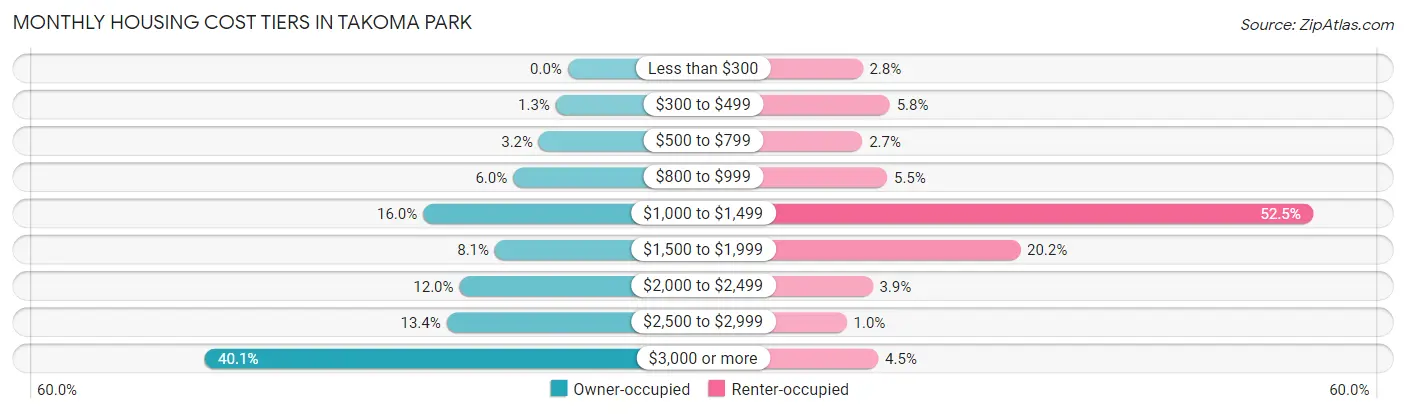
| Monthly Cost | Owner-occupied | Renter-occupied |
| Less than $300 | 0 (0.0%) | 93 (2.8%) |
| $300 to $499 | 47 (1.3%) | 194 (5.8%) |
| $500 to $799 | 113 (3.2%) | 92 (2.7%) |
| $800 to $999 | 214 (6.0%) | 184 (5.5%) |
| $1,000 to $1,499 | 566 (16.0%) | 1,762 (52.5%) |
| $1,500 to $1,999 | 285 (8.1%) | 677 (20.2%) |
| $2,000 to $2,499 | 424 (12.0%) | 130 (3.9%) |
| $2,500 to $2,999 | 474 (13.4%) | 34 (1.0%) |
| $3,000 or more | 1,418 (40.1%) | 151 (4.5%) |
| Total | 3,541 (100.0%) | 3,357 (100.0%) |
Physical Housing Characteristics in Takoma Park
Housing Structures in Takoma Park
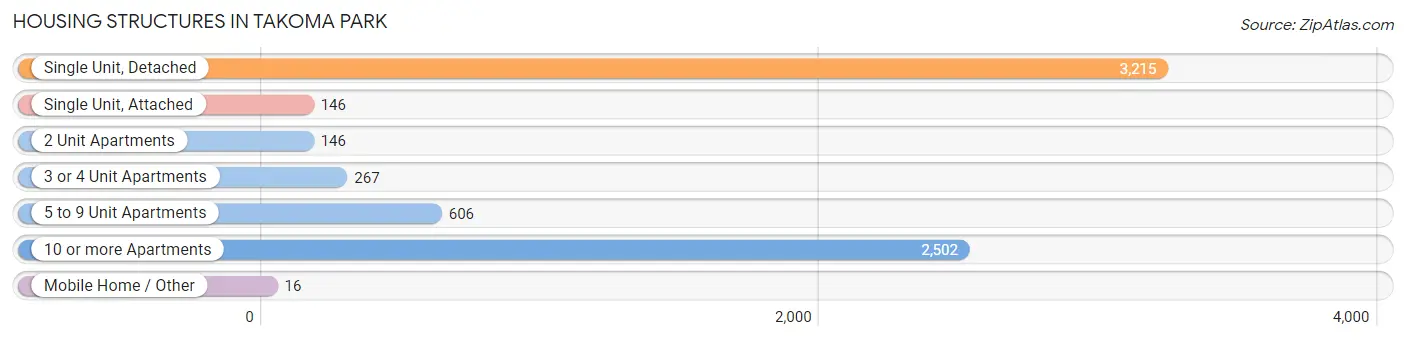
| Structure Type | # Housing Units | % Housing Units |
| Single Unit, Detached | 3,215 | 46.6% |
| Single Unit, Attached | 146 | 2.1% |
| 2 Unit Apartments | 146 | 2.1% |
| 3 or 4 Unit Apartments | 267 | 3.9% |
| 5 to 9 Unit Apartments | 606 | 8.8% |
| 10 or more Apartments | 2,502 | 36.3% |
| Mobile Home / Other | 16 | 0.2% |
| Total | 6,898 | 100.0% |
Housing Structures by Occupancy in Takoma Park
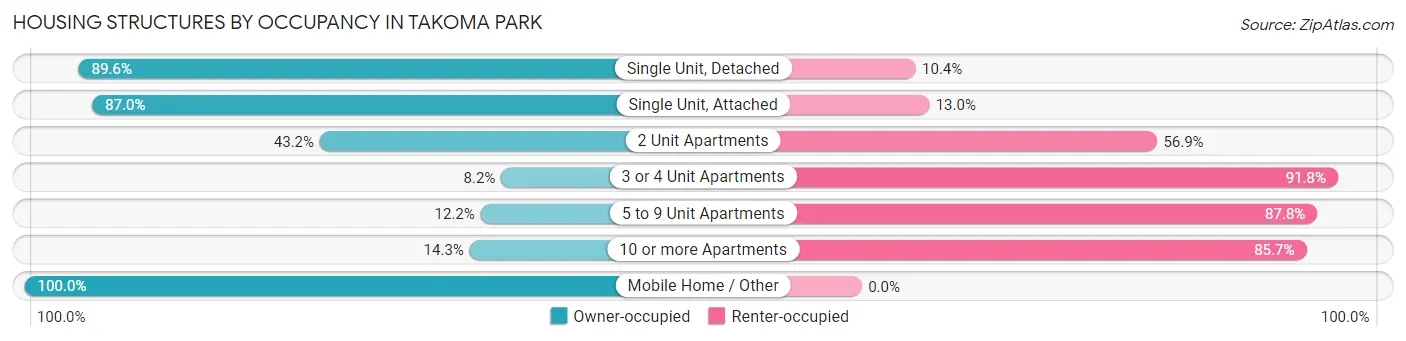
| Structure Type | Owner-occupied | Renter-occupied |
| Single Unit, Detached | 2,881 (89.6%) | 334 (10.4%) |
| Single Unit, Attached | 127 (87.0%) | 19 (13.0%) |
| 2 Unit Apartments | 63 (43.1%) | 83 (56.9%) |
| 3 or 4 Unit Apartments | 22 (8.2%) | 245 (91.8%) |
| 5 to 9 Unit Apartments | 74 (12.2%) | 532 (87.8%) |
| 10 or more Apartments | 358 (14.3%) | 2,144 (85.7%) |
| Mobile Home / Other | 16 (100.0%) | 0 (0.0%) |
| Total | 3,541 (51.3%) | 3,357 (48.7%) |
Housing Structures by Number of Rooms in Takoma Park
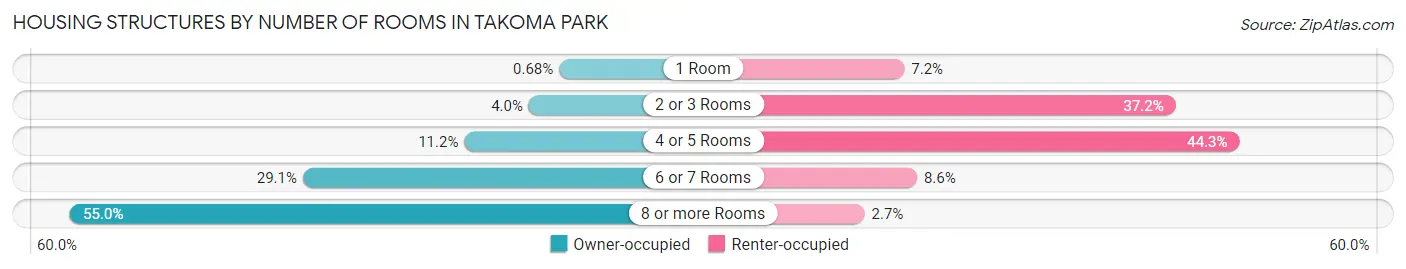
| Number of Rooms | Owner-occupied | Renter-occupied |
| 1 Room | 24 (0.7%) | 240 (7.1%) |
| 2 or 3 Rooms | 143 (4.0%) | 1,250 (37.2%) |
| 4 or 5 Rooms | 397 (11.2%) | 1,488 (44.3%) |
| 6 or 7 Rooms | 1,031 (29.1%) | 287 (8.6%) |
| 8 or more Rooms | 1,946 (55.0%) | 92 (2.7%) |
| Total | 3,541 (100.0%) | 3,357 (100.0%) |
Housing Structure by Heating Type in Takoma Park
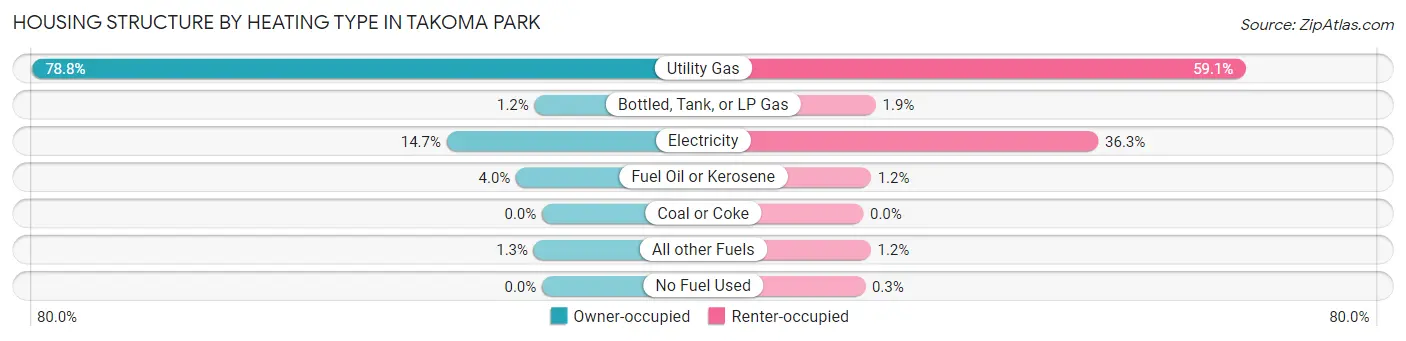
| Heating Type | Owner-occupied | Renter-occupied |
| Utility Gas | 2,791 (78.8%) | 1,983 (59.1%) |
| Bottled, Tank, or LP Gas | 41 (1.2%) | 65 (1.9%) |
| Electricity | 522 (14.7%) | 1,220 (36.3%) |
| Fuel Oil or Kerosene | 142 (4.0%) | 40 (1.2%) |
| Coal or Coke | 0 (0.0%) | 0 (0.0%) |
| All other Fuels | 45 (1.3%) | 39 (1.2%) |
| No Fuel Used | 0 (0.0%) | 10 (0.3%) |
| Total | 3,541 (100.0%) | 3,357 (100.0%) |
Household Vehicle Usage in Takoma Park
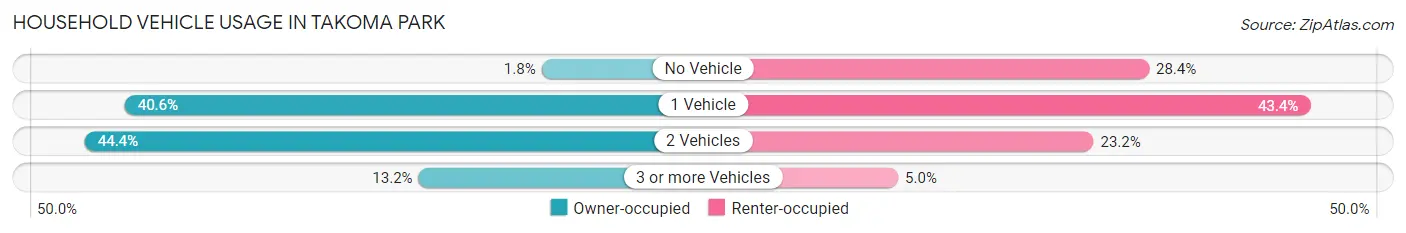
| Vehicles per Household | Owner-occupied | Renter-occupied |
| No Vehicle | 62 (1.8%) | 953 (28.4%) |
| 1 Vehicle | 1,439 (40.6%) | 1,458 (43.4%) |
| 2 Vehicles | 1,571 (44.4%) | 779 (23.2%) |
| 3 or more Vehicles | 469 (13.2%) | 167 (5.0%) |
| Total | 3,541 (100.0%) | 3,357 (100.0%) |
Real Estate & Mortgages in Takoma Park
Real Estate and Mortgage Overview in Takoma Park
| Characteristic | Without Mortgage | With Mortgage |
| Housing Units | 832 | 2,709 |
| Median Property Value | $604,100 | $715,400 |
| Median Household Income | $119,219 | $1,811 |
| Monthly Housing Costs | $1,128 | $1,418 |
| Real Estate Taxes | $8,220 | $6 |
Property Value by Mortgage Status in Takoma Park
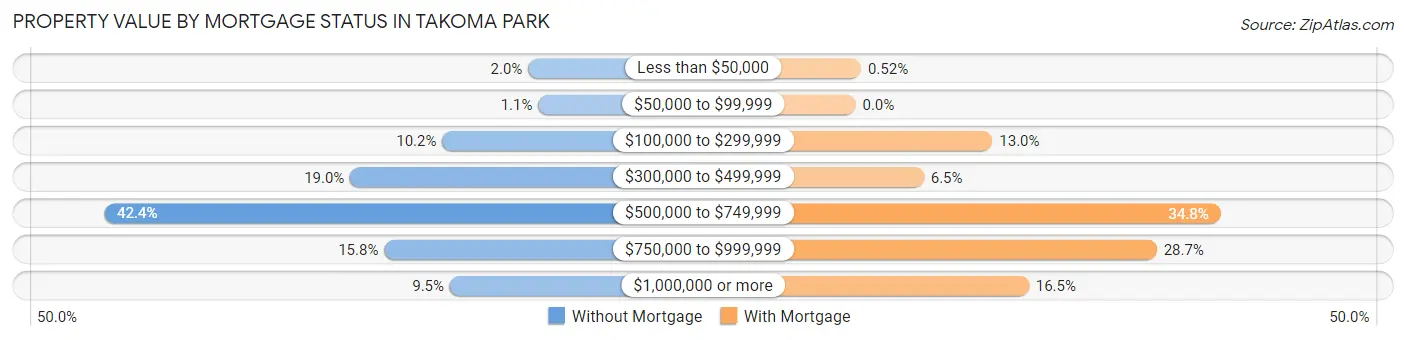
| Property Value | Without Mortgage | With Mortgage |
| Less than $50,000 | 17 (2.0%) | 14 (0.5%) |
| $50,000 to $99,999 | 9 (1.1%) | 0 (0.0%) |
| $100,000 to $299,999 | 85 (10.2%) | 353 (13.0%) |
| $300,000 to $499,999 | 158 (19.0%) | 176 (6.5%) |
| $500,000 to $749,999 | 353 (42.4%) | 942 (34.8%) |
| $750,000 to $999,999 | 131 (15.8%) | 777 (28.7%) |
| $1,000,000 or more | 79 (9.5%) | 447 (16.5%) |
| Total | 832 (100.0%) | 2,709 (100.0%) |
Household Income by Mortgage Status in Takoma Park
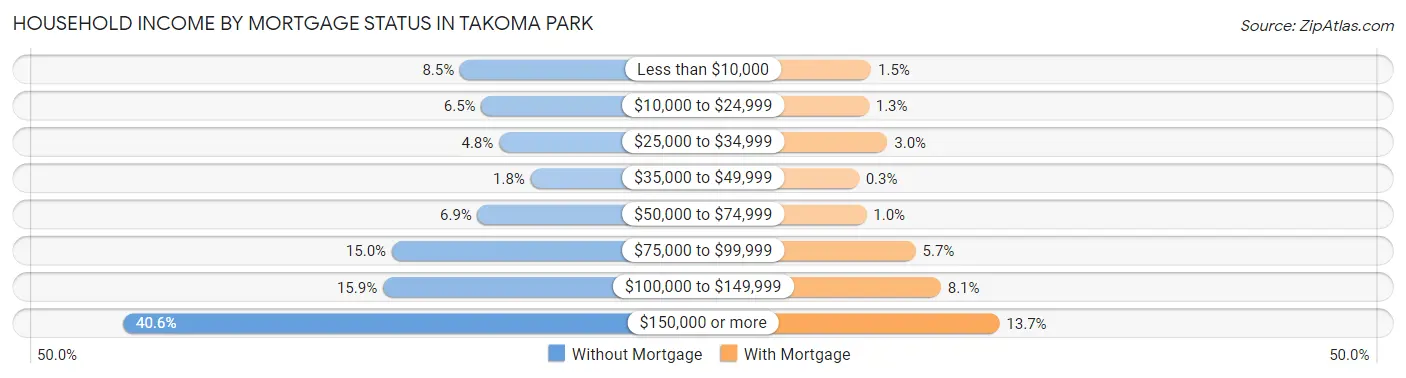
| Household Income | Without Mortgage | With Mortgage |
| Less than $10,000 | 71 (8.5%) | 40 (1.5%) |
| $10,000 to $24,999 | 54 (6.5%) | 34 (1.3%) |
| $25,000 to $34,999 | 40 (4.8%) | 82 (3.0%) |
| $35,000 to $49,999 | 15 (1.8%) | 8 (0.3%) |
| $50,000 to $74,999 | 57 (6.9%) | 28 (1.0%) |
| $75,000 to $99,999 | 125 (15.0%) | 155 (5.7%) |
| $100,000 to $149,999 | 132 (15.9%) | 220 (8.1%) |
| $150,000 or more | 338 (40.6%) | 371 (13.7%) |
| Total | 832 (100.0%) | 2,709 (100.0%) |
Property Value to Household Income Ratio in Takoma Park
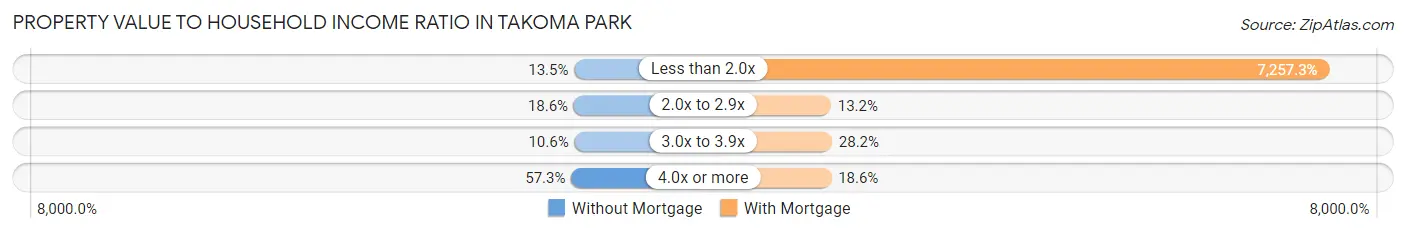
| Value-to-Income Ratio | Without Mortgage | With Mortgage |
| Less than 2.0x | 112 (13.5%) | 196,599 (7,257.3%) |
| 2.0x to 2.9x | 155 (18.6%) | 357 (13.2%) |
| 3.0x to 3.9x | 88 (10.6%) | 763 (28.2%) |
| 4.0x or more | 477 (57.3%) | 503 (18.6%) |
| Total | 832 (100.0%) | 2,709 (100.0%) |
Real Estate Taxes by Mortgage Status in Takoma Park
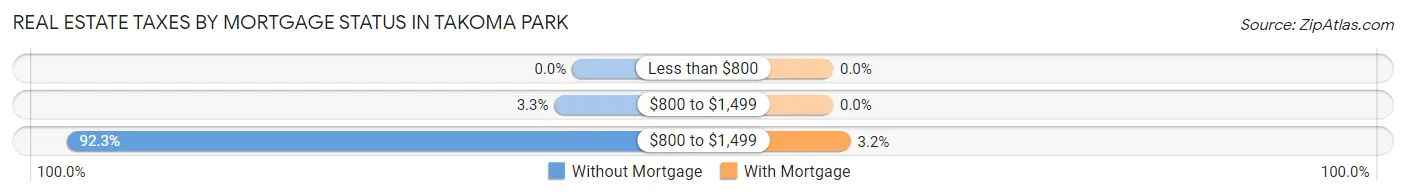
| Property Taxes | Without Mortgage | With Mortgage |
| Less than $800 | 0 (0.0%) | 0 (0.0%) |
| $800 to $1,499 | 27 (3.3%) | 0 (0.0%) |
| $800 to $1,499 | 768 (92.3%) | 87 (3.2%) |
| Total | 832 (100.0%) | 2,709 (100.0%) |
Health & Disability in Takoma Park
Health Insurance Coverage by Age in Takoma Park
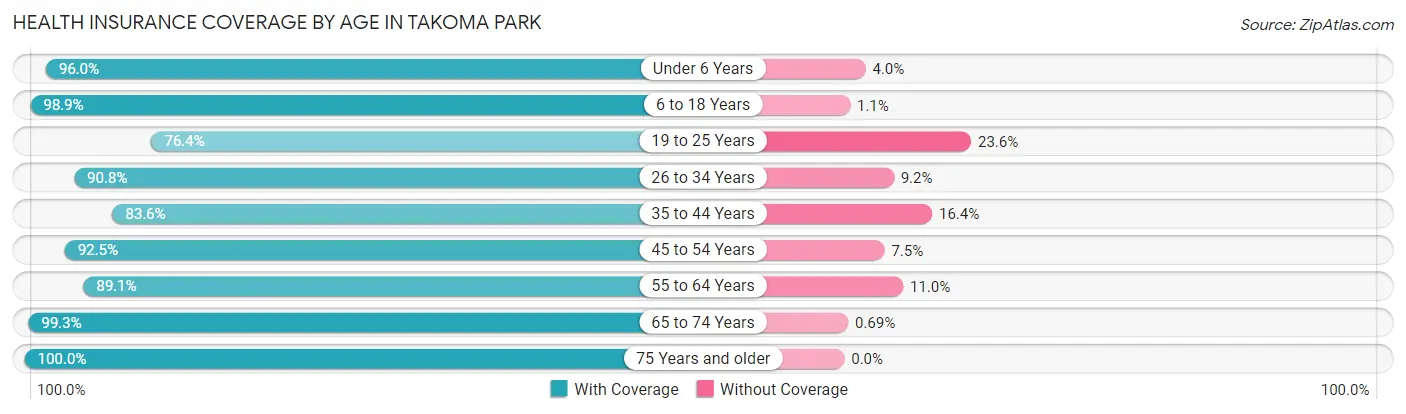
| Age Bracket | With Coverage | Without Coverage |
| Under 6 Years | 1,481 (96.0%) | 61 (4.0%) |
| 6 to 18 Years | 3,131 (98.9%) | 34 (1.1%) |
| 19 to 25 Years | 688 (76.4%) | 213 (23.6%) |
| 26 to 34 Years | 1,329 (90.8%) | 135 (9.2%) |
| 35 to 44 Years | 2,375 (83.6%) | 465 (16.4%) |
| 45 to 54 Years | 2,669 (92.5%) | 216 (7.5%) |
| 55 to 64 Years | 2,065 (89.0%) | 254 (11.0%) |
| 65 to 74 Years | 1,441 (99.3%) | 10 (0.7%) |
| 75 Years and older | 879 (100.0%) | 0 (0.0%) |
| Total | 16,058 (92.0%) | 1,388 (8.0%) |
Health Insurance Coverage by Citizenship Status in Takoma Park
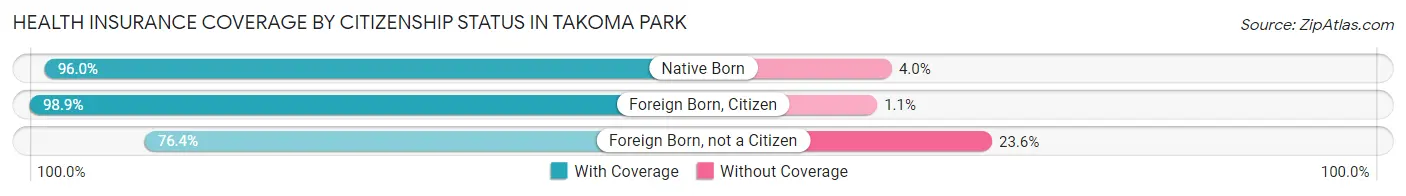
| Citizenship Status | With Coverage | Without Coverage |
| Native Born | 1,481 (96.0%) | 61 (4.0%) |
| Foreign Born, Citizen | 3,131 (98.9%) | 34 (1.1%) |
| Foreign Born, not a Citizen | 688 (76.4%) | 213 (23.6%) |
Health Insurance Coverage by Household Income in Takoma Park
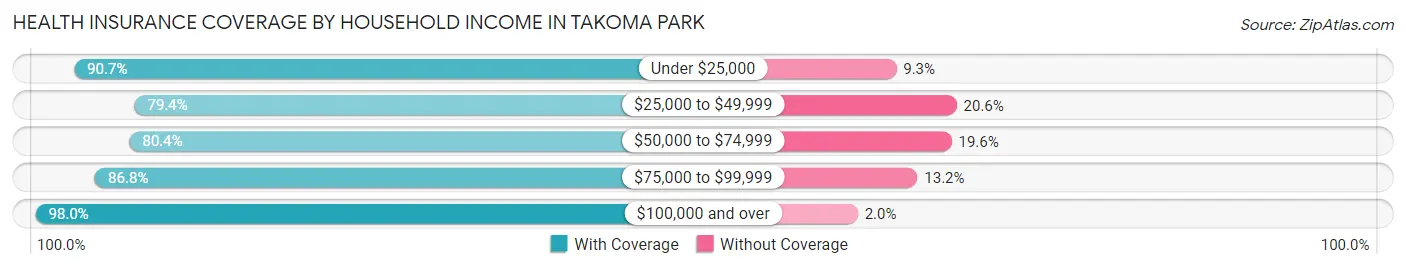
| Household Income | With Coverage | Without Coverage |
| Under $25,000 | 1,439 (90.7%) | 147 (9.3%) |
| $25,000 to $49,999 | 1,564 (79.4%) | 405 (20.6%) |
| $50,000 to $74,999 | 1,749 (80.4%) | 427 (19.6%) |
| $75,000 to $99,999 | 1,247 (86.8%) | 190 (13.2%) |
| $100,000 and over | 9,838 (98.0%) | 205 (2.0%) |
Public vs Private Health Insurance Coverage by Age in Takoma Park
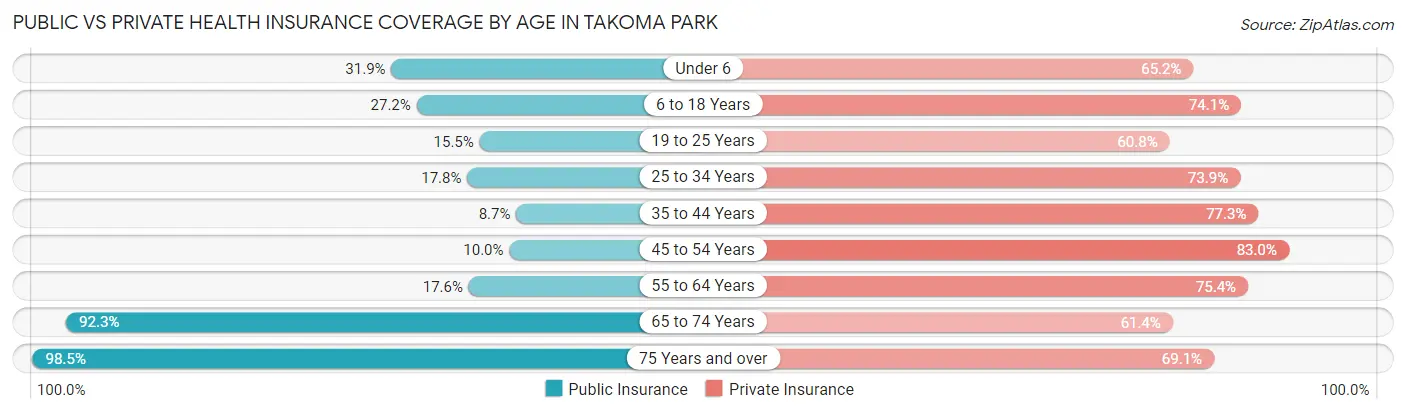
| Age Bracket | Public Insurance | Private Insurance |
| Under 6 | 492 (31.9%) | 1,006 (65.2%) |
| 6 to 18 Years | 862 (27.2%) | 2,345 (74.1%) |
| 19 to 25 Years | 140 (15.5%) | 548 (60.8%) |
| 25 to 34 Years | 261 (17.8%) | 1,082 (73.9%) |
| 35 to 44 Years | 248 (8.7%) | 2,195 (77.3%) |
| 45 to 54 Years | 289 (10.0%) | 2,393 (83.0%) |
| 55 to 64 Years | 407 (17.5%) | 1,748 (75.4%) |
| 65 to 74 Years | 1,339 (92.3%) | 891 (61.4%) |
| 75 Years and over | 866 (98.5%) | 607 (69.1%) |
| Total | 4,904 (28.1%) | 12,815 (73.5%) |
Disability Status by Sex by Age in Takoma Park
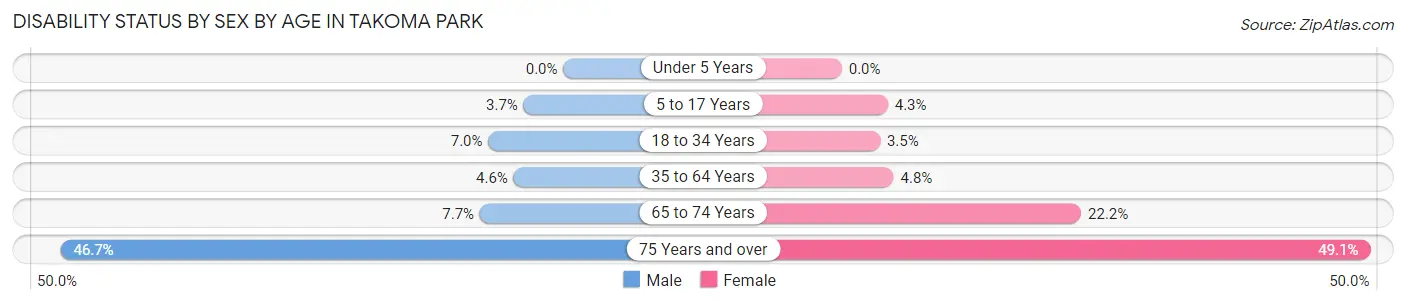
| Age Bracket | Male | Female |
| Under 5 Years | 0 (0.0%) | 0 (0.0%) |
| 5 to 17 Years | 63 (3.7%) | 69 (4.3%) |
| 18 to 34 Years | 82 (7.0%) | 47 (3.5%) |
| 35 to 64 Years | 177 (4.6%) | 202 (4.8%) |
| 65 to 74 Years | 52 (7.7%) | 173 (22.2%) |
| 75 Years and over | 161 (46.7%) | 262 (49.1%) |
Disability Class by Sex by Age in Takoma Park
Disability Class: Hearing Difficulty
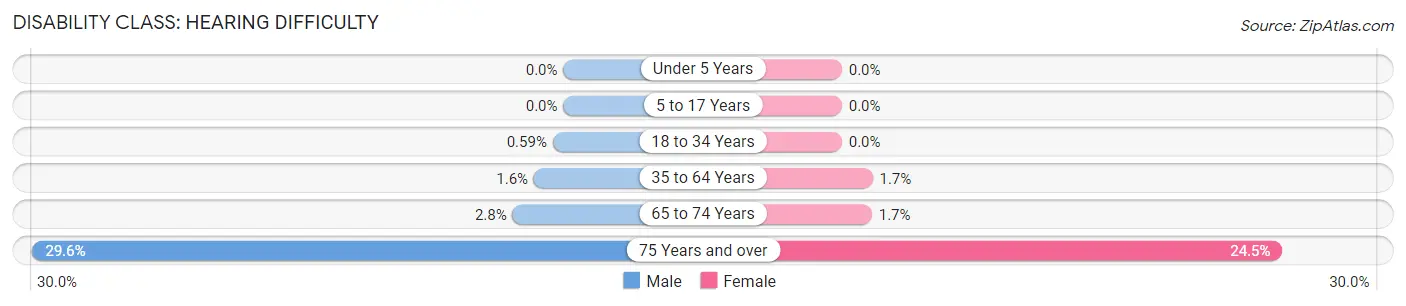
| Age Bracket | Male | Female |
| Under 5 Years | 0 (0.0%) | 0 (0.0%) |
| 5 to 17 Years | 0 (0.0%) | 0 (0.0%) |
| 18 to 34 Years | 7 (0.6%) | 0 (0.0%) |
| 35 to 64 Years | 63 (1.6%) | 72 (1.7%) |
| 65 to 74 Years | 19 (2.8%) | 13 (1.7%) |
| 75 Years and over | 102 (29.6%) | 131 (24.5%) |
Disability Class: Vision Difficulty
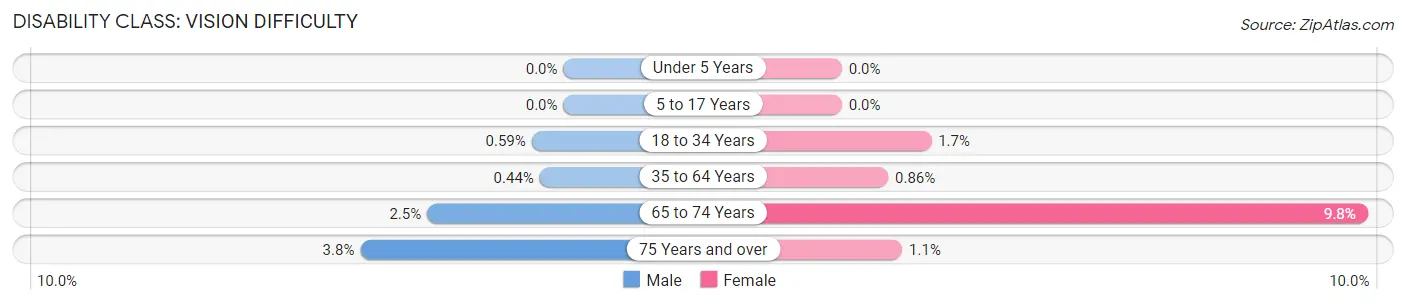
| Age Bracket | Male | Female |
| Under 5 Years | 0 (0.0%) | 0 (0.0%) |
| 5 to 17 Years | 0 (0.0%) | 0 (0.0%) |
| 18 to 34 Years | 7 (0.6%) | 22 (1.7%) |
| 35 to 64 Years | 17 (0.4%) | 36 (0.9%) |
| 65 to 74 Years | 17 (2.5%) | 76 (9.8%) |
| 75 Years and over | 13 (3.8%) | 6 (1.1%) |
Disability Class: Cognitive Difficulty
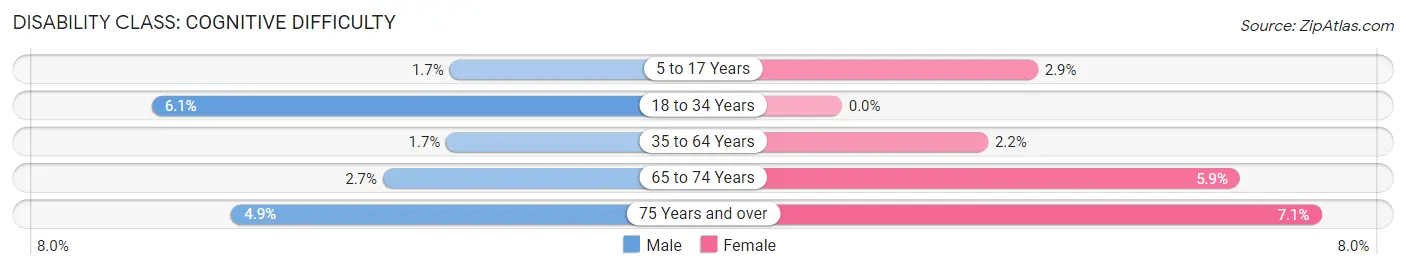
| Age Bracket | Male | Female |
| 5 to 17 Years | 29 (1.7%) | 47 (2.9%) |
| 18 to 34 Years | 72 (6.1%) | 0 (0.0%) |
| 35 to 64 Years | 67 (1.7%) | 91 (2.2%) |
| 65 to 74 Years | 18 (2.7%) | 46 (5.9%) |
| 75 Years and over | 17 (4.9%) | 38 (7.1%) |
Disability Class: Ambulatory Difficulty
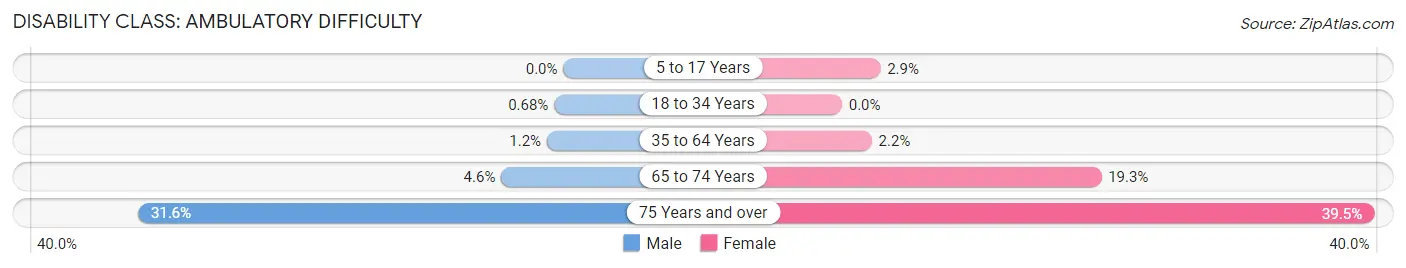
| Age Bracket | Male | Female |
| 5 to 17 Years | 0 (0.0%) | 46 (2.9%) |
| 18 to 34 Years | 8 (0.7%) | 0 (0.0%) |
| 35 to 64 Years | 47 (1.2%) | 93 (2.2%) |
| 65 to 74 Years | 31 (4.6%) | 150 (19.3%) |
| 75 Years and over | 109 (31.6%) | 211 (39.5%) |
Disability Class: Self-Care Difficulty
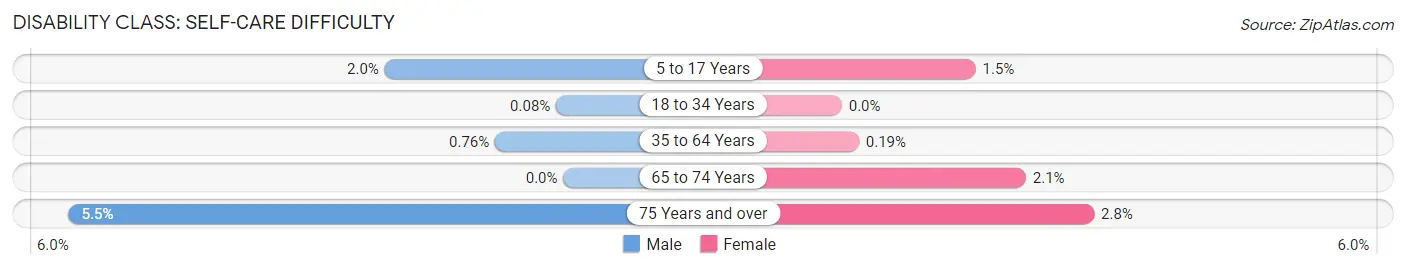
| Age Bracket | Male | Female |
| 5 to 17 Years | 34 (2.0%) | 24 (1.5%) |
| 18 to 34 Years | 1 (0.1%) | 0 (0.0%) |
| 35 to 64 Years | 29 (0.8%) | 8 (0.2%) |
| 65 to 74 Years | 0 (0.0%) | 16 (2.1%) |
| 75 Years and over | 19 (5.5%) | 15 (2.8%) |
Technology Access in Takoma Park
Computing Device Access in Takoma Park
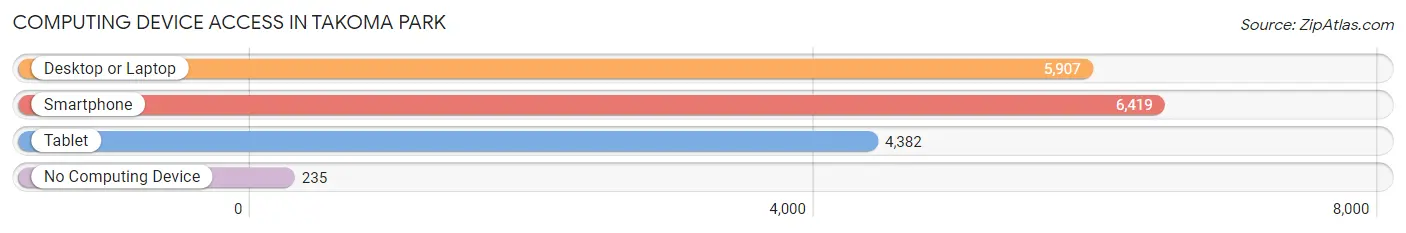
| Device Type | # Households | % Households |
| Desktop or Laptop | 5,907 | 85.6% |
| Smartphone | 6,419 | 93.1% |
| Tablet | 4,382 | 63.5% |
| No Computing Device | 235 | 3.4% |
| Total | 6,898 | 100.0% |
Internet Access in Takoma Park
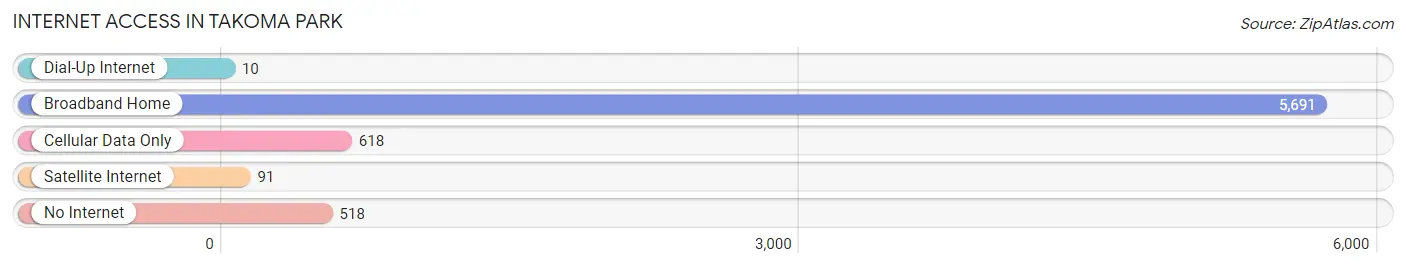
| Internet Type | # Households | % Households |
| Dial-Up Internet | 10 | 0.1% |
| Broadband Home | 5,691 | 82.5% |
| Cellular Data Only | 618 | 9.0% |
| Satellite Internet | 91 | 1.3% |
| No Internet | 518 | 7.5% |
| Total | 6,898 | 100.0% |
Takoma Park Summary
Takoma Park is a city located in Montgomery County, Maryland, United States. It is a suburb of Washington, D.C., and is located just to the northwest of the nation’s capital. The city is known for its progressive politics, its diverse population, and its vibrant arts and culture scene.
Geography
Takoma Park is located in the Piedmont region of Maryland, just to the northwest of Washington, D.C. The city is bordered by Silver Spring to the east, Langley Park to the south, and the Washington, D.C. neighborhoods of Shepherd Park and Brightwood to the west. The city is situated on a plateau, with an elevation of about 300 feet above sea level. The city is located in the watershed of the Anacostia River, and is drained by several small creeks, including Sligo Creek, which runs through the city.
The city covers an area of about 4.2 square miles, and is home to a population of about 18,000 people. The city is divided into several distinct neighborhoods, including Takoma, Old Takoma, Takoma Park, and Takoma Junction.
Economy
Takoma Park is home to a diverse economy, with a mix of small businesses, retail stores, and professional services. The city is home to several large employers, including the National Institutes of Health, the National Oceanic and Atmospheric Administration, and the U.S. Department of Agriculture. The city is also home to several small businesses, including restaurants, cafes, and boutiques.
The city is also home to several educational institutions, including Montgomery College, the University of Maryland, and the Washington Adventist University.
Demographics
Takoma Park is a diverse city, with a population that is about 40% white, 30% African American, 15% Hispanic, and 5% Asian. The city is also home to a large immigrant population, with about 20% of the population being foreign-born.
The median household income in Takoma Park is about $70,000, and the median home value is about $400,000. The city has a high rate of homeownership, with about 70% of the population owning their own homes.
The city is also home to a vibrant arts and culture scene, with several galleries, theaters, and music venues. The city is also home to several festivals and events, including the Takoma Park Folk Festival and the Takoma Park Street Festival.
Conclusion
Takoma Park is a vibrant and diverse city located in Montgomery County, Maryland. The city is known for its progressive politics, its diverse population, and its vibrant arts and culture scene. The city is home to a diverse economy, with a mix of small businesses, retail stores, and professional services. The city is also home to several educational institutions, and has a high rate of homeownership. Takoma Park is a great place to live, work, and play.
Common Questions
What is Per Capita Income in Takoma Park?
Per Capita income in Takoma Park is $55,631.
What is the Median Family Income in Takoma Park?
Median Family Income in Takoma Park is $137,738.
What is the Median Household income in Takoma Park?
Median Household Income in Takoma Park is $95,316.
What is Income or Wage Gap in Takoma Park?
Income or Wage Gap in Takoma Park is 20.5%.
Women in Takoma Park earn 79.5 cents for every dollar earned by a man.
What is Inequality or Gini Index in Takoma Park?
Inequality or Gini Index in Takoma Park is 0.49.
What is the Total Population of Takoma Park?
Total Population of Takoma Park is 17,542.
What is the Total Male Population of Takoma Park?
Total Male Population of Takoma Park is 8,304.
What is the Total Female Population of Takoma Park?
Total Female Population of Takoma Park is 9,238.
What is the Ratio of Males per 100 Females in Takoma Park?
There are 89.89 Males per 100 Females in Takoma Park.
What is the Ratio of Females per 100 Males in Takoma Park?
There are 111.25 Females per 100 Males in Takoma Park.
What is the Median Population Age in Takoma Park?
Median Population Age in Takoma Park is 41.2 Years.
What is the Average Family Size in Takoma Park
Average Family Size in Takoma Park is 3.2 People.
What is the Average Household Size in Takoma Park
Average Household Size in Takoma Park is 2.5 People.
How Large is the Labor Force in Takoma Park?
There are 9,784 People in the Labor Forcein in Takoma Park.
What is the Percentage of People in the Labor Force in Takoma Park?
72.9% of People are in the Labor Force in Takoma Park.
What is the Unemployment Rate in Takoma Park?
Unemployment Rate in Takoma Park is 5.1%.