Brock Hall, MD Map & Demographics
Brock Hall Map
Brock Hall Overview
$66,958
PER CAPITA INCOME
$193,864
AVG FAMILY INCOME
$188,096
AVG HOUSEHOLD INCOME
0.2%
WAGE / INCOME GAP [ % ]
99.8¢/ $1
WAGE / INCOME GAP [ $ ]
$10,199
FAMILY INCOME DEFICIT
0.29
INEQUALITY / GINI INDEX
12,529
TOTAL POPULATION
6,133
MALE POPULATION
6,396
FEMALE POPULATION
95.89
MALES / 100 FEMALES
104.29
FEMALES / 100 MALES
40.9
MEDIAN AGE
3.4
AVG FAMILY SIZE
3.0
AVG HOUSEHOLD SIZE
7,322
LABOR FORCE [ PEOPLE ]
76.9%
PERCENT IN LABOR FORCE
7.7%
UNEMPLOYMENT RATE
Income in Brock Hall
Income Overview in Brock Hall
Per Capita Income in Brock Hall is $66,958, while median incomes of families and households are $193,864 and $188,096 respectively.
| Characteristic | Number | Measure |
| Per Capita Income | 12,529 | $66,958 |
| Median Family Income | 3,388 | $193,864 |
| Mean Family Income | 3,388 | $207,189 |
| Median Household Income | 4,201 | $188,096 |
| Mean Household Income | 4,201 | $197,327 |
| Income Deficit | 3,388 | $10,199 |
| Wage / Income Gap (%) | 12,529 | 0.21% |
| Wage / Income Gap ($) | 12,529 | 99.79¢ per $1 |
| Gini / Inequality Index | 12,529 | 0.29 |
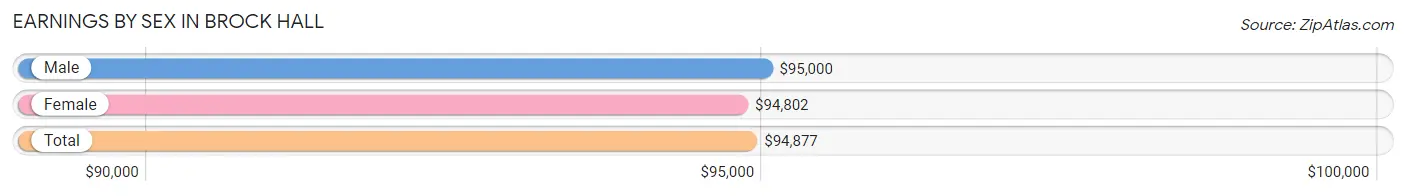
Earnings by Sex in Brock Hall
Average Earnings in Brock Hall are $94,877, $95,000 for men and $94,802 for women, a difference of 0.2%.
| Sex | Number | Average Earnings |
| Male | 3,374 (45.0%) | $95,000 |
| Female | 4,122 (55.0%) | $94,802 |
| Total | 7,496 (100.0%) | $94,877 |
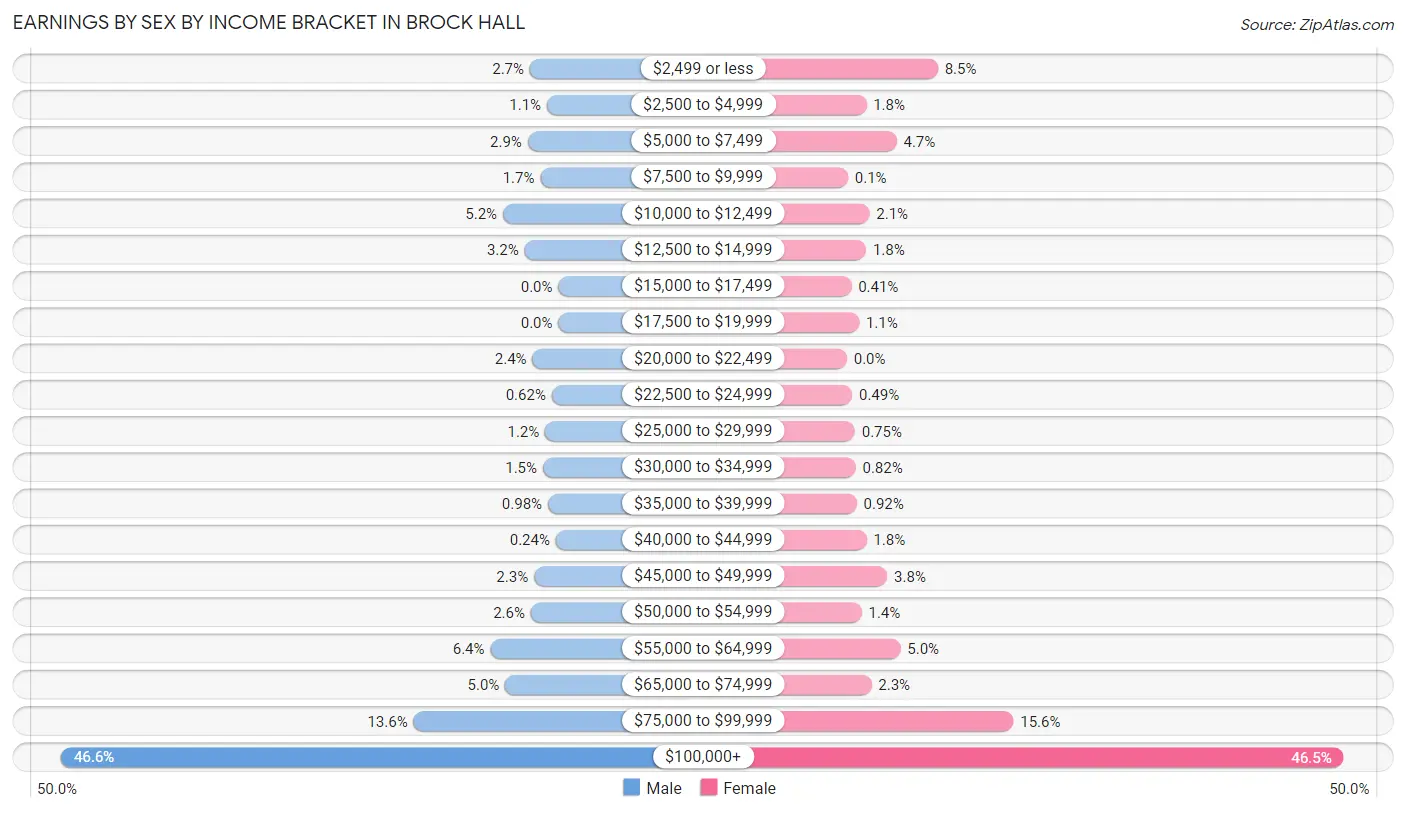
Earnings by Sex by Income Bracket in Brock Hall
The most common earnings brackets in Brock Hall are $100,000+ for men (1,572 | 46.6%) and $100,000+ for women (1,918 | 46.5%).
| Income | Male | Female |
| $2,499 or less | 90 (2.7%) | 351 (8.5%) |
| $2,500 to $4,999 | 36 (1.1%) | 75 (1.8%) |
| $5,000 to $7,499 | 97 (2.9%) | 192 (4.7%) |
| $7,500 to $9,999 | 57 (1.7%) | 4 (0.1%) |
| $10,000 to $12,499 | 175 (5.2%) | 87 (2.1%) |
| $12,500 to $14,999 | 107 (3.2%) | 74 (1.8%) |
| $15,000 to $17,499 | 0 (0.0%) | 17 (0.4%) |
| $17,500 to $19,999 | 0 (0.0%) | 47 (1.1%) |
| $20,000 to $22,499 | 82 (2.4%) | 0 (0.0%) |
| $22,500 to $24,999 | 21 (0.6%) | 20 (0.5%) |
| $25,000 to $29,999 | 42 (1.2%) | 31 (0.7%) |
| $30,000 to $34,999 | 49 (1.5%) | 34 (0.8%) |
| $35,000 to $39,999 | 33 (1.0%) | 38 (0.9%) |
| $40,000 to $44,999 | 8 (0.2%) | 76 (1.8%) |
| $45,000 to $49,999 | 77 (2.3%) | 156 (3.8%) |
| $50,000 to $54,999 | 87 (2.6%) | 57 (1.4%) |
| $55,000 to $64,999 | 215 (6.4%) | 207 (5.0%) |
| $65,000 to $74,999 | 168 (5.0%) | 95 (2.3%) |
| $75,000 to $99,999 | 458 (13.6%) | 643 (15.6%) |
| $100,000+ | 1,572 (46.6%) | 1,918 (46.5%) |
| Total | 3,374 (100.0%) | 4,122 (100.0%) |
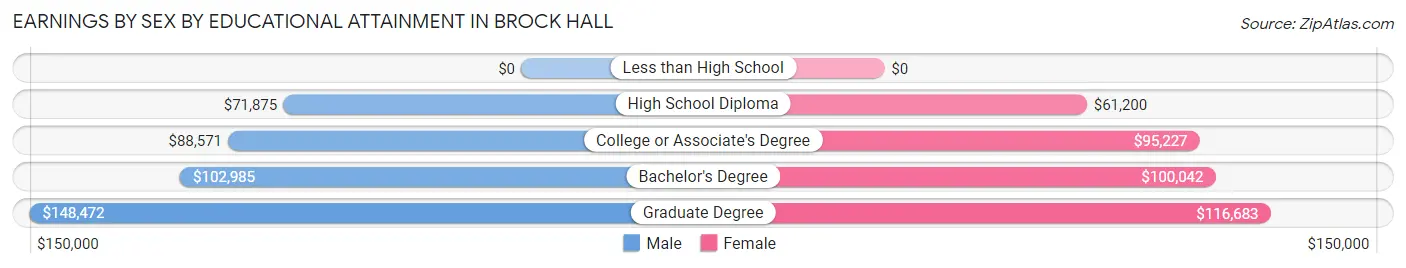
Earnings by Sex by Educational Attainment in Brock Hall
Average earnings in Brock Hall are $104,653 for men and $102,295 for women, a difference of 2.2%. Men with an educational attainment of graduate degree enjoy the highest average annual earnings of $148,472, while those with high school diploma education earn the least with $71,875. Women with an educational attainment of graduate degree earn the most with the average annual earnings of $116,683, while those with high school diploma education have the smallest earnings of $61,200.
| Educational Attainment | Male Income | Female Income |
| Less than High School | - | - |
| High School Diploma | $71,875 | $61,200 |
| College or Associate's Degree | $88,571 | $95,227 |
| Bachelor's Degree | $102,985 | $100,042 |
| Graduate Degree | $148,472 | $116,683 |
| Total | $104,653 | $102,295 |
Family Income in Brock Hall
Family Income Brackets in Brock Hall
According to the Brock Hall family income data, there are 1,558 families falling into the $200,000+ income range, which is the most common income bracket and makes up 46.0% of all families.
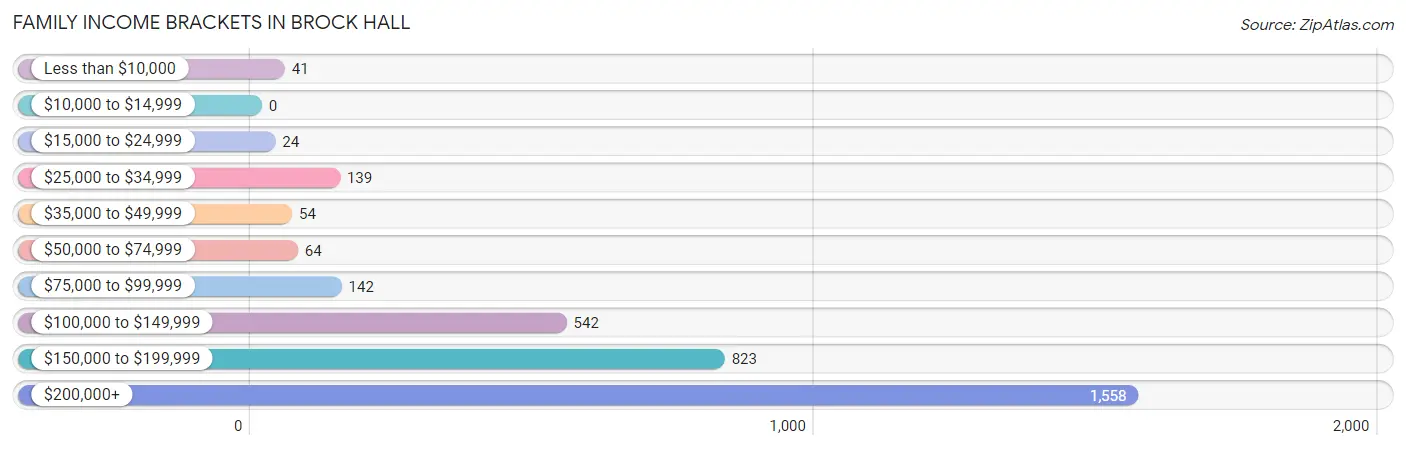
| Income Bracket | # Families | % Families |
| Less than $10,000 | 41 | 1.2% |
| $10,000 to $14,999 | 0 | 0.0% |
| $15,000 to $24,999 | 24 | 0.7% |
| $25,000 to $34,999 | 139 | 4.1% |
| $35,000 to $49,999 | 54 | 1.6% |
| $50,000 to $74,999 | 64 | 1.9% |
| $75,000 to $99,999 | 142 | 4.2% |
| $100,000 to $149,999 | 542 | 16.0% |
| $150,000 to $199,999 | 823 | 24.3% |
| $200,000+ | 1,558 | 46.0% |
Family Income by Famaliy Size in Brock Hall
4-person families (705 | 20.8%) account for the highest median family income in Brock Hall with $219,063 per family, while 2-person families (1,336 | 39.4%) have the highest median income of $85,878 per family member.
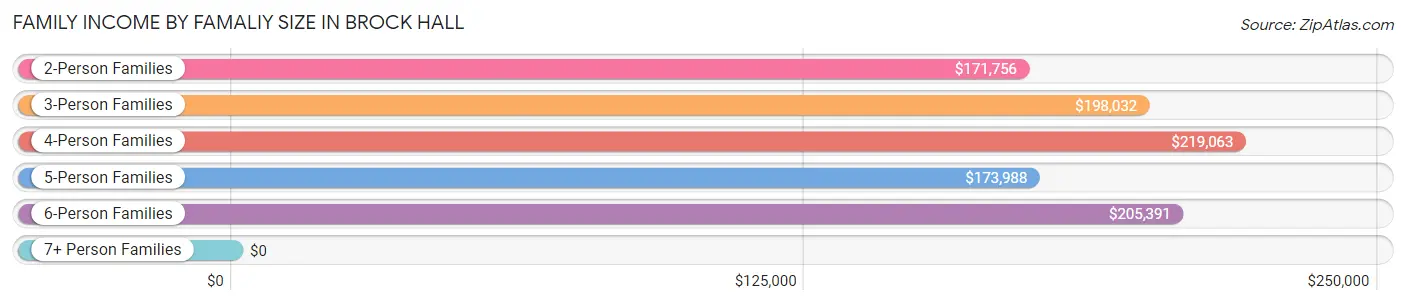
| Income Bracket | # Families | Median Income |
| 2-Person Families | 1,336 (39.4%) | $171,756 |
| 3-Person Families | 796 (23.5%) | $198,032 |
| 4-Person Families | 705 (20.8%) | $219,063 |
| 5-Person Families | 328 (9.7%) | $173,988 |
| 6-Person Families | 175 (5.2%) | $205,391 |
| 7+ Person Families | 48 (1.4%) | $0 |
| Total | 3,388 (100.0%) | $193,864 |
Family Income by Number of Earners in Brock Hall
The median family income in Brock Hall is $193,864, with families comprising 3+ earners (503) having the highest median family income of $250,001, while families with no earners (157) have the lowest median family income of $75,481, accounting for 14.8% and 4.6% of families, respectively.
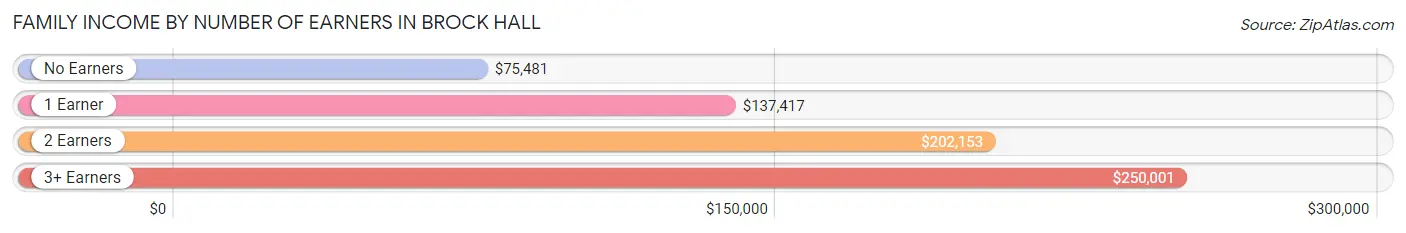
| Number of Earners | # Families | Median Income |
| No Earners | 157 (4.6%) | $75,481 |
| 1 Earner | 739 (21.8%) | $137,417 |
| 2 Earners | 1,989 (58.7%) | $202,153 |
| 3+ Earners | 503 (14.8%) | $250,001 |
| Total | 3,388 (100.0%) | $193,864 |
Household Income in Brock Hall
Household Income Brackets in Brock Hall
With 1,748 households falling in the category, the $200,000+ income range is the most frequent in Brock Hall, accounting for 41.6% of all households.
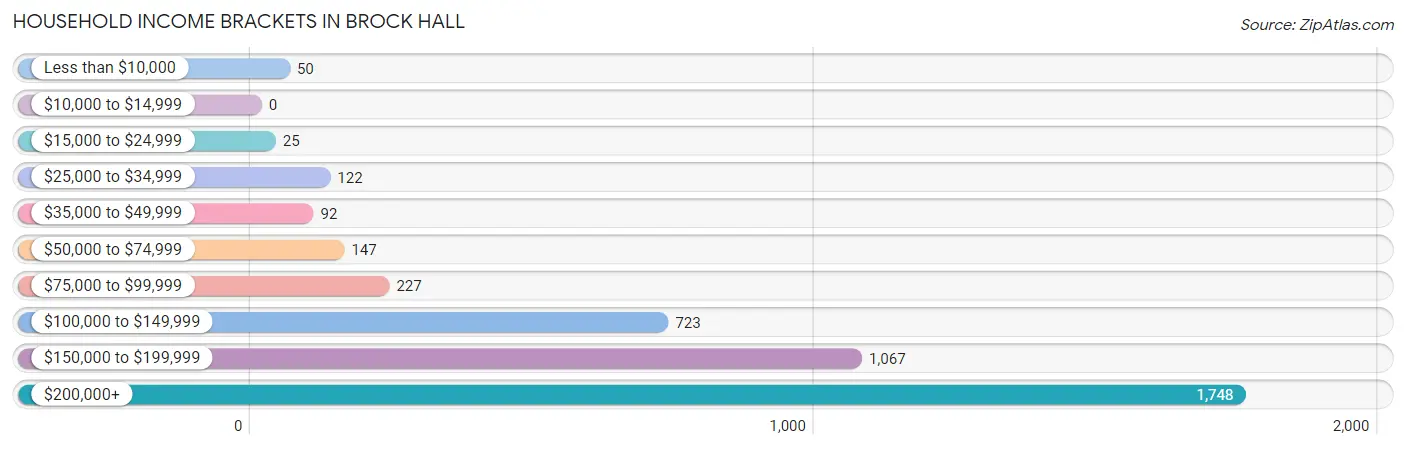
| Income Bracket | # Households | % Households |
| Less than $10,000 | 50 | 1.2% |
| $10,000 to $14,999 | 0 | 0.0% |
| $15,000 to $24,999 | 25 | 0.6% |
| $25,000 to $34,999 | 122 | 2.9% |
| $35,000 to $49,999 | 92 | 2.2% |
| $50,000 to $74,999 | 147 | 3.5% |
| $75,000 to $99,999 | 227 | 5.4% |
| $100,000 to $149,999 | 723 | 17.2% |
| $150,000 to $199,999 | 1,067 | 25.4% |
| $200,000+ | 1,748 | 41.6% |
Household Income by Householder Age in Brock Hall
The median household income in Brock Hall is $188,096, with the highest median household income of $190,885 found in the 25 to 44 years age bracket for the primary householder. A total of 1,168 households (27.8%) fall into this category. Meanwhile, the 15 to 24 years age bracket for the primary householder has the lowest median household income of $0, with 13 households (0.3%) in this group.
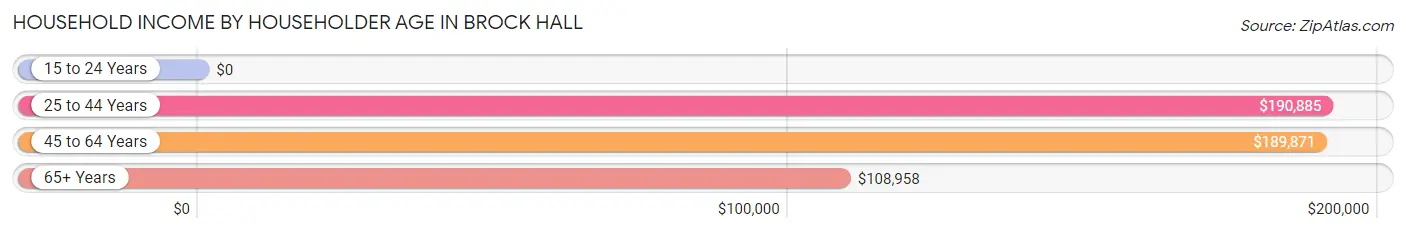
| Income Bracket | # Households | Median Income |
| 15 to 24 Years | 13 (0.3%) | $0 |
| 25 to 44 Years | 1,168 (27.8%) | $190,885 |
| 45 to 64 Years | 2,476 (58.9%) | $189,871 |
| 65+ Years | 544 (13.0%) | $108,958 |
| Total | 4,201 (100.0%) | $188,096 |
Poverty in Brock Hall
Income Below Poverty by Sex and Age in Brock Hall
With 3.9% poverty level for males and 3.0% for females among the residents of Brock Hall, 75 year old and over males and 15 year old females are the most vulnerable to poverty, with 36 males (17.6%) and 29 females (36.2%) in their respective age groups living below the poverty level.
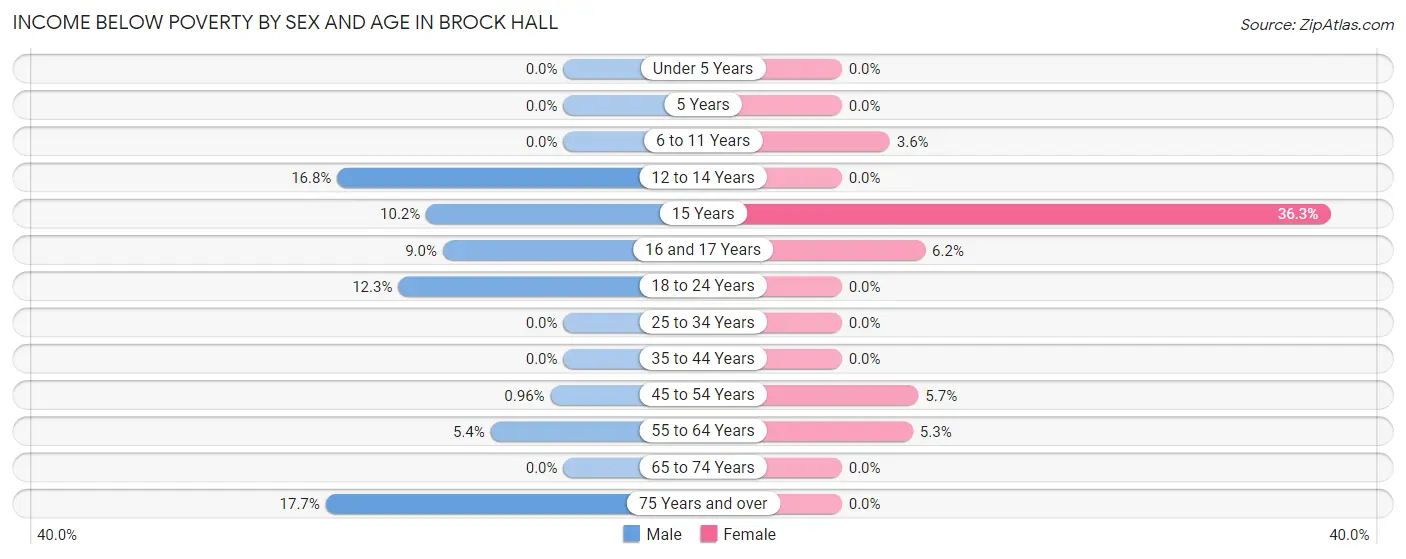
| Age Bracket | Male | Female |
| Under 5 Years | 0 (0.0%) | 0 (0.0%) |
| 5 Years | 0 (0.0%) | 0 (0.0%) |
| 6 to 11 Years | 0 (0.0%) | 27 (3.6%) |
| 12 to 14 Years | 45 (16.8%) | 0 (0.0%) |
| 15 Years | 16 (10.2%) | 29 (36.2%) |
| 16 and 17 Years | 17 (8.9%) | 13 (6.2%) |
| 18 to 24 Years | 65 (12.3%) | 0 (0.0%) |
| 25 to 34 Years | 0 (0.0%) | 0 (0.0%) |
| 35 to 44 Years | 0 (0.0%) | 0 (0.0%) |
| 45 to 54 Years | 9 (1.0%) | 86 (5.7%) |
| 55 to 64 Years | 49 (5.4%) | 39 (5.3%) |
| 65 to 74 Years | 0 (0.0%) | 0 (0.0%) |
| 75 Years and over | 36 (17.6%) | 0 (0.0%) |
| Total | 237 (3.9%) | 194 (3.0%) |
Income Above Poverty by Sex and Age in Brock Hall
According to the poverty statistics in Brock Hall, males aged under 5 years and females aged under 5 years are the age groups that are most secure financially, with 100.0% of males and 100.0% of females in these age groups living above the poverty line.
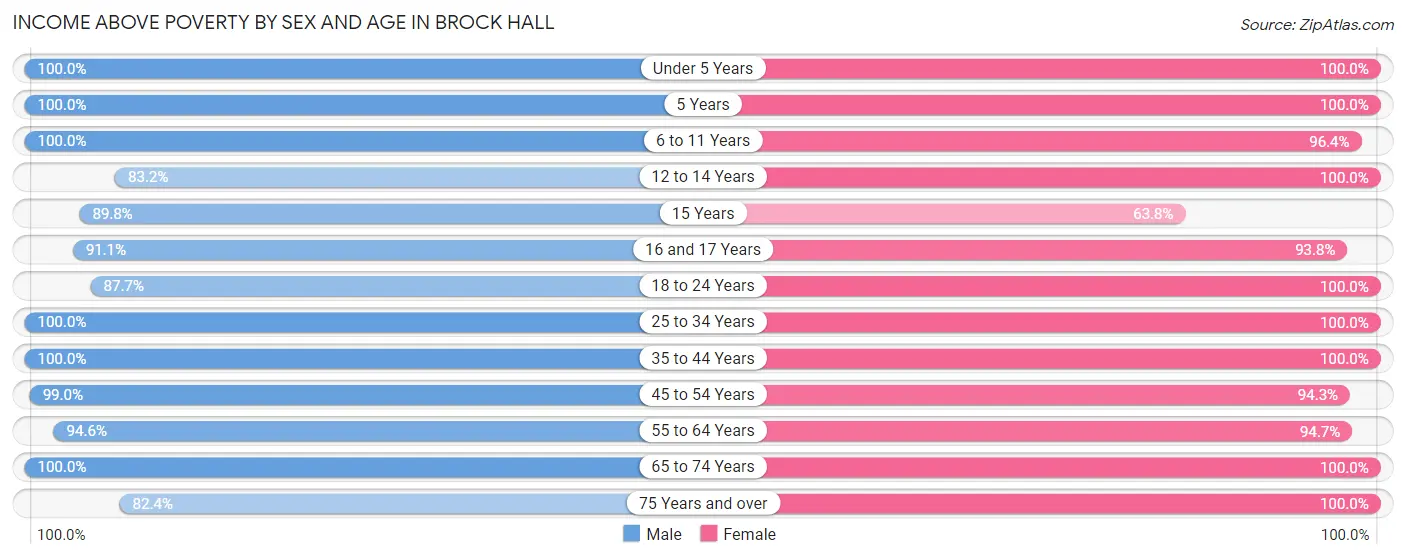
| Age Bracket | Male | Female |
| Under 5 Years | 672 (100.0%) | 199 (100.0%) |
| 5 Years | 42 (100.0%) | 53 (100.0%) |
| 6 to 11 Years | 492 (100.0%) | 729 (96.4%) |
| 12 to 14 Years | 223 (83.2%) | 288 (100.0%) |
| 15 Years | 141 (89.8%) | 51 (63.7%) |
| 16 and 17 Years | 173 (91.0%) | 197 (93.8%) |
| 18 to 24 Years | 465 (87.7%) | 343 (100.0%) |
| 25 to 34 Years | 319 (100.0%) | 401 (100.0%) |
| 35 to 44 Years | 971 (100.0%) | 1,194 (100.0%) |
| 45 to 54 Years | 931 (99.0%) | 1,425 (94.3%) |
| 55 to 64 Years | 858 (94.6%) | 699 (94.7%) |
| 65 to 74 Years | 441 (100.0%) | 434 (100.0%) |
| 75 Years and over | 168 (82.4%) | 189 (100.0%) |
| Total | 5,896 (96.1%) | 6,202 (97.0%) |
Income Below Poverty Among Married-Couple Families in Brock Hall
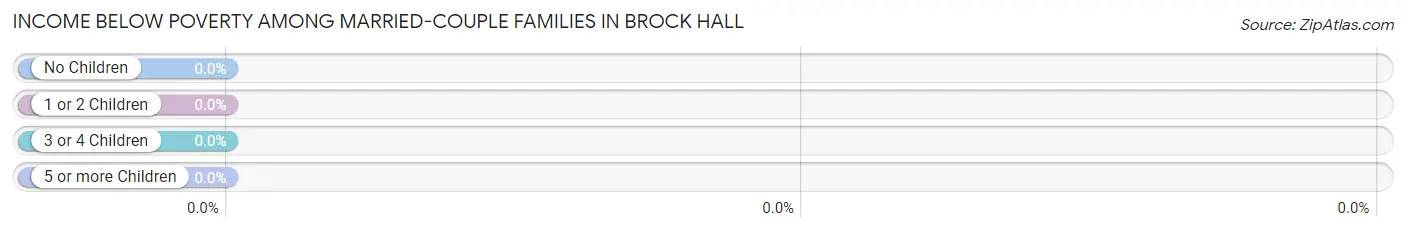
| Children | Above Poverty | Below Poverty |
| No Children | 1,081 (100.0%) | 0 (0.0%) |
| 1 or 2 Children | 1,039 (100.0%) | 0 (0.0%) |
| 3 or 4 Children | 278 (100.0%) | 0 (0.0%) |
| 5 or more Children | 25 (100.0%) | 0 (0.0%) |
| Total | 2,423 (100.0%) | 0 (0.0%) |
Income Below Poverty Among Single-Parent Households in Brock Hall
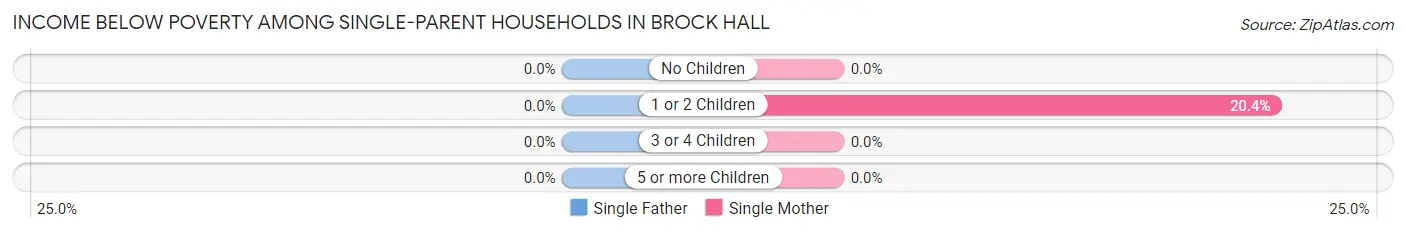
| Children | Single Father | Single Mother |
| No Children | 0 (0.0%) | 0 (0.0%) |
| 1 or 2 Children | 0 (0.0%) | 87 (20.4%) |
| 3 or 4 Children | 0 (0.0%) | 0 (0.0%) |
| 5 or more Children | 0 (0.0%) | 0 (0.0%) |
| Total | 0 (0.0%) | 87 (13.4%) |
Income Below Poverty Among Married-Couple vs Single-Parent Households in Brock Hall
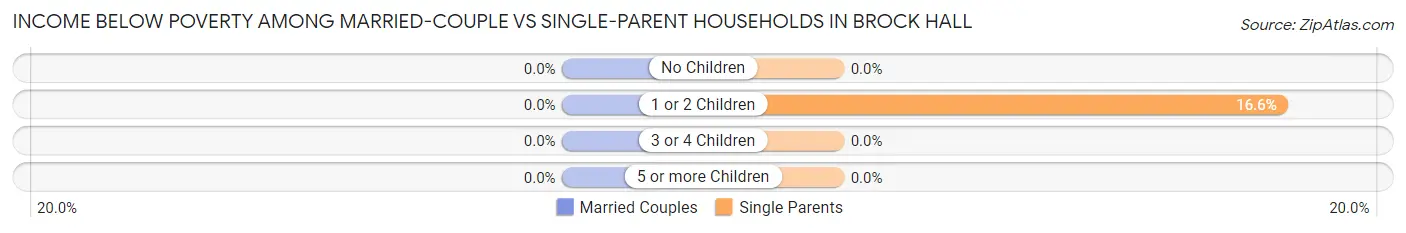
| Children | Married-Couple Families | Single-Parent Households |
| No Children | 0 (0.0%) | 0 (0.0%) |
| 1 or 2 Children | 0 (0.0%) | 87 (16.6%) |
| 3 or 4 Children | 0 (0.0%) | 0 (0.0%) |
| 5 or more Children | 0 (0.0%) | 0 (0.0%) |
| Total | 0 (0.0%) | 87 (9.0%) |
Race in Brock Hall
The most populous races in Brock Hall are Black / African American (11,046 | 88.2%), White / Caucasian (663 | 5.3%), and Two or more Races (521 | 4.2%).
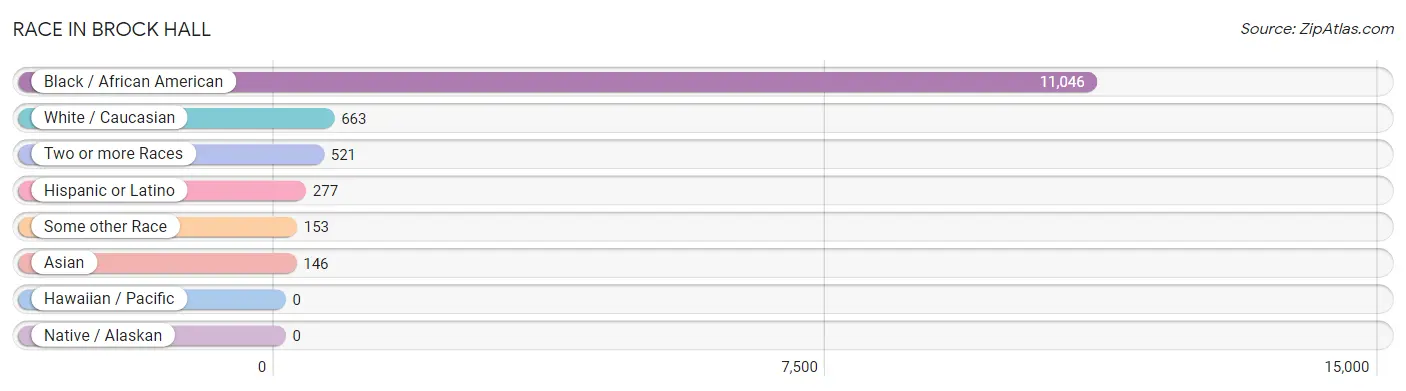
| Race | # Population | % Population |
| Asian | 146 | 1.2% |
| Black / African American | 11,046 | 88.2% |
| Hawaiian / Pacific | 0 | 0.0% |
| Hispanic or Latino | 277 | 2.2% |
| Native / Alaskan | 0 | 0.0% |
| White / Caucasian | 663 | 5.3% |
| Two or more Races | 521 | 4.2% |
| Some other Race | 153 | 1.2% |
| Total | 12,529 | 100.0% |
Ancestry in Brock Hall
The most populous ancestries reported in Brock Hall are Subsaharan African (1,494 | 11.9%), African (744 | 5.9%), American (232 | 1.8%), Jamaican (224 | 1.8%), and Nigerian (175 | 1.4%), together accounting for 22.9% of all Brock Hall residents.
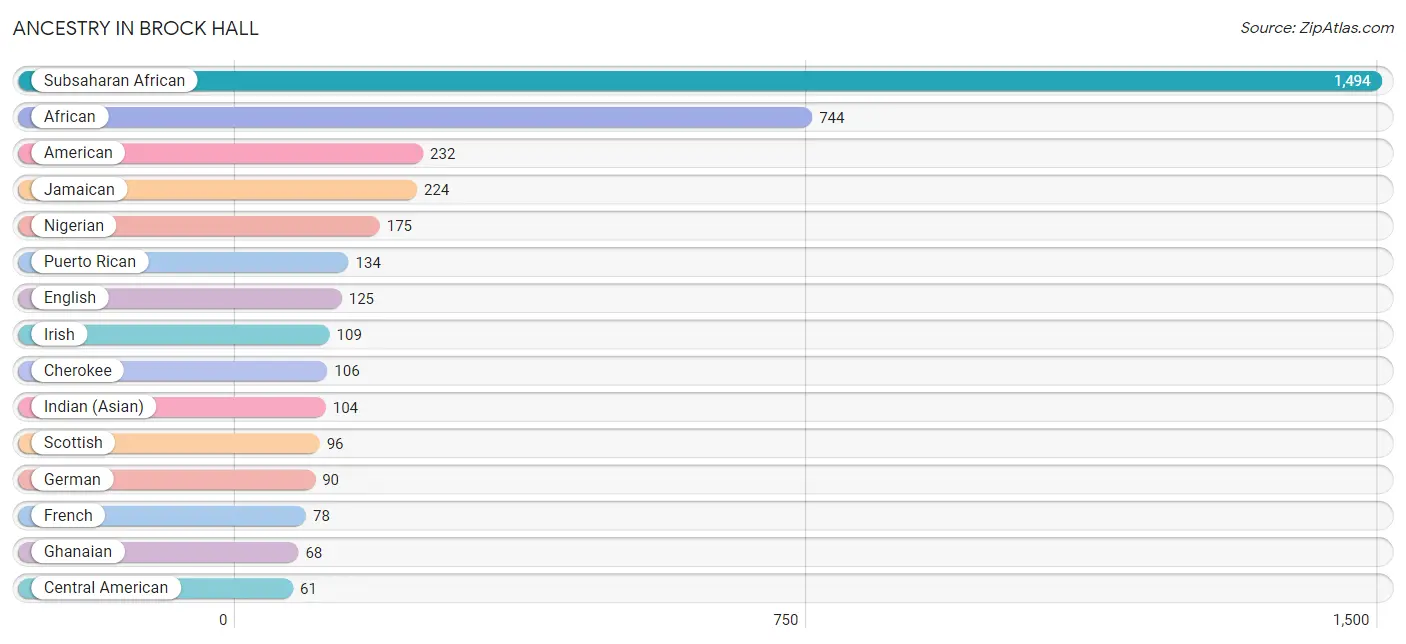
| Ancestry | # Population | % Population |
| African | 744 | 5.9% |
| American | 232 | 1.8% |
| Bermudan | 26 | 0.2% |
| Blackfeet | 32 | 0.3% |
| British | 11 | 0.1% |
| Cape Verdean | 20 | 0.2% |
| Central American | 61 | 0.5% |
| Cherokee | 106 | 0.9% |
| Chilean | 39 | 0.3% |
| Czech | 15 | 0.1% |
| Delaware | 43 | 0.3% |
| Eastern European | 12 | 0.1% |
| English | 125 | 1.0% |
| European | 44 | 0.4% |
| French | 78 | 0.6% |
| German | 90 | 0.7% |
| Ghanaian | 68 | 0.5% |
| Haitian | 45 | 0.4% |
| Indian (Asian) | 104 | 0.8% |
| Irish | 109 | 0.9% |
| Italian | 23 | 0.2% |
| Jamaican | 224 | 1.8% |
| Korean | 16 | 0.1% |
| Liberian | 18 | 0.1% |
| Mexican | 21 | 0.2% |
| Nigerian | 175 | 1.4% |
| Panamanian | 61 | 0.5% |
| Polish | 13 | 0.1% |
| Puerto Rican | 134 | 1.1% |
| Romanian | 15 | 0.1% |
| Scottish | 96 | 0.8% |
| South American | 39 | 0.3% |
| Subsaharan African | 1,494 | 11.9% |
| Swedish | 30 | 0.2% |
| Thai | 26 | 0.2% |
| Trinidadian and Tobagonian | 28 | 0.2% |
| Ukrainian | 21 | 0.2% |
| Welsh | 21 | 0.2% |
| West Indian | 55 | 0.4% | View All 39 Rows |
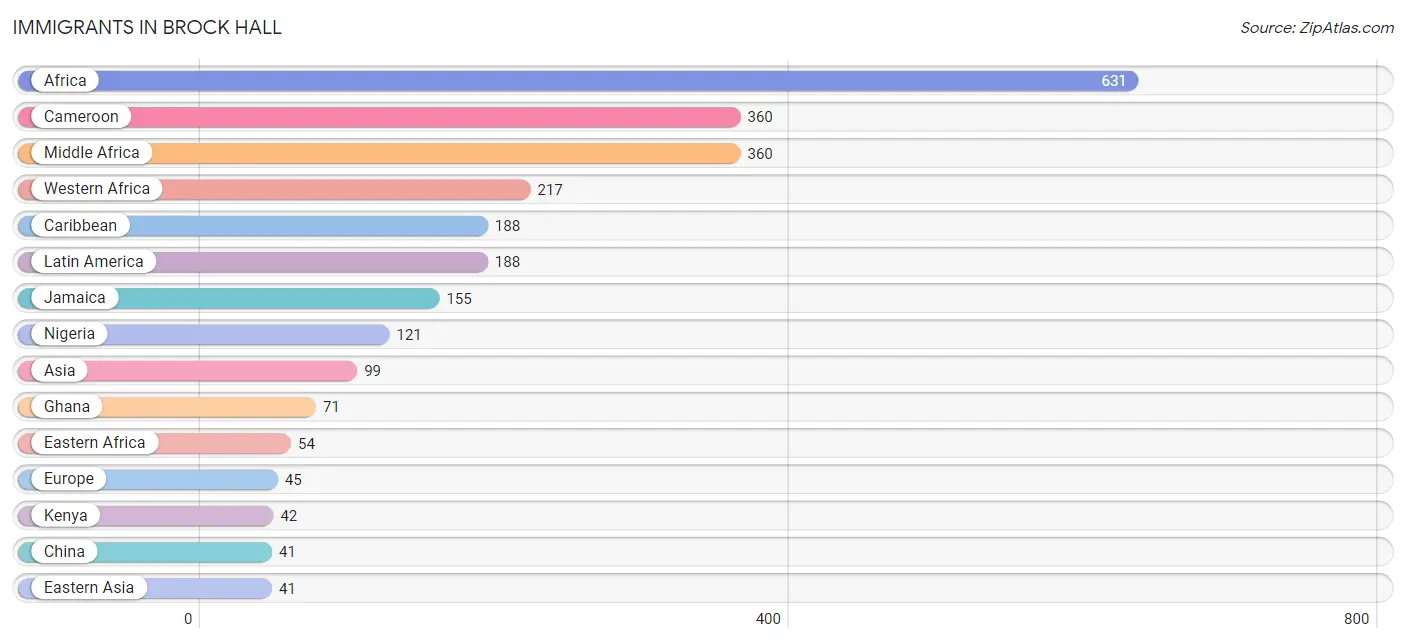
Immigrants in Brock Hall
The most numerous immigrant groups reported in Brock Hall came from Africa (631 | 5.0%), Cameroon (360 | 2.9%), Middle Africa (360 | 2.9%), Western Africa (217 | 1.7%), and Caribbean (188 | 1.5%), together accounting for 14.0% of all Brock Hall residents.
| Immigration Origin | # Population | % Population |
| Africa | 631 | 5.0% |
| Asia | 99 | 0.8% |
| Barbados | 5 | 0.0% |
| Cameroon | 360 | 2.9% |
| Caribbean | 188 | 1.5% |
| China | 41 | 0.3% |
| Eastern Africa | 54 | 0.4% |
| Eastern Asia | 41 | 0.3% |
| Eastern Europe | 21 | 0.2% |
| Europe | 45 | 0.4% |
| Germany | 13 | 0.1% |
| Ghana | 71 | 0.6% |
| India | 26 | 0.2% |
| Jamaica | 155 | 1.2% |
| Kenya | 42 | 0.3% |
| Latin America | 188 | 1.5% |
| Liberia | 25 | 0.2% |
| Middle Africa | 360 | 2.9% |
| Nigeria | 121 | 1.0% |
| Northern Europe | 11 | 0.1% |
| Philippines | 32 | 0.3% |
| Somalia | 12 | 0.1% |
| South Central Asia | 26 | 0.2% |
| South Eastern Asia | 32 | 0.3% |
| Trinidad and Tobago | 28 | 0.2% |
| Ukraine | 21 | 0.2% |
| Western Africa | 217 | 1.7% |
| Western Europe | 13 | 0.1% | View All 28 Rows |
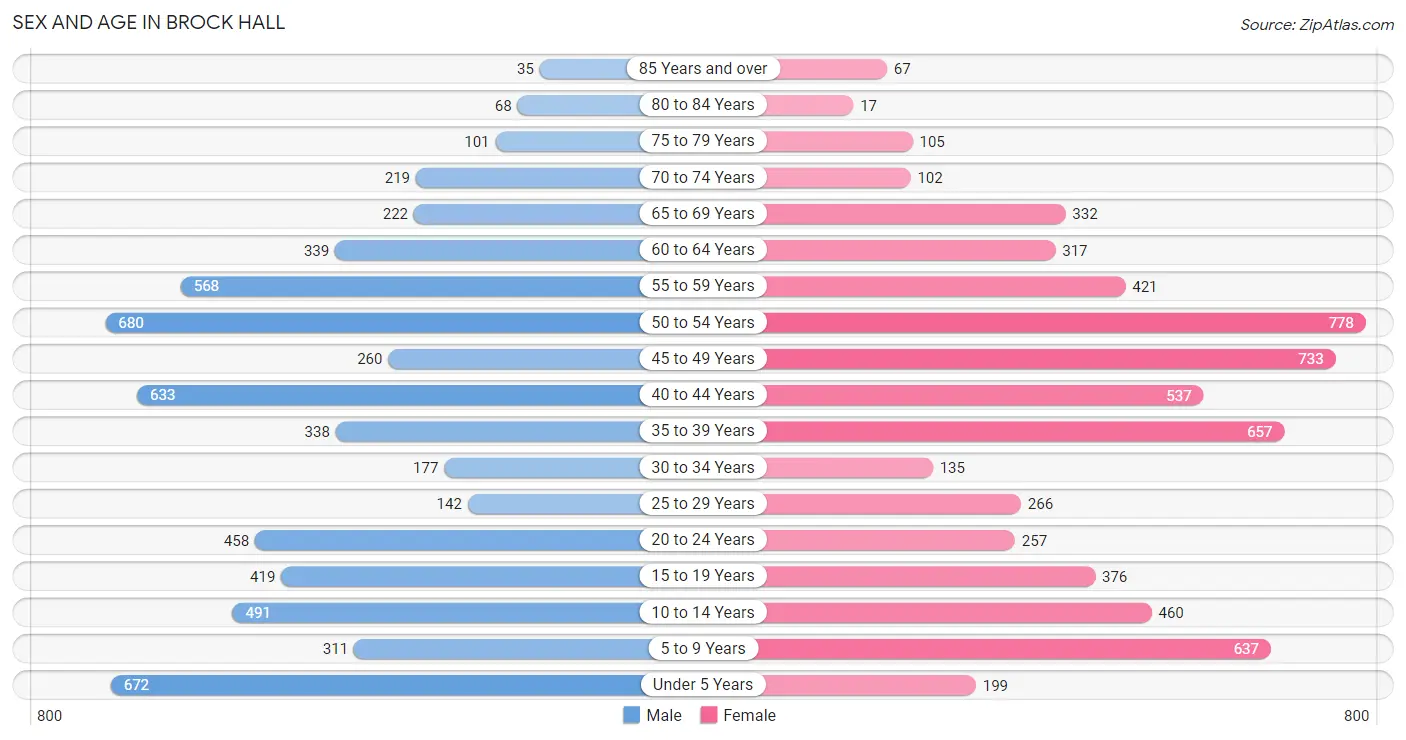
Sex and Age in Brock Hall
Sex and Age in Brock Hall
The most populous age groups in Brock Hall are 50 to 54 Years (680 | 11.1%) for men and 50 to 54 Years (778 | 12.2%) for women.
| Age Bracket | Male | Female |
| Under 5 Years | 672 (11.0%) | 199 (3.1%) |
| 5 to 9 Years | 311 (5.1%) | 637 (10.0%) |
| 10 to 14 Years | 491 (8.0%) | 460 (7.2%) |
| 15 to 19 Years | 419 (6.8%) | 376 (5.9%) |
| 20 to 24 Years | 458 (7.5%) | 257 (4.0%) |
| 25 to 29 Years | 142 (2.3%) | 266 (4.2%) |
| 30 to 34 Years | 177 (2.9%) | 135 (2.1%) |
| 35 to 39 Years | 338 (5.5%) | 657 (10.3%) |
| 40 to 44 Years | 633 (10.3%) | 537 (8.4%) |
| 45 to 49 Years | 260 (4.2%) | 733 (11.5%) |
| 50 to 54 Years | 680 (11.1%) | 778 (12.2%) |
| 55 to 59 Years | 568 (9.3%) | 421 (6.6%) |
| 60 to 64 Years | 339 (5.5%) | 317 (5.0%) |
| 65 to 69 Years | 222 (3.6%) | 332 (5.2%) |
| 70 to 74 Years | 219 (3.6%) | 102 (1.6%) |
| 75 to 79 Years | 101 (1.7%) | 105 (1.6%) |
| 80 to 84 Years | 68 (1.1%) | 17 (0.3%) |
| 85 Years and over | 35 (0.6%) | 67 (1.1%) |
| Total | 6,133 (100.0%) | 6,396 (100.0%) |
Families and Households in Brock Hall
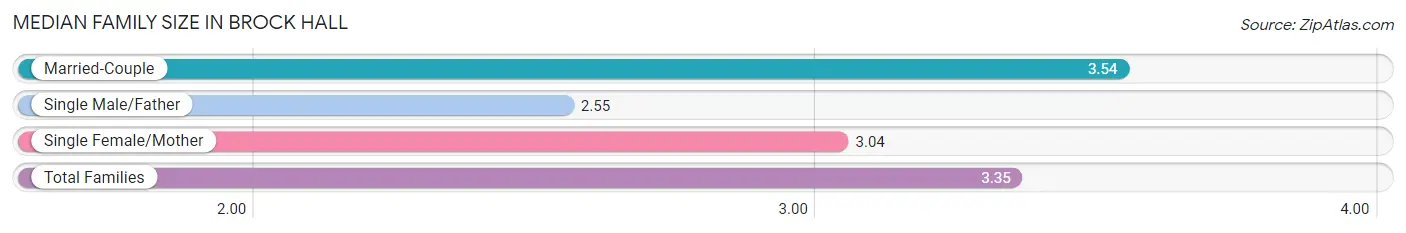
Median Family Size in Brock Hall
The median family size in Brock Hall is 3.35 persons per family, with married-couple families (2,423 | 71.5%) accounting for the largest median family size of 3.54 persons per family. On the other hand, single male/father families (317 | 9.4%) represent the smallest median family size with 2.55 persons per family.
| Family Type | # Families | Family Size |
| Married-Couple | 2,423 (71.5%) | 3.54 |
| Single Male/Father | 317 (9.4%) | 2.55 |
| Single Female/Mother | 648 (19.1%) | 3.04 |
| Total Families | 3,388 (100.0%) | 3.35 |
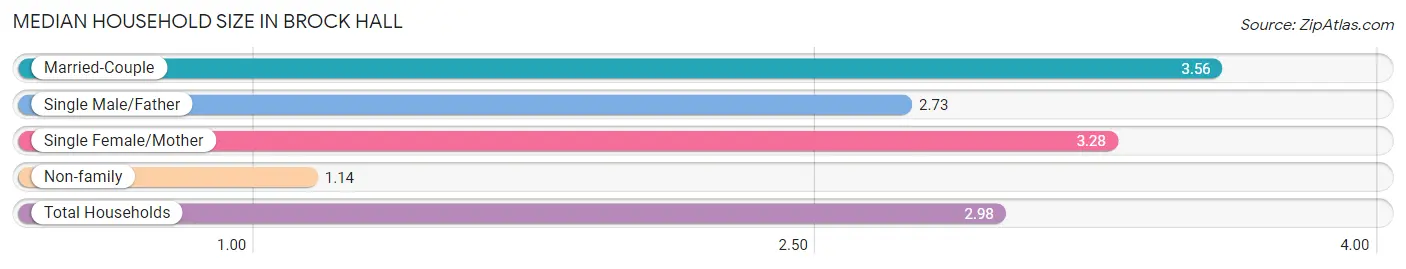
Median Household Size in Brock Hall
The median household size in Brock Hall is 2.98 persons per household, with married-couple households (2,423 | 57.7%) accounting for the largest median household size of 3.56 persons per household. non-family households (813 | 19.4%) represent the smallest median household size with 1.14 persons per household.
| Household Type | # Households | Household Size |
| Married-Couple | 2,423 (57.7%) | 3.56 |
| Single Male/Father | 317 (7.5%) | 2.73 |
| Single Female/Mother | 648 (15.4%) | 3.28 |
| Non-family | 813 (19.4%) | 1.14 |
| Total Households | 4,201 (100.0%) | 2.98 |
Household Size by Marriage Status in Brock Hall
Out of a total of 4,201 households in Brock Hall, 3,388 (80.6%) are family households, while 813 (19.4%) are nonfamily households. The most numerous type of family households are 2-person households, comprising 1,260, and the most common type of nonfamily households are 1-person households, comprising 719.
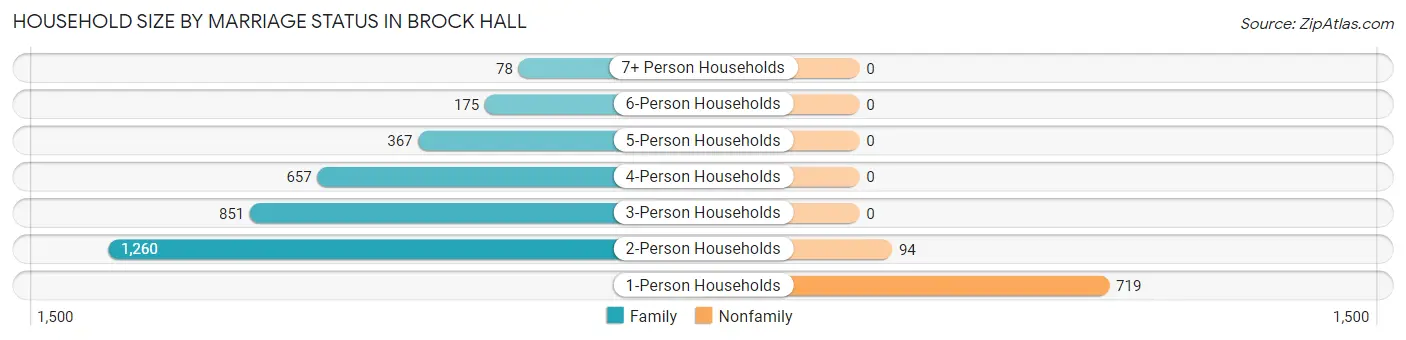
| Household Size | Family Households | Nonfamily Households |
| 1-Person Households | - | 719 (17.1%) |
| 2-Person Households | 1,260 (30.0%) | 94 (2.2%) |
| 3-Person Households | 851 (20.3%) | 0 (0.0%) |
| 4-Person Households | 657 (15.6%) | 0 (0.0%) |
| 5-Person Households | 367 (8.7%) | 0 (0.0%) |
| 6-Person Households | 175 (4.2%) | 0 (0.0%) |
| 7+ Person Households | 78 (1.9%) | 0 (0.0%) |
| Total | 3,388 (80.6%) | 813 (19.4%) |
Female Fertility in Brock Hall
Fertility by Age in Brock Hall
Average fertility rate in Brock Hall is 51.0 births per 1,000 women. Women in the age bracket of 20 to 34 years have the highest fertility rate with 88.0 births per 1,000 women. Women in the age bracket of 35 to 50 years acount for 64.0% of all women with births.
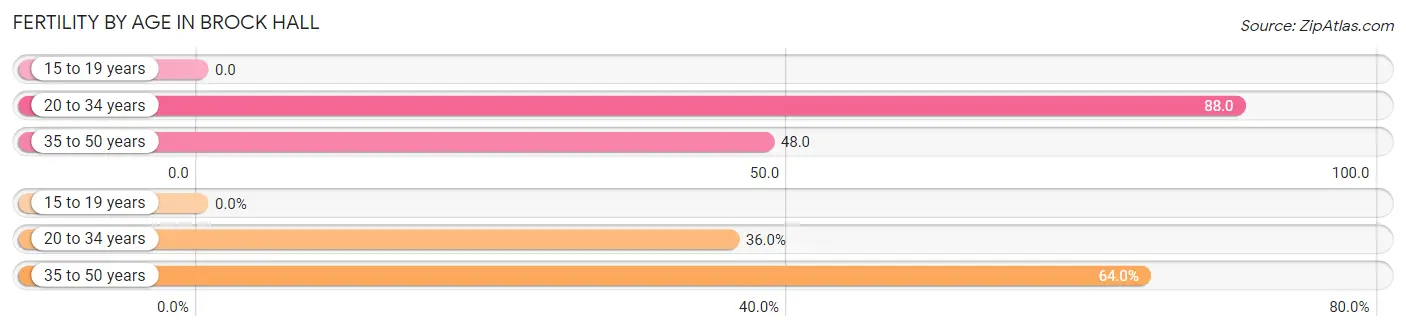
| Age Bracket | Women with Births | Births / 1,000 Women |
| 15 to 19 years | 0 (0.0%) | 0.0 |
| 20 to 34 years | 58 (36.0%) | 88.0 |
| 35 to 50 years | 103 (64.0%) | 48.0 |
| Total | 161 (100.0%) | 51.0 |
Fertility by Age by Marriage Status in Brock Hall
68.3% of women with births (161) in Brock Hall are married. The highest percentage of unmarried women with births falls into 20 to 34 years age bracket with 87.9% of them unmarried at the time of birth, while the lowest percentage of unmarried women with births belong to 35 to 50 years age bracket with 0.0% of them unmarried.
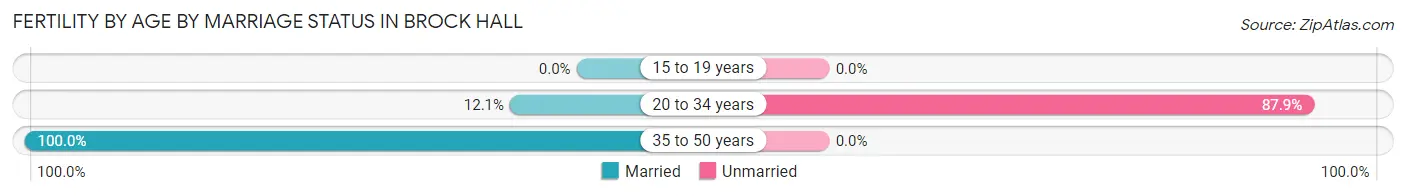
| Age Bracket | Married | Unmarried |
| 15 to 19 years | 0 (0.0%) | 0 (0.0%) |
| 20 to 34 years | 7 (12.1%) | 51 (87.9%) |
| 35 to 50 years | 103 (100.0%) | 0 (0.0%) |
| Total | 110 (68.3%) | 51 (31.7%) |
Fertility by Education in Brock Hall
Average fertility rate in Brock Hall is 51.0 births per 1,000 women. Women with the education attainment of college or associate's degree have the highest fertility rate of 115.0 births per 1,000 women, while women with the education attainment of bachelor's degree have the lowest fertility at 16.0 births per 1,000 women. Women with the education attainment of college or associate's degree represent 39.1% of all women with births.
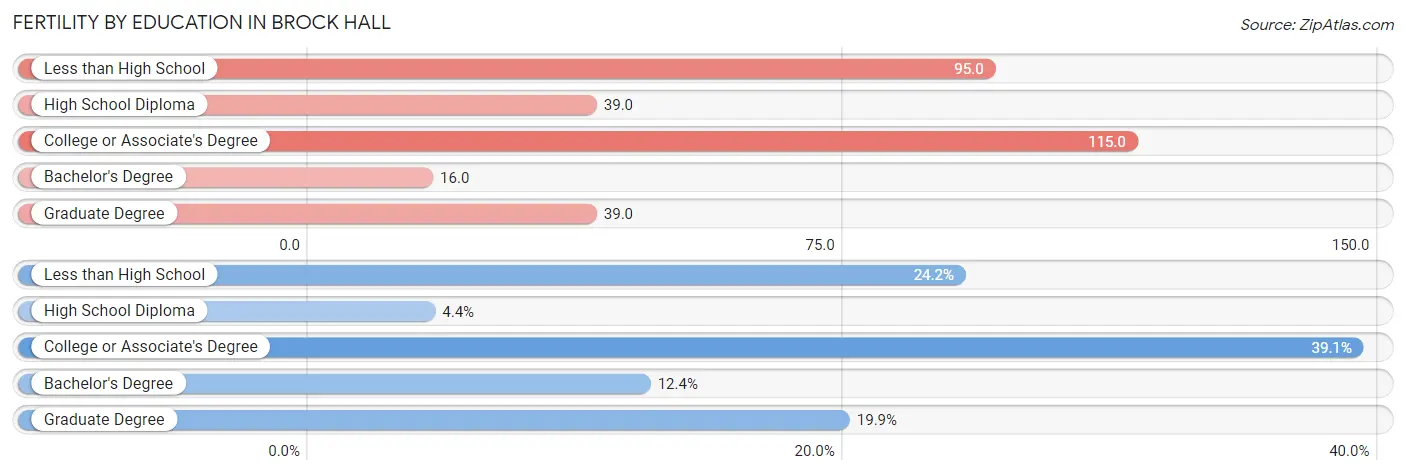
| Educational Attainment | Women with Births | Births / 1,000 Women |
| Less than High School | 39 (24.2%) | 95.0 |
| High School Diploma | 7 (4.3%) | 39.0 |
| College or Associate's Degree | 63 (39.1%) | 115.0 |
| Bachelor's Degree | 20 (12.4%) | 16.0 |
| Graduate Degree | 32 (19.9%) | 39.0 |
| Total | 161 (100.0%) | 51.0 |
Fertility by Education by Marriage Status in Brock Hall
31.7% of women with births in Brock Hall are unmarried. Women with the educational attainment of less than high school are most likely to be married with 100.0% of them married at childbirth, while women with the educational attainment of college or associate's degree are least likely to be married with 80.9% of them unmarried at childbirth.
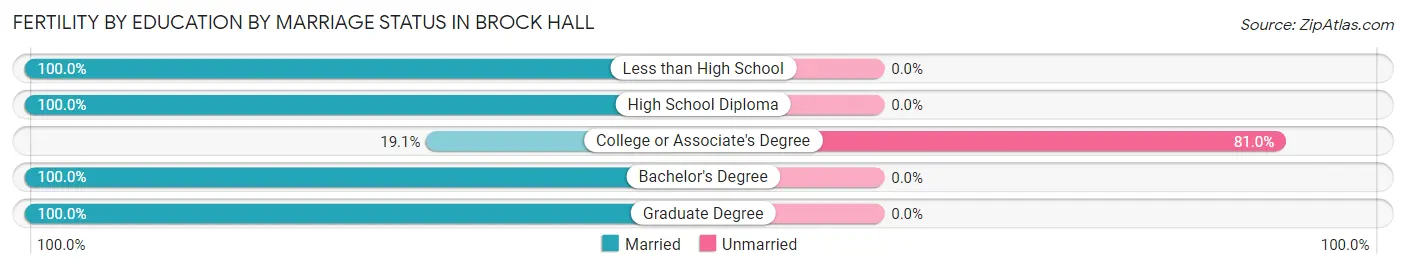
| Educational Attainment | Married | Unmarried |
| Less than High School | 39 (100.0%) | 0 (0.0%) |
| High School Diploma | 7 (100.0%) | 0 (0.0%) |
| College or Associate's Degree | 12 (19.1%) | 51 (80.9%) |
| Bachelor's Degree | 20 (100.0%) | 0 (0.0%) |
| Graduate Degree | 32 (100.0%) | 0 (0.0%) |
| Total | 110 (68.3%) | 51 (31.7%) |
Employment Characteristics in Brock Hall
Employment by Class of Employer in Brock Hall
Among the 6,742 employed individuals in Brock Hall, private company employees (2,797 | 41.5%), federal government employees (1,886 | 28.0%), and not-for-profit organizations (583 | 8.6%) make up the most common classes of employment.
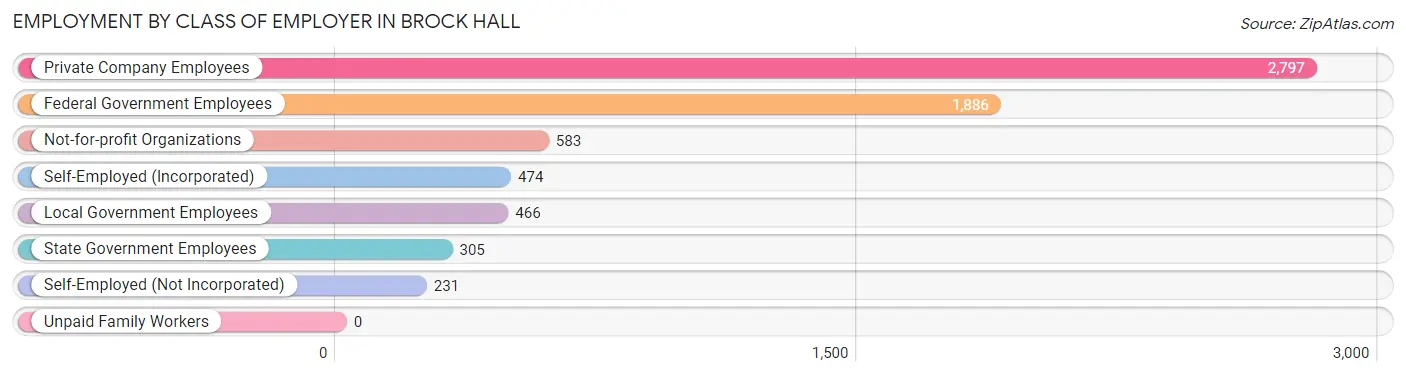
| Employer Class | # Employees | % Employees |
| Private Company Employees | 2,797 | 41.5% |
| Self-Employed (Incorporated) | 474 | 7.0% |
| Self-Employed (Not Incorporated) | 231 | 3.4% |
| Not-for-profit Organizations | 583 | 8.6% |
| Local Government Employees | 466 | 6.9% |
| State Government Employees | 305 | 4.5% |
| Federal Government Employees | 1,886 | 28.0% |
| Unpaid Family Workers | 0 | 0.0% |
| Total | 6,742 | 100.0% |
Employment Status by Age in Brock Hall
According to the labor force statistics for Brock Hall, out of the total population over 16 years of age (9,522), 76.9% or 7,322 individuals are in the labor force, with 7.7% or 564 of them unemployed. The age group with the highest labor force participation rate is 25 to 29 years, with 100.0% or 408 individuals in the labor force. Within the labor force, the 20 to 24 years age range has the highest percentage of unemployed individuals, with 55.4% or 285 of them being unemployed.
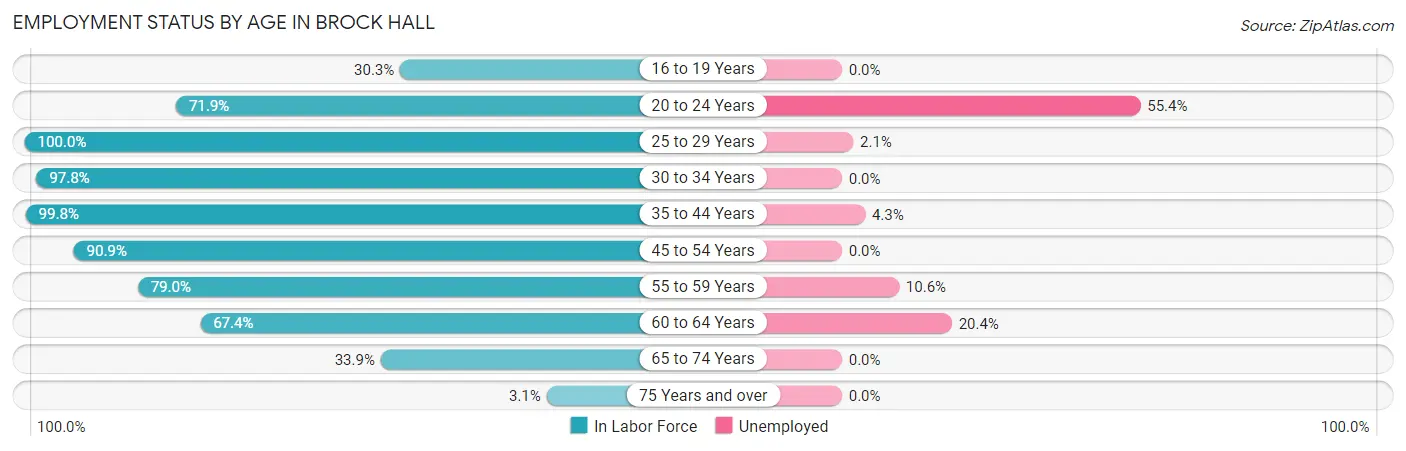
| Age Bracket | In Labor Force | Unemployed |
| 16 to 19 Years | 169 (30.3%) | 0 (0.0%) |
| 20 to 24 Years | 514 (71.9%) | 285 (55.4%) |
| 25 to 29 Years | 408 (100.0%) | 9 (2.1%) |
| 30 to 34 Years | 305 (97.8%) | 0 (0.0%) |
| 35 to 44 Years | 2,161 (99.8%) | 93 (4.3%) |
| 45 to 54 Years | 2,228 (90.9%) | 0 (0.0%) |
| 55 to 59 Years | 781 (79.0%) | 83 (10.6%) |
| 60 to 64 Years | 442 (67.4%) | 90 (20.4%) |
| 65 to 74 Years | 297 (33.9%) | 0 (0.0%) |
| 75 Years and over | 12 (3.1%) | 0 (0.0%) |
| Total | 7,322 (76.9%) | 564 (7.7%) |
Employment Status by Educational Attainment in Brock Hall
According to labor force statistics for Brock Hall, 90.6% of individuals (6,325) out of the total population between 25 and 64 years of age (6,981) are in the labor force, with 4.4% or 278 of them being unemployed. The group with the highest labor force participation rate are those with the educational attainment of bachelor's degree or higher, with 95.7% or 4,344 individuals in the labor force. Within the labor force, individuals with less than high school education have the highest percentage of unemployment, with 43.3% or 88 of them being unemployed.
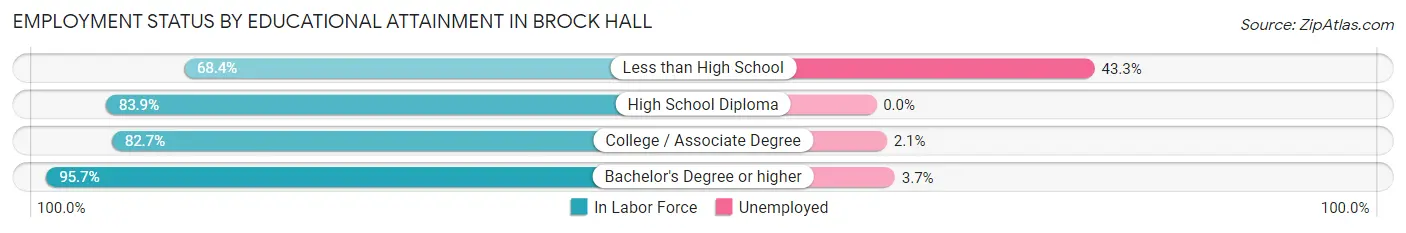
| Educational Attainment | In Labor Force | Unemployed |
| Less than High School | 203 (68.4%) | 129 (43.3%) |
| High School Diploma | 478 (83.9%) | 0 (0.0%) |
| College / Associate Degree | 1,303 (82.7%) | 33 (2.1%) |
| Bachelor's Degree or higher | 4,344 (95.7%) | 168 (3.7%) |
| Total | 6,325 (90.6%) | 307 (4.4%) |
Employment Occupations by Sex in Brock Hall
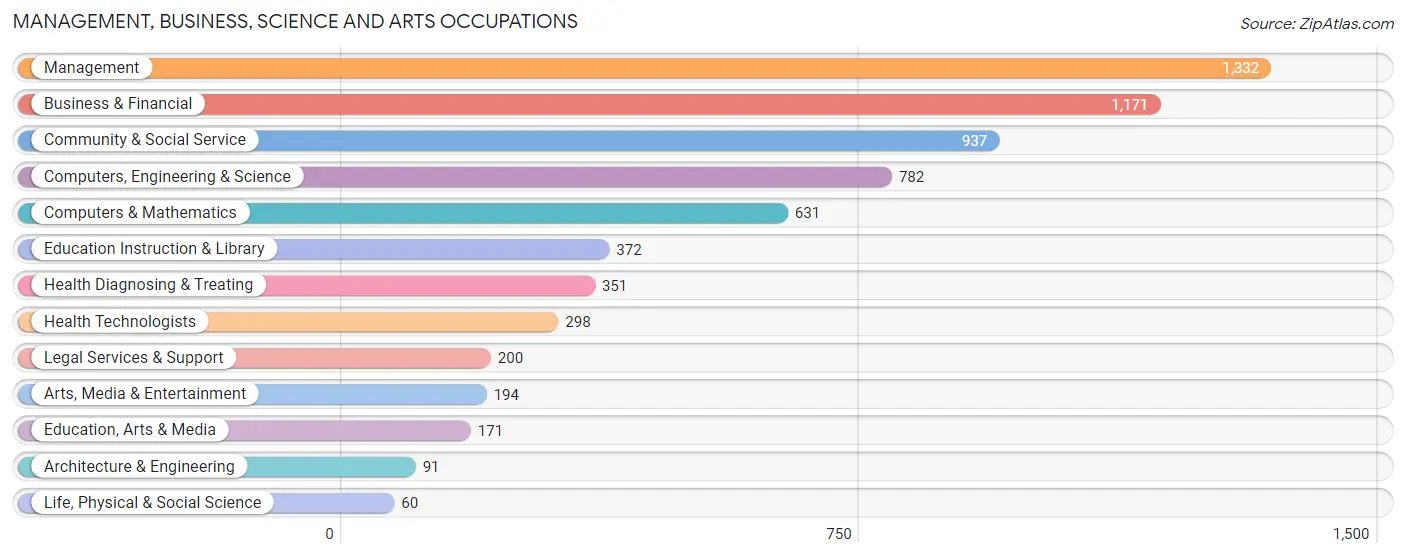
Management, Business, Science and Arts Occupations
The most common Management, Business, Science and Arts occupations in Brock Hall are Management (1,332 | 20.1%), Business & Financial (1,171 | 17.7%), Community & Social Service (937 | 14.2%), Computers, Engineering & Science (782 | 11.8%), and Computers & Mathematics (631 | 9.5%).
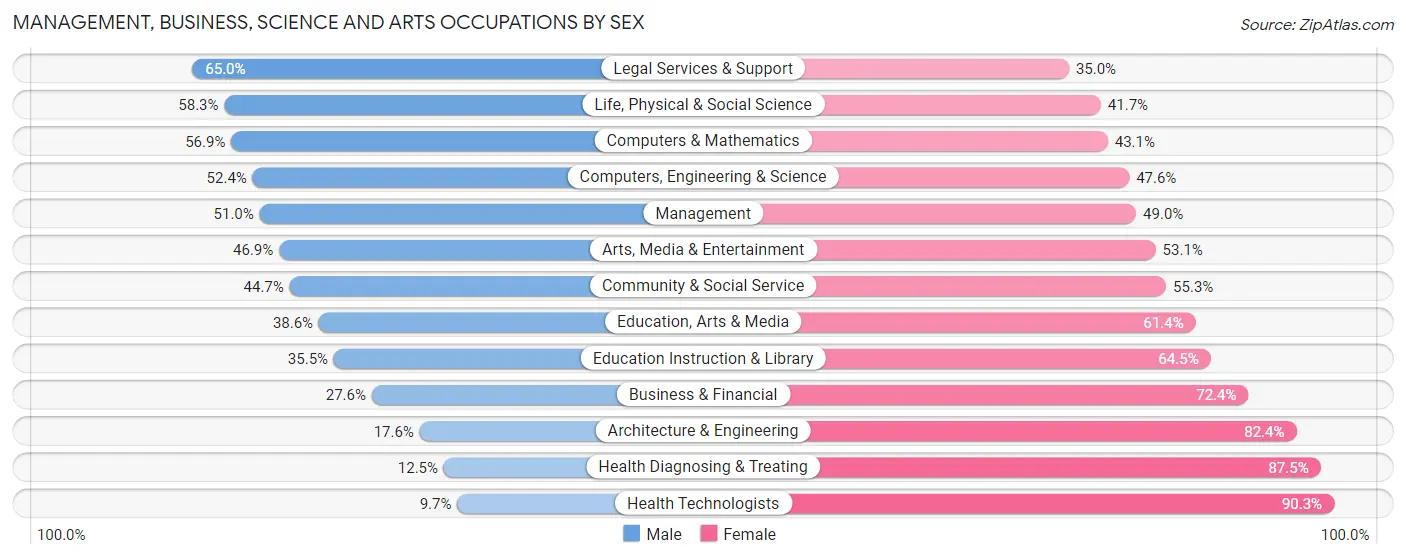
Management, Business, Science and Arts Occupations by Sex
Within the Management, Business, Science and Arts occupations in Brock Hall, the most male-oriented occupations are Legal Services & Support (65.0%), Life, Physical & Social Science (58.3%), and Computers & Mathematics (56.9%), while the most female-oriented occupations are Health Technologists (90.3%), Health Diagnosing & Treating (87.5%), and Architecture & Engineering (82.4%).
| Occupation | Male | Female |
| Management | 679 (51.0%) | 653 (49.0%) |
| Business & Financial | 323 (27.6%) | 848 (72.4%) |
| Computers, Engineering & Science | 410 (52.4%) | 372 (47.6%) |
| Computers & Mathematics | 359 (56.9%) | 272 (43.1%) |
| Architecture & Engineering | 16 (17.6%) | 75 (82.4%) |
| Life, Physical & Social Science | 35 (58.3%) | 25 (41.7%) |
| Community & Social Service | 419 (44.7%) | 518 (55.3%) |
| Education, Arts & Media | 66 (38.6%) | 105 (61.4%) |
| Legal Services & Support | 130 (65.0%) | 70 (35.0%) |
| Education Instruction & Library | 132 (35.5%) | 240 (64.5%) |
| Arts, Media & Entertainment | 91 (46.9%) | 103 (53.1%) |
| Health Diagnosing & Treating | 44 (12.5%) | 307 (87.5%) |
| Health Technologists | 29 (9.7%) | 269 (90.3%) |
| Total (Category) | 1,875 (41.0%) | 2,698 (59.0%) |
| Total (Overall) | 3,072 (46.4%) | 3,546 (53.6%) |
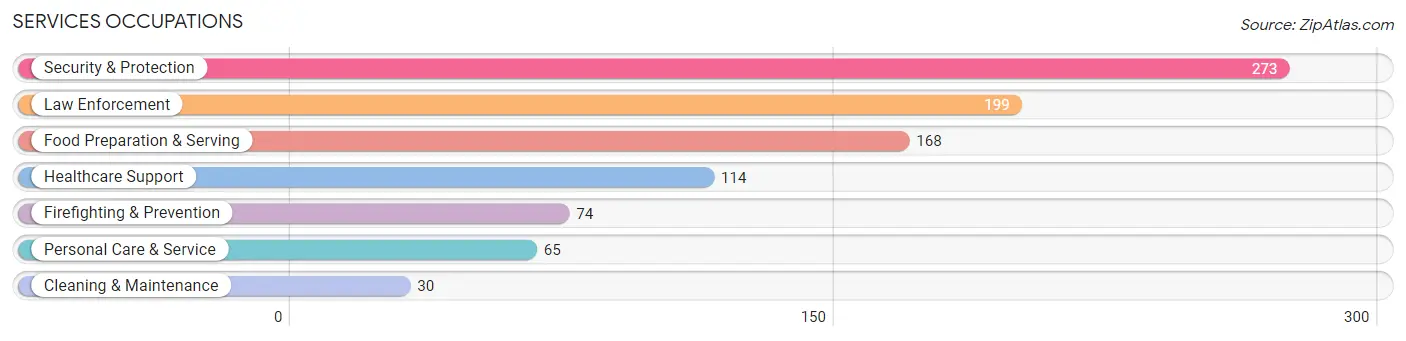
Services Occupations
The most common Services occupations in Brock Hall are Security & Protection (273 | 4.1%), Law Enforcement (199 | 3.0%), Food Preparation & Serving (168 | 2.5%), Healthcare Support (114 | 1.7%), and Firefighting & Prevention (74 | 1.1%).
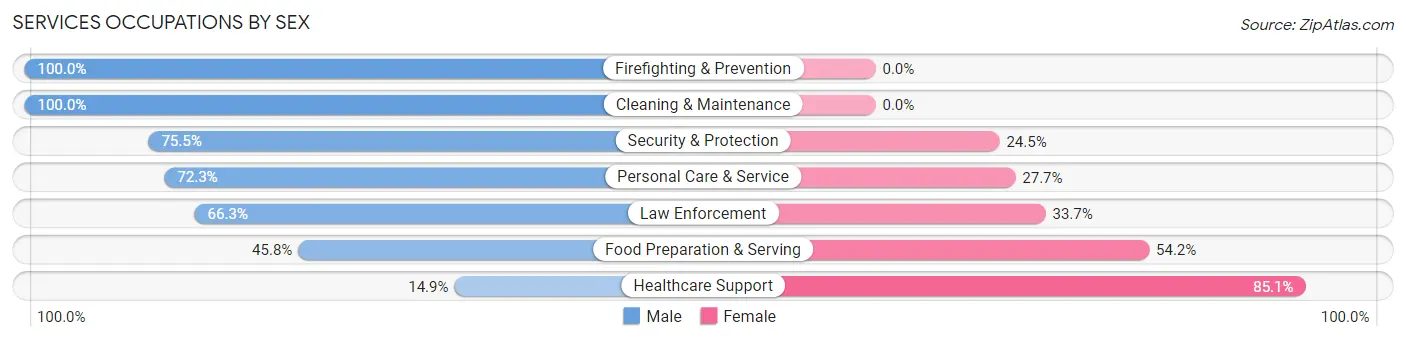
Services Occupations by Sex
Within the Services occupations in Brock Hall, the most male-oriented occupations are Firefighting & Prevention (100.0%), Cleaning & Maintenance (100.0%), and Security & Protection (75.5%), while the most female-oriented occupations are Healthcare Support (85.1%), Food Preparation & Serving (54.2%), and Law Enforcement (33.7%).
| Occupation | Male | Female |
| Healthcare Support | 17 (14.9%) | 97 (85.1%) |
| Security & Protection | 206 (75.5%) | 67 (24.5%) |
| Firefighting & Prevention | 74 (100.0%) | 0 (0.0%) |
| Law Enforcement | 132 (66.3%) | 67 (33.7%) |
| Food Preparation & Serving | 77 (45.8%) | 91 (54.2%) |
| Cleaning & Maintenance | 30 (100.0%) | 0 (0.0%) |
| Personal Care & Service | 47 (72.3%) | 18 (27.7%) |
| Total (Category) | 377 (58.0%) | 273 (42.0%) |
| Total (Overall) | 3,072 (46.4%) | 3,546 (53.6%) |
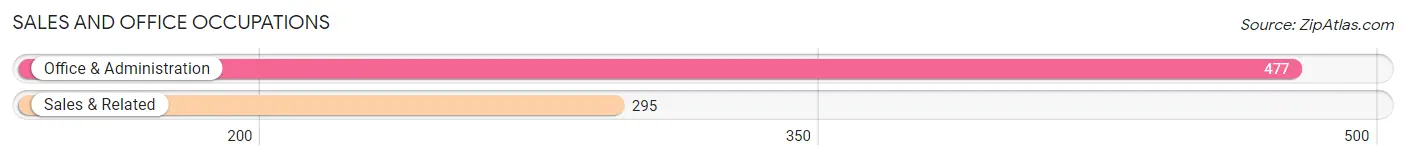
Sales and Office Occupations
The most common Sales and Office occupations in Brock Hall are Office & Administration (477 | 7.2%), and Sales & Related (295 | 4.5%).
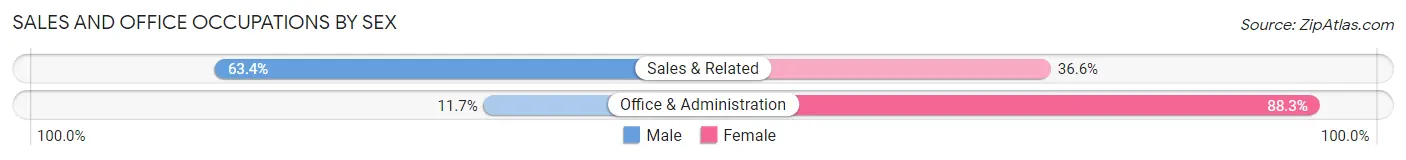
Sales and Office Occupations by Sex
| Occupation | Male | Female |
| Sales & Related | 187 (63.4%) | 108 (36.6%) |
| Office & Administration | 56 (11.7%) | 421 (88.3%) |
| Total (Category) | 243 (31.5%) | 529 (68.5%) |
| Total (Overall) | 3,072 (46.4%) | 3,546 (53.6%) |
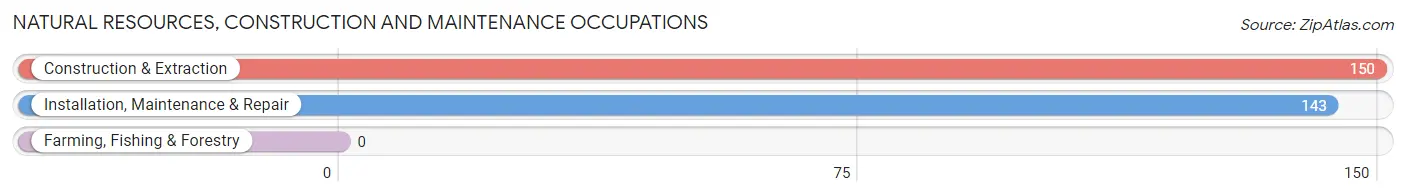
Natural Resources, Construction and Maintenance Occupations
The most common Natural Resources, Construction and Maintenance occupations in Brock Hall are Construction & Extraction (150 | 2.3%), and Installation, Maintenance & Repair (143 | 2.2%).
Natural Resources, Construction and Maintenance Occupations by Sex

| Occupation | Male | Female |
| Farming, Fishing & Forestry | 0 (0.0%) | 0 (0.0%) |
| Construction & Extraction | 150 (100.0%) | 0 (0.0%) |
| Installation, Maintenance & Repair | 143 (100.0%) | 0 (0.0%) |
| Total (Category) | 293 (100.0%) | 0 (0.0%) |
| Total (Overall) | 3,072 (46.4%) | 3,546 (53.6%) |
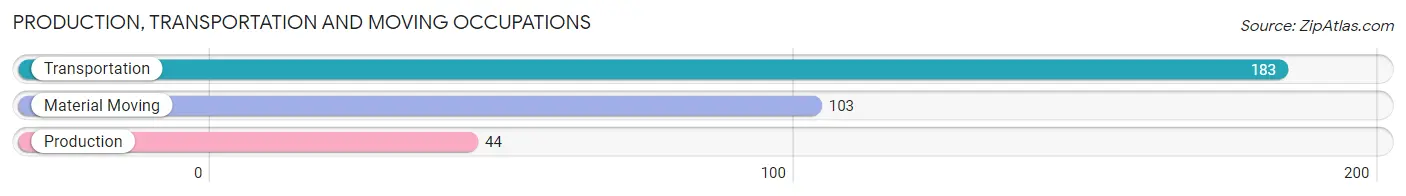
Production, Transportation and Moving Occupations
The most common Production, Transportation and Moving occupations in Brock Hall are Transportation (183 | 2.8%), Material Moving (103 | 1.6%), and Production (44 | 0.7%).
Production, Transportation and Moving Occupations by Sex
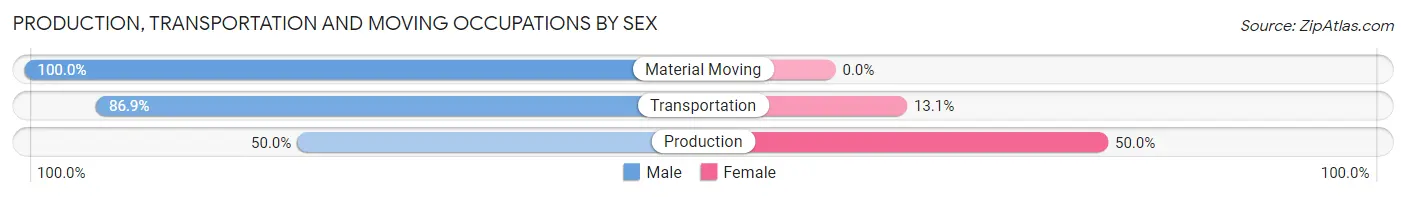
| Occupation | Male | Female |
| Production | 22 (50.0%) | 22 (50.0%) |
| Transportation | 159 (86.9%) | 24 (13.1%) |
| Material Moving | 103 (100.0%) | 0 (0.0%) |
| Total (Category) | 284 (86.1%) | 46 (13.9%) |
| Total (Overall) | 3,072 (46.4%) | 3,546 (53.6%) |
Employment Industries by Sex in Brock Hall
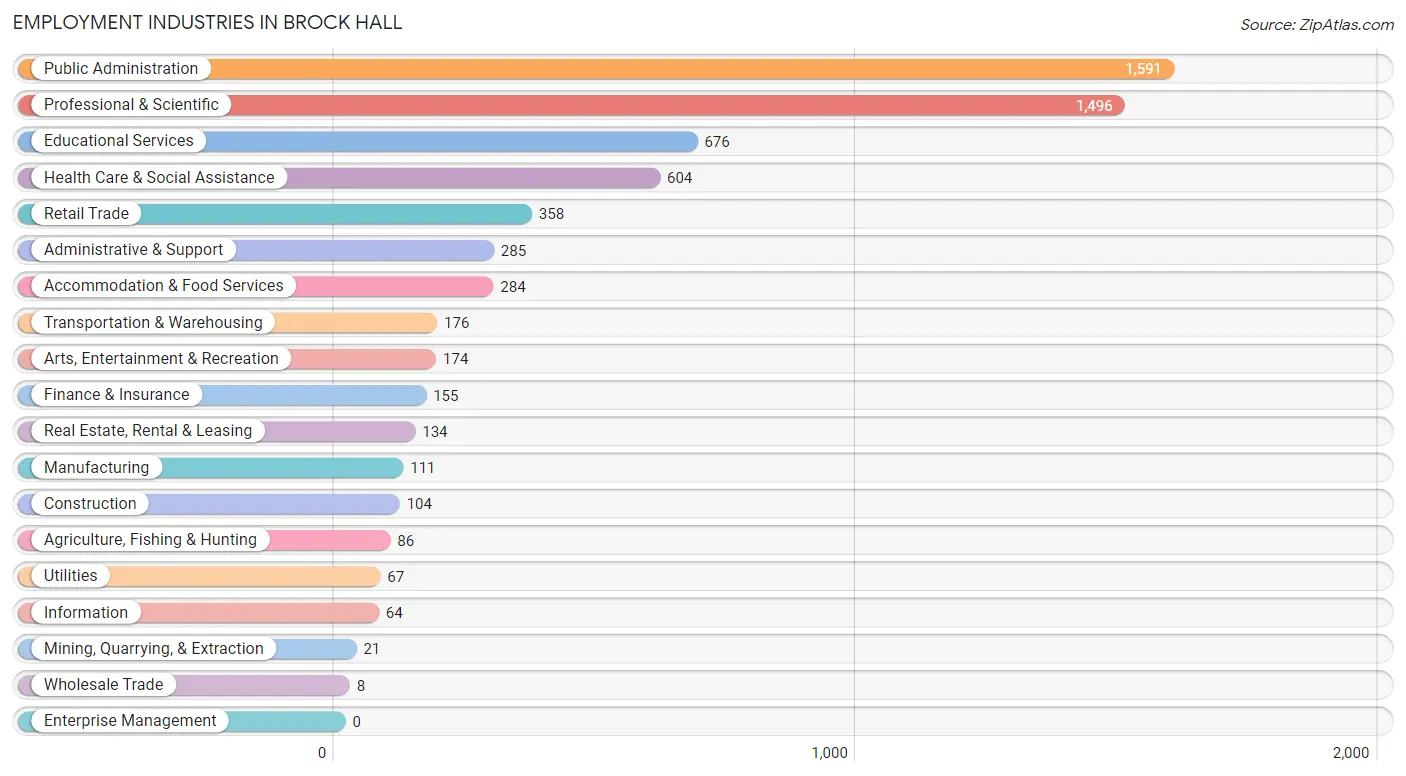
Employment Industries in Brock Hall
The major employment industries in Brock Hall include Public Administration (1,591 | 24.0%), Professional & Scientific (1,496 | 22.6%), Educational Services (676 | 10.2%), Health Care & Social Assistance (604 | 9.1%), and Retail Trade (358 | 5.4%).
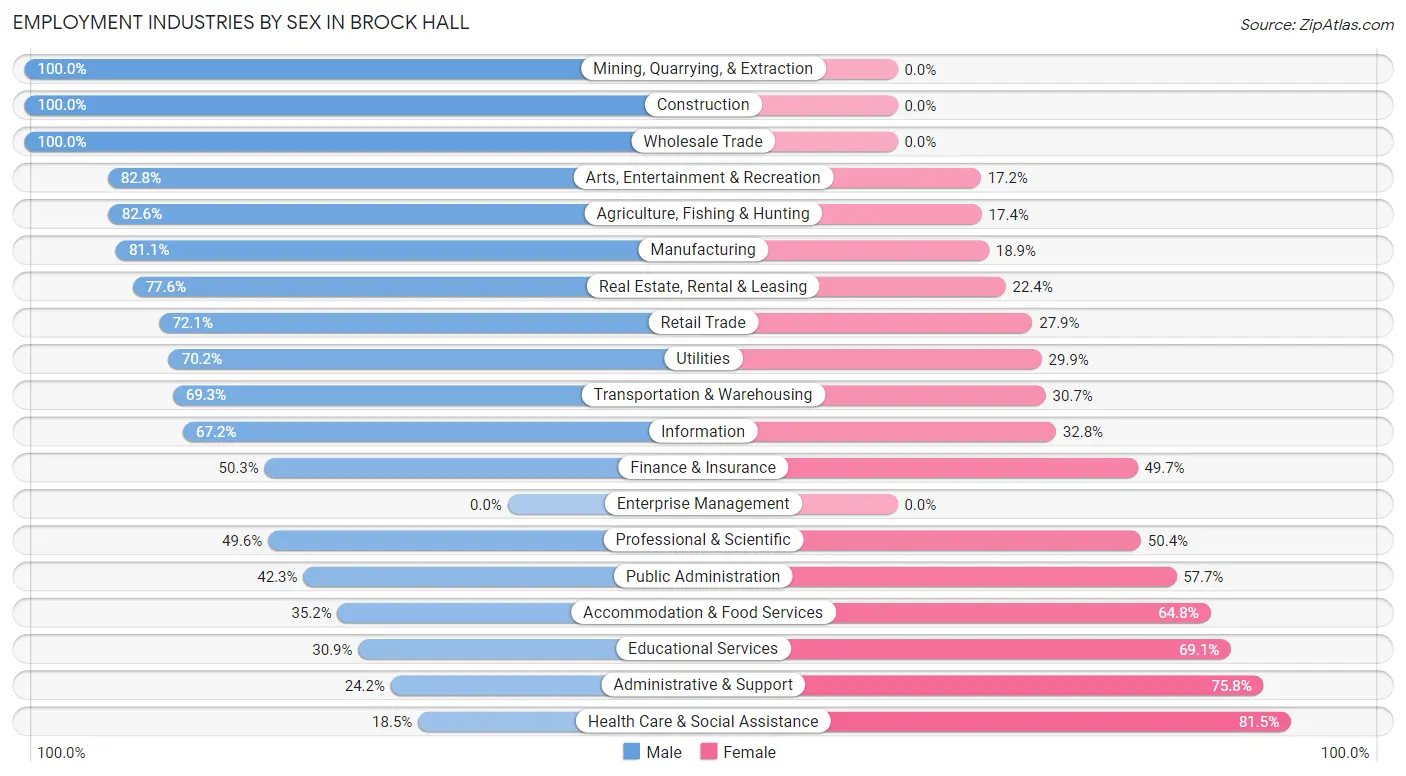
Employment Industries by Sex in Brock Hall
The Brock Hall industries that see more men than women are Mining, Quarrying, & Extraction (100.0%), Construction (100.0%), and Wholesale Trade (100.0%), whereas the industries that tend to have a higher number of women are Health Care & Social Assistance (81.5%), Administrative & Support (75.8%), and Educational Services (69.1%).
| Industry | Male | Female |
| Agriculture, Fishing & Hunting | 71 (82.6%) | 15 (17.4%) |
| Mining, Quarrying, & Extraction | 21 (100.0%) | 0 (0.0%) |
| Construction | 104 (100.0%) | 0 (0.0%) |
| Manufacturing | 90 (81.1%) | 21 (18.9%) |
| Wholesale Trade | 8 (100.0%) | 0 (0.0%) |
| Retail Trade | 258 (72.1%) | 100 (27.9%) |
| Transportation & Warehousing | 122 (69.3%) | 54 (30.7%) |
| Utilities | 47 (70.2%) | 20 (29.8%) |
| Information | 43 (67.2%) | 21 (32.8%) |
| Finance & Insurance | 78 (50.3%) | 77 (49.7%) |
| Real Estate, Rental & Leasing | 104 (77.6%) | 30 (22.4%) |
| Professional & Scientific | 742 (49.6%) | 754 (50.4%) |
| Enterprise Management | 0 (0.0%) | 0 (0.0%) |
| Administrative & Support | 69 (24.2%) | 216 (75.8%) |
| Educational Services | 209 (30.9%) | 467 (69.1%) |
| Health Care & Social Assistance | 112 (18.5%) | 492 (81.5%) |
| Arts, Entertainment & Recreation | 144 (82.8%) | 30 (17.2%) |
| Accommodation & Food Services | 100 (35.2%) | 184 (64.8%) |
| Public Administration | 673 (42.3%) | 918 (57.7%) |
| Total | 3,072 (46.4%) | 3,546 (53.6%) |
Education in Brock Hall
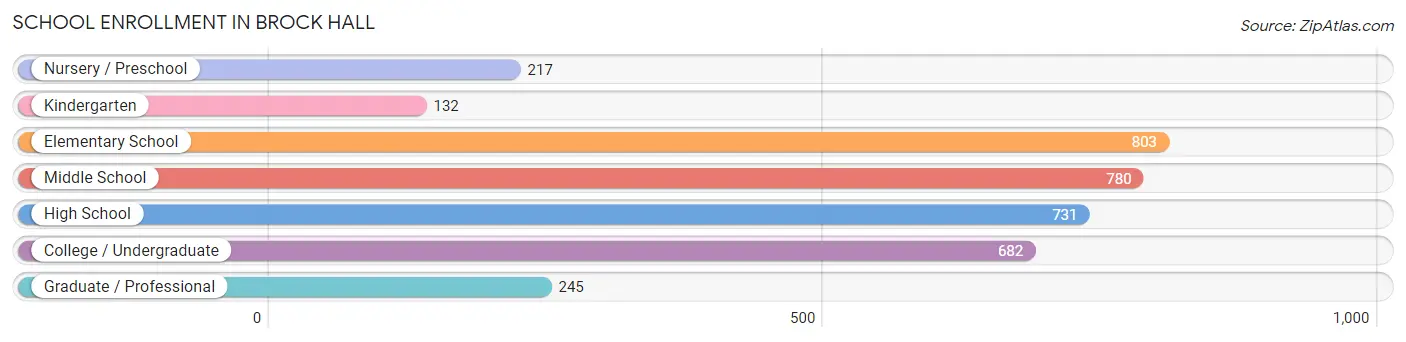
School Enrollment in Brock Hall
The most common levels of schooling among the 3,590 students in Brock Hall are elementary school (803 | 22.4%), middle school (780 | 21.7%), and high school (731 | 20.4%).
| School Level | # Students | % Students |
| Nursery / Preschool | 217 | 6.0% |
| Kindergarten | 132 | 3.7% |
| Elementary School | 803 | 22.4% |
| Middle School | 780 | 21.7% |
| High School | 731 | 20.4% |
| College / Undergraduate | 682 | 19.0% |
| Graduate / Professional | 245 | 6.8% |
| Total | 3,590 | 100.0% |
School Enrollment by Age by Funding Source in Brock Hall
Out of a total of 3,590 students who are enrolled in schools in Brock Hall, 959 (26.7%) attend a private institution, while the remaining 2,631 (73.3%) are enrolled in public schools. The age group of 3 to 4 year olds has the highest likelihood of being enrolled in private schools, with 154 (85.6% in the age bracket) enrolled. Conversely, the age group of 25 to 34 year olds has the lowest likelihood of being enrolled in a private school, with 133 (100.0% in the age bracket) attending a public institution.
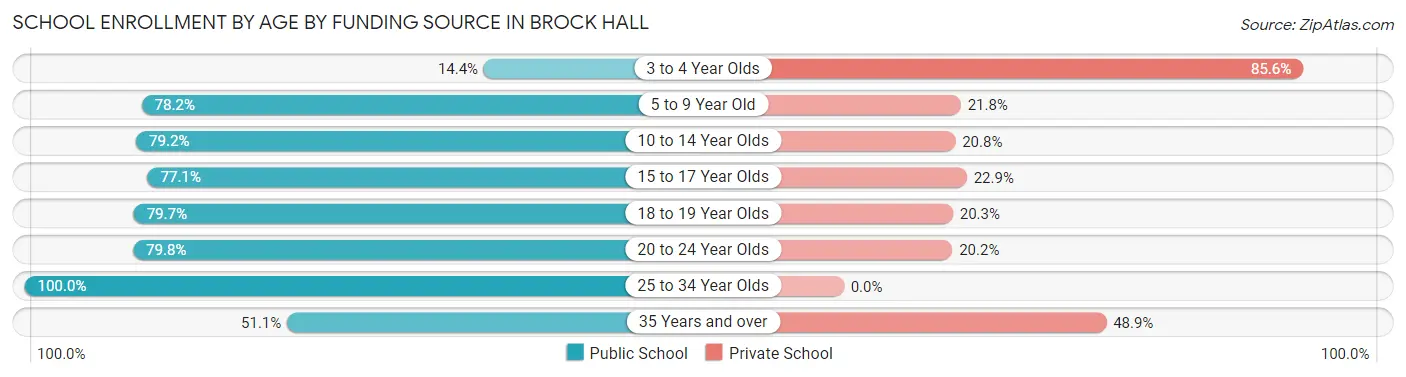
| Age Bracket | Public School | Private School |
| 3 to 4 Year Olds | 26 (14.4%) | 154 (85.6%) |
| 5 to 9 Year Old | 703 (78.2%) | 196 (21.8%) |
| 10 to 14 Year Olds | 713 (79.2%) | 187 (20.8%) |
| 15 to 17 Year Olds | 491 (77.1%) | 146 (22.9%) |
| 18 to 19 Year Olds | 98 (79.7%) | 25 (20.3%) |
| 20 to 24 Year Olds | 284 (79.8%) | 72 (20.2%) |
| 25 to 34 Year Olds | 133 (100.0%) | 0 (0.0%) |
| 35 Years and over | 185 (51.1%) | 177 (48.9%) |
| Total | 2,631 (73.3%) | 959 (26.7%) |
Educational Attainment by Field of Study in Brock Hall
Business (1,690 | 30.8%), social sciences (453 | 8.3%), bio, nature & agricultural (449 | 8.2%), arts & humanities (444 | 8.1%), and science & technology (388 | 7.1%) are the most common fields of study among 5,491 individuals in Brock Hall who have obtained a bachelor's degree or higher.
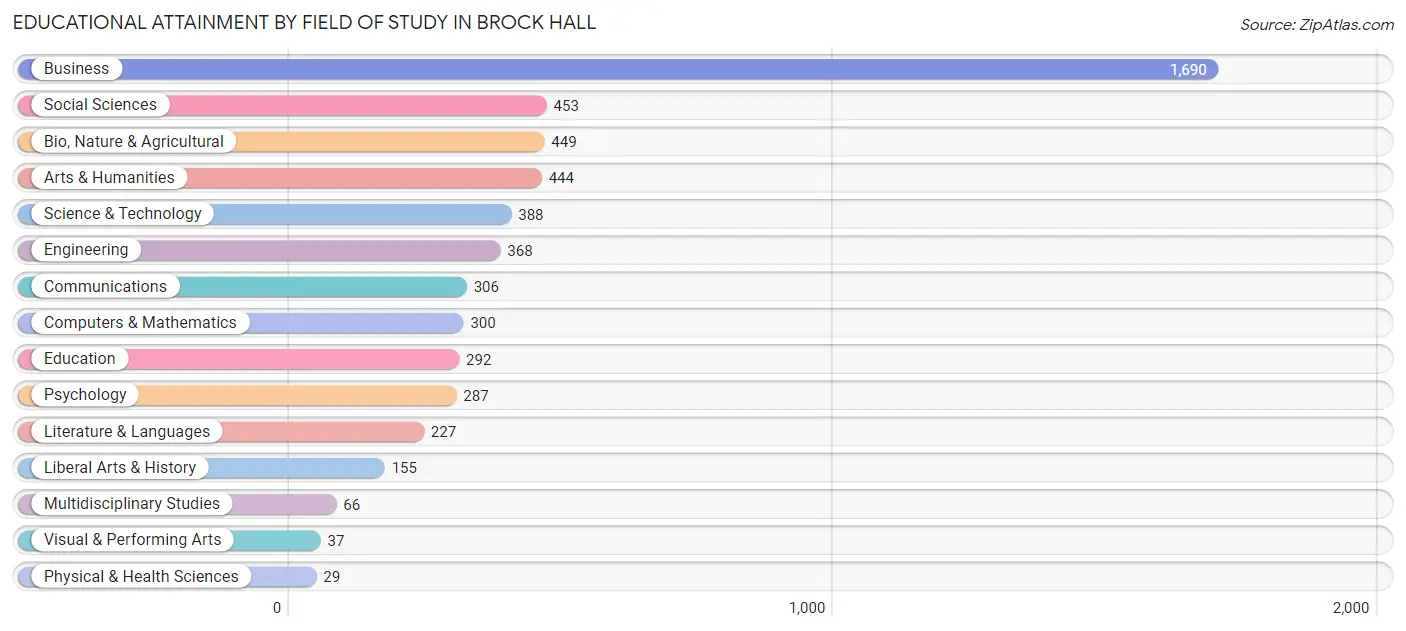
| Field of Study | # Graduates | % Graduates |
| Computers & Mathematics | 300 | 5.5% |
| Bio, Nature & Agricultural | 449 | 8.2% |
| Physical & Health Sciences | 29 | 0.5% |
| Psychology | 287 | 5.2% |
| Social Sciences | 453 | 8.3% |
| Engineering | 368 | 6.7% |
| Multidisciplinary Studies | 66 | 1.2% |
| Science & Technology | 388 | 7.1% |
| Business | 1,690 | 30.8% |
| Education | 292 | 5.3% |
| Literature & Languages | 227 | 4.1% |
| Liberal Arts & History | 155 | 2.8% |
| Visual & Performing Arts | 37 | 0.7% |
| Communications | 306 | 5.6% |
| Arts & Humanities | 444 | 8.1% |
| Total | 5,491 | 100.0% |
Transportation & Commute in Brock Hall
Vehicle Availability by Sex in Brock Hall
The most prevalent vehicle ownership categories in Brock Hall are males with 2 vehicles (1,210, accounting for 38.7%) and females with 2 vehicles (1,545, making up 33.5%).
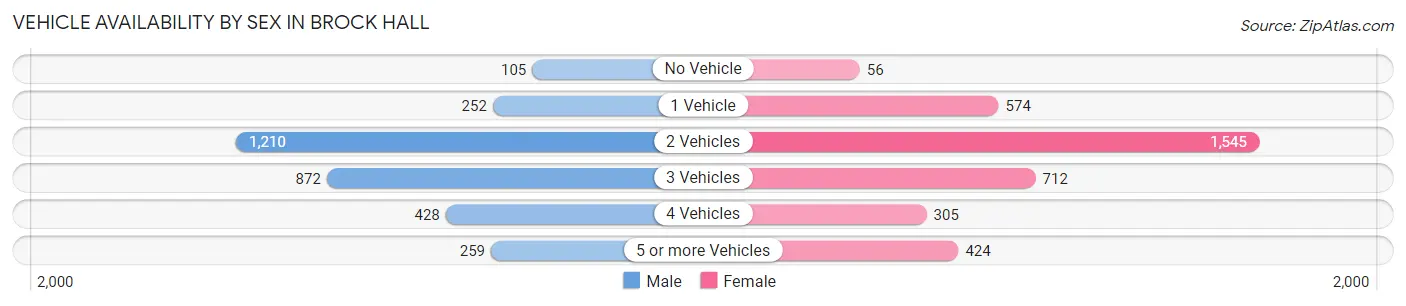
| Vehicles Available | Male | Female |
| No Vehicle | 105 (3.4%) | 56 (1.5%) |
| 1 Vehicle | 252 (8.1%) | 574 (15.9%) |
| 2 Vehicles | 1,210 (38.7%) | 1,545 (42.7%) |
| 3 Vehicles | 872 (27.9%) | 712 (19.7%) |
| 4 Vehicles | 428 (13.7%) | 305 (8.4%) |
| 5 or more Vehicles | 259 (8.3%) | 424 (11.7%) |
| Total | 3,126 (100.0%) | 3,616 (100.0%) |
Commute Time in Brock Hall
The most frequently occuring commute durations in Brock Hall are 45 to 59 minutes (1,337 commuters, 26.7%), 60 to 89 minutes (1,110 commuters, 22.2%), and 30 to 34 minutes (600 commuters, 12.0%).
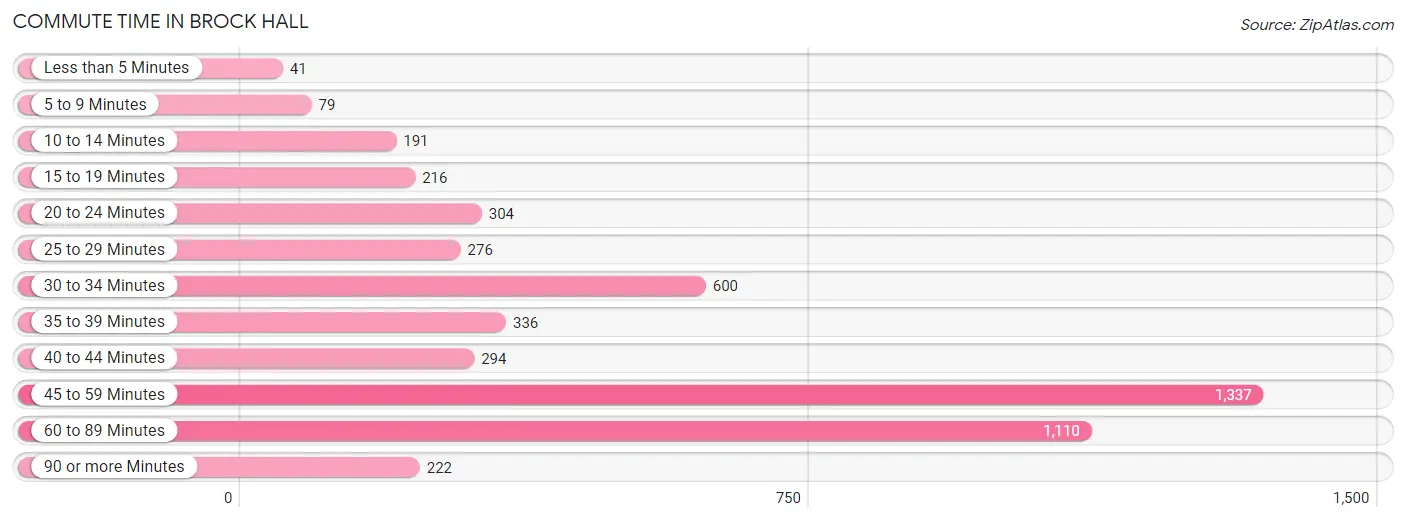
| Commute Time | # Commuters | % Commuters |
| Less than 5 Minutes | 41 | 0.8% |
| 5 to 9 Minutes | 79 | 1.6% |
| 10 to 14 Minutes | 191 | 3.8% |
| 15 to 19 Minutes | 216 | 4.3% |
| 20 to 24 Minutes | 304 | 6.1% |
| 25 to 29 Minutes | 276 | 5.5% |
| 30 to 34 Minutes | 600 | 12.0% |
| 35 to 39 Minutes | 336 | 6.7% |
| 40 to 44 Minutes | 294 | 5.9% |
| 45 to 59 Minutes | 1,337 | 26.7% |
| 60 to 89 Minutes | 1,110 | 22.2% |
| 90 or more Minutes | 222 | 4.4% |
Commute Time by Sex in Brock Hall
The most common commute times in Brock Hall are 45 to 59 minutes (723 commuters, 30.4%) for males and 60 to 89 minutes (649 commuters, 24.7%) for females.
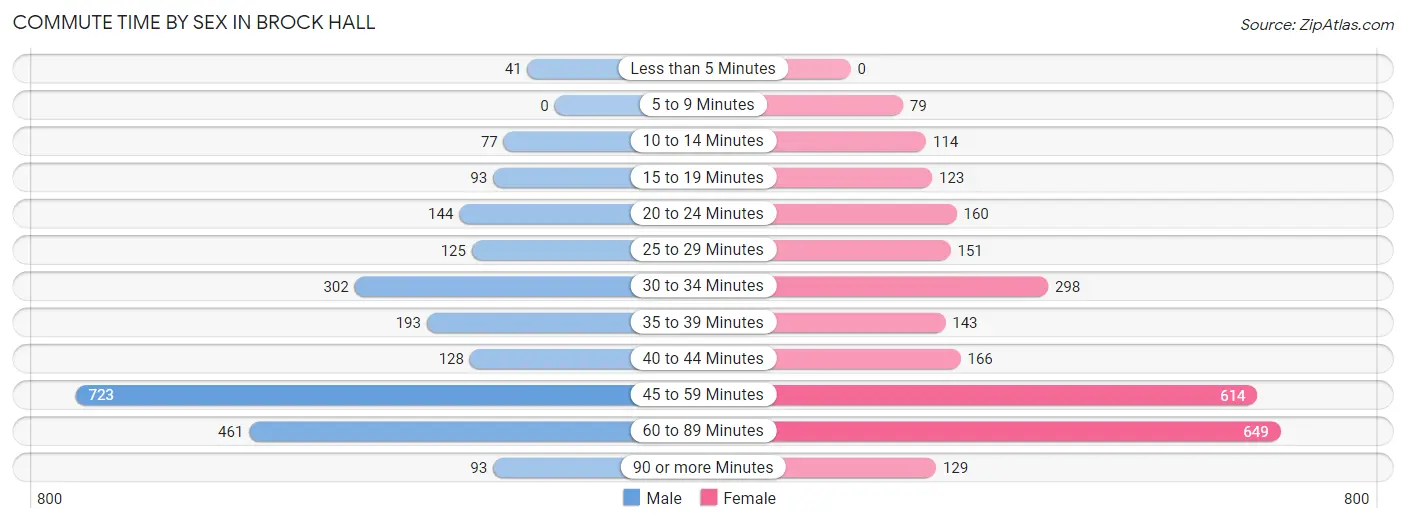
| Commute Time | Male | Female |
| Less than 5 Minutes | 41 (1.7%) | 0 (0.0%) |
| 5 to 9 Minutes | 0 (0.0%) | 79 (3.0%) |
| 10 to 14 Minutes | 77 (3.2%) | 114 (4.3%) |
| 15 to 19 Minutes | 93 (3.9%) | 123 (4.7%) |
| 20 to 24 Minutes | 144 (6.0%) | 160 (6.1%) |
| 25 to 29 Minutes | 125 (5.2%) | 151 (5.8%) |
| 30 to 34 Minutes | 302 (12.7%) | 298 (11.4%) |
| 35 to 39 Minutes | 193 (8.1%) | 143 (5.4%) |
| 40 to 44 Minutes | 128 (5.4%) | 166 (6.3%) |
| 45 to 59 Minutes | 723 (30.4%) | 614 (23.4%) |
| 60 to 89 Minutes | 461 (19.4%) | 649 (24.7%) |
| 90 or more Minutes | 93 (3.9%) | 129 (4.9%) |
Time of Departure to Work by Sex in Brock Hall
The most frequent times of departure to work in Brock Hall are 7:00 AM to 7:29 AM (378, 15.9%) for males and 7:00 AM to 7:29 AM (454, 17.3%) for females.
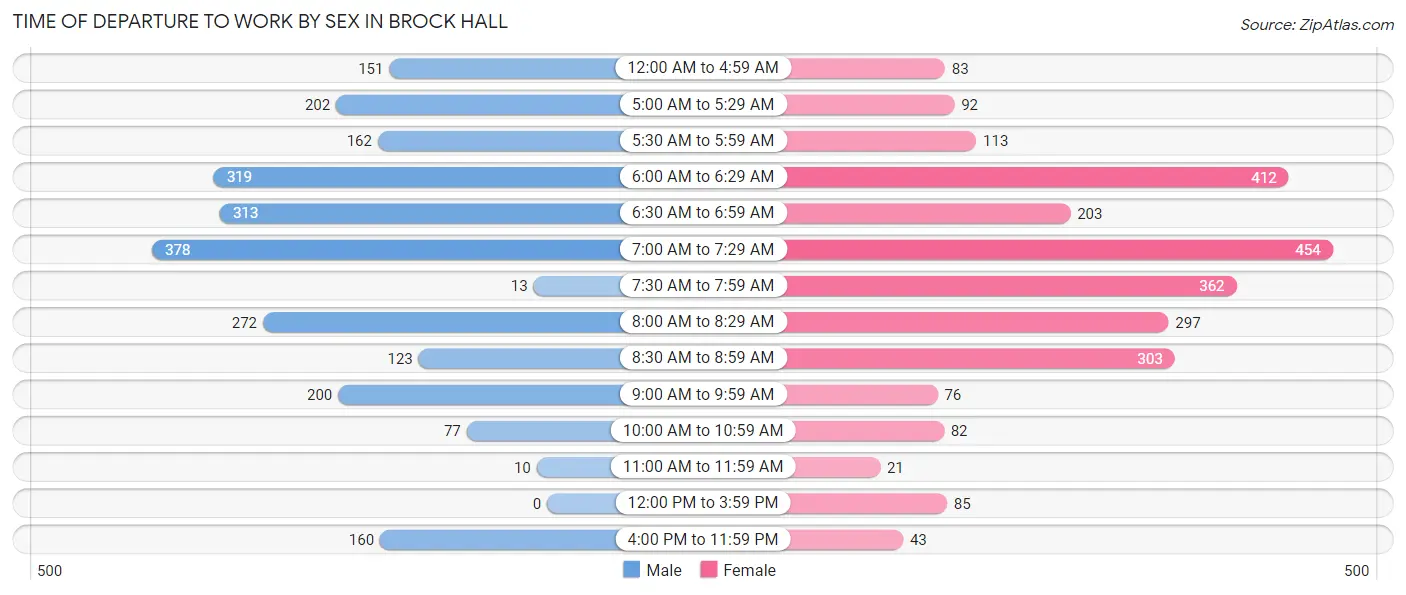
| Time of Departure | Male | Female |
| 12:00 AM to 4:59 AM | 151 (6.3%) | 83 (3.2%) |
| 5:00 AM to 5:29 AM | 202 (8.5%) | 92 (3.5%) |
| 5:30 AM to 5:59 AM | 162 (6.8%) | 113 (4.3%) |
| 6:00 AM to 6:29 AM | 319 (13.4%) | 412 (15.7%) |
| 6:30 AM to 6:59 AM | 313 (13.2%) | 203 (7.7%) |
| 7:00 AM to 7:29 AM | 378 (15.9%) | 454 (17.3%) |
| 7:30 AM to 7:59 AM | 13 (0.5%) | 362 (13.8%) |
| 8:00 AM to 8:29 AM | 272 (11.4%) | 297 (11.3%) |
| 8:30 AM to 8:59 AM | 123 (5.2%) | 303 (11.5%) |
| 9:00 AM to 9:59 AM | 200 (8.4%) | 76 (2.9%) |
| 10:00 AM to 10:59 AM | 77 (3.2%) | 82 (3.1%) |
| 11:00 AM to 11:59 AM | 10 (0.4%) | 21 (0.8%) |
| 12:00 PM to 3:59 PM | 0 (0.0%) | 85 (3.2%) |
| 4:00 PM to 11:59 PM | 160 (6.7%) | 43 (1.6%) |
| Total | 2,380 (100.0%) | 2,626 (100.0%) |
Housing Occupancy in Brock Hall
Occupancy by Ownership in Brock Hall
Of the total 4,201 dwellings in Brock Hall, owner-occupied units account for 4,015 (95.6%), while renter-occupied units make up 186 (4.4%).
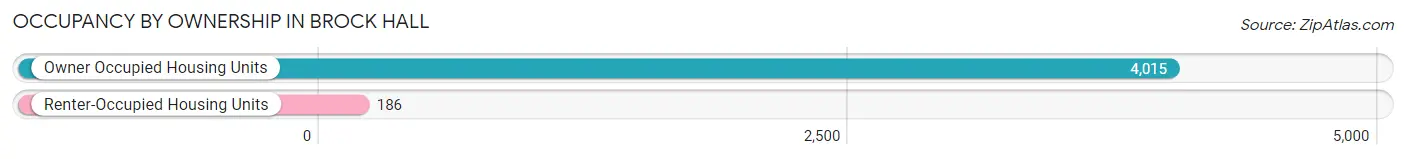
| Occupancy | # Housing Units | % Housing Units |
| Owner Occupied Housing Units | 4,015 | 95.6% |
| Renter-Occupied Housing Units | 186 | 4.4% |
| Total Occupied Housing Units | 4,201 | 100.0% |
Occupancy by Household Size in Brock Hall
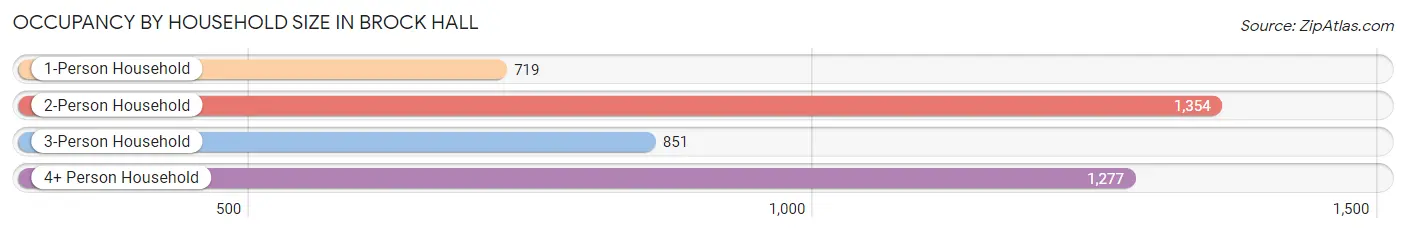
| Household Size | # Housing Units | % Housing Units |
| 1-Person Household | 719 | 17.1% |
| 2-Person Household | 1,354 | 32.2% |
| 3-Person Household | 851 | 20.3% |
| 4+ Person Household | 1,277 | 30.4% |
| Total Housing Units | 4,201 | 100.0% |
Occupancy by Ownership by Household Size in Brock Hall
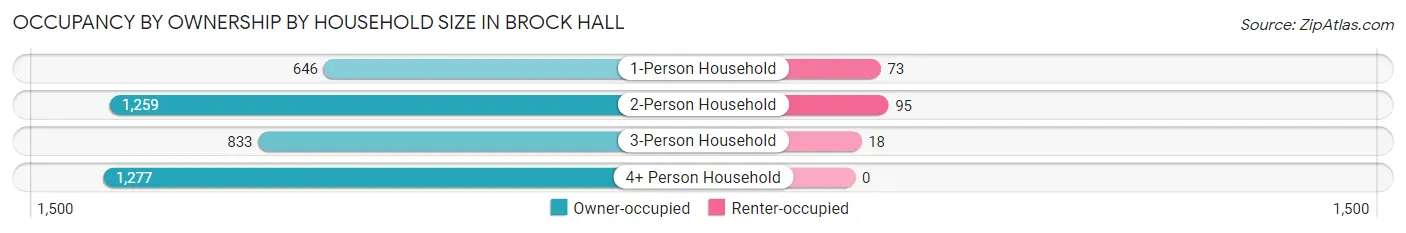
| Household Size | Owner-occupied | Renter-occupied |
| 1-Person Household | 646 (89.8%) | 73 (10.2%) |
| 2-Person Household | 1,259 (93.0%) | 95 (7.0%) |
| 3-Person Household | 833 (97.9%) | 18 (2.1%) |
| 4+ Person Household | 1,277 (100.0%) | 0 (0.0%) |
| Total Housing Units | 4,015 (95.6%) | 186 (4.4%) |
Occupancy by Educational Attainment in Brock Hall
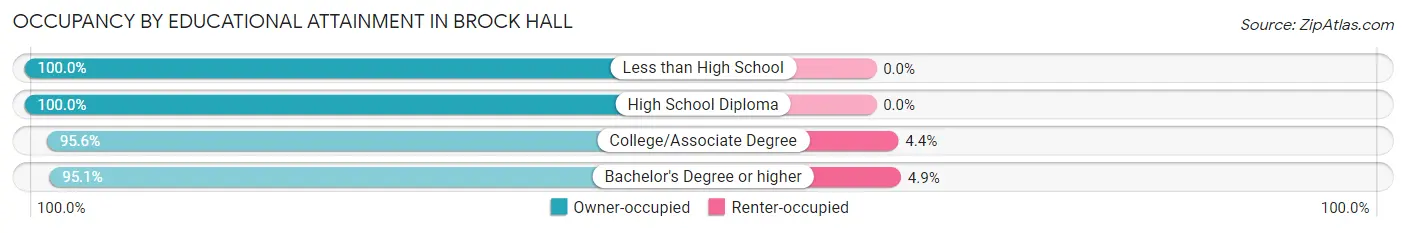
| Household Size | Owner-occupied | Renter-occupied |
| Less than High School | 70 (100.0%) | 0 (0.0%) |
| High School Diploma | 247 (100.0%) | 0 (0.0%) |
| College/Associate Degree | 931 (95.6%) | 43 (4.4%) |
| Bachelor's Degree or higher | 2,767 (95.1%) | 143 (4.9%) |
Occupancy by Age of Householder in Brock Hall
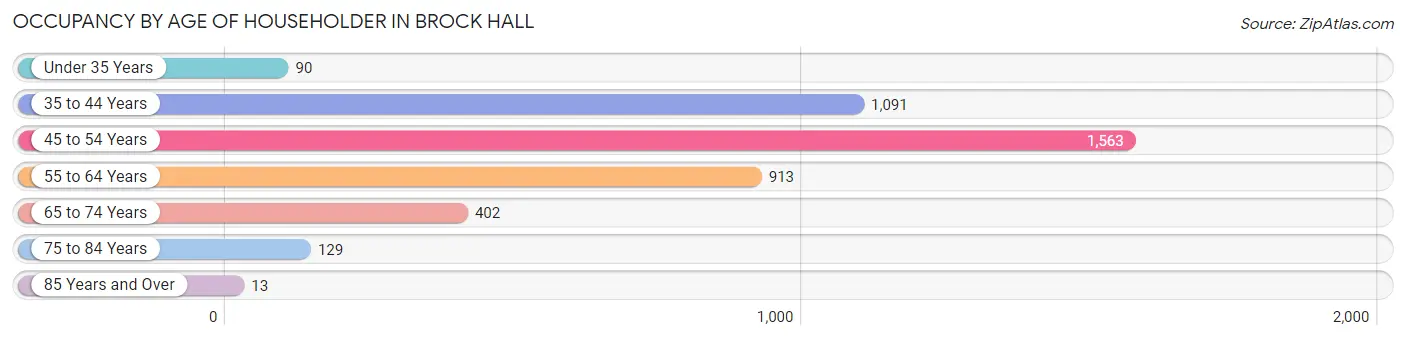
| Age Bracket | # Households | % Households |
| Under 35 Years | 90 | 2.1% |
| 35 to 44 Years | 1,091 | 26.0% |
| 45 to 54 Years | 1,563 | 37.2% |
| 55 to 64 Years | 913 | 21.7% |
| 65 to 74 Years | 402 | 9.6% |
| 75 to 84 Years | 129 | 3.1% |
| 85 Years and Over | 13 | 0.3% |
| Total | 4,201 | 100.0% |
Housing Finances in Brock Hall
Median Income by Occupancy in Brock Hall
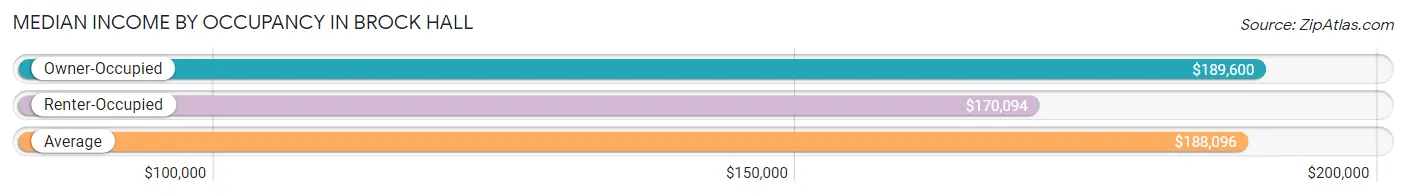
| Occupancy Type | # Households | Median Income |
| Owner-Occupied | 4,015 (95.6%) | $189,600 |
| Renter-Occupied | 186 (4.4%) | $170,094 |
| Average | 4,201 (100.0%) | $188,096 |
Occupancy by Householder Income Bracket in Brock Hall
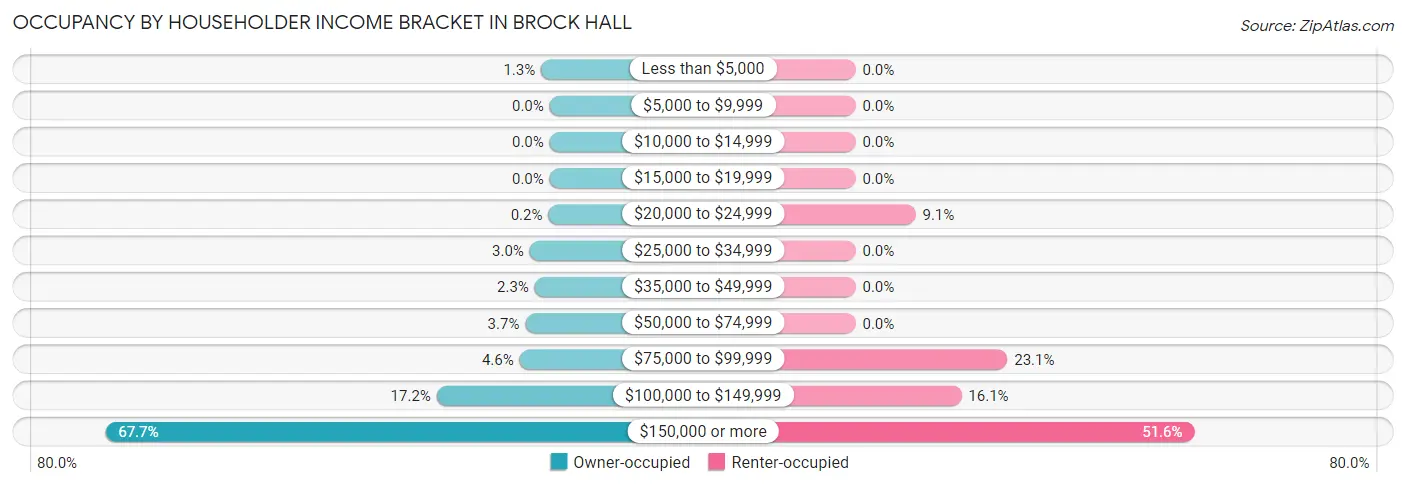
| Income Bracket | Owner-occupied | Renter-occupied |
| Less than $5,000 | 52 (1.3%) | 0 (0.0%) |
| $5,000 to $9,999 | 0 (0.0%) | 0 (0.0%) |
| $10,000 to $14,999 | 0 (0.0%) | 0 (0.0%) |
| $15,000 to $19,999 | 0 (0.0%) | 0 (0.0%) |
| $20,000 to $24,999 | 8 (0.2%) | 17 (9.1%) |
| $25,000 to $34,999 | 122 (3.0%) | 0 (0.0%) |
| $35,000 to $49,999 | 91 (2.3%) | 0 (0.0%) |
| $50,000 to $74,999 | 149 (3.7%) | 0 (0.0%) |
| $75,000 to $99,999 | 184 (4.6%) | 43 (23.1%) |
| $100,000 to $149,999 | 691 (17.2%) | 30 (16.1%) |
| $150,000 or more | 2,718 (67.7%) | 96 (51.6%) |
| Total | 4,015 (100.0%) | 186 (100.0%) |
Monthly Housing Cost Tiers in Brock Hall
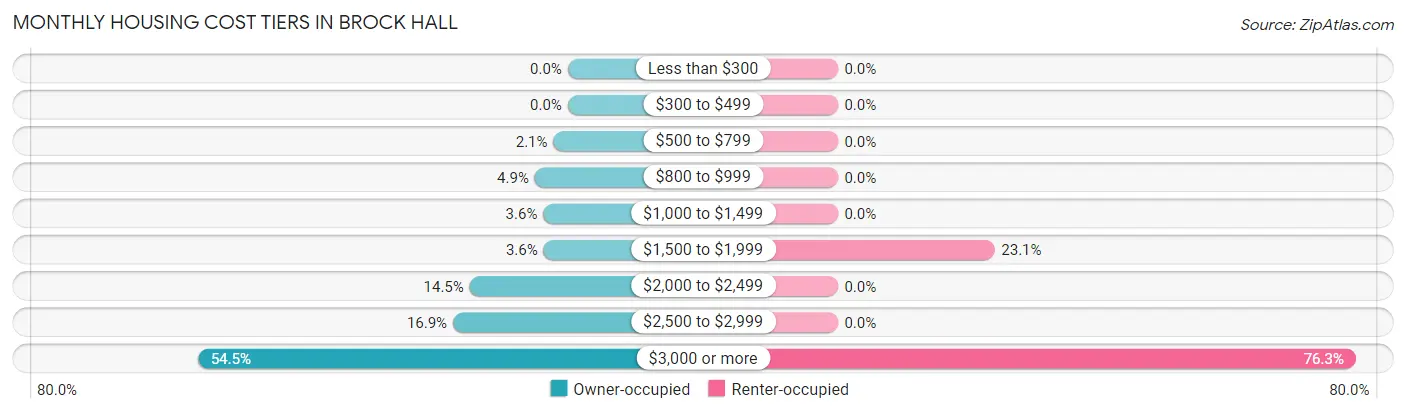
| Monthly Cost | Owner-occupied | Renter-occupied |
| Less than $300 | 0 (0.0%) | 0 (0.0%) |
| $300 to $499 | 0 (0.0%) | 0 (0.0%) |
| $500 to $799 | 85 (2.1%) | 0 (0.0%) |
| $800 to $999 | 195 (4.9%) | 0 (0.0%) |
| $1,000 to $1,499 | 145 (3.6%) | 0 (0.0%) |
| $1,500 to $1,999 | 143 (3.6%) | 43 (23.1%) |
| $2,000 to $2,499 | 580 (14.4%) | 0 (0.0%) |
| $2,500 to $2,999 | 679 (16.9%) | 0 (0.0%) |
| $3,000 or more | 2,188 (54.5%) | 142 (76.3%) |
| Total | 4,015 (100.0%) | 186 (100.0%) |
Physical Housing Characteristics in Brock Hall
Housing Structures in Brock Hall
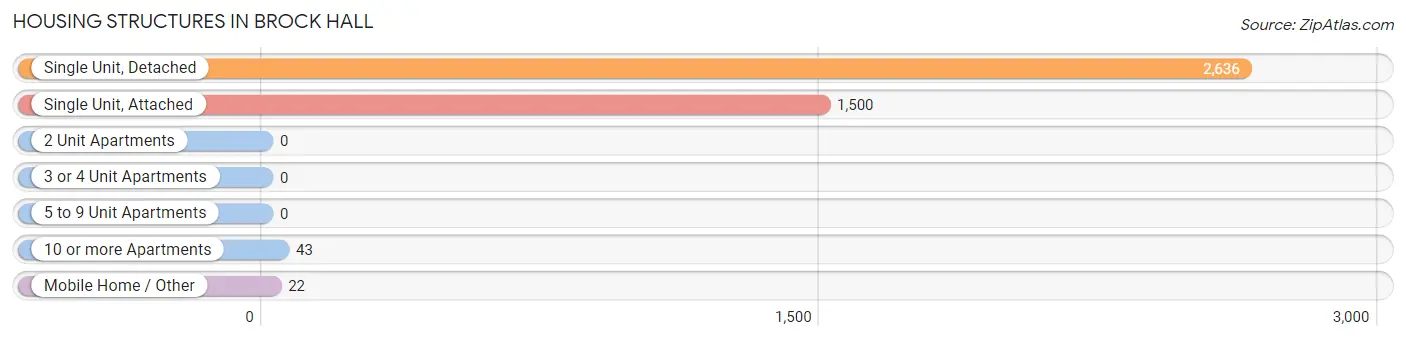
| Structure Type | # Housing Units | % Housing Units |
| Single Unit, Detached | 2,636 | 62.7% |
| Single Unit, Attached | 1,500 | 35.7% |
| 2 Unit Apartments | 0 | 0.0% |
| 3 or 4 Unit Apartments | 0 | 0.0% |
| 5 to 9 Unit Apartments | 0 | 0.0% |
| 10 or more Apartments | 43 | 1.0% |
| Mobile Home / Other | 22 | 0.5% |
| Total | 4,201 | 100.0% |
Housing Structures by Occupancy in Brock Hall
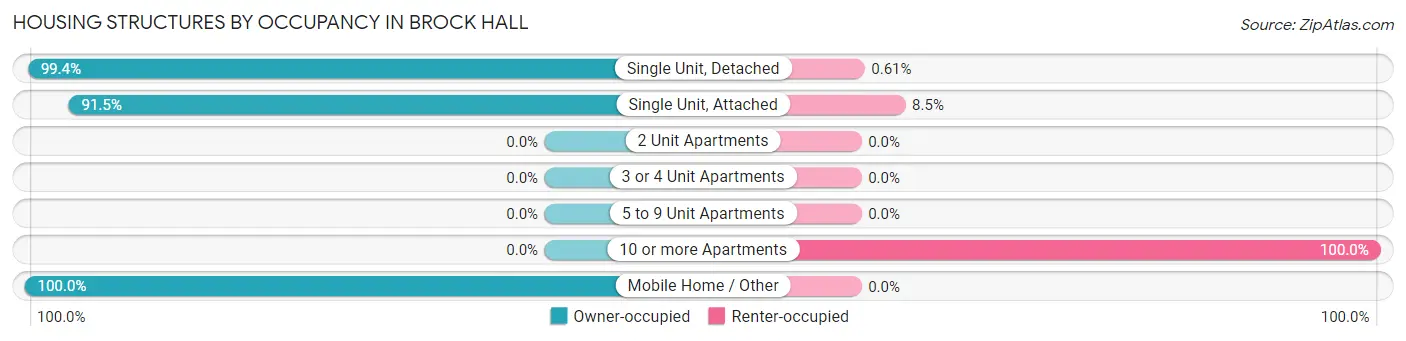
| Structure Type | Owner-occupied | Renter-occupied |
| Single Unit, Detached | 2,620 (99.4%) | 16 (0.6%) |
| Single Unit, Attached | 1,373 (91.5%) | 127 (8.5%) |
| 2 Unit Apartments | 0 (0.0%) | 0 (0.0%) |
| 3 or 4 Unit Apartments | 0 (0.0%) | 0 (0.0%) |
| 5 to 9 Unit Apartments | 0 (0.0%) | 0 (0.0%) |
| 10 or more Apartments | 0 (0.0%) | 43 (100.0%) |
| Mobile Home / Other | 22 (100.0%) | 0 (0.0%) |
| Total | 4,015 (95.6%) | 186 (4.4%) |
Housing Structures by Number of Rooms in Brock Hall
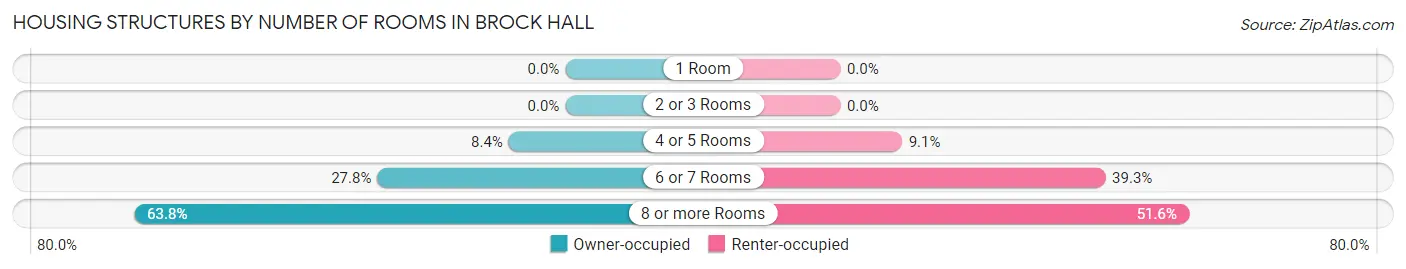
| Number of Rooms | Owner-occupied | Renter-occupied |
| 1 Room | 0 (0.0%) | 0 (0.0%) |
| 2 or 3 Rooms | 0 (0.0%) | 0 (0.0%) |
| 4 or 5 Rooms | 336 (8.4%) | 17 (9.1%) |
| 6 or 7 Rooms | 1,117 (27.8%) | 73 (39.3%) |
| 8 or more Rooms | 2,562 (63.8%) | 96 (51.6%) |
| Total | 4,015 (100.0%) | 186 (100.0%) |
Housing Structure by Heating Type in Brock Hall
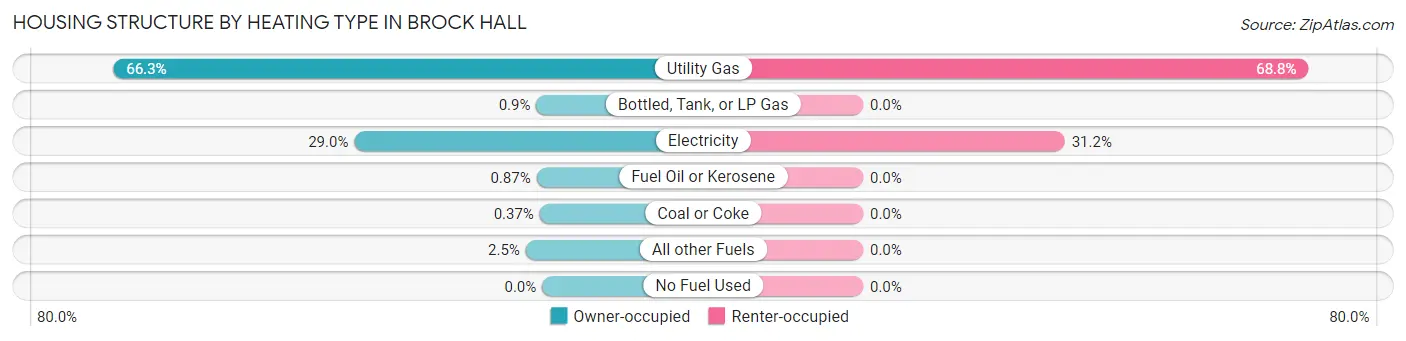
| Heating Type | Owner-occupied | Renter-occupied |
| Utility Gas | 2,661 (66.3%) | 128 (68.8%) |
| Bottled, Tank, or LP Gas | 36 (0.9%) | 0 (0.0%) |
| Electricity | 1,166 (29.0%) | 58 (31.2%) |
| Fuel Oil or Kerosene | 35 (0.9%) | 0 (0.0%) |
| Coal or Coke | 15 (0.4%) | 0 (0.0%) |
| All other Fuels | 102 (2.5%) | 0 (0.0%) |
| No Fuel Used | 0 (0.0%) | 0 (0.0%) |
| Total | 4,015 (100.0%) | 186 (100.0%) |
Household Vehicle Usage in Brock Hall
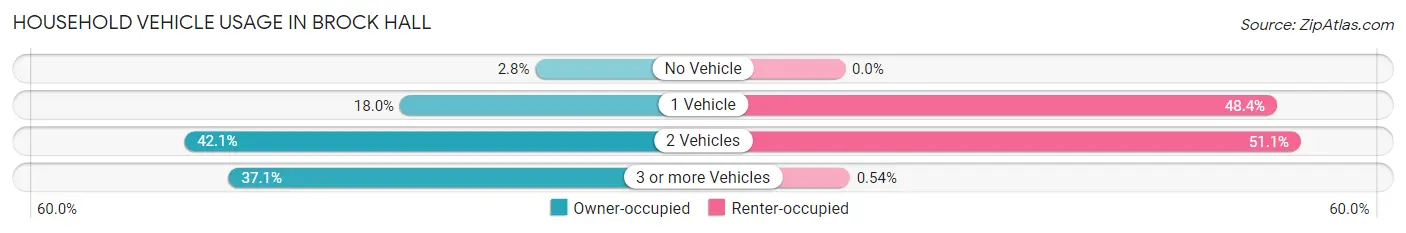
| Vehicles per Household | Owner-occupied | Renter-occupied |
| No Vehicle | 112 (2.8%) | 0 (0.0%) |
| 1 Vehicle | 721 (18.0%) | 90 (48.4%) |
| 2 Vehicles | 1,691 (42.1%) | 95 (51.1%) |
| 3 or more Vehicles | 1,491 (37.1%) | 1 (0.5%) |
| Total | 4,015 (100.0%) | 186 (100.0%) |
Real Estate & Mortgages in Brock Hall
Real Estate and Mortgage Overview in Brock Hall
| Characteristic | Without Mortgage | With Mortgage |
| Housing Units | 368 | 3,647 |
| Median Property Value | $440,000 | $577,700 |
| Median Household Income | $187,581 | $2,491 |
| Monthly Housing Costs | $911 | $2,188 |
| Real Estate Taxes | $5,837 | $29 |
Property Value by Mortgage Status in Brock Hall
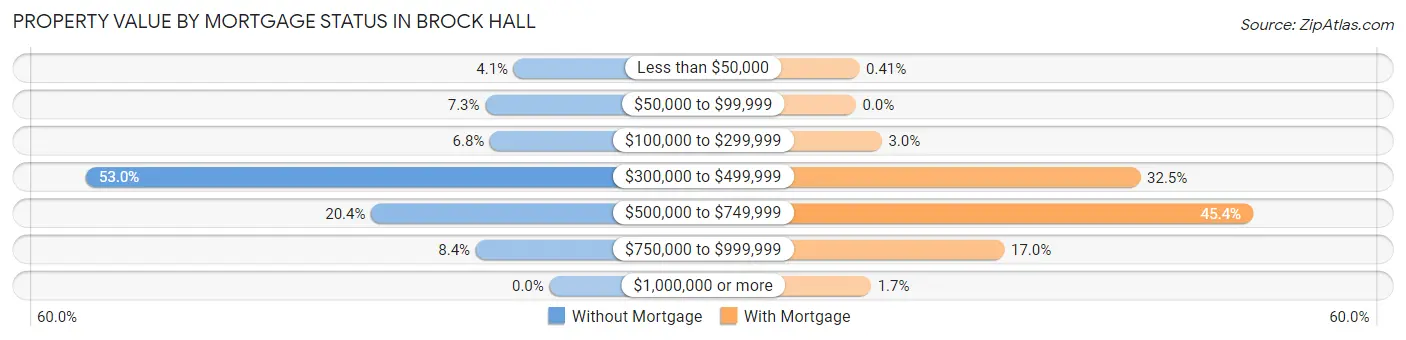
| Property Value | Without Mortgage | With Mortgage |
| Less than $50,000 | 15 (4.1%) | 15 (0.4%) |
| $50,000 to $99,999 | 27 (7.3%) | 0 (0.0%) |
| $100,000 to $299,999 | 25 (6.8%) | 108 (3.0%) |
| $300,000 to $499,999 | 195 (53.0%) | 1,186 (32.5%) |
| $500,000 to $749,999 | 75 (20.4%) | 1,656 (45.4%) |
| $750,000 to $999,999 | 31 (8.4%) | 619 (17.0%) |
| $1,000,000 or more | 0 (0.0%) | 63 (1.7%) |
| Total | 368 (100.0%) | 3,647 (100.0%) |
Household Income by Mortgage Status in Brock Hall
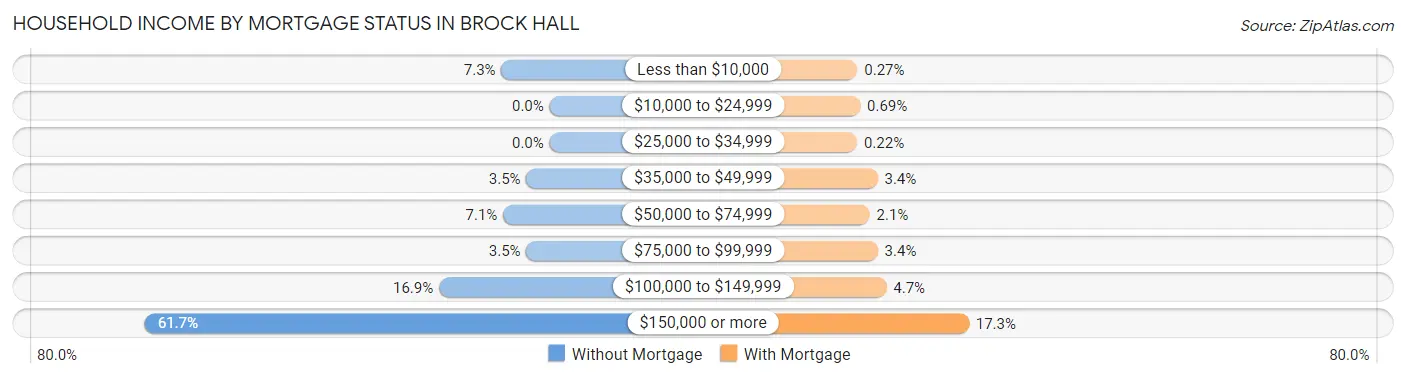
| Household Income | Without Mortgage | With Mortgage |
| Less than $10,000 | 27 (7.3%) | 10 (0.3%) |
| $10,000 to $24,999 | 0 (0.0%) | 25 (0.7%) |
| $25,000 to $34,999 | 0 (0.0%) | 8 (0.2%) |
| $35,000 to $49,999 | 13 (3.5%) | 122 (3.4%) |
| $50,000 to $74,999 | 26 (7.1%) | 78 (2.1%) |
| $75,000 to $99,999 | 13 (3.5%) | 123 (3.4%) |
| $100,000 to $149,999 | 62 (16.9%) | 171 (4.7%) |
| $150,000 or more | 227 (61.7%) | 629 (17.2%) |
| Total | 368 (100.0%) | 3,647 (100.0%) |
Property Value to Household Income Ratio in Brock Hall
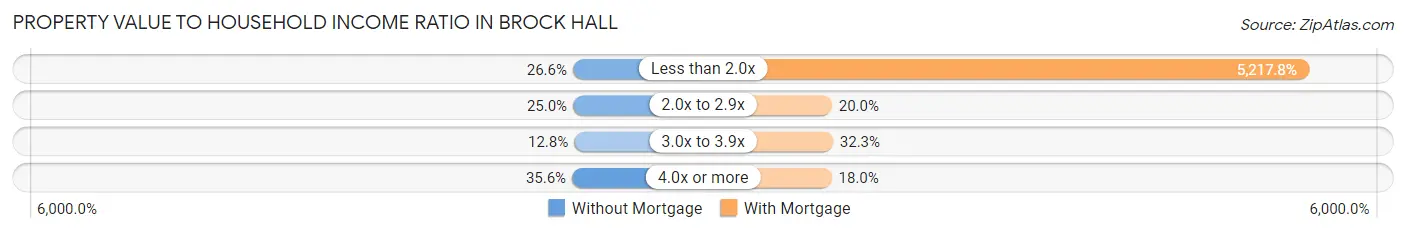
| Value-to-Income Ratio | Without Mortgage | With Mortgage |
| Less than 2.0x | 98 (26.6%) | 190,293 (5,217.8%) |
| 2.0x to 2.9x | 92 (25.0%) | 730 (20.0%) |
| 3.0x to 3.9x | 47 (12.8%) | 1,179 (32.3%) |
| 4.0x or more | 131 (35.6%) | 656 (18.0%) |
| Total | 368 (100.0%) | 3,647 (100.0%) |
Real Estate Taxes by Mortgage Status in Brock Hall
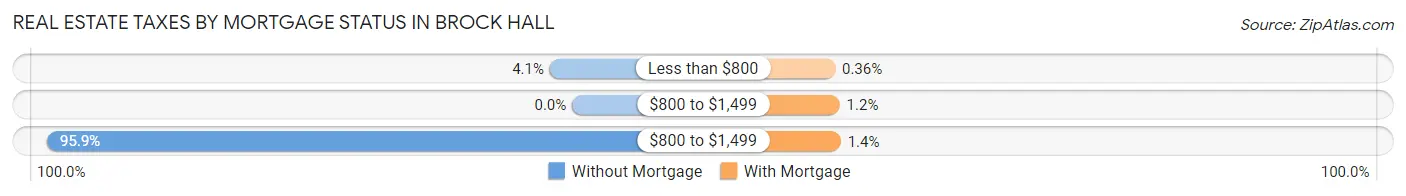
| Property Taxes | Without Mortgage | With Mortgage |
| Less than $800 | 15 (4.1%) | 13 (0.4%) |
| $800 to $1,499 | 0 (0.0%) | 44 (1.2%) |
| $800 to $1,499 | 353 (95.9%) | 51 (1.4%) |
| Total | 368 (100.0%) | 3,647 (100.0%) |
Health & Disability in Brock Hall
Health Insurance Coverage by Age in Brock Hall
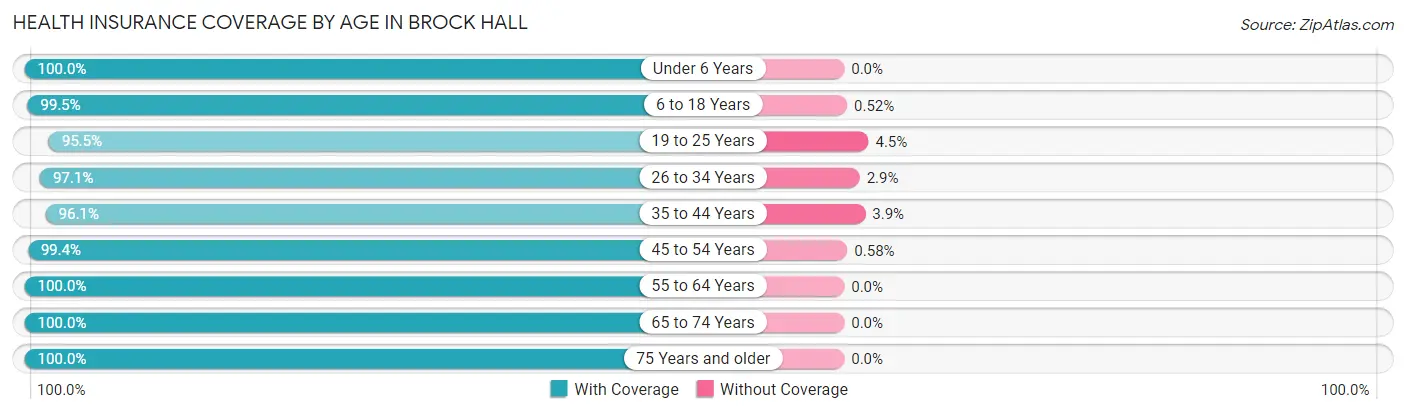
| Age Bracket | With Coverage | Without Coverage |
| Under 6 Years | 966 (100.0%) | 0 (0.0%) |
| 6 to 18 Years | 2,474 (99.5%) | 13 (0.5%) |
| 19 to 25 Years | 929 (95.5%) | 44 (4.5%) |
| 26 to 34 Years | 506 (97.1%) | 15 (2.9%) |
| 35 to 44 Years | 2,008 (96.1%) | 82 (3.9%) |
| 45 to 54 Years | 2,420 (99.4%) | 14 (0.6%) |
| 55 to 64 Years | 1,645 (100.0%) | 0 (0.0%) |
| 65 to 74 Years | 875 (100.0%) | 0 (0.0%) |
| 75 Years and older | 393 (100.0%) | 0 (0.0%) |
| Total | 12,216 (98.6%) | 168 (1.4%) |
Health Insurance Coverage by Citizenship Status in Brock Hall
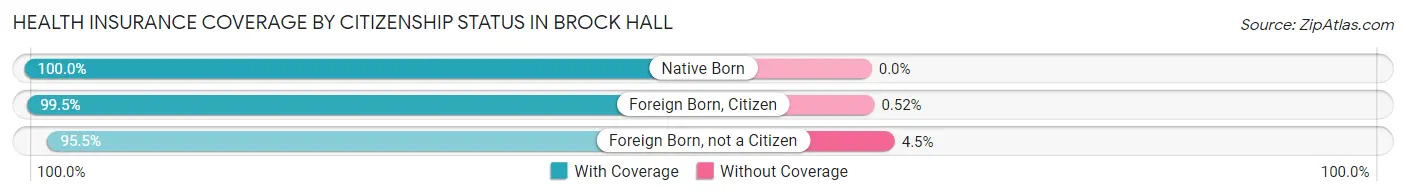
| Citizenship Status | With Coverage | Without Coverage |
| Native Born | 966 (100.0%) | 0 (0.0%) |
| Foreign Born, Citizen | 2,474 (99.5%) | 13 (0.5%) |
| Foreign Born, not a Citizen | 929 (95.5%) | 44 (4.5%) |
Health Insurance Coverage by Household Income in Brock Hall
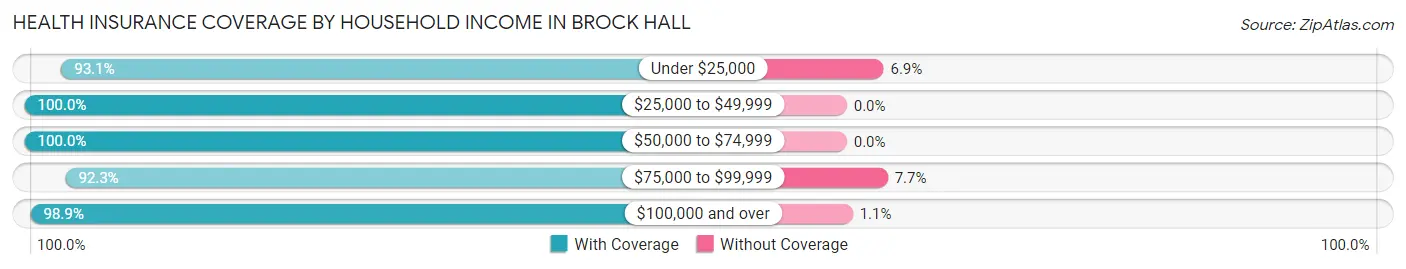
| Household Income | With Coverage | Without Coverage |
| Under $25,000 | 176 (93.1%) | 13 (6.9%) |
| $25,000 to $49,999 | 602 (100.0%) | 0 (0.0%) |
| $50,000 to $74,999 | 335 (100.0%) | 0 (0.0%) |
| $75,000 to $99,999 | 422 (92.3%) | 35 (7.7%) |
| $100,000 and over | 10,681 (98.9%) | 120 (1.1%) |
Public vs Private Health Insurance Coverage by Age in Brock Hall
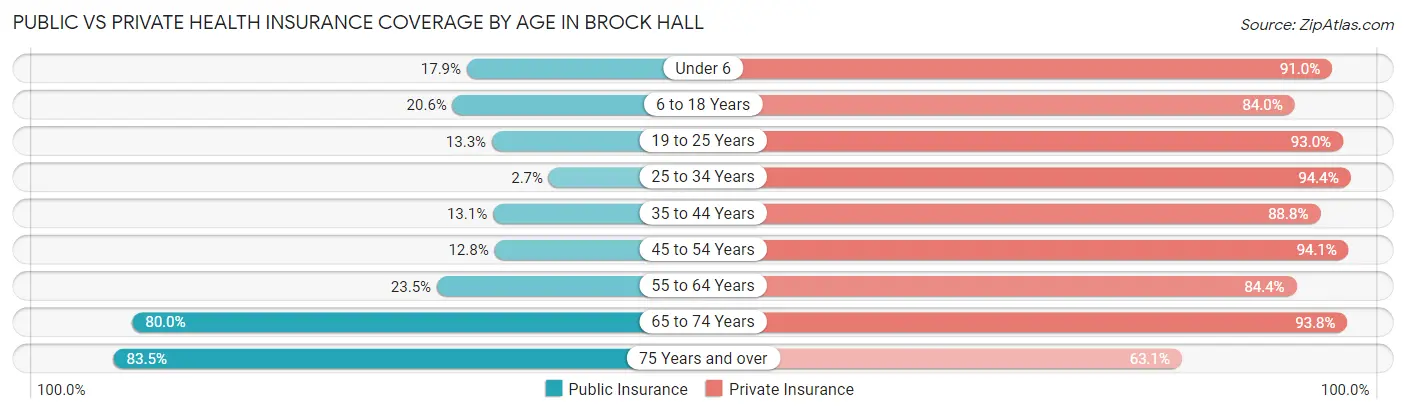
| Age Bracket | Public Insurance | Private Insurance |
| Under 6 | 173 (17.9%) | 879 (91.0%) |
| 6 to 18 Years | 511 (20.5%) | 2,090 (84.0%) |
| 19 to 25 Years | 129 (13.3%) | 905 (93.0%) |
| 25 to 34 Years | 14 (2.7%) | 492 (94.4%) |
| 35 to 44 Years | 273 (13.1%) | 1,856 (88.8%) |
| 45 to 54 Years | 311 (12.8%) | 2,290 (94.1%) |
| 55 to 64 Years | 386 (23.5%) | 1,388 (84.4%) |
| 65 to 74 Years | 700 (80.0%) | 821 (93.8%) |
| 75 Years and over | 328 (83.5%) | 248 (63.1%) |
| Total | 2,825 (22.8%) | 10,969 (88.6%) |
Disability Status by Sex by Age in Brock Hall
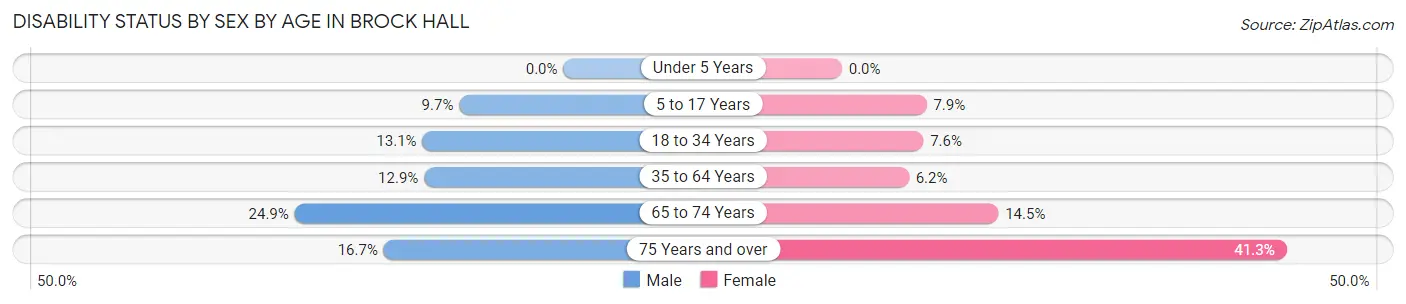
| Age Bracket | Male | Female |
| Under 5 Years | 0 (0.0%) | 0 (0.0%) |
| 5 to 17 Years | 111 (9.7%) | 109 (7.9%) |
| 18 to 34 Years | 108 (13.1%) | 54 (7.6%) |
| 35 to 64 Years | 360 (12.9%) | 210 (6.2%) |
| 65 to 74 Years | 110 (24.9%) | 63 (14.5%) |
| 75 Years and over | 34 (16.7%) | 78 (41.3%) |
Disability Class by Sex by Age in Brock Hall
Disability Class: Hearing Difficulty
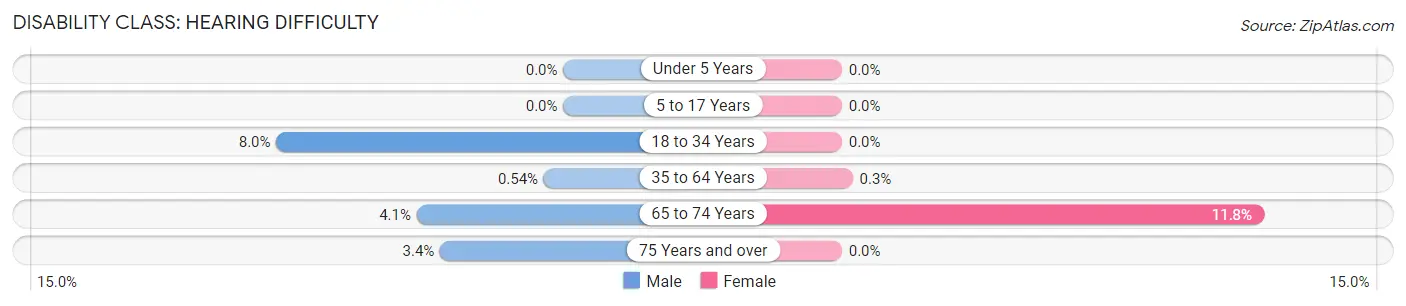
| Age Bracket | Male | Female |
| Under 5 Years | 0 (0.0%) | 0 (0.0%) |
| 5 to 17 Years | 0 (0.0%) | 0 (0.0%) |
| 18 to 34 Years | 66 (8.0%) | 0 (0.0%) |
| 35 to 64 Years | 15 (0.5%) | 10 (0.3%) |
| 65 to 74 Years | 18 (4.1%) | 51 (11.7%) |
| 75 Years and over | 7 (3.4%) | 0 (0.0%) |
Disability Class: Vision Difficulty
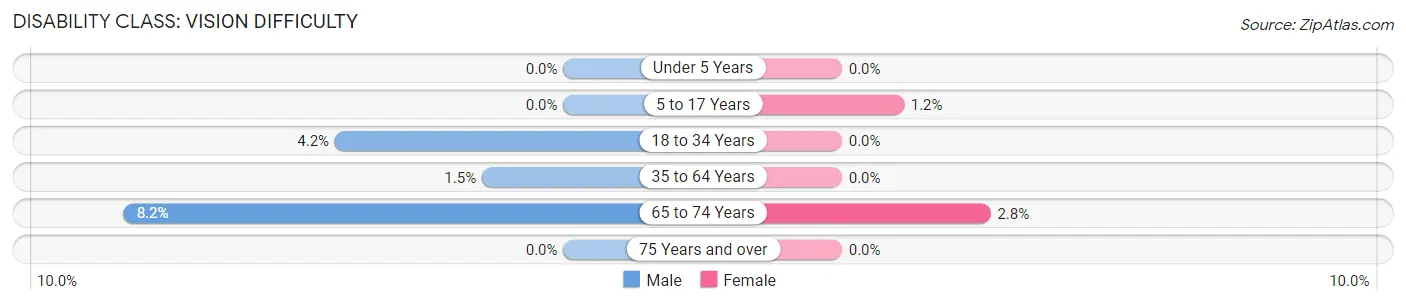
| Age Bracket | Male | Female |
| Under 5 Years | 0 (0.0%) | 0 (0.0%) |
| 5 to 17 Years | 0 (0.0%) | 16 (1.1%) |
| 18 to 34 Years | 35 (4.2%) | 0 (0.0%) |
| 35 to 64 Years | 42 (1.5%) | 0 (0.0%) |
| 65 to 74 Years | 36 (8.2%) | 12 (2.8%) |
| 75 Years and over | 0 (0.0%) | 0 (0.0%) |
Disability Class: Cognitive Difficulty
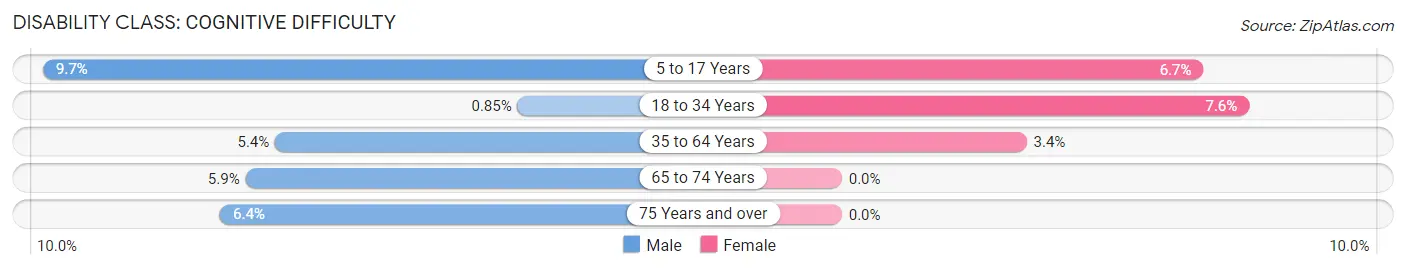
| Age Bracket | Male | Female |
| 5 to 17 Years | 111 (9.7%) | 93 (6.7%) |
| 18 to 34 Years | 7 (0.9%) | 54 (7.6%) |
| 35 to 64 Years | 149 (5.3%) | 116 (3.4%) |
| 65 to 74 Years | 26 (5.9%) | 0 (0.0%) |
| 75 Years and over | 13 (6.4%) | 0 (0.0%) |
Disability Class: Ambulatory Difficulty
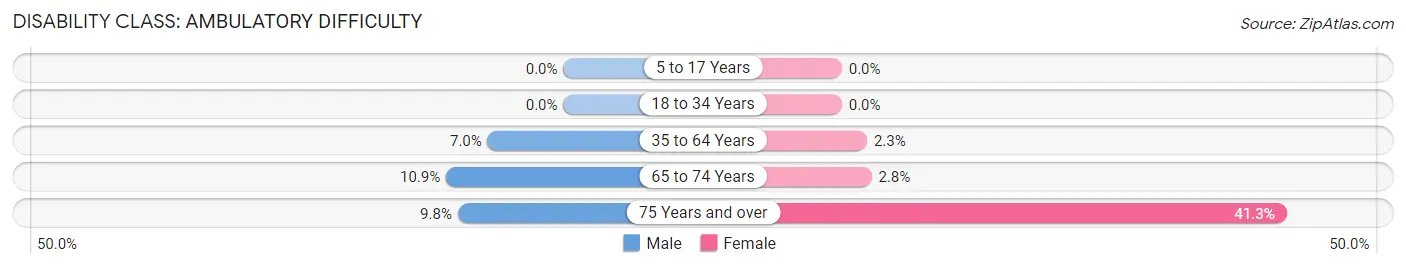
| Age Bracket | Male | Female |
| 5 to 17 Years | 0 (0.0%) | 0 (0.0%) |
| 18 to 34 Years | 0 (0.0%) | 0 (0.0%) |
| 35 to 64 Years | 196 (7.0%) | 79 (2.3%) |
| 65 to 74 Years | 48 (10.9%) | 12 (2.8%) |
| 75 Years and over | 20 (9.8%) | 78 (41.3%) |
Disability Class: Self-Care Difficulty
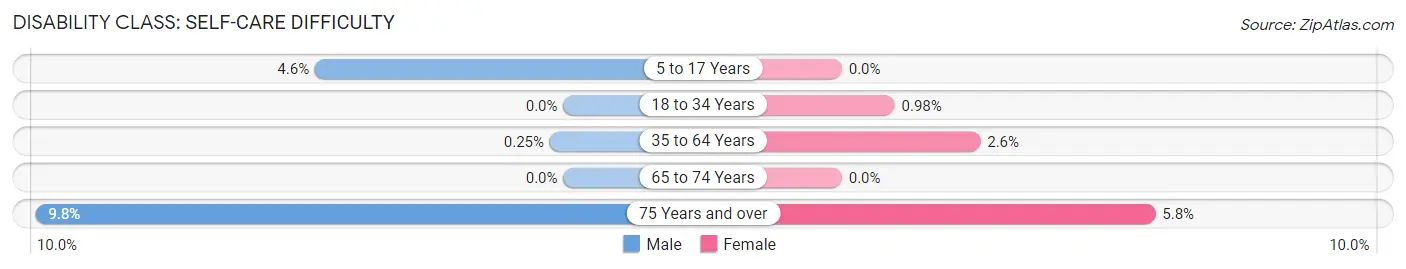
| Age Bracket | Male | Female |
| 5 to 17 Years | 53 (4.6%) | 0 (0.0%) |
| 18 to 34 Years | 0 (0.0%) | 7 (1.0%) |
| 35 to 64 Years | 7 (0.3%) | 87 (2.6%) |
| 65 to 74 Years | 0 (0.0%) | 0 (0.0%) |
| 75 Years and over | 20 (9.8%) | 11 (5.8%) |
Technology Access in Brock Hall
Computing Device Access in Brock Hall
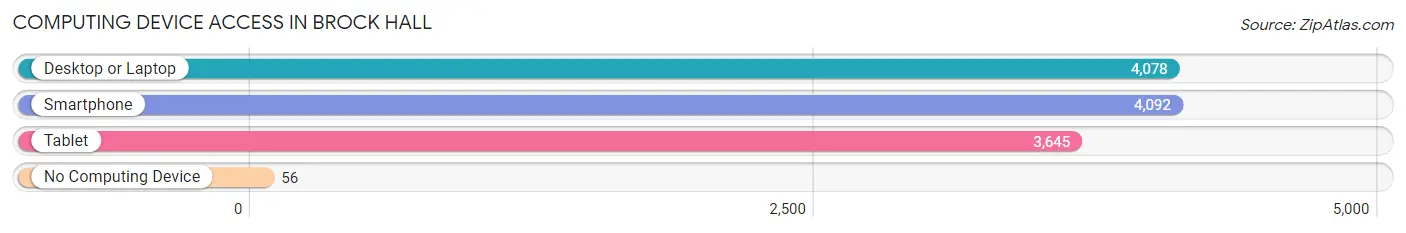
| Device Type | # Households | % Households |
| Desktop or Laptop | 4,078 | 97.1% |
| Smartphone | 4,092 | 97.4% |
| Tablet | 3,645 | 86.8% |
| No Computing Device | 56 | 1.3% |
| Total | 4,201 | 100.0% |
Internet Access in Brock Hall
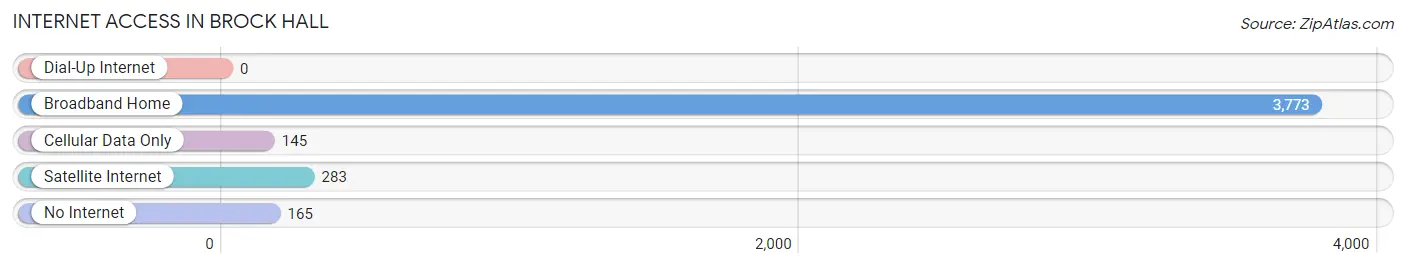
| Internet Type | # Households | % Households |
| Dial-Up Internet | 0 | 0.0% |
| Broadband Home | 3,773 | 89.8% |
| Cellular Data Only | 145 | 3.5% |
| Satellite Internet | 283 | 6.7% |
| No Internet | 165 | 3.9% |
| Total | 4,201 | 100.0% |
Brock Hall Summary
Brock Hall is a census-designated place (CDP) located in Prince George's County, Maryland, United States. As of the 2010 census, the population of Brock Hall was 8,945.
History
Brock Hall was first settled in the late 1700s by a group of German immigrants. The area was originally known as “Brock’s Hall” after the family that owned the land. The area was primarily used for farming until the 1950s when it began to be developed into a residential community. The area was officially designated as a CDP in 1980.
Geography
Brock Hall is located at 38°48'45"N 76°50'45"W (38.812500, -76.845556). It is situated in the northern part of Prince George's County, approximately 15 miles east of Washington, D.C. The CDP has a total area of 4.2 square miles, all of which is land.
Economy
Brock Hall is primarily a residential community, with most of its residents commuting to nearby cities for work. The area is home to several small businesses, including a grocery store, a gas station, and a few restaurants.
Demographics
As of the 2010 census, there were 8,945 people, 3,093 households, and 2,521 families residing in the CDP. The population density was 2,133.3 people per square mile. The racial makeup of the CDP was 57.2% White, 33.3% African American, 0.3% Native American, 3.2% Asian, 0.1% Pacific Islander, 3.2% from other races, and 2.7% from two or more races. Hispanic or Latino of any race were 8.2% of the population.
The median income for a household in the CDP was $87,917, and the median income for a family was $97,917. The per capita income for the CDP was $35,917. About 4.2% of families and 5.3% of the population were below the poverty line, including 6.2% of those under age 18 and 4.2% of those age 65 or over.
Common Questions
What is Per Capita Income in Brock Hall?
Per Capita income in Brock Hall is $66,958.
What is the Median Family Income in Brock Hall?
Median Family Income in Brock Hall is $193,864.
What is the Median Household income in Brock Hall?
Median Household Income in Brock Hall is $188,096.
What is Income or Wage Gap in Brock Hall?
Income or Wage Gap in Brock Hall is 0.2%.
Women in Brock Hall earn 99.8 cents for every dollar earned by a man.
What is Family Income Deficit in Brock Hall?
Family Income Deficit in Brock Hall is $10,199.
Families that are below poverty line in Brock Hall earn $10,199 less on average than the poverty threshold level.
What is Inequality or Gini Index in Brock Hall?
Inequality or Gini Index in Brock Hall is 0.29.
What is the Total Population of Brock Hall?
Total Population of Brock Hall is 12,529.
What is the Total Male Population of Brock Hall?
Total Male Population of Brock Hall is 6,133.
What is the Total Female Population of Brock Hall?
Total Female Population of Brock Hall is 6,396.
What is the Ratio of Males per 100 Females in Brock Hall?
There are 95.89 Males per 100 Females in Brock Hall.
What is the Ratio of Females per 100 Males in Brock Hall?
There are 104.29 Females per 100 Males in Brock Hall.
What is the Median Population Age in Brock Hall?
Median Population Age in Brock Hall is 40.9 Years.
What is the Average Family Size in Brock Hall
Average Family Size in Brock Hall is 3.4 People.
What is the Average Household Size in Brock Hall
Average Household Size in Brock Hall is 3.0 People.
How Large is the Labor Force in Brock Hall?
There are 7,322 People in the Labor Forcein in Brock Hall.
What is the Percentage of People in the Labor Force in Brock Hall?
76.9% of People are in the Labor Force in Brock Hall.
What is the Unemployment Rate in Brock Hall?
Unemployment Rate in Brock Hall is 7.7%.