Washington Grove, MD Map & Demographics
Washington Grove Map
Washington Grove Overview
$78,629
PER CAPITA INCOME
$198,750
AVG FAMILY INCOME
$131,528
AVG HOUSEHOLD INCOME
27.8%
WAGE / INCOME GAP [ % ]
72.2¢/ $1
WAGE / INCOME GAP [ $ ]
0.29
INEQUALITY / GINI INDEX
604
TOTAL POPULATION
353
MALE POPULATION
251
FEMALE POPULATION
140.64
MALES / 100 FEMALES
71.10
FEMALES / 100 MALES
58.1
MEDIAN AGE
3.1
AVG FAMILY SIZE
2.1
AVG HOUSEHOLD SIZE
388
LABOR FORCE [ PEOPLE ]
70.2%
PERCENT IN LABOR FORCE
2.6%
UNEMPLOYMENT RATE
Washington Grove Zip Codes
Washington Grove Area Codes
Income in Washington Grove
Income Overview in Washington Grove
Per Capita Income in Washington Grove is $78,629, while median incomes of families and households are $198,750 and $131,528 respectively.
| Characteristic | Number | Measure |
| Per Capita Income | 604 | $78,629 |
| Median Family Income | 140 | $198,750 |
| Mean Family Income | 140 | $194,168 |
| Median Household Income | 285 | $131,528 |
| Mean Household Income | 285 | $154,849 |
| Income Deficit | 140 | $0 |
| Wage / Income Gap (%) | 604 | 27.85% |
| Wage / Income Gap ($) | 604 | 72.15¢ per $1 |
| Gini / Inequality Index | 604 | 0.29 |
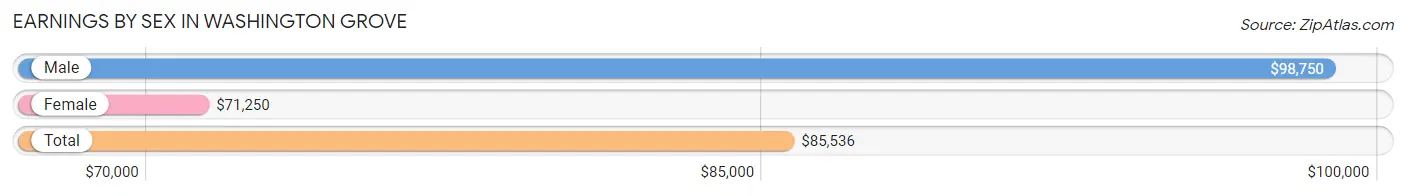
Earnings by Sex in Washington Grove
Average Earnings in Washington Grove are $85,536, $98,750 for men and $71,250 for women, a difference of 27.9%.
| Sex | Number | Average Earnings |
| Male | 255 (62.0%) | $98,750 |
| Female | 156 (38.0%) | $71,250 |
| Total | 411 (100.0%) | $85,536 |
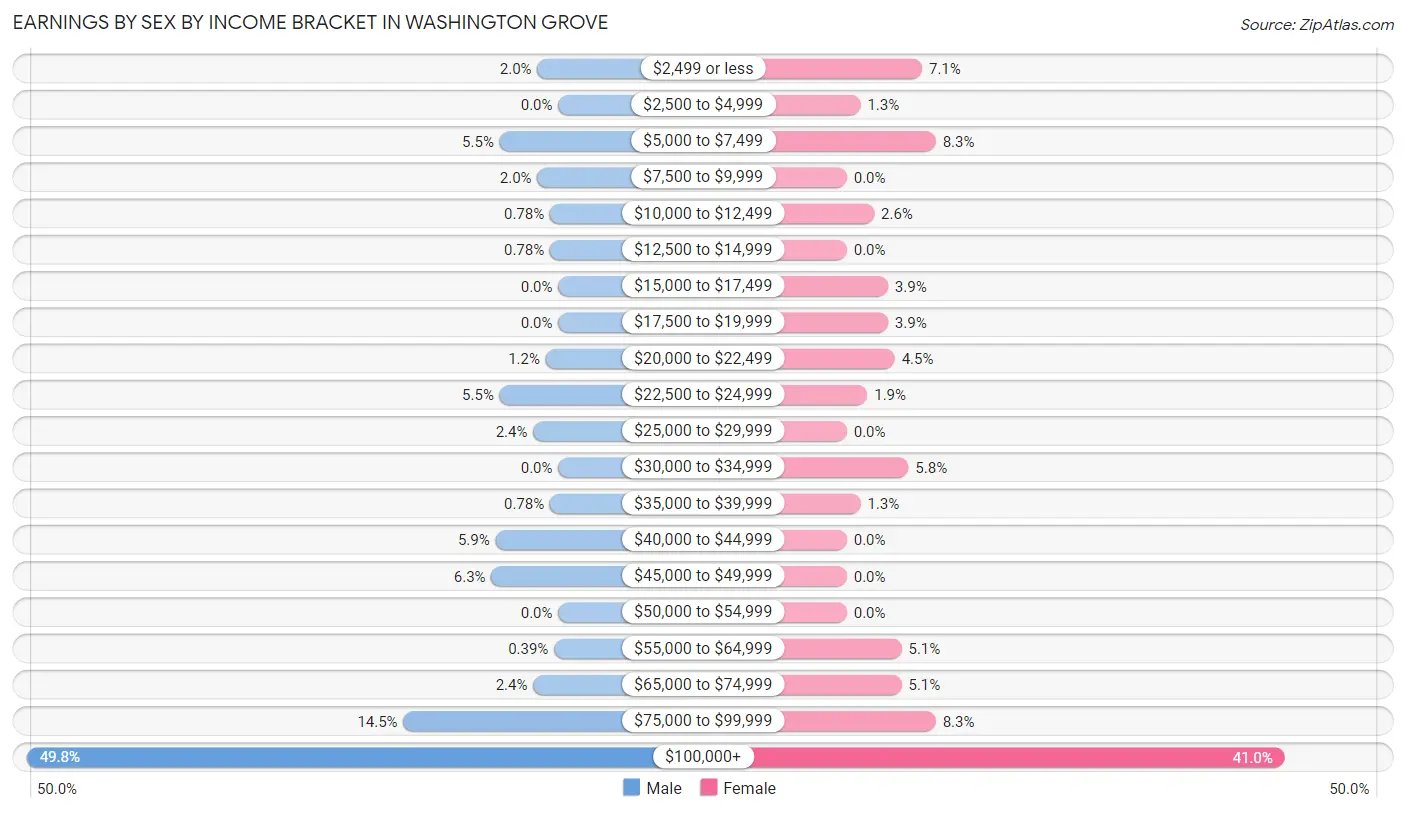
Earnings by Sex by Income Bracket in Washington Grove
The most common earnings brackets in Washington Grove are $100,000+ for men (127 | 49.8%) and $100,000+ for women (64 | 41.0%).
| Income | Male | Female |
| $2,499 or less | 5 (2.0%) | 11 (7.0%) |
| $2,500 to $4,999 | 0 (0.0%) | 2 (1.3%) |
| $5,000 to $7,499 | 14 (5.5%) | 13 (8.3%) |
| $7,500 to $9,999 | 5 (2.0%) | 0 (0.0%) |
| $10,000 to $12,499 | 2 (0.8%) | 4 (2.6%) |
| $12,500 to $14,999 | 2 (0.8%) | 0 (0.0%) |
| $15,000 to $17,499 | 0 (0.0%) | 6 (3.8%) |
| $17,500 to $19,999 | 0 (0.0%) | 6 (3.8%) |
| $20,000 to $22,499 | 3 (1.2%) | 7 (4.5%) |
| $22,500 to $24,999 | 14 (5.5%) | 3 (1.9%) |
| $25,000 to $29,999 | 6 (2.4%) | 0 (0.0%) |
| $30,000 to $34,999 | 0 (0.0%) | 9 (5.8%) |
| $35,000 to $39,999 | 2 (0.8%) | 2 (1.3%) |
| $40,000 to $44,999 | 15 (5.9%) | 0 (0.0%) |
| $45,000 to $49,999 | 16 (6.3%) | 0 (0.0%) |
| $50,000 to $54,999 | 0 (0.0%) | 0 (0.0%) |
| $55,000 to $64,999 | 1 (0.4%) | 8 (5.1%) |
| $65,000 to $74,999 | 6 (2.4%) | 8 (5.1%) |
| $75,000 to $99,999 | 37 (14.5%) | 13 (8.3%) |
| $100,000+ | 127 (49.8%) | 64 (41.0%) |
| Total | 255 (100.0%) | 156 (100.0%) |
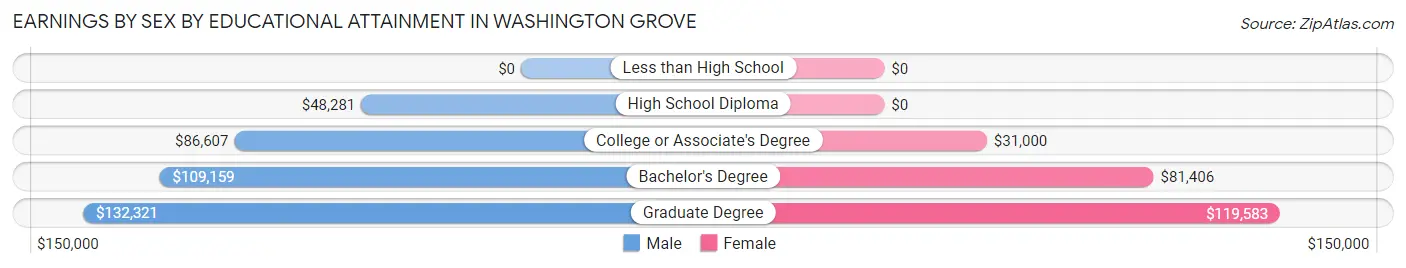
Earnings by Sex by Educational Attainment in Washington Grove
Average earnings in Washington Grove are $107,596 for men and $81,719 for women, a difference of 24.0%. Men with an educational attainment of graduate degree enjoy the highest average annual earnings of $132,321, while those with high school diploma education earn the least with $48,281. Women with an educational attainment of graduate degree earn the most with the average annual earnings of $119,583, while those with college or associate's degree education have the smallest earnings of $31,000.
| Educational Attainment | Male Income | Female Income |
| Less than High School | - | - |
| High School Diploma | $48,281 | $0 |
| College or Associate's Degree | $86,607 | $31,000 |
| Bachelor's Degree | $109,159 | $81,406 |
| Graduate Degree | $132,321 | $119,583 |
| Total | $107,596 | $81,719 |
Family Income in Washington Grove
Family Income Brackets in Washington Grove
According to the Washington Grove family income data, there are 70 families falling into the $200,000+ income range, which is the most common income bracket and makes up 50.0% of all families.
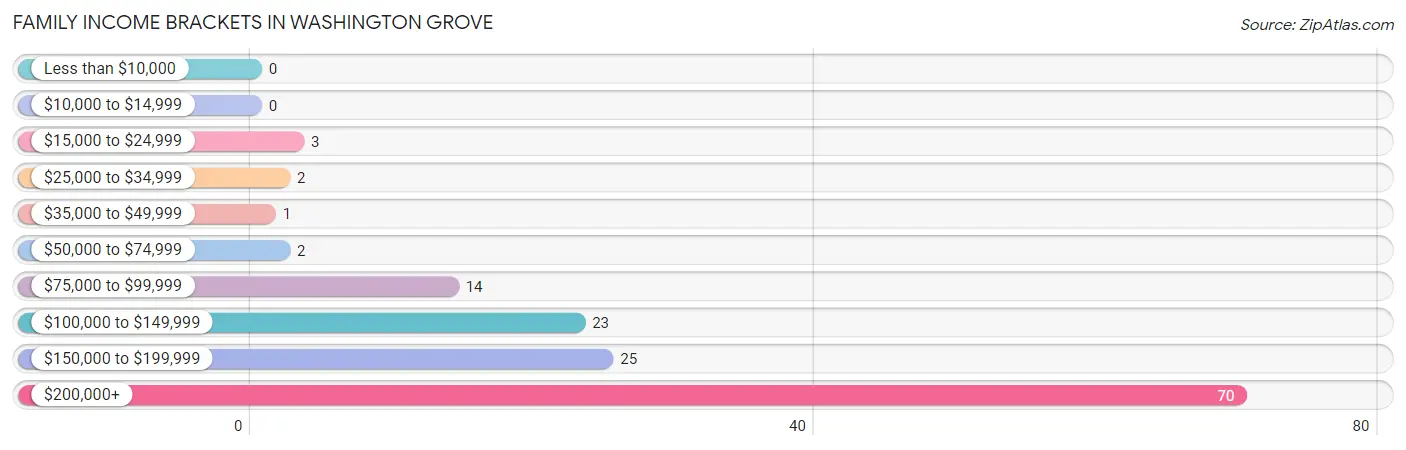
| Income Bracket | # Families | % Families |
| Less than $10,000 | 0 | 0.0% |
| $10,000 to $14,999 | 0 | 0.0% |
| $15,000 to $24,999 | 3 | 2.1% |
| $25,000 to $34,999 | 2 | 1.4% |
| $35,000 to $49,999 | 1 | 0.7% |
| $50,000 to $74,999 | 2 | 1.4% |
| $75,000 to $99,999 | 14 | 10.0% |
| $100,000 to $149,999 | 23 | 16.4% |
| $150,000 to $199,999 | 25 | 17.9% |
| $200,000+ | 70 | 50.0% |
Family Income by Famaliy Size in Washington Grove
4-person families (27 | 19.3%) account for the highest median family income in Washington Grove with $228,977 per family, while 2-person families (72 | 51.4%) have the highest median income of $93,334 per family member.
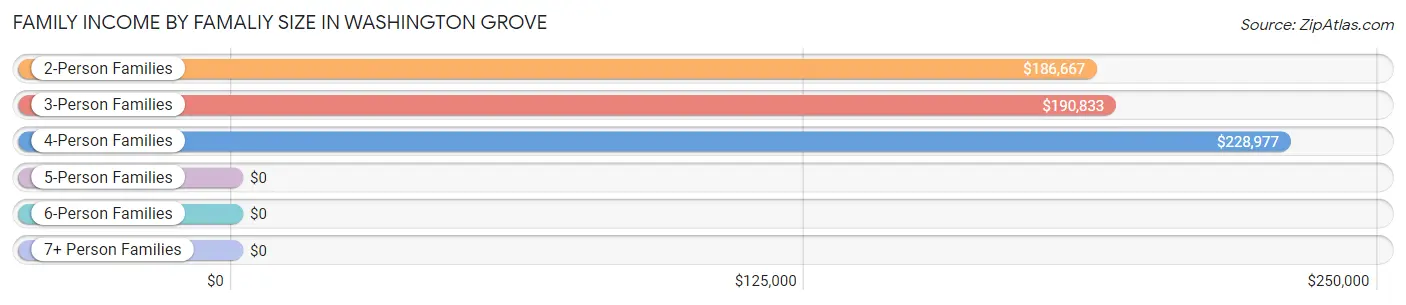
| Income Bracket | # Families | Median Income |
| 2-Person Families | 72 (51.4%) | $186,667 |
| 3-Person Families | 22 (15.7%) | $190,833 |
| 4-Person Families | 27 (19.3%) | $228,977 |
| 5-Person Families | 11 (7.9%) | $0 |
| 6-Person Families | 8 (5.7%) | $0 |
| 7+ Person Families | 0 (0.0%) | $0 |
| Total | 140 (100.0%) | $198,750 |
Family Income by Number of Earners in Washington Grove
The median family income in Washington Grove is $198,750, with families comprising 2 earners (51) having the highest median family income of $231,094, while families with no earners (16) have the lowest median family income of $94,375, accounting for 36.4% and 11.4% of families, respectively.
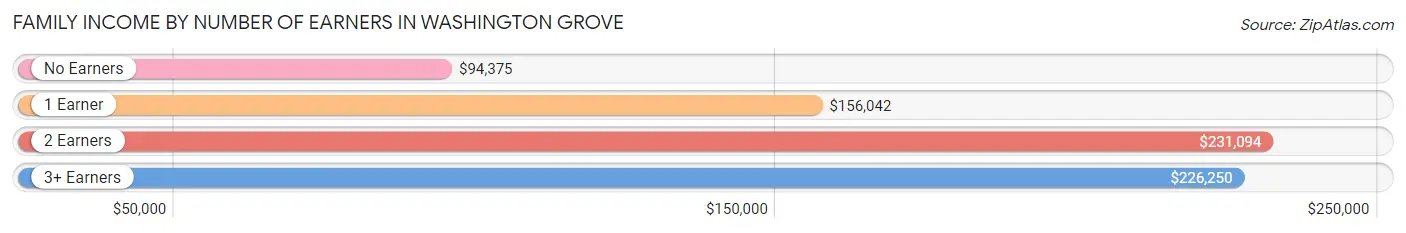
| Number of Earners | # Families | Median Income |
| No Earners | 16 (11.4%) | $94,375 |
| 1 Earner | 37 (26.4%) | $156,042 |
| 2 Earners | 51 (36.4%) | $231,094 |
| 3+ Earners | 36 (25.7%) | $226,250 |
| Total | 140 (100.0%) | $198,750 |
Household Income in Washington Grove
Household Income Brackets in Washington Grove
With 92 households falling in the category, the $100,000 to $149,999 income range is the most frequent in Washington Grove, accounting for 32.3% of all households.
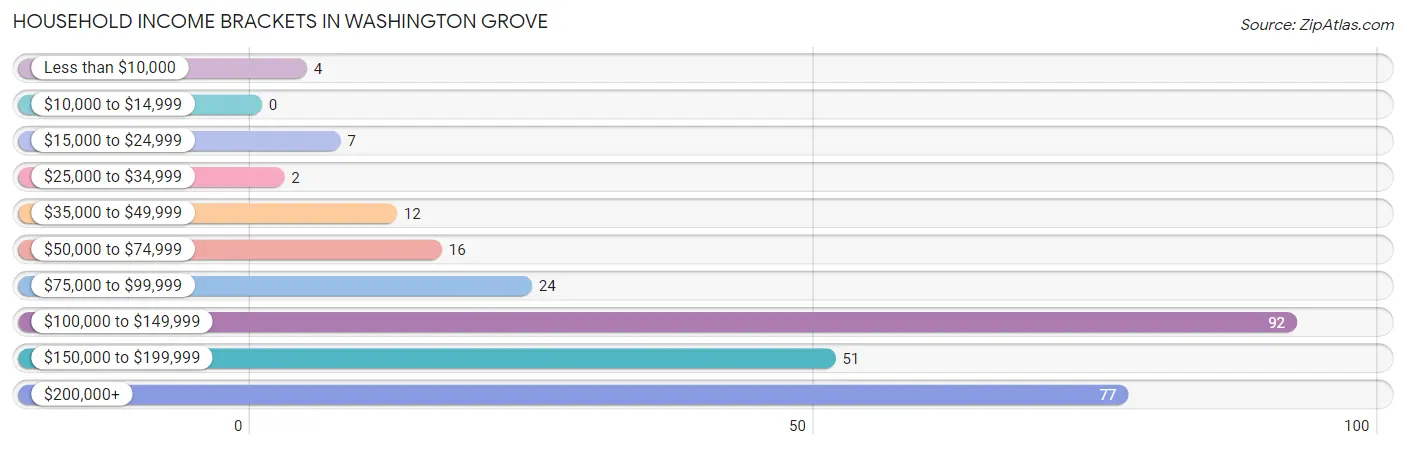
| Income Bracket | # Households | % Households |
| Less than $10,000 | 4 | 1.4% |
| $10,000 to $14,999 | 0 | 0.0% |
| $15,000 to $24,999 | 7 | 2.5% |
| $25,000 to $34,999 | 2 | 0.7% |
| $35,000 to $49,999 | 12 | 4.2% |
| $50,000 to $74,999 | 16 | 5.6% |
| $75,000 to $99,999 | 24 | 8.4% |
| $100,000 to $149,999 | 92 | 32.3% |
| $150,000 to $199,999 | 51 | 17.9% |
| $200,000+ | 77 | 27.0% |
Household Income by Householder Age in Washington Grove
The median household income in Washington Grove is $131,528, with the highest median household income of $218,125 found in the 25 to 44 years age bracket for the primary householder. A total of 47 households (16.5%) fall into this category.

| Income Bracket | # Households | Median Income |
| 15 to 24 Years | 0 (0.0%) | $0 |
| 25 to 44 Years | 47 (16.5%) | $218,125 |
| 45 to 64 Years | 122 (42.8%) | $109,818 |
| 65+ Years | 116 (40.7%) | $122,500 |
| Total | 285 (100.0%) | $131,528 |
Poverty in Washington Grove
Income Below Poverty by Sex and Age in Washington Grove
With 3.1% poverty level for males and 3.6% for females among the residents of Washington Grove, 25 to 34 year old males and 25 to 34 year old females are the most vulnerable to poverty, with 3 males (13.0%) and 2 females (14.3%) in their respective age groups living below the poverty level.
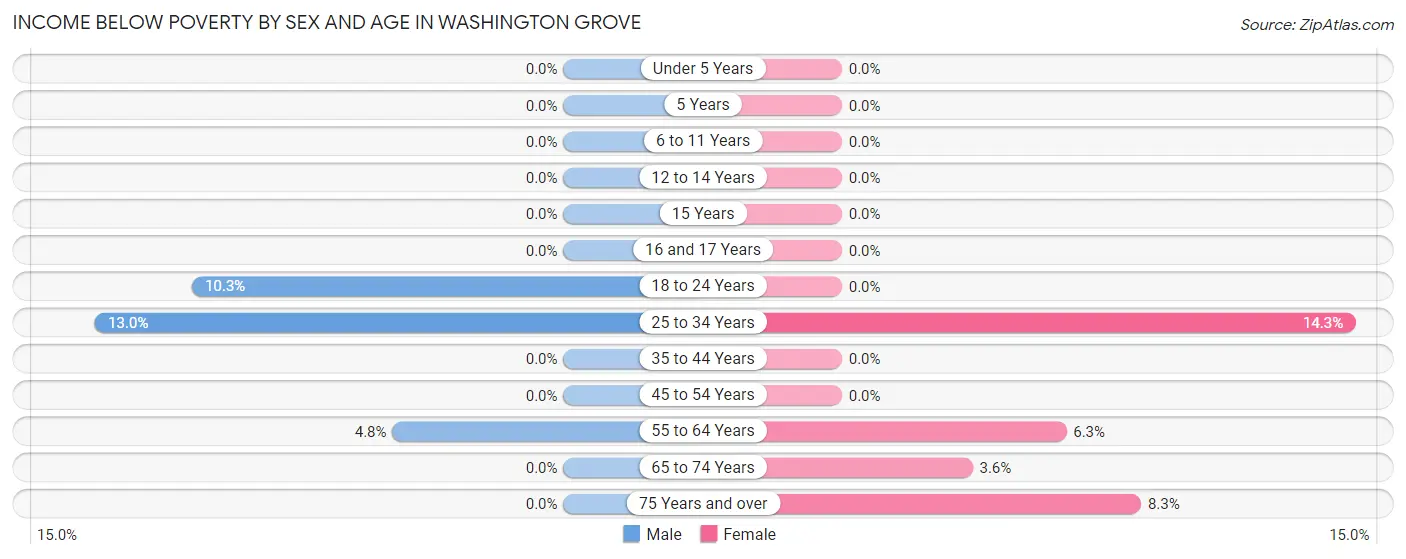
| Age Bracket | Male | Female |
| Under 5 Years | 0 (0.0%) | 0 (0.0%) |
| 5 Years | 0 (0.0%) | 0 (0.0%) |
| 6 to 11 Years | 0 (0.0%) | 0 (0.0%) |
| 12 to 14 Years | 0 (0.0%) | 0 (0.0%) |
| 15 Years | 0 (0.0%) | 0 (0.0%) |
| 16 and 17 Years | 0 (0.0%) | 0 (0.0%) |
| 18 to 24 Years | 3 (10.3%) | 0 (0.0%) |
| 25 to 34 Years | 3 (13.0%) | 2 (14.3%) |
| 35 to 44 Years | 0 (0.0%) | 0 (0.0%) |
| 45 to 54 Years | 0 (0.0%) | 0 (0.0%) |
| 55 to 64 Years | 5 (4.8%) | 3 (6.2%) |
| 65 to 74 Years | 0 (0.0%) | 2 (3.6%) |
| 75 Years and over | 0 (0.0%) | 2 (8.3%) |
| Total | 11 (3.1%) | 9 (3.6%) |
Income Above Poverty by Sex and Age in Washington Grove
According to the poverty statistics in Washington Grove, males aged under 5 years and females aged under 5 years are the age groups that are most secure financially, with 100.0% of males and 100.0% of females in these age groups living above the poverty line.
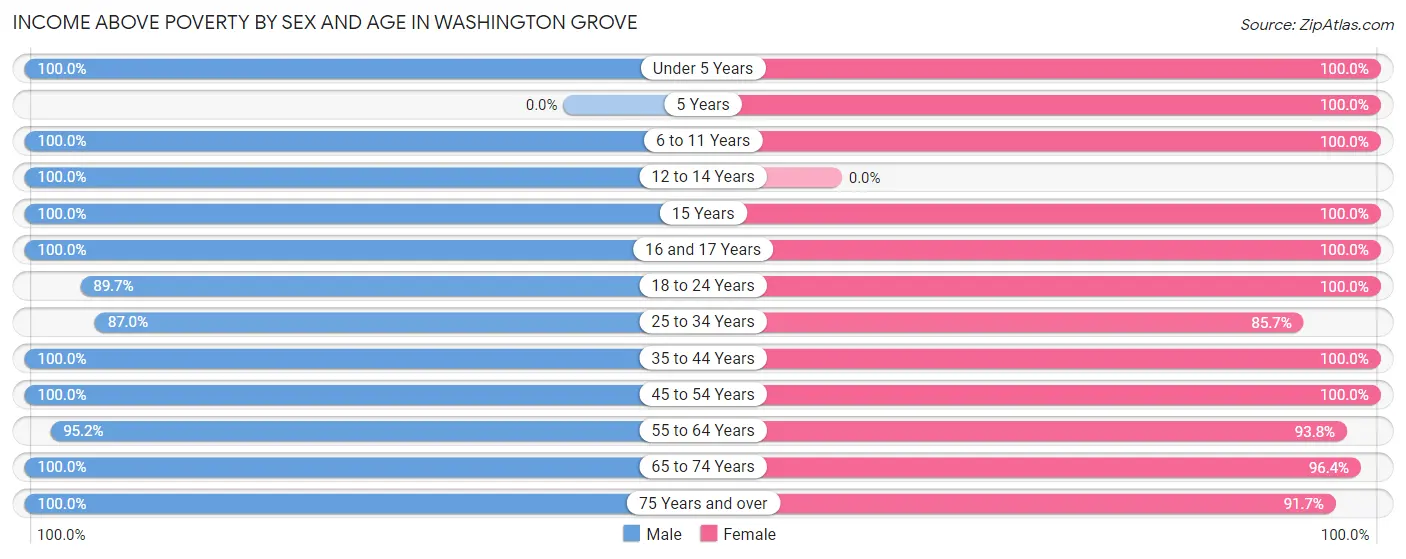
| Age Bracket | Male | Female |
| Under 5 Years | 8 (100.0%) | 13 (100.0%) |
| 5 Years | 0 (0.0%) | 6 (100.0%) |
| 6 to 11 Years | 12 (100.0%) | 6 (100.0%) |
| 12 to 14 Years | 1 (100.0%) | 0 (0.0%) |
| 15 Years | 2 (100.0%) | 3 (100.0%) |
| 16 and 17 Years | 2 (100.0%) | 9 (100.0%) |
| 18 to 24 Years | 26 (89.7%) | 14 (100.0%) |
| 25 to 34 Years | 20 (87.0%) | 12 (85.7%) |
| 35 to 44 Years | 47 (100.0%) | 35 (100.0%) |
| 45 to 54 Years | 20 (100.0%) | 24 (100.0%) |
| 55 to 64 Years | 100 (95.2%) | 45 (93.8%) |
| 65 to 74 Years | 79 (100.0%) | 53 (96.4%) |
| 75 Years and over | 25 (100.0%) | 22 (91.7%) |
| Total | 342 (96.9%) | 242 (96.4%) |
Income Below Poverty Among Married-Couple Families in Washington Grove
The poverty statistics for married-couple families in Washington Grove show that 2.6% or 3 of the total 115 families live below the poverty line. Families with no children have the highest poverty rate of 3.7%, comprising of 3 families. On the other hand, families with 1 or 2 children have the lowest poverty rate of 0.0%, which includes 0 families.
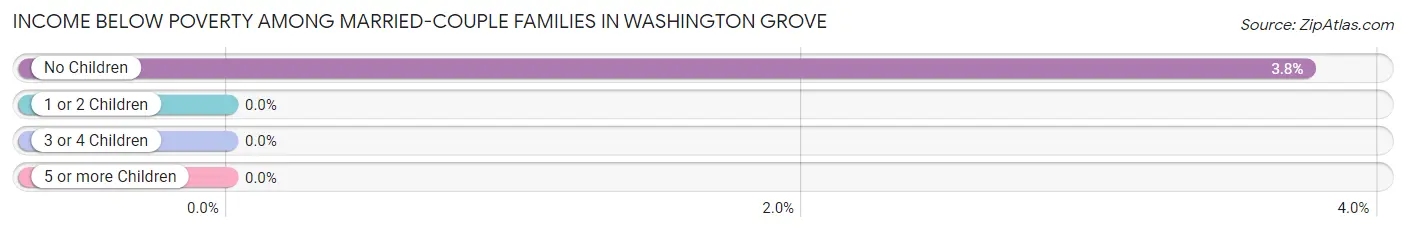
| Children | Above Poverty | Below Poverty |
| No Children | 77 (96.3%) | 3 (3.7%) |
| 1 or 2 Children | 28 (100.0%) | 0 (0.0%) |
| 3 or 4 Children | 7 (100.0%) | 0 (0.0%) |
| 5 or more Children | 0 (0.0%) | 0 (0.0%) |
| Total | 112 (97.4%) | 3 (2.6%) |
Income Below Poverty Among Single-Parent Households in Washington Grove
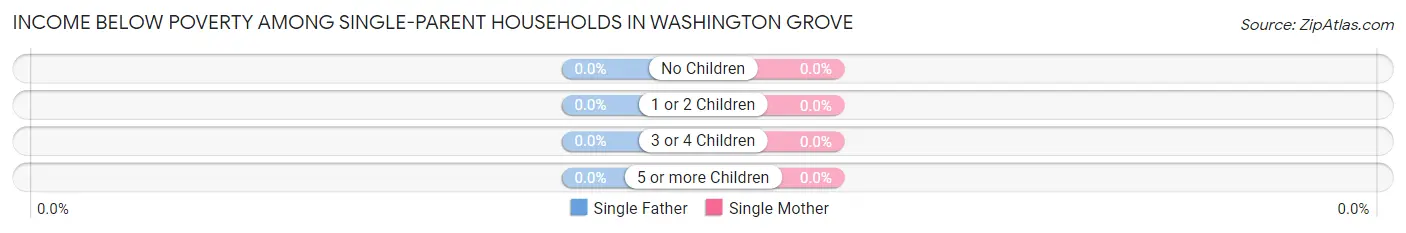
| Children | Single Father | Single Mother |
| No Children | 0 (0.0%) | 0 (0.0%) |
| 1 or 2 Children | 0 (0.0%) | 0 (0.0%) |
| 3 or 4 Children | 0 (0.0%) | 0 (0.0%) |
| 5 or more Children | 0 (0.0%) | 0 (0.0%) |
| Total | 0 (0.0%) | 0 (0.0%) |
Income Below Poverty Among Married-Couple vs Single-Parent Households in Washington Grove
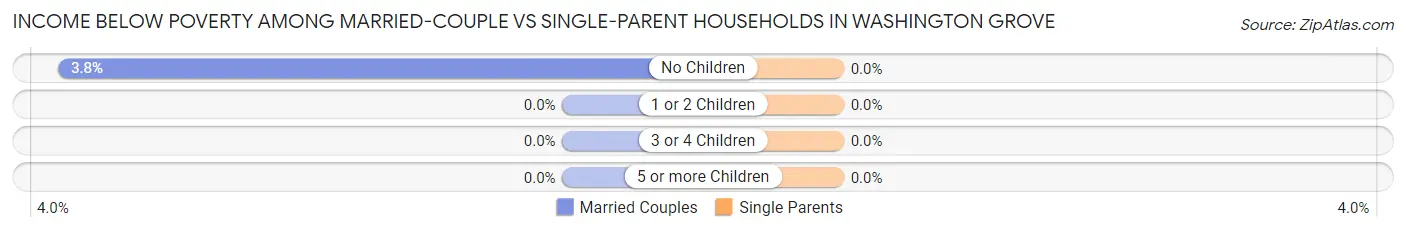
| Children | Married-Couple Families | Single-Parent Households |
| No Children | 3 (3.7%) | 0 (0.0%) |
| 1 or 2 Children | 0 (0.0%) | 0 (0.0%) |
| 3 or 4 Children | 0 (0.0%) | 0 (0.0%) |
| 5 or more Children | 0 (0.0%) | 0 (0.0%) |
| Total | 3 (2.6%) | 0 (0.0%) |
Race in Washington Grove
The most populous races in Washington Grove are White / Caucasian (467 | 77.3%), Black / African American (76 | 12.6%), and Hispanic or Latino (26 | 4.3%).
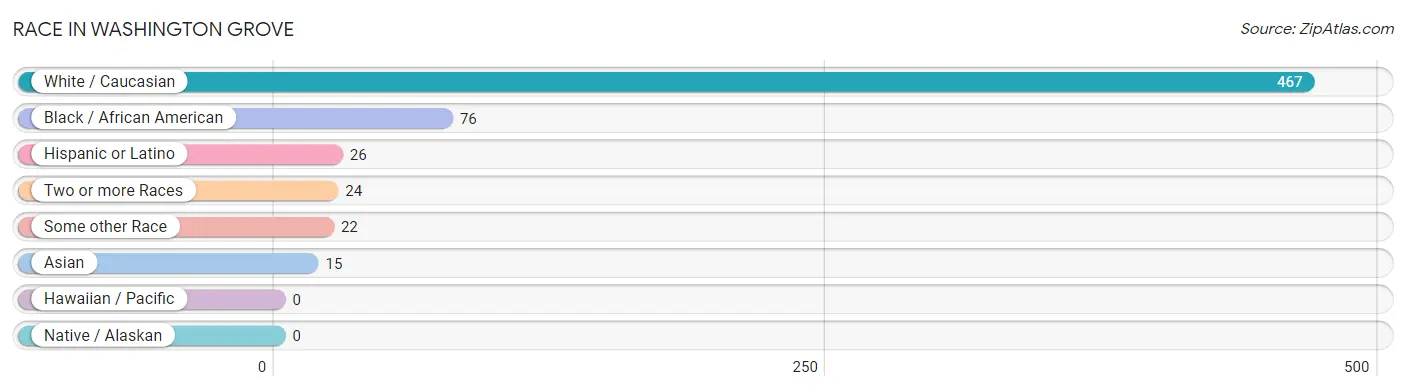
| Race | # Population | % Population |
| Asian | 15 | 2.5% |
| Black / African American | 76 | 12.6% |
| Hawaiian / Pacific | 0 | 0.0% |
| Hispanic or Latino | 26 | 4.3% |
| Native / Alaskan | 0 | 0.0% |
| White / Caucasian | 467 | 77.3% |
| Two or more Races | 24 | 4.0% |
| Some other Race | 22 | 3.6% |
| Total | 604 | 100.0% |
Ancestry in Washington Grove
The most populous ancestries reported in Washington Grove are German (90 | 14.9%), English (69 | 11.4%), Scottish (66 | 10.9%), Irish (56 | 9.3%), and Subsaharan African (42 | 7.0%), together accounting for 53.5% of all Washington Grove residents.
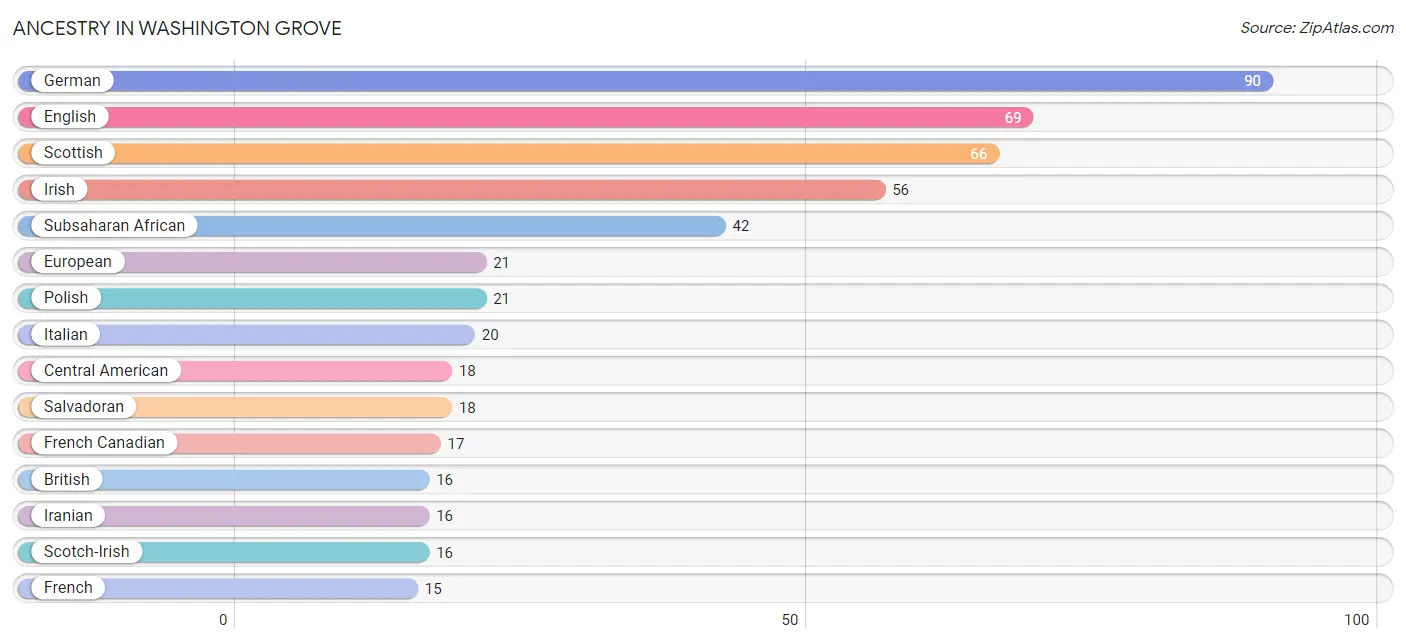
| Ancestry | # Population | % Population |
| African | 14 | 2.3% |
| American | 6 | 1.0% |
| Arab | 2 | 0.3% |
| Armenian | 6 | 1.0% |
| Bhutanese | 5 | 0.8% |
| British | 16 | 2.6% |
| Burmese | 5 | 0.8% |
| Central American | 18 | 3.0% |
| Chilean | 2 | 0.3% |
| Chippewa | 1 | 0.2% |
| Croatian | 4 | 0.7% |
| Czech | 3 | 0.5% |
| Danish | 5 | 0.8% |
| Dutch | 1 | 0.2% |
| Eastern European | 5 | 0.8% |
| English | 69 | 11.4% |
| European | 21 | 3.5% |
| French | 15 | 2.5% |
| French Canadian | 17 | 2.8% |
| German | 90 | 14.9% |
| Greek | 9 | 1.5% |
| Hungarian | 2 | 0.3% |
| Indian (Asian) | 7 | 1.2% |
| Iranian | 16 | 2.6% |
| Irish | 56 | 9.3% |
| Italian | 20 | 3.3% |
| Lithuanian | 10 | 1.7% |
| Mexican | 4 | 0.7% |
| Northern European | 5 | 0.8% |
| Norwegian | 5 | 0.8% |
| Palestinian | 2 | 0.3% |
| Polish | 21 | 3.5% |
| Russian | 7 | 1.2% |
| Salvadoran | 18 | 3.0% |
| Scotch-Irish | 16 | 2.6% |
| Scottish | 66 | 10.9% |
| South American | 2 | 0.3% |
| Spaniard | 2 | 0.3% |
| Subsaharan African | 42 | 7.0% |
| Swedish | 13 | 2.1% |
| Swiss | 5 | 0.8% |
| Ukrainian | 3 | 0.5% |
| Welsh | 2 | 0.3% | View All 43 Rows |
Immigrants in Washington Grove
The most numerous immigrant groups reported in Washington Grove came from Asia (29 | 4.8%), Africa (28 | 4.6%), Middle Africa (28 | 4.6%), Zaire (28 | 4.6%), and Iran (16 | 2.6%), together accounting for 21.4% of all Washington Grove residents.
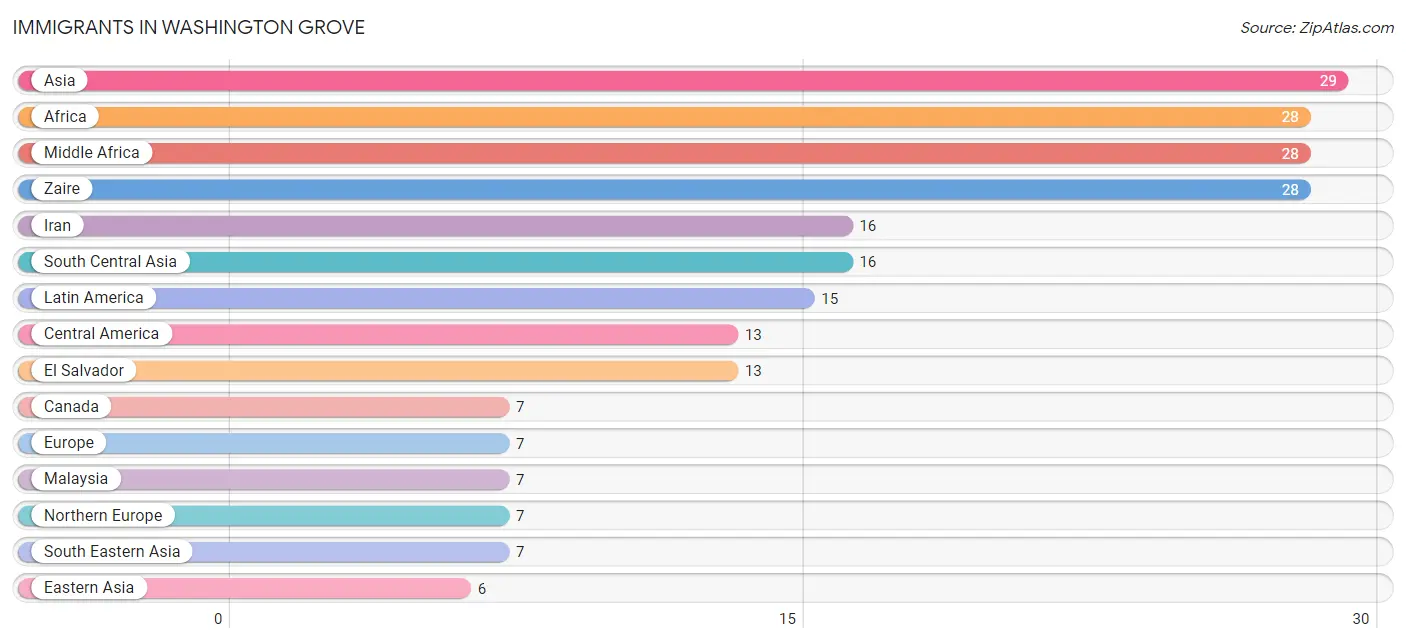
| Immigration Origin | # Population | % Population |
| Africa | 28 | 4.6% |
| Asia | 29 | 4.8% |
| Canada | 7 | 1.2% |
| Central America | 13 | 2.1% |
| Chile | 2 | 0.3% |
| Eastern Asia | 6 | 1.0% |
| El Salvador | 13 | 2.1% |
| Europe | 7 | 1.2% |
| Iran | 16 | 2.6% |
| Japan | 3 | 0.5% |
| Korea | 3 | 0.5% |
| Latin America | 15 | 2.5% |
| Malaysia | 7 | 1.2% |
| Middle Africa | 28 | 4.6% |
| Northern Europe | 7 | 1.2% |
| Scotland | 2 | 0.3% |
| South America | 2 | 0.3% |
| South Central Asia | 16 | 2.6% |
| South Eastern Asia | 7 | 1.2% |
| Zaire | 28 | 4.6% | View All 20 Rows |
Sex and Age in Washington Grove
Sex and Age in Washington Grove
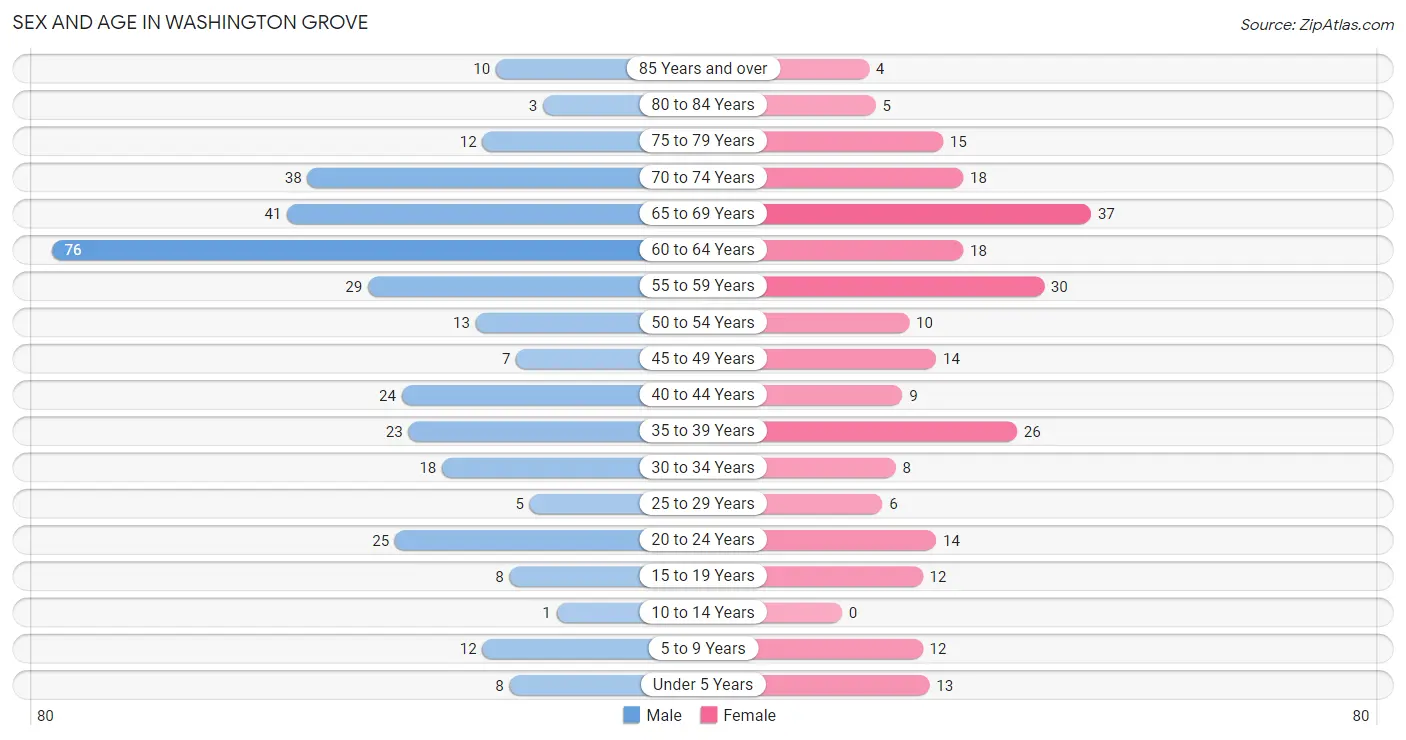
The most populous age groups in Washington Grove are 60 to 64 Years (76 | 21.5%) for men and 65 to 69 Years (37 | 14.7%) for women.
| Age Bracket | Male | Female |
| Under 5 Years | 8 (2.3%) | 13 (5.2%) |
| 5 to 9 Years | 12 (3.4%) | 12 (4.8%) |
| 10 to 14 Years | 1 (0.3%) | 0 (0.0%) |
| 15 to 19 Years | 8 (2.3%) | 12 (4.8%) |
| 20 to 24 Years | 25 (7.1%) | 14 (5.6%) |
| 25 to 29 Years | 5 (1.4%) | 6 (2.4%) |
| 30 to 34 Years | 18 (5.1%) | 8 (3.2%) |
| 35 to 39 Years | 23 (6.5%) | 26 (10.4%) |
| 40 to 44 Years | 24 (6.8%) | 9 (3.6%) |
| 45 to 49 Years | 7 (2.0%) | 14 (5.6%) |
| 50 to 54 Years | 13 (3.7%) | 10 (4.0%) |
| 55 to 59 Years | 29 (8.2%) | 30 (11.9%) |
| 60 to 64 Years | 76 (21.5%) | 18 (7.2%) |
| 65 to 69 Years | 41 (11.6%) | 37 (14.7%) |
| 70 to 74 Years | 38 (10.8%) | 18 (7.2%) |
| 75 to 79 Years | 12 (3.4%) | 15 (6.0%) |
| 80 to 84 Years | 3 (0.9%) | 5 (2.0%) |
| 85 Years and over | 10 (2.8%) | 4 (1.6%) |
| Total | 353 (100.0%) | 251 (100.0%) |
Families and Households in Washington Grove
Median Family Size in Washington Grove
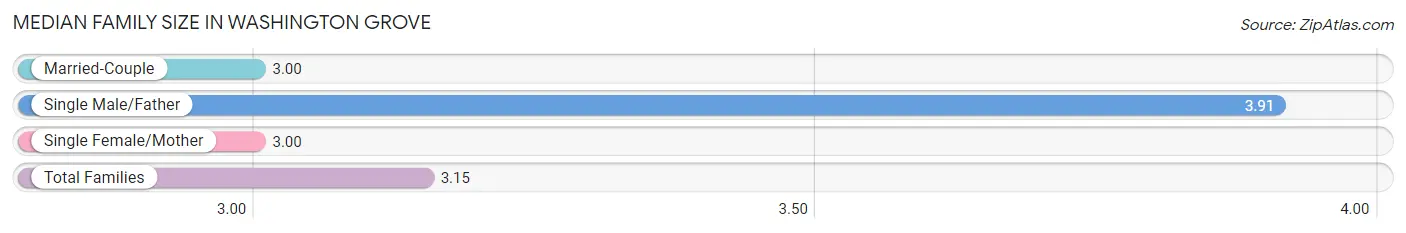
The median family size in Washington Grove is 3.15 persons per family, with single male/father families (23 | 16.4%) accounting for the largest median family size of 3.91 persons per family. On the other hand, married-couple families (115 | 82.1%) represent the smallest median family size with 3.00 persons per family.
| Family Type | # Families | Family Size |
| Married-Couple | 115 (82.1%) | 3.00 |
| Single Male/Father | 23 (16.4%) | 3.91 |
| Single Female/Mother | 2 (1.4%) | 3.00 |
| Total Families | 140 (100.0%) | 3.15 |
Median Household Size in Washington Grove
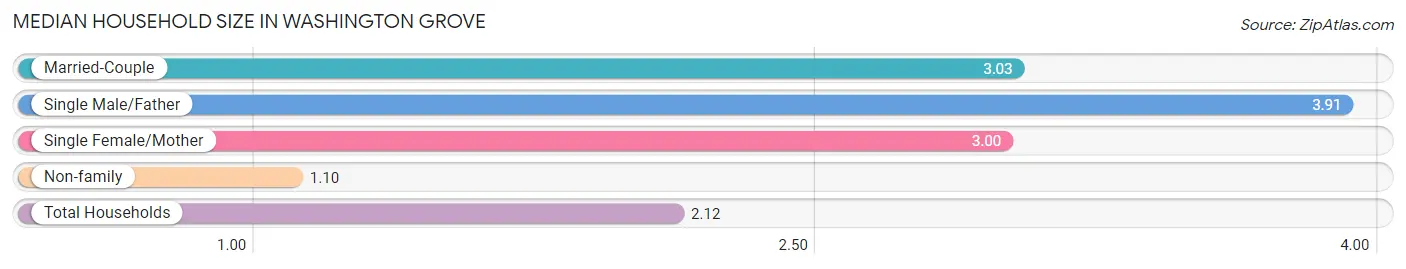
The median household size in Washington Grove is 2.12 persons per household, with single male/father households (23 | 8.1%) accounting for the largest median household size of 3.91 persons per household. non-family households (145 | 50.9%) represent the smallest median household size with 1.10 persons per household.
| Household Type | # Households | Household Size |
| Married-Couple | 115 (40.4%) | 3.03 |
| Single Male/Father | 23 (8.1%) | 3.91 |
| Single Female/Mother | 2 (0.7%) | 3.00 |
| Non-family | 145 (50.9%) | 1.10 |
| Total Households | 285 (100.0%) | 2.12 |
Household Size by Marriage Status in Washington Grove
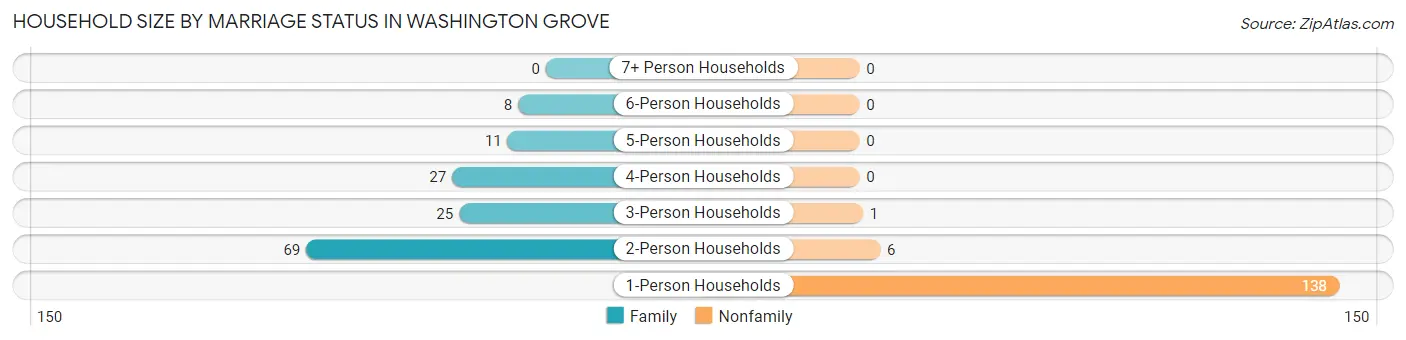
Out of a total of 285 households in Washington Grove, 140 (49.1%) are family households, while 145 (50.9%) are nonfamily households. The most numerous type of family households are 2-person households, comprising 69, and the most common type of nonfamily households are 1-person households, comprising 138.
| Household Size | Family Households | Nonfamily Households |
| 1-Person Households | - | 138 (48.4%) |
| 2-Person Households | 69 (24.2%) | 6 (2.1%) |
| 3-Person Households | 25 (8.8%) | 1 (0.4%) |
| 4-Person Households | 27 (9.5%) | 0 (0.0%) |
| 5-Person Households | 11 (3.9%) | 0 (0.0%) |
| 6-Person Households | 8 (2.8%) | 0 (0.0%) |
| 7+ Person Households | 0 (0.0%) | 0 (0.0%) |
| Total | 140 (49.1%) | 145 (50.9%) |
Female Fertility in Washington Grove
Fertility by Age in Washington Grove
Average fertility rate in Washington Grove is 90.0 births per 1,000 women. Women in the age bracket of 20 to 34 years have the highest fertility rate with 286.0 births per 1,000 women. Women in the age bracket of 20 to 34 years acount for 100.0% of all women with births.
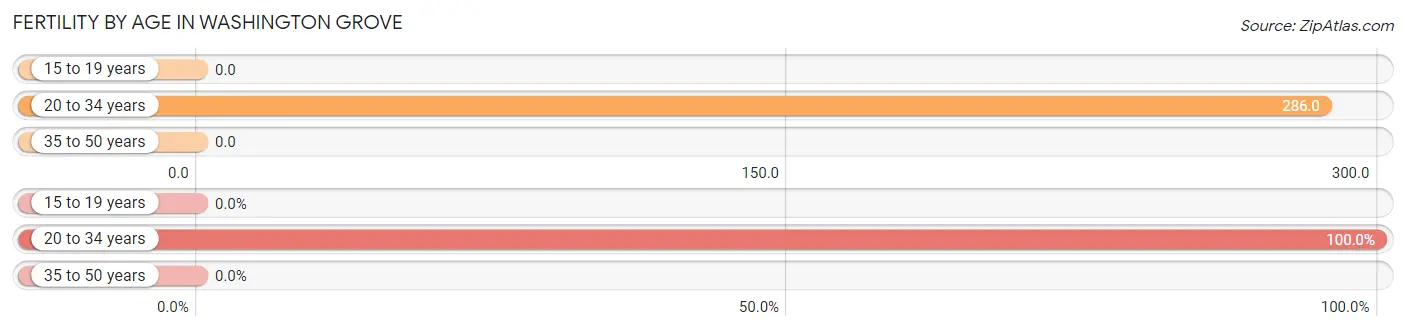
| Age Bracket | Women with Births | Births / 1,000 Women |
| 15 to 19 years | 0 (0.0%) | 0.0 |
| 20 to 34 years | 8 (100.0%) | 286.0 |
| 35 to 50 years | 0 (0.0%) | 0.0 |
| Total | 8 (100.0%) | 90.0 |
Fertility by Age by Marriage Status in Washington Grove
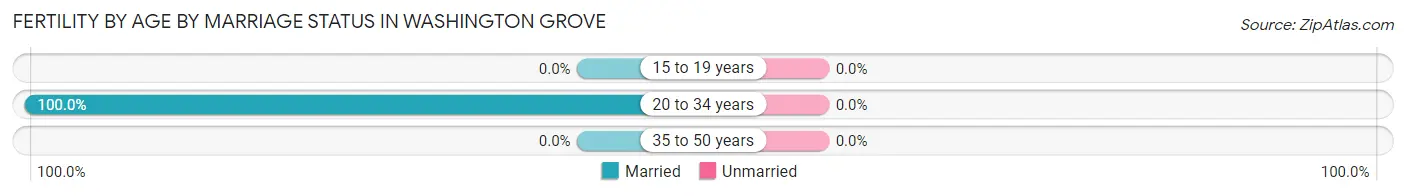
| Age Bracket | Married | Unmarried |
| 15 to 19 years | 0 (0.0%) | 0 (0.0%) |
| 20 to 34 years | 8 (100.0%) | 0 (0.0%) |
| 35 to 50 years | 0 (0.0%) | 0 (0.0%) |
| Total | 8 (100.0%) | 0 (0.0%) |
Fertility by Education in Washington Grove
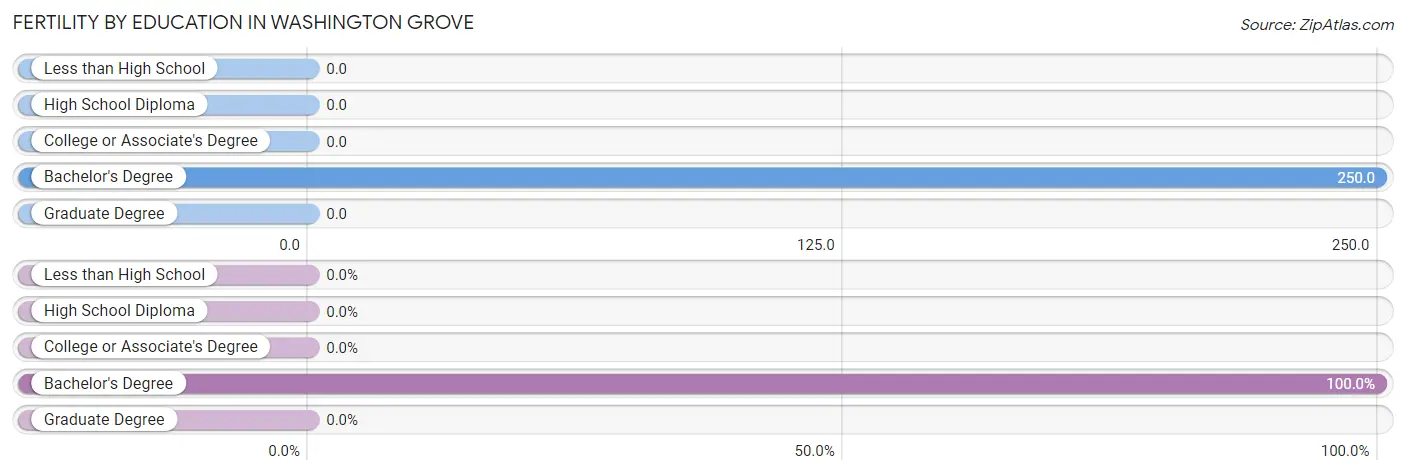
| Educational Attainment | Women with Births | Births / 1,000 Women |
| Less than High School | 0 (0.0%) | 0.0 |
| High School Diploma | 0 (0.0%) | 0.0 |
| College or Associate's Degree | 0 (0.0%) | 0.0 |
| Bachelor's Degree | 8 (100.0%) | 250.0 |
| Graduate Degree | 0 (0.0%) | 0.0 |
| Total | 8 (100.0%) | 90.0 |
Fertility by Education by Marriage Status in Washington Grove
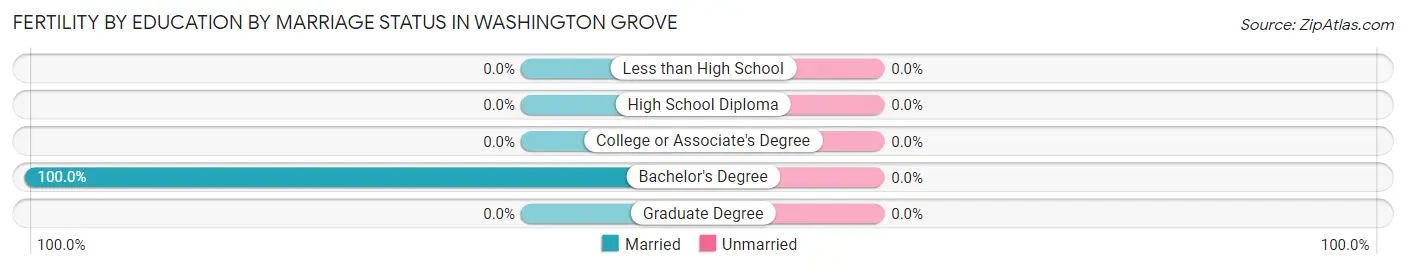
| Educational Attainment | Married | Unmarried |
| Less than High School | 0 (0.0%) | 0 (0.0%) |
| High School Diploma | 0 (0.0%) | 0 (0.0%) |
| College or Associate's Degree | 0 (0.0%) | 0 (0.0%) |
| Bachelor's Degree | 8 (100.0%) | 0 (0.0%) |
| Graduate Degree | 0 (0.0%) | 0 (0.0%) |
| Total | 8 (100.0%) | 0 (0.0%) |
Employment Characteristics in Washington Grove
Employment by Class of Employer in Washington Grove
Among the 371 employed individuals in Washington Grove, private company employees (214 | 57.7%), federal government employees (57 | 15.4%), and local government employees (35 | 9.4%) make up the most common classes of employment.
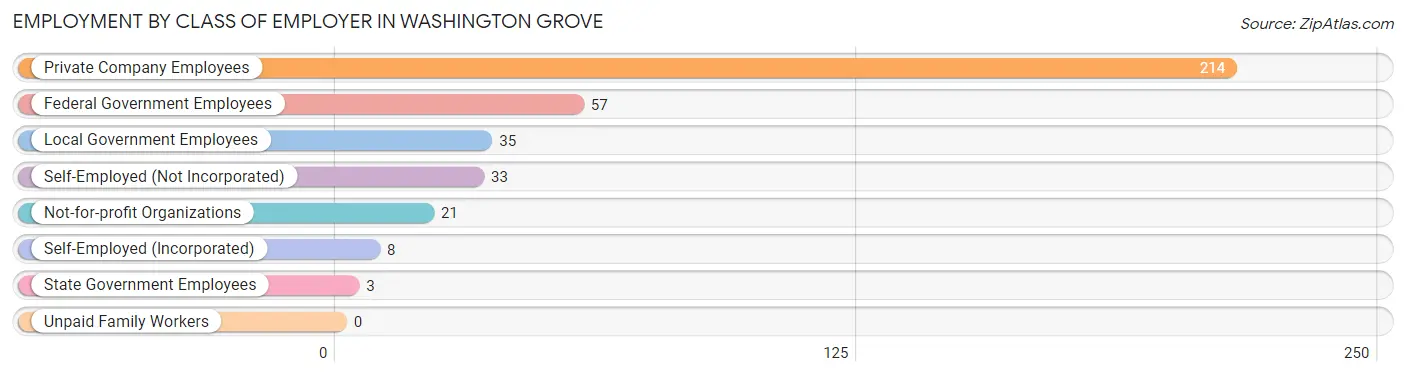
| Employer Class | # Employees | % Employees |
| Private Company Employees | 214 | 57.7% |
| Self-Employed (Incorporated) | 8 | 2.2% |
| Self-Employed (Not Incorporated) | 33 | 8.9% |
| Not-for-profit Organizations | 21 | 5.7% |
| Local Government Employees | 35 | 9.4% |
| State Government Employees | 3 | 0.8% |
| Federal Government Employees | 57 | 15.4% |
| Unpaid Family Workers | 0 | 0.0% |
| Total | 371 | 100.0% |
Employment Status by Age in Washington Grove
According to the labor force statistics for Washington Grove, out of the total population over 16 years of age (553), 70.2% or 388 individuals are in the labor force, with 2.6% or 10 of them unemployed. The age group with the highest labor force participation rate is 35 to 44 years, with 100.0% or 82 individuals in the labor force. Within the labor force, the 20 to 24 years age range has the highest percentage of unemployed individuals, with 24.2% or 8 of them being unemployed.
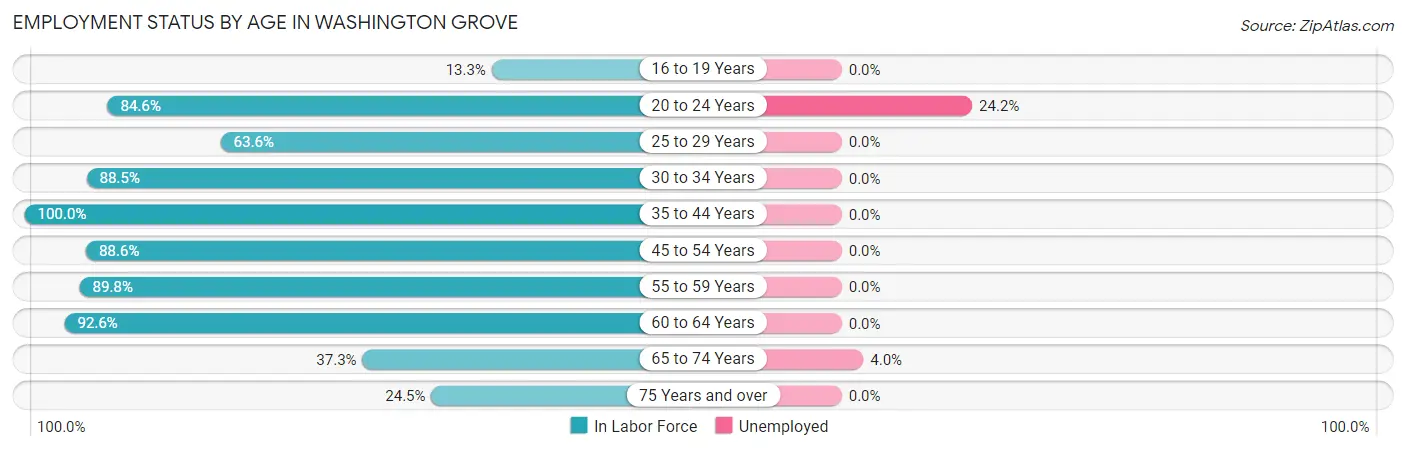
| Age Bracket | In Labor Force | Unemployed |
| 16 to 19 Years | 2 (13.3%) | 0 (0.0%) |
| 20 to 24 Years | 33 (84.6%) | 8 (24.2%) |
| 25 to 29 Years | 7 (63.6%) | 0 (0.0%) |
| 30 to 34 Years | 23 (88.5%) | 0 (0.0%) |
| 35 to 44 Years | 82 (100.0%) | 0 (0.0%) |
| 45 to 54 Years | 39 (88.6%) | 0 (0.0%) |
| 55 to 59 Years | 53 (89.8%) | 0 (0.0%) |
| 60 to 64 Years | 87 (92.6%) | 0 (0.0%) |
| 65 to 74 Years | 50 (37.3%) | 2 (4.0%) |
| 75 Years and over | 12 (24.5%) | 0 (0.0%) |
| Total | 388 (70.2%) | 10 (2.6%) |
Employment Status by Educational Attainment in Washington Grove
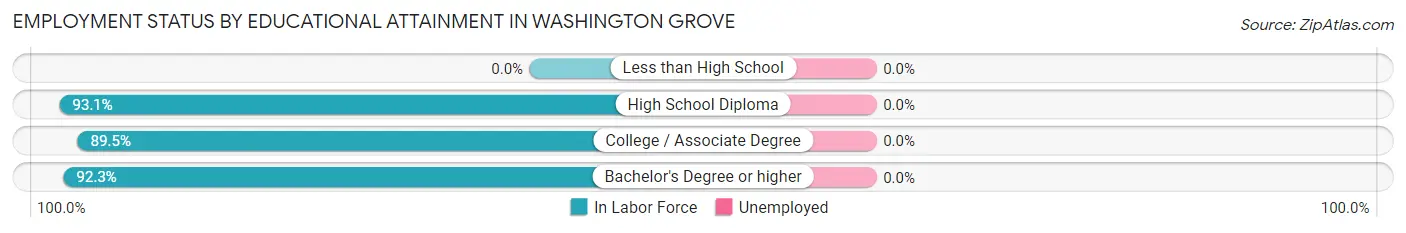
| Educational Attainment | In Labor Force | Unemployed |
| Less than High School | 0 (0.0%) | 0 (0.0%) |
| High School Diploma | 54 (93.1%) | 0 (0.0%) |
| College / Associate Degree | 34 (89.5%) | 0 (0.0%) |
| Bachelor's Degree or higher | 203 (92.3%) | 0 (0.0%) |
| Total | 291 (92.1%) | 0 (0.0%) |
Employment Occupations by Sex in Washington Grove
Management, Business, Science and Arts Occupations
The most common Management, Business, Science and Arts occupations in Washington Grove are Management (99 | 26.2%), Computers, Engineering & Science (80 | 21.2%), Community & Social Service (48 | 12.7%), Computers & Mathematics (46 | 12.2%), and Business & Financial (27 | 7.1%).
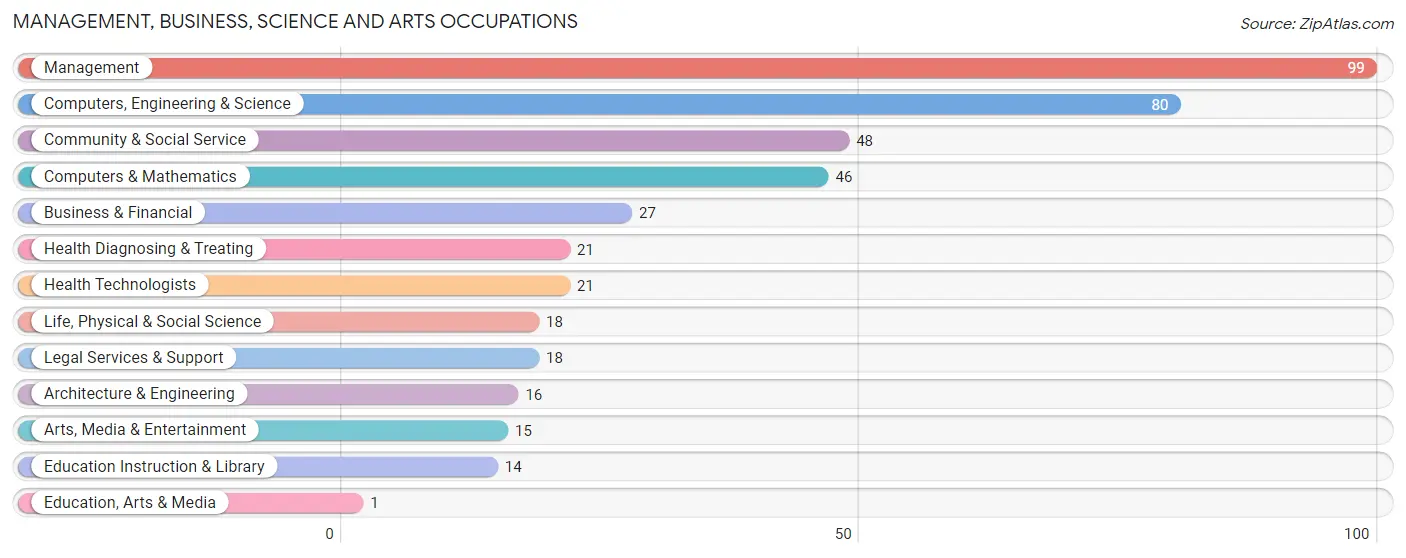
Management, Business, Science and Arts Occupations by Sex
Within the Management, Business, Science and Arts occupations in Washington Grove, the most male-oriented occupations are Architecture & Engineering (100.0%), Computers & Mathematics (87.0%), and Computers, Engineering & Science (85.0%), while the most female-oriented occupations are Education, Arts & Media (100.0%), Legal Services & Support (94.4%), and Education Instruction & Library (85.7%).
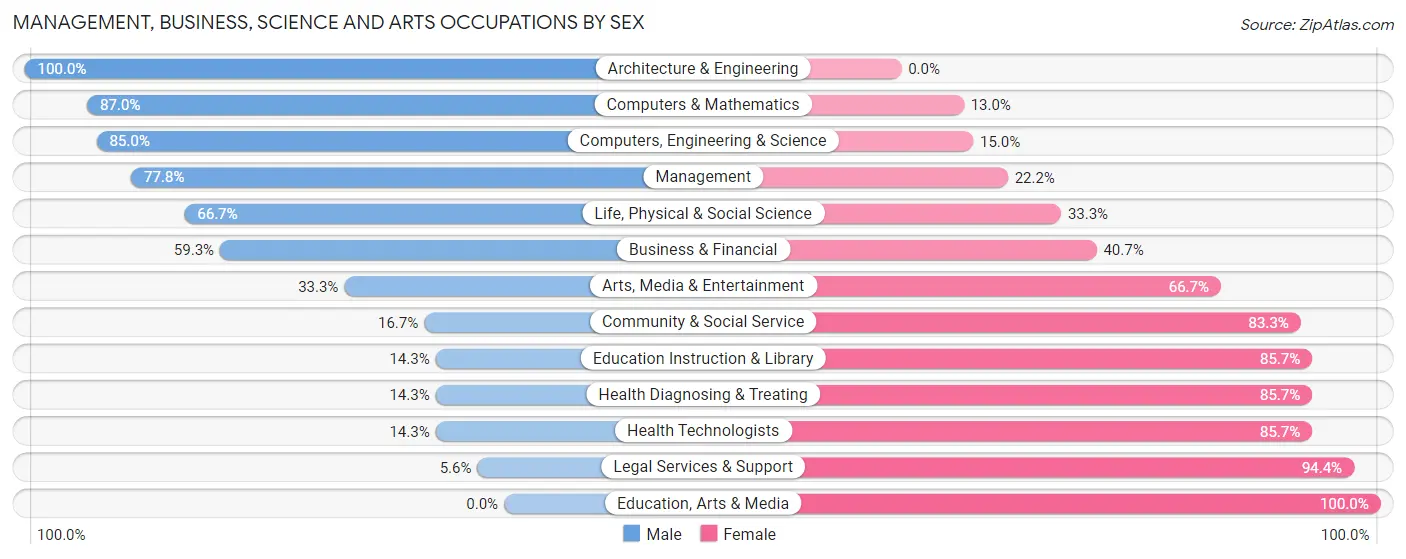
| Occupation | Male | Female |
| Management | 77 (77.8%) | 22 (22.2%) |
| Business & Financial | 16 (59.3%) | 11 (40.7%) |
| Computers, Engineering & Science | 68 (85.0%) | 12 (15.0%) |
| Computers & Mathematics | 40 (87.0%) | 6 (13.0%) |
| Architecture & Engineering | 16 (100.0%) | 0 (0.0%) |
| Life, Physical & Social Science | 12 (66.7%) | 6 (33.3%) |
| Community & Social Service | 8 (16.7%) | 40 (83.3%) |
| Education, Arts & Media | 0 (0.0%) | 1 (100.0%) |
| Legal Services & Support | 1 (5.6%) | 17 (94.4%) |
| Education Instruction & Library | 2 (14.3%) | 12 (85.7%) |
| Arts, Media & Entertainment | 5 (33.3%) | 10 (66.7%) |
| Health Diagnosing & Treating | 3 (14.3%) | 18 (85.7%) |
| Health Technologists | 3 (14.3%) | 18 (85.7%) |
| Total (Category) | 172 (62.5%) | 103 (37.4%) |
| Total (Overall) | 242 (64.0%) | 136 (36.0%) |
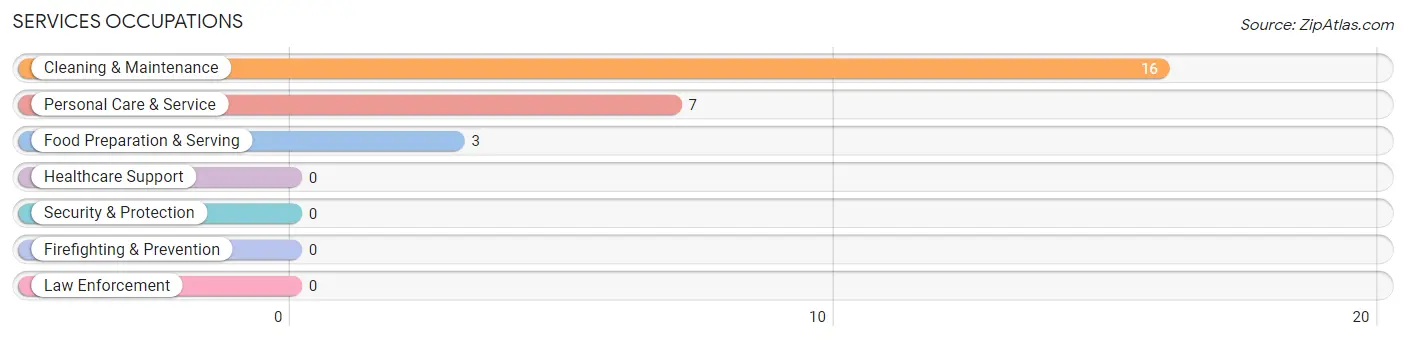
Services Occupations
The most common Services occupations in Washington Grove are Cleaning & Maintenance (16 | 4.2%), Personal Care & Service (7 | 1.8%), and Food Preparation & Serving (3 | 0.8%).
Services Occupations by Sex
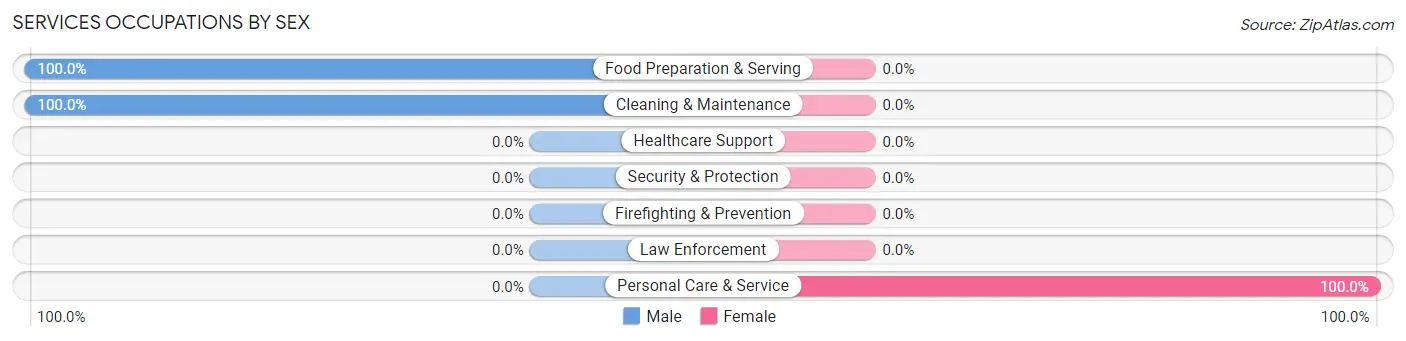
| Occupation | Male | Female |
| Healthcare Support | 0 (0.0%) | 0 (0.0%) |
| Security & Protection | 0 (0.0%) | 0 (0.0%) |
| Firefighting & Prevention | 0 (0.0%) | 0 (0.0%) |
| Law Enforcement | 0 (0.0%) | 0 (0.0%) |
| Food Preparation & Serving | 3 (100.0%) | 0 (0.0%) |
| Cleaning & Maintenance | 16 (100.0%) | 0 (0.0%) |
| Personal Care & Service | 0 (0.0%) | 7 (100.0%) |
| Total (Category) | 19 (73.1%) | 7 (26.9%) |
| Total (Overall) | 242 (64.0%) | 136 (36.0%) |
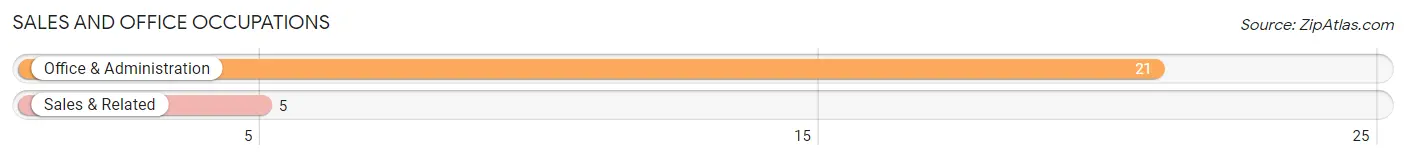
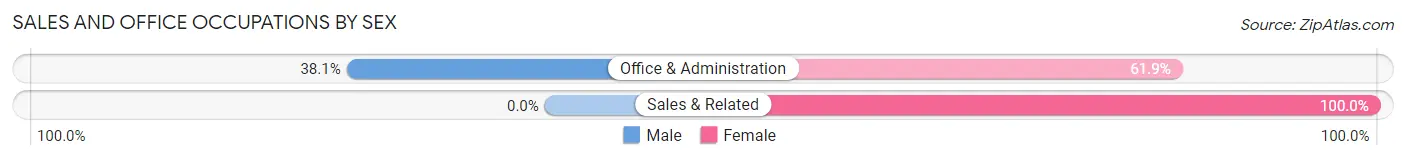
Sales and Office Occupations
The most common Sales and Office occupations in Washington Grove are Office & Administration (21 | 5.6%), and Sales & Related (5 | 1.3%).
Sales and Office Occupations by Sex
| Occupation | Male | Female |
| Sales & Related | 0 (0.0%) | 5 (100.0%) |
| Office & Administration | 8 (38.1%) | 13 (61.9%) |
| Total (Category) | 8 (30.8%) | 18 (69.2%) |
| Total (Overall) | 242 (64.0%) | 136 (36.0%) |
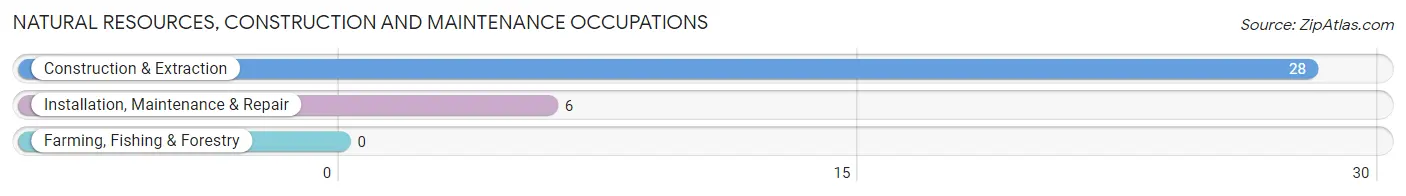
Natural Resources, Construction and Maintenance Occupations
The most common Natural Resources, Construction and Maintenance occupations in Washington Grove are Construction & Extraction (28 | 7.4%), and Installation, Maintenance & Repair (6 | 1.6%).
Natural Resources, Construction and Maintenance Occupations by Sex
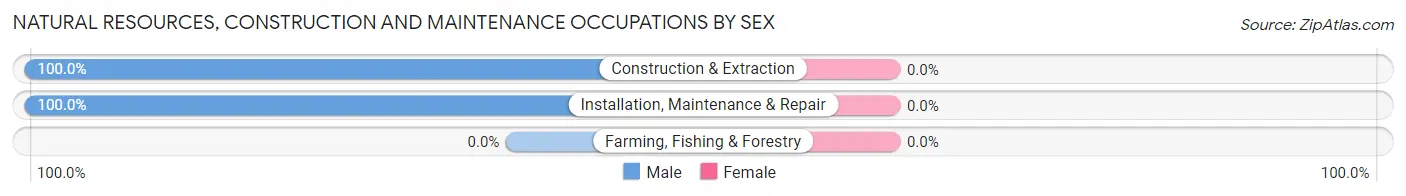
| Occupation | Male | Female |
| Farming, Fishing & Forestry | 0 (0.0%) | 0 (0.0%) |
| Construction & Extraction | 28 (100.0%) | 0 (0.0%) |
| Installation, Maintenance & Repair | 6 (100.0%) | 0 (0.0%) |
| Total (Category) | 34 (100.0%) | 0 (0.0%) |
| Total (Overall) | 242 (64.0%) | 136 (36.0%) |
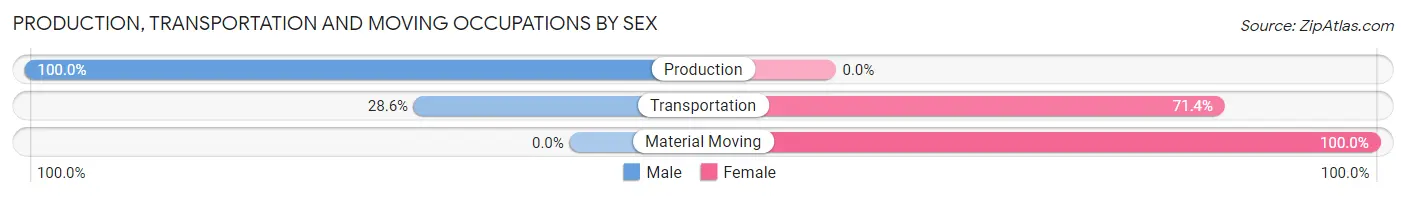
Production, Transportation and Moving Occupations
The most common Production, Transportation and Moving occupations in Washington Grove are Production (7 | 1.8%), Transportation (7 | 1.8%), and Material Moving (3 | 0.8%).
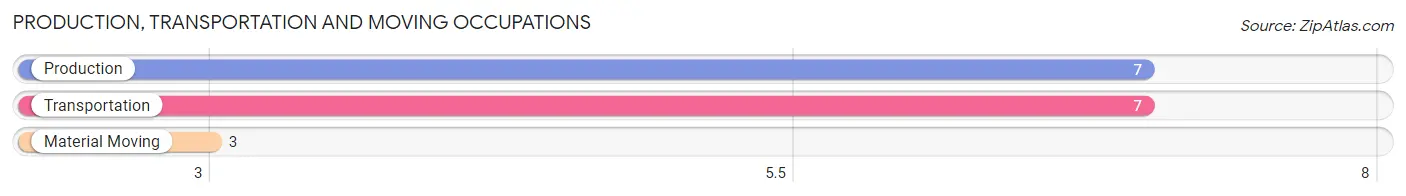
Production, Transportation and Moving Occupations by Sex
| Occupation | Male | Female |
| Production | 7 (100.0%) | 0 (0.0%) |
| Transportation | 2 (28.6%) | 5 (71.4%) |
| Material Moving | 0 (0.0%) | 3 (100.0%) |
| Total (Category) | 9 (52.9%) | 8 (47.1%) |
| Total (Overall) | 242 (64.0%) | 136 (36.0%) |
Employment Industries by Sex in Washington Grove
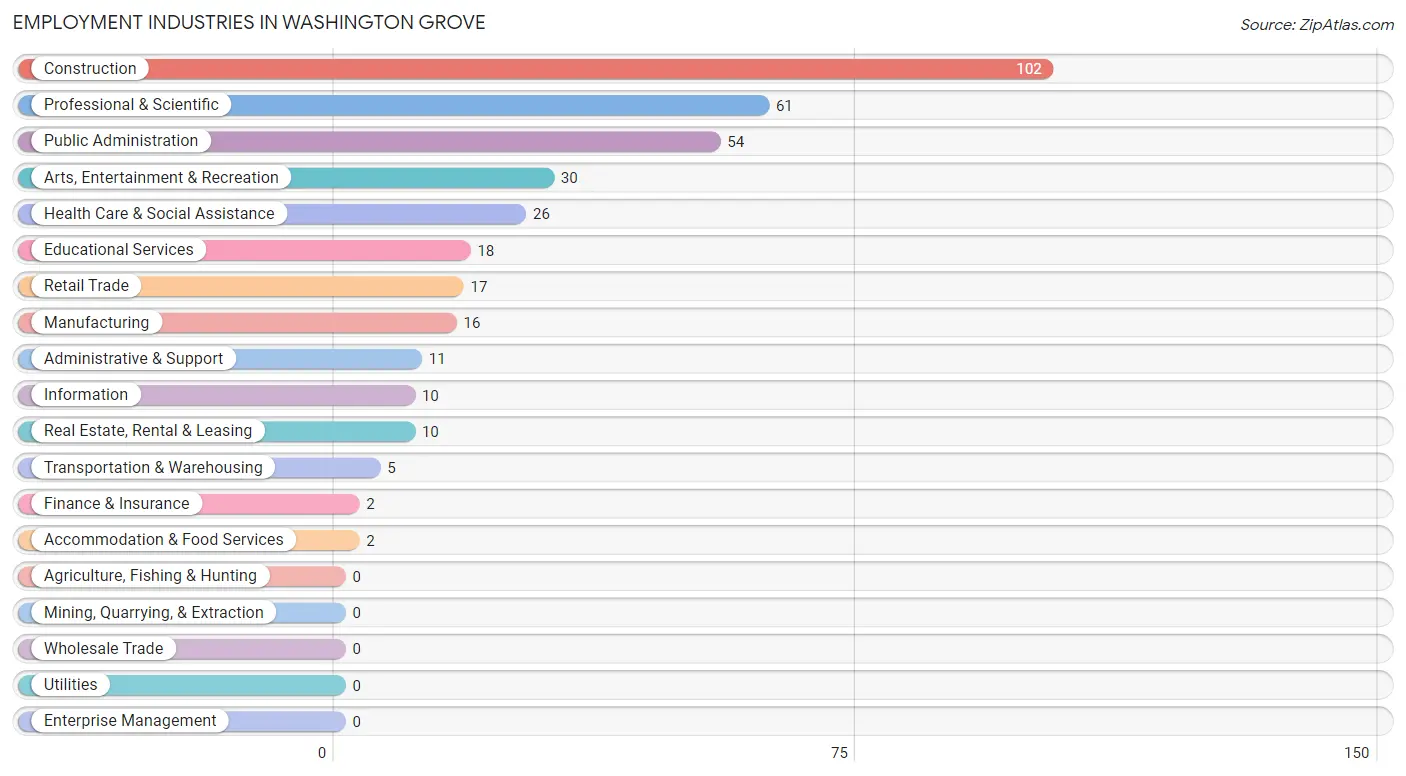
Employment Industries in Washington Grove
The major employment industries in Washington Grove include Construction (102 | 27.0%), Professional & Scientific (61 | 16.1%), Public Administration (54 | 14.3%), Arts, Entertainment & Recreation (30 | 7.9%), and Health Care & Social Assistance (26 | 6.9%).
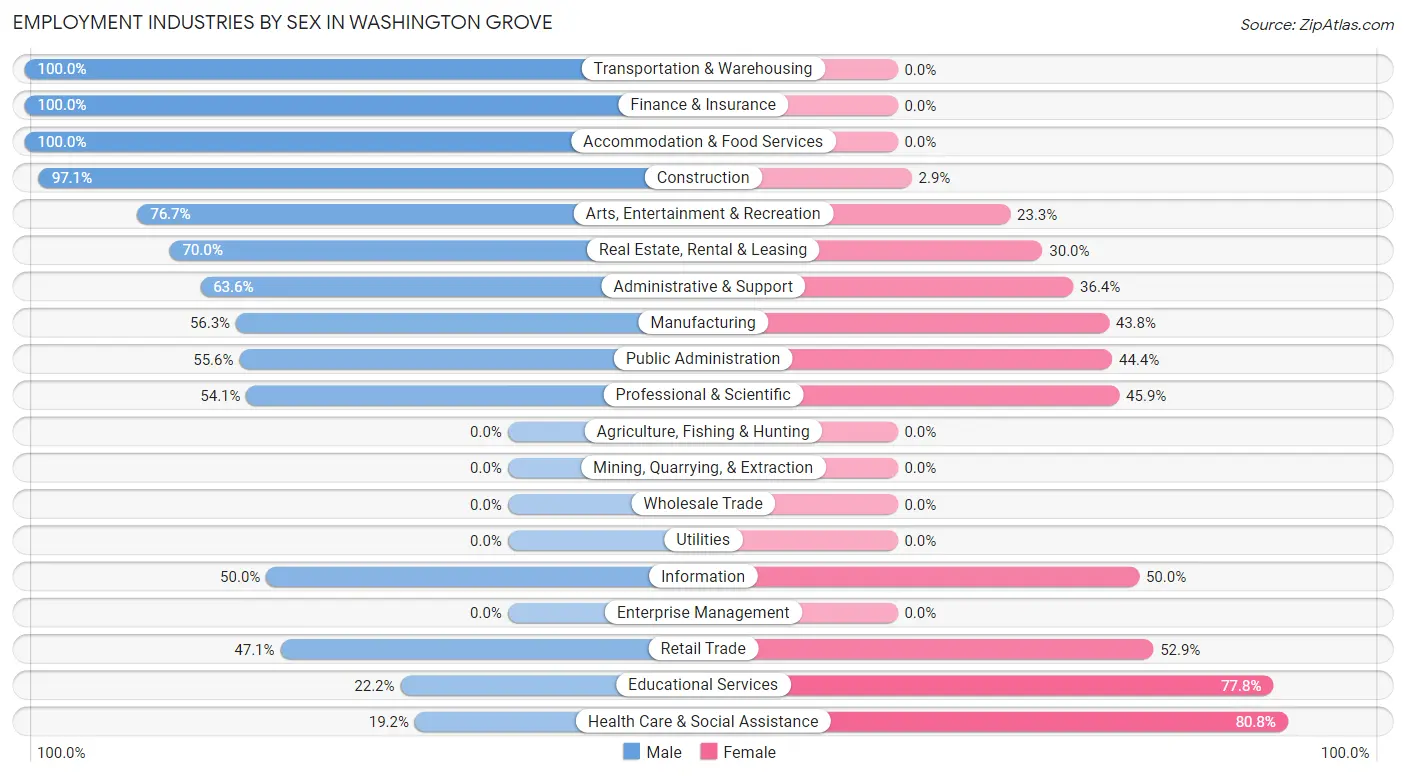
Employment Industries by Sex in Washington Grove
The Washington Grove industries that see more men than women are Transportation & Warehousing (100.0%), Finance & Insurance (100.0%), and Accommodation & Food Services (100.0%), whereas the industries that tend to have a higher number of women are Health Care & Social Assistance (80.8%), Educational Services (77.8%), and Retail Trade (52.9%).
| Industry | Male | Female |
| Agriculture, Fishing & Hunting | 0 (0.0%) | 0 (0.0%) |
| Mining, Quarrying, & Extraction | 0 (0.0%) | 0 (0.0%) |
| Construction | 99 (97.1%) | 3 (2.9%) |
| Manufacturing | 9 (56.2%) | 7 (43.8%) |
| Wholesale Trade | 0 (0.0%) | 0 (0.0%) |
| Retail Trade | 8 (47.1%) | 9 (52.9%) |
| Transportation & Warehousing | 5 (100.0%) | 0 (0.0%) |
| Utilities | 0 (0.0%) | 0 (0.0%) |
| Information | 5 (50.0%) | 5 (50.0%) |
| Finance & Insurance | 2 (100.0%) | 0 (0.0%) |
| Real Estate, Rental & Leasing | 7 (70.0%) | 3 (30.0%) |
| Professional & Scientific | 33 (54.1%) | 28 (45.9%) |
| Enterprise Management | 0 (0.0%) | 0 (0.0%) |
| Administrative & Support | 7 (63.6%) | 4 (36.4%) |
| Educational Services | 4 (22.2%) | 14 (77.8%) |
| Health Care & Social Assistance | 5 (19.2%) | 21 (80.8%) |
| Arts, Entertainment & Recreation | 23 (76.7%) | 7 (23.3%) |
| Accommodation & Food Services | 2 (100.0%) | 0 (0.0%) |
| Public Administration | 30 (55.6%) | 24 (44.4%) |
| Total | 242 (64.0%) | 136 (36.0%) |
Education in Washington Grove
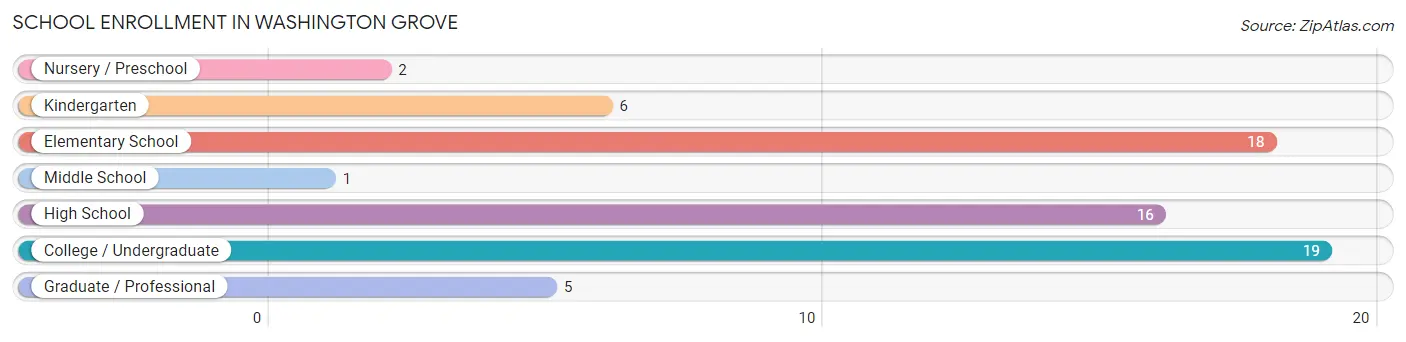
School Enrollment in Washington Grove
The most common levels of schooling among the 67 students in Washington Grove are college / undergraduate (19 | 28.4%), elementary school (18 | 26.9%), and high school (16 | 23.9%).
| School Level | # Students | % Students |
| Nursery / Preschool | 2 | 3.0% |
| Kindergarten | 6 | 9.0% |
| Elementary School | 18 | 26.9% |
| Middle School | 1 | 1.5% |
| High School | 16 | 23.9% |
| College / Undergraduate | 19 | 28.4% |
| Graduate / Professional | 5 | 7.5% |
| Total | 67 | 100.0% |
School Enrollment by Age by Funding Source in Washington Grove
Out of a total of 67 students who are enrolled in schools in Washington Grove, 5 (7.5%) attend a private institution, while the remaining 62 (92.5%) are enrolled in public schools. The age group of 3 to 4 year olds has the highest likelihood of being enrolled in private schools, with 2 (100.0% in the age bracket) enrolled. Conversely, the age group of 5 to 9 year old has the lowest likelihood of being enrolled in a private school, with 24 (100.0% in the age bracket) attending a public institution.
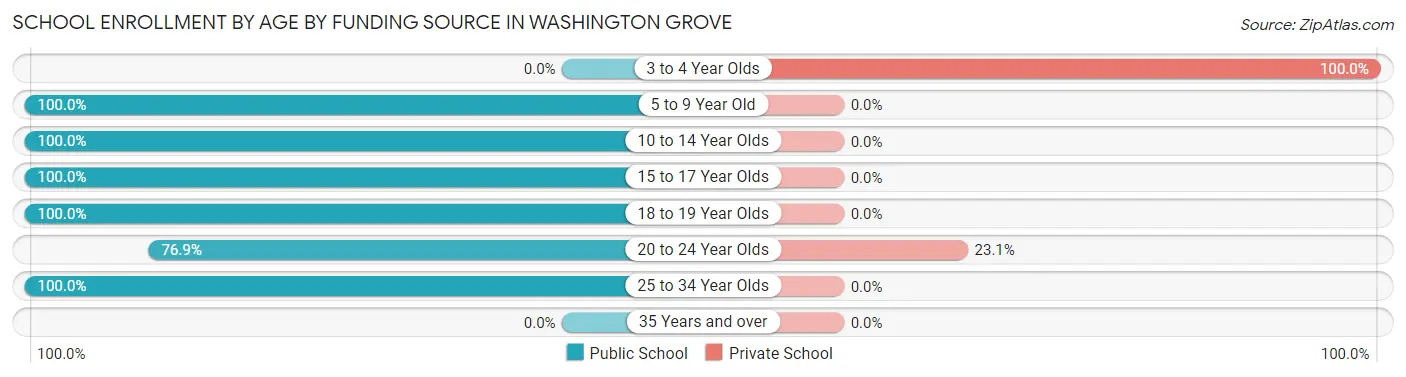
| Age Bracket | Public School | Private School |
| 3 to 4 Year Olds | 0 (0.0%) | 2 (100.0%) |
| 5 to 9 Year Old | 24 (100.0%) | 0 (0.0%) |
| 10 to 14 Year Olds | 1 (100.0%) | 0 (0.0%) |
| 15 to 17 Year Olds | 16 (100.0%) | 0 (0.0%) |
| 18 to 19 Year Olds | 4 (100.0%) | 0 (0.0%) |
| 20 to 24 Year Olds | 10 (76.9%) | 3 (23.1%) |
| 25 to 34 Year Olds | 7 (100.0%) | 0 (0.0%) |
| 35 Years and over | 0 (0.0%) | 0 (0.0%) |
| Total | 62 (92.5%) | 5 (7.5%) |
Educational Attainment by Field of Study in Washington Grove
Business (62 | 17.1%), engineering (43 | 11.9%), literature & languages (40 | 11.1%), bio, nature & agricultural (38 | 10.5%), and computers & mathematics (37 | 10.2%) are the most common fields of study among 362 individuals in Washington Grove who have obtained a bachelor's degree or higher.
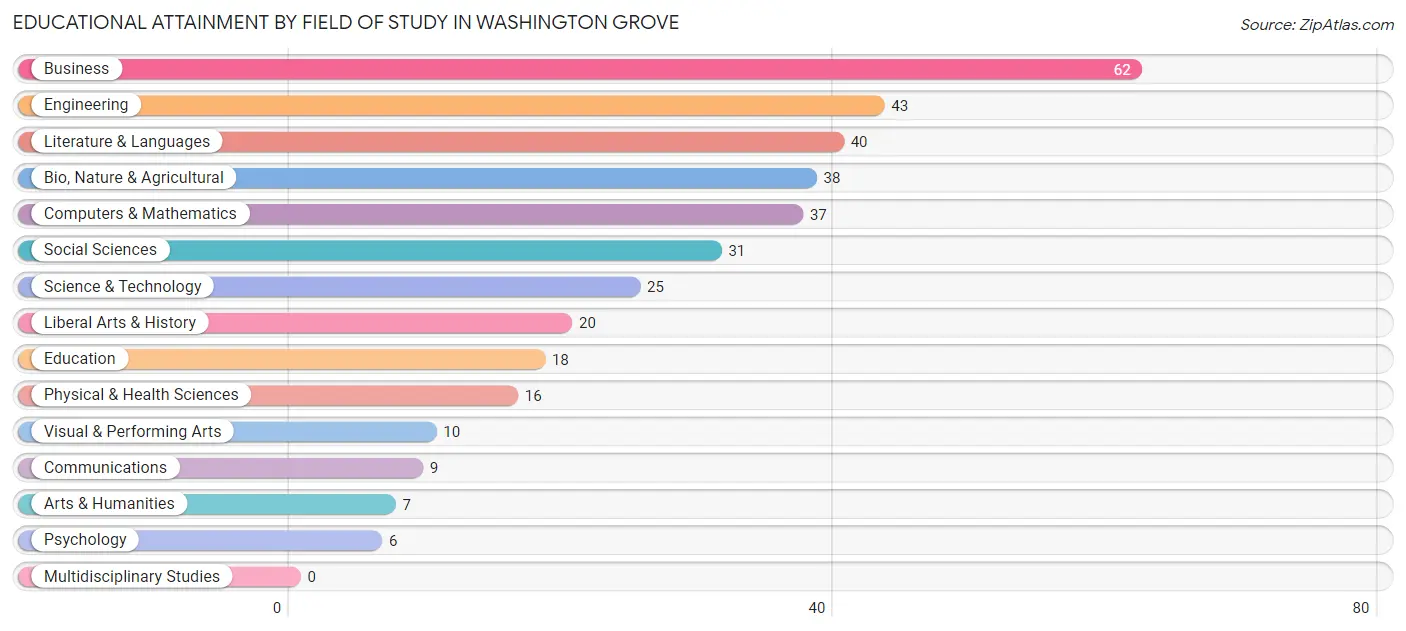
| Field of Study | # Graduates | % Graduates |
| Computers & Mathematics | 37 | 10.2% |
| Bio, Nature & Agricultural | 38 | 10.5% |
| Physical & Health Sciences | 16 | 4.4% |
| Psychology | 6 | 1.7% |
| Social Sciences | 31 | 8.6% |
| Engineering | 43 | 11.9% |
| Multidisciplinary Studies | 0 | 0.0% |
| Science & Technology | 25 | 6.9% |
| Business | 62 | 17.1% |
| Education | 18 | 5.0% |
| Literature & Languages | 40 | 11.1% |
| Liberal Arts & History | 20 | 5.5% |
| Visual & Performing Arts | 10 | 2.8% |
| Communications | 9 | 2.5% |
| Arts & Humanities | 7 | 1.9% |
| Total | 362 | 100.0% |
Transportation & Commute in Washington Grove
Vehicle Availability by Sex in Washington Grove
The most prevalent vehicle ownership categories in Washington Grove are males with 2 vehicles (106, accounting for 45.1%) and females with 2 vehicles (47, making up 77.9%).
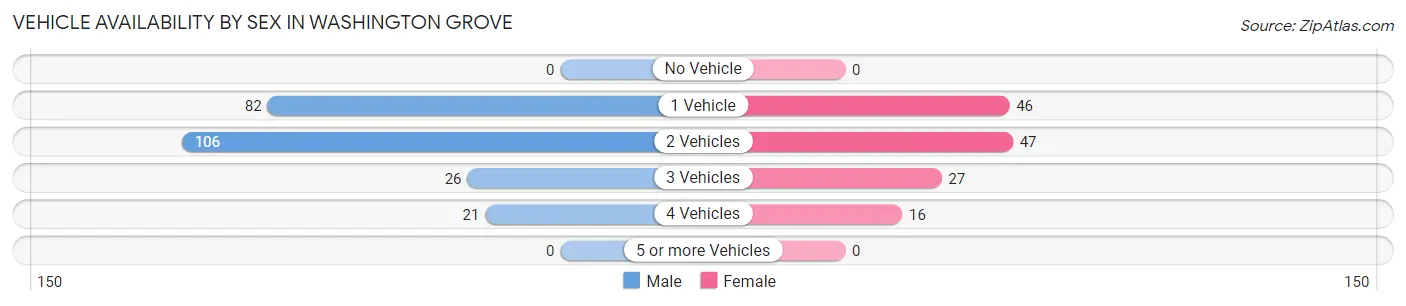
| Vehicles Available | Male | Female |
| No Vehicle | 0 (0.0%) | 0 (0.0%) |
| 1 Vehicle | 82 (34.9%) | 46 (33.8%) |
| 2 Vehicles | 106 (45.1%) | 47 (34.6%) |
| 3 Vehicles | 26 (11.1%) | 27 (19.9%) |
| 4 Vehicles | 21 (8.9%) | 16 (11.8%) |
| 5 or more Vehicles | 0 (0.0%) | 0 (0.0%) |
| Total | 235 (100.0%) | 136 (100.0%) |
Commute Time in Washington Grove
The most frequently occuring commute durations in Washington Grove are 45 to 59 minutes (55 commuters, 18.6%), 5 to 9 minutes (53 commuters, 17.9%), and 30 to 34 minutes (40 commuters, 13.5%).
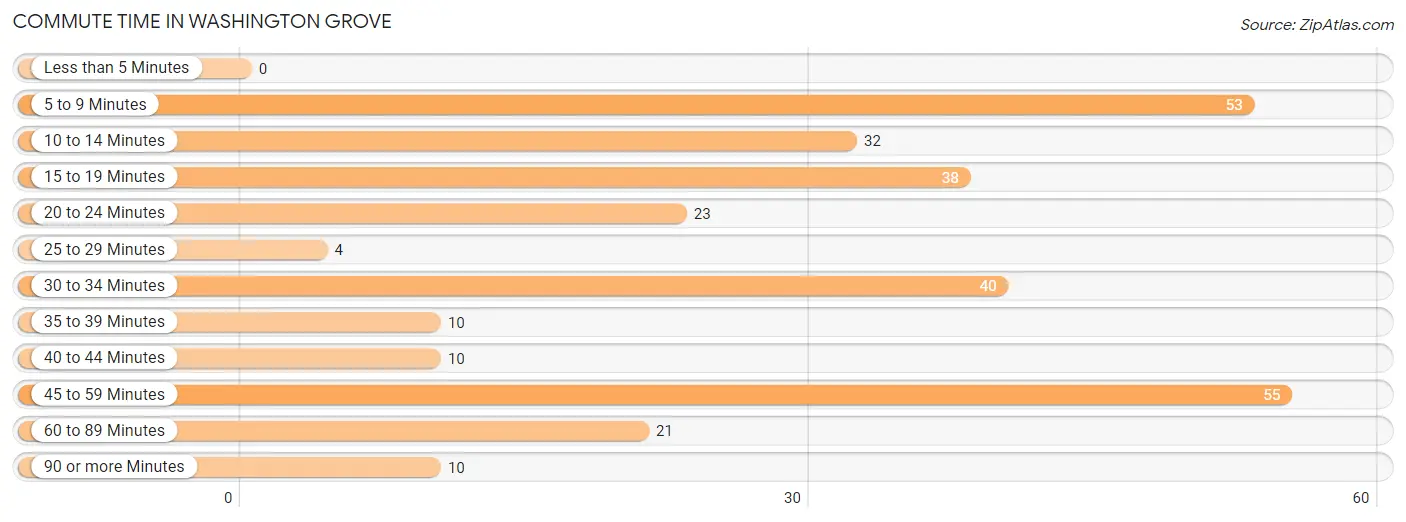
| Commute Time | # Commuters | % Commuters |
| Less than 5 Minutes | 0 | 0.0% |
| 5 to 9 Minutes | 53 | 17.9% |
| 10 to 14 Minutes | 32 | 10.8% |
| 15 to 19 Minutes | 38 | 12.8% |
| 20 to 24 Minutes | 23 | 7.8% |
| 25 to 29 Minutes | 4 | 1.3% |
| 30 to 34 Minutes | 40 | 13.5% |
| 35 to 39 Minutes | 10 | 3.4% |
| 40 to 44 Minutes | 10 | 3.4% |
| 45 to 59 Minutes | 55 | 18.6% |
| 60 to 89 Minutes | 21 | 7.1% |
| 90 or more Minutes | 10 | 3.4% |
Commute Time by Sex in Washington Grove
The most common commute times in Washington Grove are 5 to 9 minutes (53 commuters, 26.9%) for males and 10 to 14 minutes (25 commuters, 25.3%) for females.
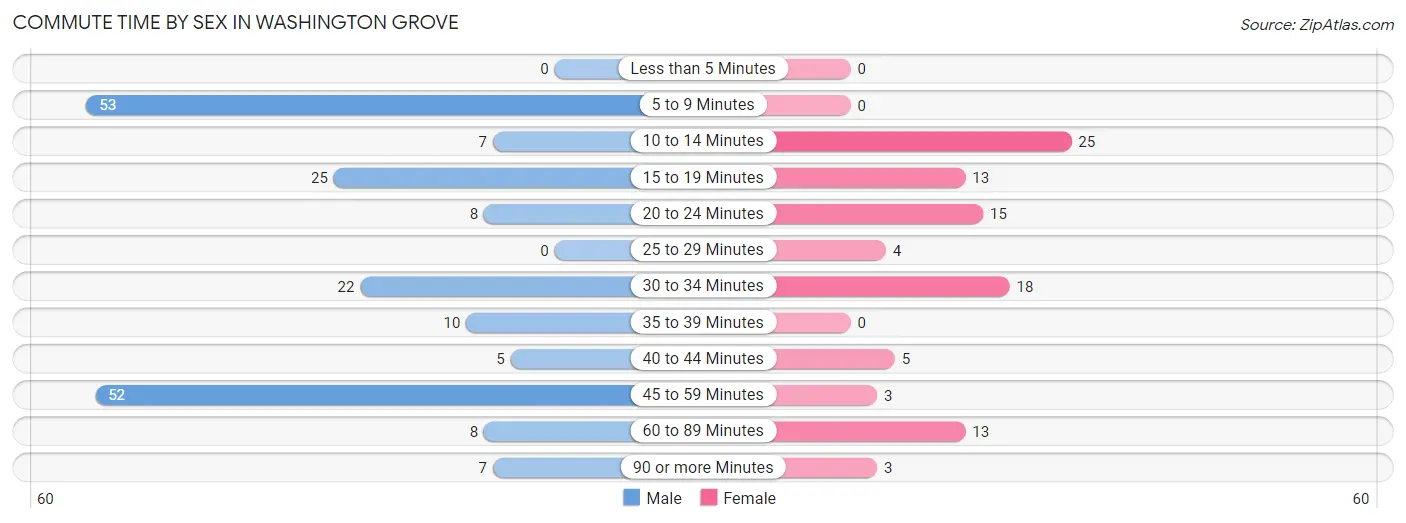
| Commute Time | Male | Female |
| Less than 5 Minutes | 0 (0.0%) | 0 (0.0%) |
| 5 to 9 Minutes | 53 (26.9%) | 0 (0.0%) |
| 10 to 14 Minutes | 7 (3.5%) | 25 (25.3%) |
| 15 to 19 Minutes | 25 (12.7%) | 13 (13.1%) |
| 20 to 24 Minutes | 8 (4.1%) | 15 (15.1%) |
| 25 to 29 Minutes | 0 (0.0%) | 4 (4.0%) |
| 30 to 34 Minutes | 22 (11.2%) | 18 (18.2%) |
| 35 to 39 Minutes | 10 (5.1%) | 0 (0.0%) |
| 40 to 44 Minutes | 5 (2.5%) | 5 (5.1%) |
| 45 to 59 Minutes | 52 (26.4%) | 3 (3.0%) |
| 60 to 89 Minutes | 8 (4.1%) | 13 (13.1%) |
| 90 or more Minutes | 7 (3.5%) | 3 (3.0%) |
Time of Departure to Work by Sex in Washington Grove
The most frequent times of departure to work in Washington Grove are 5:30 AM to 5:59 AM (63, 32.0%) for males and 6:30 AM to 6:59 AM (25, 25.3%) for females.
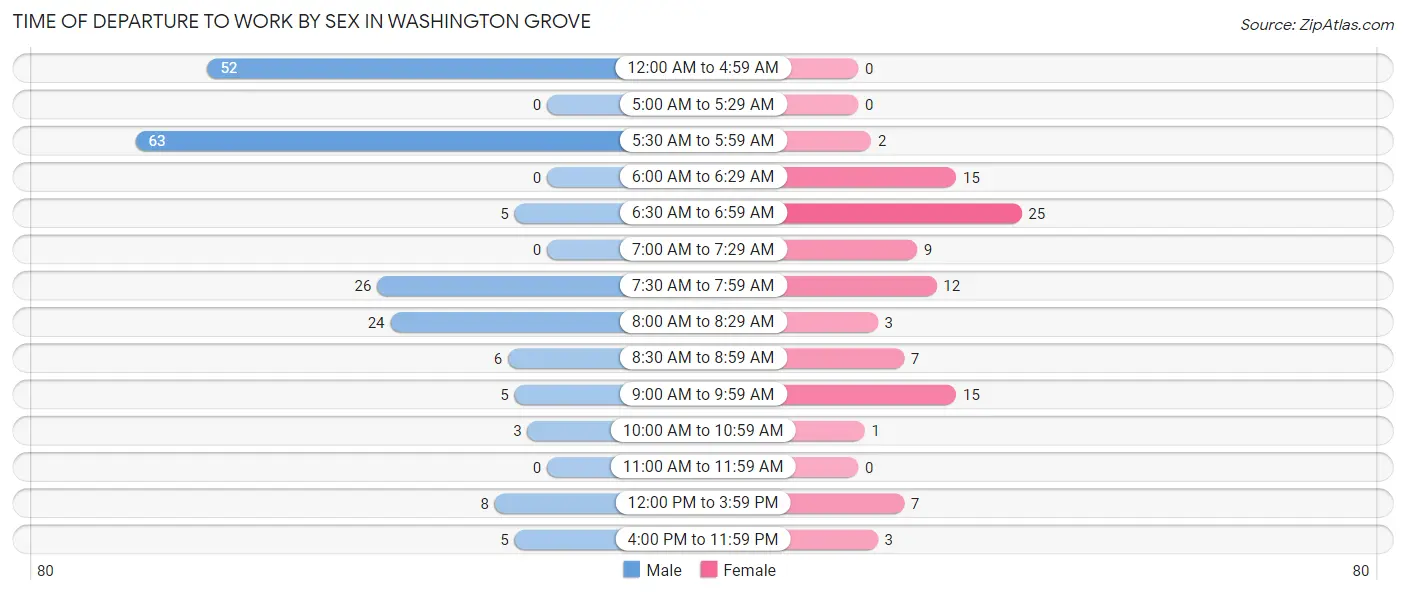
| Time of Departure | Male | Female |
| 12:00 AM to 4:59 AM | 52 (26.4%) | 0 (0.0%) |
| 5:00 AM to 5:29 AM | 0 (0.0%) | 0 (0.0%) |
| 5:30 AM to 5:59 AM | 63 (32.0%) | 2 (2.0%) |
| 6:00 AM to 6:29 AM | 0 (0.0%) | 15 (15.1%) |
| 6:30 AM to 6:59 AM | 5 (2.5%) | 25 (25.3%) |
| 7:00 AM to 7:29 AM | 0 (0.0%) | 9 (9.1%) |
| 7:30 AM to 7:59 AM | 26 (13.2%) | 12 (12.1%) |
| 8:00 AM to 8:29 AM | 24 (12.2%) | 3 (3.0%) |
| 8:30 AM to 8:59 AM | 6 (3.0%) | 7 (7.1%) |
| 9:00 AM to 9:59 AM | 5 (2.5%) | 15 (15.1%) |
| 10:00 AM to 10:59 AM | 3 (1.5%) | 1 (1.0%) |
| 11:00 AM to 11:59 AM | 0 (0.0%) | 0 (0.0%) |
| 12:00 PM to 3:59 PM | 8 (4.1%) | 7 (7.1%) |
| 4:00 PM to 11:59 PM | 5 (2.5%) | 3 (3.0%) |
| Total | 197 (100.0%) | 99 (100.0%) |
Housing Occupancy in Washington Grove
Occupancy by Ownership in Washington Grove
Of the total 285 dwellings in Washington Grove, owner-occupied units account for 272 (95.4%), while renter-occupied units make up 13 (4.6%).
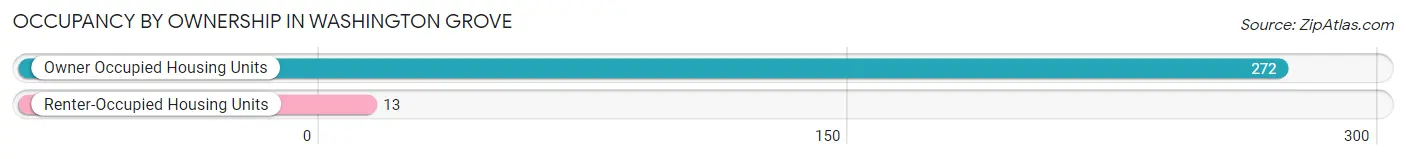
| Occupancy | # Housing Units | % Housing Units |
| Owner Occupied Housing Units | 272 | 95.4% |
| Renter-Occupied Housing Units | 13 | 4.6% |
| Total Occupied Housing Units | 285 | 100.0% |
Occupancy by Household Size in Washington Grove
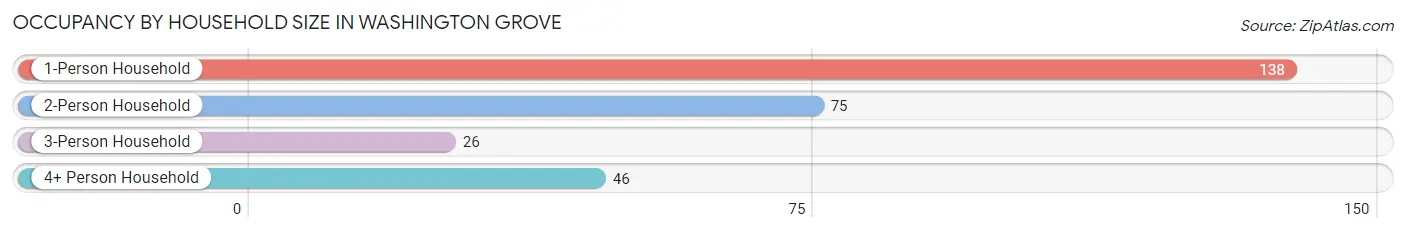
| Household Size | # Housing Units | % Housing Units |
| 1-Person Household | 138 | 48.4% |
| 2-Person Household | 75 | 26.3% |
| 3-Person Household | 26 | 9.1% |
| 4+ Person Household | 46 | 16.1% |
| Total Housing Units | 285 | 100.0% |
Occupancy by Ownership by Household Size in Washington Grove
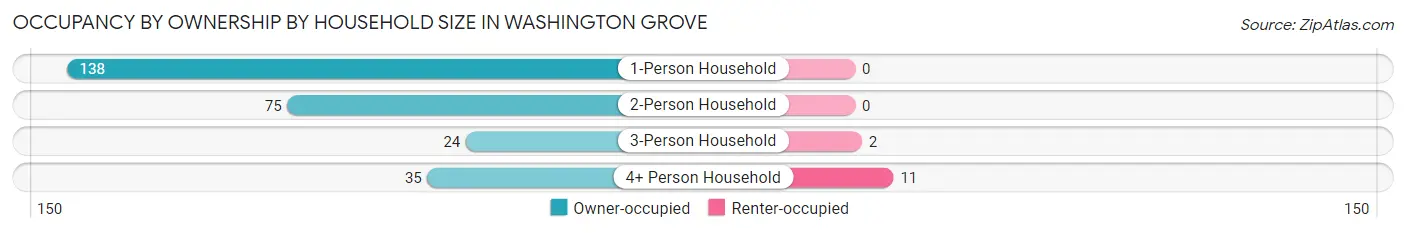
| Household Size | Owner-occupied | Renter-occupied |
| 1-Person Household | 138 (100.0%) | 0 (0.0%) |
| 2-Person Household | 75 (100.0%) | 0 (0.0%) |
| 3-Person Household | 24 (92.3%) | 2 (7.7%) |
| 4+ Person Household | 35 (76.1%) | 11 (23.9%) |
| Total Housing Units | 272 (95.4%) | 13 (4.6%) |
Occupancy by Educational Attainment in Washington Grove
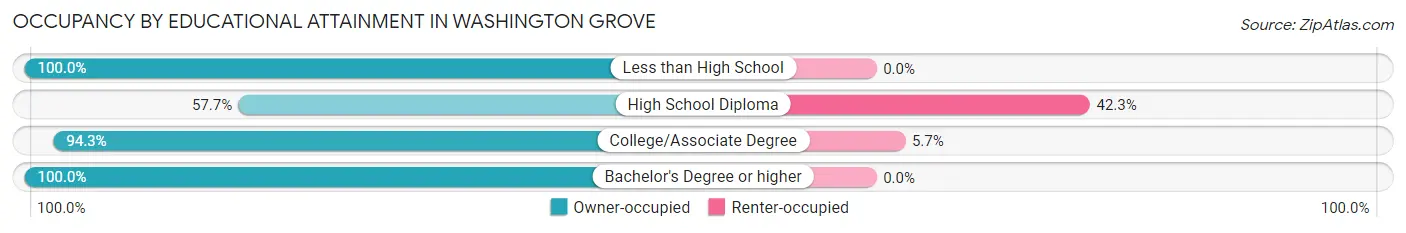
| Household Size | Owner-occupied | Renter-occupied |
| Less than High School | 2 (100.0%) | 0 (0.0%) |
| High School Diploma | 15 (57.7%) | 11 (42.3%) |
| College/Associate Degree | 33 (94.3%) | 2 (5.7%) |
| Bachelor's Degree or higher | 222 (100.0%) | 0 (0.0%) |
Occupancy by Age of Householder in Washington Grove
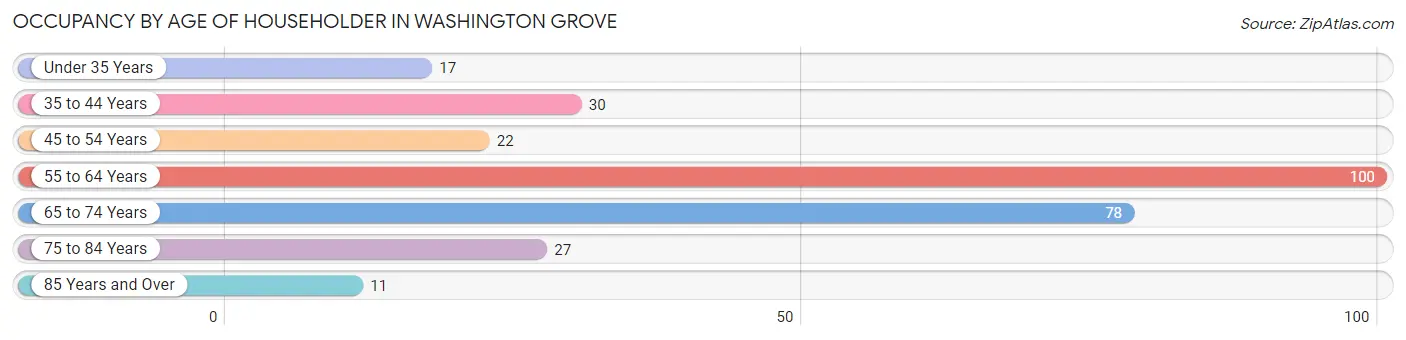
| Age Bracket | # Households | % Households |
| Under 35 Years | 17 | 6.0% |
| 35 to 44 Years | 30 | 10.5% |
| 45 to 54 Years | 22 | 7.7% |
| 55 to 64 Years | 100 | 35.1% |
| 65 to 74 Years | 78 | 27.4% |
| 75 to 84 Years | 27 | 9.5% |
| 85 Years and Over | 11 | 3.9% |
| Total | 285 | 100.0% |
Housing Finances in Washington Grove
Median Income by Occupancy in Washington Grove
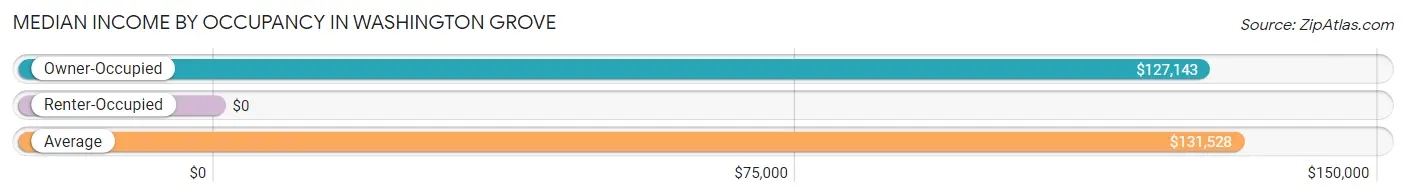
| Occupancy Type | # Households | Median Income |
| Owner-Occupied | 272 (95.4%) | $127,143 |
| Renter-Occupied | 13 (4.6%) | $0 |
| Average | 285 (100.0%) | $131,528 |
Occupancy by Householder Income Bracket in Washington Grove
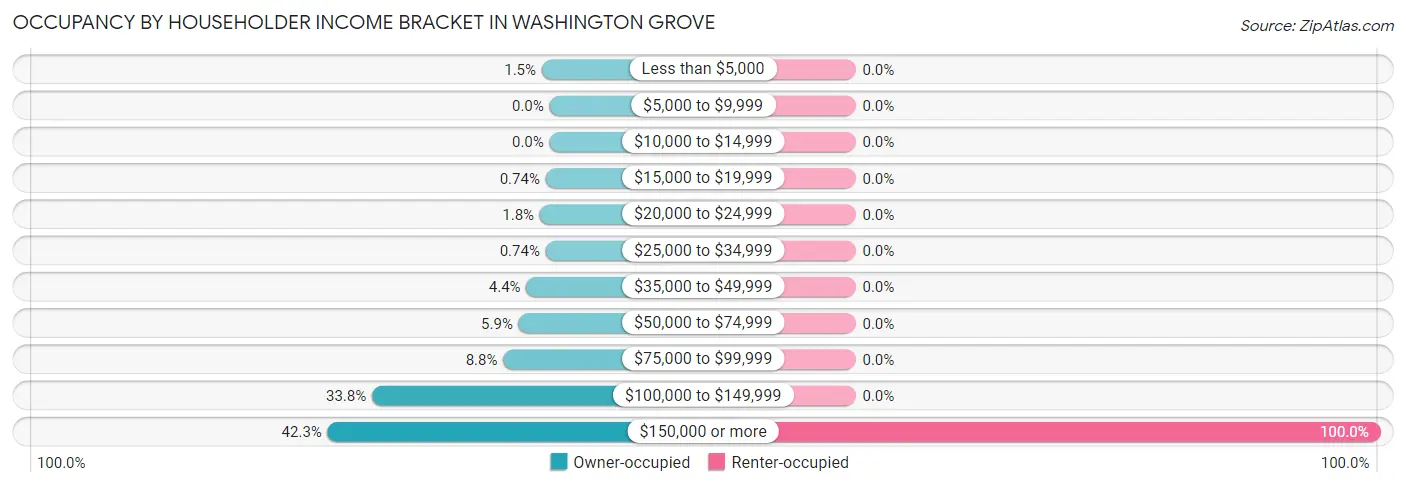
| Income Bracket | Owner-occupied | Renter-occupied |
| Less than $5,000 | 4 (1.5%) | 0 (0.0%) |
| $5,000 to $9,999 | 0 (0.0%) | 0 (0.0%) |
| $10,000 to $14,999 | 0 (0.0%) | 0 (0.0%) |
| $15,000 to $19,999 | 2 (0.7%) | 0 (0.0%) |
| $20,000 to $24,999 | 5 (1.8%) | 0 (0.0%) |
| $25,000 to $34,999 | 2 (0.7%) | 0 (0.0%) |
| $35,000 to $49,999 | 12 (4.4%) | 0 (0.0%) |
| $50,000 to $74,999 | 16 (5.9%) | 0 (0.0%) |
| $75,000 to $99,999 | 24 (8.8%) | 0 (0.0%) |
| $100,000 to $149,999 | 92 (33.8%) | 0 (0.0%) |
| $150,000 or more | 115 (42.3%) | 13 (100.0%) |
| Total | 272 (100.0%) | 13 (100.0%) |
Monthly Housing Cost Tiers in Washington Grove
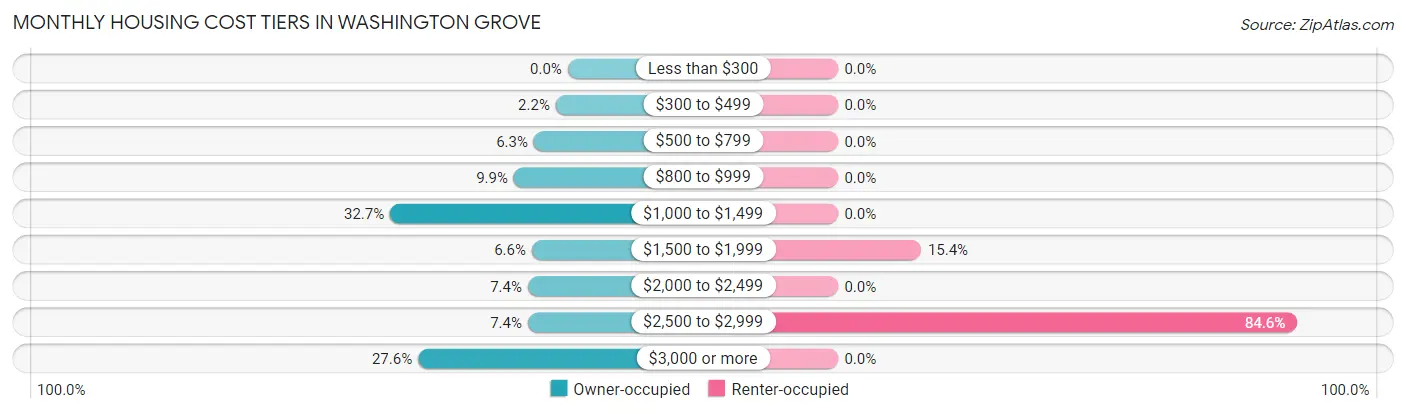
| Monthly Cost | Owner-occupied | Renter-occupied |
| Less than $300 | 0 (0.0%) | 0 (0.0%) |
| $300 to $499 | 6 (2.2%) | 0 (0.0%) |
| $500 to $799 | 17 (6.2%) | 0 (0.0%) |
| $800 to $999 | 27 (9.9%) | 0 (0.0%) |
| $1,000 to $1,499 | 89 (32.7%) | 0 (0.0%) |
| $1,500 to $1,999 | 18 (6.6%) | 2 (15.4%) |
| $2,000 to $2,499 | 20 (7.3%) | 0 (0.0%) |
| $2,500 to $2,999 | 20 (7.3%) | 11 (84.6%) |
| $3,000 or more | 75 (27.6%) | 0 (0.0%) |
| Total | 272 (100.0%) | 13 (100.0%) |
Physical Housing Characteristics in Washington Grove
Housing Structures in Washington Grove
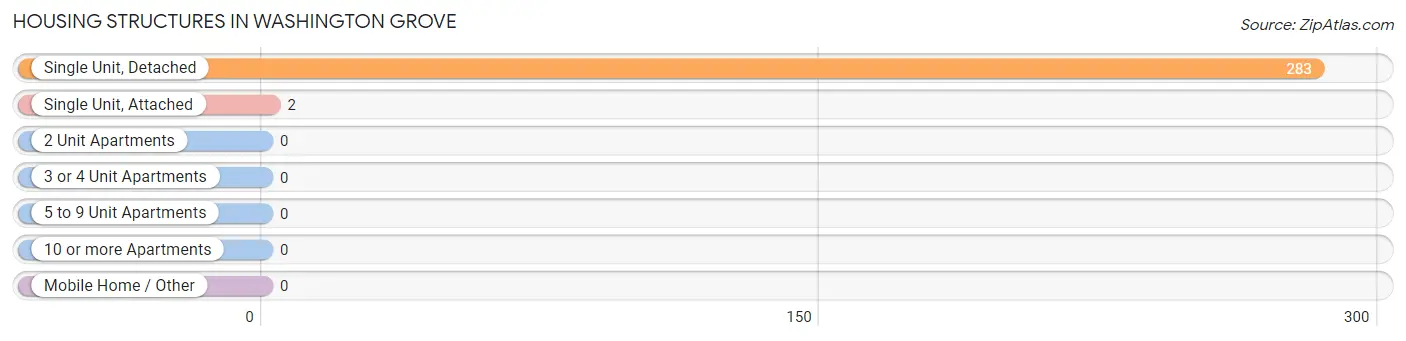
| Structure Type | # Housing Units | % Housing Units |
| Single Unit, Detached | 283 | 99.3% |
| Single Unit, Attached | 2 | 0.7% |
| 2 Unit Apartments | 0 | 0.0% |
| 3 or 4 Unit Apartments | 0 | 0.0% |
| 5 to 9 Unit Apartments | 0 | 0.0% |
| 10 or more Apartments | 0 | 0.0% |
| Mobile Home / Other | 0 | 0.0% |
| Total | 285 | 100.0% |
Housing Structures by Occupancy in Washington Grove
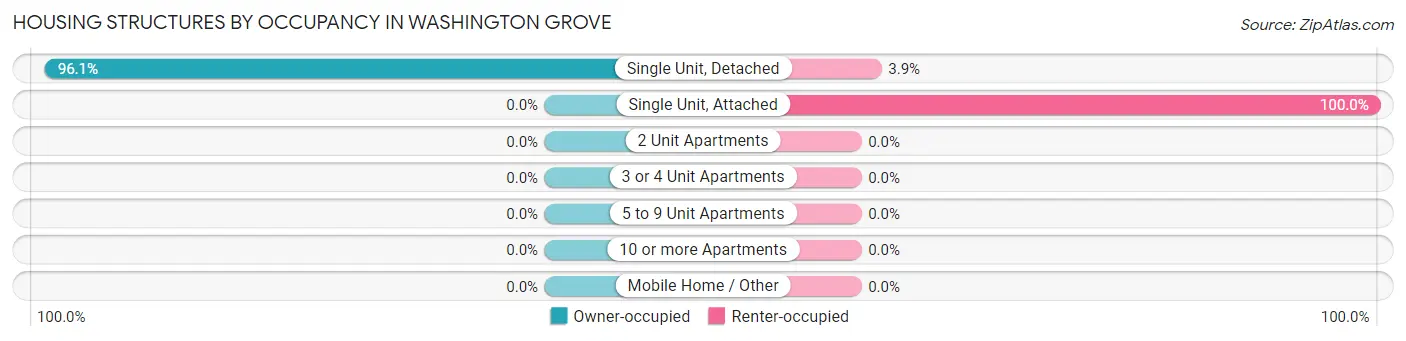
| Structure Type | Owner-occupied | Renter-occupied |
| Single Unit, Detached | 272 (96.1%) | 11 (3.9%) |
| Single Unit, Attached | 0 (0.0%) | 2 (100.0%) |
| 2 Unit Apartments | 0 (0.0%) | 0 (0.0%) |
| 3 or 4 Unit Apartments | 0 (0.0%) | 0 (0.0%) |
| 5 to 9 Unit Apartments | 0 (0.0%) | 0 (0.0%) |
| 10 or more Apartments | 0 (0.0%) | 0 (0.0%) |
| Mobile Home / Other | 0 (0.0%) | 0 (0.0%) |
| Total | 272 (95.4%) | 13 (4.6%) |
Housing Structures by Number of Rooms in Washington Grove
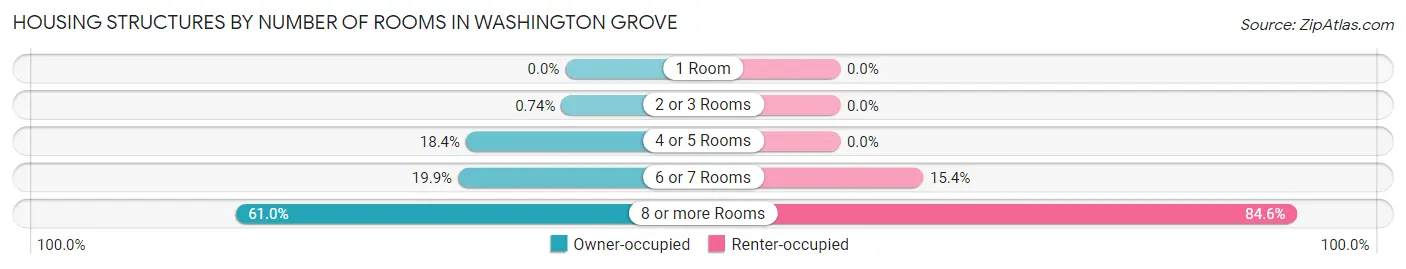
| Number of Rooms | Owner-occupied | Renter-occupied |
| 1 Room | 0 (0.0%) | 0 (0.0%) |
| 2 or 3 Rooms | 2 (0.7%) | 0 (0.0%) |
| 4 or 5 Rooms | 50 (18.4%) | 0 (0.0%) |
| 6 or 7 Rooms | 54 (19.9%) | 2 (15.4%) |
| 8 or more Rooms | 166 (61.0%) | 11 (84.6%) |
| Total | 272 (100.0%) | 13 (100.0%) |
Housing Structure by Heating Type in Washington Grove
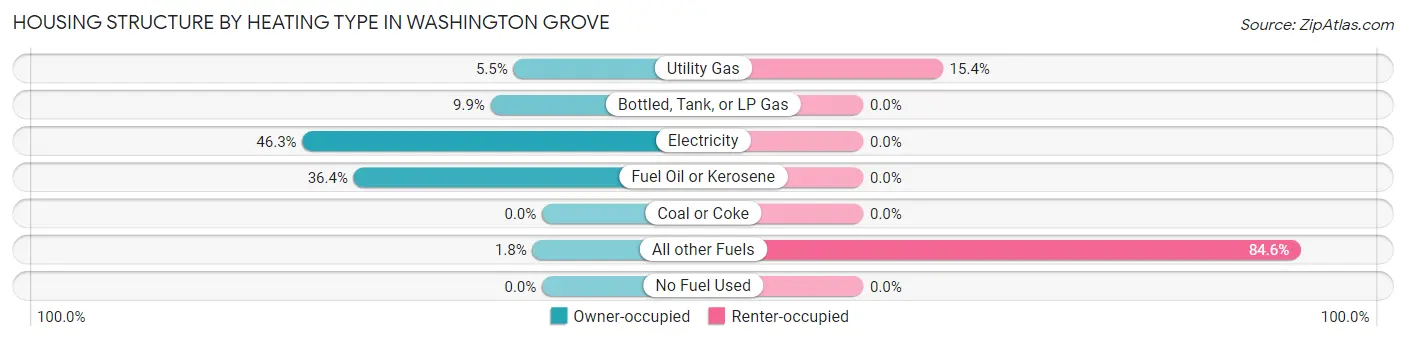
| Heating Type | Owner-occupied | Renter-occupied |
| Utility Gas | 15 (5.5%) | 2 (15.4%) |
| Bottled, Tank, or LP Gas | 27 (9.9%) | 0 (0.0%) |
| Electricity | 126 (46.3%) | 0 (0.0%) |
| Fuel Oil or Kerosene | 99 (36.4%) | 0 (0.0%) |
| Coal or Coke | 0 (0.0%) | 0 (0.0%) |
| All other Fuels | 5 (1.8%) | 11 (84.6%) |
| No Fuel Used | 0 (0.0%) | 0 (0.0%) |
| Total | 272 (100.0%) | 13 (100.0%) |
Household Vehicle Usage in Washington Grove
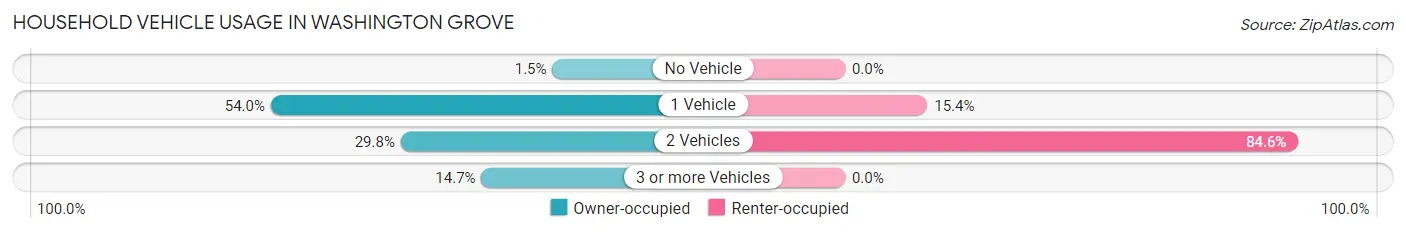
| Vehicles per Household | Owner-occupied | Renter-occupied |
| No Vehicle | 4 (1.5%) | 0 (0.0%) |
| 1 Vehicle | 147 (54.0%) | 2 (15.4%) |
| 2 Vehicles | 81 (29.8%) | 11 (84.6%) |
| 3 or more Vehicles | 40 (14.7%) | 0 (0.0%) |
| Total | 272 (100.0%) | 13 (100.0%) |
Real Estate & Mortgages in Washington Grove
Real Estate and Mortgage Overview in Washington Grove
| Characteristic | Without Mortgage | With Mortgage |
| Housing Units | 117 | 155 |
| Median Property Value | $608,200 | $514,800 |
| Median Household Income | $108,977 | $81 |
| Monthly Housing Costs | $1,028 | $75 |
| Real Estate Taxes | $6,065 | $1 |
Property Value by Mortgage Status in Washington Grove
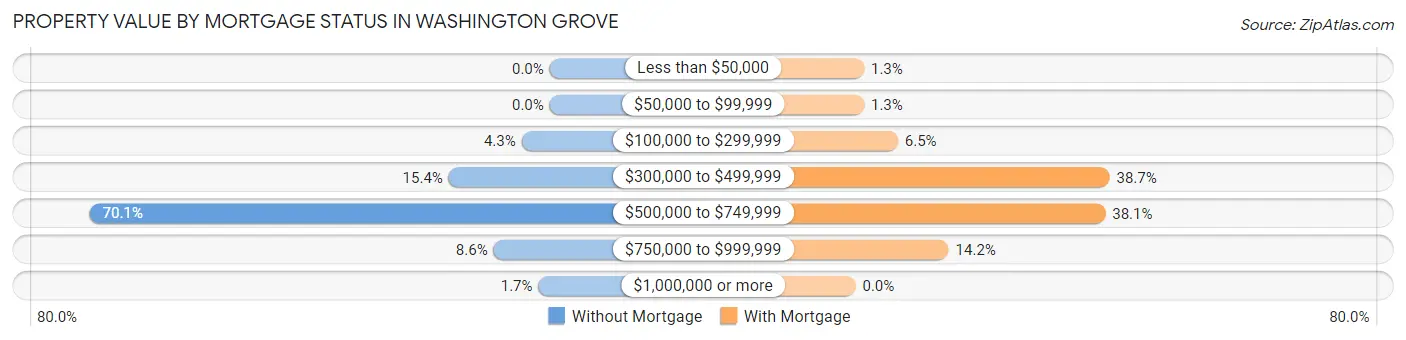
| Property Value | Without Mortgage | With Mortgage |
| Less than $50,000 | 0 (0.0%) | 2 (1.3%) |
| $50,000 to $99,999 | 0 (0.0%) | 2 (1.3%) |
| $100,000 to $299,999 | 5 (4.3%) | 10 (6.5%) |
| $300,000 to $499,999 | 18 (15.4%) | 60 (38.7%) |
| $500,000 to $749,999 | 82 (70.1%) | 59 (38.1%) |
| $750,000 to $999,999 | 10 (8.6%) | 22 (14.2%) |
| $1,000,000 or more | 2 (1.7%) | 0 (0.0%) |
| Total | 117 (100.0%) | 155 (100.0%) |
Household Income by Mortgage Status in Washington Grove
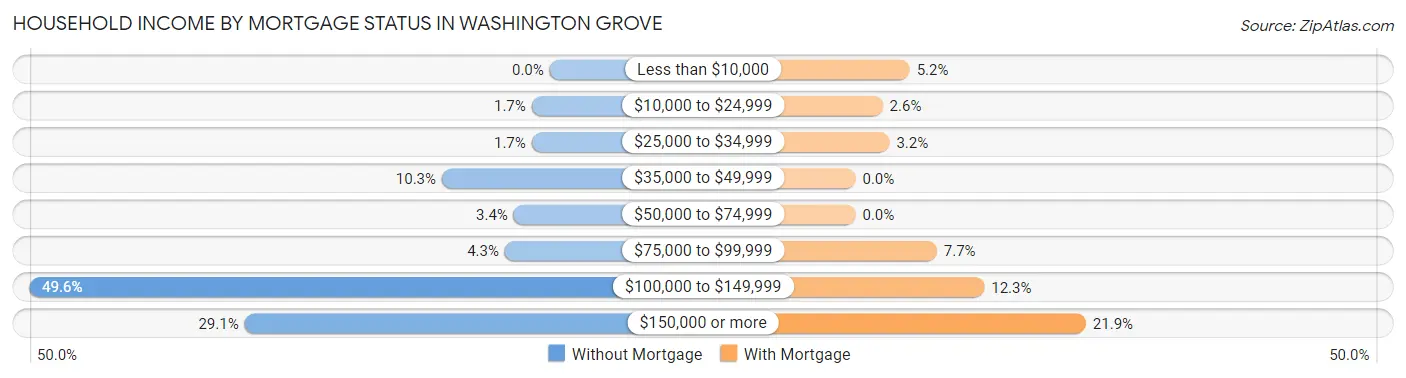
| Household Income | Without Mortgage | With Mortgage |
| Less than $10,000 | 0 (0.0%) | 8 (5.2%) |
| $10,000 to $24,999 | 2 (1.7%) | 4 (2.6%) |
| $25,000 to $34,999 | 2 (1.7%) | 5 (3.2%) |
| $35,000 to $49,999 | 12 (10.3%) | 0 (0.0%) |
| $50,000 to $74,999 | 4 (3.4%) | 0 (0.0%) |
| $75,000 to $99,999 | 5 (4.3%) | 12 (7.7%) |
| $100,000 to $149,999 | 58 (49.6%) | 19 (12.3%) |
| $150,000 or more | 34 (29.1%) | 34 (21.9%) |
| Total | 117 (100.0%) | 155 (100.0%) |
Property Value to Household Income Ratio in Washington Grove
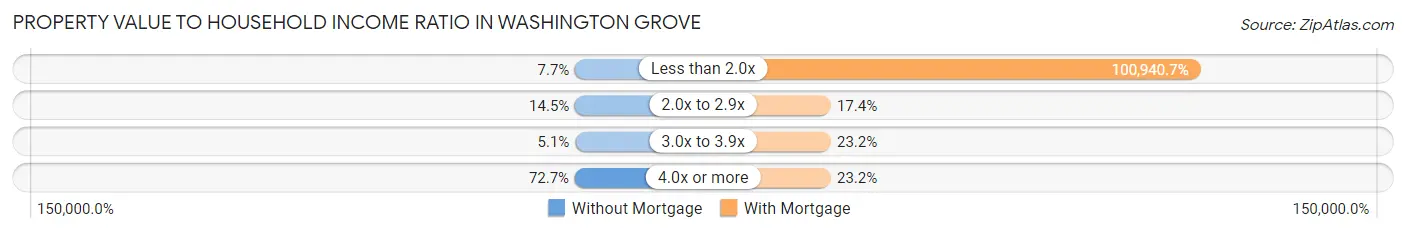
| Value-to-Income Ratio | Without Mortgage | With Mortgage |
| Less than 2.0x | 9 (7.7%) | 156,458 (100,940.7%) |
| 2.0x to 2.9x | 17 (14.5%) | 27 (17.4%) |
| 3.0x to 3.9x | 6 (5.1%) | 36 (23.2%) |
| 4.0x or more | 85 (72.7%) | 36 (23.2%) |
| Total | 117 (100.0%) | 155 (100.0%) |
Real Estate Taxes by Mortgage Status in Washington Grove
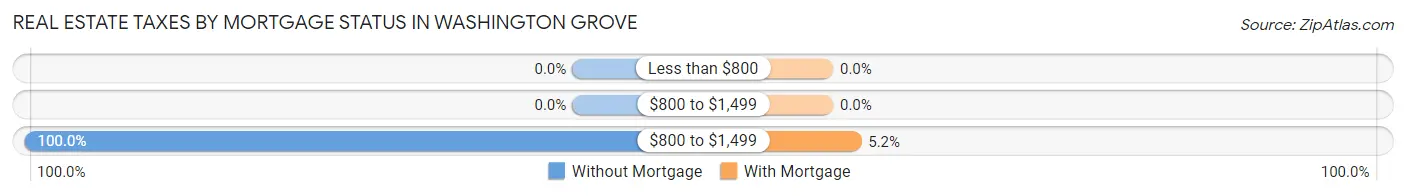
| Property Taxes | Without Mortgage | With Mortgage |
| Less than $800 | 0 (0.0%) | 0 (0.0%) |
| $800 to $1,499 | 0 (0.0%) | 0 (0.0%) |
| $800 to $1,499 | 117 (100.0%) | 8 (5.2%) |
| Total | 117 (100.0%) | 155 (100.0%) |
Health & Disability in Washington Grove
Health Insurance Coverage by Age in Washington Grove
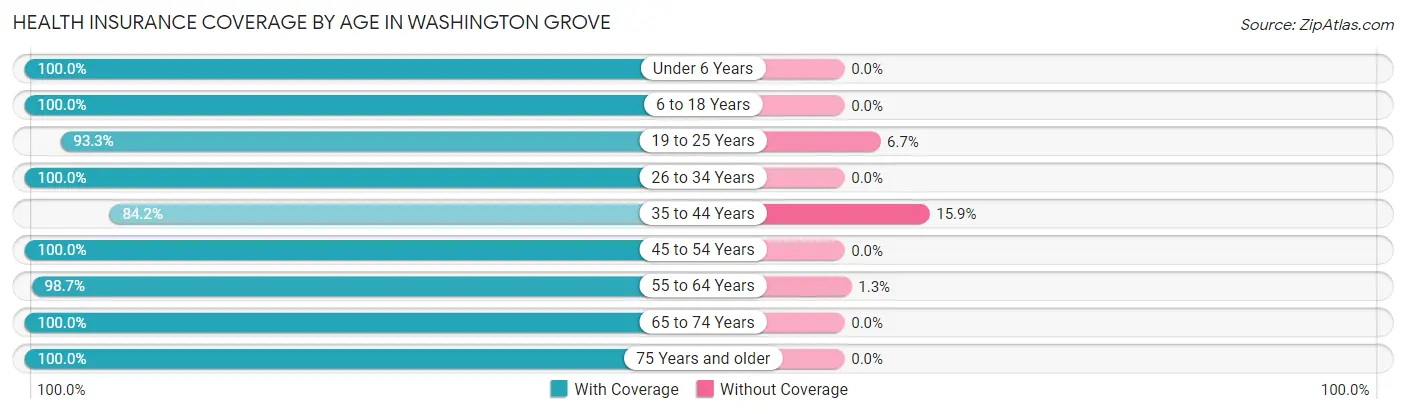
| Age Bracket | With Coverage | Without Coverage |
| Under 6 Years | 27 (100.0%) | 0 (0.0%) |
| 6 to 18 Years | 35 (100.0%) | 0 (0.0%) |
| 19 to 25 Years | 42 (93.3%) | 3 (6.7%) |
| 26 to 34 Years | 35 (100.0%) | 0 (0.0%) |
| 35 to 44 Years | 69 (84.2%) | 13 (15.9%) |
| 45 to 54 Years | 44 (100.0%) | 0 (0.0%) |
| 55 to 64 Years | 151 (98.7%) | 2 (1.3%) |
| 65 to 74 Years | 134 (100.0%) | 0 (0.0%) |
| 75 Years and older | 49 (100.0%) | 0 (0.0%) |
| Total | 586 (97.0%) | 18 (3.0%) |
Health Insurance Coverage by Citizenship Status in Washington Grove
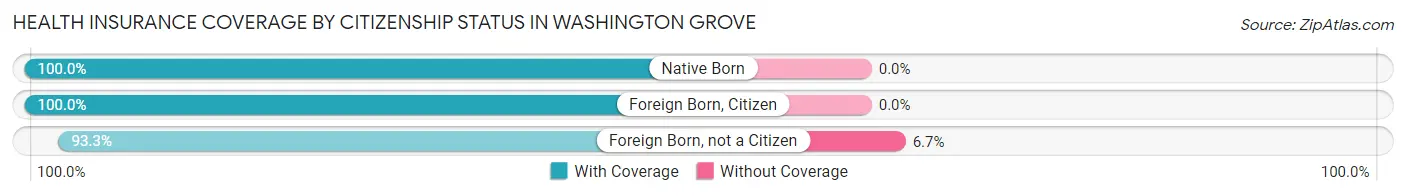
| Citizenship Status | With Coverage | Without Coverage |
| Native Born | 27 (100.0%) | 0 (0.0%) |
| Foreign Born, Citizen | 35 (100.0%) | 0 (0.0%) |
| Foreign Born, not a Citizen | 42 (93.3%) | 3 (6.7%) |
Health Insurance Coverage by Household Income in Washington Grove
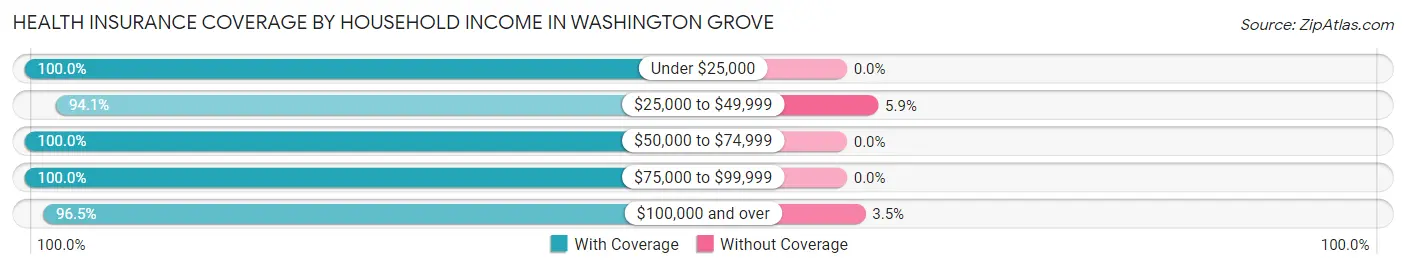
| Household Income | With Coverage | Without Coverage |
| Under $25,000 | 19 (100.0%) | 0 (0.0%) |
| $25,000 to $49,999 | 16 (94.1%) | 1 (5.9%) |
| $50,000 to $74,999 | 19 (100.0%) | 0 (0.0%) |
| $75,000 to $99,999 | 61 (100.0%) | 0 (0.0%) |
| $100,000 and over | 471 (96.5%) | 17 (3.5%) |
Public vs Private Health Insurance Coverage by Age in Washington Grove
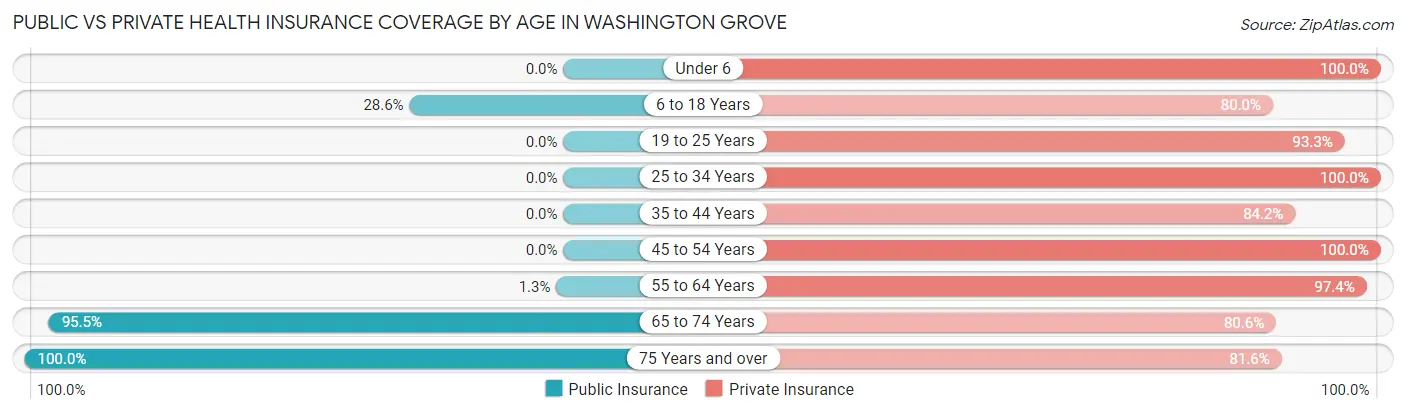
| Age Bracket | Public Insurance | Private Insurance |
| Under 6 | 0 (0.0%) | 27 (100.0%) |
| 6 to 18 Years | 10 (28.6%) | 28 (80.0%) |
| 19 to 25 Years | 0 (0.0%) | 42 (93.3%) |
| 25 to 34 Years | 0 (0.0%) | 35 (100.0%) |
| 35 to 44 Years | 0 (0.0%) | 69 (84.2%) |
| 45 to 54 Years | 0 (0.0%) | 44 (100.0%) |
| 55 to 64 Years | 2 (1.3%) | 149 (97.4%) |
| 65 to 74 Years | 128 (95.5%) | 108 (80.6%) |
| 75 Years and over | 49 (100.0%) | 40 (81.6%) |
| Total | 189 (31.3%) | 542 (89.7%) |
Disability Status by Sex by Age in Washington Grove
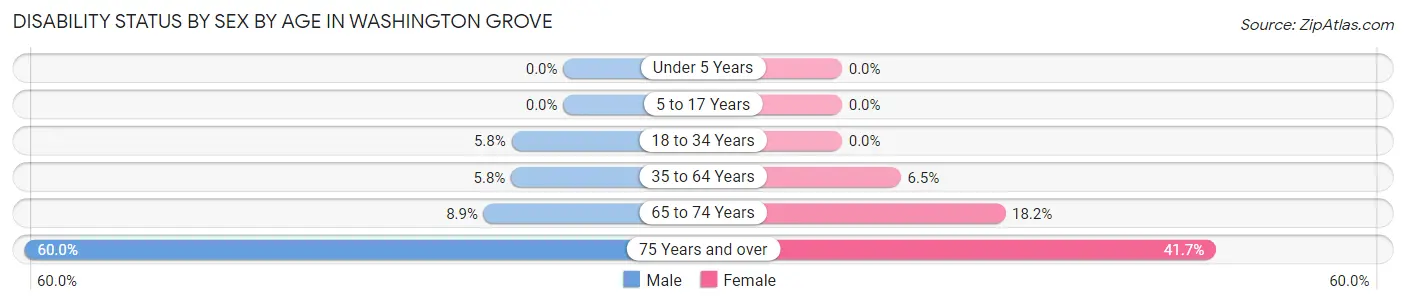
| Age Bracket | Male | Female |
| Under 5 Years | 0 (0.0%) | 0 (0.0%) |
| 5 to 17 Years | 0 (0.0%) | 0 (0.0%) |
| 18 to 34 Years | 3 (5.8%) | 0 (0.0%) |
| 35 to 64 Years | 10 (5.8%) | 7 (6.5%) |
| 65 to 74 Years | 7 (8.9%) | 10 (18.2%) |
| 75 Years and over | 15 (60.0%) | 10 (41.7%) |
Disability Class by Sex by Age in Washington Grove
Disability Class: Hearing Difficulty
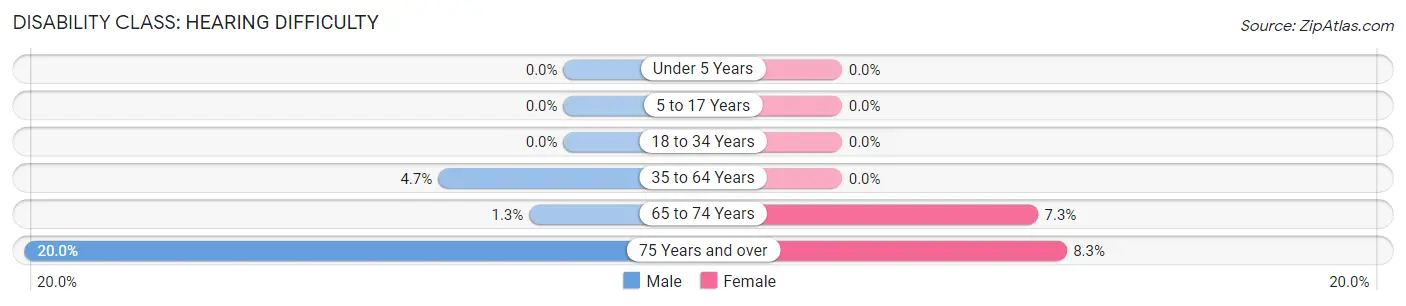
| Age Bracket | Male | Female |
| Under 5 Years | 0 (0.0%) | 0 (0.0%) |
| 5 to 17 Years | 0 (0.0%) | 0 (0.0%) |
| 18 to 34 Years | 0 (0.0%) | 0 (0.0%) |
| 35 to 64 Years | 8 (4.6%) | 0 (0.0%) |
| 65 to 74 Years | 1 (1.3%) | 4 (7.3%) |
| 75 Years and over | 5 (20.0%) | 2 (8.3%) |
Disability Class: Vision Difficulty
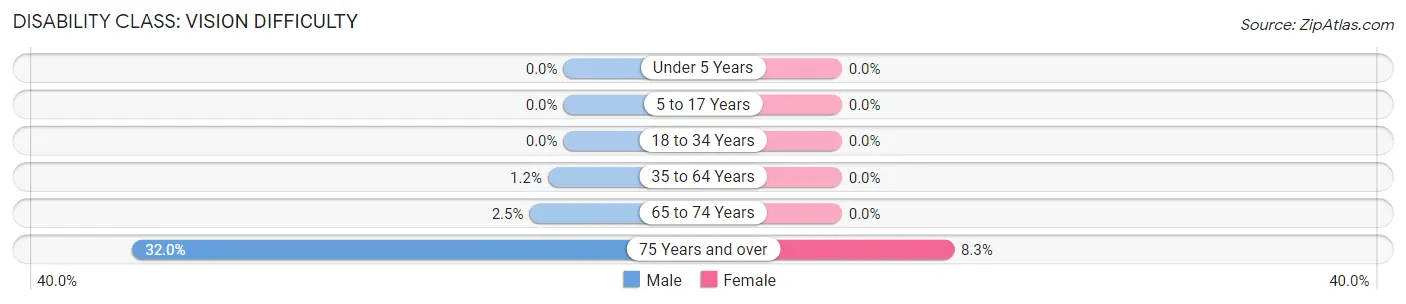
| Age Bracket | Male | Female |
| Under 5 Years | 0 (0.0%) | 0 (0.0%) |
| 5 to 17 Years | 0 (0.0%) | 0 (0.0%) |
| 18 to 34 Years | 0 (0.0%) | 0 (0.0%) |
| 35 to 64 Years | 2 (1.2%) | 0 (0.0%) |
| 65 to 74 Years | 2 (2.5%) | 0 (0.0%) |
| 75 Years and over | 8 (32.0%) | 2 (8.3%) |
Disability Class: Cognitive Difficulty
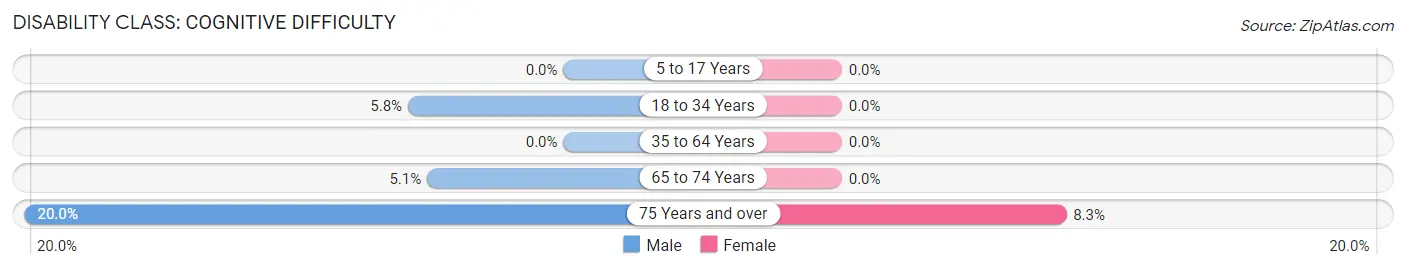
| Age Bracket | Male | Female |
| 5 to 17 Years | 0 (0.0%) | 0 (0.0%) |
| 18 to 34 Years | 3 (5.8%) | 0 (0.0%) |
| 35 to 64 Years | 0 (0.0%) | 0 (0.0%) |
| 65 to 74 Years | 4 (5.1%) | 0 (0.0%) |
| 75 Years and over | 5 (20.0%) | 2 (8.3%) |
Disability Class: Ambulatory Difficulty
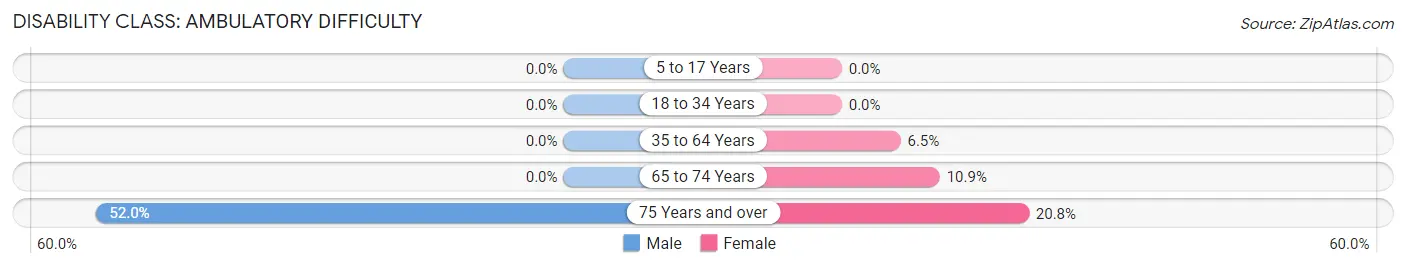
| Age Bracket | Male | Female |
| 5 to 17 Years | 0 (0.0%) | 0 (0.0%) |
| 18 to 34 Years | 0 (0.0%) | 0 (0.0%) |
| 35 to 64 Years | 0 (0.0%) | 7 (6.5%) |
| 65 to 74 Years | 0 (0.0%) | 6 (10.9%) |
| 75 Years and over | 13 (52.0%) | 5 (20.8%) |
Disability Class: Self-Care Difficulty
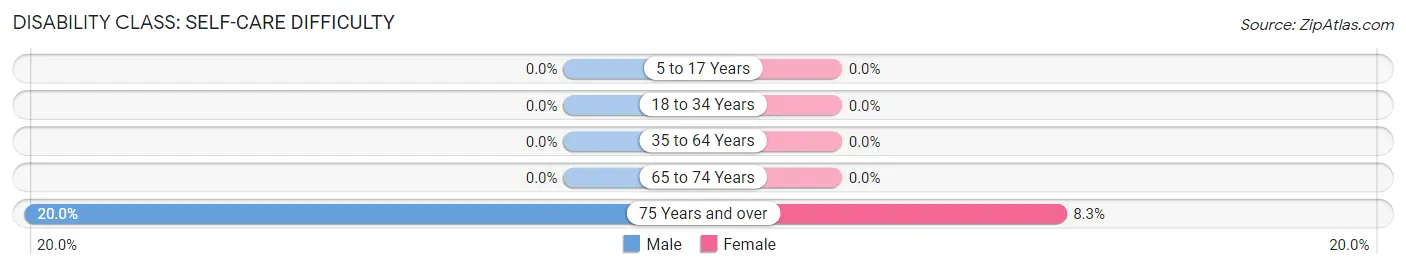
| Age Bracket | Male | Female |
| 5 to 17 Years | 0 (0.0%) | 0 (0.0%) |
| 18 to 34 Years | 0 (0.0%) | 0 (0.0%) |
| 35 to 64 Years | 0 (0.0%) | 0 (0.0%) |
| 65 to 74 Years | 0 (0.0%) | 0 (0.0%) |
| 75 Years and over | 5 (20.0%) | 2 (8.3%) |
Technology Access in Washington Grove
Computing Device Access in Washington Grove
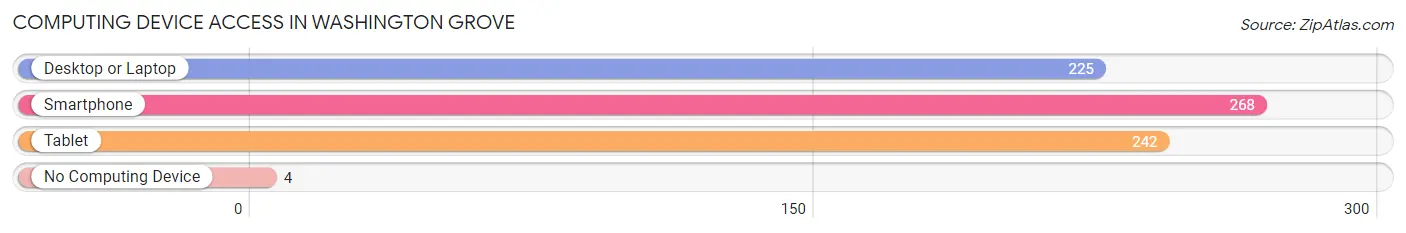
| Device Type | # Households | % Households |
| Desktop or Laptop | 225 | 78.9% |
| Smartphone | 268 | 94.0% |
| Tablet | 242 | 84.9% |
| No Computing Device | 4 | 1.4% |
| Total | 285 | 100.0% |
Internet Access in Washington Grove
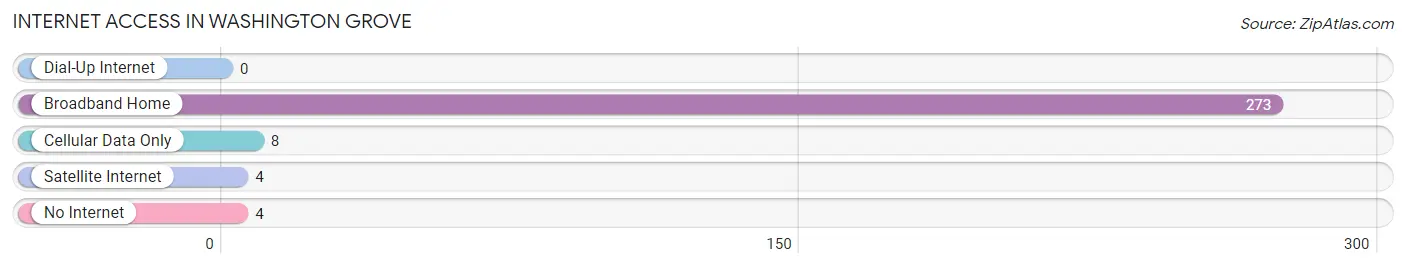
| Internet Type | # Households | % Households |
| Dial-Up Internet | 0 | 0.0% |
| Broadband Home | 273 | 95.8% |
| Cellular Data Only | 8 | 2.8% |
| Satellite Internet | 4 | 1.4% |
| No Internet | 4 | 1.4% |
| Total | 285 | 100.0% |
Washington Grove Summary
History
Washington Grove is a small, unincorporated town located in Montgomery County, Maryland. It was founded in 1873 by a group of Methodists who wanted to create a summer retreat from the hustle and bustle of Washington, D.C. The town was originally known as “Washington Grove Camp Meeting Association” and was established as a religious retreat. The town was incorporated in 1891 and was the first incorporated town in Montgomery County.
The town was designed to be a self-sustaining community, with its own water supply, roads, and electricity. The town was also designed to be a place of relaxation and recreation, with its own lake, tennis courts, and a nine-hole golf course. The town was also home to a number of churches, including the Washington Grove United Methodist Church, which was founded in 1873 and is still active today.
The town was also home to a number of businesses, including a general store, a post office, a blacksmith shop, and a hotel. The town was also home to a number of summer cottages, which were used by the town’s residents and visitors.
Geography
Washington Grove is located in Montgomery County, Maryland, approximately 25 miles northwest of Washington, D.C. The town is situated on a small hill, surrounded by a forest of oak and hickory trees. The town is bordered by the Potomac River to the east and the Chesapeake and Ohio Canal to the west.
The town covers an area of approximately 0.6 square miles and has a population of approximately 1,000 people. The town is located at an elevation of approximately 500 feet above sea level.
Economy
Washington Grove is a small, rural town and does not have a large economy. The town is primarily residential, with most of its residents employed in the nearby cities of Washington, D.C. and Baltimore. The town does have a few small businesses, including a general store, a post office, and a few restaurants.
Demographics
As of the 2010 census, the population of Washington Grove was 1,000 people. The racial makeup of the town was 94.2% White, 2.2% African American, 0.2% Native American, 0.8% Asian, 0.2% from other races, and 2.4% from two or more races. Hispanic or Latino of any race were 1.2% of the population.
The median income for a household in the town was $90,000, and the median income for a family was $100,000. The per capita income for the town was $45,000. About 4.2% of families and 5.2% of the population were below the poverty line, including 6.2% of those under age 18 and none of those age 65 or over.
Common Questions
What is Per Capita Income in Washington Grove?
Per Capita income in Washington Grove is $78,629.
What is the Median Family Income in Washington Grove?
Median Family Income in Washington Grove is $198,750.
What is the Median Household income in Washington Grove?
Median Household Income in Washington Grove is $131,528.
What is Income or Wage Gap in Washington Grove?
Income or Wage Gap in Washington Grove is 27.8%.
Women in Washington Grove earn 72.2 cents for every dollar earned by a man.
What is Inequality or Gini Index in Washington Grove?
Inequality or Gini Index in Washington Grove is 0.29.
What is the Total Population of Washington Grove?
Total Population of Washington Grove is 604.
What is the Total Male Population of Washington Grove?
Total Male Population of Washington Grove is 353.
What is the Total Female Population of Washington Grove?
Total Female Population of Washington Grove is 251.
What is the Ratio of Males per 100 Females in Washington Grove?
There are 140.64 Males per 100 Females in Washington Grove.
What is the Ratio of Females per 100 Males in Washington Grove?
There are 71.10 Females per 100 Males in Washington Grove.
What is the Median Population Age in Washington Grove?
Median Population Age in Washington Grove is 58.1 Years.
What is the Average Family Size in Washington Grove
Average Family Size in Washington Grove is 3.1 People.
What is the Average Household Size in Washington Grove
Average Household Size in Washington Grove is 2.1 People.
How Large is the Labor Force in Washington Grove?
There are 388 People in the Labor Forcein in Washington Grove.
What is the Percentage of People in the Labor Force in Washington Grove?
70.2% of People are in the Labor Force in Washington Grove.
What is the Unemployment Rate in Washington Grove?
Unemployment Rate in Washington Grove is 2.6%.