Taylor, ND Map & Demographics
Taylor Map
Taylor Overview
$39,369
PER CAPITA INCOME
$93,750
AVG FAMILY INCOME
$91,000
AVG HOUSEHOLD INCOME
24.4%
WAGE / INCOME GAP [ % ]
75.6¢/ $1
WAGE / INCOME GAP [ $ ]
0.34
INEQUALITY / GINI INDEX
186
TOTAL POPULATION
88
MALE POPULATION
98
FEMALE POPULATION
89.80
MALES / 100 FEMALES
111.36
FEMALES / 100 MALES
37.0
MEDIAN AGE
2.7
AVG FAMILY SIZE
2.3
AVG HOUSEHOLD SIZE
99
LABOR FORCE [ PEOPLE ]
72.3%
PERCENT IN LABOR FORCE
8.1%
UNEMPLOYMENT RATE
Taylor Zip Codes
Taylor Area Codes
Income in Taylor
Income Overview in Taylor
Per Capita Income in Taylor is $39,369, while median incomes of families and households are $93,750 and $91,000 respectively.
| Characteristic | Number | Measure |
| Per Capita Income | 186 | $39,369 |
| Median Family Income | 50 | $93,750 |
| Mean Family Income | 50 | $104,244 |
| Median Household Income | 80 | $91,000 |
| Mean Household Income | 80 | $91,756 |
| Income Deficit | 50 | $0 |
| Wage / Income Gap (%) | 186 | 24.44% |
| Wage / Income Gap ($) | 186 | 75.56¢ per $1 |
| Gini / Inequality Index | 186 | 0.34 |
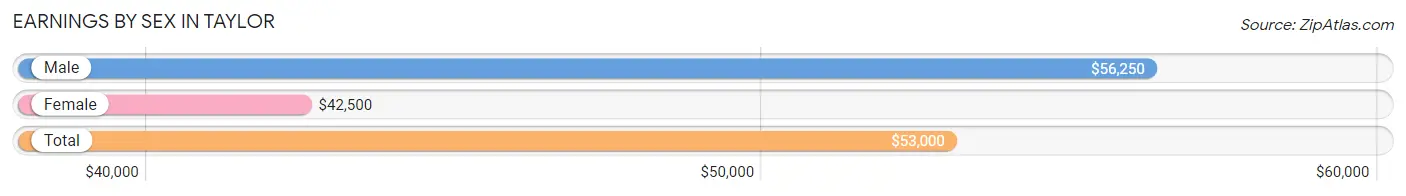
Earnings by Sex in Taylor
Average Earnings in Taylor are $53,000, $56,250 for men and $42,500 for women, a difference of 24.4%.
| Sex | Number | Average Earnings |
| Male | 62 (63.3%) | $56,250 |
| Female | 36 (36.7%) | $42,500 |
| Total | 98 (100.0%) | $53,000 |
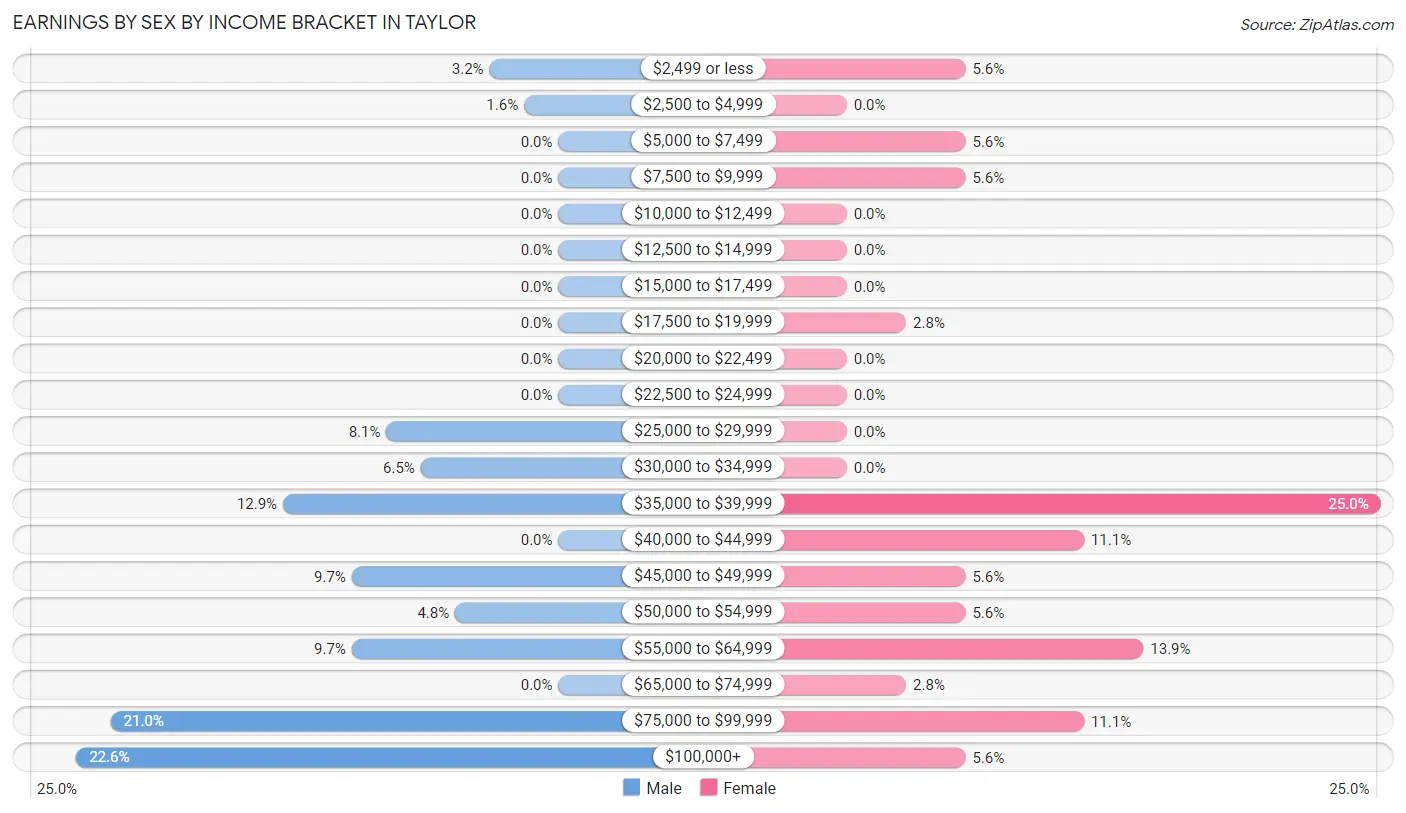
Earnings by Sex by Income Bracket in Taylor
The most common earnings brackets in Taylor are $100,000+ for men (14 | 22.6%) and $35,000 to $39,999 for women (9 | 25.0%).
| Income | Male | Female |
| $2,499 or less | 2 (3.2%) | 2 (5.6%) |
| $2,500 to $4,999 | 1 (1.6%) | 0 (0.0%) |
| $5,000 to $7,499 | 0 (0.0%) | 2 (5.6%) |
| $7,500 to $9,999 | 0 (0.0%) | 2 (5.6%) |
| $10,000 to $12,499 | 0 (0.0%) | 0 (0.0%) |
| $12,500 to $14,999 | 0 (0.0%) | 0 (0.0%) |
| $15,000 to $17,499 | 0 (0.0%) | 0 (0.0%) |
| $17,500 to $19,999 | 0 (0.0%) | 1 (2.8%) |
| $20,000 to $22,499 | 0 (0.0%) | 0 (0.0%) |
| $22,500 to $24,999 | 0 (0.0%) | 0 (0.0%) |
| $25,000 to $29,999 | 5 (8.1%) | 0 (0.0%) |
| $30,000 to $34,999 | 4 (6.5%) | 0 (0.0%) |
| $35,000 to $39,999 | 8 (12.9%) | 9 (25.0%) |
| $40,000 to $44,999 | 0 (0.0%) | 4 (11.1%) |
| $45,000 to $49,999 | 6 (9.7%) | 2 (5.6%) |
| $50,000 to $54,999 | 3 (4.8%) | 2 (5.6%) |
| $55,000 to $64,999 | 6 (9.7%) | 5 (13.9%) |
| $65,000 to $74,999 | 0 (0.0%) | 1 (2.8%) |
| $75,000 to $99,999 | 13 (21.0%) | 4 (11.1%) |
| $100,000+ | 14 (22.6%) | 2 (5.6%) |
| Total | 62 (100.0%) | 36 (100.0%) |
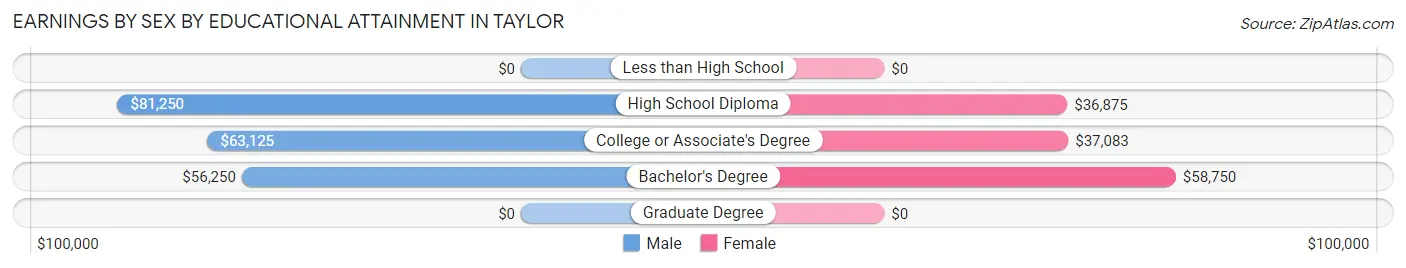
Earnings by Sex by Educational Attainment in Taylor
Average earnings in Taylor are $63,750 for men and $44,375 for women, a difference of 30.4%. Men with an educational attainment of high school diploma enjoy the highest average annual earnings of $81,250, while those with bachelor's degree education earn the least with $56,250. Women with an educational attainment of bachelor's degree earn the most with the average annual earnings of $58,750, while those with high school diploma education have the smallest earnings of $36,875.
| Educational Attainment | Male Income | Female Income |
| Less than High School | - | - |
| High School Diploma | $81,250 | $36,875 |
| College or Associate's Degree | $63,125 | $37,083 |
| Bachelor's Degree | $56,250 | $58,750 |
| Graduate Degree | - | - |
| Total | $63,750 | $44,375 |
Family Income in Taylor
Family Income Brackets in Taylor
According to the Taylor family income data, there are 12 families falling into the $100,000 to $149,999 income range, which is the most common income bracket and makes up 24.0% of all families.
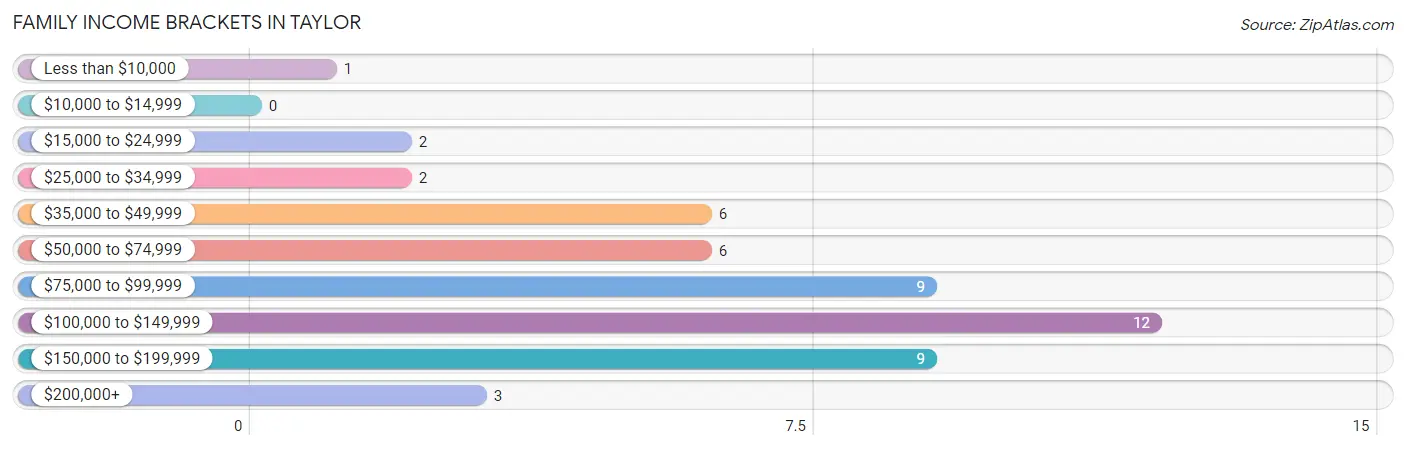
| Income Bracket | # Families | % Families |
| Less than $10,000 | 1 | 2.0% |
| $10,000 to $14,999 | 0 | 0.0% |
| $15,000 to $24,999 | 2 | 4.0% |
| $25,000 to $34,999 | 2 | 4.0% |
| $35,000 to $49,999 | 6 | 12.0% |
| $50,000 to $74,999 | 6 | 12.0% |
| $75,000 to $99,999 | 9 | 18.0% |
| $100,000 to $149,999 | 12 | 24.0% |
| $150,000 to $199,999 | 9 | 18.0% |
| $200,000+ | 3 | 6.0% |
Family Income by Famaliy Size in Taylor
3-person families (10 | 20.0%) account for the highest median family income in Taylor with $102,500 per family, while 3-person families (10 | 20.0%) have the highest median income of $34,167 per family member.
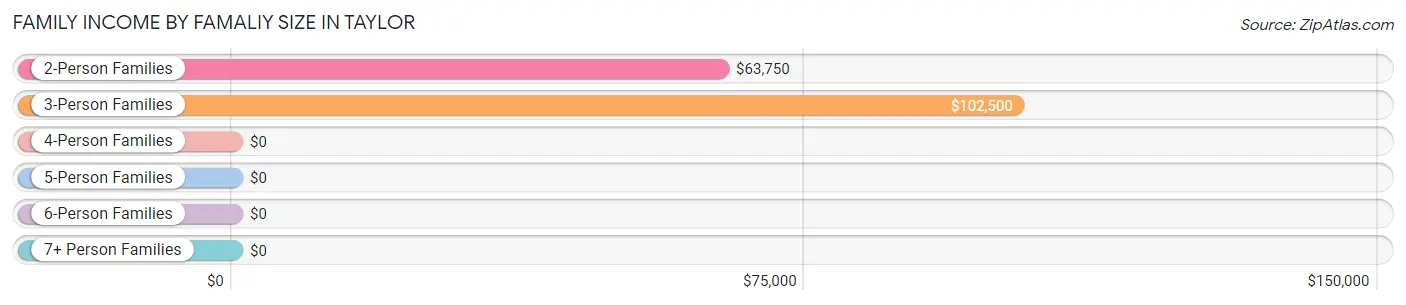
| Income Bracket | # Families | Median Income |
| 2-Person Families | 29 (58.0%) | $63,750 |
| 3-Person Families | 10 (20.0%) | $102,500 |
| 4-Person Families | 7 (14.0%) | $0 |
| 5-Person Families | 1 (2.0%) | $0 |
| 6-Person Families | 2 (4.0%) | $0 |
| 7+ Person Families | 1 (2.0%) | $0 |
| Total | 50 (100.0%) | $93,750 |
Family Income by Number of Earners in Taylor
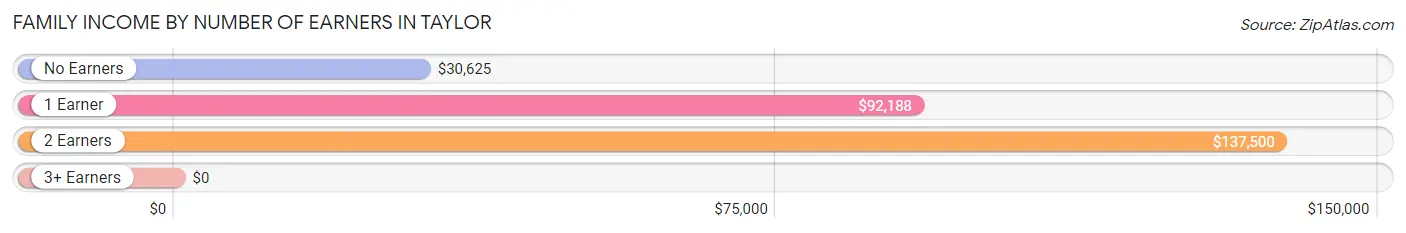
| Number of Earners | # Families | Median Income |
| No Earners | 7 (14.0%) | $30,625 |
| 1 Earner | 27 (54.0%) | $92,188 |
| 2 Earners | 14 (28.0%) | $137,500 |
| 3+ Earners | 2 (4.0%) | $0 |
| Total | 50 (100.0%) | $93,750 |
Household Income in Taylor
Household Income Brackets in Taylor
With 20 households falling in the category, the $75,000 to $99,999 income range is the most frequent in Taylor, accounting for 25.0% of all households.
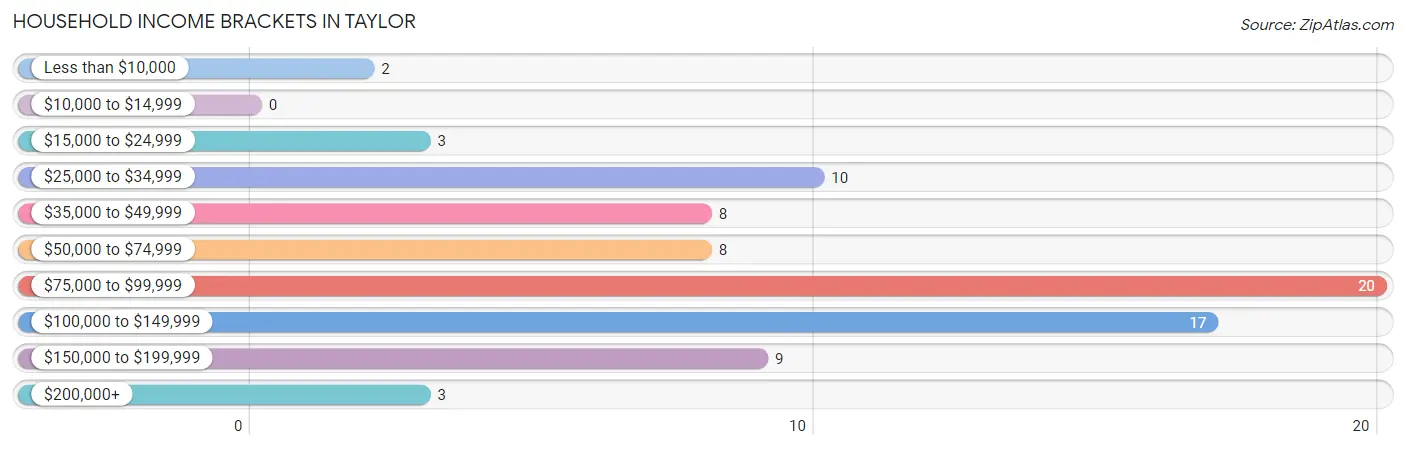
| Income Bracket | # Households | % Households |
| Less than $10,000 | 2 | 2.5% |
| $10,000 to $14,999 | 0 | 0.0% |
| $15,000 to $24,999 | 3 | 3.8% |
| $25,000 to $34,999 | 10 | 12.5% |
| $35,000 to $49,999 | 8 | 10.0% |
| $50,000 to $74,999 | 8 | 10.0% |
| $75,000 to $99,999 | 20 | 25.0% |
| $100,000 to $149,999 | 17 | 21.3% |
| $150,000 to $199,999 | 9 | 11.3% |
| $200,000+ | 3 | 3.8% |
Household Income by Householder Age in Taylor
The median household income in Taylor is $91,000, with the highest median household income of $132,500 found in the 45 to 64 years age bracket for the primary householder. A total of 24 households (30.0%) fall into this category. Meanwhile, the 15 to 24 years age bracket for the primary householder has the lowest median household income of $0, with 3 households (3.7%) in this group.
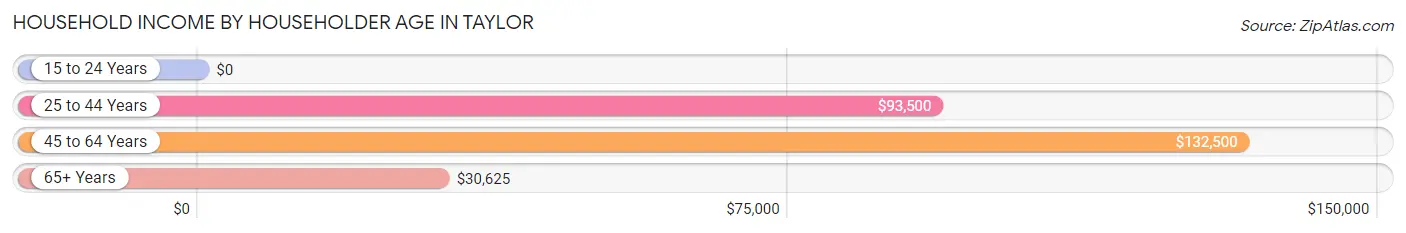
| Income Bracket | # Households | Median Income |
| 15 to 24 Years | 3 (3.7%) | $0 |
| 25 to 44 Years | 26 (32.5%) | $93,500 |
| 45 to 64 Years | 24 (30.0%) | $132,500 |
| 65+ Years | 27 (33.8%) | $30,625 |
| Total | 80 (100.0%) | $91,000 |
Poverty in Taylor
Income Below Poverty by Sex and Age in Taylor
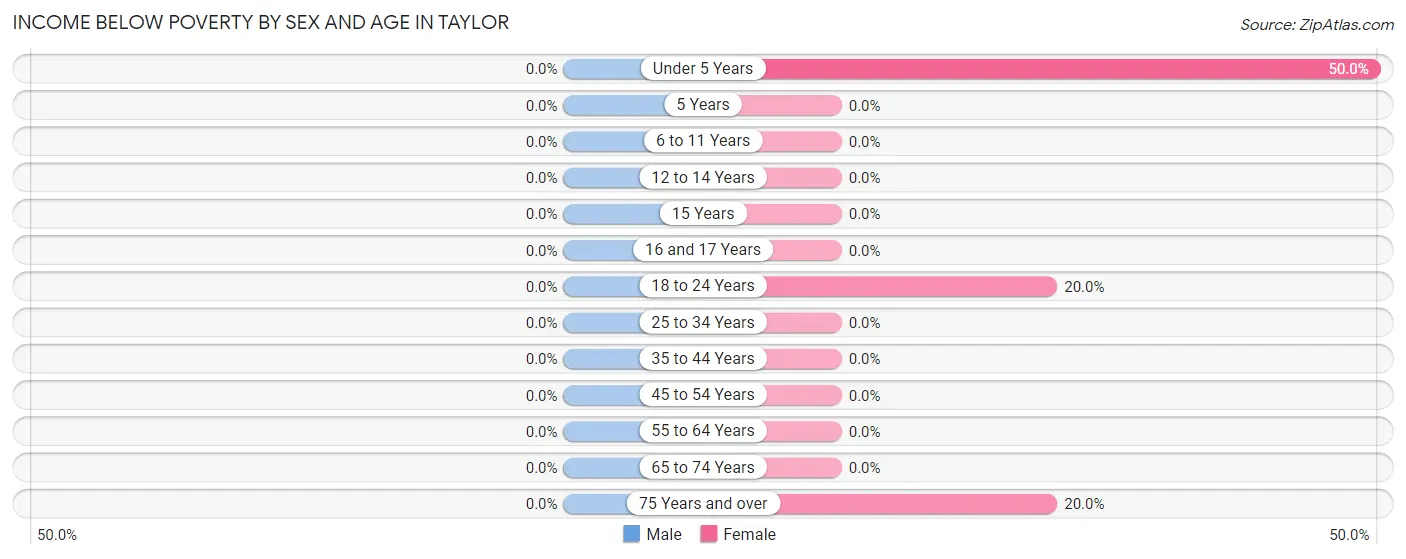
| Age Bracket | Male | Female |
| Under 5 Years | 0 (0.0%) | 2 (50.0%) |
| 5 Years | 0 (0.0%) | 0 (0.0%) |
| 6 to 11 Years | 0 (0.0%) | 0 (0.0%) |
| 12 to 14 Years | 0 (0.0%) | 0 (0.0%) |
| 15 Years | 0 (0.0%) | 0 (0.0%) |
| 16 and 17 Years | 0 (0.0%) | 0 (0.0%) |
| 18 to 24 Years | 0 (0.0%) | 1 (20.0%) |
| 25 to 34 Years | 0 (0.0%) | 0 (0.0%) |
| 35 to 44 Years | 0 (0.0%) | 0 (0.0%) |
| 45 to 54 Years | 0 (0.0%) | 0 (0.0%) |
| 55 to 64 Years | 0 (0.0%) | 0 (0.0%) |
| 65 to 74 Years | 0 (0.0%) | 0 (0.0%) |
| 75 Years and over | 0 (0.0%) | 2 (20.0%) |
| Total | 0 (0.0%) | 5 (5.4%) |
Income Above Poverty by Sex and Age in Taylor
According to the poverty statistics in Taylor, males aged under 5 years and females aged 5 years are the age groups that are most secure financially, with 100.0% of males and 100.0% of females in these age groups living above the poverty line.
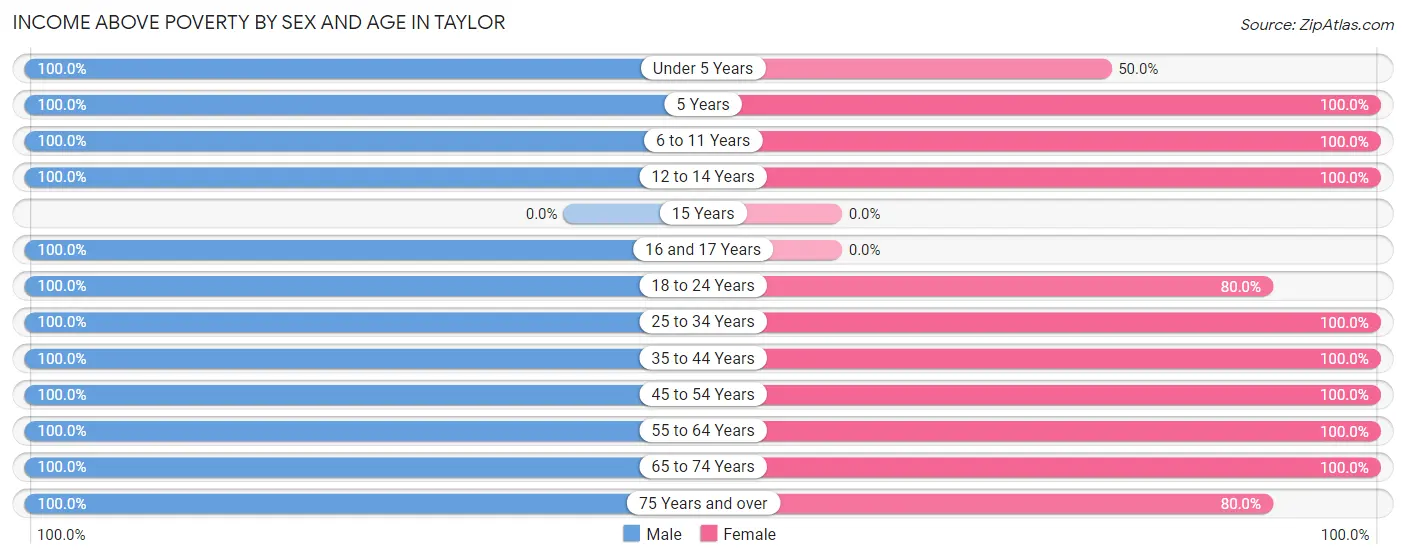
| Age Bracket | Male | Female |
| Under 5 Years | 6 (100.0%) | 2 (50.0%) |
| 5 Years | 1 (100.0%) | 8 (100.0%) |
| 6 to 11 Years | 4 (100.0%) | 13 (100.0%) |
| 12 to 14 Years | 1 (100.0%) | 6 (100.0%) |
| 15 Years | 0 (0.0%) | 0 (0.0%) |
| 16 and 17 Years | 3 (100.0%) | 0 (0.0%) |
| 18 to 24 Years | 6 (100.0%) | 4 (80.0%) |
| 25 to 34 Years | 12 (100.0%) | 3 (100.0%) |
| 35 to 44 Years | 12 (100.0%) | 17 (100.0%) |
| 45 to 54 Years | 13 (100.0%) | 7 (100.0%) |
| 55 to 64 Years | 13 (100.0%) | 9 (100.0%) |
| 65 to 74 Years | 11 (100.0%) | 10 (100.0%) |
| 75 Years and over | 6 (100.0%) | 8 (80.0%) |
| Total | 88 (100.0%) | 87 (94.6%) |
Income Below Poverty Among Married-Couple Families in Taylor
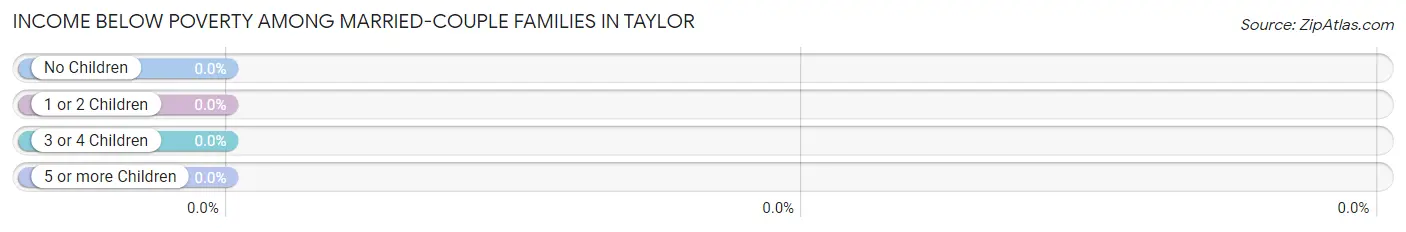
| Children | Above Poverty | Below Poverty |
| No Children | 20 (100.0%) | 0 (0.0%) |
| 1 or 2 Children | 12 (100.0%) | 0 (0.0%) |
| 3 or 4 Children | 4 (100.0%) | 0 (0.0%) |
| 5 or more Children | 0 (0.0%) | 0 (0.0%) |
| Total | 36 (100.0%) | 0 (0.0%) |
Income Below Poverty Among Single-Parent Households in Taylor
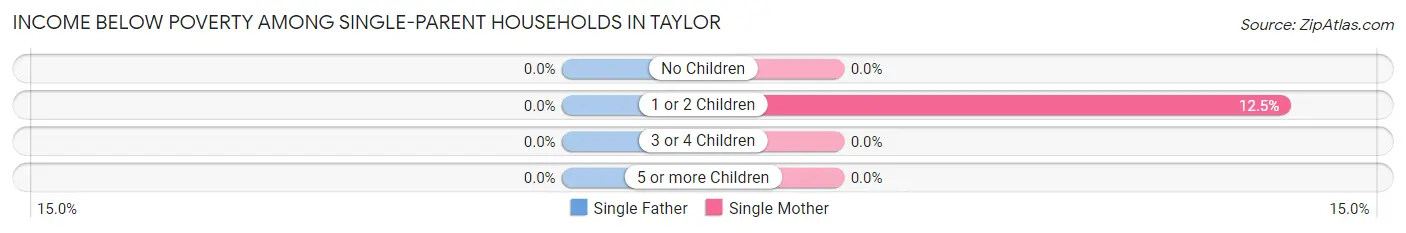
| Children | Single Father | Single Mother |
| No Children | 0 (0.0%) | 0 (0.0%) |
| 1 or 2 Children | 0 (0.0%) | 1 (12.5%) |
| 3 or 4 Children | 0 (0.0%) | 0 (0.0%) |
| 5 or more Children | 0 (0.0%) | 0 (0.0%) |
| Total | 0 (0.0%) | 1 (11.1%) |
Income Below Poverty Among Married-Couple vs Single-Parent Households in Taylor
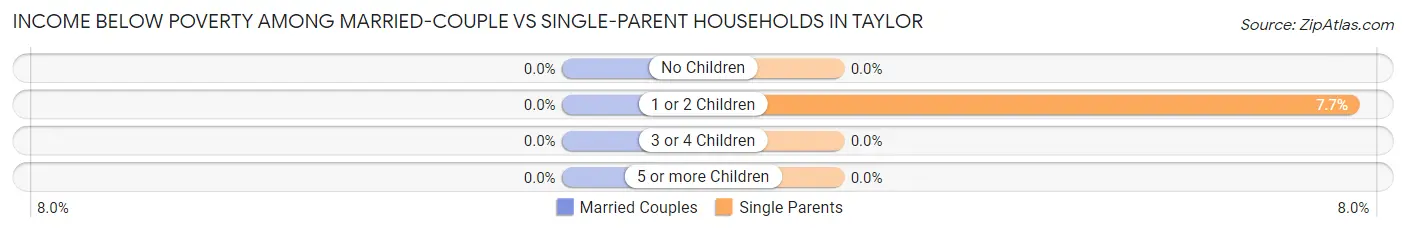
| Children | Married-Couple Families | Single-Parent Households |
| No Children | 0 (0.0%) | 0 (0.0%) |
| 1 or 2 Children | 0 (0.0%) | 1 (7.7%) |
| 3 or 4 Children | 0 (0.0%) | 0 (0.0%) |
| 5 or more Children | 0 (0.0%) | 0 (0.0%) |
| Total | 0 (0.0%) | 1 (7.1%) |
Race in Taylor
The most populous races in Taylor are White / Caucasian (153 | 82.3%), Two or more Races (17 | 9.1%), and Asian (7 | 3.8%).
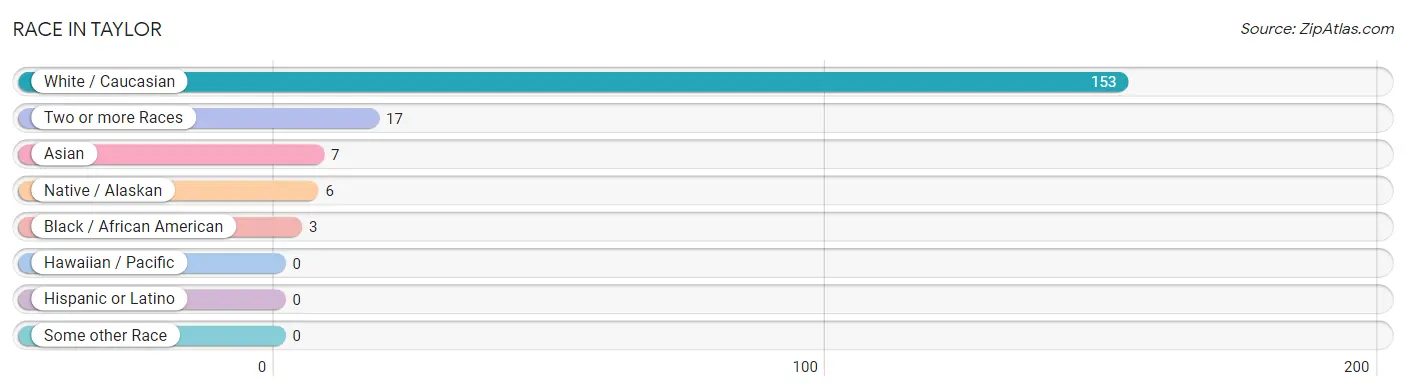
| Race | # Population | % Population |
| Asian | 7 | 3.8% |
| Black / African American | 3 | 1.6% |
| Hawaiian / Pacific | 0 | 0.0% |
| Hispanic or Latino | 0 | 0.0% |
| Native / Alaskan | 6 | 3.2% |
| White / Caucasian | 153 | 82.3% |
| Two or more Races | 17 | 9.1% |
| Some other Race | 0 | 0.0% |
| Total | 186 | 100.0% |
Ancestry in Taylor
The most populous ancestries reported in Taylor are German (55 | 29.6%), Norwegian (35 | 18.8%), American (23 | 12.4%), Korean (15 | 8.1%), and English (14 | 7.5%), together accounting for 76.4% of all Taylor residents.
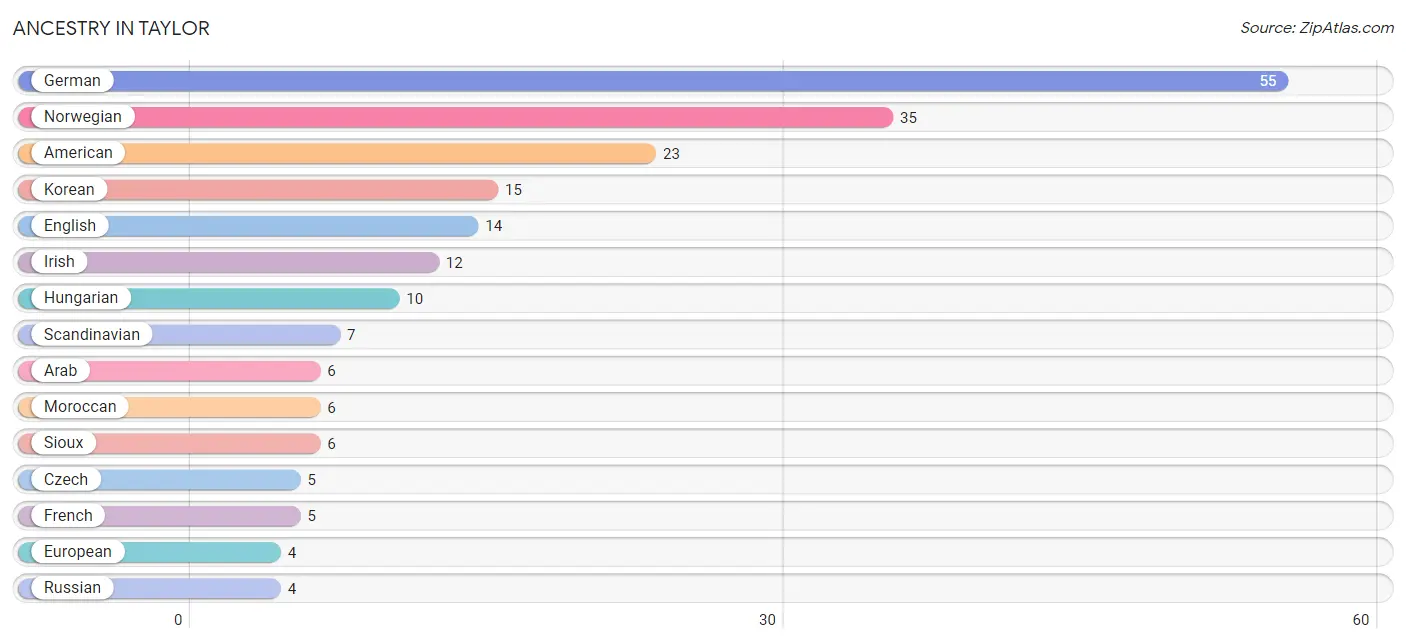
| Ancestry | # Population | % Population |
| American | 23 | 12.4% |
| Arab | 6 | 3.2% |
| Czech | 5 | 2.7% |
| Danish | 3 | 1.6% |
| English | 14 | 7.5% |
| European | 4 | 2.1% |
| Filipino | 2 | 1.1% |
| Finnish | 1 | 0.5% |
| French | 5 | 2.7% |
| French Canadian | 2 | 1.1% |
| German | 55 | 29.6% |
| Hungarian | 10 | 5.4% |
| Irish | 12 | 6.5% |
| Korean | 15 | 8.1% |
| Moroccan | 6 | 3.2% |
| Norwegian | 35 | 18.8% |
| Pennsylvania German | 3 | 1.6% |
| Russian | 4 | 2.1% |
| Scandinavian | 7 | 3.8% |
| Scottish | 2 | 1.1% |
| Sioux | 6 | 3.2% |
| Subsaharan African | 3 | 1.6% |
| Swedish | 3 | 1.6% |
| Ukrainian | 4 | 2.1% | View All 24 Rows |
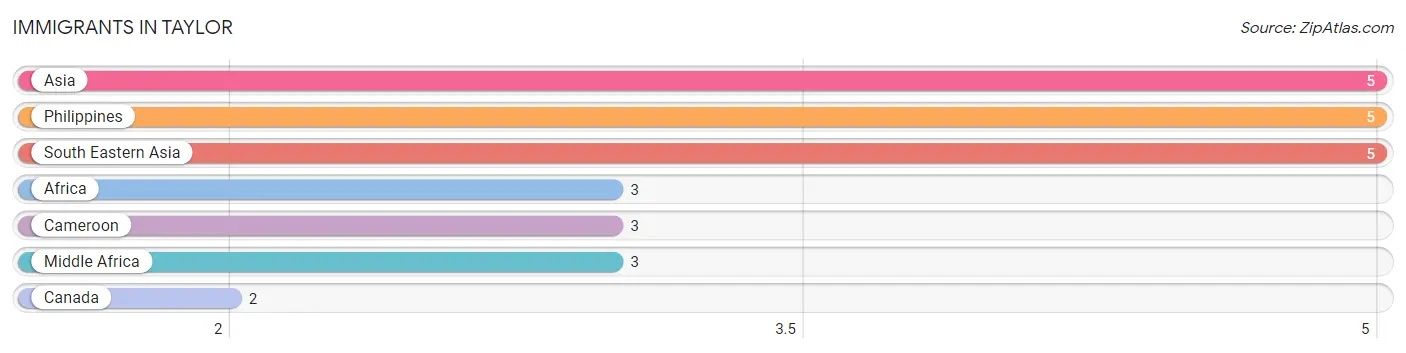
Immigrants in Taylor
The most numerous immigrant groups reported in Taylor came from Asia (5 | 2.7%), Philippines (5 | 2.7%), South Eastern Asia (5 | 2.7%), Africa (3 | 1.6%), and Cameroon (3 | 1.6%), together accounting for 11.3% of all Taylor residents.
| Immigration Origin | # Population | % Population |
| Africa | 3 | 1.6% |
| Asia | 5 | 2.7% |
| Cameroon | 3 | 1.6% |
| Canada | 2 | 1.1% |
| Middle Africa | 3 | 1.6% |
| Philippines | 5 | 2.7% |
| South Eastern Asia | 5 | 2.7% | View All 7 Rows |
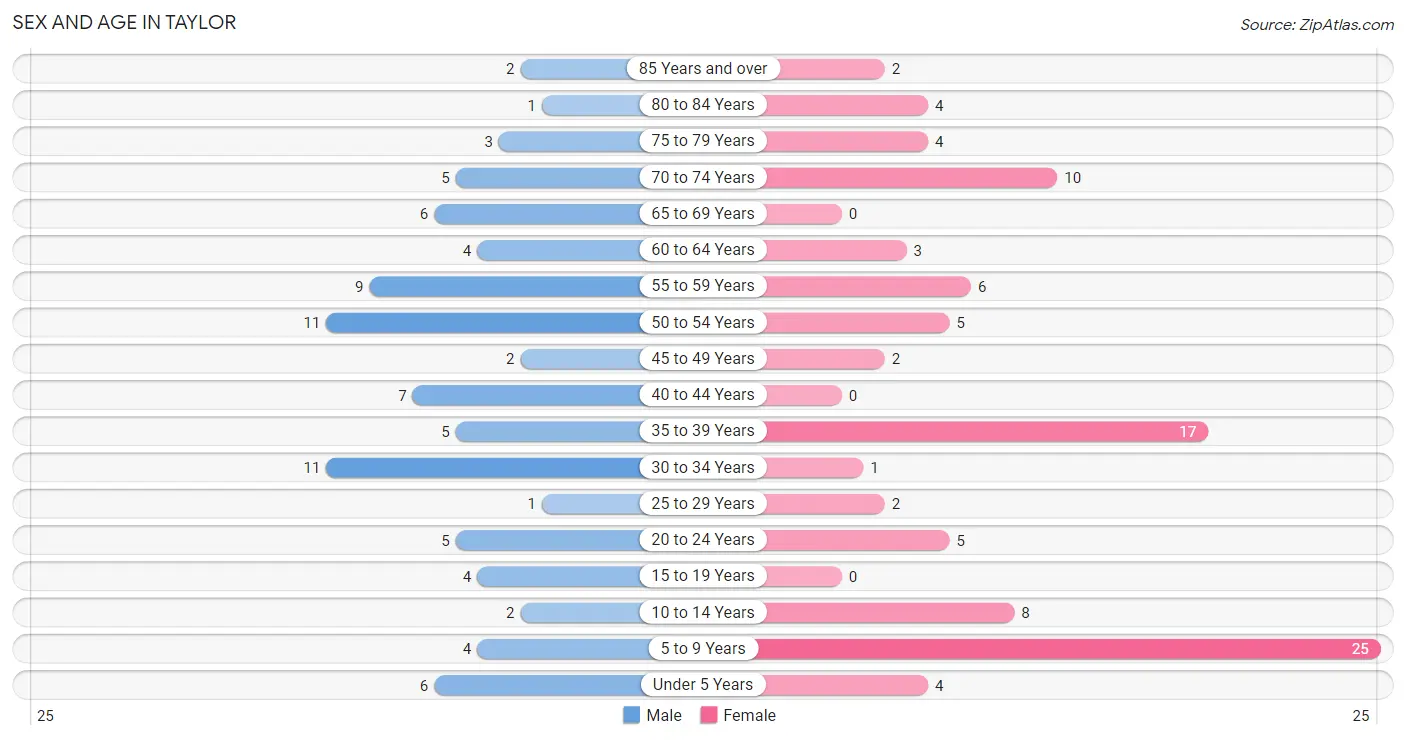
Sex and Age in Taylor
Sex and Age in Taylor
The most populous age groups in Taylor are 30 to 34 Years (11 | 12.5%) for men and 5 to 9 Years (25 | 25.5%) for women.
| Age Bracket | Male | Female |
| Under 5 Years | 6 (6.8%) | 4 (4.1%) |
| 5 to 9 Years | 4 (4.5%) | 25 (25.5%) |
| 10 to 14 Years | 2 (2.3%) | 8 (8.2%) |
| 15 to 19 Years | 4 (4.5%) | 0 (0.0%) |
| 20 to 24 Years | 5 (5.7%) | 5 (5.1%) |
| 25 to 29 Years | 1 (1.1%) | 2 (2.0%) |
| 30 to 34 Years | 11 (12.5%) | 1 (1.0%) |
| 35 to 39 Years | 5 (5.7%) | 17 (17.3%) |
| 40 to 44 Years | 7 (8.0%) | 0 (0.0%) |
| 45 to 49 Years | 2 (2.3%) | 2 (2.0%) |
| 50 to 54 Years | 11 (12.5%) | 5 (5.1%) |
| 55 to 59 Years | 9 (10.2%) | 6 (6.1%) |
| 60 to 64 Years | 4 (4.5%) | 3 (3.1%) |
| 65 to 69 Years | 6 (6.8%) | 0 (0.0%) |
| 70 to 74 Years | 5 (5.7%) | 10 (10.2%) |
| 75 to 79 Years | 3 (3.4%) | 4 (4.1%) |
| 80 to 84 Years | 1 (1.1%) | 4 (4.1%) |
| 85 Years and over | 2 (2.3%) | 2 (2.0%) |
| Total | 88 (100.0%) | 98 (100.0%) |
Families and Households in Taylor
Median Family Size in Taylor
The median family size in Taylor is 2.74 persons per family, with married-couple families (36 | 72.0%) accounting for the largest median family size of 2.86 persons per family. On the other hand, single female/mother families (9 | 18.0%) represent the smallest median family size with 2.22 persons per family.
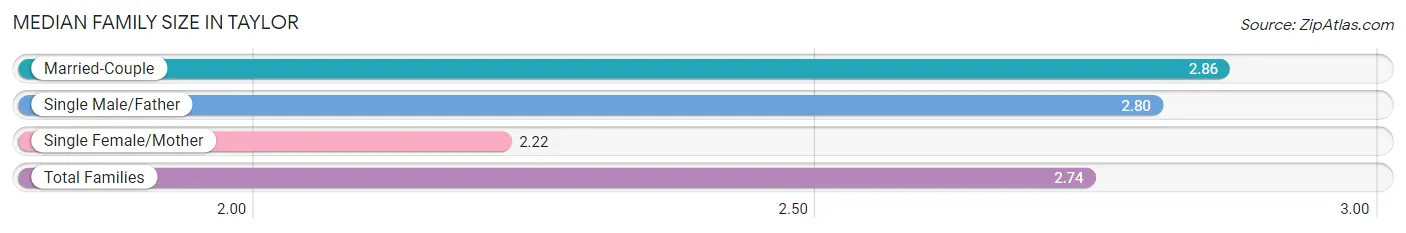
| Family Type | # Families | Family Size |
| Married-Couple | 36 (72.0%) | 2.86 |
| Single Male/Father | 5 (10.0%) | 2.80 |
| Single Female/Mother | 9 (18.0%) | 2.22 |
| Total Families | 50 (100.0%) | 2.74 |
Median Household Size in Taylor
The median household size in Taylor is 2.33 persons per household, with single male/father households (5 | 6.2%) accounting for the largest median household size of 3.2 persons per household. non-family households (30 | 37.5%) represent the smallest median household size with 1.40 persons per household.
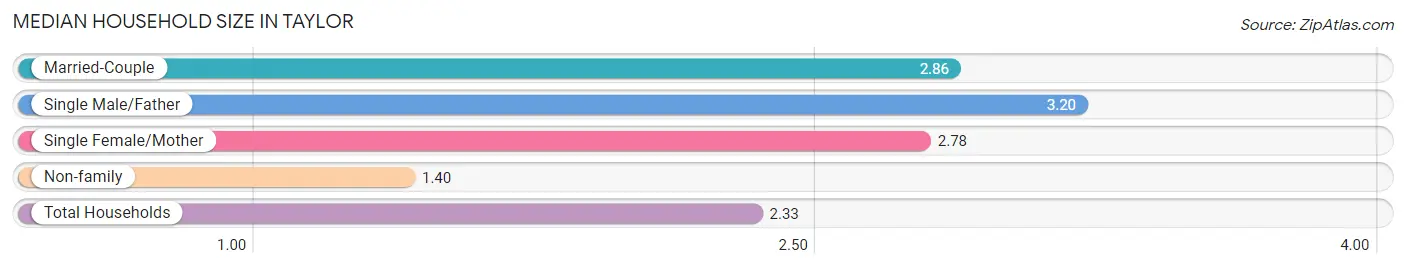
| Household Type | # Households | Household Size |
| Married-Couple | 36 (45.0%) | 2.86 |
| Single Male/Father | 5 (6.2%) | 3.20 |
| Single Female/Mother | 9 (11.3%) | 2.78 |
| Non-family | 30 (37.5%) | 1.40 |
| Total Households | 80 (100.0%) | 2.33 |
Household Size by Marriage Status in Taylor
Out of a total of 80 households in Taylor, 50 (62.5%) are family households, while 30 (37.5%) are nonfamily households. The most numerous type of family households are 2-person households, comprising 26, and the most common type of nonfamily households are 1-person households, comprising 24.
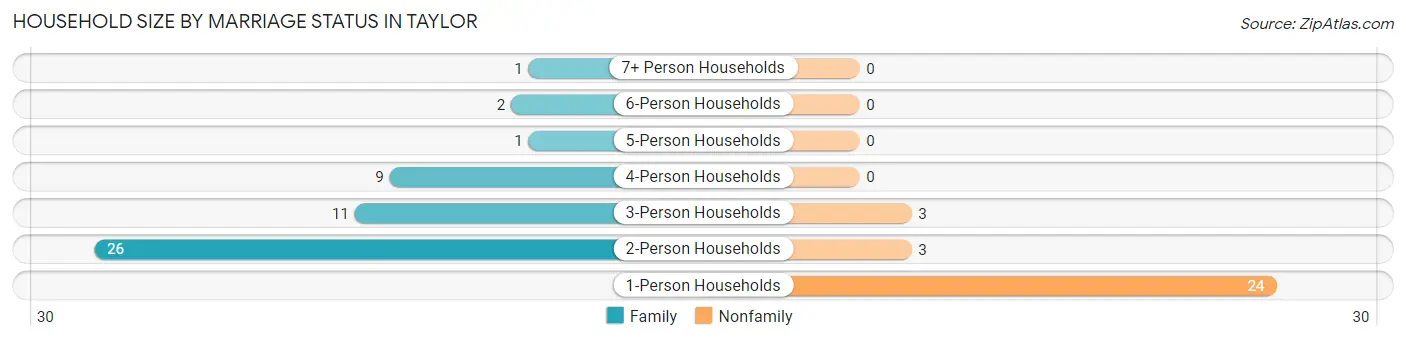
| Household Size | Family Households | Nonfamily Households |
| 1-Person Households | - | 24 (30.0%) |
| 2-Person Households | 26 (32.5%) | 3 (3.7%) |
| 3-Person Households | 11 (13.8%) | 3 (3.7%) |
| 4-Person Households | 9 (11.3%) | 0 (0.0%) |
| 5-Person Households | 1 (1.3%) | 0 (0.0%) |
| 6-Person Households | 2 (2.5%) | 0 (0.0%) |
| 7+ Person Households | 1 (1.3%) | 0 (0.0%) |
| Total | 50 (62.5%) | 30 (37.5%) |
Female Fertility in Taylor
Fertility by Age in Taylor
Average fertility rate in Taylor is 185.0 births per 1,000 women. Women in the age bracket of 20 to 34 years have the highest fertility rate with 375.0 births per 1,000 women. Women in the age bracket of 20 to 34 years acount for 60.0% of all women with births.
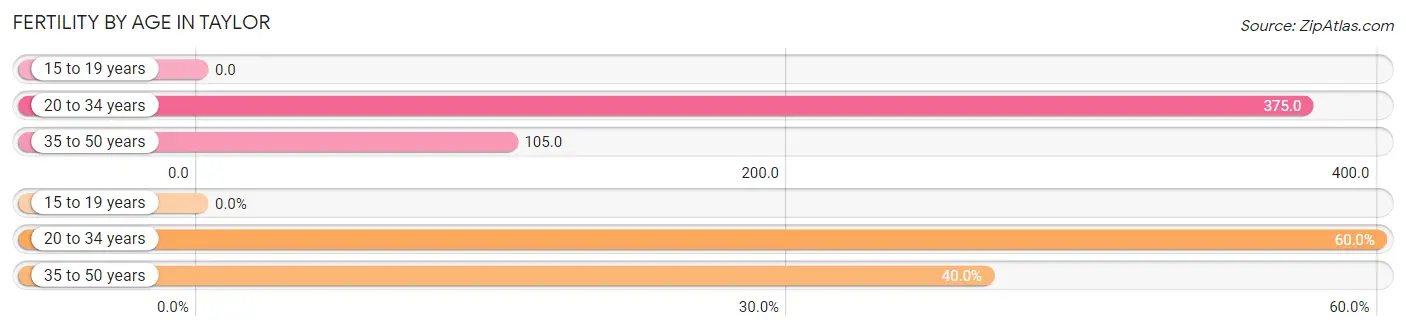
| Age Bracket | Women with Births | Births / 1,000 Women |
| 15 to 19 years | 0 (0.0%) | 0.0 |
| 20 to 34 years | 3 (60.0%) | 375.0 |
| 35 to 50 years | 2 (40.0%) | 105.0 |
| Total | 5 (100.0%) | 185.0 |
Fertility by Age by Marriage Status in Taylor
40.0% of women with births (5) in Taylor are married. The highest percentage of unmarried women with births falls into 20 to 34 years age bracket with 100.0% of them unmarried at the time of birth, while the lowest percentage of unmarried women with births belong to 35 to 50 years age bracket with 0.0% of them unmarried.
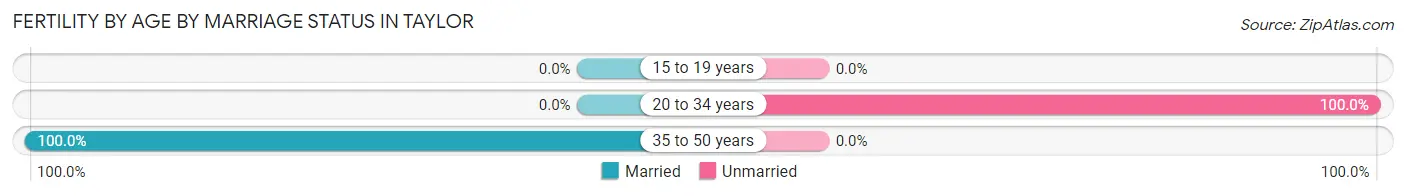
| Age Bracket | Married | Unmarried |
| 15 to 19 years | 0 (0.0%) | 0 (0.0%) |
| 20 to 34 years | 0 (0.0%) | 3 (100.0%) |
| 35 to 50 years | 2 (100.0%) | 0 (0.0%) |
| Total | 2 (40.0%) | 3 (60.0%) |
Fertility by Education in Taylor
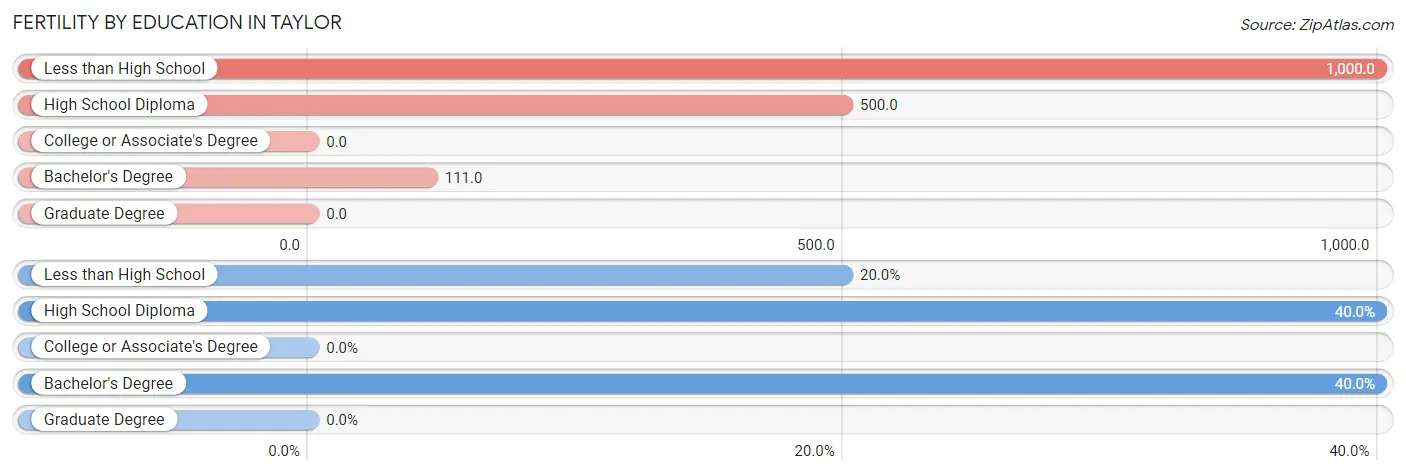
| Educational Attainment | Women with Births | Births / 1,000 Women |
| Less than High School | 1 (20.0%) | 1,000.0 |
| High School Diploma | 2 (40.0%) | 500.0 |
| College or Associate's Degree | 0 (0.0%) | 0.0 |
| Bachelor's Degree | 2 (40.0%) | 111.0 |
| Graduate Degree | 0 (0.0%) | 0.0 |
| Total | 5 (100.0%) | 185.0 |
Fertility by Education by Marriage Status in Taylor
60.0% of women with births in Taylor are unmarried. Women with the educational attainment of bachelor's degree are most likely to be married with 100.0% of them married at childbirth, while women with the educational attainment of less than high school are least likely to be married with 100.0% of them unmarried at childbirth.
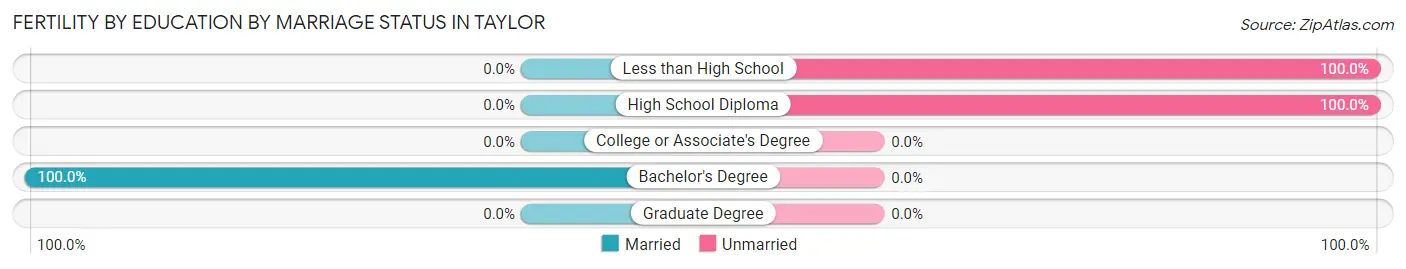
| Educational Attainment | Married | Unmarried |
| Less than High School | 0 (0.0%) | 1 (100.0%) |
| High School Diploma | 0 (0.0%) | 2 (100.0%) |
| College or Associate's Degree | 0 (0.0%) | 0 (0.0%) |
| Bachelor's Degree | 2 (100.0%) | 0 (0.0%) |
| Graduate Degree | 0 (0.0%) | 0 (0.0%) |
| Total | 2 (40.0%) | 3 (60.0%) |
Employment Characteristics in Taylor
Employment by Class of Employer in Taylor
Among the 91 employed individuals in Taylor, private company employees (62 | 68.1%), not-for-profit organizations (11 | 12.1%), and self-employed (not incorporated) (6 | 6.6%) make up the most common classes of employment.
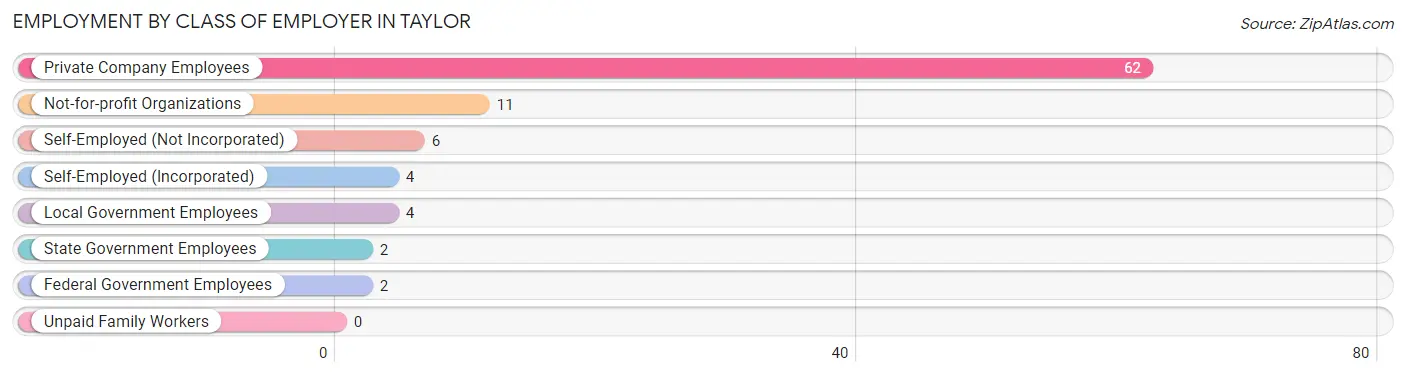
| Employer Class | # Employees | % Employees |
| Private Company Employees | 62 | 68.1% |
| Self-Employed (Incorporated) | 4 | 4.4% |
| Self-Employed (Not Incorporated) | 6 | 6.6% |
| Not-for-profit Organizations | 11 | 12.1% |
| Local Government Employees | 4 | 4.4% |
| State Government Employees | 2 | 2.2% |
| Federal Government Employees | 2 | 2.2% |
| Unpaid Family Workers | 0 | 0.0% |
| Total | 91 | 100.0% |
Employment Status by Age in Taylor
According to the labor force statistics for Taylor, out of the total population over 16 years of age (137), 72.3% or 99 individuals are in the labor force, with 8.1% or 8 of them unemployed. The age group with the highest labor force participation rate is 30 to 34 years, with 100.0% or 12 individuals in the labor force. Within the labor force, the 55 to 59 years age range has the highest percentage of unemployed individuals, with 45.5% or 5 of them being unemployed.
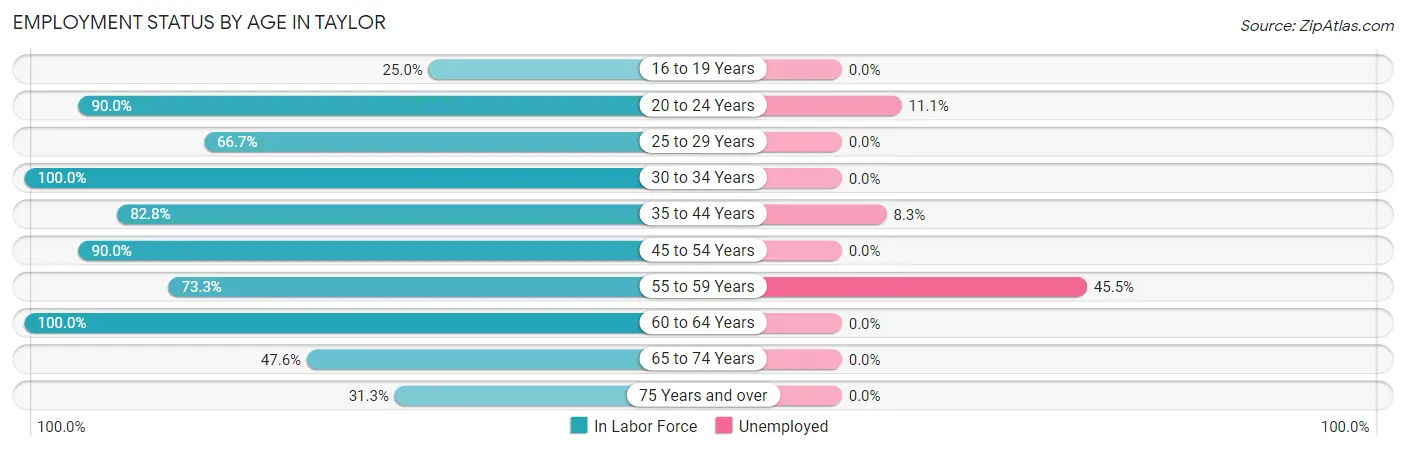
| Age Bracket | In Labor Force | Unemployed |
| 16 to 19 Years | 1 (25.0%) | 0 (0.0%) |
| 20 to 24 Years | 9 (90.0%) | 1 (11.1%) |
| 25 to 29 Years | 2 (66.7%) | 0 (0.0%) |
| 30 to 34 Years | 12 (100.0%) | 0 (0.0%) |
| 35 to 44 Years | 24 (82.8%) | 2 (8.3%) |
| 45 to 54 Years | 18 (90.0%) | 0 (0.0%) |
| 55 to 59 Years | 11 (73.3%) | 5 (45.5%) |
| 60 to 64 Years | 7 (100.0%) | 0 (0.0%) |
| 65 to 74 Years | 10 (47.6%) | 0 (0.0%) |
| 75 Years and over | 5 (31.3%) | 0 (0.0%) |
| Total | 99 (72.3%) | 8 (8.1%) |
Employment Status by Educational Attainment in Taylor
According to labor force statistics for Taylor, 86.0% of individuals (74) out of the total population between 25 and 64 years of age (86) are in the labor force, with 9.5% or 7 of them being unemployed. The group with the highest labor force participation rate are those with the educational attainment of college / associate degree, with 95.5% or 21 individuals in the labor force. Within the labor force, individuals with college / associate degree education have the highest percentage of unemployment, with 19.0% or 4 of them being unemployed.
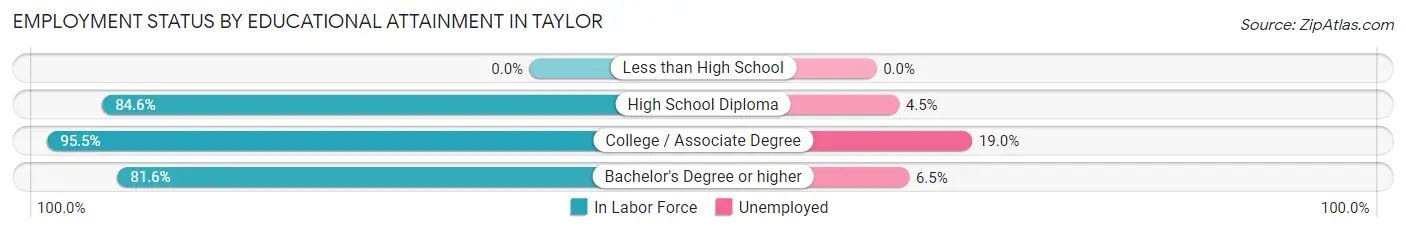
| Educational Attainment | In Labor Force | Unemployed |
| Less than High School | 0 (0.0%) | 0 (0.0%) |
| High School Diploma | 22 (84.6%) | 1 (4.5%) |
| College / Associate Degree | 21 (95.5%) | 4 (19.0%) |
| Bachelor's Degree or higher | 31 (81.6%) | 2 (6.5%) |
| Total | 74 (86.0%) | 8 (9.5%) |
Employment Occupations by Sex in Taylor
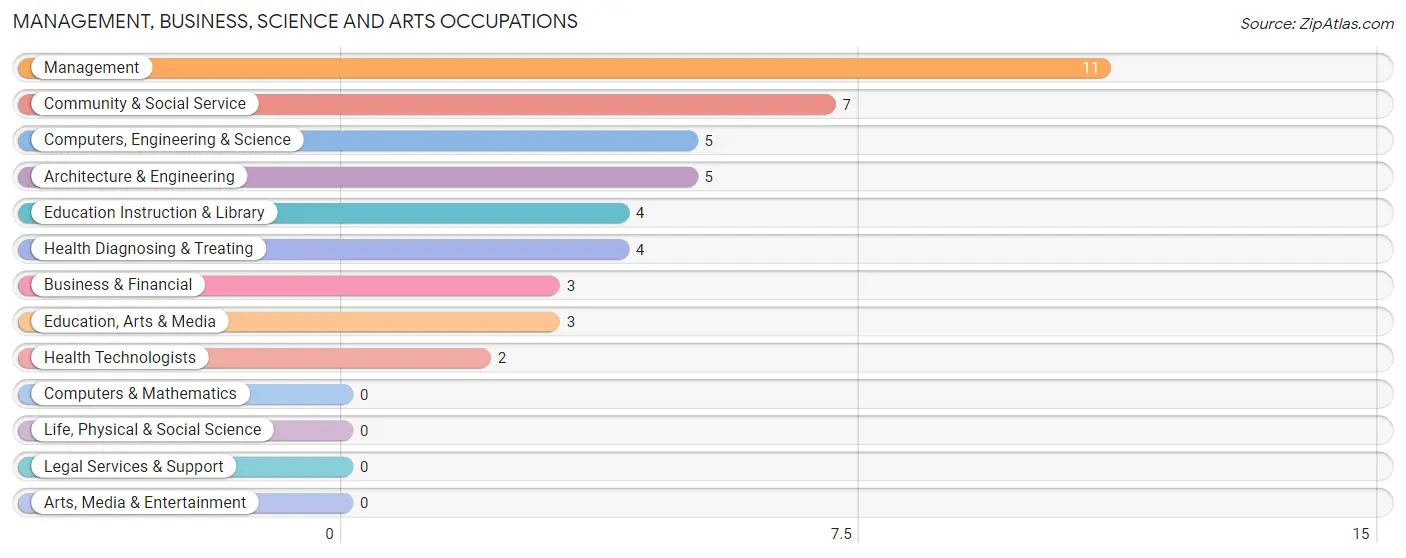
Management, Business, Science and Arts Occupations
The most common Management, Business, Science and Arts occupations in Taylor are Management (11 | 12.1%), Community & Social Service (7 | 7.7%), Computers, Engineering & Science (5 | 5.5%), Architecture & Engineering (5 | 5.5%), and Education Instruction & Library (4 | 4.4%).
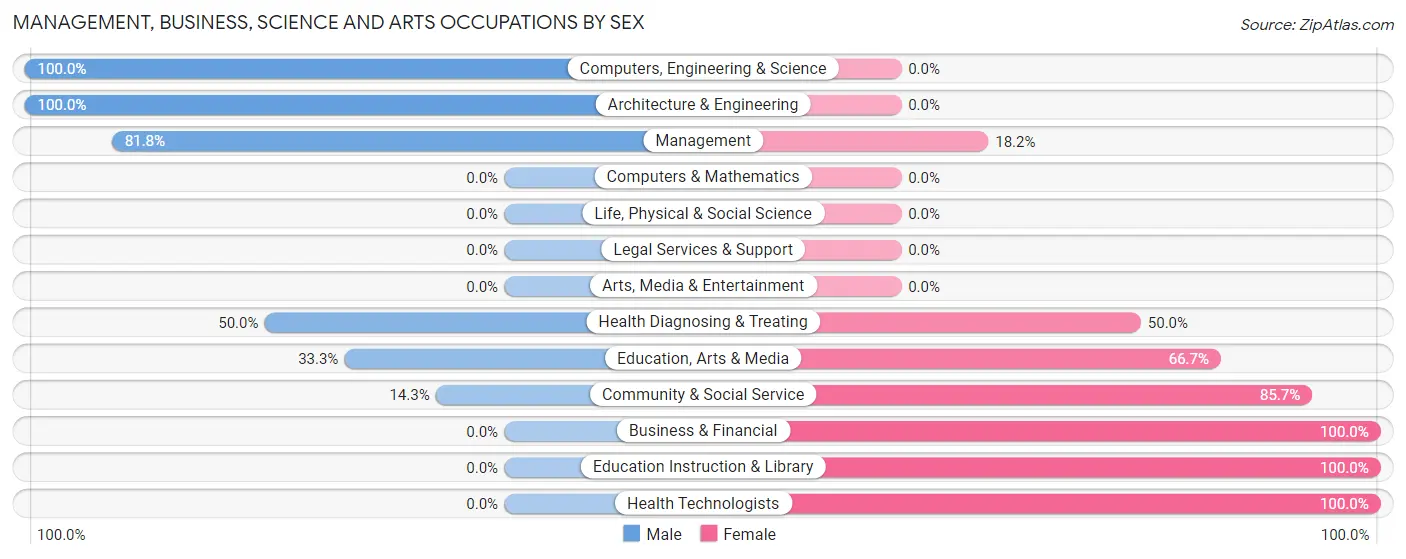
Management, Business, Science and Arts Occupations by Sex
Within the Management, Business, Science and Arts occupations in Taylor, the most male-oriented occupations are Computers, Engineering & Science (100.0%), Architecture & Engineering (100.0%), and Management (81.8%), while the most female-oriented occupations are Business & Financial (100.0%), Education Instruction & Library (100.0%), and Health Technologists (100.0%).
| Occupation | Male | Female |
| Management | 9 (81.8%) | 2 (18.2%) |
| Business & Financial | 0 (0.0%) | 3 (100.0%) |
| Computers, Engineering & Science | 5 (100.0%) | 0 (0.0%) |
| Computers & Mathematics | 0 (0.0%) | 0 (0.0%) |
| Architecture & Engineering | 5 (100.0%) | 0 (0.0%) |
| Life, Physical & Social Science | 0 (0.0%) | 0 (0.0%) |
| Community & Social Service | 1 (14.3%) | 6 (85.7%) |
| Education, Arts & Media | 1 (33.3%) | 2 (66.7%) |
| Legal Services & Support | 0 (0.0%) | 0 (0.0%) |
| Education Instruction & Library | 0 (0.0%) | 4 (100.0%) |
| Arts, Media & Entertainment | 0 (0.0%) | 0 (0.0%) |
| Health Diagnosing & Treating | 2 (50.0%) | 2 (50.0%) |
| Health Technologists | 0 (0.0%) | 2 (100.0%) |
| Total (Category) | 17 (56.7%) | 13 (43.3%) |
| Total (Overall) | 57 (62.6%) | 34 (37.4%) |
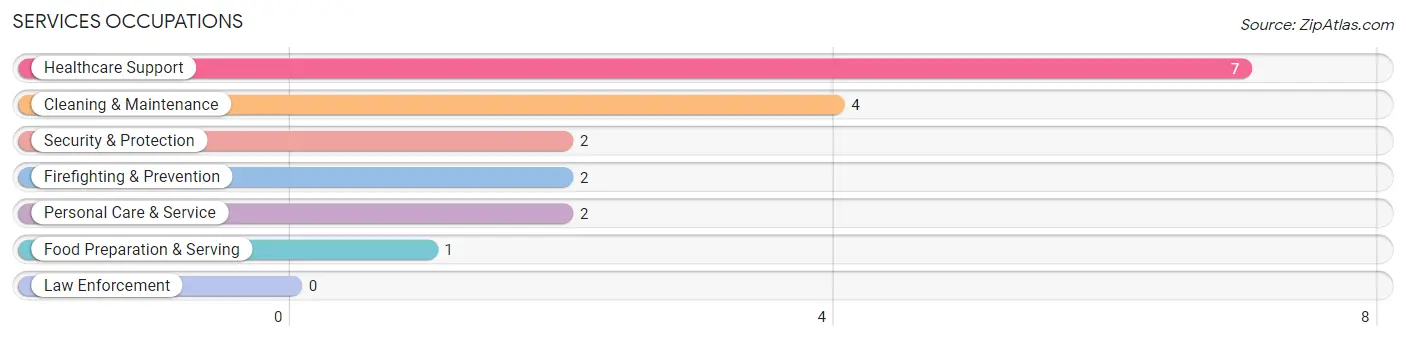
Services Occupations
The most common Services occupations in Taylor are Healthcare Support (7 | 7.7%), Cleaning & Maintenance (4 | 4.4%), Security & Protection (2 | 2.2%), Firefighting & Prevention (2 | 2.2%), and Personal Care & Service (2 | 2.2%).
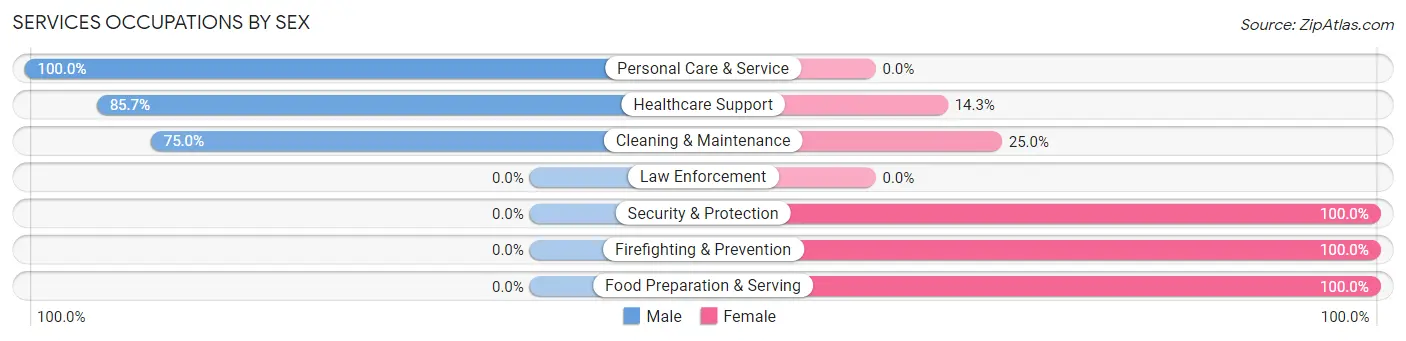
Services Occupations by Sex
Within the Services occupations in Taylor, the most male-oriented occupations are Personal Care & Service (100.0%), Healthcare Support (85.7%), and Cleaning & Maintenance (75.0%), while the most female-oriented occupations are Security & Protection (100.0%), Firefighting & Prevention (100.0%), and Food Preparation & Serving (100.0%).
| Occupation | Male | Female |
| Healthcare Support | 6 (85.7%) | 1 (14.3%) |
| Security & Protection | 0 (0.0%) | 2 (100.0%) |
| Firefighting & Prevention | 0 (0.0%) | 2 (100.0%) |
| Law Enforcement | 0 (0.0%) | 0 (0.0%) |
| Food Preparation & Serving | 0 (0.0%) | 1 (100.0%) |
| Cleaning & Maintenance | 3 (75.0%) | 1 (25.0%) |
| Personal Care & Service | 2 (100.0%) | 0 (0.0%) |
| Total (Category) | 11 (68.8%) | 5 (31.2%) |
| Total (Overall) | 57 (62.6%) | 34 (37.4%) |
Sales and Office Occupations
The most common Sales and Office occupations in Taylor are Office & Administration (10 | 11.0%), and Sales & Related (6 | 6.6%).
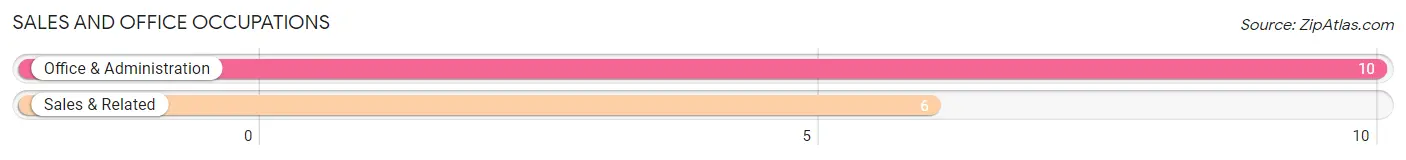
Sales and Office Occupations by Sex
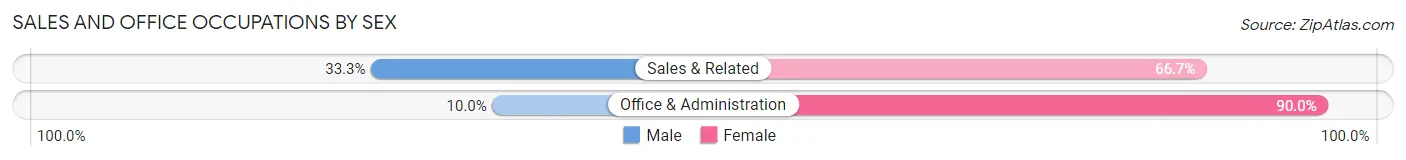
| Occupation | Male | Female |
| Sales & Related | 2 (33.3%) | 4 (66.7%) |
| Office & Administration | 1 (10.0%) | 9 (90.0%) |
| Total (Category) | 3 (18.8%) | 13 (81.2%) |
| Total (Overall) | 57 (62.6%) | 34 (37.4%) |
Natural Resources, Construction and Maintenance Occupations
The most common Natural Resources, Construction and Maintenance occupations in Taylor are Construction & Extraction (9 | 9.9%), Installation, Maintenance & Repair (9 | 9.9%), and Farming, Fishing & Forestry (1 | 1.1%).
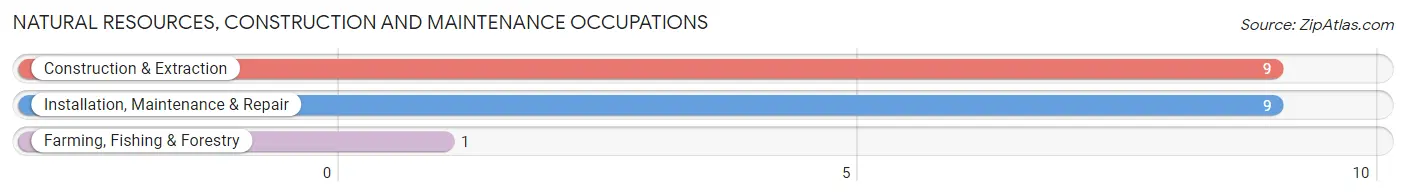
Natural Resources, Construction and Maintenance Occupations by Sex
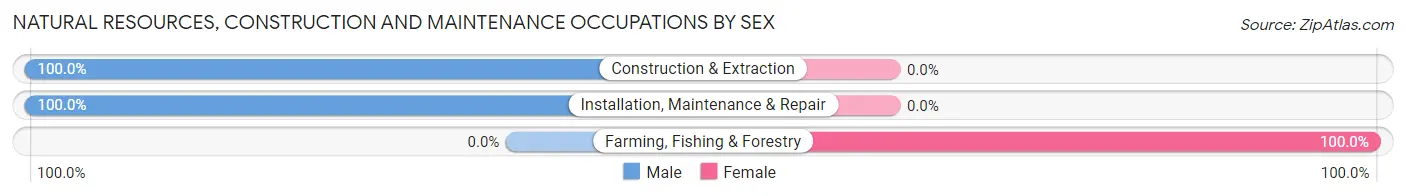
| Occupation | Male | Female |
| Farming, Fishing & Forestry | 0 (0.0%) | 1 (100.0%) |
| Construction & Extraction | 9 (100.0%) | 0 (0.0%) |
| Installation, Maintenance & Repair | 9 (100.0%) | 0 (0.0%) |
| Total (Category) | 18 (94.7%) | 1 (5.3%) |
| Total (Overall) | 57 (62.6%) | 34 (37.4%) |
Production, Transportation and Moving Occupations
The most common Production, Transportation and Moving occupations in Taylor are Transportation (7 | 7.7%), and Production (3 | 3.3%).
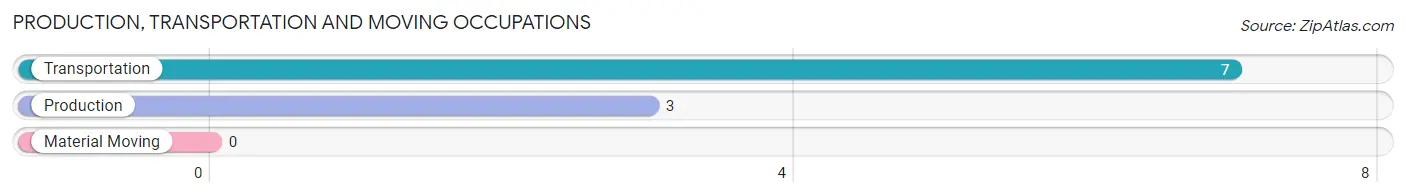
Production, Transportation and Moving Occupations by Sex
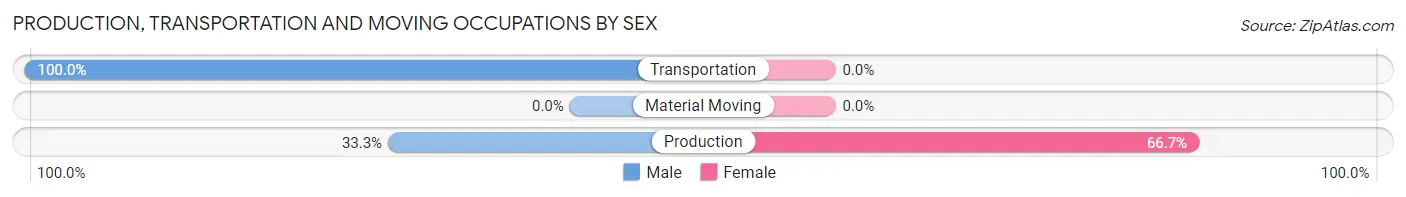
| Occupation | Male | Female |
| Production | 1 (33.3%) | 2 (66.7%) |
| Transportation | 7 (100.0%) | 0 (0.0%) |
| Material Moving | 0 (0.0%) | 0 (0.0%) |
| Total (Category) | 8 (80.0%) | 2 (20.0%) |
| Total (Overall) | 57 (62.6%) | 34 (37.4%) |
Employment Industries by Sex in Taylor
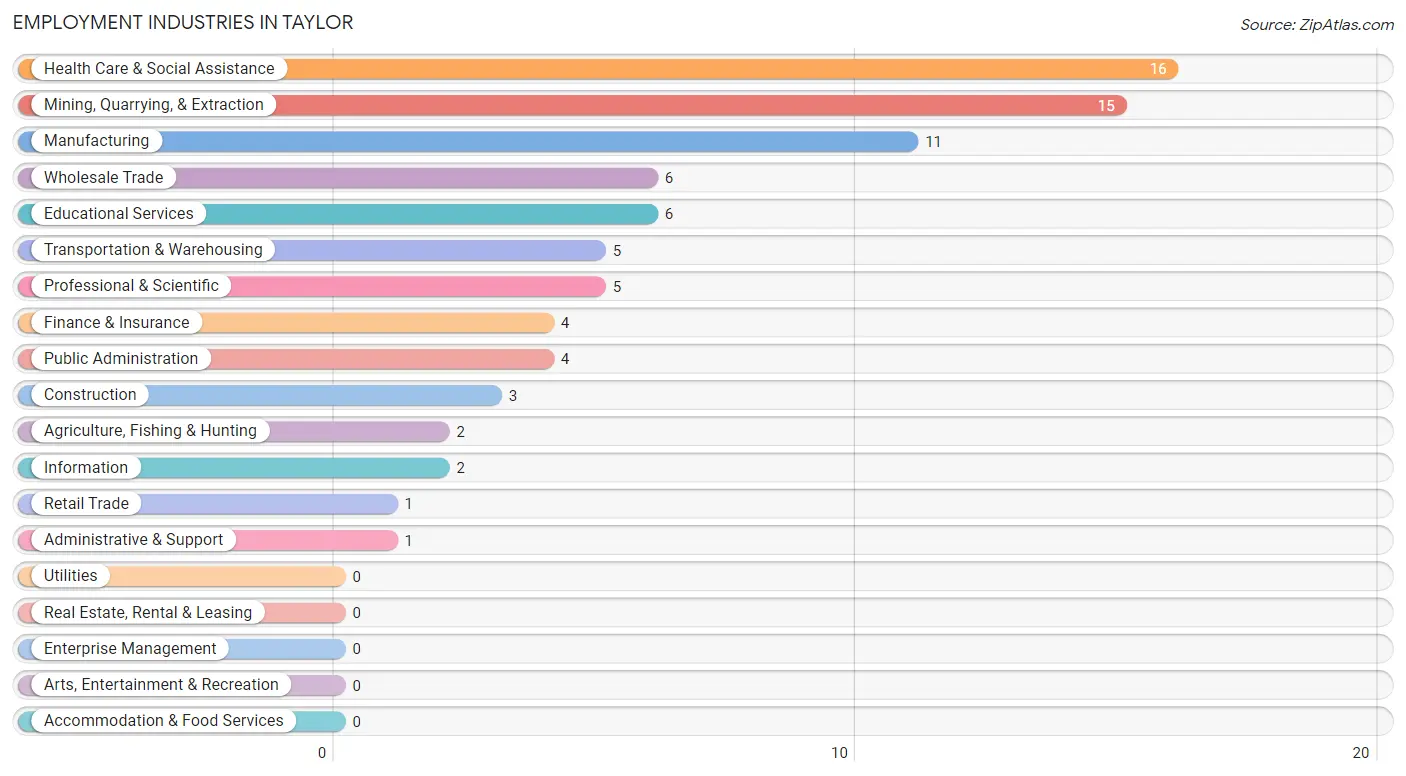
Employment Industries in Taylor
The major employment industries in Taylor include Health Care & Social Assistance (16 | 17.6%), Mining, Quarrying, & Extraction (15 | 16.5%), Manufacturing (11 | 12.1%), Wholesale Trade (6 | 6.6%), and Educational Services (6 | 6.6%).
Employment Industries by Sex in Taylor
The Taylor industries that see more men than women are Mining, Quarrying, & Extraction (100.0%), Construction (100.0%), and Information (100.0%), whereas the industries that tend to have a higher number of women are Retail Trade (100.0%), Finance & Insurance (100.0%), and Public Administration (100.0%).
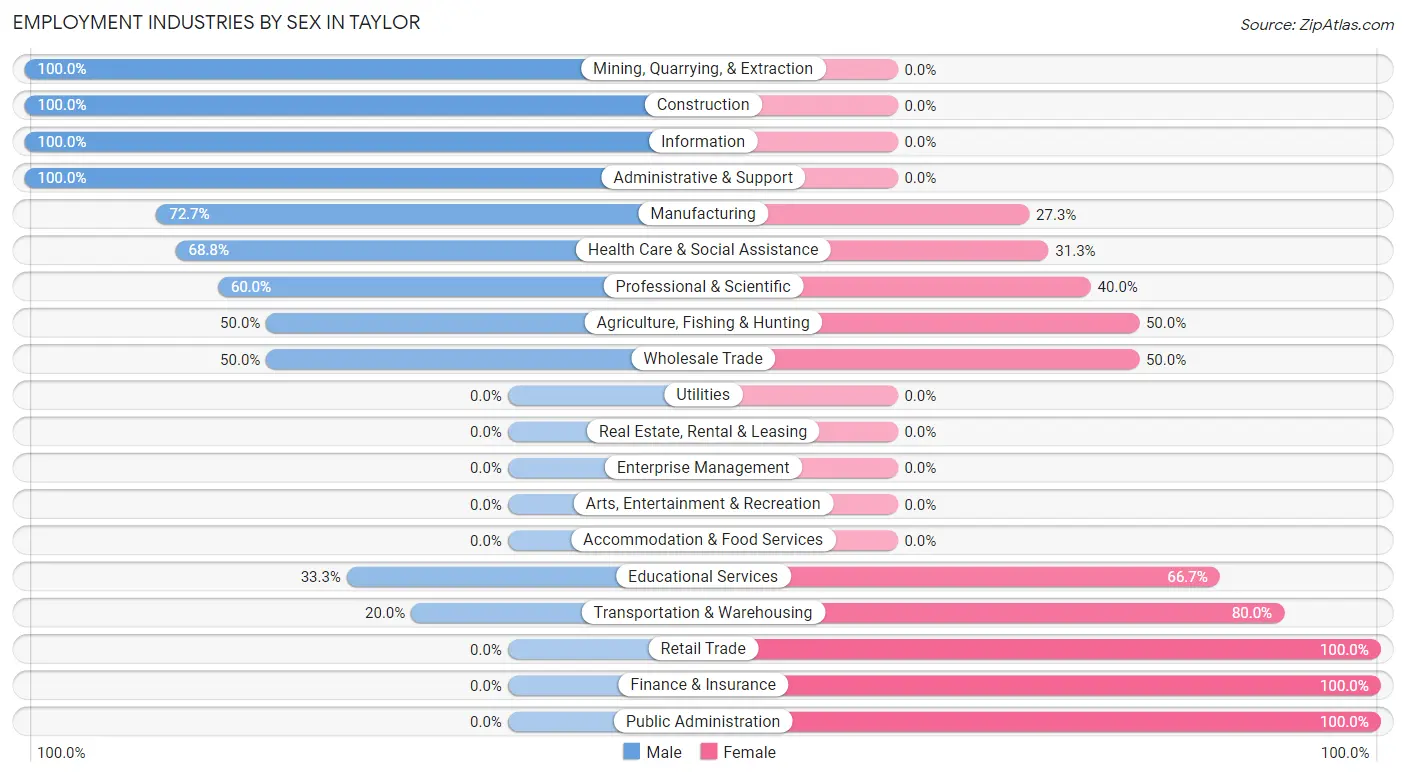
| Industry | Male | Female |
| Agriculture, Fishing & Hunting | 1 (50.0%) | 1 (50.0%) |
| Mining, Quarrying, & Extraction | 15 (100.0%) | 0 (0.0%) |
| Construction | 3 (100.0%) | 0 (0.0%) |
| Manufacturing | 8 (72.7%) | 3 (27.3%) |
| Wholesale Trade | 3 (50.0%) | 3 (50.0%) |
| Retail Trade | 0 (0.0%) | 1 (100.0%) |
| Transportation & Warehousing | 1 (20.0%) | 4 (80.0%) |
| Utilities | 0 (0.0%) | 0 (0.0%) |
| Information | 2 (100.0%) | 0 (0.0%) |
| Finance & Insurance | 0 (0.0%) | 4 (100.0%) |
| Real Estate, Rental & Leasing | 0 (0.0%) | 0 (0.0%) |
| Professional & Scientific | 3 (60.0%) | 2 (40.0%) |
| Enterprise Management | 0 (0.0%) | 0 (0.0%) |
| Administrative & Support | 1 (100.0%) | 0 (0.0%) |
| Educational Services | 2 (33.3%) | 4 (66.7%) |
| Health Care & Social Assistance | 11 (68.8%) | 5 (31.2%) |
| Arts, Entertainment & Recreation | 0 (0.0%) | 0 (0.0%) |
| Accommodation & Food Services | 0 (0.0%) | 0 (0.0%) |
| Public Administration | 0 (0.0%) | 4 (100.0%) |
| Total | 57 (62.6%) | 34 (37.4%) |
Education in Taylor
School Enrollment in Taylor
The most common levels of schooling among the 49 students in Taylor are elementary school (22 | 44.9%), kindergarten (7 | 14.3%), and middle school (7 | 14.3%).
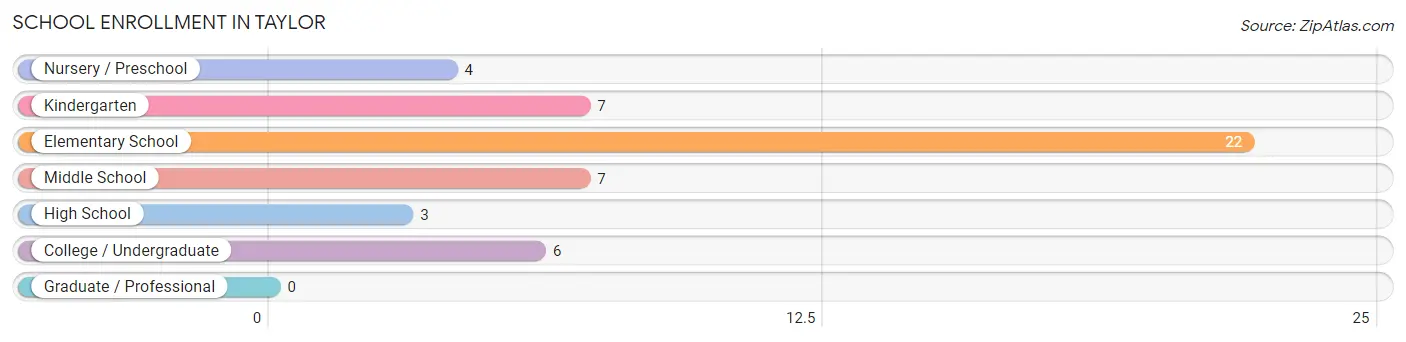
| School Level | # Students | % Students |
| Nursery / Preschool | 4 | 8.2% |
| Kindergarten | 7 | 14.3% |
| Elementary School | 22 | 44.9% |
| Middle School | 7 | 14.3% |
| High School | 3 | 6.1% |
| College / Undergraduate | 6 | 12.2% |
| Graduate / Professional | 0 | 0.0% |
| Total | 49 | 100.0% |
School Enrollment by Age by Funding Source in Taylor
Out of a total of 49 students who are enrolled in schools in Taylor, 3 (6.1%) attend a private institution, while the remaining 46 (93.9%) are enrolled in public schools. The age group of 3 to 4 year olds has the highest likelihood of being enrolled in private schools, with 1 (100.0% in the age bracket) enrolled. Conversely, the age group of 10 to 14 year olds has the lowest likelihood of being enrolled in a private school, with 10 (100.0% in the age bracket) attending a public institution.
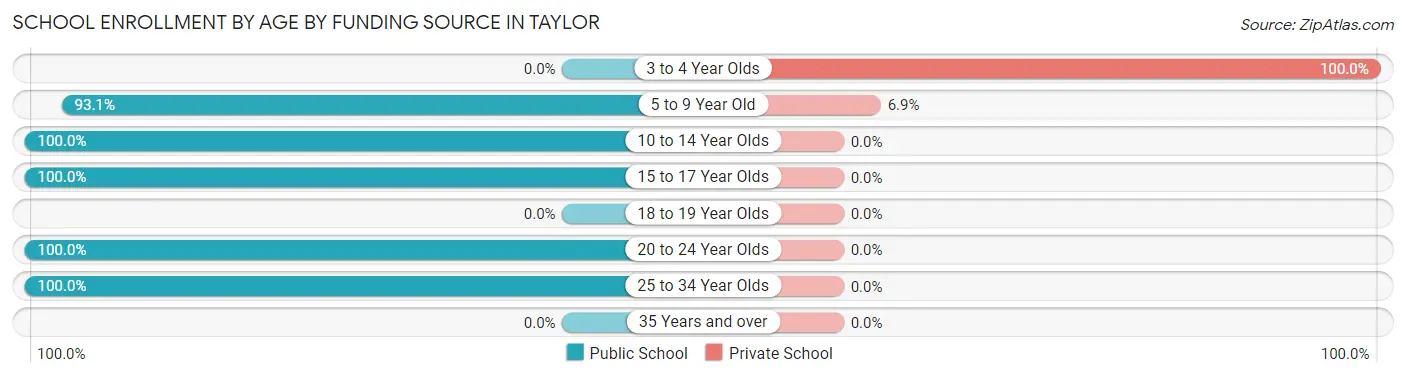
| Age Bracket | Public School | Private School |
| 3 to 4 Year Olds | 0 (0.0%) | 1 (100.0%) |
| 5 to 9 Year Old | 27 (93.1%) | 2 (6.9%) |
| 10 to 14 Year Olds | 10 (100.0%) | 0 (0.0%) |
| 15 to 17 Year Olds | 3 (100.0%) | 0 (0.0%) |
| 18 to 19 Year Olds | 0 (0.0%) | 0 (0.0%) |
| 20 to 24 Year Olds | 4 (100.0%) | 0 (0.0%) |
| 25 to 34 Year Olds | 2 (100.0%) | 0 (0.0%) |
| 35 Years and over | 0 (0.0%) | 0 (0.0%) |
| Total | 46 (93.9%) | 3 (6.1%) |
Educational Attainment by Field of Study in Taylor
Business (12 | 21.4%), arts & humanities (10 | 17.9%), education (8 | 14.3%), social sciences (6 | 10.7%), and visual & performing arts (6 | 10.7%) are the most common fields of study among 56 individuals in Taylor who have obtained a bachelor's degree or higher.
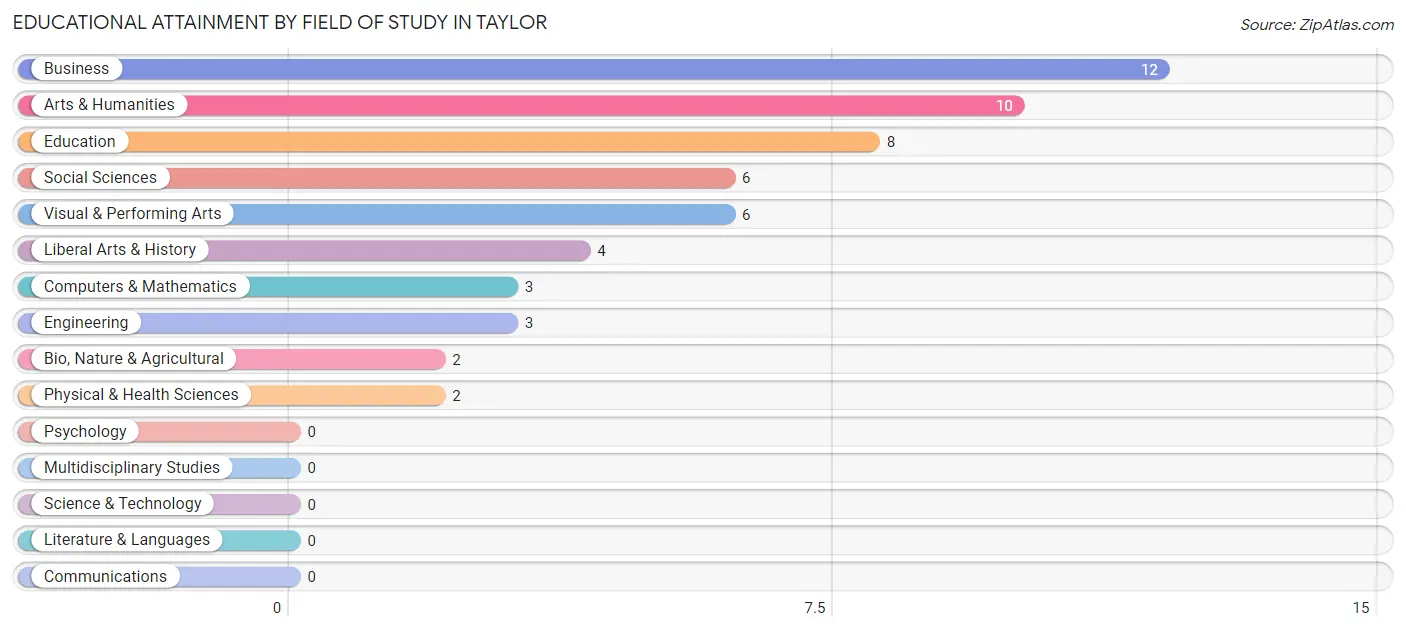
| Field of Study | # Graduates | % Graduates |
| Computers & Mathematics | 3 | 5.4% |
| Bio, Nature & Agricultural | 2 | 3.6% |
| Physical & Health Sciences | 2 | 3.6% |
| Psychology | 0 | 0.0% |
| Social Sciences | 6 | 10.7% |
| Engineering | 3 | 5.4% |
| Multidisciplinary Studies | 0 | 0.0% |
| Science & Technology | 0 | 0.0% |
| Business | 12 | 21.4% |
| Education | 8 | 14.3% |
| Literature & Languages | 0 | 0.0% |
| Liberal Arts & History | 4 | 7.1% |
| Visual & Performing Arts | 6 | 10.7% |
| Communications | 0 | 0.0% |
| Arts & Humanities | 10 | 17.9% |
| Total | 56 | 100.0% |
Transportation & Commute in Taylor
Vehicle Availability by Sex in Taylor
The most prevalent vehicle ownership categories in Taylor are males with 3 vehicles (21, accounting for 36.8%) and females with 3 vehicles (13, making up 61.8%).
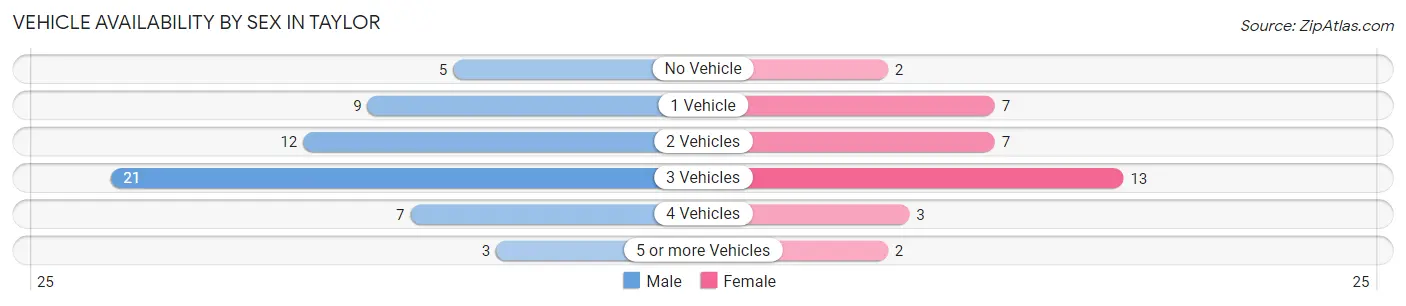
| Vehicles Available | Male | Female |
| No Vehicle | 5 (8.8%) | 2 (5.9%) |
| 1 Vehicle | 9 (15.8%) | 7 (20.6%) |
| 2 Vehicles | 12 (21.0%) | 7 (20.6%) |
| 3 Vehicles | 21 (36.8%) | 13 (38.2%) |
| 4 Vehicles | 7 (12.3%) | 3 (8.8%) |
| 5 or more Vehicles | 3 (5.3%) | 2 (5.9%) |
| Total | 57 (100.0%) | 34 (100.0%) |
Commute Time in Taylor
The most frequently occuring commute durations in Taylor are 25 to 29 minutes (16 commuters, 18.0%), 30 to 34 minutes (16 commuters, 18.0%), and less than 5 minutes (14 commuters, 15.7%).
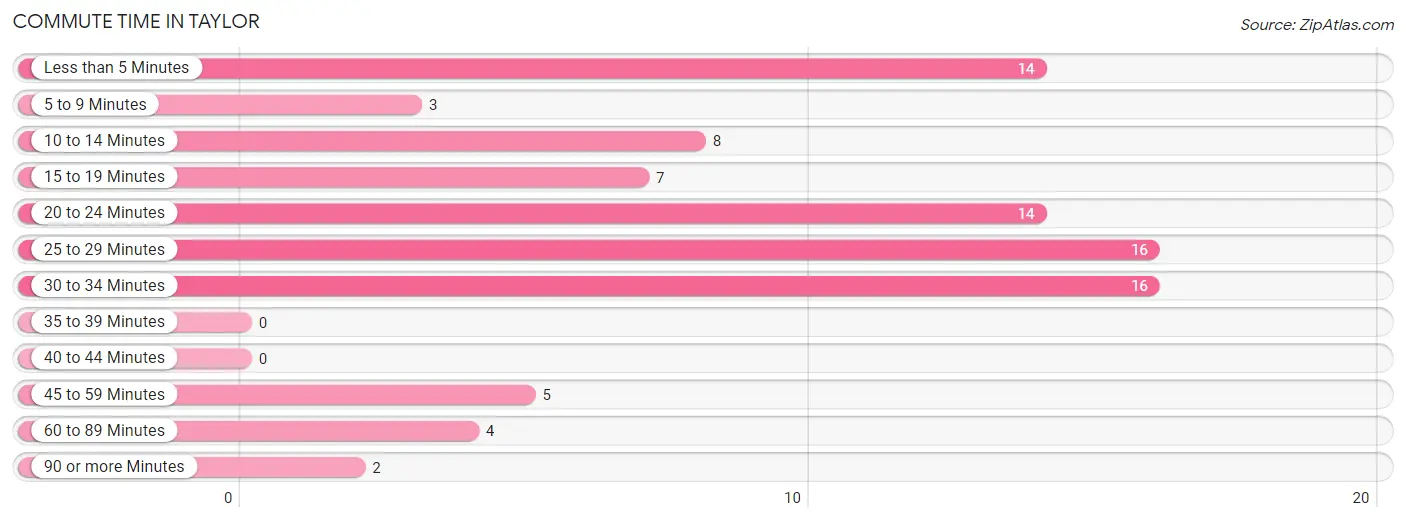
| Commute Time | # Commuters | % Commuters |
| Less than 5 Minutes | 14 | 15.7% |
| 5 to 9 Minutes | 3 | 3.4% |
| 10 to 14 Minutes | 8 | 9.0% |
| 15 to 19 Minutes | 7 | 7.9% |
| 20 to 24 Minutes | 14 | 15.7% |
| 25 to 29 Minutes | 16 | 18.0% |
| 30 to 34 Minutes | 16 | 18.0% |
| 35 to 39 Minutes | 0 | 0.0% |
| 40 to 44 Minutes | 0 | 0.0% |
| 45 to 59 Minutes | 5 | 5.6% |
| 60 to 89 Minutes | 4 | 4.5% |
| 90 or more Minutes | 2 | 2.2% |
Commute Time by Sex in Taylor
The most common commute times in Taylor are 20 to 24 minutes (10 commuters, 17.5%) for males and 30 to 34 minutes (9 commuters, 28.1%) for females.
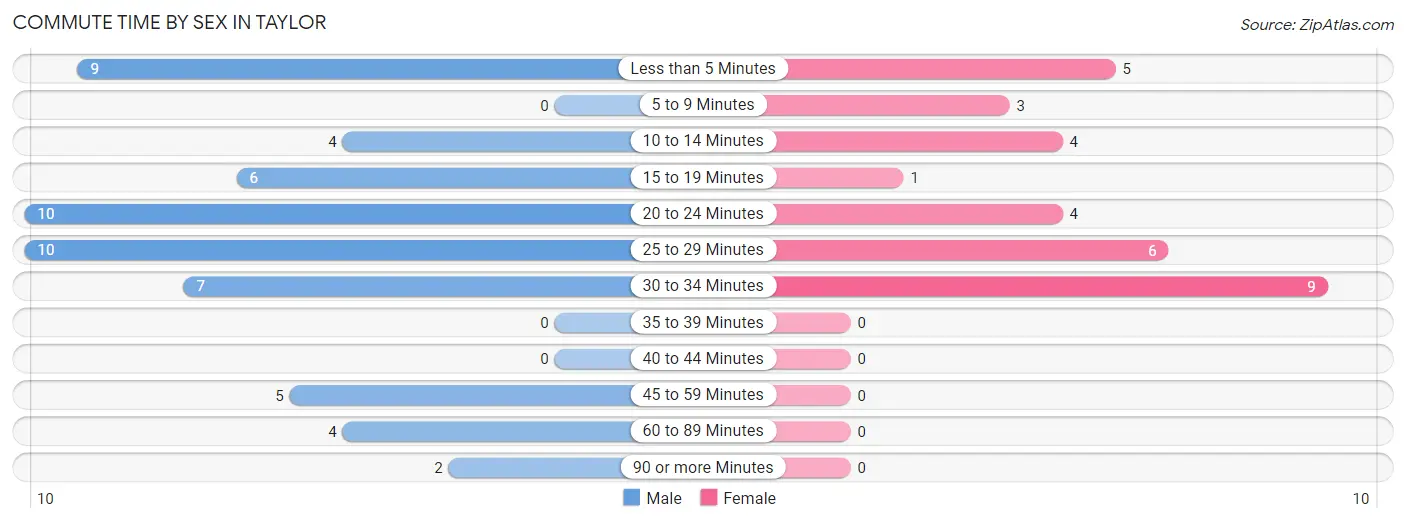
| Commute Time | Male | Female |
| Less than 5 Minutes | 9 (15.8%) | 5 (15.6%) |
| 5 to 9 Minutes | 0 (0.0%) | 3 (9.4%) |
| 10 to 14 Minutes | 4 (7.0%) | 4 (12.5%) |
| 15 to 19 Minutes | 6 (10.5%) | 1 (3.1%) |
| 20 to 24 Minutes | 10 (17.5%) | 4 (12.5%) |
| 25 to 29 Minutes | 10 (17.5%) | 6 (18.8%) |
| 30 to 34 Minutes | 7 (12.3%) | 9 (28.1%) |
| 35 to 39 Minutes | 0 (0.0%) | 0 (0.0%) |
| 40 to 44 Minutes | 0 (0.0%) | 0 (0.0%) |
| 45 to 59 Minutes | 5 (8.8%) | 0 (0.0%) |
| 60 to 89 Minutes | 4 (7.0%) | 0 (0.0%) |
| 90 or more Minutes | 2 (3.5%) | 0 (0.0%) |
Time of Departure to Work by Sex in Taylor
The most frequent times of departure to work in Taylor are 7:30 AM to 7:59 AM (12, 21.0%) for males and 7:30 AM to 7:59 AM (14, 43.8%) for females.
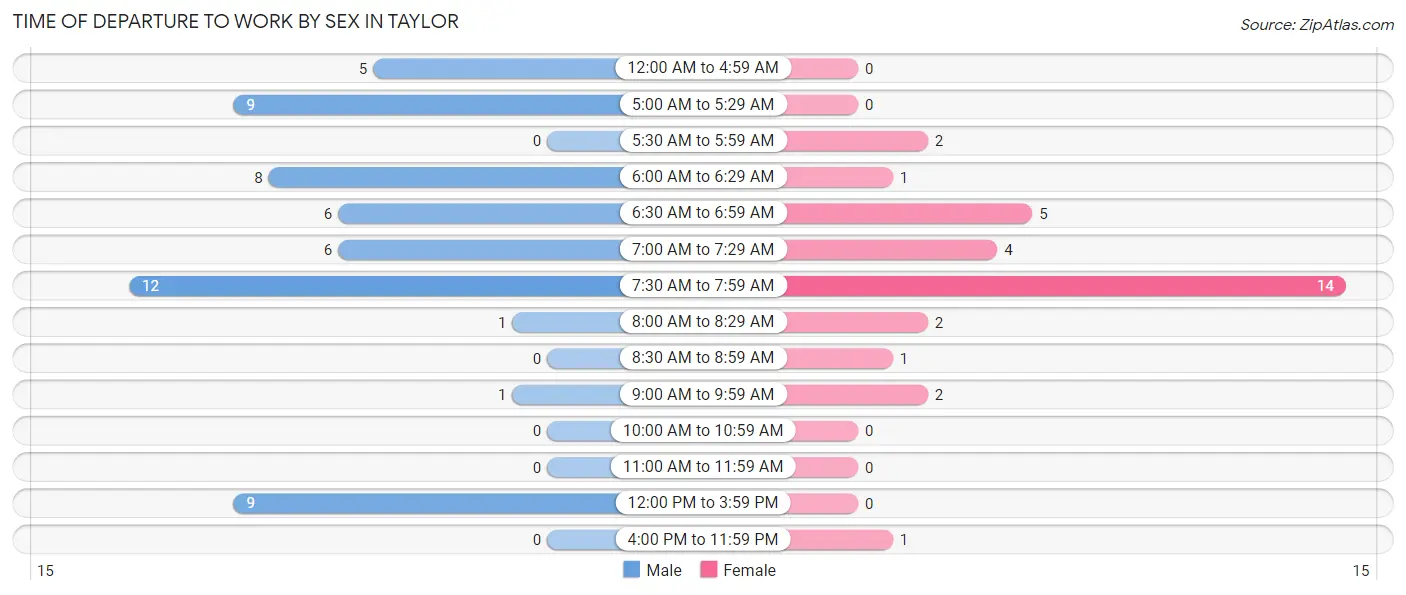
| Time of Departure | Male | Female |
| 12:00 AM to 4:59 AM | 5 (8.8%) | 0 (0.0%) |
| 5:00 AM to 5:29 AM | 9 (15.8%) | 0 (0.0%) |
| 5:30 AM to 5:59 AM | 0 (0.0%) | 2 (6.2%) |
| 6:00 AM to 6:29 AM | 8 (14.0%) | 1 (3.1%) |
| 6:30 AM to 6:59 AM | 6 (10.5%) | 5 (15.6%) |
| 7:00 AM to 7:29 AM | 6 (10.5%) | 4 (12.5%) |
| 7:30 AM to 7:59 AM | 12 (21.0%) | 14 (43.8%) |
| 8:00 AM to 8:29 AM | 1 (1.8%) | 2 (6.2%) |
| 8:30 AM to 8:59 AM | 0 (0.0%) | 1 (3.1%) |
| 9:00 AM to 9:59 AM | 1 (1.8%) | 2 (6.2%) |
| 10:00 AM to 10:59 AM | 0 (0.0%) | 0 (0.0%) |
| 11:00 AM to 11:59 AM | 0 (0.0%) | 0 (0.0%) |
| 12:00 PM to 3:59 PM | 9 (15.8%) | 0 (0.0%) |
| 4:00 PM to 11:59 PM | 0 (0.0%) | 1 (3.1%) |
| Total | 57 (100.0%) | 32 (100.0%) |
Housing Occupancy in Taylor
Occupancy by Ownership in Taylor
Of the total 80 dwellings in Taylor, owner-occupied units account for 69 (86.3%), while renter-occupied units make up 11 (13.8%).
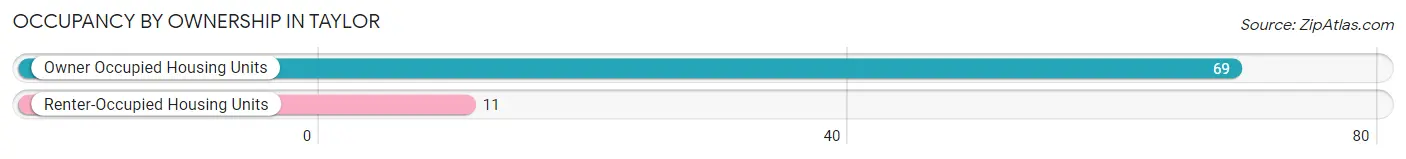
| Occupancy | # Housing Units | % Housing Units |
| Owner Occupied Housing Units | 69 | 86.3% |
| Renter-Occupied Housing Units | 11 | 13.8% |
| Total Occupied Housing Units | 80 | 100.0% |
Occupancy by Household Size in Taylor
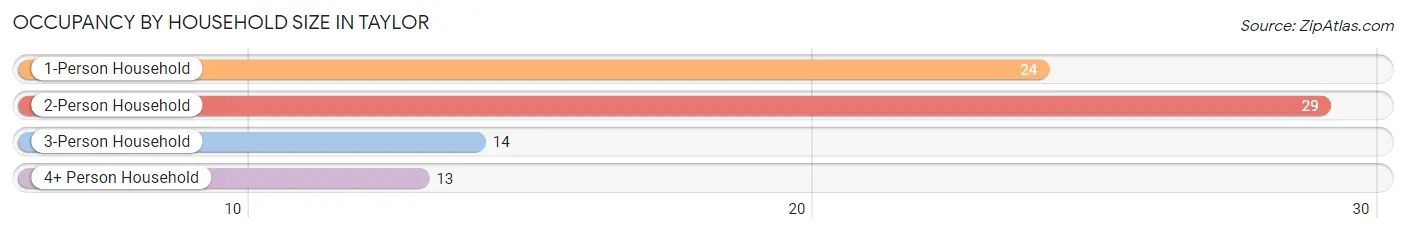
| Household Size | # Housing Units | % Housing Units |
| 1-Person Household | 24 | 30.0% |
| 2-Person Household | 29 | 36.2% |
| 3-Person Household | 14 | 17.5% |
| 4+ Person Household | 13 | 16.3% |
| Total Housing Units | 80 | 100.0% |
Occupancy by Ownership by Household Size in Taylor
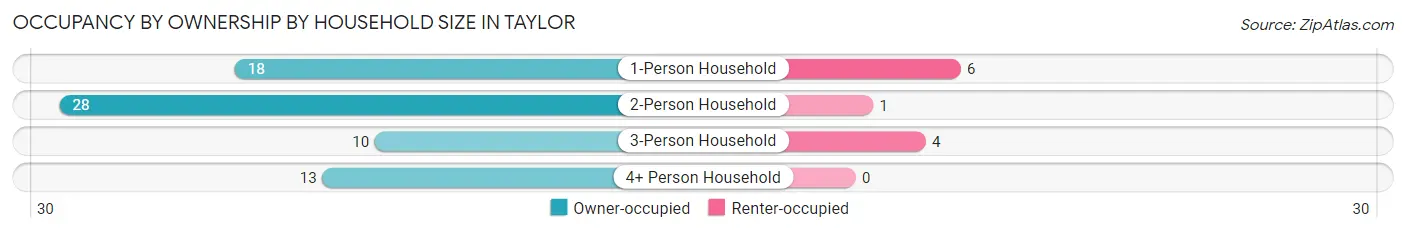
| Household Size | Owner-occupied | Renter-occupied |
| 1-Person Household | 18 (75.0%) | 6 (25.0%) |
| 2-Person Household | 28 (96.6%) | 1 (3.5%) |
| 3-Person Household | 10 (71.4%) | 4 (28.6%) |
| 4+ Person Household | 13 (100.0%) | 0 (0.0%) |
| Total Housing Units | 69 (86.3%) | 11 (13.8%) |
Occupancy by Educational Attainment in Taylor
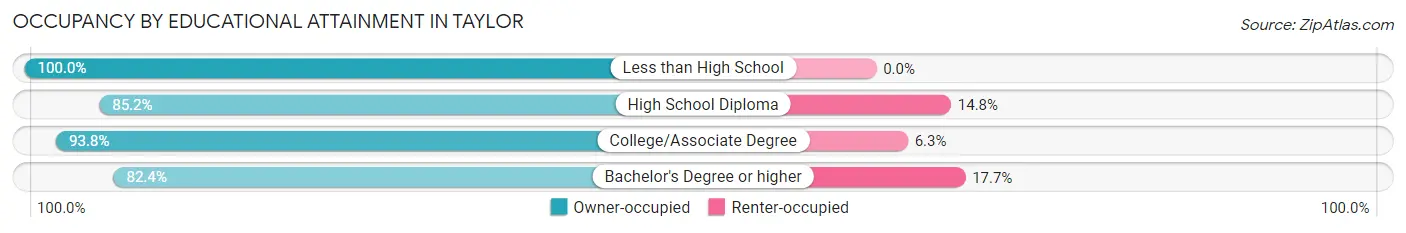
| Household Size | Owner-occupied | Renter-occupied |
| Less than High School | 3 (100.0%) | 0 (0.0%) |
| High School Diploma | 23 (85.2%) | 4 (14.8%) |
| College/Associate Degree | 15 (93.8%) | 1 (6.2%) |
| Bachelor's Degree or higher | 28 (82.4%) | 6 (17.6%) |
Occupancy by Age of Householder in Taylor
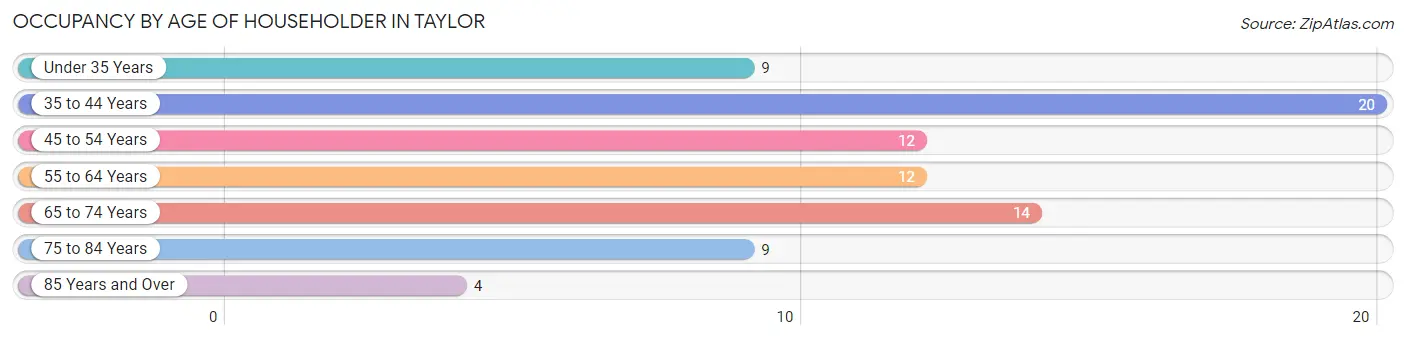
| Age Bracket | # Households | % Households |
| Under 35 Years | 9 | 11.3% |
| 35 to 44 Years | 20 | 25.0% |
| 45 to 54 Years | 12 | 15.0% |
| 55 to 64 Years | 12 | 15.0% |
| 65 to 74 Years | 14 | 17.5% |
| 75 to 84 Years | 9 | 11.3% |
| 85 Years and Over | 4 | 5.0% |
| Total | 80 | 100.0% |
Housing Finances in Taylor
Median Income by Occupancy in Taylor
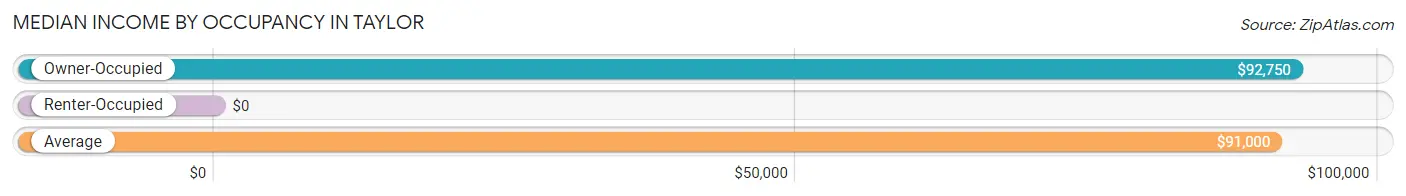
| Occupancy Type | # Households | Median Income |
| Owner-Occupied | 69 (86.3%) | $92,750 |
| Renter-Occupied | 11 (13.8%) | $0 |
| Average | 80 (100.0%) | $91,000 |
Occupancy by Householder Income Bracket in Taylor
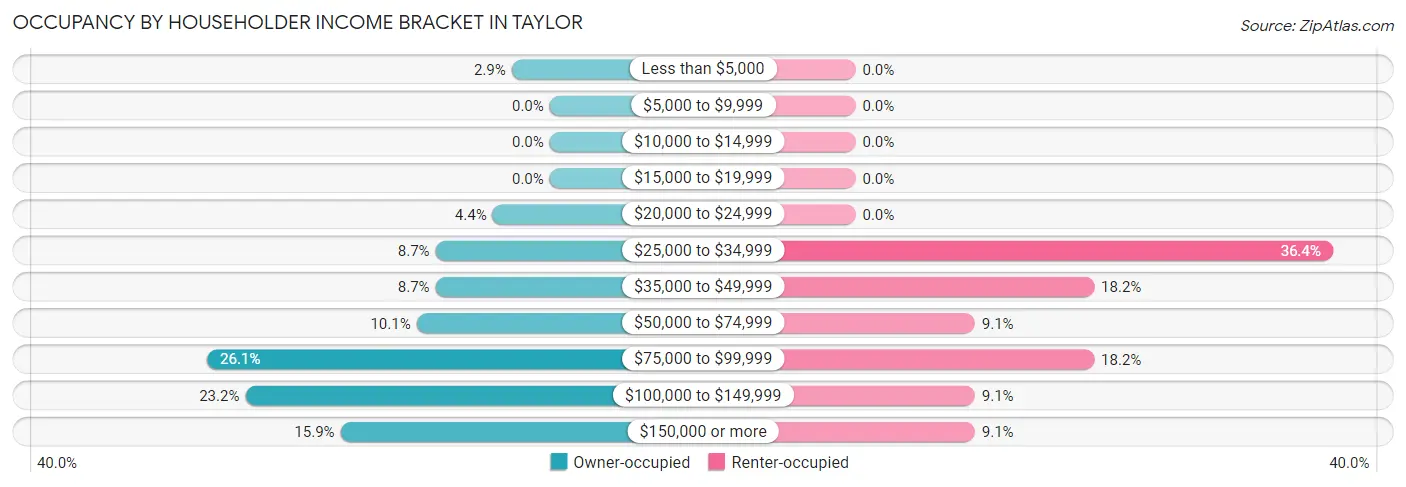
| Income Bracket | Owner-occupied | Renter-occupied |
| Less than $5,000 | 2 (2.9%) | 0 (0.0%) |
| $5,000 to $9,999 | 0 (0.0%) | 0 (0.0%) |
| $10,000 to $14,999 | 0 (0.0%) | 0 (0.0%) |
| $15,000 to $19,999 | 0 (0.0%) | 0 (0.0%) |
| $20,000 to $24,999 | 3 (4.3%) | 0 (0.0%) |
| $25,000 to $34,999 | 6 (8.7%) | 4 (36.4%) |
| $35,000 to $49,999 | 6 (8.7%) | 2 (18.2%) |
| $50,000 to $74,999 | 7 (10.1%) | 1 (9.1%) |
| $75,000 to $99,999 | 18 (26.1%) | 2 (18.2%) |
| $100,000 to $149,999 | 16 (23.2%) | 1 (9.1%) |
| $150,000 or more | 11 (15.9%) | 1 (9.1%) |
| Total | 69 (100.0%) | 11 (100.0%) |
Monthly Housing Cost Tiers in Taylor
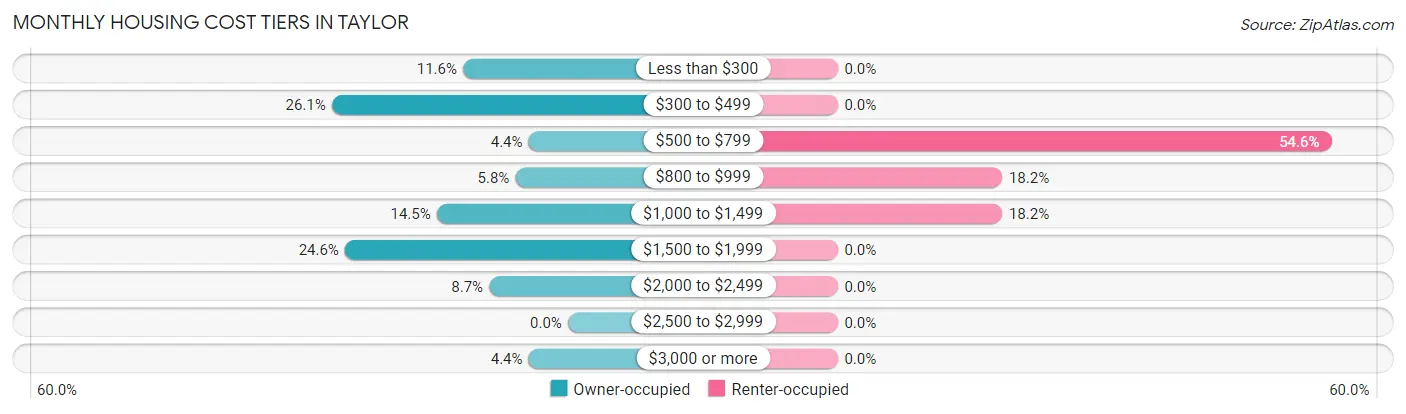
| Monthly Cost | Owner-occupied | Renter-occupied |
| Less than $300 | 8 (11.6%) | 0 (0.0%) |
| $300 to $499 | 18 (26.1%) | 0 (0.0%) |
| $500 to $799 | 3 (4.3%) | 6 (54.5%) |
| $800 to $999 | 4 (5.8%) | 2 (18.2%) |
| $1,000 to $1,499 | 10 (14.5%) | 2 (18.2%) |
| $1,500 to $1,999 | 17 (24.6%) | 0 (0.0%) |
| $2,000 to $2,499 | 6 (8.7%) | 0 (0.0%) |
| $2,500 to $2,999 | 0 (0.0%) | 0 (0.0%) |
| $3,000 or more | 3 (4.3%) | 0 (0.0%) |
| Total | 69 (100.0%) | 11 (100.0%) |
Physical Housing Characteristics in Taylor
Housing Structures in Taylor
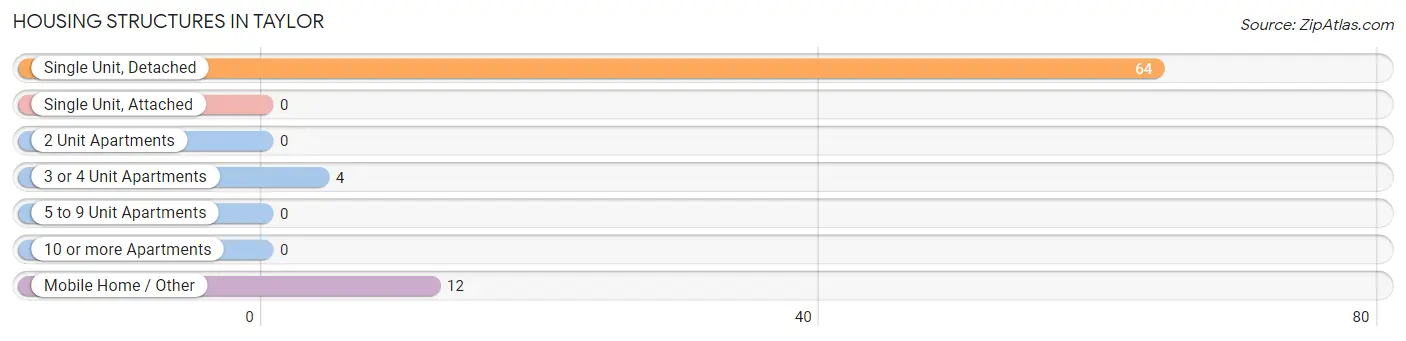
| Structure Type | # Housing Units | % Housing Units |
| Single Unit, Detached | 64 | 80.0% |
| Single Unit, Attached | 0 | 0.0% |
| 2 Unit Apartments | 0 | 0.0% |
| 3 or 4 Unit Apartments | 4 | 5.0% |
| 5 to 9 Unit Apartments | 0 | 0.0% |
| 10 or more Apartments | 0 | 0.0% |
| Mobile Home / Other | 12 | 15.0% |
| Total | 80 | 100.0% |
Housing Structures by Occupancy in Taylor
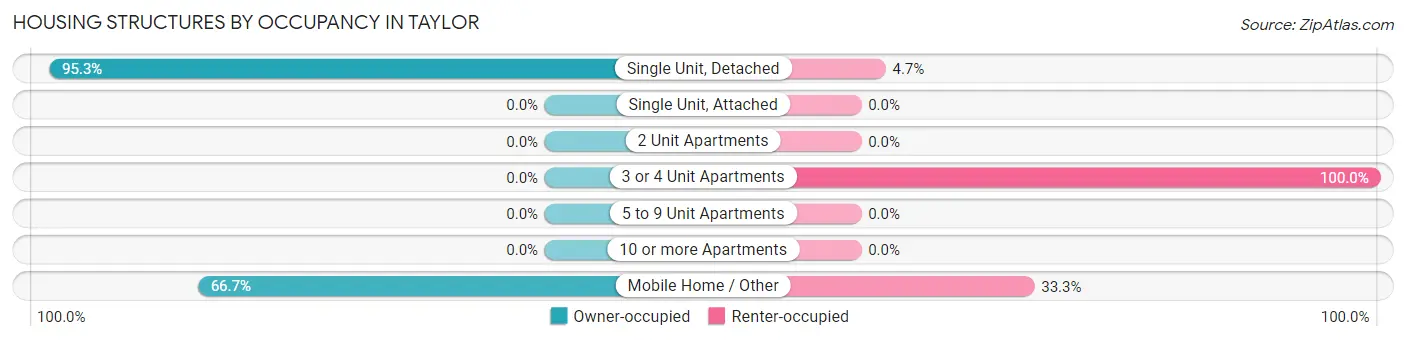
| Structure Type | Owner-occupied | Renter-occupied |
| Single Unit, Detached | 61 (95.3%) | 3 (4.7%) |
| Single Unit, Attached | 0 (0.0%) | 0 (0.0%) |
| 2 Unit Apartments | 0 (0.0%) | 0 (0.0%) |
| 3 or 4 Unit Apartments | 0 (0.0%) | 4 (100.0%) |
| 5 to 9 Unit Apartments | 0 (0.0%) | 0 (0.0%) |
| 10 or more Apartments | 0 (0.0%) | 0 (0.0%) |
| Mobile Home / Other | 8 (66.7%) | 4 (33.3%) |
| Total | 69 (86.3%) | 11 (13.8%) |
Housing Structures by Number of Rooms in Taylor
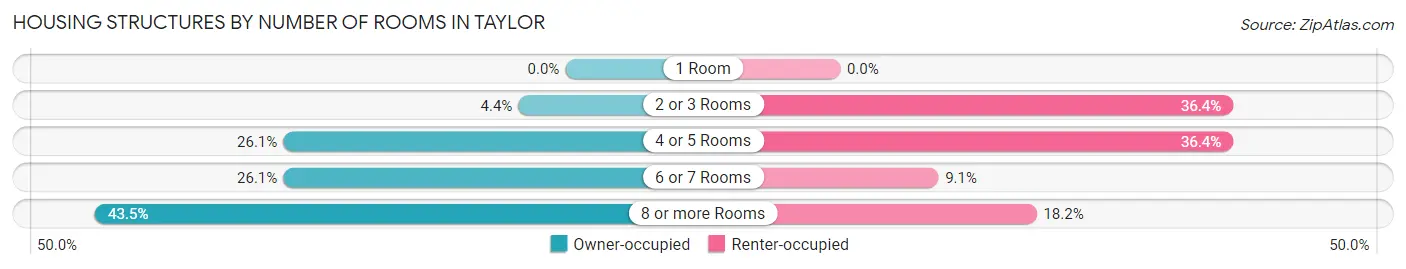
| Number of Rooms | Owner-occupied | Renter-occupied |
| 1 Room | 0 (0.0%) | 0 (0.0%) |
| 2 or 3 Rooms | 3 (4.3%) | 4 (36.4%) |
| 4 or 5 Rooms | 18 (26.1%) | 4 (36.4%) |
| 6 or 7 Rooms | 18 (26.1%) | 1 (9.1%) |
| 8 or more Rooms | 30 (43.5%) | 2 (18.2%) |
| Total | 69 (100.0%) | 11 (100.0%) |
Housing Structure by Heating Type in Taylor
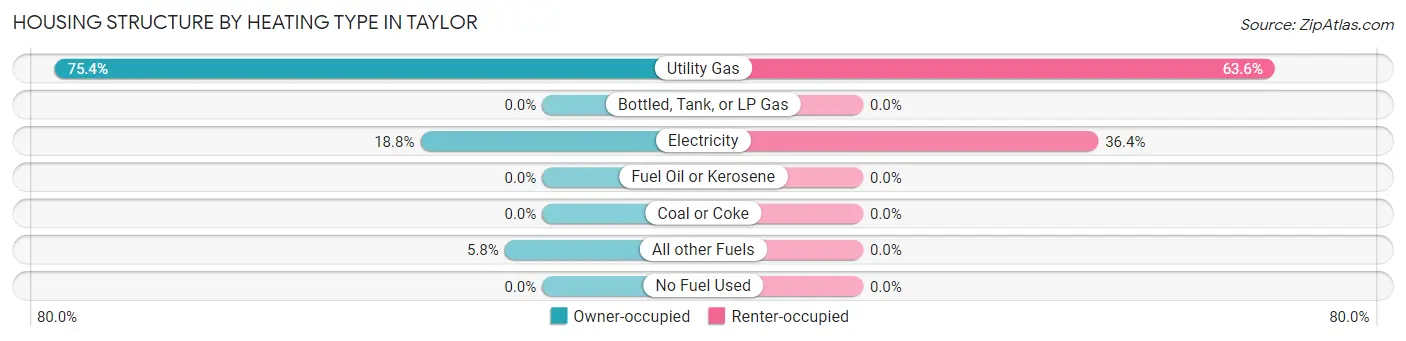
| Heating Type | Owner-occupied | Renter-occupied |
| Utility Gas | 52 (75.4%) | 7 (63.6%) |
| Bottled, Tank, or LP Gas | 0 (0.0%) | 0 (0.0%) |
| Electricity | 13 (18.8%) | 4 (36.4%) |
| Fuel Oil or Kerosene | 0 (0.0%) | 0 (0.0%) |
| Coal or Coke | 0 (0.0%) | 0 (0.0%) |
| All other Fuels | 4 (5.8%) | 0 (0.0%) |
| No Fuel Used | 0 (0.0%) | 0 (0.0%) |
| Total | 69 (100.0%) | 11 (100.0%) |
Household Vehicle Usage in Taylor
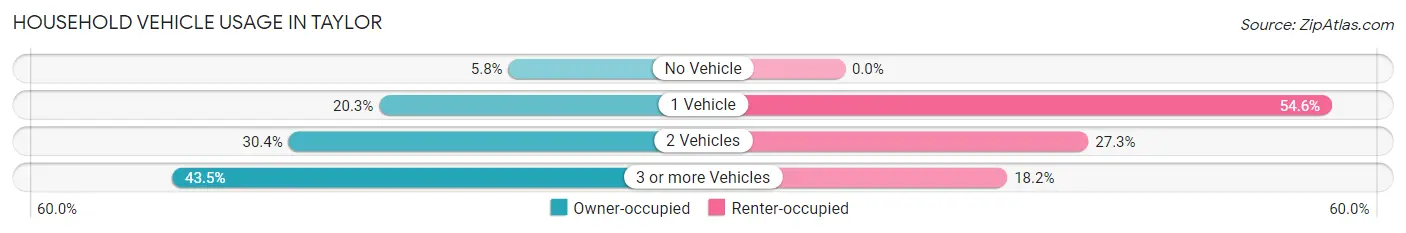
| Vehicles per Household | Owner-occupied | Renter-occupied |
| No Vehicle | 4 (5.8%) | 0 (0.0%) |
| 1 Vehicle | 14 (20.3%) | 6 (54.5%) |
| 2 Vehicles | 21 (30.4%) | 3 (27.3%) |
| 3 or more Vehicles | 30 (43.5%) | 2 (18.2%) |
| Total | 69 (100.0%) | 11 (100.0%) |
Real Estate & Mortgages in Taylor
Real Estate and Mortgage Overview in Taylor
| Characteristic | Without Mortgage | With Mortgage |
| Housing Units | 30 | 39 |
| Median Property Value | $91,800 | $216,200 |
| Median Household Income | $50,000 | $10 |
| Monthly Housing Costs | $371 | $3 |
| Real Estate Taxes | $1,083 | $0 |
Property Value by Mortgage Status in Taylor
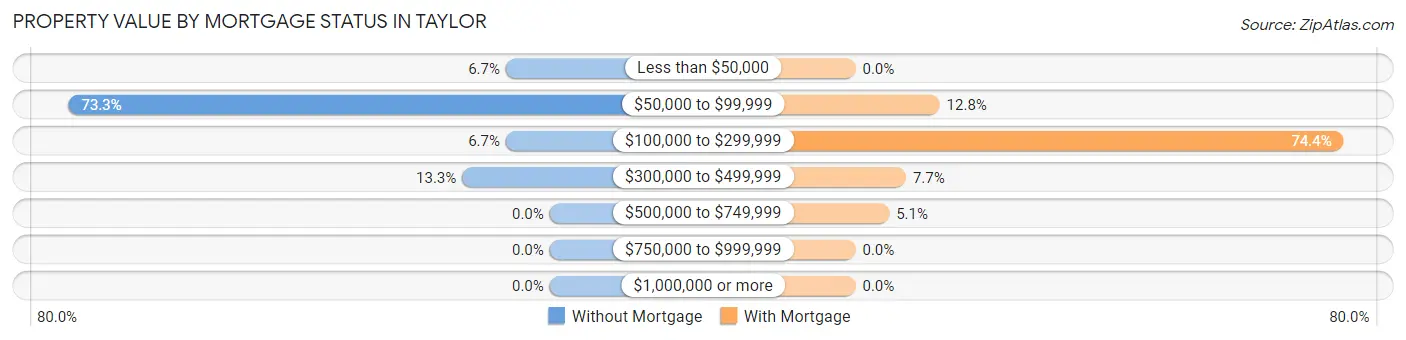
| Property Value | Without Mortgage | With Mortgage |
| Less than $50,000 | 2 (6.7%) | 0 (0.0%) |
| $50,000 to $99,999 | 22 (73.3%) | 5 (12.8%) |
| $100,000 to $299,999 | 2 (6.7%) | 29 (74.4%) |
| $300,000 to $499,999 | 4 (13.3%) | 3 (7.7%) |
| $500,000 to $749,999 | 0 (0.0%) | 2 (5.1%) |
| $750,000 to $999,999 | 0 (0.0%) | 0 (0.0%) |
| $1,000,000 or more | 0 (0.0%) | 0 (0.0%) |
| Total | 30 (100.0%) | 39 (100.0%) |
Household Income by Mortgage Status in Taylor
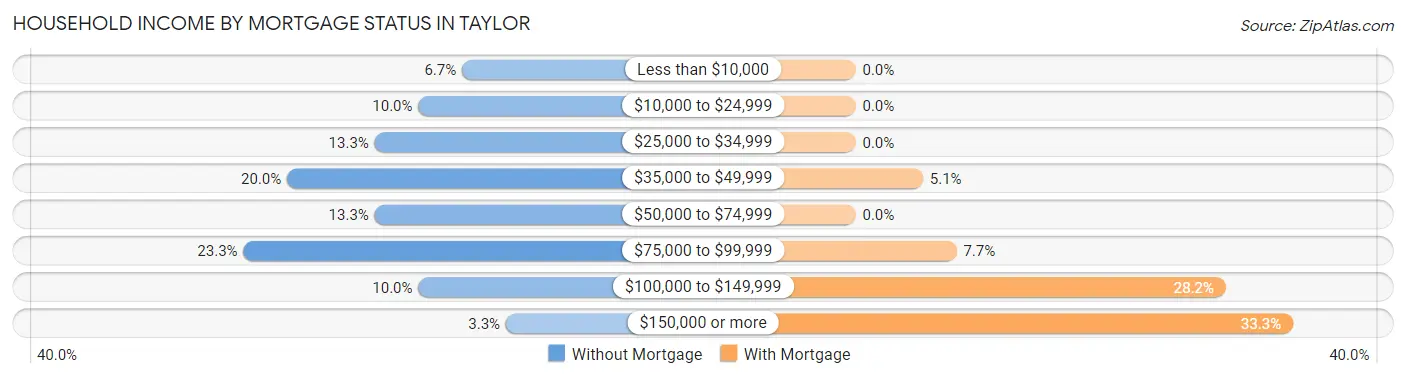
| Household Income | Without Mortgage | With Mortgage |
| Less than $10,000 | 2 (6.7%) | 0 (0.0%) |
| $10,000 to $24,999 | 3 (10.0%) | 0 (0.0%) |
| $25,000 to $34,999 | 4 (13.3%) | 0 (0.0%) |
| $35,000 to $49,999 | 6 (20.0%) | 2 (5.1%) |
| $50,000 to $74,999 | 4 (13.3%) | 0 (0.0%) |
| $75,000 to $99,999 | 7 (23.3%) | 3 (7.7%) |
| $100,000 to $149,999 | 3 (10.0%) | 11 (28.2%) |
| $150,000 or more | 1 (3.3%) | 13 (33.3%) |
| Total | 30 (100.0%) | 39 (100.0%) |
Property Value to Household Income Ratio in Taylor
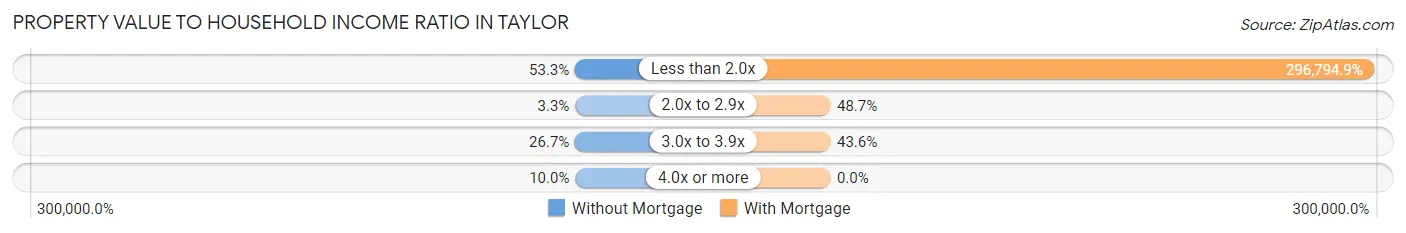
| Value-to-Income Ratio | Without Mortgage | With Mortgage |
| Less than 2.0x | 16 (53.3%) | 115,750 (296,794.9%) |
| 2.0x to 2.9x | 1 (3.3%) | 19 (48.7%) |
| 3.0x to 3.9x | 8 (26.7%) | 17 (43.6%) |
| 4.0x or more | 3 (10.0%) | 0 (0.0%) |
| Total | 30 (100.0%) | 39 (100.0%) |
Real Estate Taxes by Mortgage Status in Taylor
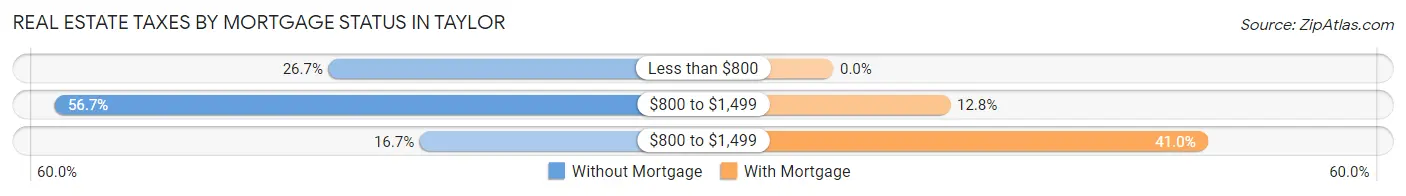
| Property Taxes | Without Mortgage | With Mortgage |
| Less than $800 | 8 (26.7%) | 0 (0.0%) |
| $800 to $1,499 | 17 (56.7%) | 5 (12.8%) |
| $800 to $1,499 | 5 (16.7%) | 16 (41.0%) |
| Total | 30 (100.0%) | 39 (100.0%) |
Health & Disability in Taylor
Health Insurance Coverage by Age in Taylor
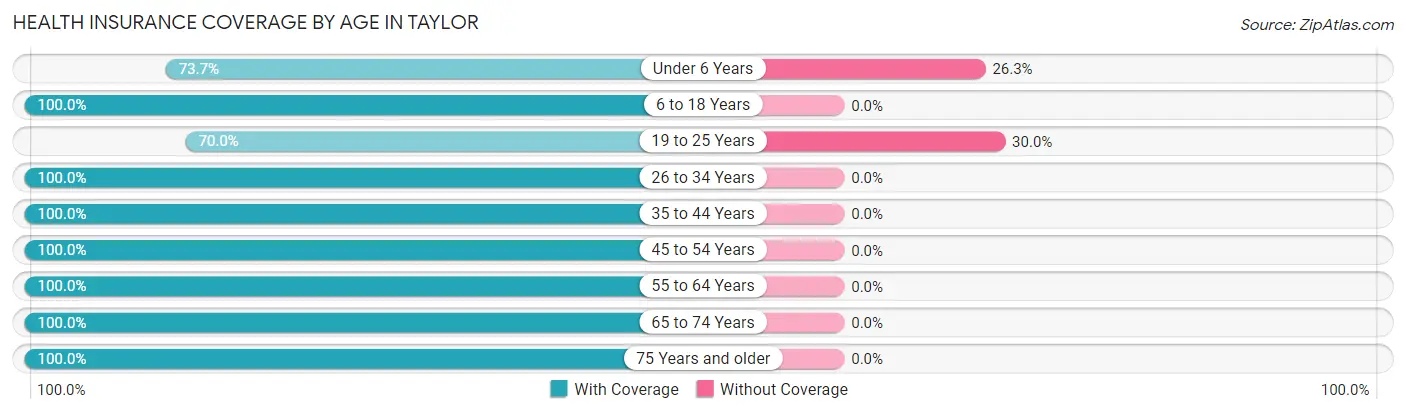
| Age Bracket | With Coverage | Without Coverage |
| Under 6 Years | 14 (73.7%) | 5 (26.3%) |
| 6 to 18 Years | 34 (100.0%) | 0 (0.0%) |
| 19 to 25 Years | 7 (70.0%) | 3 (30.0%) |
| 26 to 34 Years | 15 (100.0%) | 0 (0.0%) |
| 35 to 44 Years | 29 (100.0%) | 0 (0.0%) |
| 45 to 54 Years | 20 (100.0%) | 0 (0.0%) |
| 55 to 64 Years | 22 (100.0%) | 0 (0.0%) |
| 65 to 74 Years | 21 (100.0%) | 0 (0.0%) |
| 75 Years and older | 16 (100.0%) | 0 (0.0%) |
| Total | 178 (95.7%) | 8 (4.3%) |
Health Insurance Coverage by Citizenship Status in Taylor
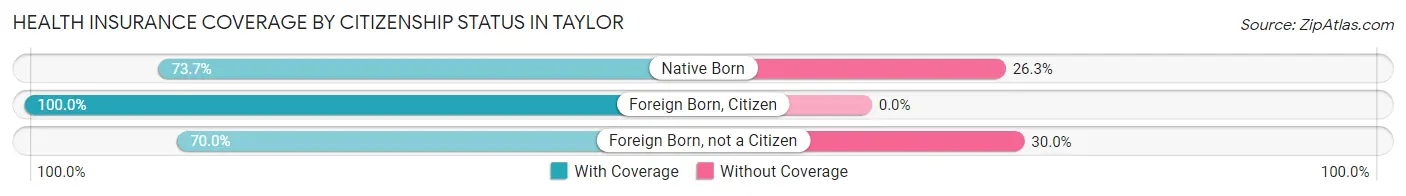
| Citizenship Status | With Coverage | Without Coverage |
| Native Born | 14 (73.7%) | 5 (26.3%) |
| Foreign Born, Citizen | 34 (100.0%) | 0 (0.0%) |
| Foreign Born, not a Citizen | 7 (70.0%) | 3 (30.0%) |
Health Insurance Coverage by Household Income in Taylor
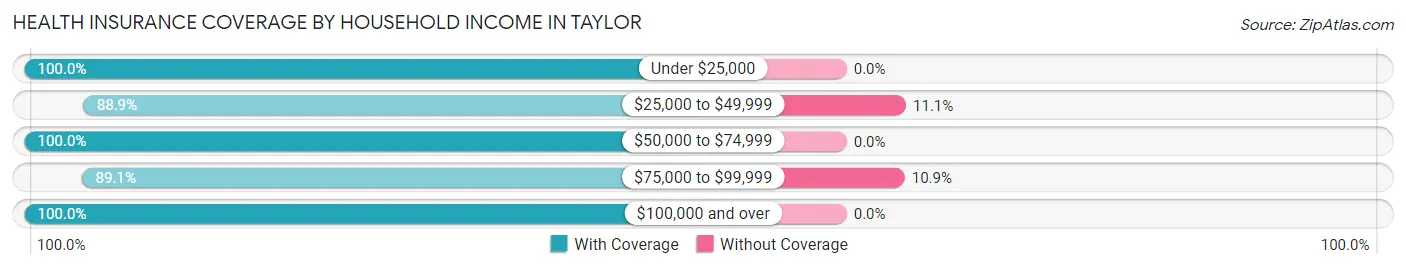
| Household Income | With Coverage | Without Coverage |
| Under $25,000 | 7 (100.0%) | 0 (0.0%) |
| $25,000 to $49,999 | 24 (88.9%) | 3 (11.1%) |
| $50,000 to $74,999 | 13 (100.0%) | 0 (0.0%) |
| $75,000 to $99,999 | 41 (89.1%) | 5 (10.9%) |
| $100,000 and over | 93 (100.0%) | 0 (0.0%) |
Public vs Private Health Insurance Coverage by Age in Taylor
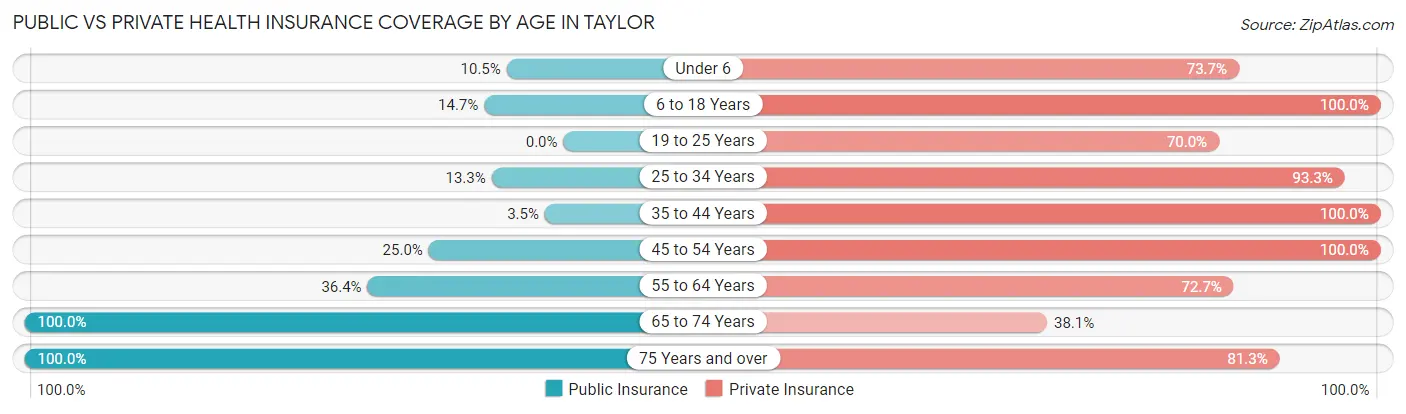
| Age Bracket | Public Insurance | Private Insurance |
| Under 6 | 2 (10.5%) | 14 (73.7%) |
| 6 to 18 Years | 5 (14.7%) | 34 (100.0%) |
| 19 to 25 Years | 0 (0.0%) | 7 (70.0%) |
| 25 to 34 Years | 2 (13.3%) | 14 (93.3%) |
| 35 to 44 Years | 1 (3.5%) | 29 (100.0%) |
| 45 to 54 Years | 5 (25.0%) | 20 (100.0%) |
| 55 to 64 Years | 8 (36.4%) | 16 (72.7%) |
| 65 to 74 Years | 21 (100.0%) | 8 (38.1%) |
| 75 Years and over | 16 (100.0%) | 13 (81.2%) |
| Total | 60 (32.3%) | 155 (83.3%) |
Disability Status by Sex by Age in Taylor
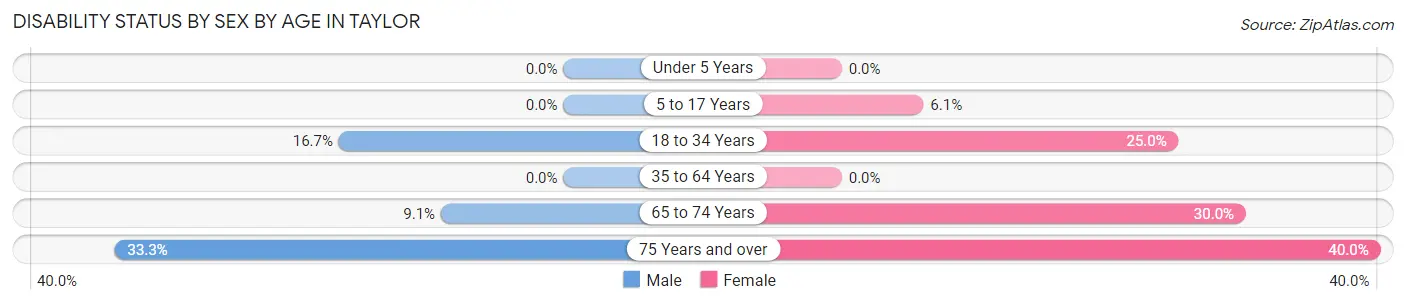
| Age Bracket | Male | Female |
| Under 5 Years | 0 (0.0%) | 0 (0.0%) |
| 5 to 17 Years | 0 (0.0%) | 2 (6.1%) |
| 18 to 34 Years | 3 (16.7%) | 2 (25.0%) |
| 35 to 64 Years | 0 (0.0%) | 0 (0.0%) |
| 65 to 74 Years | 1 (9.1%) | 3 (30.0%) |
| 75 Years and over | 2 (33.3%) | 4 (40.0%) |
Disability Class by Sex by Age in Taylor
Disability Class: Hearing Difficulty
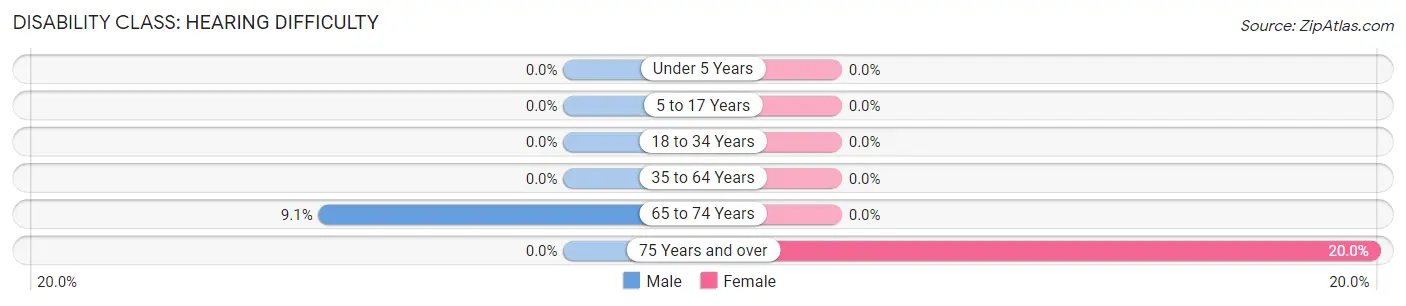
| Age Bracket | Male | Female |
| Under 5 Years | 0 (0.0%) | 0 (0.0%) |
| 5 to 17 Years | 0 (0.0%) | 0 (0.0%) |
| 18 to 34 Years | 0 (0.0%) | 0 (0.0%) |
| 35 to 64 Years | 0 (0.0%) | 0 (0.0%) |
| 65 to 74 Years | 1 (9.1%) | 0 (0.0%) |
| 75 Years and over | 0 (0.0%) | 2 (20.0%) |
Disability Class: Vision Difficulty
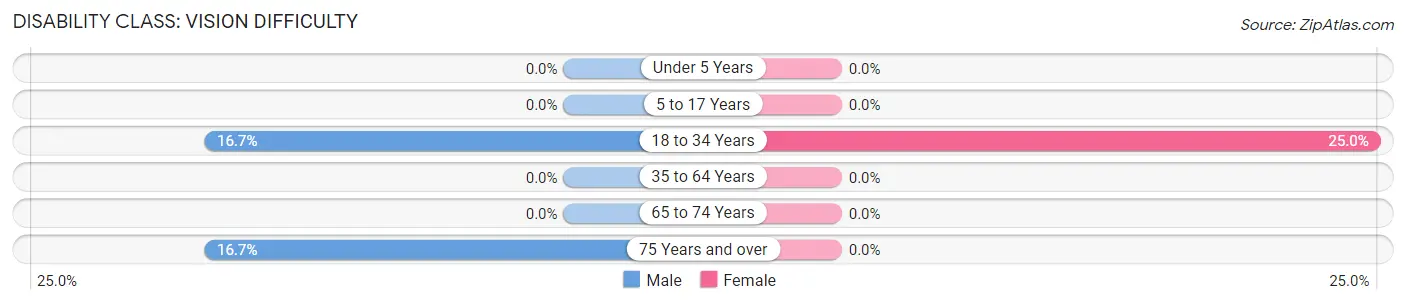
| Age Bracket | Male | Female |
| Under 5 Years | 0 (0.0%) | 0 (0.0%) |
| 5 to 17 Years | 0 (0.0%) | 0 (0.0%) |
| 18 to 34 Years | 3 (16.7%) | 2 (25.0%) |
| 35 to 64 Years | 0 (0.0%) | 0 (0.0%) |
| 65 to 74 Years | 0 (0.0%) | 0 (0.0%) |
| 75 Years and over | 1 (16.7%) | 0 (0.0%) |
Disability Class: Cognitive Difficulty
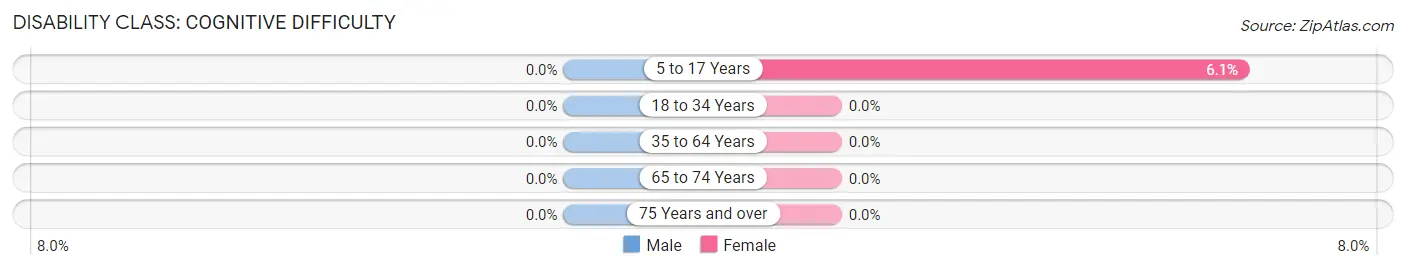
| Age Bracket | Male | Female |
| 5 to 17 Years | 0 (0.0%) | 2 (6.1%) |
| 18 to 34 Years | 0 (0.0%) | 0 (0.0%) |
| 35 to 64 Years | 0 (0.0%) | 0 (0.0%) |
| 65 to 74 Years | 0 (0.0%) | 0 (0.0%) |
| 75 Years and over | 0 (0.0%) | 0 (0.0%) |
Disability Class: Ambulatory Difficulty
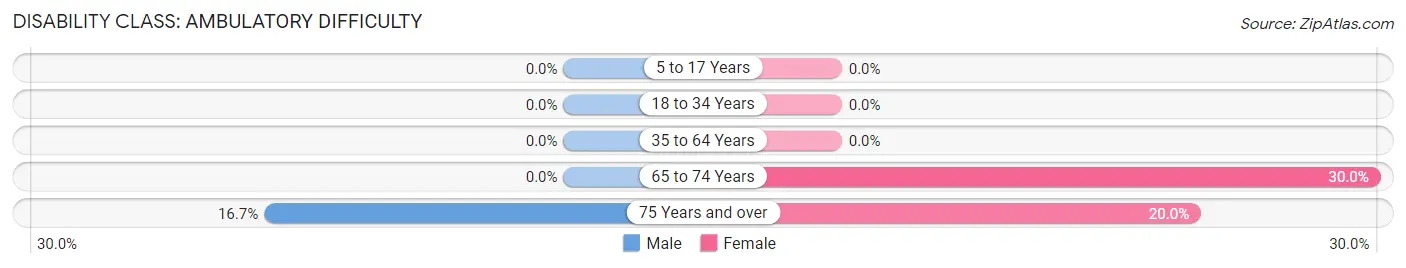
| Age Bracket | Male | Female |
| 5 to 17 Years | 0 (0.0%) | 0 (0.0%) |
| 18 to 34 Years | 0 (0.0%) | 0 (0.0%) |
| 35 to 64 Years | 0 (0.0%) | 0 (0.0%) |
| 65 to 74 Years | 0 (0.0%) | 3 (30.0%) |
| 75 Years and over | 1 (16.7%) | 2 (20.0%) |
Disability Class: Self-Care Difficulty
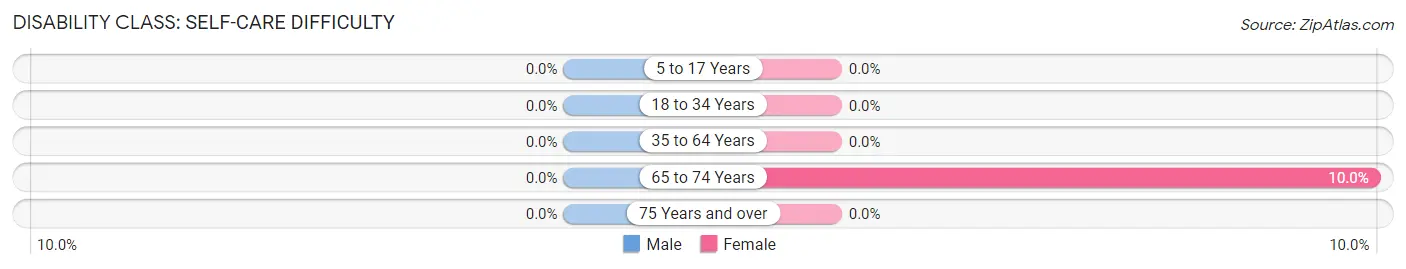
| Age Bracket | Male | Female |
| 5 to 17 Years | 0 (0.0%) | 0 (0.0%) |
| 18 to 34 Years | 0 (0.0%) | 0 (0.0%) |
| 35 to 64 Years | 0 (0.0%) | 0 (0.0%) |
| 65 to 74 Years | 0 (0.0%) | 1 (10.0%) |
| 75 Years and over | 0 (0.0%) | 0 (0.0%) |
Technology Access in Taylor
Computing Device Access in Taylor
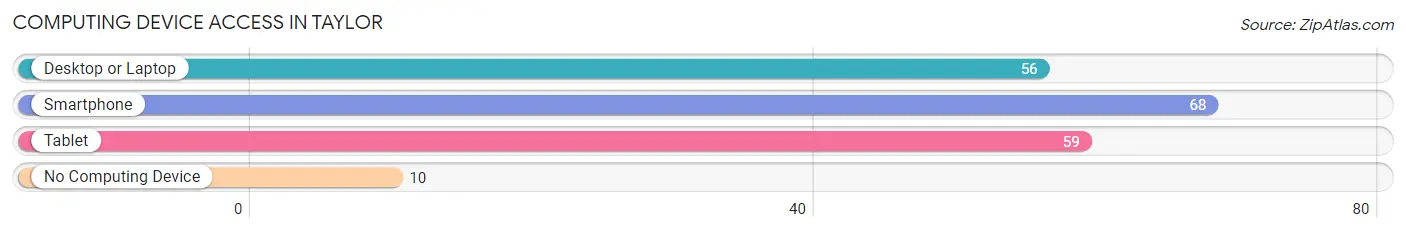
| Device Type | # Households | % Households |
| Desktop or Laptop | 56 | 70.0% |
| Smartphone | 68 | 85.0% |
| Tablet | 59 | 73.8% |
| No Computing Device | 10 | 12.5% |
| Total | 80 | 100.0% |
Internet Access in Taylor
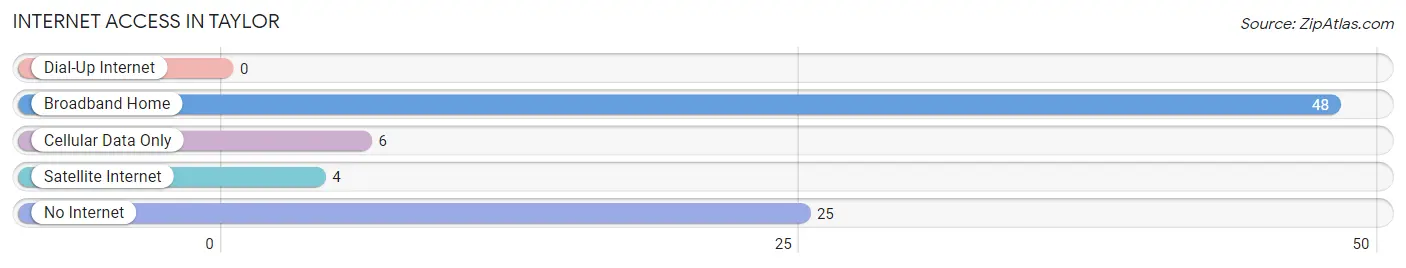
| Internet Type | # Households | % Households |
| Dial-Up Internet | 0 | 0.0% |
| Broadband Home | 48 | 60.0% |
| Cellular Data Only | 6 | 7.5% |
| Satellite Internet | 4 | 5.0% |
| No Internet | 25 | 31.2% |
| Total | 80 | 100.0% |
Taylor Summary
The history of North Dakota is a long and varied one, stretching back to the days of the Native Americans who first inhabited the area. The first Europeans to explore the area were French fur traders, who arrived in the late 1700s. The area was then part of the Louisiana Purchase, and was part of the Dakota Territory until 1889, when it became the 39th state in the Union.
Geographically, North Dakota is located in the northern Great Plains region of the United States. It is bordered by Minnesota to the east, South Dakota to the south, Montana to the west, and the Canadian provinces of Saskatchewan and Manitoba to the north. The state is divided into 53 counties, and its capital is Bismarck.
North Dakota has a diverse economy, with agriculture, energy, and tourism being the main industries. Agriculture is the largest sector, with wheat, corn, soybeans, and sunflowers being the main crops. The state is also a major producer of beef, pork, and dairy products. Energy production is also important, with oil and natural gas being the main sources. Tourism is also a major industry, with the state’s many national parks and monuments drawing visitors from all over the world.
North Dakota’s population in 2000 was 642,200, making it the 47th most populous state in the country. The population is largely rural, with the majority of people living in small towns and rural areas. The largest city is Fargo, with a population of 90,599. The state’s population is largely white, with Native Americans making up the largest minority group. The median household income in 2000 was $37,845, and the median age was 35.7 years.
North Dakota has a rich and varied history, and its economy and demographics have changed over the years. The state is a major producer of agricultural products, and its energy industry is also important. Tourism is also a major industry, and the state’s population is largely rural. North Dakota is a great place to live and work, and its history and culture are sure to continue to draw people from all over the world.
Common Questions
What is Per Capita Income in Taylor?
Per Capita income in Taylor is $39,369.
What is the Median Family Income in Taylor?
Median Family Income in Taylor is $93,750.
What is the Median Household income in Taylor?
Median Household Income in Taylor is $91,000.
What is Income or Wage Gap in Taylor?
Income or Wage Gap in Taylor is 24.4%.
Women in Taylor earn 75.6 cents for every dollar earned by a man.
What is Inequality or Gini Index in Taylor?
Inequality or Gini Index in Taylor is 0.34.
What is the Total Population of Taylor?
Total Population of Taylor is 186.
What is the Total Male Population of Taylor?
Total Male Population of Taylor is 88.
What is the Total Female Population of Taylor?
Total Female Population of Taylor is 98.
What is the Ratio of Males per 100 Females in Taylor?
There are 89.80 Males per 100 Females in Taylor.
What is the Ratio of Females per 100 Males in Taylor?
There are 111.36 Females per 100 Males in Taylor.
What is the Median Population Age in Taylor?
Median Population Age in Taylor is 37.0 Years.
What is the Average Family Size in Taylor
Average Family Size in Taylor is 2.7 People.
What is the Average Household Size in Taylor
Average Household Size in Taylor is 2.3 People.
How Large is the Labor Force in Taylor?
There are 99 People in the Labor Forcein in Taylor.
What is the Percentage of People in the Labor Force in Taylor?
72.3% of People are in the Labor Force in Taylor.
What is the Unemployment Rate in Taylor?
Unemployment Rate in Taylor is 8.1%.