Palestine, TX Map & Demographics
Palestine Map
Palestine Overview
$23,235
PER CAPITA INCOME
$52,371
AVG FAMILY INCOME
$43,759
AVG HOUSEHOLD INCOME
34.0%
WAGE / INCOME GAP [ % ]
66.0¢/ $1
WAGE / INCOME GAP [ $ ]
0.42
INEQUALITY / GINI INDEX
18,741
TOTAL POPULATION
9,245
MALE POPULATION
9,496
FEMALE POPULATION
97.36
MALES / 100 FEMALES
102.71
FEMALES / 100 MALES
33.1
MEDIAN AGE
3.2
AVG FAMILY SIZE
2.6
AVG HOUSEHOLD SIZE
8,885
LABOR FORCE [ PEOPLE ]
62.1%
PERCENT IN LABOR FORCE
4.0%
UNEMPLOYMENT RATE
Income in Palestine
Income Overview in Palestine
Per Capita Income in Palestine is $23,235, while median incomes of families and households are $52,371 and $43,759 respectively.
| Characteristic | Number | Measure |
| Per Capita Income | 18,741 | $23,235 |
| Median Family Income | 4,904 | $52,371 |
| Mean Family Income | 4,904 | $67,003 |
| Median Household Income | 7,028 | $43,759 |
| Mean Household Income | 7,028 | $58,366 |
| Income Deficit | 4,904 | $0 |
| Wage / Income Gap (%) | 18,741 | 33.97% |
| Wage / Income Gap ($) | 18,741 | 66.03¢ per $1 |
| Gini / Inequality Index | 18,741 | 0.42 |
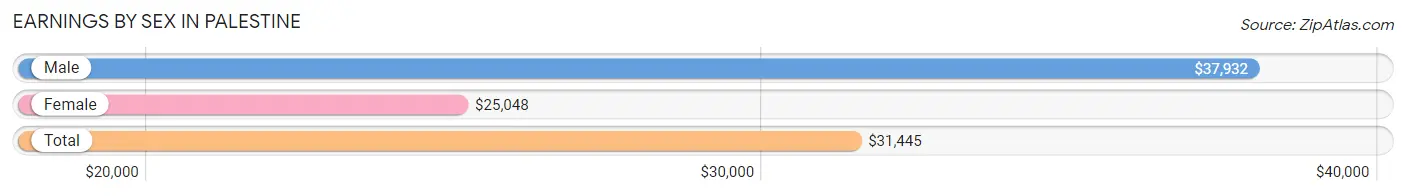
Earnings by Sex in Palestine
Average Earnings in Palestine are $31,445, $37,932 for men and $25,048 for women, a difference of 34.0%.
| Sex | Number | Average Earnings |
| Male | 4,766 (53.0%) | $37,932 |
| Female | 4,220 (47.0%) | $25,048 |
| Total | 8,986 (100.0%) | $31,445 |
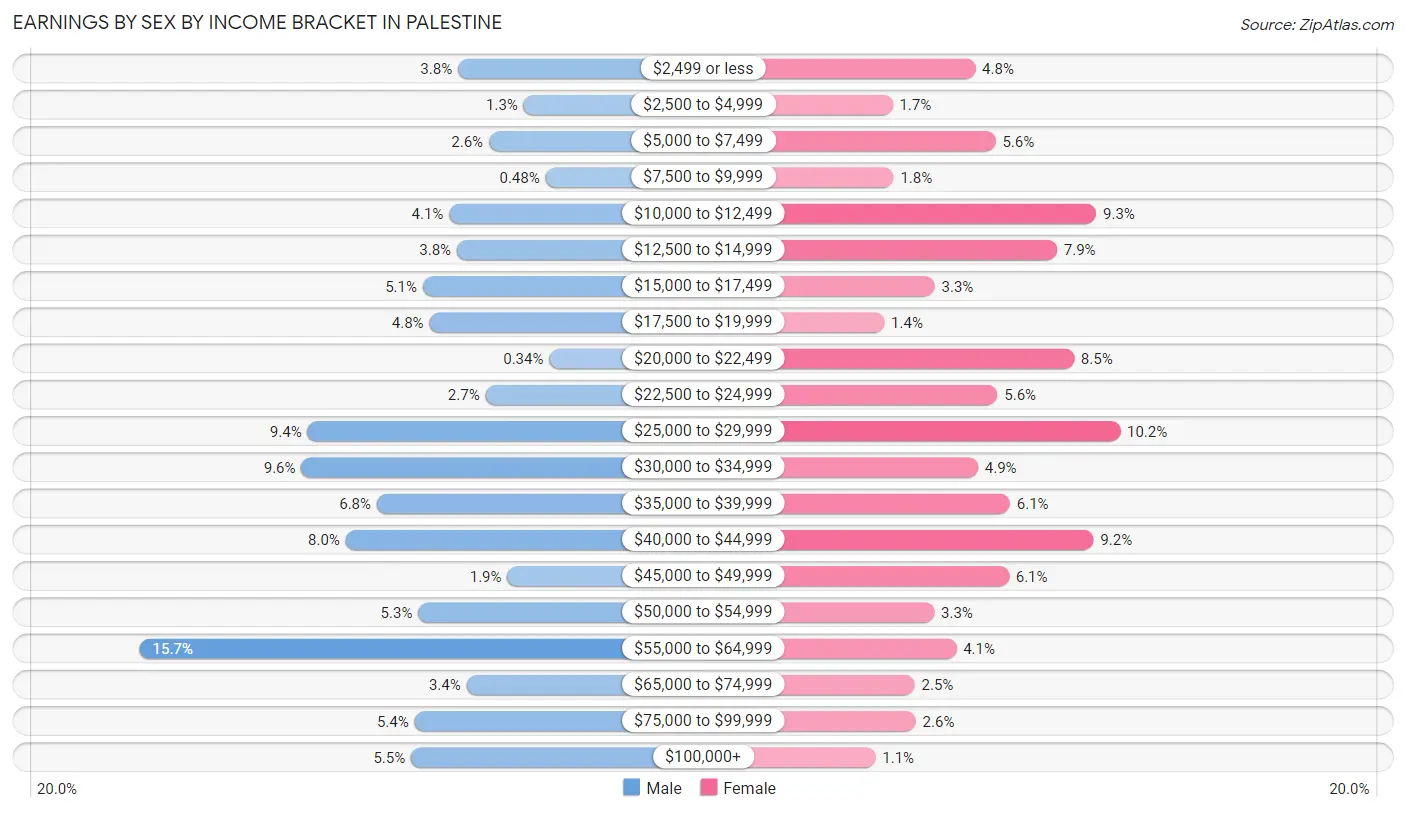
Earnings by Sex by Income Bracket in Palestine
The most common earnings brackets in Palestine are $55,000 to $64,999 for men (748 | 15.7%) and $25,000 to $29,999 for women (432 | 10.2%).
| Income | Male | Female |
| $2,499 or less | 179 (3.8%) | 203 (4.8%) |
| $2,500 to $4,999 | 62 (1.3%) | 72 (1.7%) |
| $5,000 to $7,499 | 124 (2.6%) | 235 (5.6%) |
| $7,500 to $9,999 | 23 (0.5%) | 74 (1.8%) |
| $10,000 to $12,499 | 195 (4.1%) | 394 (9.3%) |
| $12,500 to $14,999 | 181 (3.8%) | 332 (7.9%) |
| $15,000 to $17,499 | 242 (5.1%) | 139 (3.3%) |
| $17,500 to $19,999 | 230 (4.8%) | 59 (1.4%) |
| $20,000 to $22,499 | 16 (0.3%) | 359 (8.5%) |
| $22,500 to $24,999 | 130 (2.7%) | 238 (5.6%) |
| $25,000 to $29,999 | 448 (9.4%) | 432 (10.2%) |
| $30,000 to $34,999 | 459 (9.6%) | 207 (4.9%) |
| $35,000 to $39,999 | 324 (6.8%) | 258 (6.1%) |
| $40,000 to $44,999 | 380 (8.0%) | 390 (9.2%) |
| $45,000 to $49,999 | 91 (1.9%) | 256 (6.1%) |
| $50,000 to $54,999 | 250 (5.2%) | 138 (3.3%) |
| $55,000 to $64,999 | 748 (15.7%) | 173 (4.1%) |
| $65,000 to $74,999 | 164 (3.4%) | 107 (2.5%) |
| $75,000 to $99,999 | 257 (5.4%) | 109 (2.6%) |
| $100,000+ | 263 (5.5%) | 45 (1.1%) |
| Total | 4,766 (100.0%) | 4,220 (100.0%) |
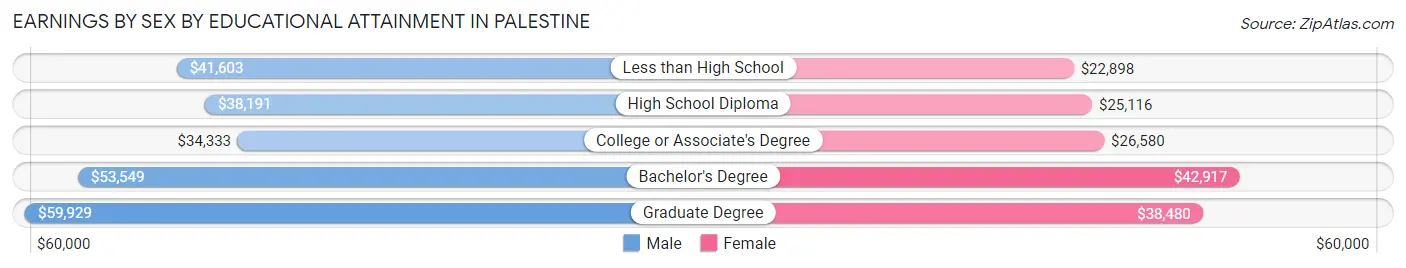
Earnings by Sex by Educational Attainment in Palestine
Average earnings in Palestine are $42,159 for men and $27,364 for women, a difference of 35.1%. Men with an educational attainment of graduate degree enjoy the highest average annual earnings of $59,929, while those with college or associate's degree education earn the least with $34,333. Women with an educational attainment of bachelor's degree earn the most with the average annual earnings of $42,917, while those with less than high school education have the smallest earnings of $22,898.
| Educational Attainment | Male Income | Female Income |
| Less than High School | $41,603 | $22,898 |
| High School Diploma | $38,191 | $25,116 |
| College or Associate's Degree | $34,333 | $26,580 |
| Bachelor's Degree | $53,549 | $42,917 |
| Graduate Degree | $59,929 | $38,480 |
| Total | $42,159 | $27,364 |
Family Income in Palestine
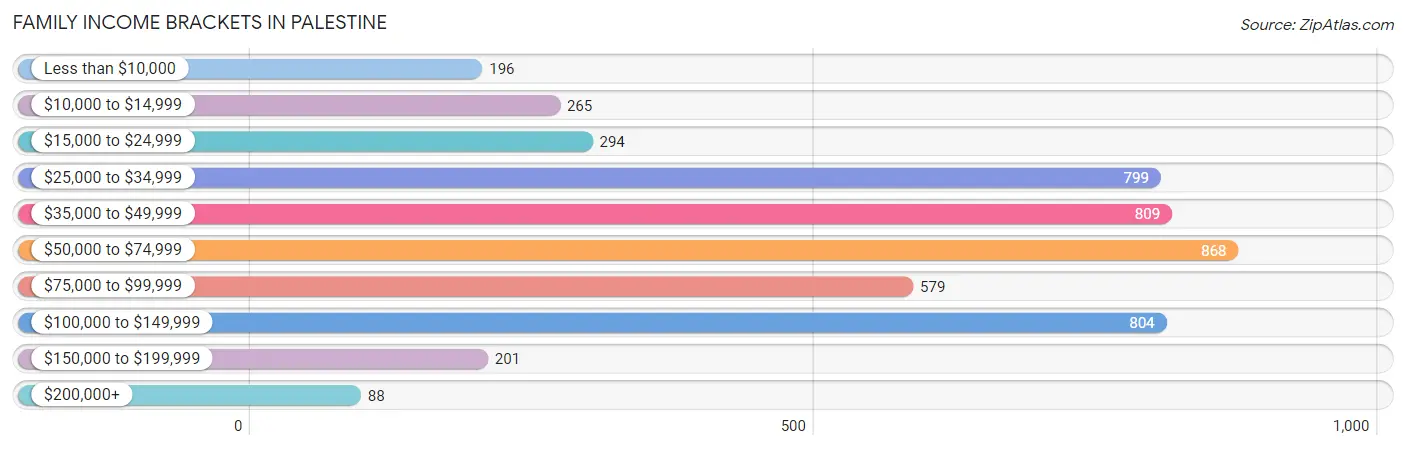
Family Income Brackets in Palestine
According to the Palestine family income data, there are 868 families falling into the $50,000 to $74,999 income range, which is the most common income bracket and makes up 17.7% of all families. Conversely, the $200,000+ income bracket is the least frequent group with only 88 families (1.8%) belonging to this category.
| Income Bracket | # Families | % Families |
| Less than $10,000 | 196 | 4.0% |
| $10,000 to $14,999 | 265 | 5.4% |
| $15,000 to $24,999 | 294 | 6.0% |
| $25,000 to $34,999 | 799 | 16.3% |
| $35,000 to $49,999 | 809 | 16.5% |
| $50,000 to $74,999 | 868 | 17.7% |
| $75,000 to $99,999 | 579 | 11.8% |
| $100,000 to $149,999 | 804 | 16.4% |
| $150,000 to $199,999 | 201 | 4.1% |
| $200,000+ | 88 | 1.8% |
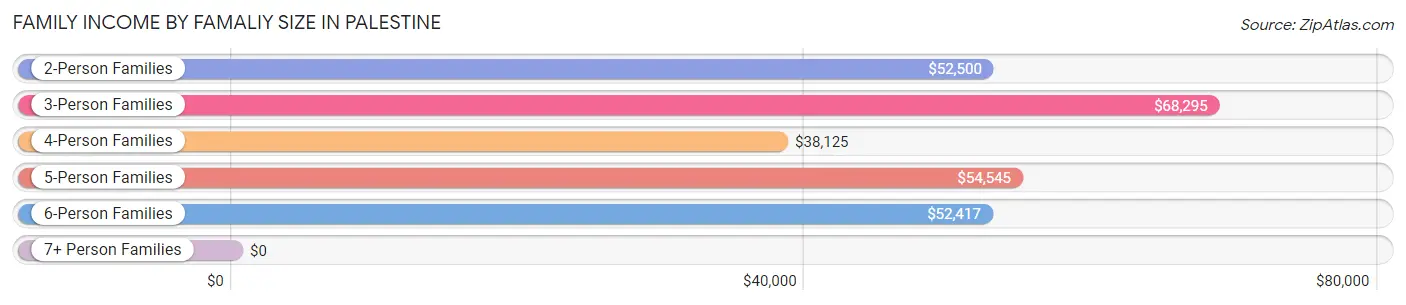
Family Income by Famaliy Size in Palestine
3-person families (1,415 | 28.8%) account for the highest median family income in Palestine with $68,295 per family, while 2-person families (1,852 | 37.8%) have the highest median income of $26,250 per family member.
| Income Bracket | # Families | Median Income |
| 2-Person Families | 1,852 (37.8%) | $52,500 |
| 3-Person Families | 1,415 (28.8%) | $68,295 |
| 4-Person Families | 985 (20.1%) | $38,125 |
| 5-Person Families | 530 (10.8%) | $54,545 |
| 6-Person Families | 111 (2.3%) | $52,417 |
| 7+ Person Families | 11 (0.2%) | $0 |
| Total | 4,904 (100.0%) | $52,371 |
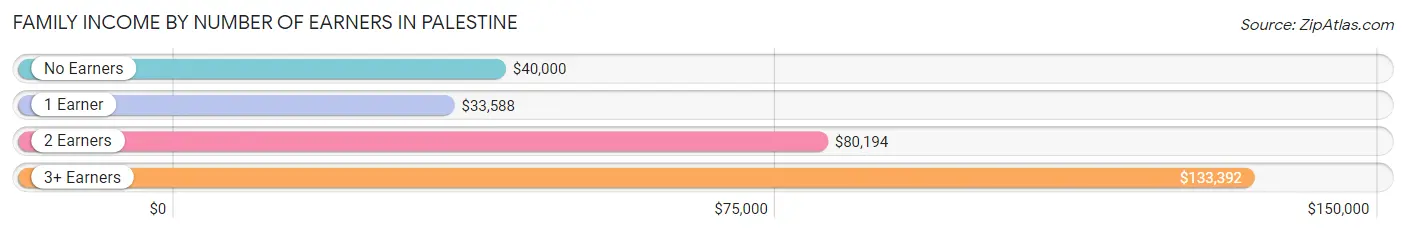
Family Income by Number of Earners in Palestine
The median family income in Palestine is $52,371, with families comprising 3+ earners (623) having the highest median family income of $133,392, while families with 1 earner (1,903) have the lowest median family income of $33,588, accounting for 12.7% and 38.8% of families, respectively.
| Number of Earners | # Families | Median Income |
| No Earners | 762 (15.5%) | $40,000 |
| 1 Earner | 1,903 (38.8%) | $33,588 |
| 2 Earners | 1,616 (33.0%) | $80,194 |
| 3+ Earners | 623 (12.7%) | $133,392 |
| Total | 4,904 (100.0%) | $52,371 |
Household Income in Palestine
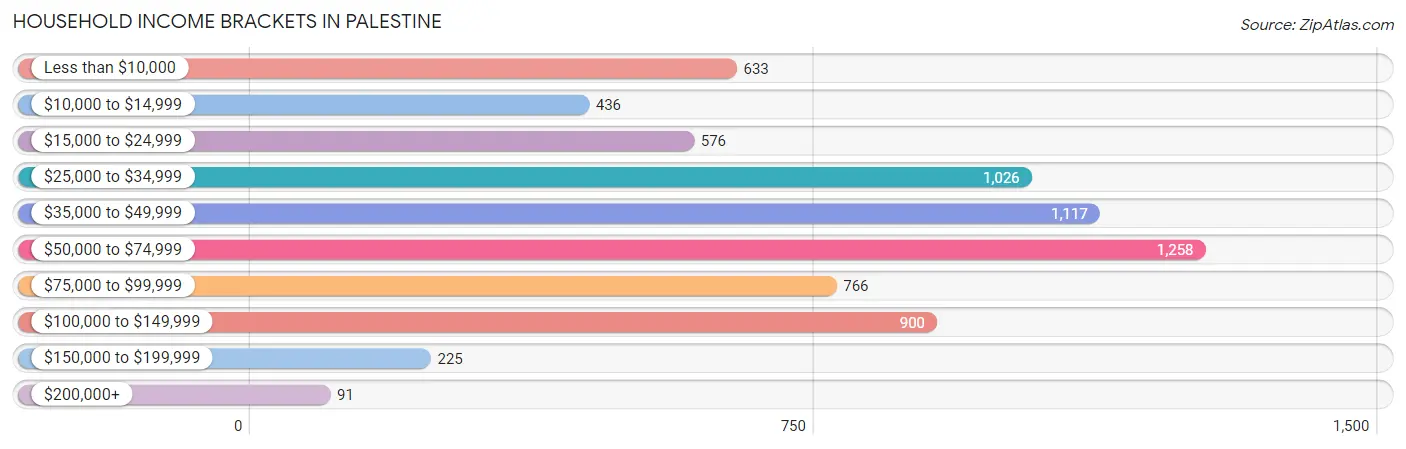
Household Income Brackets in Palestine
With 1,258 households falling in the category, the $50,000 to $74,999 income range is the most frequent in Palestine, accounting for 17.9% of all households. In contrast, only 91 households (1.3%) fall into the $200,000+ income bracket, making it the least populous group.
| Income Bracket | # Households | % Households |
| Less than $10,000 | 633 | 9.0% |
| $10,000 to $14,999 | 436 | 6.2% |
| $15,000 to $24,999 | 576 | 8.2% |
| $25,000 to $34,999 | 1,026 | 14.6% |
| $35,000 to $49,999 | 1,117 | 15.9% |
| $50,000 to $74,999 | 1,258 | 17.9% |
| $75,000 to $99,999 | 766 | 10.9% |
| $100,000 to $149,999 | 900 | 12.8% |
| $150,000 to $199,999 | 225 | 3.2% |
| $200,000+ | 91 | 1.3% |
Household Income by Householder Age in Palestine
The median household income in Palestine is $43,759, with the highest median household income of $53,500 found in the 45 to 64 years age bracket for the primary householder. A total of 1,868 households (26.6%) fall into this category. Meanwhile, the 15 to 24 years age bracket for the primary householder has the lowest median household income of $41,103, with 395 households (5.6%) in this group.
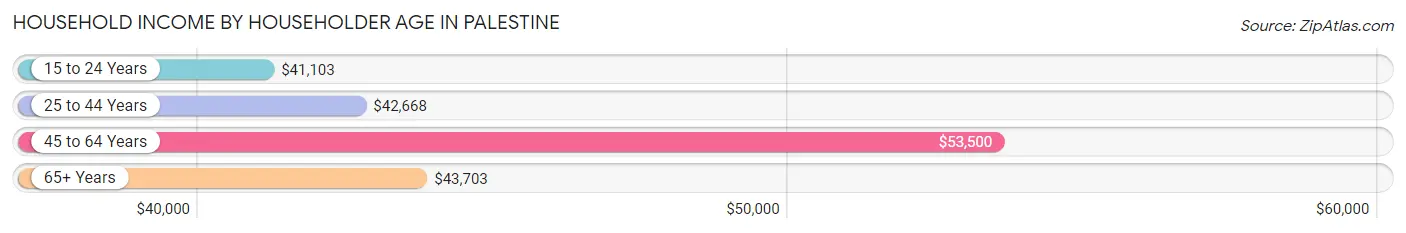
| Income Bracket | # Households | Median Income |
| 15 to 24 Years | 395 (5.6%) | $41,103 |
| 25 to 44 Years | 3,161 (45.0%) | $42,668 |
| 45 to 64 Years | 1,868 (26.6%) | $53,500 |
| 65+ Years | 1,604 (22.8%) | $43,703 |
| Total | 7,028 (100.0%) | $43,759 |
Poverty in Palestine
Income Below Poverty by Sex and Age in Palestine
With 16.7% poverty level for males and 19.4% for females among the residents of Palestine, 15 year old males and 5 year old females are the most vulnerable to poverty, with 109 males (77.3%) and 52 females (82.5%) in their respective age groups living below the poverty level.
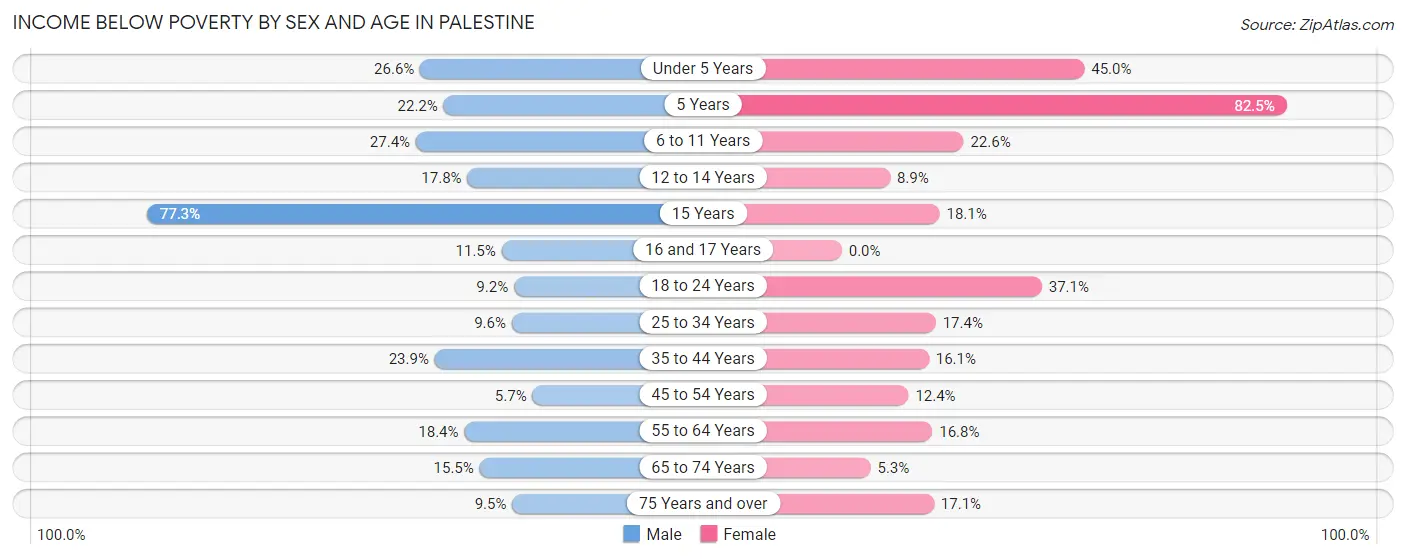
| Age Bracket | Male | Female |
| Under 5 Years | 219 (26.6%) | 311 (45.0%) |
| 5 Years | 14 (22.2%) | 52 (82.5%) |
| 6 to 11 Years | 196 (27.4%) | 218 (22.6%) |
| 12 to 14 Years | 88 (17.8%) | 22 (8.9%) |
| 15 Years | 109 (77.3%) | 37 (18.1%) |
| 16 and 17 Years | 37 (11.5%) | 0 (0.0%) |
| 18 to 24 Years | 82 (9.2%) | 297 (37.1%) |
| 25 to 34 Years | 152 (9.6%) | 269 (17.4%) |
| 35 to 44 Years | 350 (23.9%) | 183 (16.1%) |
| 45 to 54 Years | 70 (5.7%) | 138 (12.4%) |
| 55 to 64 Years | 77 (18.4%) | 130 (16.8%) |
| 65 to 74 Years | 76 (15.5%) | 50 (5.3%) |
| 75 Years and over | 32 (9.5%) | 112 (17.1%) |
| Total | 1,502 (16.7%) | 1,819 (19.4%) |
Income Above Poverty by Sex and Age in Palestine
According to the poverty statistics in Palestine, males aged 45 to 54 years and females aged 16 and 17 years are the age groups that are most secure financially, with 94.3% of males and 100.0% of females in these age groups living above the poverty line.
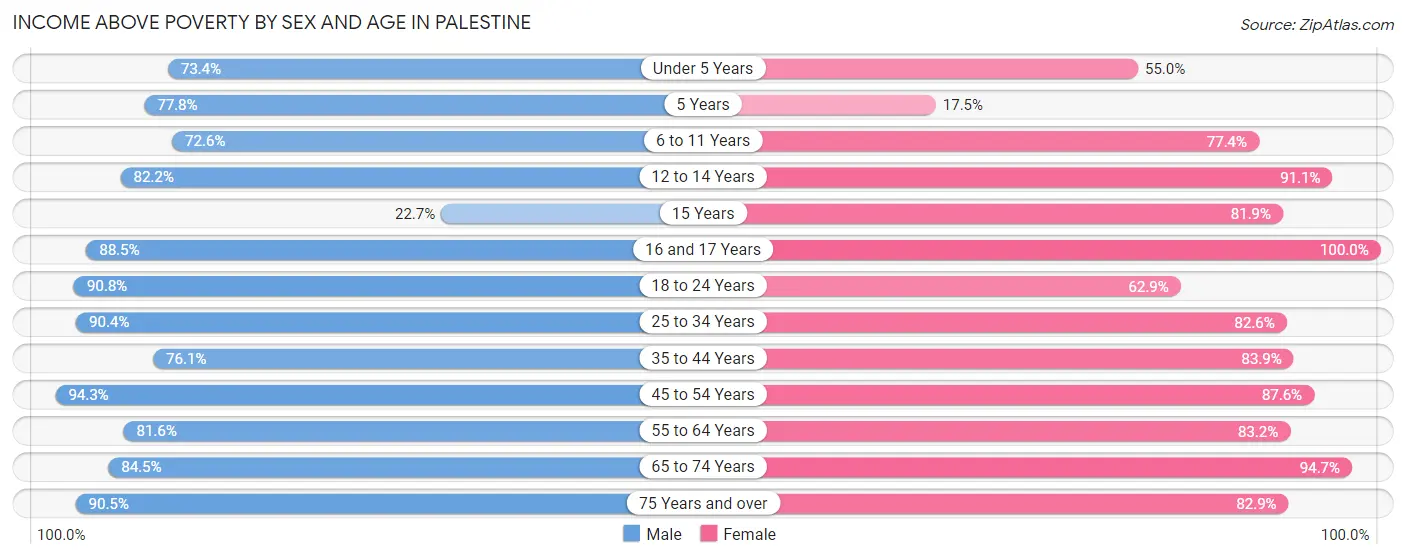
| Age Bracket | Male | Female |
| Under 5 Years | 605 (73.4%) | 380 (55.0%) |
| 5 Years | 49 (77.8%) | 11 (17.5%) |
| 6 to 11 Years | 520 (72.6%) | 747 (77.4%) |
| 12 to 14 Years | 406 (82.2%) | 224 (91.1%) |
| 15 Years | 32 (22.7%) | 167 (81.9%) |
| 16 and 17 Years | 286 (88.5%) | 259 (100.0%) |
| 18 to 24 Years | 813 (90.8%) | 503 (62.9%) |
| 25 to 34 Years | 1,436 (90.4%) | 1,273 (82.6%) |
| 35 to 44 Years | 1,116 (76.1%) | 951 (83.9%) |
| 45 to 54 Years | 1,151 (94.3%) | 978 (87.6%) |
| 55 to 64 Years | 342 (81.6%) | 644 (83.2%) |
| 65 to 74 Years | 413 (84.5%) | 888 (94.7%) |
| 75 Years and over | 306 (90.5%) | 543 (82.9%) |
| Total | 7,475 (83.3%) | 7,568 (80.6%) |
Income Below Poverty Among Married-Couple Families in Palestine
The poverty statistics for married-couple families in Palestine show that 8.4% or 263 of the total 3,134 families live below the poverty line. Families with 3 or 4 children have the highest poverty rate of 50.7%, comprising of 221 families. On the other hand, families with 1 or 2 children have the lowest poverty rate of 0.0%, which includes 0 families.
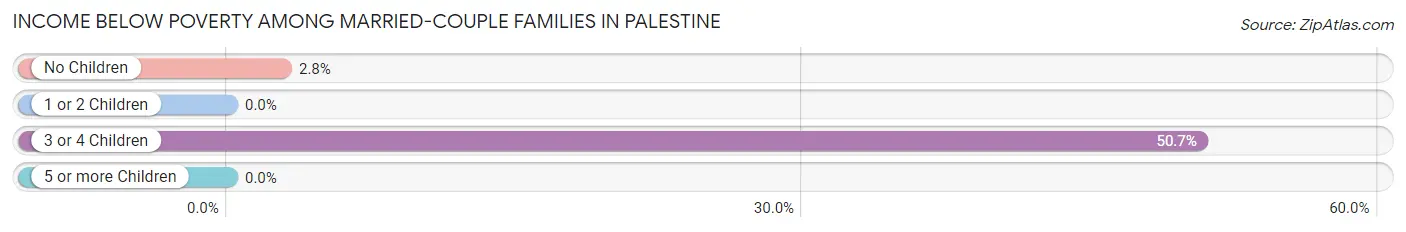
| Children | Above Poverty | Below Poverty |
| No Children | 1,447 (97.2%) | 42 (2.8%) |
| 1 or 2 Children | 1,206 (100.0%) | 0 (0.0%) |
| 3 or 4 Children | 215 (49.3%) | 221 (50.7%) |
| 5 or more Children | 3 (100.0%) | 0 (0.0%) |
| Total | 2,871 (91.6%) | 263 (8.4%) |
Income Below Poverty Among Single-Parent Households in Palestine
According to the poverty data in Palestine, 7.3% or 12 single-father households and 27.1% or 435 single-mother households are living below the poverty line. Among single-father households, those with 1 or 2 children have the highest poverty rate, with 12 households (11.8%) experiencing poverty. Likewise, among single-mother households, those with 5 or more children have the highest poverty rate, with 8 households (100.0%) falling below the poverty line.
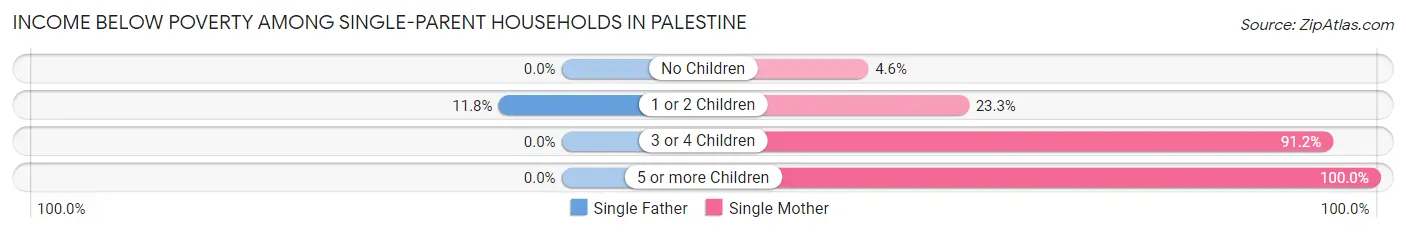
| Children | Single Father | Single Mother |
| No Children | 0 (0.0%) | 24 (4.6%) |
| 1 or 2 Children | 12 (11.8%) | 197 (23.3%) |
| 3 or 4 Children | 0 (0.0%) | 206 (91.1%) |
| 5 or more Children | 0 (0.0%) | 8 (100.0%) |
| Total | 12 (7.3%) | 435 (27.1%) |
Income Below Poverty Among Married-Couple vs Single-Parent Households in Palestine
The poverty data for Palestine shows that 263 of the married-couple family households (8.4%) and 447 of the single-parent households (25.3%) are living below the poverty level. Within the married-couple family households, those with 3 or 4 children have the highest poverty rate, with 221 households (50.7%) falling below the poverty line. Among the single-parent households, those with 5 or more children have the highest poverty rate, with 8 household (100.0%) living below poverty.
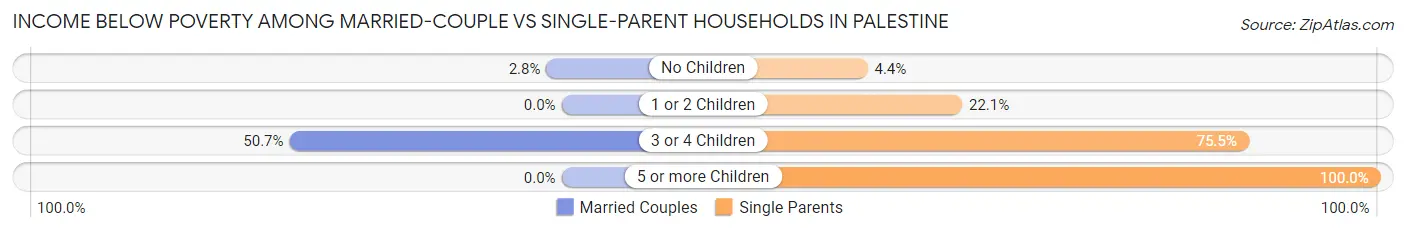
| Children | Married-Couple Families | Single-Parent Households |
| No Children | 42 (2.8%) | 24 (4.4%) |
| 1 or 2 Children | 0 (0.0%) | 209 (22.1%) |
| 3 or 4 Children | 221 (50.7%) | 206 (75.5%) |
| 5 or more Children | 0 (0.0%) | 8 (100.0%) |
| Total | 263 (8.4%) | 447 (25.3%) |
Race in Palestine
The most populous races in Palestine are White / Caucasian (10,457 | 55.8%), Black / African American (5,247 | 28.0%), and Hispanic or Latino (4,321 | 23.1%).
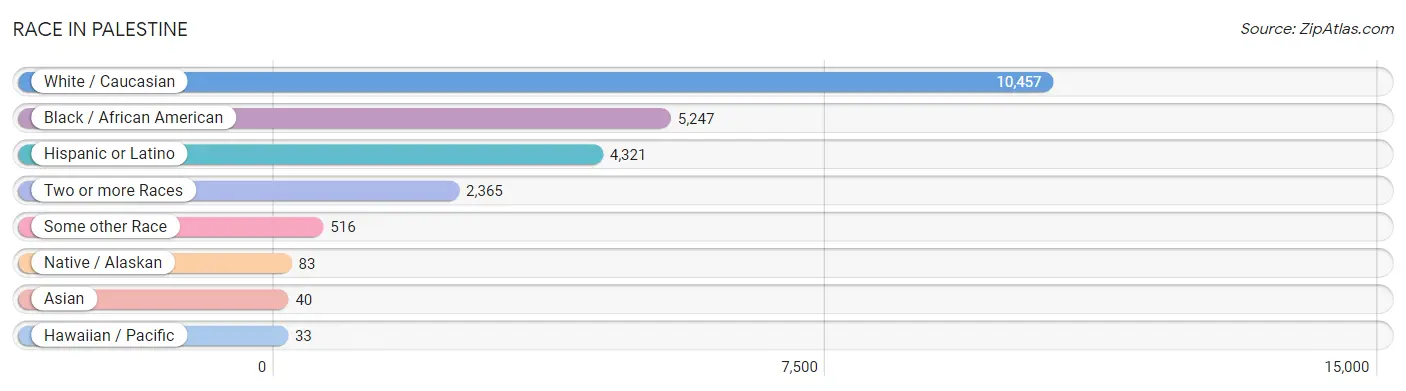
| Race | # Population | % Population |
| Asian | 40 | 0.2% |
| Black / African American | 5,247 | 28.0% |
| Hawaiian / Pacific | 33 | 0.2% |
| Hispanic or Latino | 4,321 | 23.1% |
| Native / Alaskan | 83 | 0.4% |
| White / Caucasian | 10,457 | 55.8% |
| Two or more Races | 2,365 | 12.6% |
| Some other Race | 516 | 2.8% |
| Total | 18,741 | 100.0% |
Ancestry in Palestine
The most populous ancestries reported in Palestine are Mexican (3,327 | 17.7%), Irish (1,665 | 8.9%), German (1,647 | 8.8%), American (1,474 | 7.9%), and English (1,298 | 6.9%), together accounting for 50.2% of all Palestine residents.
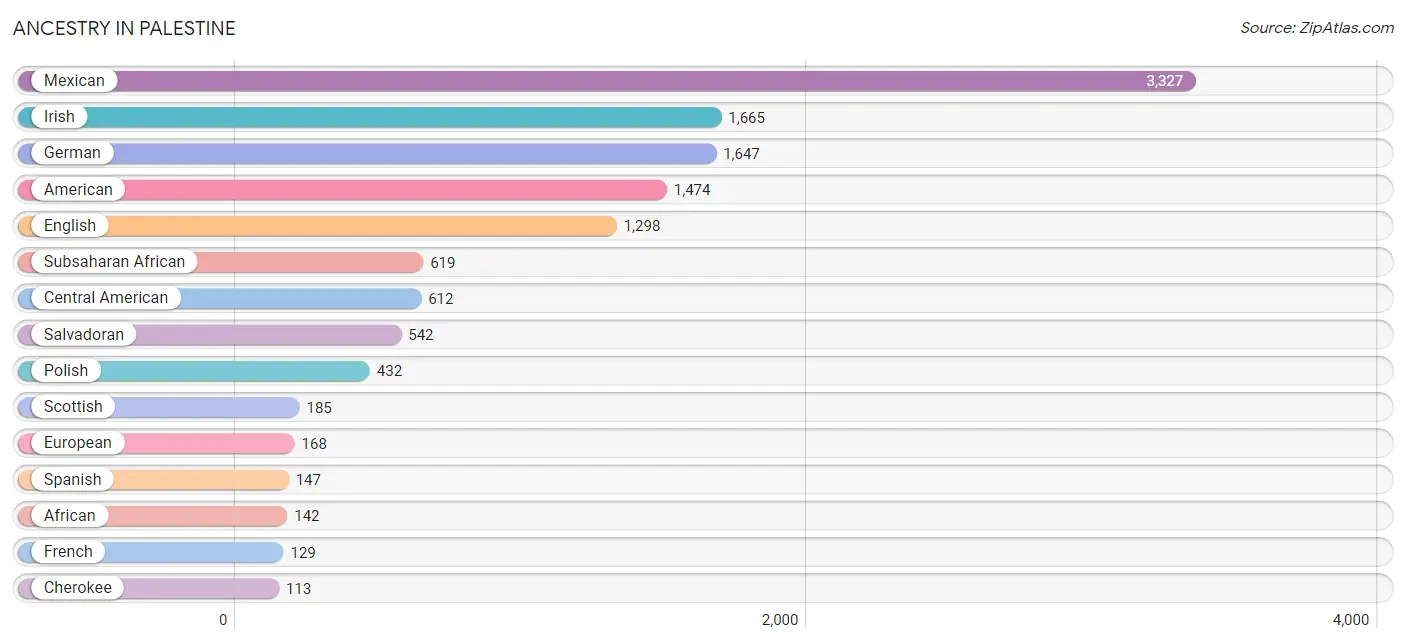
| Ancestry | # Population | % Population |
| African | 142 | 0.8% |
| American | 1,474 | 7.9% |
| Belgian | 33 | 0.2% |
| British | 109 | 0.6% |
| Central American | 612 | 3.3% |
| Central American Indian | 39 | 0.2% |
| Cherokee | 113 | 0.6% |
| Chickasaw | 31 | 0.2% |
| Choctaw | 5 | 0.0% |
| Colombian | 12 | 0.1% |
| Croatian | 12 | 0.1% |
| Czech | 16 | 0.1% |
| Dutch | 50 | 0.3% |
| Eastern European | 7 | 0.0% |
| English | 1,298 | 6.9% |
| European | 168 | 0.9% |
| French | 129 | 0.7% |
| German | 1,647 | 8.8% |
| Ghanaian | 25 | 0.1% |
| Greek | 76 | 0.4% |
| Guatemalan | 70 | 0.4% |
| Guyanese | 7 | 0.0% |
| Irish | 1,665 | 8.9% |
| Italian | 60 | 0.3% |
| Korean | 20 | 0.1% |
| Laotian | 40 | 0.2% |
| Mexican | 3,327 | 17.7% |
| Mexican American Indian | 39 | 0.2% |
| Native Hawaiian | 33 | 0.2% |
| Nigerian | 111 | 0.6% |
| Norwegian | 66 | 0.4% |
| Polish | 432 | 2.3% |
| Portuguese | 73 | 0.4% |
| Russian | 11 | 0.1% |
| Salvadoran | 542 | 2.9% |
| Scotch-Irish | 77 | 0.4% |
| Scottish | 185 | 1.0% |
| Sioux | 12 | 0.1% |
| South American | 12 | 0.1% |
| Spaniard | 33 | 0.2% |
| Spanish | 147 | 0.8% |
| Spanish American | 19 | 0.1% |
| Subsaharan African | 619 | 3.3% |
| Swedish | 21 | 0.1% |
| Swiss | 16 | 0.1% |
| Welsh | 109 | 0.6% | View All 46 Rows |
Immigrants in Palestine
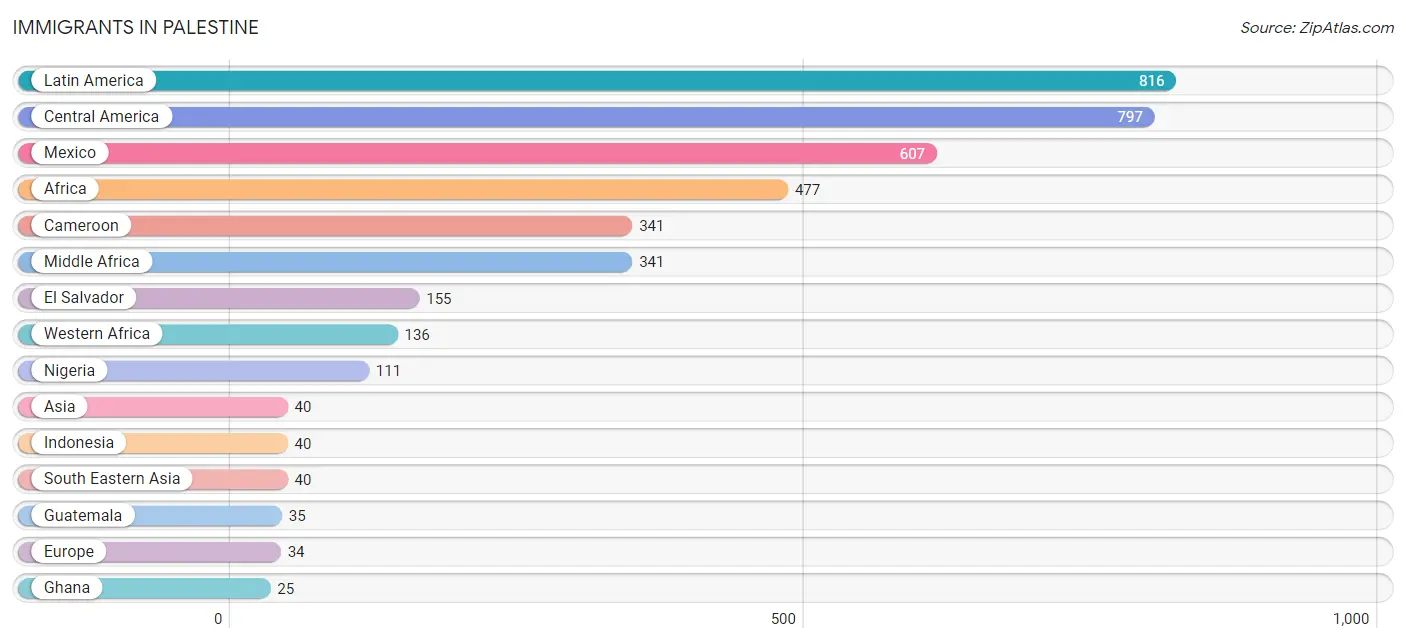
The most numerous immigrant groups reported in Palestine came from Latin America (816 | 4.3%), Central America (797 | 4.3%), Mexico (607 | 3.2%), Africa (477 | 2.5%), and Cameroon (341 | 1.8%), together accounting for 16.2% of all Palestine residents.
| Immigration Origin | # Population | % Population |
| Africa | 477 | 2.5% |
| Asia | 40 | 0.2% |
| Cameroon | 341 | 1.8% |
| Central America | 797 | 4.3% |
| Colombia | 12 | 0.1% |
| Eastern Europe | 16 | 0.1% |
| El Salvador | 155 | 0.8% |
| England | 12 | 0.1% |
| Europe | 34 | 0.2% |
| Ghana | 25 | 0.1% |
| Guatemala | 35 | 0.2% |
| Guyana | 7 | 0.0% |
| Indonesia | 40 | 0.2% |
| Latin America | 816 | 4.3% |
| Mexico | 607 | 3.2% |
| Middle Africa | 341 | 1.8% |
| Netherlands | 6 | 0.0% |
| Nigeria | 111 | 0.6% |
| Northern Europe | 12 | 0.1% |
| Poland | 5 | 0.0% |
| Russia | 11 | 0.1% |
| South America | 19 | 0.1% |
| South Eastern Asia | 40 | 0.2% |
| Western Africa | 136 | 0.7% |
| Western Europe | 6 | 0.0% | View All 25 Rows |
Sex and Age in Palestine
Sex and Age in Palestine
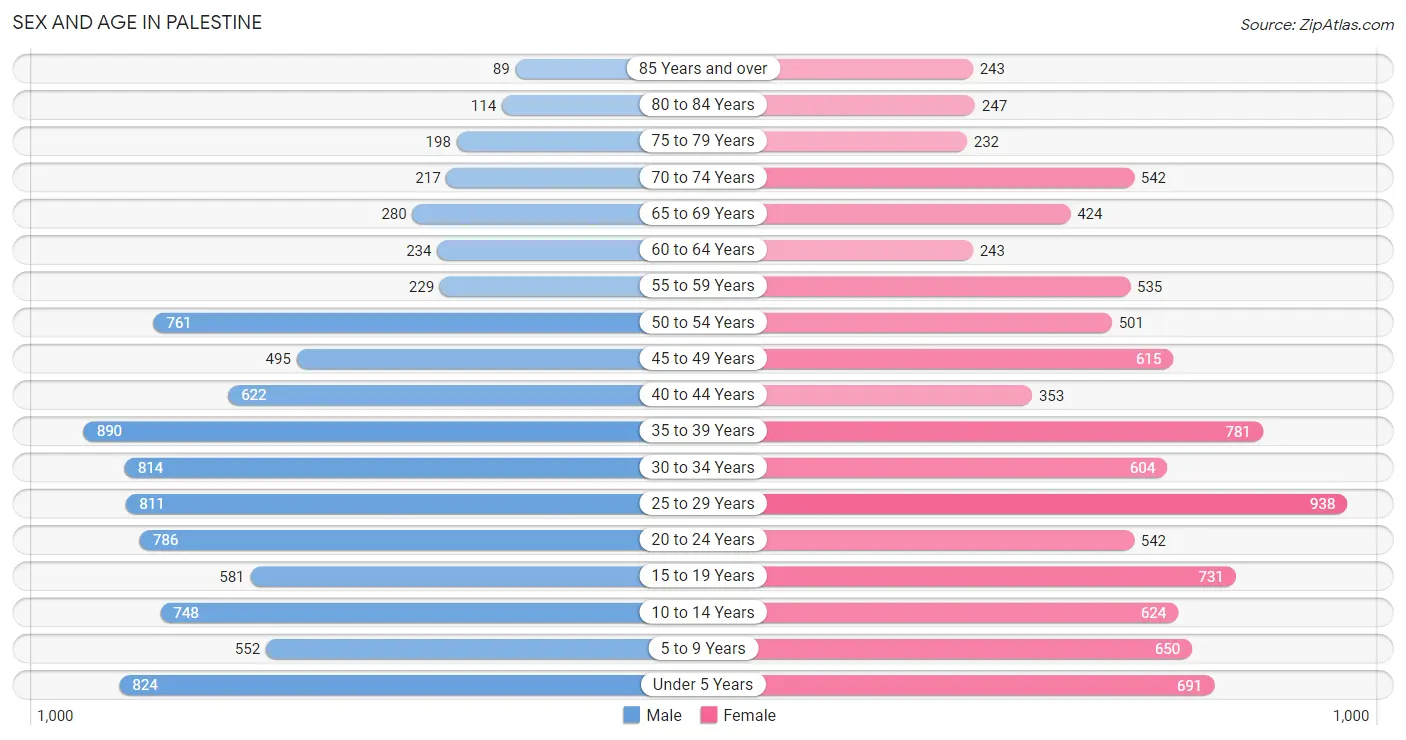
The most populous age groups in Palestine are 35 to 39 Years (890 | 9.6%) for men and 25 to 29 Years (938 | 9.9%) for women.
| Age Bracket | Male | Female |
| Under 5 Years | 824 (8.9%) | 691 (7.3%) |
| 5 to 9 Years | 552 (6.0%) | 650 (6.8%) |
| 10 to 14 Years | 748 (8.1%) | 624 (6.6%) |
| 15 to 19 Years | 581 (6.3%) | 731 (7.7%) |
| 20 to 24 Years | 786 (8.5%) | 542 (5.7%) |
| 25 to 29 Years | 811 (8.8%) | 938 (9.9%) |
| 30 to 34 Years | 814 (8.8%) | 604 (6.4%) |
| 35 to 39 Years | 890 (9.6%) | 781 (8.2%) |
| 40 to 44 Years | 622 (6.7%) | 353 (3.7%) |
| 45 to 49 Years | 495 (5.3%) | 615 (6.5%) |
| 50 to 54 Years | 761 (8.2%) | 501 (5.3%) |
| 55 to 59 Years | 229 (2.5%) | 535 (5.6%) |
| 60 to 64 Years | 234 (2.5%) | 243 (2.6%) |
| 65 to 69 Years | 280 (3.0%) | 424 (4.5%) |
| 70 to 74 Years | 217 (2.4%) | 542 (5.7%) |
| 75 to 79 Years | 198 (2.1%) | 232 (2.4%) |
| 80 to 84 Years | 114 (1.2%) | 247 (2.6%) |
| 85 Years and over | 89 (1.0%) | 243 (2.6%) |
| Total | 9,245 (100.0%) | 9,496 (100.0%) |
Families and Households in Palestine
Median Family Size in Palestine
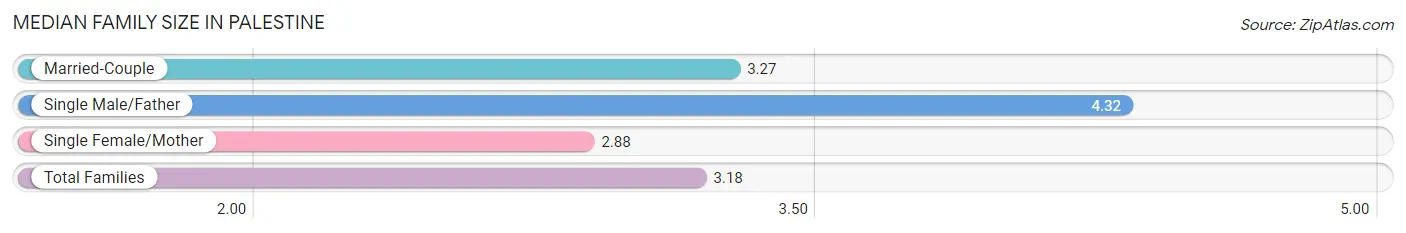
The median family size in Palestine is 3.18 persons per family, with single male/father families (165 | 3.4%) accounting for the largest median family size of 4.32 persons per family. On the other hand, single female/mother families (1,605 | 32.7%) represent the smallest median family size with 2.88 persons per family.
| Family Type | # Families | Family Size |
| Married-Couple | 3,134 (63.9%) | 3.27 |
| Single Male/Father | 165 (3.4%) | 4.32 |
| Single Female/Mother | 1,605 (32.7%) | 2.88 |
| Total Families | 4,904 (100.0%) | 3.18 |
Median Household Size in Palestine
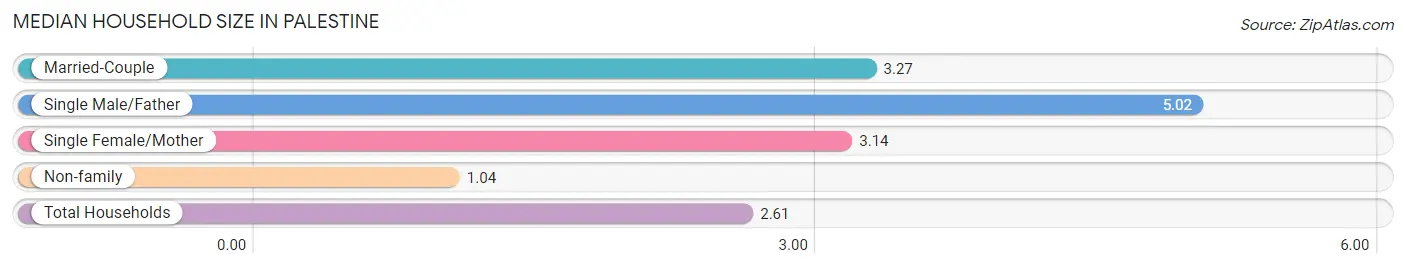
The median household size in Palestine is 2.61 persons per household, with single male/father households (165 | 2.4%) accounting for the largest median household size of 5.02 persons per household. non-family households (2,124 | 30.2%) represent the smallest median household size with 1.04 persons per household.
| Household Type | # Households | Household Size |
| Married-Couple | 3,134 (44.6%) | 3.27 |
| Single Male/Father | 165 (2.4%) | 5.02 |
| Single Female/Mother | 1,605 (22.8%) | 3.14 |
| Non-family | 2,124 (30.2%) | 1.04 |
| Total Households | 7,028 (100.0%) | 2.61 |
Household Size by Marriage Status in Palestine
Out of a total of 7,028 households in Palestine, 4,904 (69.8%) are family households, while 2,124 (30.2%) are nonfamily households. The most numerous type of family households are 2-person households, comprising 1,723, and the most common type of nonfamily households are 1-person households, comprising 2,058.
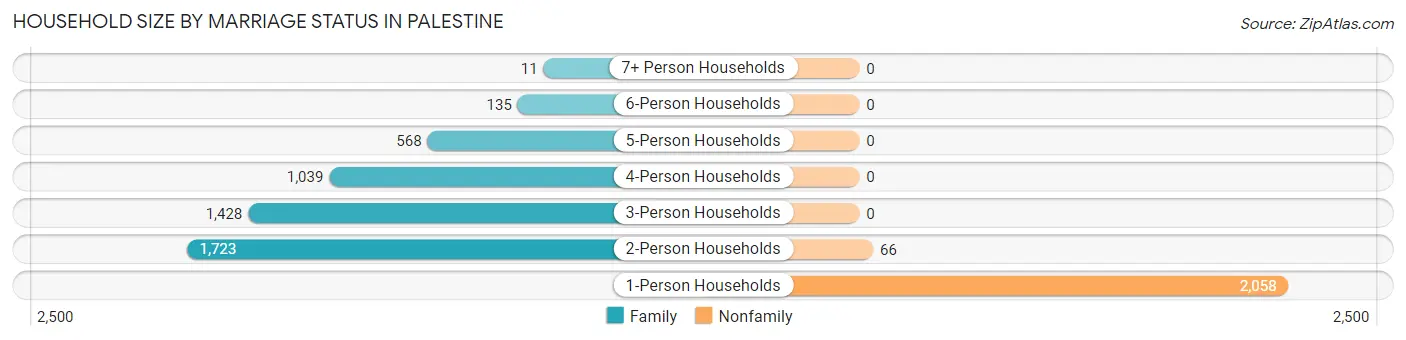
| Household Size | Family Households | Nonfamily Households |
| 1-Person Households | - | 2,058 (29.3%) |
| 2-Person Households | 1,723 (24.5%) | 66 (0.9%) |
| 3-Person Households | 1,428 (20.3%) | 0 (0.0%) |
| 4-Person Households | 1,039 (14.8%) | 0 (0.0%) |
| 5-Person Households | 568 (8.1%) | 0 (0.0%) |
| 6-Person Households | 135 (1.9%) | 0 (0.0%) |
| 7+ Person Households | 11 (0.2%) | 0 (0.0%) |
| Total | 4,904 (69.8%) | 2,124 (30.2%) |
Female Fertility in Palestine
Fertility by Age in Palestine
Average fertility rate in Palestine is 60.0 births per 1,000 women. Women in the age bracket of 20 to 34 years have the highest fertility rate with 113.0 births per 1,000 women. Women in the age bracket of 20 to 34 years acount for 85.2% of all women with births.
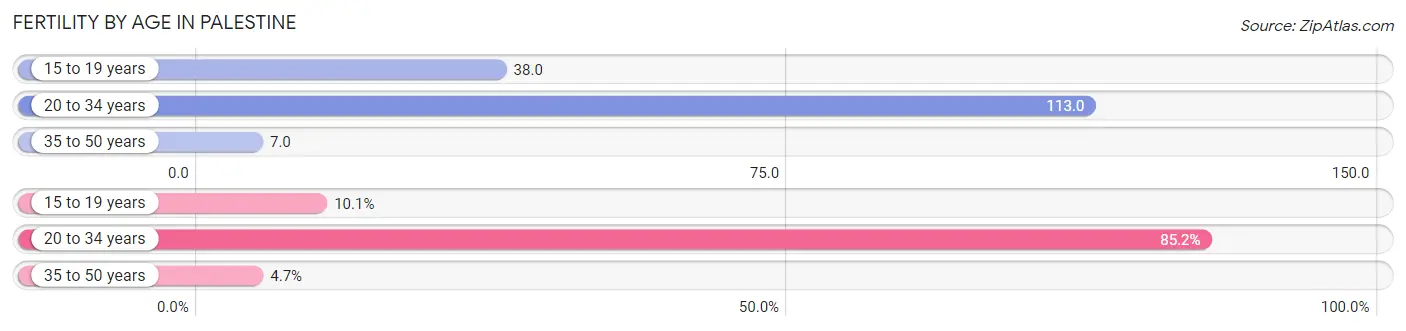
| Age Bracket | Women with Births | Births / 1,000 Women |
| 15 to 19 years | 28 (10.1%) | 38.0 |
| 20 to 34 years | 236 (85.2%) | 113.0 |
| 35 to 50 years | 13 (4.7%) | 7.0 |
| Total | 277 (100.0%) | 60.0 |
Fertility by Age by Marriage Status in Palestine
75.8% of women with births (277) in Palestine are married. The highest percentage of unmarried women with births falls into 15 to 19 years age bracket with 100.0% of them unmarried at the time of birth, while the lowest percentage of unmarried women with births belong to 35 to 50 years age bracket with 0.0% of them unmarried.
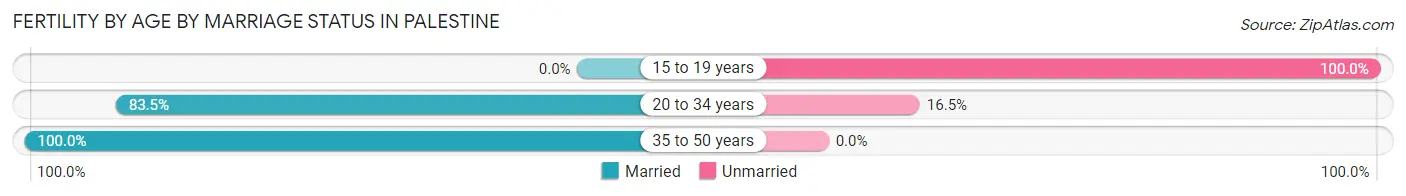
| Age Bracket | Married | Unmarried |
| 15 to 19 years | 0 (0.0%) | 28 (100.0%) |
| 20 to 34 years | 197 (83.5%) | 39 (16.5%) |
| 35 to 50 years | 13 (100.0%) | 0 (0.0%) |
| Total | 210 (75.8%) | 67 (24.2%) |
Fertility by Education in Palestine
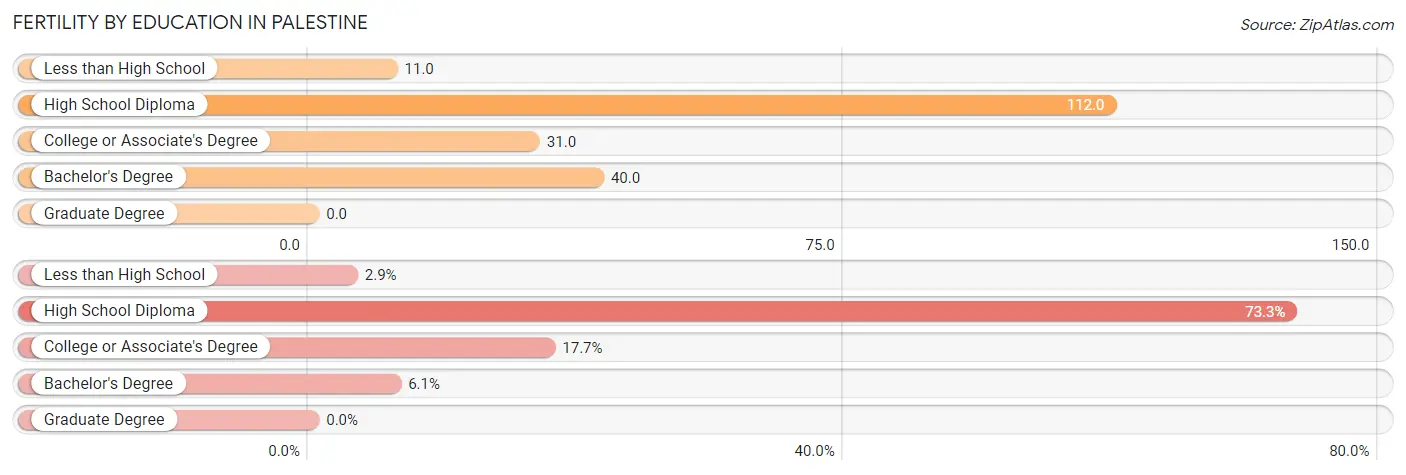
| Educational Attainment | Women with Births | Births / 1,000 Women |
| Less than High School | 8 (2.9%) | 11.0 |
| High School Diploma | 203 (73.3%) | 112.0 |
| College or Associate's Degree | 49 (17.7%) | 31.0 |
| Bachelor's Degree | 17 (6.1%) | 40.0 |
| Graduate Degree | 0 (0.0%) | 0.0 |
| Total | 277 (100.0%) | 60.0 |
Fertility by Education by Marriage Status in Palestine
24.2% of women with births in Palestine are unmarried. Women with the educational attainment of bachelor's degree are most likely to be married with 100.0% of them married at childbirth, while women with the educational attainment of less than high school are least likely to be married with 100.0% of them unmarried at childbirth.
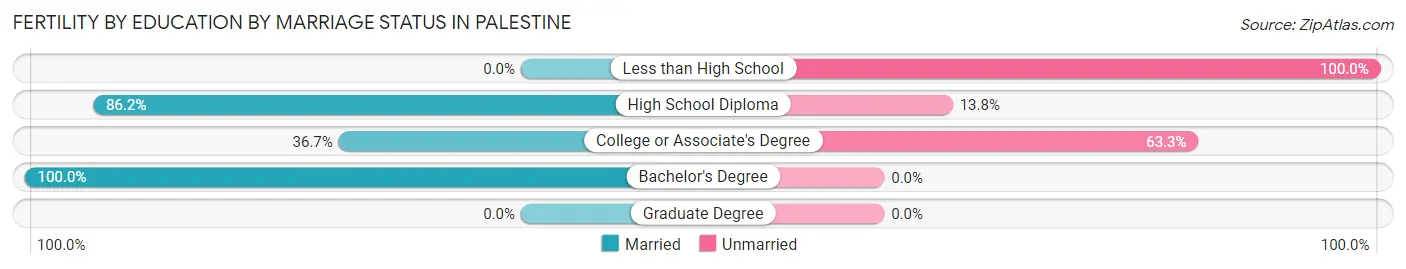
| Educational Attainment | Married | Unmarried |
| Less than High School | 0 (0.0%) | 8 (100.0%) |
| High School Diploma | 175 (86.2%) | 28 (13.8%) |
| College or Associate's Degree | 18 (36.7%) | 31 (63.3%) |
| Bachelor's Degree | 17 (100.0%) | 0 (0.0%) |
| Graduate Degree | 0 (0.0%) | 0 (0.0%) |
| Total | 210 (75.8%) | 67 (24.2%) |
Employment Characteristics in Palestine
Employment by Class of Employer in Palestine
Among the 8,448 employed individuals in Palestine, private company employees (4,917 | 58.2%), state government employees (1,483 | 17.5%), and local government employees (1,056 | 12.5%) make up the most common classes of employment.
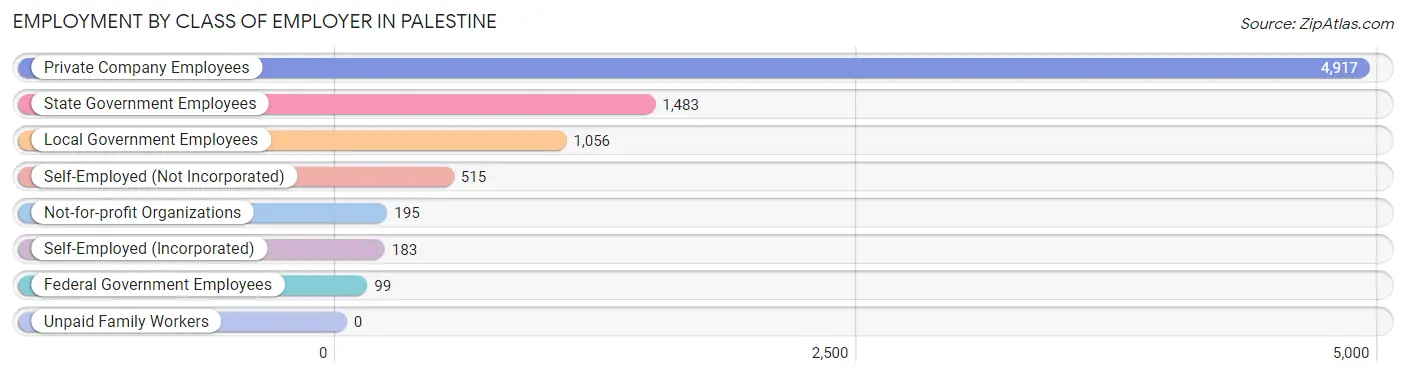
| Employer Class | # Employees | % Employees |
| Private Company Employees | 4,917 | 58.2% |
| Self-Employed (Incorporated) | 183 | 2.2% |
| Self-Employed (Not Incorporated) | 515 | 6.1% |
| Not-for-profit Organizations | 195 | 2.3% |
| Local Government Employees | 1,056 | 12.5% |
| State Government Employees | 1,483 | 17.5% |
| Federal Government Employees | 99 | 1.2% |
| Unpaid Family Workers | 0 | 0.0% |
| Total | 8,448 | 100.0% |
Employment Status by Age in Palestine
According to the labor force statistics for Palestine, out of the total population over 16 years of age (14,307), 62.1% or 8,885 individuals are in the labor force, with 4.0% or 355 of them unemployed. The age group with the highest labor force participation rate is 30 to 34 years, with 89.0% or 1,262 individuals in the labor force. Within the labor force, the 20 to 24 years age range has the highest percentage of unemployed individuals, with 8.4% or 89 of them being unemployed.
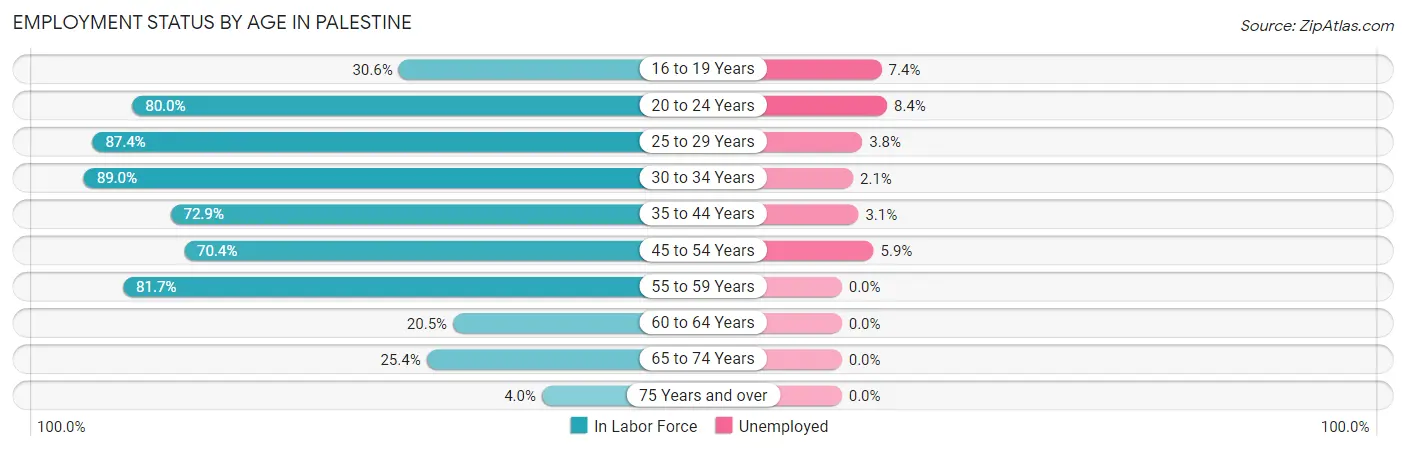
| Age Bracket | In Labor Force | Unemployed |
| 16 to 19 Years | 296 (30.6%) | 22 (7.4%) |
| 20 to 24 Years | 1,062 (80.0%) | 89 (8.4%) |
| 25 to 29 Years | 1,529 (87.4%) | 58 (3.8%) |
| 30 to 34 Years | 1,262 (89.0%) | 27 (2.1%) |
| 35 to 44 Years | 1,929 (72.9%) | 60 (3.1%) |
| 45 to 54 Years | 1,670 (70.4%) | 99 (5.9%) |
| 55 to 59 Years | 624 (81.7%) | 0 (0.0%) |
| 60 to 64 Years | 98 (20.5%) | 0 (0.0%) |
| 65 to 74 Years | 372 (25.4%) | 0 (0.0%) |
| 75 Years and over | 45 (4.0%) | 0 (0.0%) |
| Total | 8,885 (62.1%) | 355 (4.0%) |
Employment Status by Educational Attainment in Palestine
According to labor force statistics for Palestine, 75.4% of individuals (7,107) out of the total population between 25 and 64 years of age (9,426) are in the labor force, with 3.4% or 242 of them being unemployed. The group with the highest labor force participation rate are those with the educational attainment of bachelor's degree or higher, with 90.4% or 1,173 individuals in the labor force. Within the labor force, individuals with college / associate degree education have the highest percentage of unemployment, with 4.5% or 103 of them being unemployed.
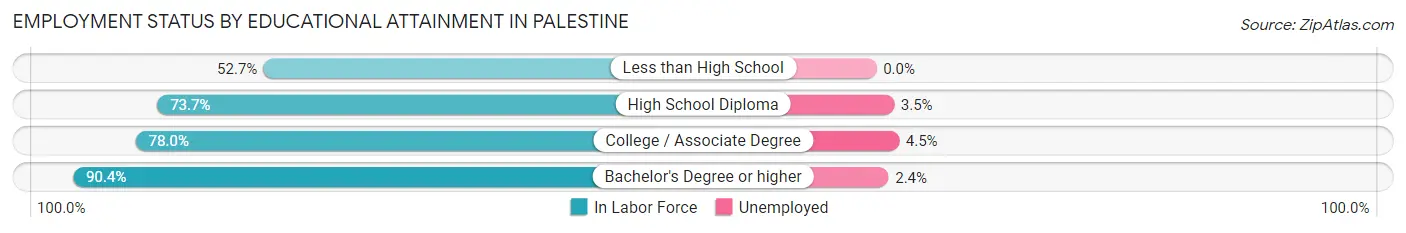
| Educational Attainment | In Labor Force | Unemployed |
| Less than High School | 455 (52.7%) | 0 (0.0%) |
| High School Diploma | 3,189 (73.7%) | 151 (3.5%) |
| College / Associate Degree | 2,291 (78.0%) | 132 (4.5%) |
| Bachelor's Degree or higher | 1,173 (90.4%) | 31 (2.4%) |
| Total | 7,107 (75.4%) | 320 (3.4%) |
Employment Occupations by Sex in Palestine
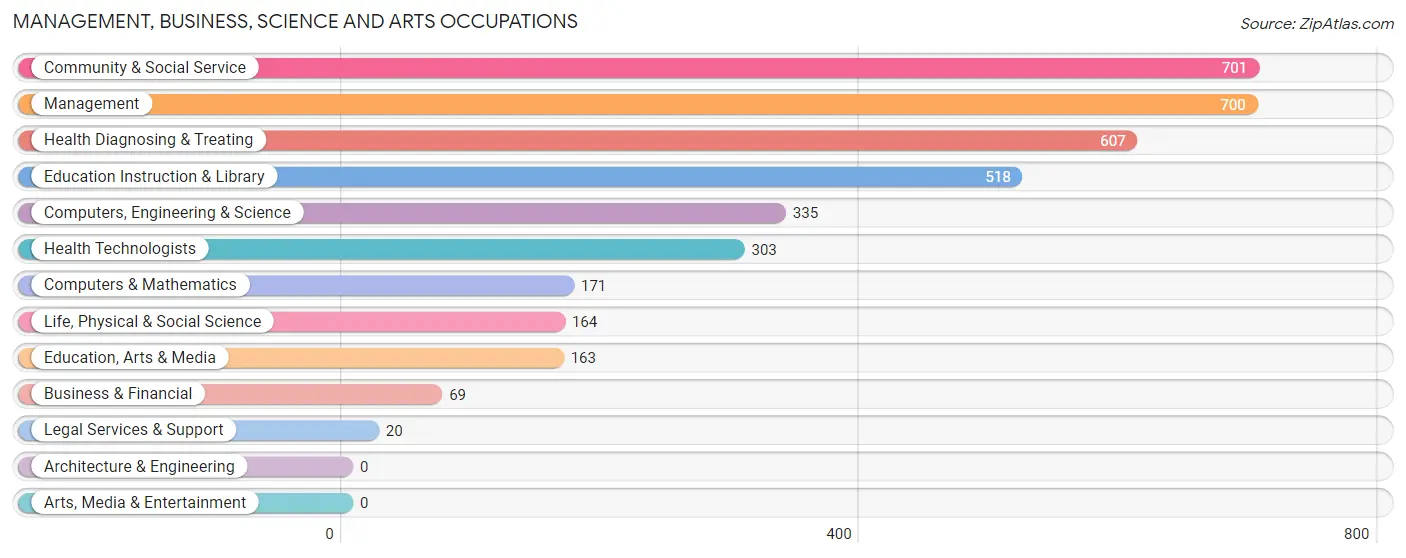
Management, Business, Science and Arts Occupations
The most common Management, Business, Science and Arts occupations in Palestine are Community & Social Service (701 | 8.2%), Management (700 | 8.2%), Health Diagnosing & Treating (607 | 7.1%), Education Instruction & Library (518 | 6.1%), and Computers, Engineering & Science (335 | 3.9%).
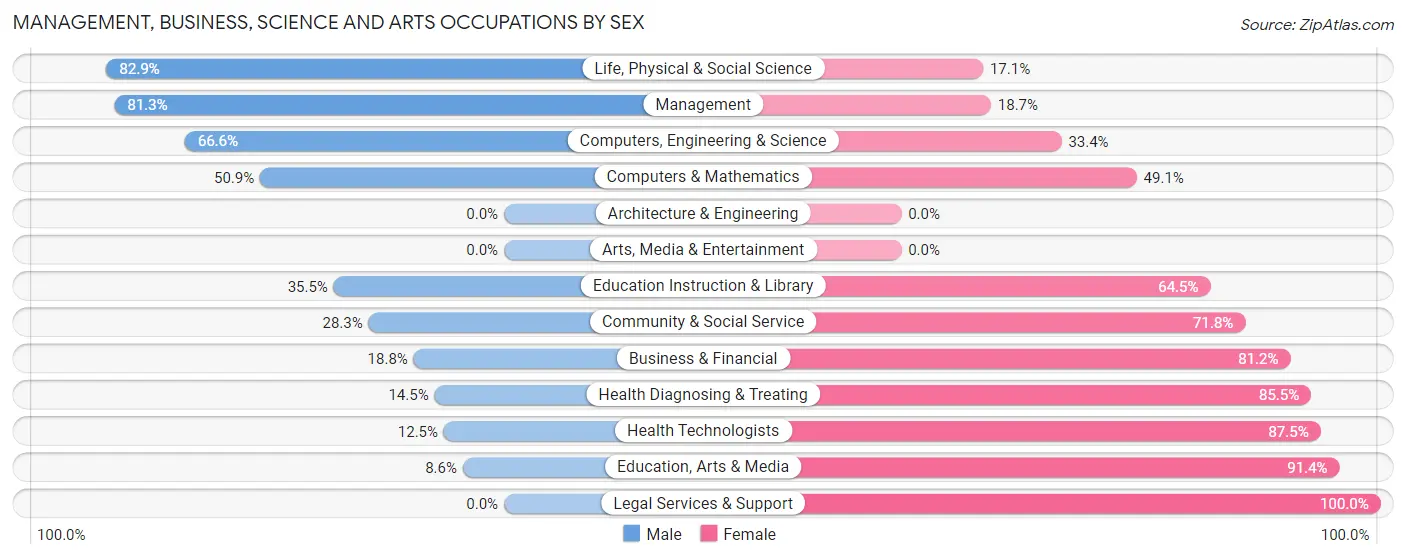
Management, Business, Science and Arts Occupations by Sex
Within the Management, Business, Science and Arts occupations in Palestine, the most male-oriented occupations are Life, Physical & Social Science (82.9%), Management (81.3%), and Computers, Engineering & Science (66.6%), while the most female-oriented occupations are Legal Services & Support (100.0%), Education, Arts & Media (91.4%), and Health Technologists (87.5%).
| Occupation | Male | Female |
| Management | 569 (81.3%) | 131 (18.7%) |
| Business & Financial | 13 (18.8%) | 56 (81.2%) |
| Computers, Engineering & Science | 223 (66.6%) | 112 (33.4%) |
| Computers & Mathematics | 87 (50.9%) | 84 (49.1%) |
| Architecture & Engineering | 0 (0.0%) | 0 (0.0%) |
| Life, Physical & Social Science | 136 (82.9%) | 28 (17.1%) |
| Community & Social Service | 198 (28.2%) | 503 (71.8%) |
| Education, Arts & Media | 14 (8.6%) | 149 (91.4%) |
| Legal Services & Support | 0 (0.0%) | 20 (100.0%) |
| Education Instruction & Library | 184 (35.5%) | 334 (64.5%) |
| Arts, Media & Entertainment | 0 (0.0%) | 0 (0.0%) |
| Health Diagnosing & Treating | 88 (14.5%) | 519 (85.5%) |
| Health Technologists | 38 (12.5%) | 265 (87.5%) |
| Total (Category) | 1,091 (45.2%) | 1,321 (54.8%) |
| Total (Overall) | 4,584 (53.7%) | 3,947 (46.3%) |
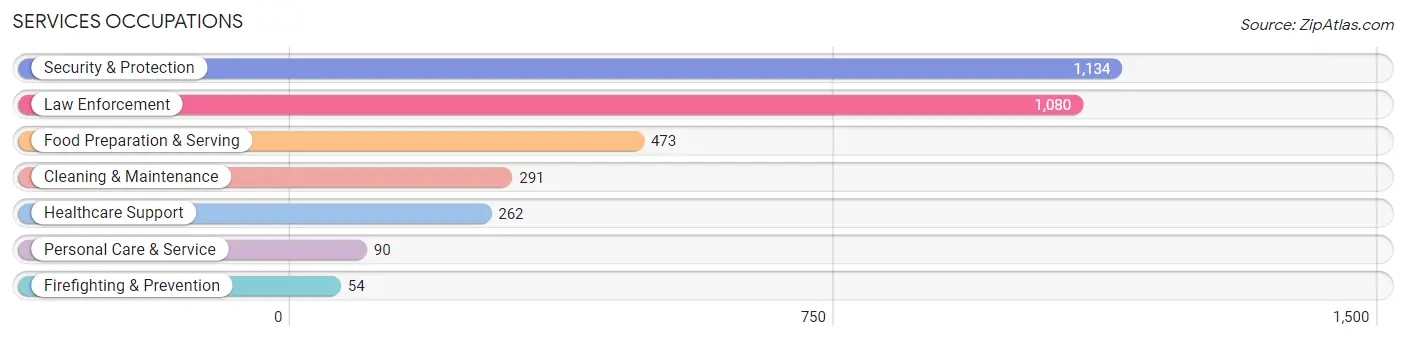
Services Occupations
The most common Services occupations in Palestine are Security & Protection (1,134 | 13.3%), Law Enforcement (1,080 | 12.7%), Food Preparation & Serving (473 | 5.5%), Cleaning & Maintenance (291 | 3.4%), and Healthcare Support (262 | 3.1%).
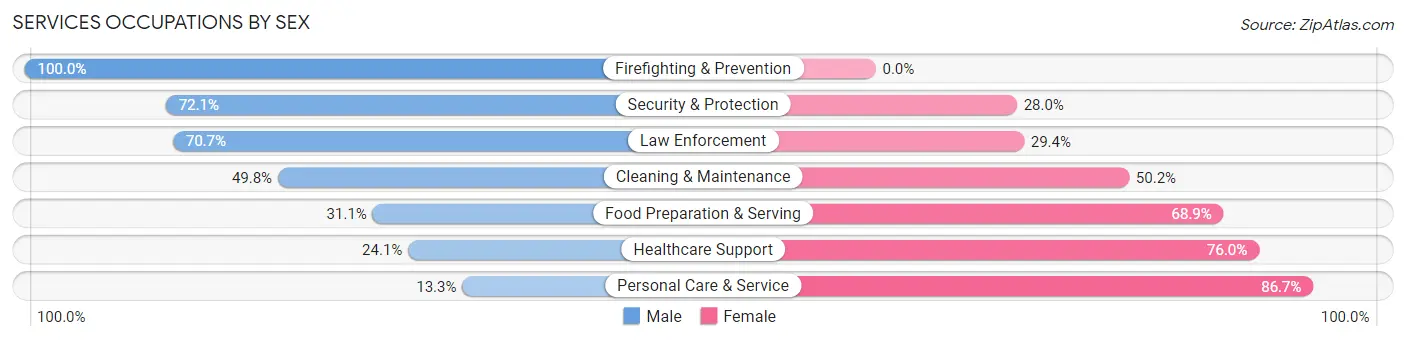
Services Occupations by Sex
Within the Services occupations in Palestine, the most male-oriented occupations are Firefighting & Prevention (100.0%), Security & Protection (72.1%), and Law Enforcement (70.7%), while the most female-oriented occupations are Personal Care & Service (86.7%), Healthcare Support (75.9%), and Food Preparation & Serving (68.9%).
| Occupation | Male | Female |
| Healthcare Support | 63 (24.0%) | 199 (75.9%) |
| Security & Protection | 817 (72.1%) | 317 (28.0%) |
| Firefighting & Prevention | 54 (100.0%) | 0 (0.0%) |
| Law Enforcement | 763 (70.7%) | 317 (29.3%) |
| Food Preparation & Serving | 147 (31.1%) | 326 (68.9%) |
| Cleaning & Maintenance | 145 (49.8%) | 146 (50.2%) |
| Personal Care & Service | 12 (13.3%) | 78 (86.7%) |
| Total (Category) | 1,184 (52.6%) | 1,066 (47.4%) |
| Total (Overall) | 4,584 (53.7%) | 3,947 (46.3%) |
Sales and Office Occupations
The most common Sales and Office occupations in Palestine are Office & Administration (1,015 | 11.9%), and Sales & Related (448 | 5.2%).

Sales and Office Occupations by Sex

| Occupation | Male | Female |
| Sales & Related | 195 (43.5%) | 253 (56.5%) |
| Office & Administration | 51 (5.0%) | 964 (95.0%) |
| Total (Category) | 246 (16.8%) | 1,217 (83.2%) |
| Total (Overall) | 4,584 (53.7%) | 3,947 (46.3%) |
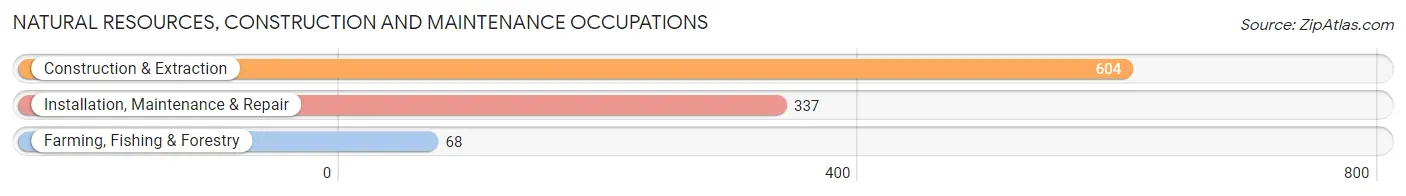
Natural Resources, Construction and Maintenance Occupations
The most common Natural Resources, Construction and Maintenance occupations in Palestine are Construction & Extraction (604 | 7.1%), Installation, Maintenance & Repair (337 | 4.0%), and Farming, Fishing & Forestry (68 | 0.8%).
Natural Resources, Construction and Maintenance Occupations by Sex
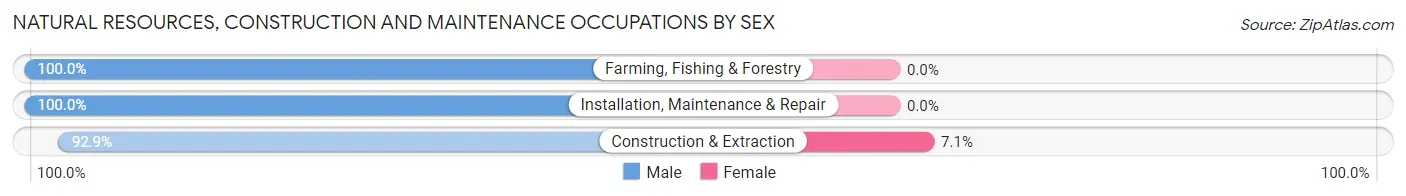
| Occupation | Male | Female |
| Farming, Fishing & Forestry | 68 (100.0%) | 0 (0.0%) |
| Construction & Extraction | 561 (92.9%) | 43 (7.1%) |
| Installation, Maintenance & Repair | 337 (100.0%) | 0 (0.0%) |
| Total (Category) | 966 (95.7%) | 43 (4.3%) |
| Total (Overall) | 4,584 (53.7%) | 3,947 (46.3%) |
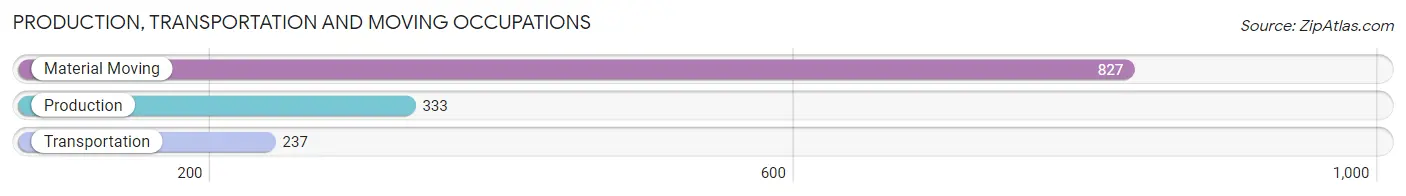
Production, Transportation and Moving Occupations
The most common Production, Transportation and Moving occupations in Palestine are Material Moving (827 | 9.7%), Production (333 | 3.9%), and Transportation (237 | 2.8%).
Production, Transportation and Moving Occupations by Sex
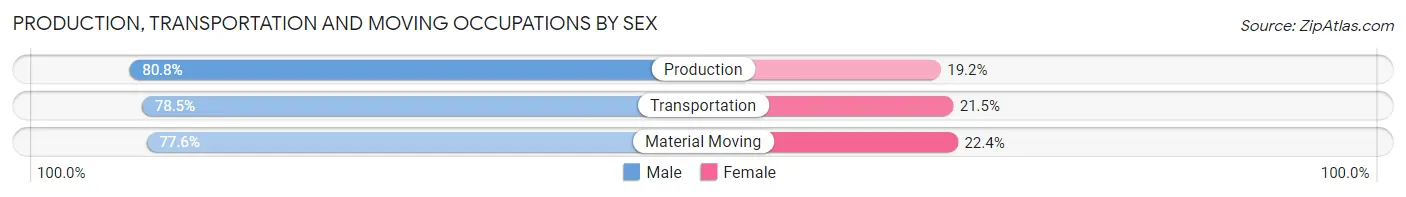
| Occupation | Male | Female |
| Production | 269 (80.8%) | 64 (19.2%) |
| Transportation | 186 (78.5%) | 51 (21.5%) |
| Material Moving | 642 (77.6%) | 185 (22.4%) |
| Total (Category) | 1,097 (78.5%) | 300 (21.5%) |
| Total (Overall) | 4,584 (53.7%) | 3,947 (46.3%) |
Employment Industries by Sex in Palestine
Employment Industries in Palestine
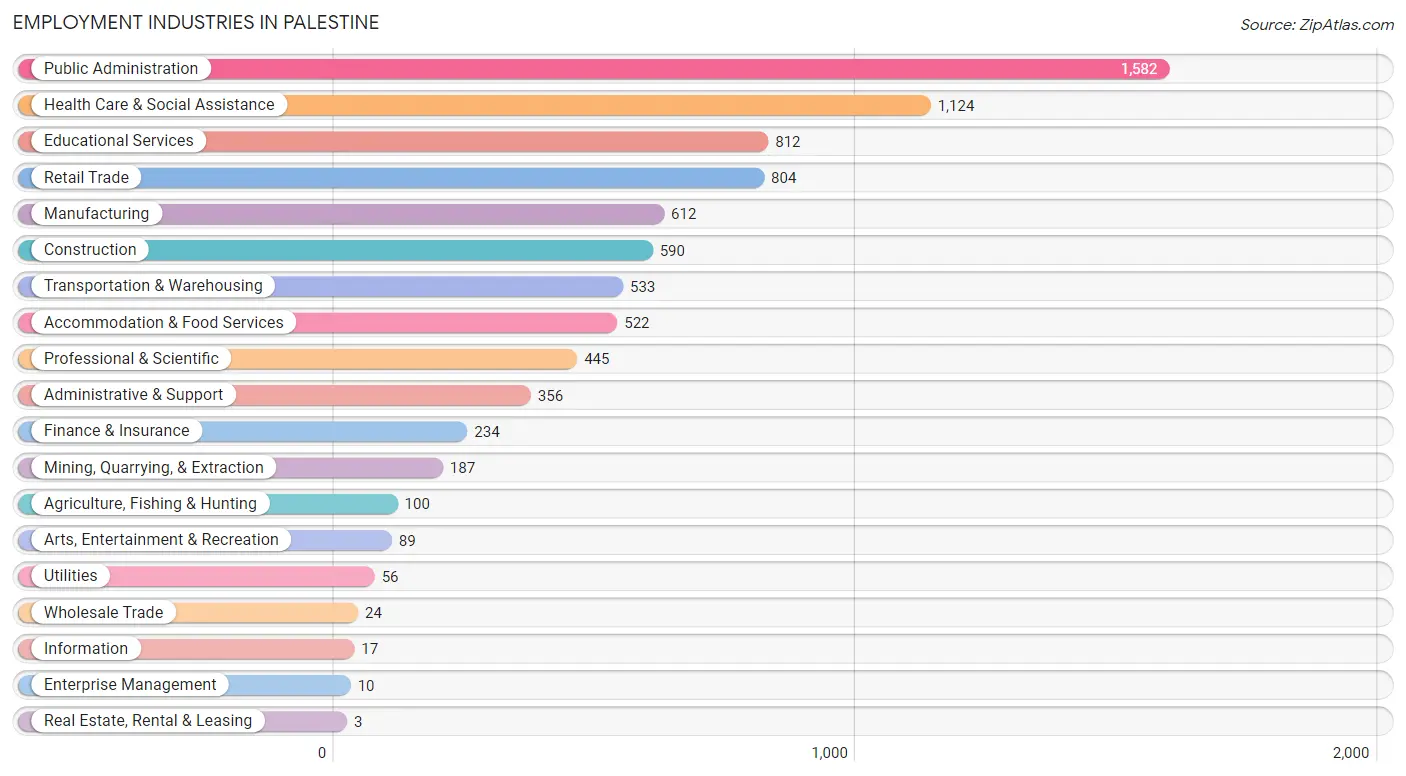
The major employment industries in Palestine include Public Administration (1,582 | 18.5%), Health Care & Social Assistance (1,124 | 13.2%), Educational Services (812 | 9.5%), Retail Trade (804 | 9.4%), and Manufacturing (612 | 7.2%).
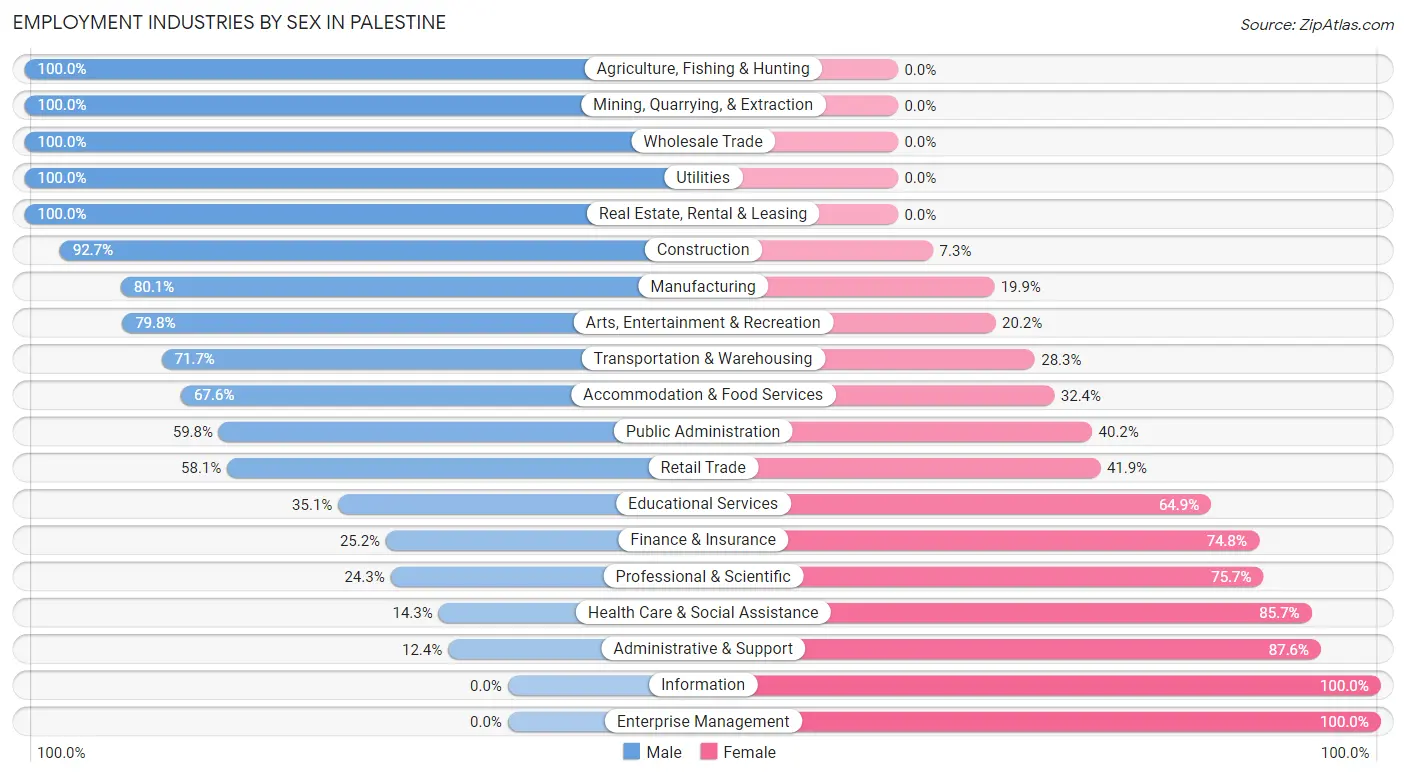
Employment Industries by Sex in Palestine
The Palestine industries that see more men than women are Agriculture, Fishing & Hunting (100.0%), Mining, Quarrying, & Extraction (100.0%), and Wholesale Trade (100.0%), whereas the industries that tend to have a higher number of women are Information (100.0%), Enterprise Management (100.0%), and Administrative & Support (87.6%).
| Industry | Male | Female |
| Agriculture, Fishing & Hunting | 100 (100.0%) | 0 (0.0%) |
| Mining, Quarrying, & Extraction | 187 (100.0%) | 0 (0.0%) |
| Construction | 547 (92.7%) | 43 (7.3%) |
| Manufacturing | 490 (80.1%) | 122 (19.9%) |
| Wholesale Trade | 24 (100.0%) | 0 (0.0%) |
| Retail Trade | 467 (58.1%) | 337 (41.9%) |
| Transportation & Warehousing | 382 (71.7%) | 151 (28.3%) |
| Utilities | 56 (100.0%) | 0 (0.0%) |
| Information | 0 (0.0%) | 17 (100.0%) |
| Finance & Insurance | 59 (25.2%) | 175 (74.8%) |
| Real Estate, Rental & Leasing | 3 (100.0%) | 0 (0.0%) |
| Professional & Scientific | 108 (24.3%) | 337 (75.7%) |
| Enterprise Management | 0 (0.0%) | 10 (100.0%) |
| Administrative & Support | 44 (12.4%) | 312 (87.6%) |
| Educational Services | 285 (35.1%) | 527 (64.9%) |
| Health Care & Social Assistance | 161 (14.3%) | 963 (85.7%) |
| Arts, Entertainment & Recreation | 71 (79.8%) | 18 (20.2%) |
| Accommodation & Food Services | 353 (67.6%) | 169 (32.4%) |
| Public Administration | 946 (59.8%) | 636 (40.2%) |
| Total | 4,584 (53.7%) | 3,947 (46.3%) |
Education in Palestine
School Enrollment in Palestine
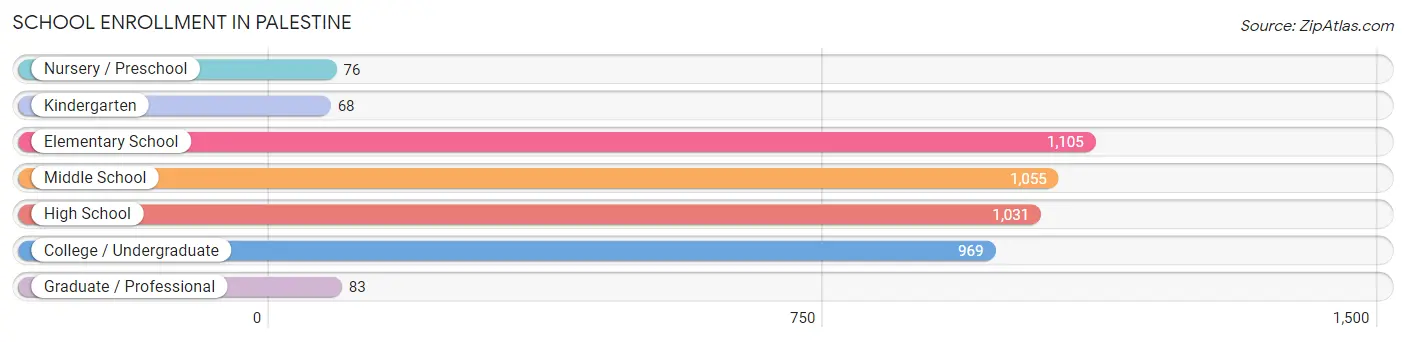
The most common levels of schooling among the 4,387 students in Palestine are elementary school (1,105 | 25.2%), middle school (1,055 | 24.0%), and high school (1,031 | 23.5%).
| School Level | # Students | % Students |
| Nursery / Preschool | 76 | 1.7% |
| Kindergarten | 68 | 1.5% |
| Elementary School | 1,105 | 25.2% |
| Middle School | 1,055 | 24.0% |
| High School | 1,031 | 23.5% |
| College / Undergraduate | 969 | 22.1% |
| Graduate / Professional | 83 | 1.9% |
| Total | 4,387 | 100.0% |
School Enrollment by Age by Funding Source in Palestine
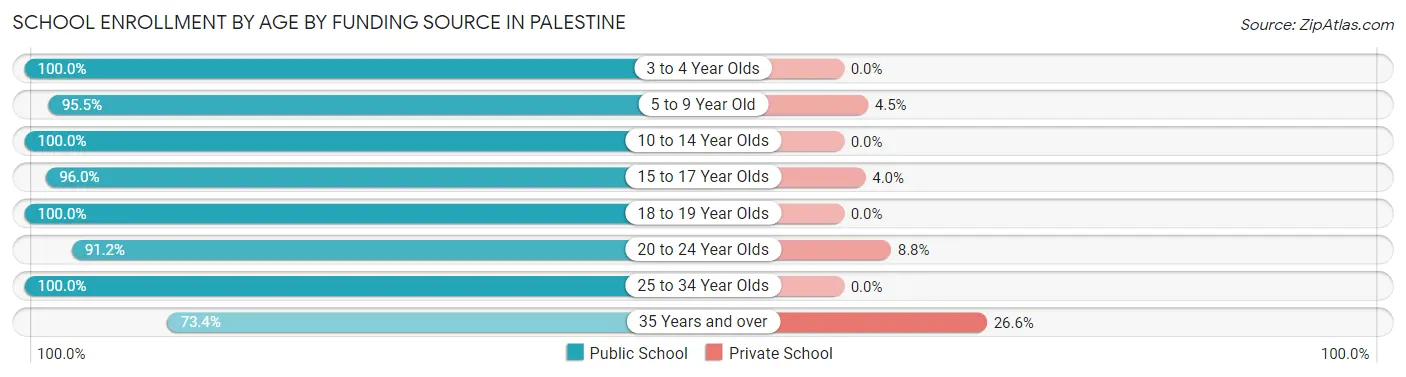
Out of a total of 4,387 students who are enrolled in schools in Palestine, 158 (3.6%) attend a private institution, while the remaining 4,229 (96.4%) are enrolled in public schools. The age group of 35 years and over has the highest likelihood of being enrolled in private schools, with 57 (26.6% in the age bracket) enrolled. Conversely, the age group of 3 to 4 year olds has the lowest likelihood of being enrolled in a private school, with 49 (100.0% in the age bracket) attending a public institution.
| Age Bracket | Public School | Private School |
| 3 to 4 Year Olds | 49 (100.0%) | 0 (0.0%) |
| 5 to 9 Year Old | 913 (95.5%) | 43 (4.5%) |
| 10 to 14 Year Olds | 1,308 (100.0%) | 0 (0.0%) |
| 15 to 17 Year Olds | 858 (96.0%) | 36 (4.0%) |
| 18 to 19 Year Olds | 210 (100.0%) | 0 (0.0%) |
| 20 to 24 Year Olds | 239 (91.2%) | 23 (8.8%) |
| 25 to 34 Year Olds | 494 (100.0%) | 0 (0.0%) |
| 35 Years and over | 157 (73.4%) | 57 (26.6%) |
| Total | 4,229 (96.4%) | 158 (3.6%) |
Educational Attainment by Field of Study in Palestine
Business (358 | 18.0%), education (340 | 17.1%), science & technology (216 | 10.9%), visual & performing arts (178 | 8.9%), and bio, nature & agricultural (150 | 7.5%) are the most common fields of study among 1,989 individuals in Palestine who have obtained a bachelor's degree or higher.
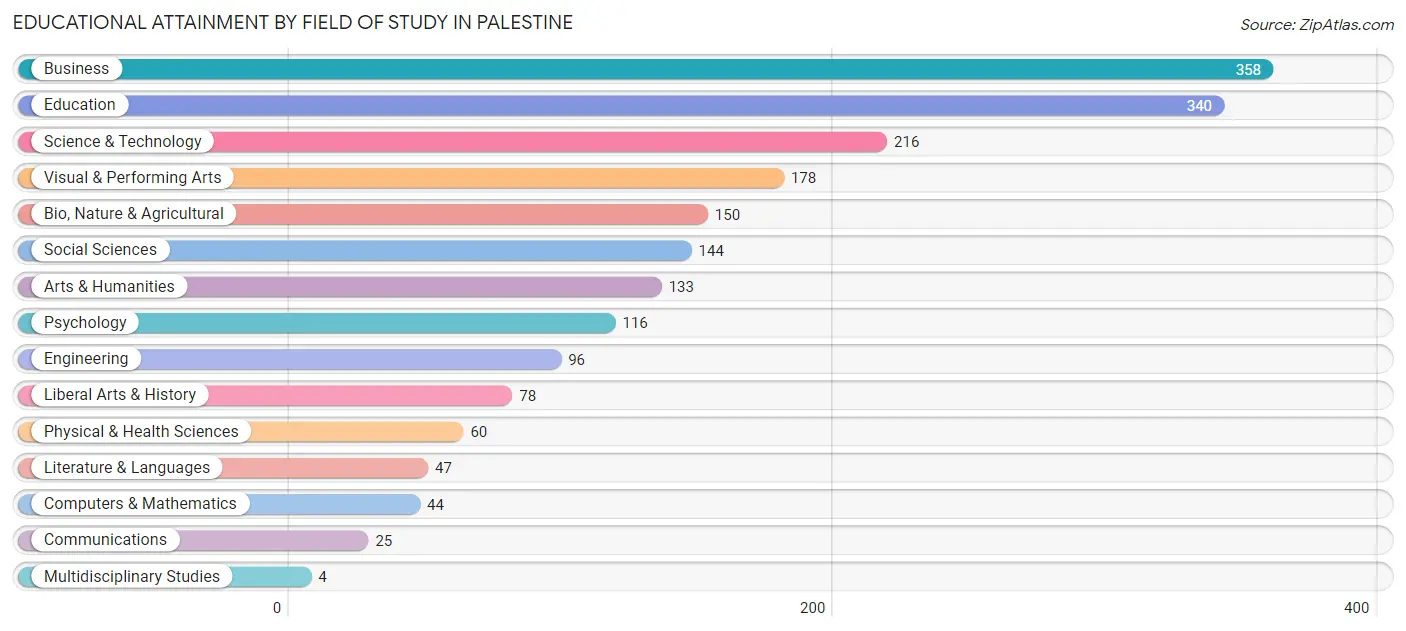
| Field of Study | # Graduates | % Graduates |
| Computers & Mathematics | 44 | 2.2% |
| Bio, Nature & Agricultural | 150 | 7.5% |
| Physical & Health Sciences | 60 | 3.0% |
| Psychology | 116 | 5.8% |
| Social Sciences | 144 | 7.2% |
| Engineering | 96 | 4.8% |
| Multidisciplinary Studies | 4 | 0.2% |
| Science & Technology | 216 | 10.9% |
| Business | 358 | 18.0% |
| Education | 340 | 17.1% |
| Literature & Languages | 47 | 2.4% |
| Liberal Arts & History | 78 | 3.9% |
| Visual & Performing Arts | 178 | 8.9% |
| Communications | 25 | 1.3% |
| Arts & Humanities | 133 | 6.7% |
| Total | 1,989 | 100.0% |
Transportation & Commute in Palestine
Vehicle Availability by Sex in Palestine
The most prevalent vehicle ownership categories in Palestine are males with 2 vehicles (2,282, accounting for 50.4%) and females with 2 vehicles (1,756, making up 58.3%).
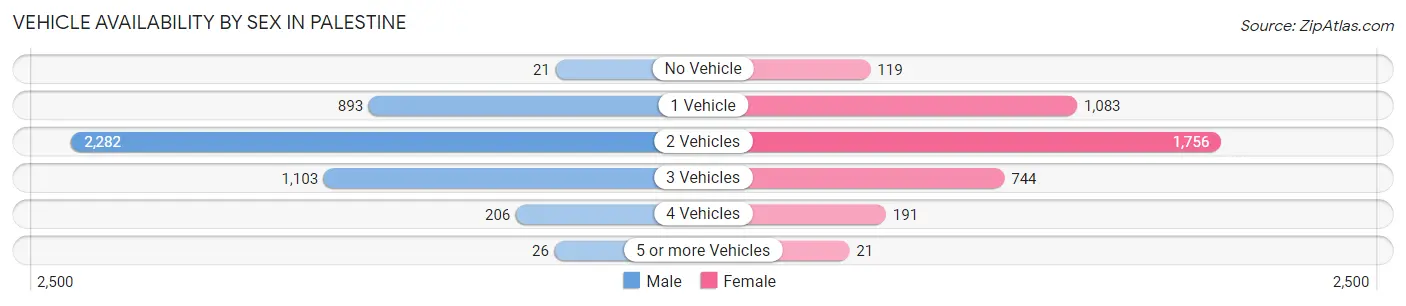
| Vehicles Available | Male | Female |
| No Vehicle | 21 (0.5%) | 119 (3.0%) |
| 1 Vehicle | 893 (19.7%) | 1,083 (27.7%) |
| 2 Vehicles | 2,282 (50.4%) | 1,756 (44.9%) |
| 3 Vehicles | 1,103 (24.3%) | 744 (19.0%) |
| 4 Vehicles | 206 (4.5%) | 191 (4.9%) |
| 5 or more Vehicles | 26 (0.6%) | 21 (0.5%) |
| Total | 4,531 (100.0%) | 3,914 (100.0%) |
Commute Time in Palestine
The most frequently occuring commute durations in Palestine are 5 to 9 minutes (2,355 commuters, 28.8%), 10 to 14 minutes (1,592 commuters, 19.5%), and 20 to 24 minutes (892 commuters, 10.9%).
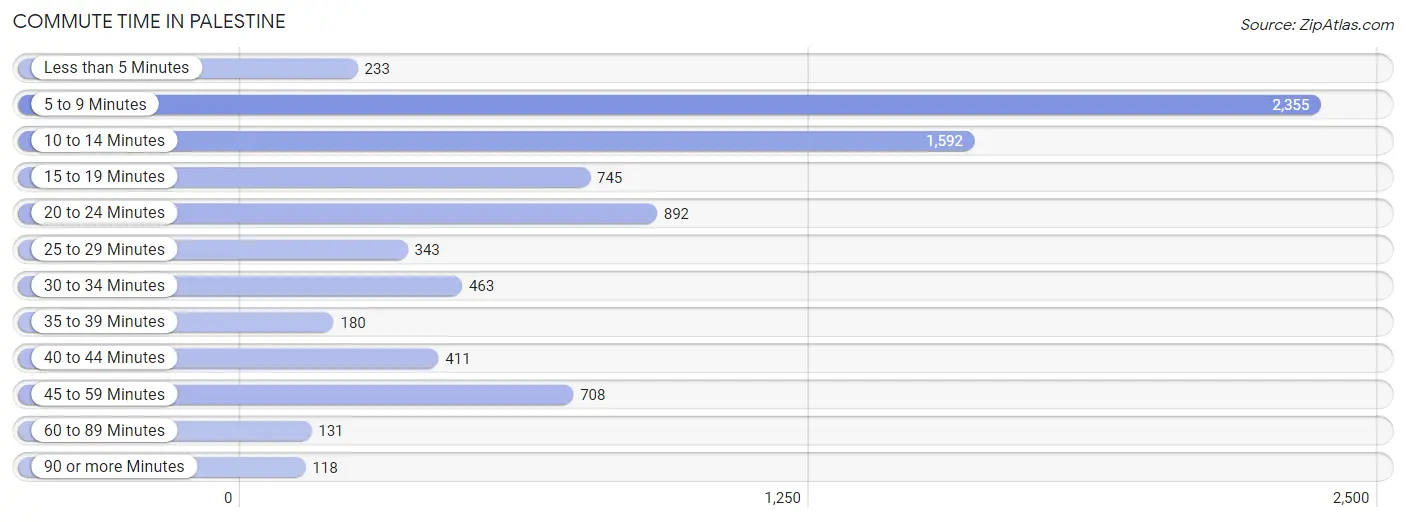
| Commute Time | # Commuters | % Commuters |
| Less than 5 Minutes | 233 | 2.9% |
| 5 to 9 Minutes | 2,355 | 28.8% |
| 10 to 14 Minutes | 1,592 | 19.5% |
| 15 to 19 Minutes | 745 | 9.1% |
| 20 to 24 Minutes | 892 | 10.9% |
| 25 to 29 Minutes | 343 | 4.2% |
| 30 to 34 Minutes | 463 | 5.7% |
| 35 to 39 Minutes | 180 | 2.2% |
| 40 to 44 Minutes | 411 | 5.0% |
| 45 to 59 Minutes | 708 | 8.7% |
| 60 to 89 Minutes | 131 | 1.6% |
| 90 or more Minutes | 118 | 1.4% |
Commute Time by Sex in Palestine
The most common commute times in Palestine are 5 to 9 minutes (1,111 commuters, 25.1%) for males and 5 to 9 minutes (1,244 commuters, 33.3%) for females.
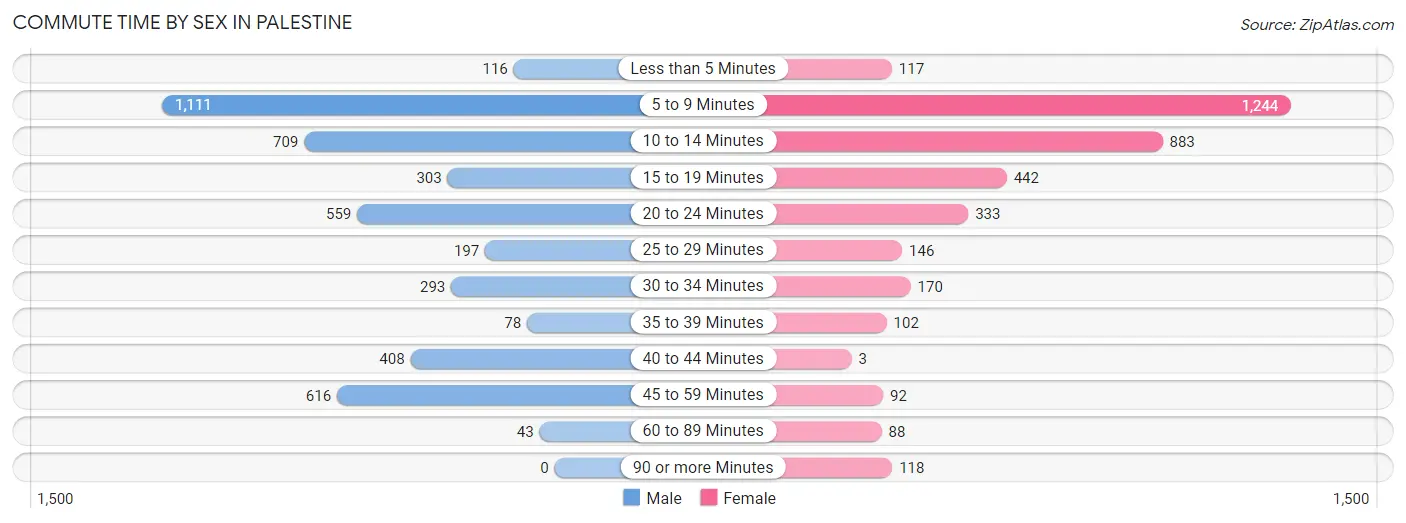
| Commute Time | Male | Female |
| Less than 5 Minutes | 116 (2.6%) | 117 (3.1%) |
| 5 to 9 Minutes | 1,111 (25.1%) | 1,244 (33.3%) |
| 10 to 14 Minutes | 709 (16.0%) | 883 (23.6%) |
| 15 to 19 Minutes | 303 (6.8%) | 442 (11.8%) |
| 20 to 24 Minutes | 559 (12.6%) | 333 (8.9%) |
| 25 to 29 Minutes | 197 (4.4%) | 146 (3.9%) |
| 30 to 34 Minutes | 293 (6.6%) | 170 (4.5%) |
| 35 to 39 Minutes | 78 (1.8%) | 102 (2.7%) |
| 40 to 44 Minutes | 408 (9.2%) | 3 (0.1%) |
| 45 to 59 Minutes | 616 (13.9%) | 92 (2.5%) |
| 60 to 89 Minutes | 43 (1.0%) | 88 (2.4%) |
| 90 or more Minutes | 0 (0.0%) | 118 (3.2%) |
Time of Departure to Work by Sex in Palestine
The most frequent times of departure to work in Palestine are 12:00 AM to 4:59 AM (860, 19.4%) for males and 7:30 AM to 7:59 AM (818, 21.9%) for females.
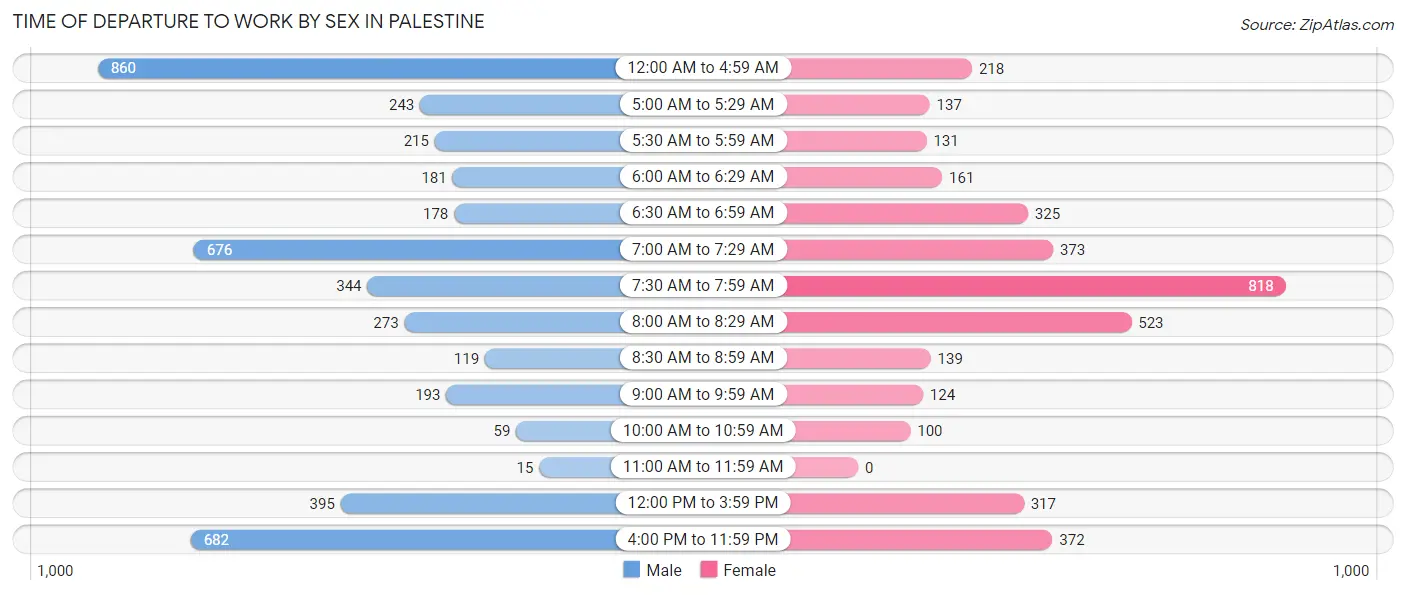
| Time of Departure | Male | Female |
| 12:00 AM to 4:59 AM | 860 (19.4%) | 218 (5.8%) |
| 5:00 AM to 5:29 AM | 243 (5.5%) | 137 (3.7%) |
| 5:30 AM to 5:59 AM | 215 (4.9%) | 131 (3.5%) |
| 6:00 AM to 6:29 AM | 181 (4.1%) | 161 (4.3%) |
| 6:30 AM to 6:59 AM | 178 (4.0%) | 325 (8.7%) |
| 7:00 AM to 7:29 AM | 676 (15.2%) | 373 (10.0%) |
| 7:30 AM to 7:59 AM | 344 (7.8%) | 818 (21.9%) |
| 8:00 AM to 8:29 AM | 273 (6.2%) | 523 (14.0%) |
| 8:30 AM to 8:59 AM | 119 (2.7%) | 139 (3.7%) |
| 9:00 AM to 9:59 AM | 193 (4.3%) | 124 (3.3%) |
| 10:00 AM to 10:59 AM | 59 (1.3%) | 100 (2.7%) |
| 11:00 AM to 11:59 AM | 15 (0.3%) | 0 (0.0%) |
| 12:00 PM to 3:59 PM | 395 (8.9%) | 317 (8.5%) |
| 4:00 PM to 11:59 PM | 682 (15.4%) | 372 (10.0%) |
| Total | 4,433 (100.0%) | 3,738 (100.0%) |
Housing Occupancy in Palestine
Occupancy by Ownership in Palestine
Of the total 7,028 dwellings in Palestine, owner-occupied units account for 3,696 (52.6%), while renter-occupied units make up 3,332 (47.4%).
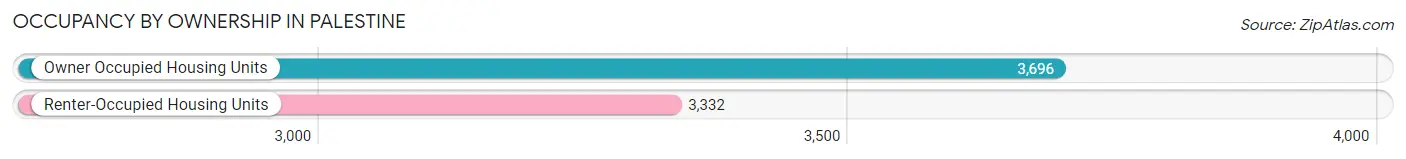
| Occupancy | # Housing Units | % Housing Units |
| Owner Occupied Housing Units | 3,696 | 52.6% |
| Renter-Occupied Housing Units | 3,332 | 47.4% |
| Total Occupied Housing Units | 7,028 | 100.0% |
Occupancy by Household Size in Palestine
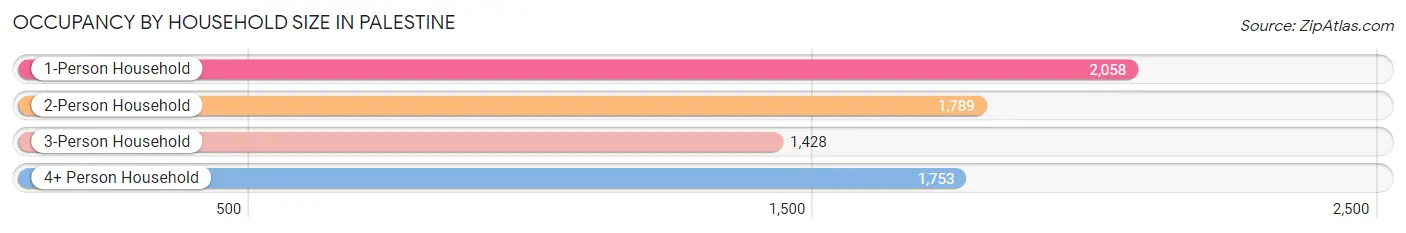
| Household Size | # Housing Units | % Housing Units |
| 1-Person Household | 2,058 | 29.3% |
| 2-Person Household | 1,789 | 25.5% |
| 3-Person Household | 1,428 | 20.3% |
| 4+ Person Household | 1,753 | 24.9% |
| Total Housing Units | 7,028 | 100.0% |
Occupancy by Ownership by Household Size in Palestine
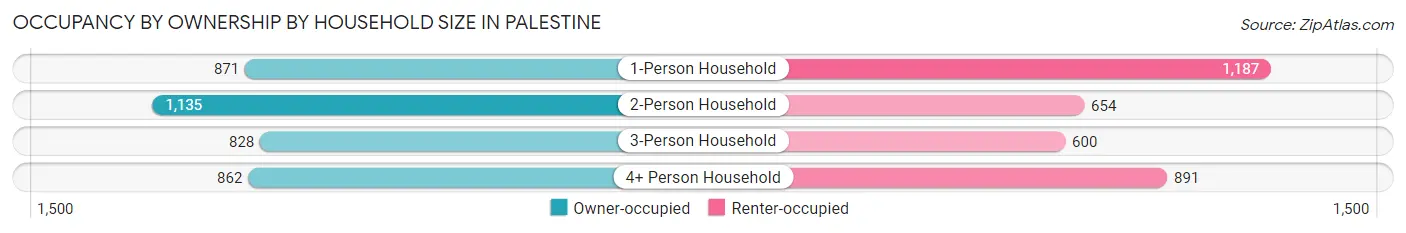
| Household Size | Owner-occupied | Renter-occupied |
| 1-Person Household | 871 (42.3%) | 1,187 (57.7%) |
| 2-Person Household | 1,135 (63.4%) | 654 (36.6%) |
| 3-Person Household | 828 (58.0%) | 600 (42.0%) |
| 4+ Person Household | 862 (49.2%) | 891 (50.8%) |
| Total Housing Units | 3,696 (52.6%) | 3,332 (47.4%) |
Occupancy by Educational Attainment in Palestine
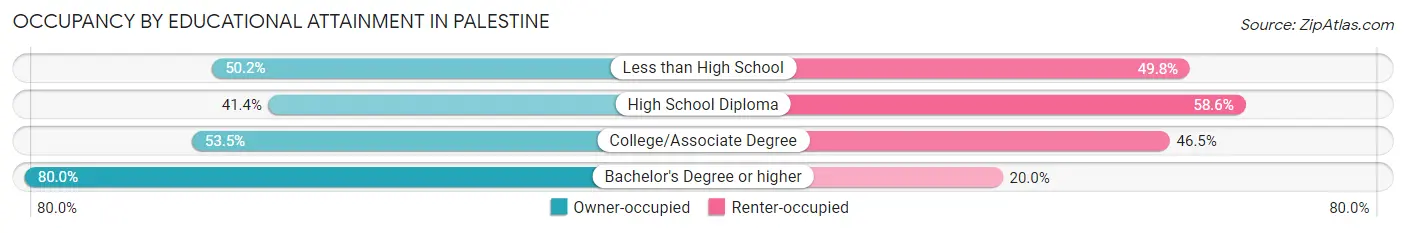
| Household Size | Owner-occupied | Renter-occupied |
| Less than High School | 315 (50.2%) | 312 (49.8%) |
| High School Diploma | 1,156 (41.4%) | 1,635 (58.6%) |
| College/Associate Degree | 1,335 (53.5%) | 1,162 (46.5%) |
| Bachelor's Degree or higher | 890 (80.0%) | 223 (20.0%) |
Occupancy by Age of Householder in Palestine
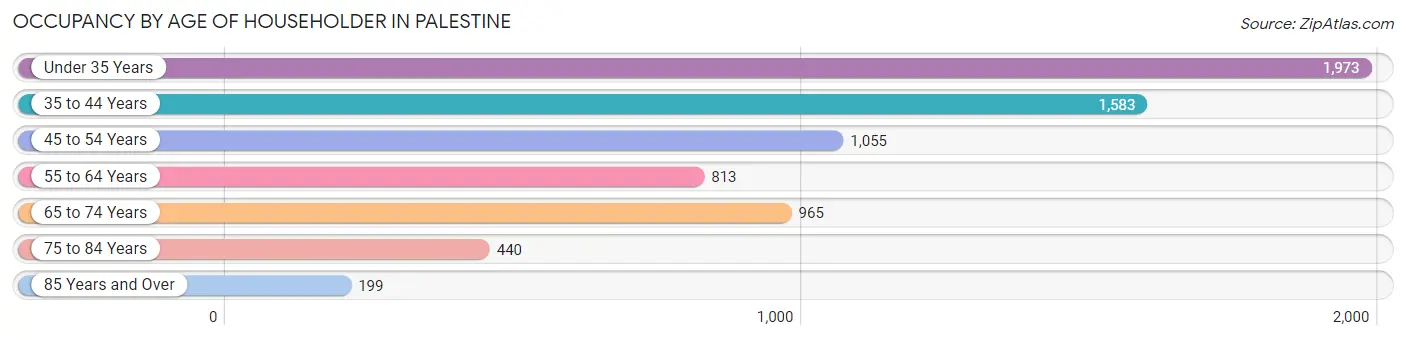
| Age Bracket | # Households | % Households |
| Under 35 Years | 1,973 | 28.1% |
| 35 to 44 Years | 1,583 | 22.5% |
| 45 to 54 Years | 1,055 | 15.0% |
| 55 to 64 Years | 813 | 11.6% |
| 65 to 74 Years | 965 | 13.7% |
| 75 to 84 Years | 440 | 6.3% |
| 85 Years and Over | 199 | 2.8% |
| Total | 7,028 | 100.0% |
Housing Finances in Palestine
Median Income by Occupancy in Palestine
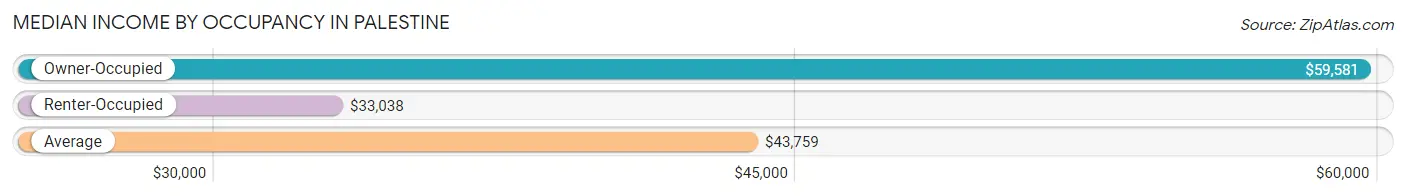
| Occupancy Type | # Households | Median Income |
| Owner-Occupied | 3,696 (52.6%) | $59,581 |
| Renter-Occupied | 3,332 (47.4%) | $33,038 |
| Average | 7,028 (100.0%) | $43,759 |
Occupancy by Householder Income Bracket in Palestine
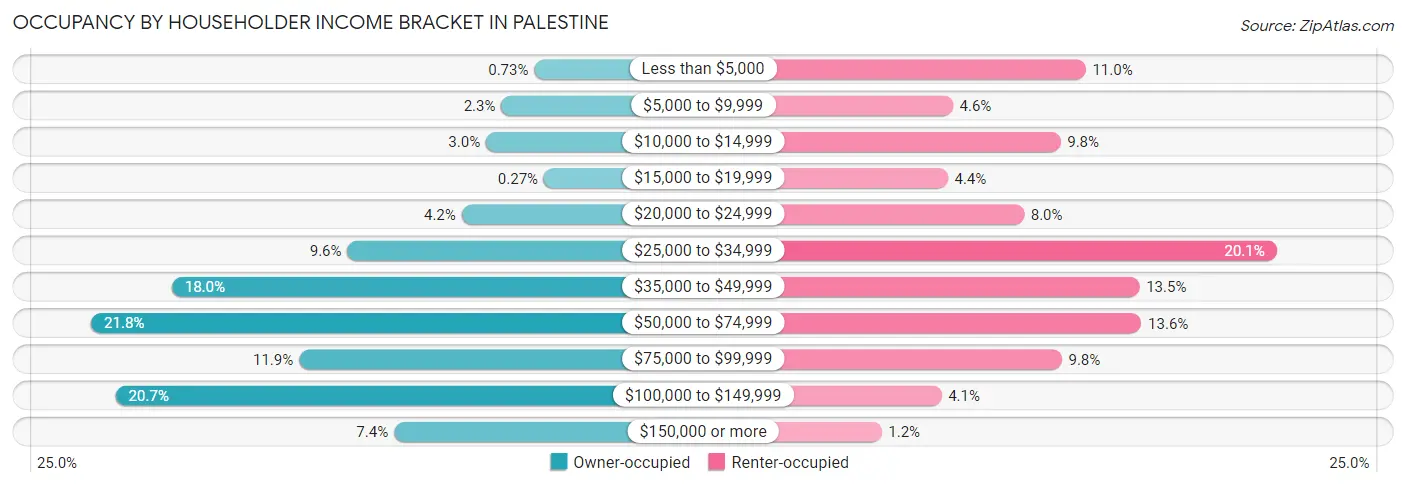
| Income Bracket | Owner-occupied | Renter-occupied |
| Less than $5,000 | 27 (0.7%) | 365 (11.0%) |
| $5,000 to $9,999 | 85 (2.3%) | 154 (4.6%) |
| $10,000 to $14,999 | 112 (3.0%) | 325 (9.8%) |
| $15,000 to $19,999 | 10 (0.3%) | 146 (4.4%) |
| $20,000 to $24,999 | 155 (4.2%) | 267 (8.0%) |
| $25,000 to $34,999 | 356 (9.6%) | 668 (20.1%) |
| $35,000 to $49,999 | 665 (18.0%) | 450 (13.5%) |
| $50,000 to $74,999 | 807 (21.8%) | 453 (13.6%) |
| $75,000 to $99,999 | 441 (11.9%) | 327 (9.8%) |
| $100,000 to $149,999 | 764 (20.7%) | 136 (4.1%) |
| $150,000 or more | 274 (7.4%) | 41 (1.2%) |
| Total | 3,696 (100.0%) | 3,332 (100.0%) |
Monthly Housing Cost Tiers in Palestine
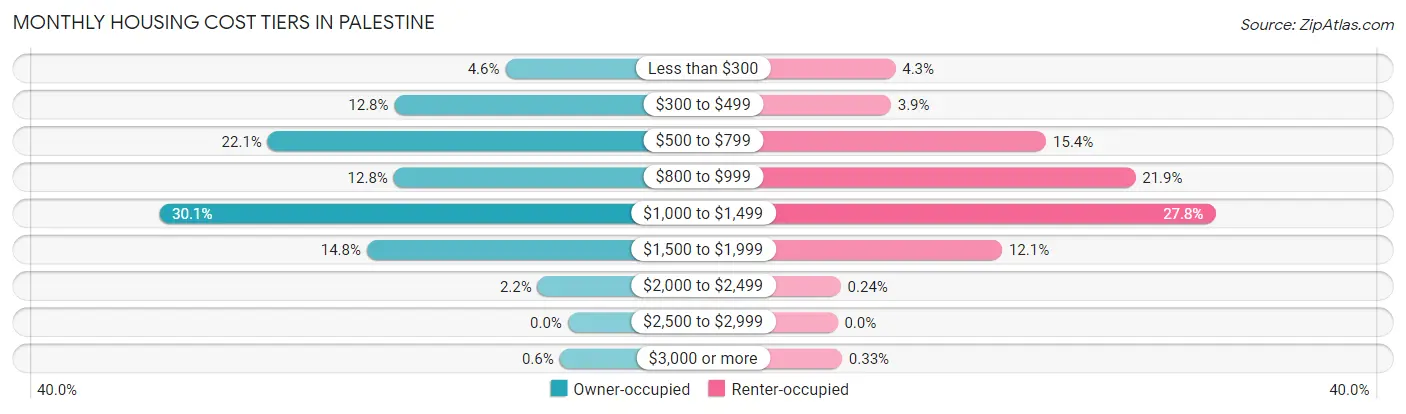
| Monthly Cost | Owner-occupied | Renter-occupied |
| Less than $300 | 170 (4.6%) | 142 (4.3%) |
| $300 to $499 | 472 (12.8%) | 131 (3.9%) |
| $500 to $799 | 817 (22.1%) | 512 (15.4%) |
| $800 to $999 | 474 (12.8%) | 731 (21.9%) |
| $1,000 to $1,499 | 1,112 (30.1%) | 927 (27.8%) |
| $1,500 to $1,999 | 547 (14.8%) | 404 (12.1%) |
| $2,000 to $2,499 | 82 (2.2%) | 8 (0.2%) |
| $2,500 to $2,999 | 0 (0.0%) | 0 (0.0%) |
| $3,000 or more | 22 (0.6%) | 11 (0.3%) |
| Total | 3,696 (100.0%) | 3,332 (100.0%) |
Physical Housing Characteristics in Palestine
Housing Structures in Palestine
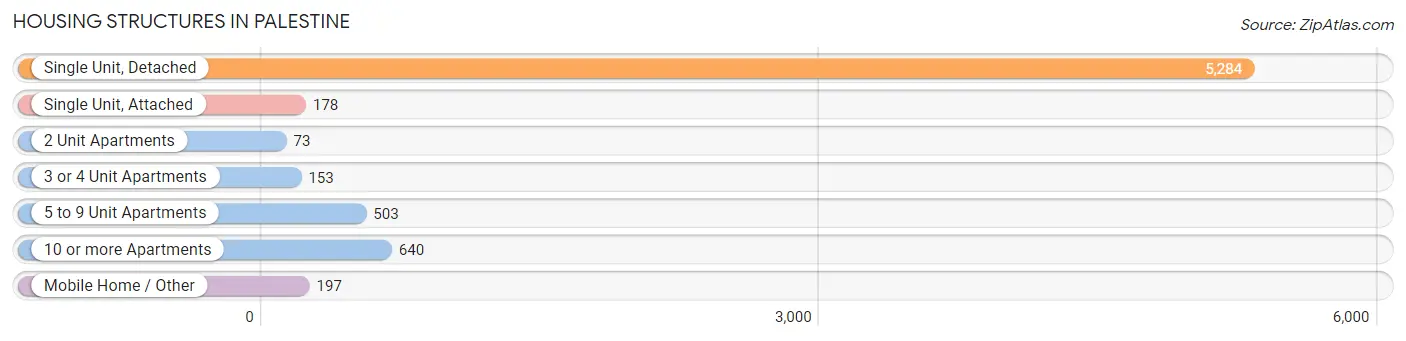
| Structure Type | # Housing Units | % Housing Units |
| Single Unit, Detached | 5,284 | 75.2% |
| Single Unit, Attached | 178 | 2.5% |
| 2 Unit Apartments | 73 | 1.0% |
| 3 or 4 Unit Apartments | 153 | 2.2% |
| 5 to 9 Unit Apartments | 503 | 7.2% |
| 10 or more Apartments | 640 | 9.1% |
| Mobile Home / Other | 197 | 2.8% |
| Total | 7,028 | 100.0% |
Housing Structures by Occupancy in Palestine
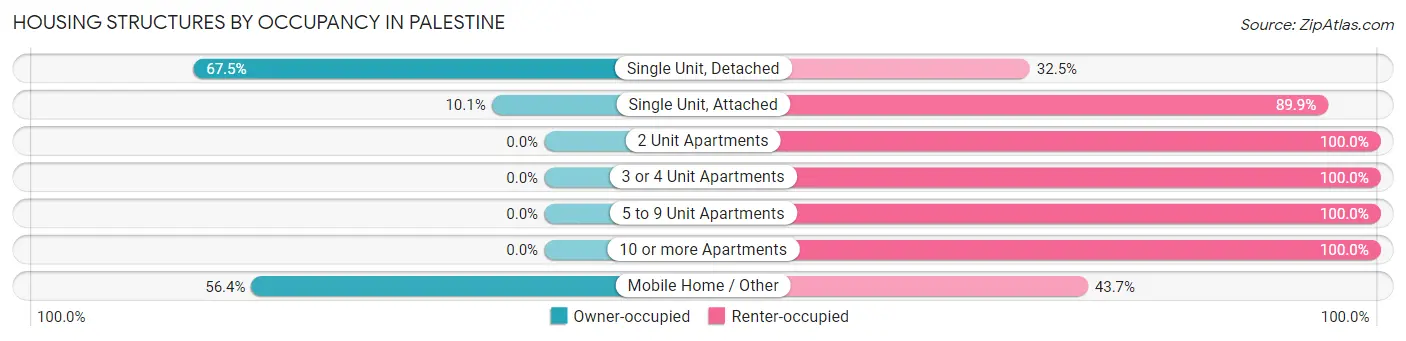
| Structure Type | Owner-occupied | Renter-occupied |
| Single Unit, Detached | 3,567 (67.5%) | 1,717 (32.5%) |
| Single Unit, Attached | 18 (10.1%) | 160 (89.9%) |
| 2 Unit Apartments | 0 (0.0%) | 73 (100.0%) |
| 3 or 4 Unit Apartments | 0 (0.0%) | 153 (100.0%) |
| 5 to 9 Unit Apartments | 0 (0.0%) | 503 (100.0%) |
| 10 or more Apartments | 0 (0.0%) | 640 (100.0%) |
| Mobile Home / Other | 111 (56.4%) | 86 (43.6%) |
| Total | 3,696 (52.6%) | 3,332 (47.4%) |
Housing Structures by Number of Rooms in Palestine
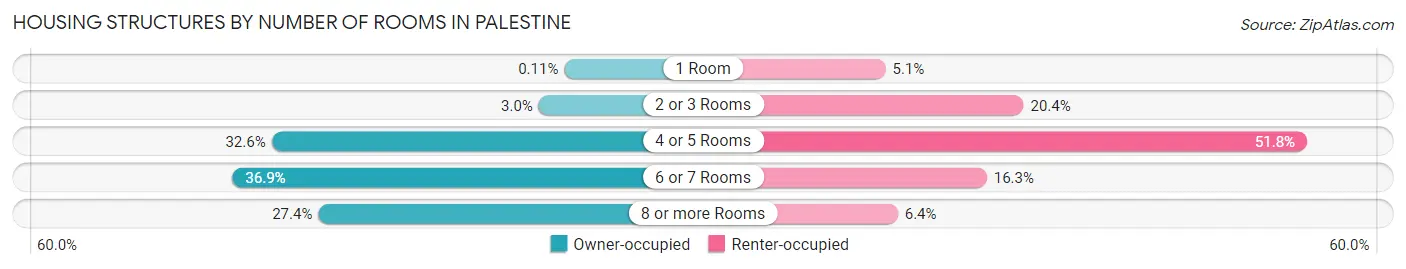
| Number of Rooms | Owner-occupied | Renter-occupied |
| 1 Room | 4 (0.1%) | 169 (5.1%) |
| 2 or 3 Rooms | 109 (2.9%) | 679 (20.4%) |
| 4 or 5 Rooms | 1,205 (32.6%) | 1,727 (51.8%) |
| 6 or 7 Rooms | 1,365 (36.9%) | 543 (16.3%) |
| 8 or more Rooms | 1,013 (27.4%) | 214 (6.4%) |
| Total | 3,696 (100.0%) | 3,332 (100.0%) |
Housing Structure by Heating Type in Palestine
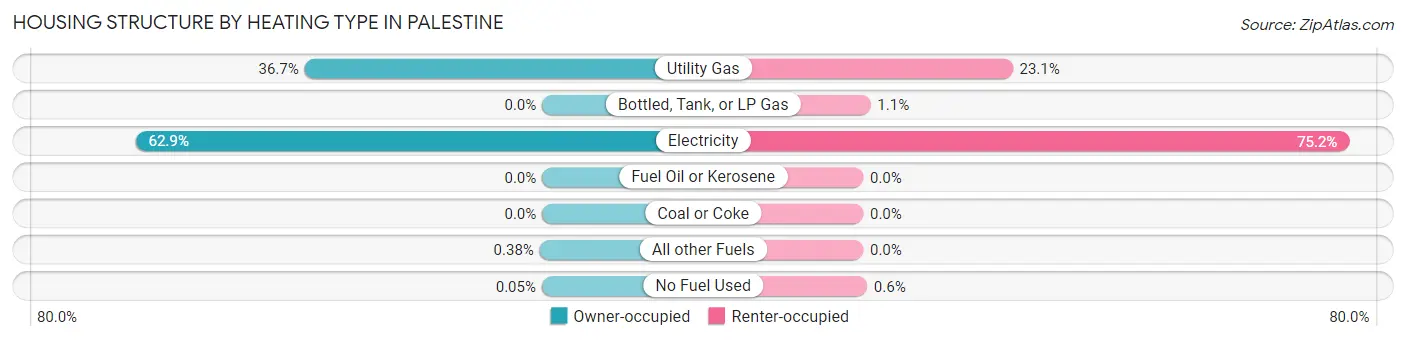
| Heating Type | Owner-occupied | Renter-occupied |
| Utility Gas | 1,357 (36.7%) | 770 (23.1%) |
| Bottled, Tank, or LP Gas | 0 (0.0%) | 38 (1.1%) |
| Electricity | 2,323 (62.8%) | 2,504 (75.1%) |
| Fuel Oil or Kerosene | 0 (0.0%) | 0 (0.0%) |
| Coal or Coke | 0 (0.0%) | 0 (0.0%) |
| All other Fuels | 14 (0.4%) | 0 (0.0%) |
| No Fuel Used | 2 (0.1%) | 20 (0.6%) |
| Total | 3,696 (100.0%) | 3,332 (100.0%) |
Household Vehicle Usage in Palestine
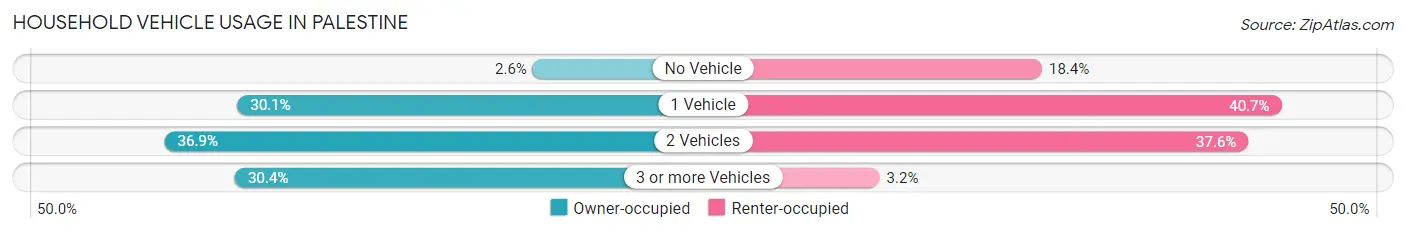
| Vehicles per Household | Owner-occupied | Renter-occupied |
| No Vehicle | 95 (2.6%) | 613 (18.4%) |
| 1 Vehicle | 1,114 (30.1%) | 1,357 (40.7%) |
| 2 Vehicles | 1,365 (36.9%) | 1,254 (37.6%) |
| 3 or more Vehicles | 1,122 (30.4%) | 108 (3.2%) |
| Total | 3,696 (100.0%) | 3,332 (100.0%) |
Real Estate & Mortgages in Palestine
Real Estate and Mortgage Overview in Palestine
| Characteristic | Without Mortgage | With Mortgage |
| Housing Units | 1,915 | 1,781 |
| Median Property Value | $127,800 | $124,300 |
| Median Household Income | $62,610 | $229 |
| Monthly Housing Costs | $597 | $22 |
| Real Estate Taxes | $1,740 | $15 |
Property Value by Mortgage Status in Palestine
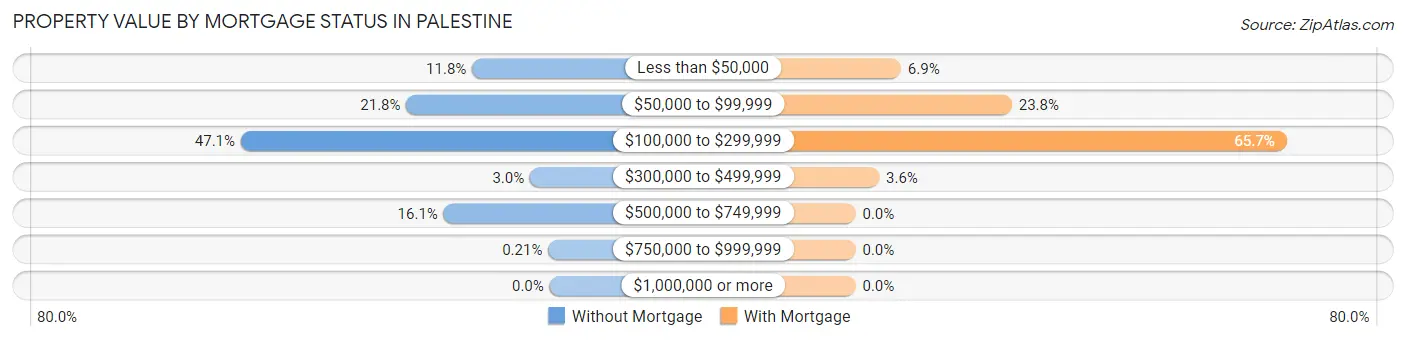
| Property Value | Without Mortgage | With Mortgage |
| Less than $50,000 | 226 (11.8%) | 123 (6.9%) |
| $50,000 to $99,999 | 418 (21.8%) | 424 (23.8%) |
| $100,000 to $299,999 | 901 (47.0%) | 1,170 (65.7%) |
| $300,000 to $499,999 | 57 (3.0%) | 64 (3.6%) |
| $500,000 to $749,999 | 309 (16.1%) | 0 (0.0%) |
| $750,000 to $999,999 | 4 (0.2%) | 0 (0.0%) |
| $1,000,000 or more | 0 (0.0%) | 0 (0.0%) |
| Total | 1,915 (100.0%) | 1,781 (100.0%) |
Household Income by Mortgage Status in Palestine
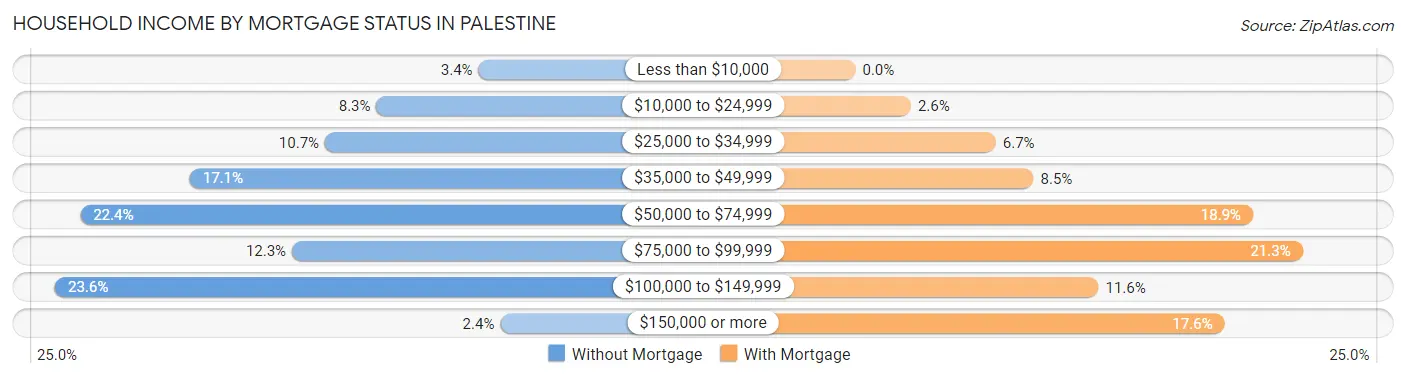
| Household Income | Without Mortgage | With Mortgage |
| Less than $10,000 | 65 (3.4%) | 0 (0.0%) |
| $10,000 to $24,999 | 158 (8.3%) | 47 (2.6%) |
| $25,000 to $34,999 | 205 (10.7%) | 119 (6.7%) |
| $35,000 to $49,999 | 328 (17.1%) | 151 (8.5%) |
| $50,000 to $74,999 | 428 (22.4%) | 337 (18.9%) |
| $75,000 to $99,999 | 235 (12.3%) | 379 (21.3%) |
| $100,000 to $149,999 | 451 (23.5%) | 206 (11.6%) |
| $150,000 or more | 45 (2.4%) | 313 (17.6%) |
| Total | 1,915 (100.0%) | 1,781 (100.0%) |
Property Value to Household Income Ratio in Palestine
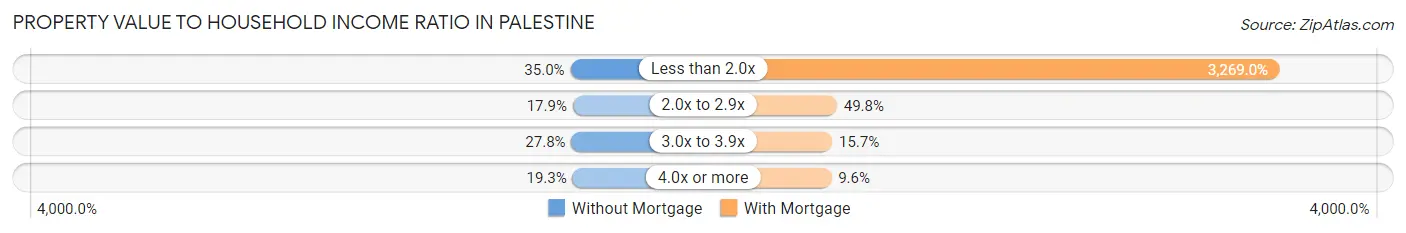
| Value-to-Income Ratio | Without Mortgage | With Mortgage |
| Less than 2.0x | 670 (35.0%) | 58,220 (3,269.0%) |
| 2.0x to 2.9x | 343 (17.9%) | 886 (49.7%) |
| 3.0x to 3.9x | 532 (27.8%) | 279 (15.7%) |
| 4.0x or more | 370 (19.3%) | 170 (9.6%) |
| Total | 1,915 (100.0%) | 1,781 (100.0%) |
Real Estate Taxes by Mortgage Status in Palestine
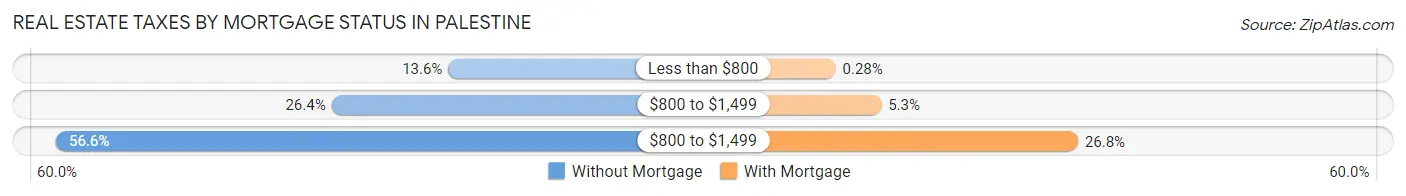
| Property Taxes | Without Mortgage | With Mortgage |
| Less than $800 | 260 (13.6%) | 5 (0.3%) |
| $800 to $1,499 | 505 (26.4%) | 94 (5.3%) |
| $800 to $1,499 | 1,083 (56.6%) | 478 (26.8%) |
| Total | 1,915 (100.0%) | 1,781 (100.0%) |
Health & Disability in Palestine
Health Insurance Coverage by Age in Palestine
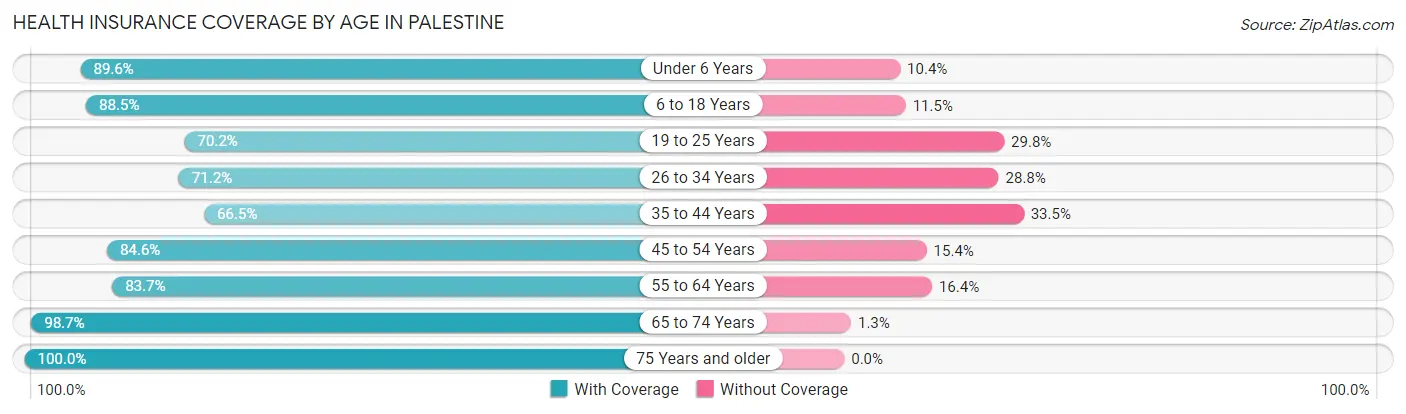
| Age Bracket | With Coverage | Without Coverage |
| Under 6 Years | 1,470 (89.6%) | 171 (10.4%) |
| 6 to 18 Years | 3,121 (88.5%) | 404 (11.5%) |
| 19 to 25 Years | 1,255 (70.2%) | 533 (29.8%) |
| 26 to 34 Years | 2,056 (71.2%) | 831 (28.8%) |
| 35 to 44 Years | 1,730 (66.5%) | 870 (33.5%) |
| 45 to 54 Years | 1,978 (84.6%) | 359 (15.4%) |
| 55 to 64 Years | 998 (83.7%) | 195 (16.4%) |
| 65 to 74 Years | 1,409 (98.7%) | 18 (1.3%) |
| 75 Years and older | 993 (100.0%) | 0 (0.0%) |
| Total | 15,010 (81.6%) | 3,381 (18.4%) |
Health Insurance Coverage by Citizenship Status in Palestine
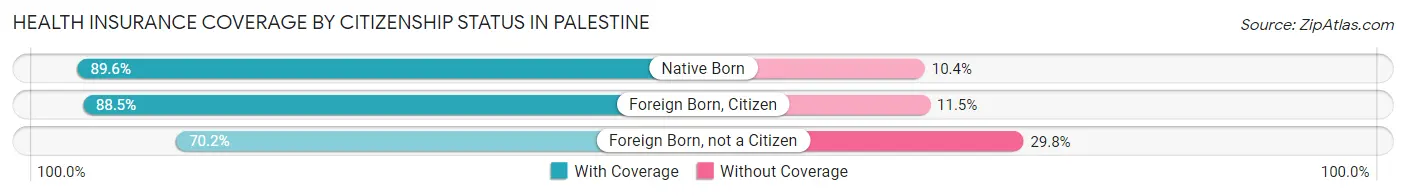
| Citizenship Status | With Coverage | Without Coverage |
| Native Born | 1,470 (89.6%) | 171 (10.4%) |
| Foreign Born, Citizen | 3,121 (88.5%) | 404 (11.5%) |
| Foreign Born, not a Citizen | 1,255 (70.2%) | 533 (29.8%) |
Health Insurance Coverage by Household Income in Palestine
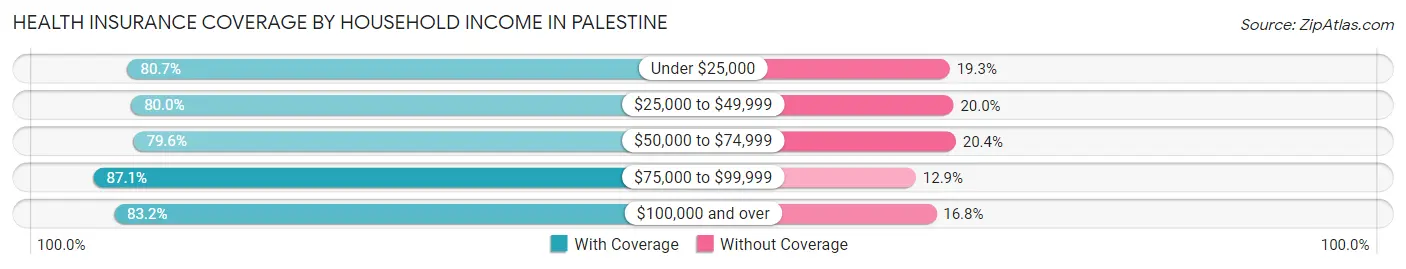
| Household Income | With Coverage | Without Coverage |
| Under $25,000 | 2,694 (80.7%) | 644 (19.3%) |
| $25,000 to $49,999 | 3,910 (80.0%) | 976 (20.0%) |
| $50,000 to $74,999 | 2,869 (79.6%) | 736 (20.4%) |
| $75,000 to $99,999 | 1,851 (87.1%) | 275 (12.9%) |
| $100,000 and over | 3,653 (83.2%) | 736 (16.8%) |
Public vs Private Health Insurance Coverage by Age in Palestine
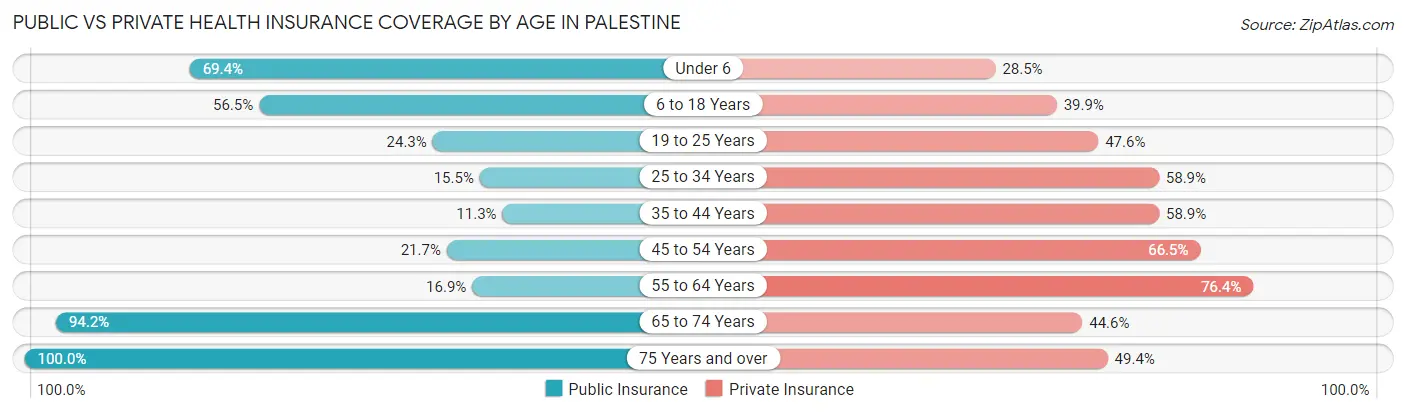
| Age Bracket | Public Insurance | Private Insurance |
| Under 6 | 1,138 (69.4%) | 468 (28.5%) |
| 6 to 18 Years | 1,991 (56.5%) | 1,406 (39.9%) |
| 19 to 25 Years | 434 (24.3%) | 851 (47.6%) |
| 25 to 34 Years | 448 (15.5%) | 1,699 (58.9%) |
| 35 to 44 Years | 294 (11.3%) | 1,531 (58.9%) |
| 45 to 54 Years | 506 (21.6%) | 1,555 (66.5%) |
| 55 to 64 Years | 202 (16.9%) | 911 (76.4%) |
| 65 to 74 Years | 1,344 (94.2%) | 637 (44.6%) |
| 75 Years and over | 993 (100.0%) | 490 (49.3%) |
| Total | 7,350 (40.0%) | 9,548 (51.9%) |
Disability Status by Sex by Age in Palestine
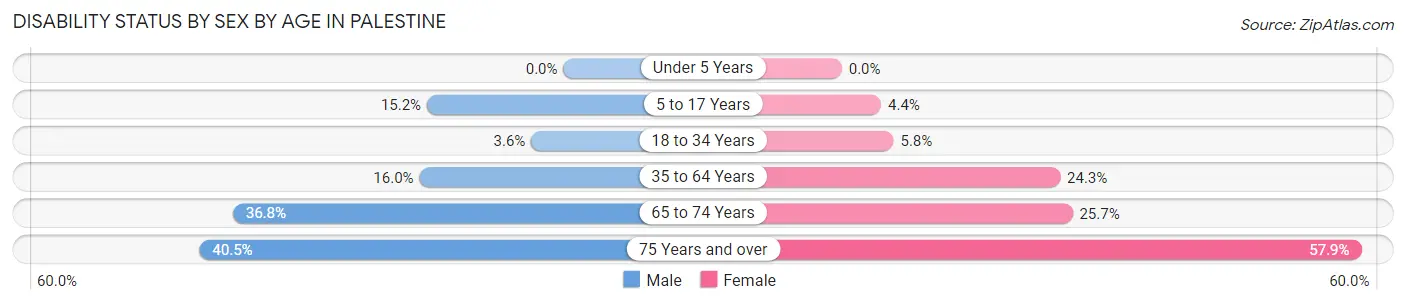
| Age Bracket | Male | Female |
| Under 5 Years | 0 (0.0%) | 0 (0.0%) |
| 5 to 17 Years | 268 (15.2%) | 76 (4.4%) |
| 18 to 34 Years | 89 (3.6%) | 135 (5.8%) |
| 35 to 64 Years | 498 (16.0%) | 735 (24.3%) |
| 65 to 74 Years | 180 (36.8%) | 241 (25.7%) |
| 75 Years and over | 137 (40.5%) | 379 (57.9%) |
Disability Class by Sex by Age in Palestine
Disability Class: Hearing Difficulty
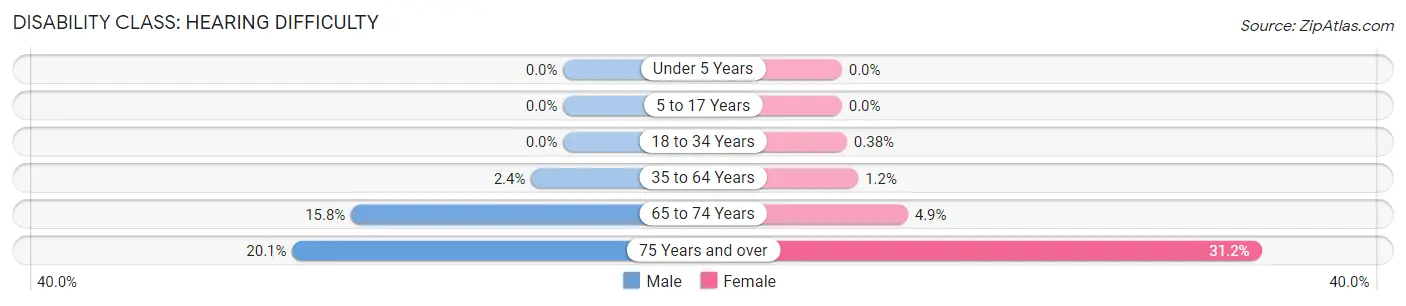
| Age Bracket | Male | Female |
| Under 5 Years | 0 (0.0%) | 0 (0.0%) |
| 5 to 17 Years | 0 (0.0%) | 0 (0.0%) |
| 18 to 34 Years | 0 (0.0%) | 9 (0.4%) |
| 35 to 64 Years | 74 (2.4%) | 37 (1.2%) |
| 65 to 74 Years | 77 (15.8%) | 46 (4.9%) |
| 75 Years and over | 68 (20.1%) | 204 (31.1%) |
Disability Class: Vision Difficulty
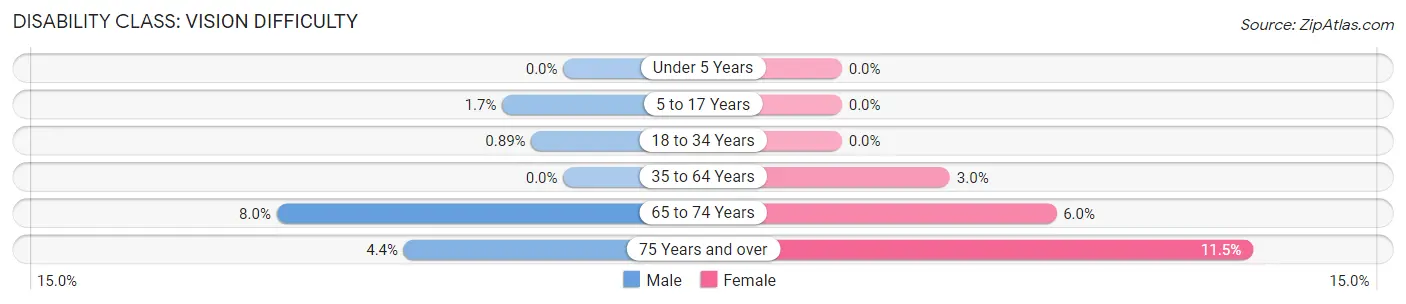
| Age Bracket | Male | Female |
| Under 5 Years | 0 (0.0%) | 0 (0.0%) |
| 5 to 17 Years | 30 (1.7%) | 0 (0.0%) |
| 18 to 34 Years | 22 (0.9%) | 0 (0.0%) |
| 35 to 64 Years | 0 (0.0%) | 91 (3.0%) |
| 65 to 74 Years | 39 (8.0%) | 56 (6.0%) |
| 75 Years and over | 15 (4.4%) | 75 (11.5%) |
Disability Class: Cognitive Difficulty
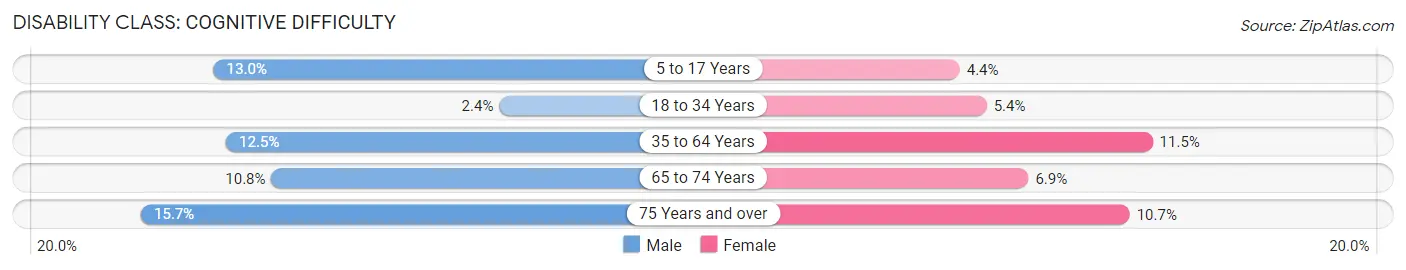
| Age Bracket | Male | Female |
| 5 to 17 Years | 229 (13.0%) | 76 (4.4%) |
| 18 to 34 Years | 59 (2.4%) | 126 (5.4%) |
| 35 to 64 Years | 389 (12.5%) | 349 (11.5%) |
| 65 to 74 Years | 53 (10.8%) | 65 (6.9%) |
| 75 Years and over | 53 (15.7%) | 70 (10.7%) |
Disability Class: Ambulatory Difficulty
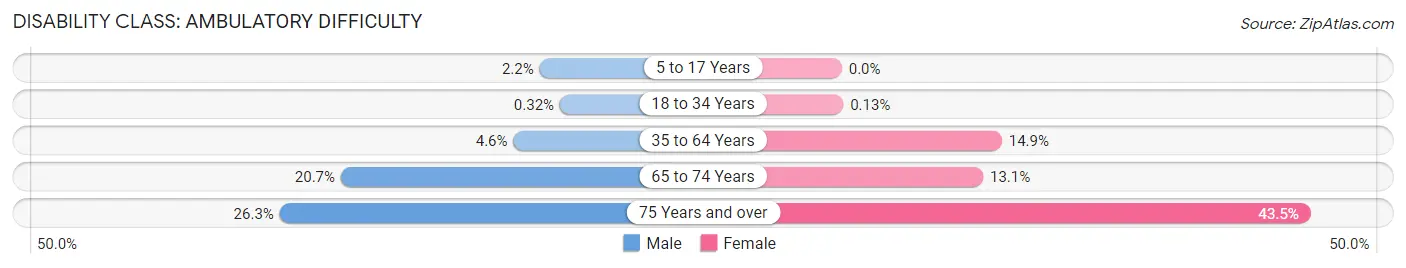
| Age Bracket | Male | Female |
| 5 to 17 Years | 39 (2.2%) | 0 (0.0%) |
| 18 to 34 Years | 8 (0.3%) | 3 (0.1%) |
| 35 to 64 Years | 144 (4.6%) | 449 (14.8%) |
| 65 to 74 Years | 101 (20.6%) | 123 (13.1%) |
| 75 Years and over | 89 (26.3%) | 285 (43.5%) |
Disability Class: Self-Care Difficulty
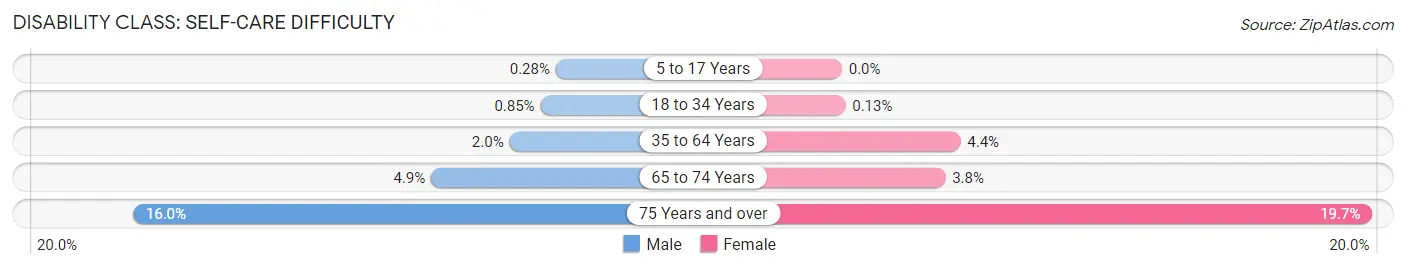
| Age Bracket | Male | Female |
| 5 to 17 Years | 5 (0.3%) | 0 (0.0%) |
| 18 to 34 Years | 21 (0.9%) | 3 (0.1%) |
| 35 to 64 Years | 62 (2.0%) | 133 (4.4%) |
| 65 to 74 Years | 24 (4.9%) | 36 (3.8%) |
| 75 Years and over | 54 (16.0%) | 129 (19.7%) |
Technology Access in Palestine
Computing Device Access in Palestine
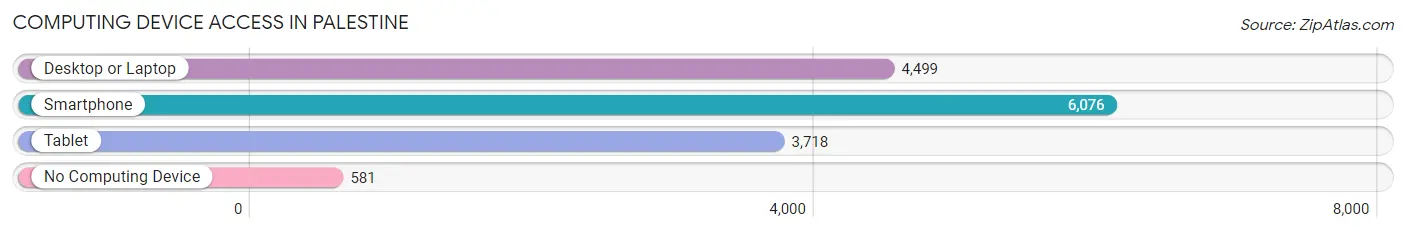
| Device Type | # Households | % Households |
| Desktop or Laptop | 4,499 | 64.0% |
| Smartphone | 6,076 | 86.5% |
| Tablet | 3,718 | 52.9% |
| No Computing Device | 581 | 8.3% |
| Total | 7,028 | 100.0% |
Internet Access in Palestine
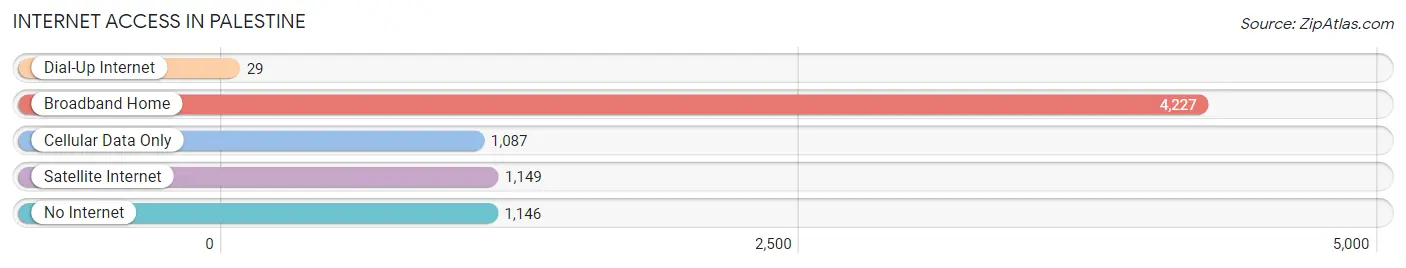
| Internet Type | # Households | % Households |
| Dial-Up Internet | 29 | 0.4% |
| Broadband Home | 4,227 | 60.2% |
| Cellular Data Only | 1,087 | 15.5% |
| Satellite Internet | 1,149 | 16.4% |
| No Internet | 1,146 | 16.3% |
| Total | 7,028 | 100.0% |
Palestine Summary
Palestine, Texas is a city located in Anderson County, Texas, United States. It is the county seat of Anderson County and is situated in the East Texas Piney Woods region. The population of Palestine was 18,712 at the 2010 census, making it the largest city in Anderson County.
History
The area around Palestine was first settled in the early 1830s by pioneers from the United States and Europe. The town was named after Palestine, Illinois, which was the hometown of one of the early settlers. The city was officially incorporated in 1846 and was designated as the county seat of Anderson County in 1846.
In the late 19th century, Palestine became a major railroad hub, with the Houston and Texas Central Railway and the International-Great Northern Railroad both running through the city. This led to a period of economic growth and prosperity for the city, which lasted until the Great Depression.
During the Civil War, Palestine was the site of several battles, including the Battle of Palestine in 1862. After the war, the city experienced a period of economic decline, but was able to recover in the early 20th century.
Geography
Palestine is located at 31°46'N 95°45'W (31.766, -95.749). It is situated in the East Texas Piney Woods region, about 100 miles southeast of Dallas. The city is located on the banks of the Neches River, which flows through the city and is a major tributary of the Trinity River.
The city has a total area of 16.2 square miles, of which 16.1 square miles is land and 0.1 square miles is water.
Economy
The economy of Palestine is largely based on agriculture, manufacturing, and tourism. The city is home to several manufacturing companies, including a large paper mill and a steel mill.
Agriculture is also an important part of the local economy, with the city being home to several large farms and ranches. The city is also home to several tourist attractions, including the Texas State Railroad, the Palestine Historic District, and the Museum for East Texas Culture.
Demographics
As of the 2010 census, the population of Palestine was 18,712. The racial makeup of the city was 73.3% White, 19.2% African American, 0.5% Native American, 0.7% Asian, 0.1% Pacific Islander, 4.2% from other races, and 2.0% from two or more races. Hispanic or Latino of any race were 11.2% of the population.
The median income for a household in the city was $31,945, and the median income for a family was $41,945. The per capita income for the city was $17,845. About 17.2% of families and 21.3% of the population were below the poverty line, including 28.3% of those under age 18 and 14.2% of those age 65 or over.
Common Questions
What is Per Capita Income in Palestine?
Per Capita income in Palestine is $23,235.
What is the Median Family Income in Palestine?
Median Family Income in Palestine is $52,371.
What is the Median Household income in Palestine?
Median Household Income in Palestine is $43,759.
What is Income or Wage Gap in Palestine?
Income or Wage Gap in Palestine is 34.0%.
Women in Palestine earn 66.0 cents for every dollar earned by a man.
What is Inequality or Gini Index in Palestine?
Inequality or Gini Index in Palestine is 0.42.
What is the Total Population of Palestine?
Total Population of Palestine is 18,741.
What is the Total Male Population of Palestine?
Total Male Population of Palestine is 9,245.
What is the Total Female Population of Palestine?
Total Female Population of Palestine is 9,496.
What is the Ratio of Males per 100 Females in Palestine?
There are 97.36 Males per 100 Females in Palestine.
What is the Ratio of Females per 100 Males in Palestine?
There are 102.71 Females per 100 Males in Palestine.
What is the Median Population Age in Palestine?
Median Population Age in Palestine is 33.1 Years.
What is the Average Family Size in Palestine
Average Family Size in Palestine is 3.2 People.
What is the Average Household Size in Palestine
Average Household Size in Palestine is 2.6 People.
How Large is the Labor Force in Palestine?
There are 8,885 People in the Labor Forcein in Palestine.
What is the Percentage of People in the Labor Force in Palestine?
62.1% of People are in the Labor Force in Palestine.
What is the Unemployment Rate in Palestine?
Unemployment Rate in Palestine is 4.0%.