Georgetown, SC Map & Demographics
Georgetown Map
Georgetown Overview
$28,945
PER CAPITA INCOME
$56,761
AVG FAMILY INCOME
$50,000
AVG HOUSEHOLD INCOME
4.8%
WAGE / INCOME GAP [ % ]
95.2¢/ $1
WAGE / INCOME GAP [ $ ]
$5,438
FAMILY INCOME DEFICIT
0.49
INEQUALITY / GINI INDEX
8,465
TOTAL POPULATION
3,823
MALE POPULATION
4,642
FEMALE POPULATION
82.36
MALES / 100 FEMALES
121.42
FEMALES / 100 MALES
48.8
MEDIAN AGE
2.8
AVG FAMILY SIZE
2.2
AVG HOUSEHOLD SIZE
4,096
LABOR FORCE [ PEOPLE ]
54.9%
PERCENT IN LABOR FORCE
9.2%
UNEMPLOYMENT RATE
Georgetown Zip Codes
Georgetown Area Codes
Income in Georgetown
Income Overview in Georgetown
Per Capita Income in Georgetown is $28,945, while median incomes of families and households are $56,761 and $50,000 respectively.
| Characteristic | Number | Measure |
| Per Capita Income | 8,465 | $28,945 |
| Median Family Income | 2,327 | $56,761 |
| Mean Family Income | 2,327 | $83,150 |
| Median Household Income | 3,670 | $50,000 |
| Mean Household Income | 3,670 | $64,094 |
| Income Deficit | 2,327 | $5,438 |
| Wage / Income Gap (%) | 8,465 | 4.79% |
| Wage / Income Gap ($) | 8,465 | 95.21¢ per $1 |
| Gini / Inequality Index | 8,465 | 0.49 |
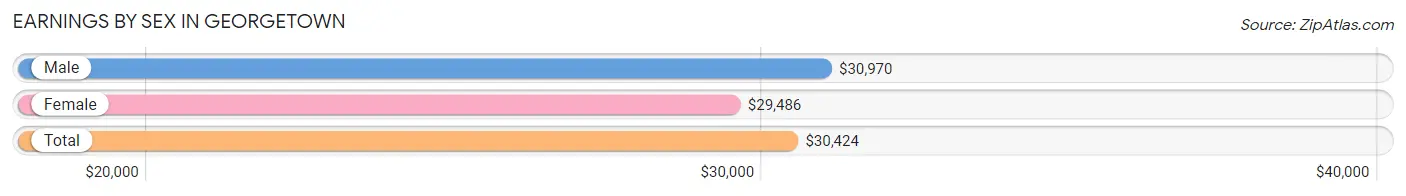
Earnings by Sex in Georgetown
Average Earnings in Georgetown are $30,424, $30,970 for men and $29,486 for women, a difference of 4.8%.
| Sex | Number | Average Earnings |
| Male | 2,151 (51.4%) | $30,970 |
| Female | 2,035 (48.6%) | $29,486 |
| Total | 4,186 (100.0%) | $30,424 |
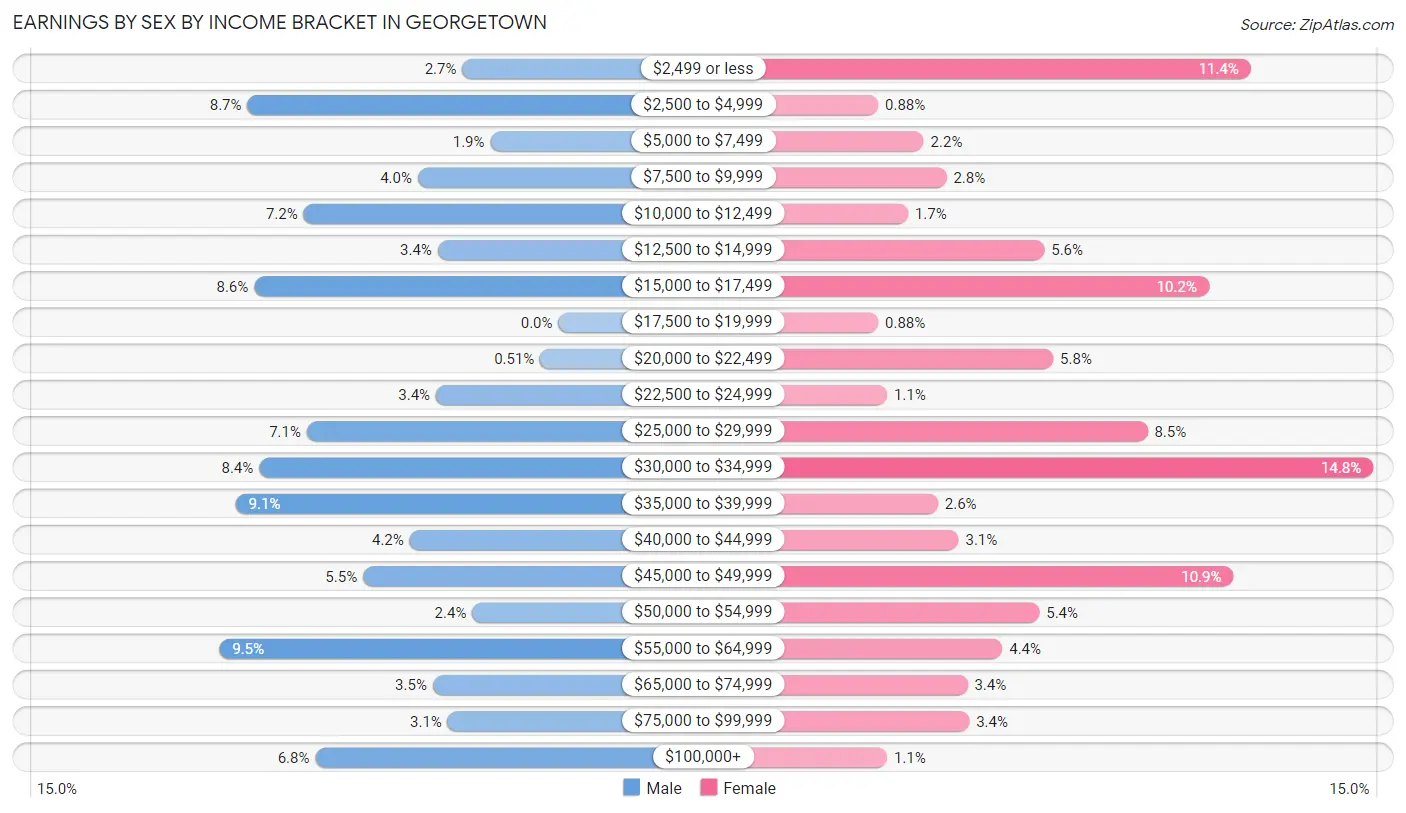
Earnings by Sex by Income Bracket in Georgetown
The most common earnings brackets in Georgetown are $55,000 to $64,999 for men (205 | 9.5%) and $30,000 to $34,999 for women (301 | 14.8%).
| Income | Male | Female |
| $2,499 or less | 58 (2.7%) | 231 (11.4%) |
| $2,500 to $4,999 | 188 (8.7%) | 18 (0.9%) |
| $5,000 to $7,499 | 41 (1.9%) | 44 (2.2%) |
| $7,500 to $9,999 | 85 (4.0%) | 57 (2.8%) |
| $10,000 to $12,499 | 154 (7.2%) | 35 (1.7%) |
| $12,500 to $14,999 | 73 (3.4%) | 113 (5.6%) |
| $15,000 to $17,499 | 184 (8.6%) | 207 (10.2%) |
| $17,500 to $19,999 | 0 (0.0%) | 18 (0.9%) |
| $20,000 to $22,499 | 11 (0.5%) | 118 (5.8%) |
| $22,500 to $24,999 | 74 (3.4%) | 23 (1.1%) |
| $25,000 to $29,999 | 152 (7.1%) | 172 (8.5%) |
| $30,000 to $34,999 | 181 (8.4%) | 301 (14.8%) |
| $35,000 to $39,999 | 195 (9.1%) | 52 (2.6%) |
| $40,000 to $44,999 | 90 (4.2%) | 64 (3.1%) |
| $45,000 to $49,999 | 118 (5.5%) | 221 (10.9%) |
| $50,000 to $54,999 | 52 (2.4%) | 110 (5.4%) |
| $55,000 to $64,999 | 205 (9.5%) | 89 (4.4%) |
| $65,000 to $74,999 | 76 (3.5%) | 69 (3.4%) |
| $75,000 to $99,999 | 67 (3.1%) | 70 (3.4%) |
| $100,000+ | 147 (6.8%) | 23 (1.1%) |
| Total | 2,151 (100.0%) | 2,035 (100.0%) |
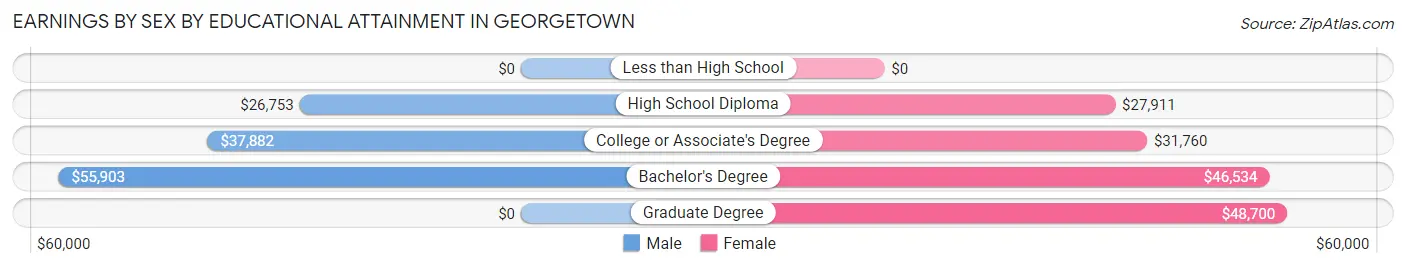
Earnings by Sex by Educational Attainment in Georgetown
Average earnings in Georgetown are $35,211 for men and $32,771 for women, a difference of 6.9%. Men with an educational attainment of bachelor's degree enjoy the highest average annual earnings of $55,903, while those with high school diploma education earn the least with $26,753. Women with an educational attainment of graduate degree earn the most with the average annual earnings of $48,700, while those with high school diploma education have the smallest earnings of $27,911.
| Educational Attainment | Male Income | Female Income |
| Less than High School | - | - |
| High School Diploma | $26,753 | $27,911 |
| College or Associate's Degree | $37,882 | $31,760 |
| Bachelor's Degree | $55,903 | $46,534 |
| Graduate Degree | - | - |
| Total | $35,211 | $32,771 |
Family Income in Georgetown
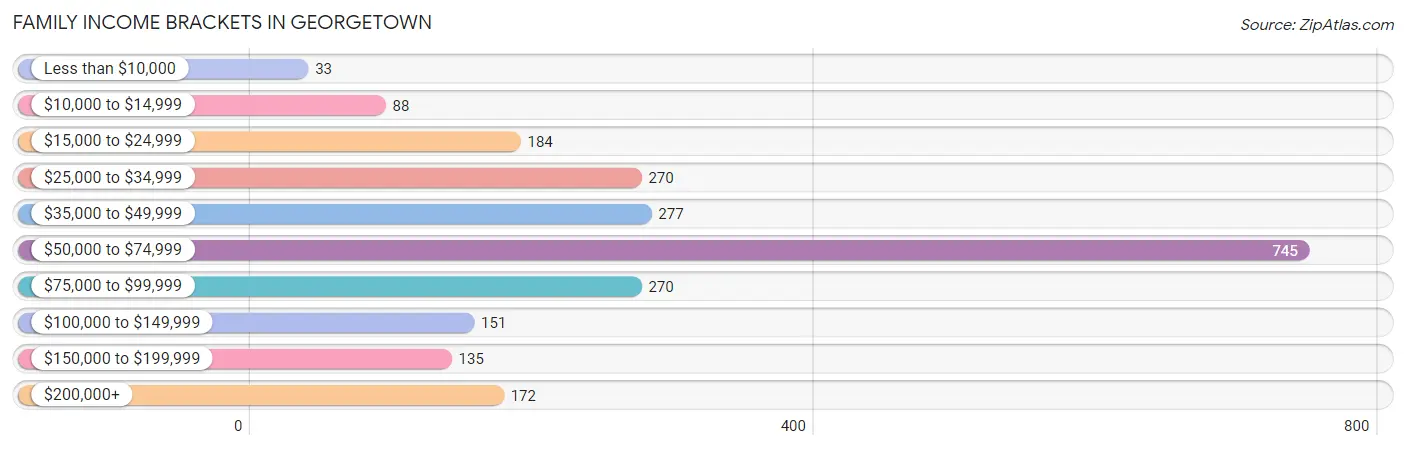
Family Income Brackets in Georgetown
According to the Georgetown family income data, there are 745 families falling into the $50,000 to $74,999 income range, which is the most common income bracket and makes up 32.0% of all families. Conversely, the less than $10,000 income bracket is the least frequent group with only 33 families (1.4%) belonging to this category.
| Income Bracket | # Families | % Families |
| Less than $10,000 | 33 | 1.4% |
| $10,000 to $14,999 | 88 | 3.8% |
| $15,000 to $24,999 | 184 | 7.9% |
| $25,000 to $34,999 | 270 | 11.6% |
| $35,000 to $49,999 | 277 | 11.9% |
| $50,000 to $74,999 | 745 | 32.0% |
| $75,000 to $99,999 | 270 | 11.6% |
| $100,000 to $149,999 | 151 | 6.5% |
| $150,000 to $199,999 | 135 | 5.8% |
| $200,000+ | 172 | 7.4% |
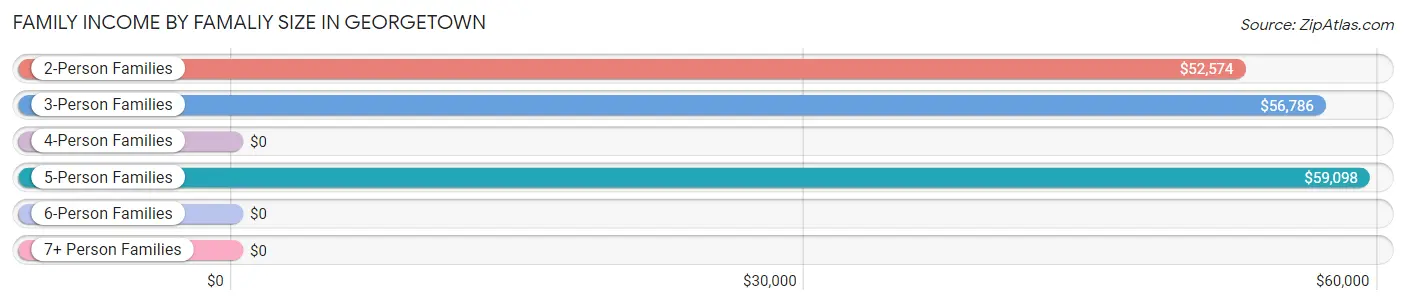
Family Income by Famaliy Size in Georgetown
5-person families (126 | 5.4%) account for the highest median family income in Georgetown with $59,098 per family, while 2-person families (1,462 | 62.8%) have the highest median income of $26,287 per family member.
| Income Bracket | # Families | Median Income |
| 2-Person Families | 1,462 (62.8%) | $52,574 |
| 3-Person Families | 498 (21.4%) | $56,786 |
| 4-Person Families | 226 (9.7%) | $0 |
| 5-Person Families | 126 (5.4%) | $59,098 |
| 6-Person Families | 0 (0.0%) | $0 |
| 7+ Person Families | 15 (0.6%) | $0 |
| Total | 2,327 (100.0%) | $56,761 |
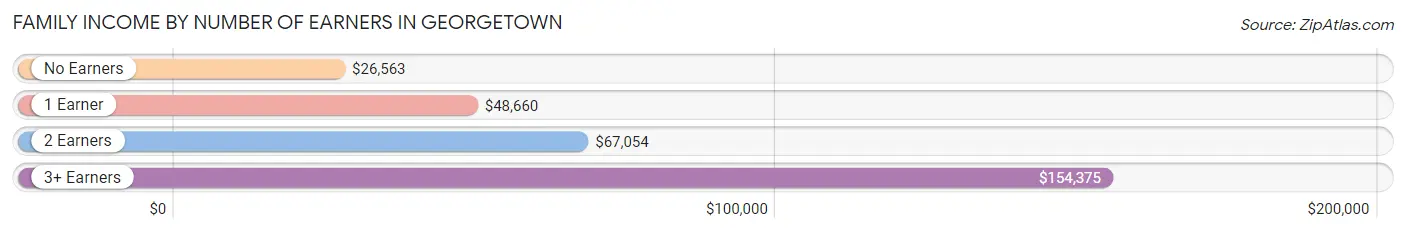
Family Income by Number of Earners in Georgetown
The median family income in Georgetown is $56,761, with families comprising 3+ earners (125) having the highest median family income of $154,375, while families with no earners (382) have the lowest median family income of $26,563, accounting for 5.4% and 16.4% of families, respectively.
| Number of Earners | # Families | Median Income |
| No Earners | 382 (16.4%) | $26,563 |
| 1 Earner | 1,079 (46.4%) | $48,660 |
| 2 Earners | 741 (31.8%) | $67,054 |
| 3+ Earners | 125 (5.4%) | $154,375 |
| Total | 2,327 (100.0%) | $56,761 |
Household Income in Georgetown
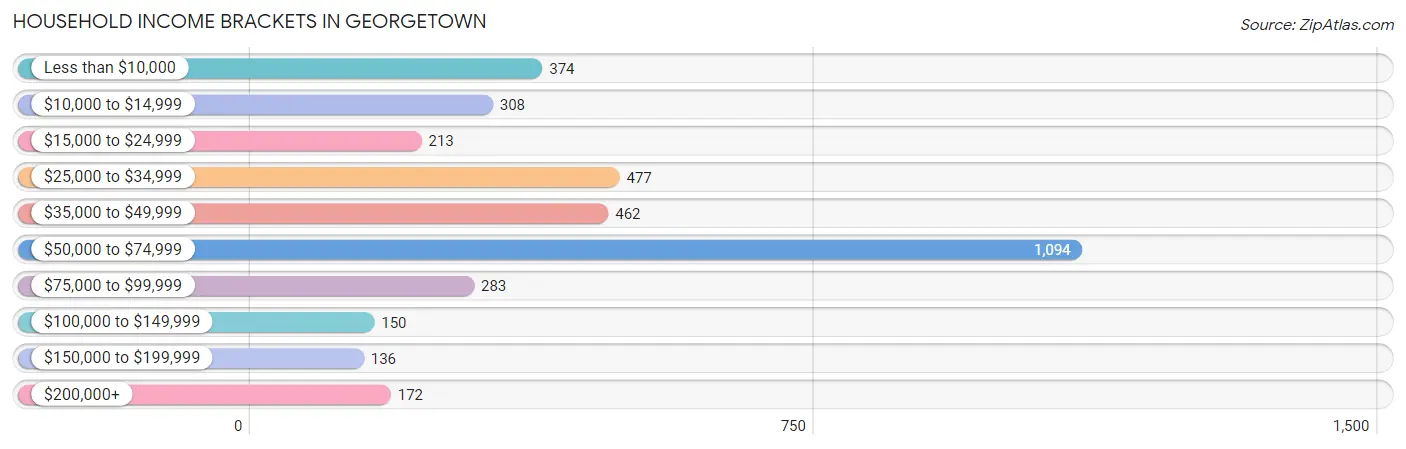
Household Income Brackets in Georgetown
With 1,094 households falling in the category, the $50,000 to $74,999 income range is the most frequent in Georgetown, accounting for 29.8% of all households. In contrast, only 136 households (3.7%) fall into the $150,000 to $199,999 income bracket, making it the least populous group.
| Income Bracket | # Households | % Households |
| Less than $10,000 | 374 | 10.2% |
| $10,000 to $14,999 | 308 | 8.4% |
| $15,000 to $24,999 | 213 | 5.8% |
| $25,000 to $34,999 | 477 | 13.0% |
| $35,000 to $49,999 | 462 | 12.6% |
| $50,000 to $74,999 | 1,094 | 29.8% |
| $75,000 to $99,999 | 283 | 7.7% |
| $100,000 to $149,999 | 150 | 4.1% |
| $150,000 to $199,999 | 136 | 3.7% |
| $200,000+ | 172 | 4.7% |
Household Income by Householder Age in Georgetown
The median household income in Georgetown is $50,000, with the highest median household income of $51,708 found in the 25 to 44 years age bracket for the primary householder. A total of 751 households (20.5%) fall into this category. Meanwhile, the 15 to 24 years age bracket for the primary householder has the lowest median household income of $0, with 108 households (2.9%) in this group.
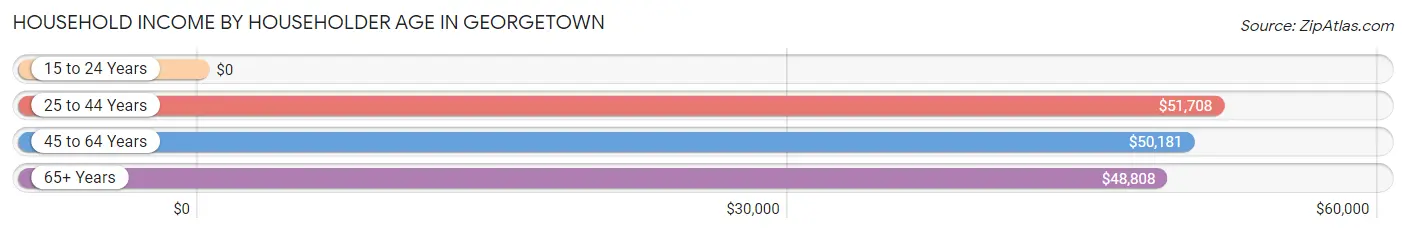
| Income Bracket | # Households | Median Income |
| 15 to 24 Years | 108 (2.9%) | $0 |
| 25 to 44 Years | 751 (20.5%) | $51,708 |
| 45 to 64 Years | 1,574 (42.9%) | $50,181 |
| 65+ Years | 1,237 (33.7%) | $48,808 |
| Total | 3,670 (100.0%) | $50,000 |
Poverty in Georgetown
Income Below Poverty by Sex and Age in Georgetown
With 19.2% poverty level for males and 12.6% for females among the residents of Georgetown, 25 to 34 year old males and 75 year old and over females are the most vulnerable to poverty, with 252 males (45.6%) and 121 females (23.5%) in their respective age groups living below the poverty level.
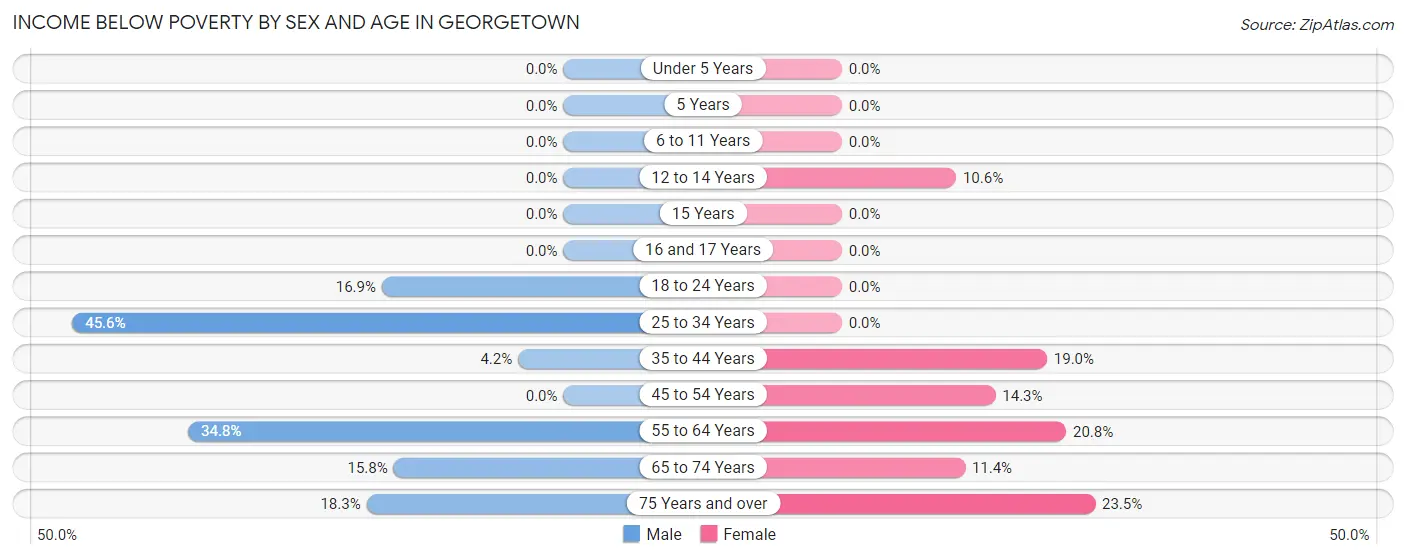
| Age Bracket | Male | Female |
| Under 5 Years | 0 (0.0%) | 0 (0.0%) |
| 5 Years | 0 (0.0%) | 0 (0.0%) |
| 6 to 11 Years | 0 (0.0%) | 0 (0.0%) |
| 12 to 14 Years | 0 (0.0%) | 16 (10.6%) |
| 15 Years | 0 (0.0%) | 0 (0.0%) |
| 16 and 17 Years | 0 (0.0%) | 0 (0.0%) |
| 18 to 24 Years | 62 (16.9%) | 0 (0.0%) |
| 25 to 34 Years | 252 (45.6%) | 0 (0.0%) |
| 35 to 44 Years | 15 (4.2%) | 122 (19.0%) |
| 45 to 54 Years | 0 (0.0%) | 52 (14.2%) |
| 55 to 64 Years | 250 (34.8%) | 170 (20.8%) |
| 65 to 74 Years | 87 (15.8%) | 84 (11.4%) |
| 75 Years and over | 36 (18.3%) | 121 (23.5%) |
| Total | 702 (19.2%) | 565 (12.6%) |
Income Above Poverty by Sex and Age in Georgetown
According to the poverty statistics in Georgetown, males aged under 5 years and females aged under 5 years are the age groups that are most secure financially, with 100.0% of males and 100.0% of females in these age groups living above the poverty line.
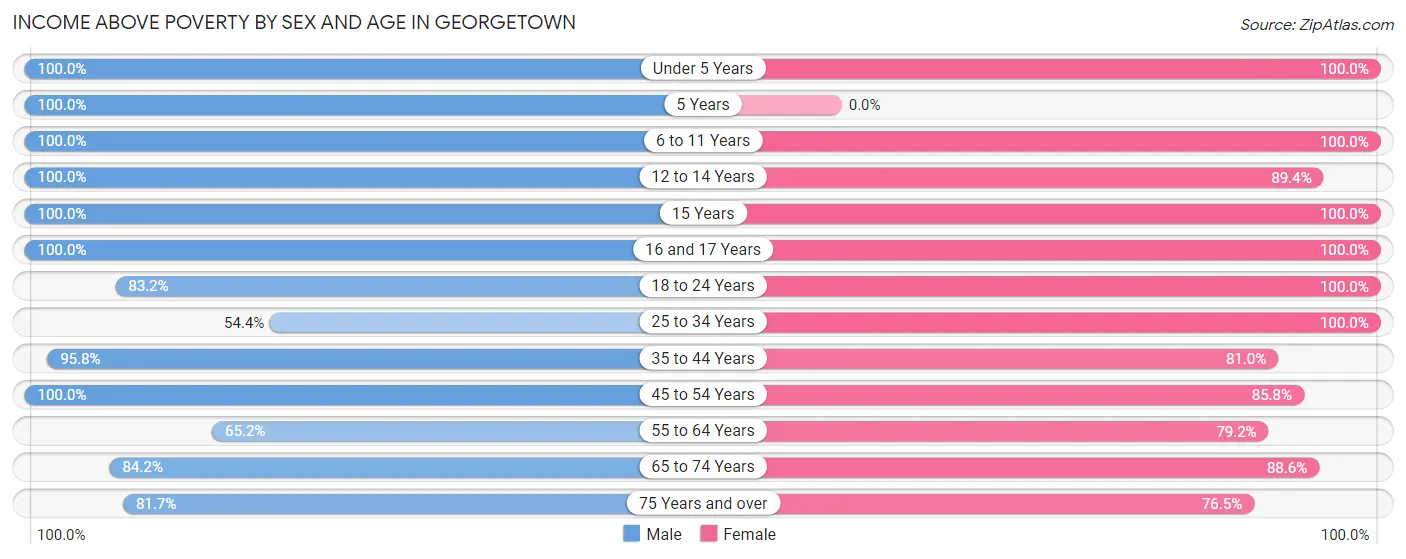
| Age Bracket | Male | Female |
| Under 5 Years | 12 (100.0%) | 149 (100.0%) |
| 5 Years | 29 (100.0%) | 0 (0.0%) |
| 6 to 11 Years | 128 (100.0%) | 306 (100.0%) |
| 12 to 14 Years | 87 (100.0%) | 135 (89.4%) |
| 15 Years | 65 (100.0%) | 77 (100.0%) |
| 16 and 17 Years | 137 (100.0%) | 83 (100.0%) |
| 18 to 24 Years | 306 (83.2%) | 453 (100.0%) |
| 25 to 34 Years | 301 (54.4%) | 207 (100.0%) |
| 35 to 44 Years | 342 (95.8%) | 519 (81.0%) |
| 45 to 54 Years | 459 (100.0%) | 313 (85.8%) |
| 55 to 64 Years | 468 (65.2%) | 647 (79.2%) |
| 65 to 74 Years | 465 (84.2%) | 651 (88.6%) |
| 75 Years and over | 161 (81.7%) | 394 (76.5%) |
| Total | 2,960 (80.8%) | 3,934 (87.4%) |
Income Below Poverty Among Married-Couple Families in Georgetown
The poverty statistics for married-couple families in Georgetown show that 4.6% or 68 of the total 1,485 families live below the poverty line. Families with no children have the highest poverty rate of 5.5%, comprising of 68 families. On the other hand, families with 1 or 2 children have the lowest poverty rate of 0.0%, which includes 0 families.
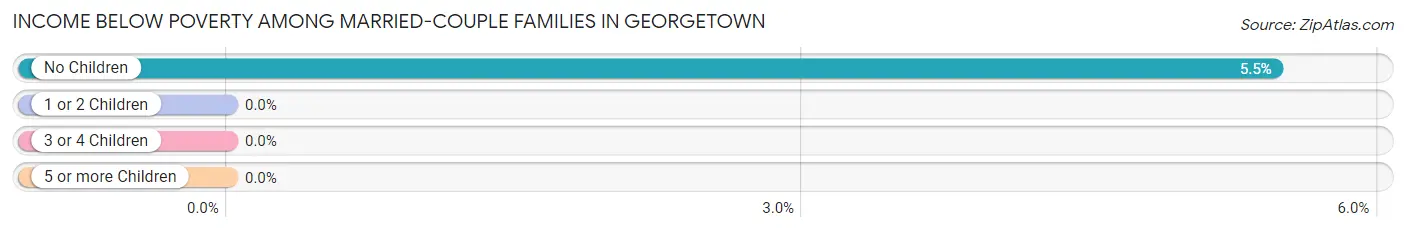
| Children | Above Poverty | Below Poverty |
| No Children | 1,177 (94.5%) | 68 (5.5%) |
| 1 or 2 Children | 197 (100.0%) | 0 (0.0%) |
| 3 or 4 Children | 28 (100.0%) | 0 (0.0%) |
| 5 or more Children | 15 (100.0%) | 0 (0.0%) |
| Total | 1,417 (95.4%) | 68 (4.6%) |
Income Below Poverty Among Single-Parent Households in Georgetown
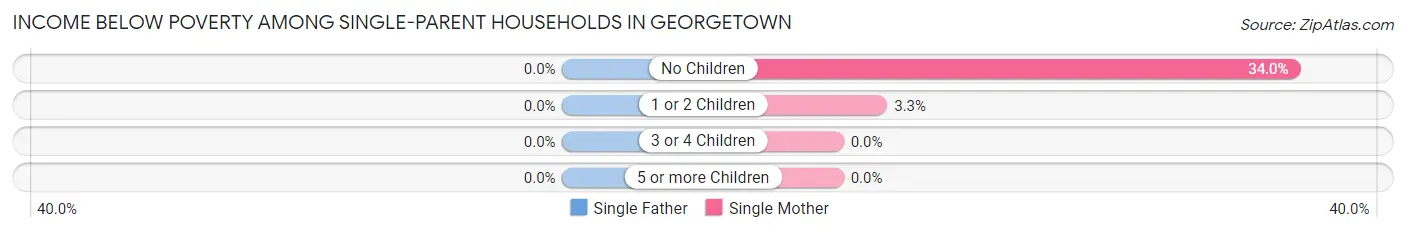
| Children | Single Father | Single Mother |
| No Children | 0 (0.0%) | 116 (34.0%) |
| 1 or 2 Children | 0 (0.0%) | 8 (3.3%) |
| 3 or 4 Children | 0 (0.0%) | 0 (0.0%) |
| 5 or more Children | 0 (0.0%) | 0 (0.0%) |
| Total | 0 (0.0%) | 124 (21.1%) |
Income Below Poverty Among Married-Couple vs Single-Parent Households in Georgetown
The poverty data for Georgetown shows that 68 of the married-couple family households (4.6%) and 124 of the single-parent households (14.7%) are living below the poverty level. Within the married-couple family households, those with no children have the highest poverty rate, with 68 households (5.5%) falling below the poverty line. Among the single-parent households, those with no children have the highest poverty rate, with 116 household (25.1%) living below poverty.
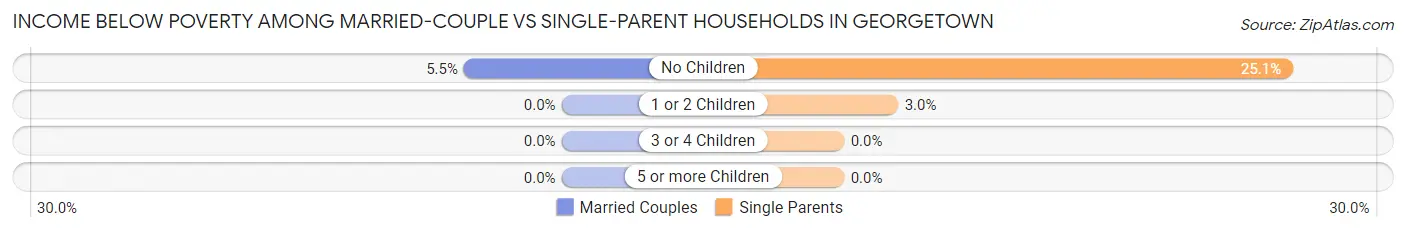
| Children | Married-Couple Families | Single-Parent Households |
| No Children | 68 (5.5%) | 116 (25.1%) |
| 1 or 2 Children | 0 (0.0%) | 8 (3.0%) |
| 3 or 4 Children | 0 (0.0%) | 0 (0.0%) |
| 5 or more Children | 0 (0.0%) | 0 (0.0%) |
| Total | 68 (4.6%) | 124 (14.7%) |
Race in Georgetown
The most populous races in Georgetown are Black / African American (4,348 | 51.4%), White / Caucasian (3,823 | 45.2%), and Hispanic or Latino (191 | 2.3%).
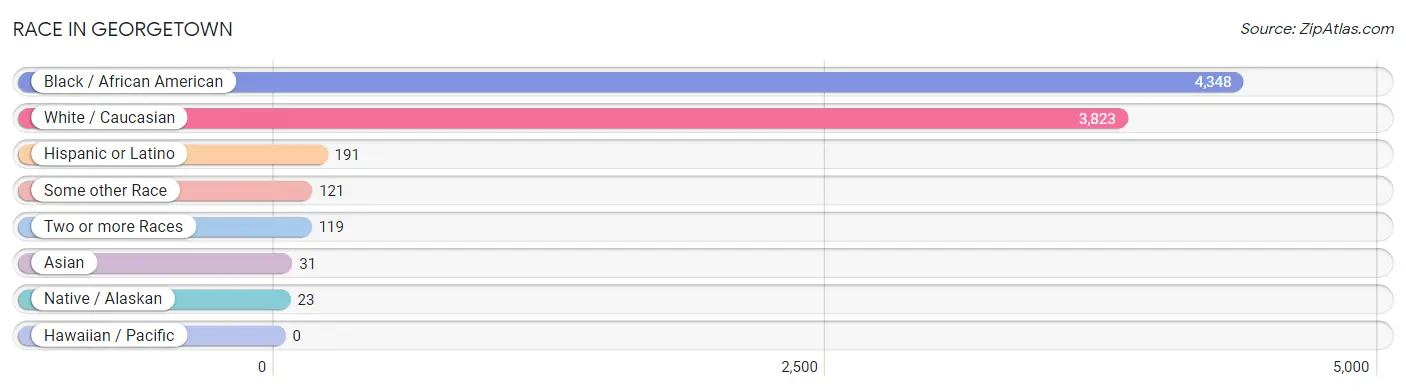
| Race | # Population | % Population |
| Asian | 31 | 0.4% |
| Black / African American | 4,348 | 51.4% |
| Hawaiian / Pacific | 0 | 0.0% |
| Hispanic or Latino | 191 | 2.3% |
| Native / Alaskan | 23 | 0.3% |
| White / Caucasian | 3,823 | 45.2% |
| Two or more Races | 119 | 1.4% |
| Some other Race | 121 | 1.4% |
| Total | 8,465 | 100.0% |
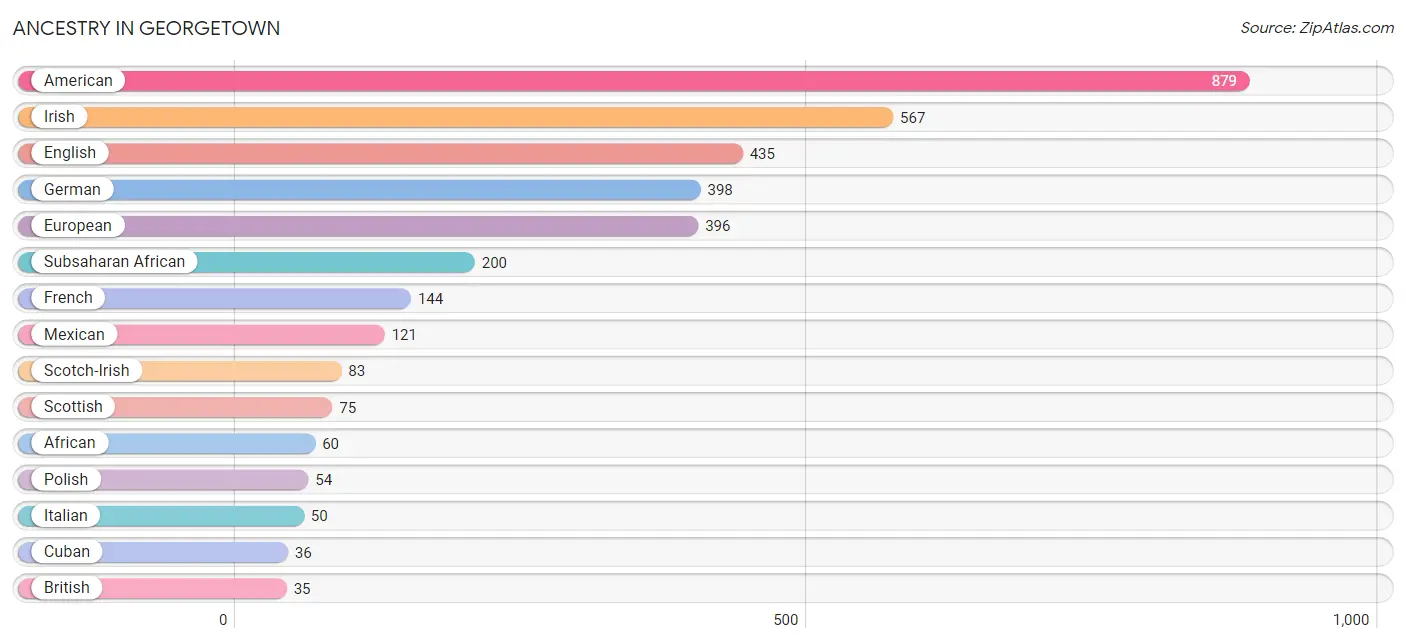
Ancestry in Georgetown
The most populous ancestries reported in Georgetown are American (879 | 10.4%), Irish (567 | 6.7%), English (435 | 5.1%), German (398 | 4.7%), and European (396 | 4.7%), together accounting for 31.6% of all Georgetown residents.
| Ancestry | # Population | % Population |
| African | 60 | 0.7% |
| American | 879 | 10.4% |
| Arab | 21 | 0.3% |
| Austrian | 12 | 0.1% |
| British | 35 | 0.4% |
| Cherokee | 1 | 0.0% |
| Cuban | 36 | 0.4% |
| Czechoslovakian | 10 | 0.1% |
| Dominican | 1 | 0.0% |
| English | 435 | 5.1% |
| European | 396 | 4.7% |
| French | 144 | 1.7% |
| French Canadian | 10 | 0.1% |
| German | 398 | 4.7% |
| Greek | 5 | 0.1% |
| Haitian | 22 | 0.3% |
| Irish | 567 | 6.7% |
| Italian | 50 | 0.6% |
| Korean | 31 | 0.4% |
| Lebanese | 21 | 0.3% |
| Lumbee | 13 | 0.2% |
| Mexican | 121 | 1.4% |
| Northern European | 16 | 0.2% |
| Norwegian | 20 | 0.2% |
| Ottawa | 23 | 0.3% |
| Polish | 54 | 0.6% |
| Romanian | 15 | 0.2% |
| Russian | 10 | 0.1% |
| Scandinavian | 25 | 0.3% |
| Scotch-Irish | 83 | 1.0% |
| Scottish | 75 | 0.9% |
| South American | 33 | 0.4% |
| Subsaharan African | 200 | 2.4% |
| Swedish | 23 | 0.3% |
| Swiss | 10 | 0.1% |
| Ukrainian | 18 | 0.2% |
| Venezuelan | 33 | 0.4% |
| Welsh | 26 | 0.3% | View All 38 Rows |
Immigrants in Georgetown
The most numerous immigrant groups reported in Georgetown came from Latin America (161 | 1.9%), Africa (140 | 1.7%), Cameroon (140 | 1.7%), Middle Africa (140 | 1.7%), and Central America (106 | 1.3%), together accounting for 8.1% of all Georgetown residents.
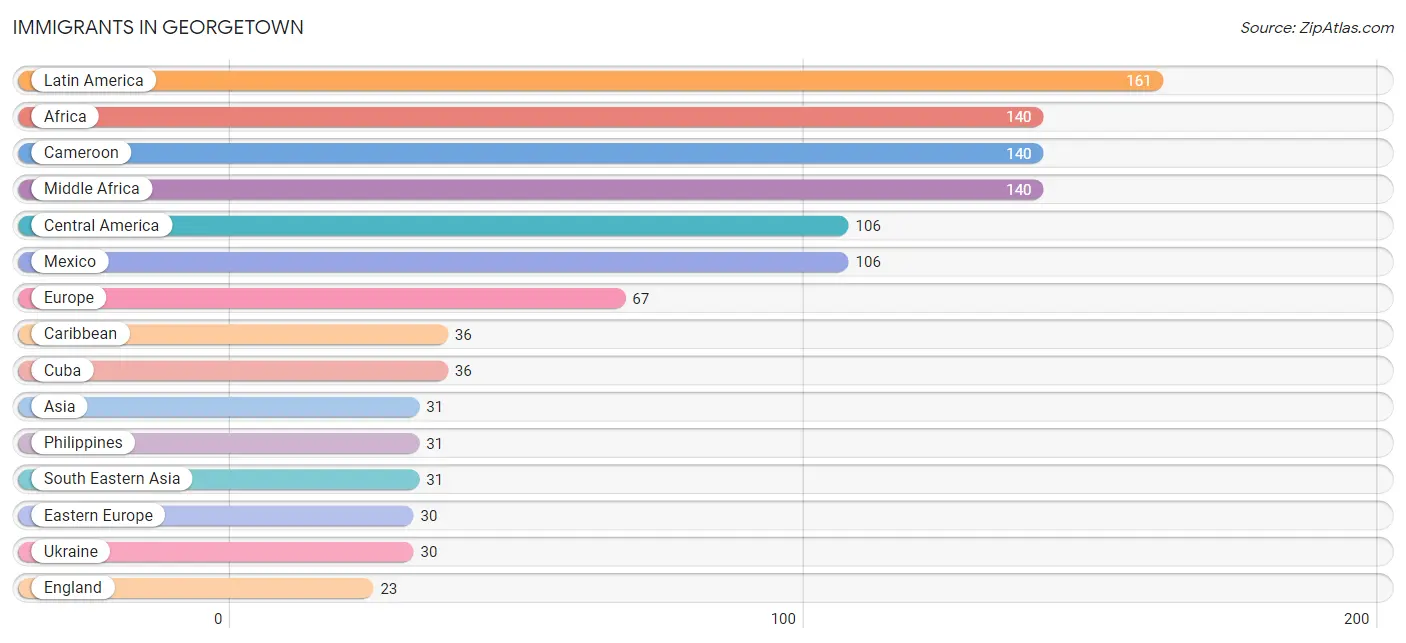
| Immigration Origin | # Population | % Population |
| Africa | 140 | 1.7% |
| Asia | 31 | 0.4% |
| Cameroon | 140 | 1.7% |
| Caribbean | 36 | 0.4% |
| Central America | 106 | 1.3% |
| Cuba | 36 | 0.4% |
| Eastern Europe | 30 | 0.4% |
| England | 23 | 0.3% |
| Europe | 67 | 0.8% |
| Germany | 14 | 0.2% |
| Latin America | 161 | 1.9% |
| Mexico | 106 | 1.3% |
| Middle Africa | 140 | 1.7% |
| Northern Europe | 23 | 0.3% |
| Philippines | 31 | 0.4% |
| South America | 19 | 0.2% |
| South Eastern Asia | 31 | 0.4% |
| Ukraine | 30 | 0.4% |
| Venezuela | 19 | 0.2% |
| Western Europe | 14 | 0.2% | View All 20 Rows |
Sex and Age in Georgetown
Sex and Age in Georgetown
The most populous age groups in Georgetown are 60 to 64 Years (537 | 14.1%) for men and 65 to 69 Years (558 | 12.0%) for women.
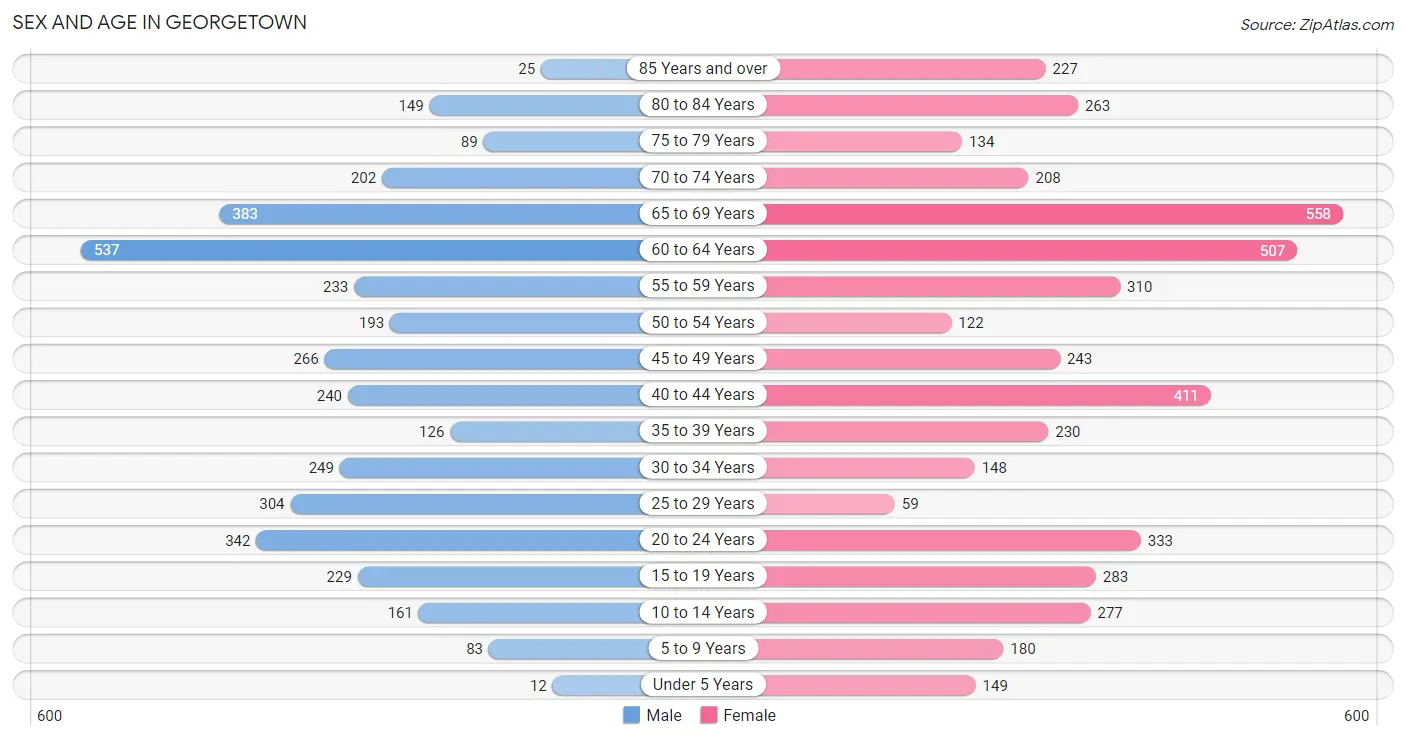
| Age Bracket | Male | Female |
| Under 5 Years | 12 (0.3%) | 149 (3.2%) |
| 5 to 9 Years | 83 (2.2%) | 180 (3.9%) |
| 10 to 14 Years | 161 (4.2%) | 277 (6.0%) |
| 15 to 19 Years | 229 (6.0%) | 283 (6.1%) |
| 20 to 24 Years | 342 (8.9%) | 333 (7.2%) |
| 25 to 29 Years | 304 (8.0%) | 59 (1.3%) |
| 30 to 34 Years | 249 (6.5%) | 148 (3.2%) |
| 35 to 39 Years | 126 (3.3%) | 230 (5.0%) |
| 40 to 44 Years | 240 (6.3%) | 411 (8.8%) |
| 45 to 49 Years | 266 (7.0%) | 243 (5.2%) |
| 50 to 54 Years | 193 (5.1%) | 122 (2.6%) |
| 55 to 59 Years | 233 (6.1%) | 310 (6.7%) |
| 60 to 64 Years | 537 (14.1%) | 507 (10.9%) |
| 65 to 69 Years | 383 (10.0%) | 558 (12.0%) |
| 70 to 74 Years | 202 (5.3%) | 208 (4.5%) |
| 75 to 79 Years | 89 (2.3%) | 134 (2.9%) |
| 80 to 84 Years | 149 (3.9%) | 263 (5.7%) |
| 85 Years and over | 25 (0.6%) | 227 (4.9%) |
| Total | 3,823 (100.0%) | 4,642 (100.0%) |
Families and Households in Georgetown
Median Family Size in Georgetown
The median family size in Georgetown is 2.84 persons per family, with single male/father families (255 | 11.0%) accounting for the largest median family size of 3.71 persons per family. On the other hand, married-couple families (1,485 | 63.8%) represent the smallest median family size with 2.60 persons per family.
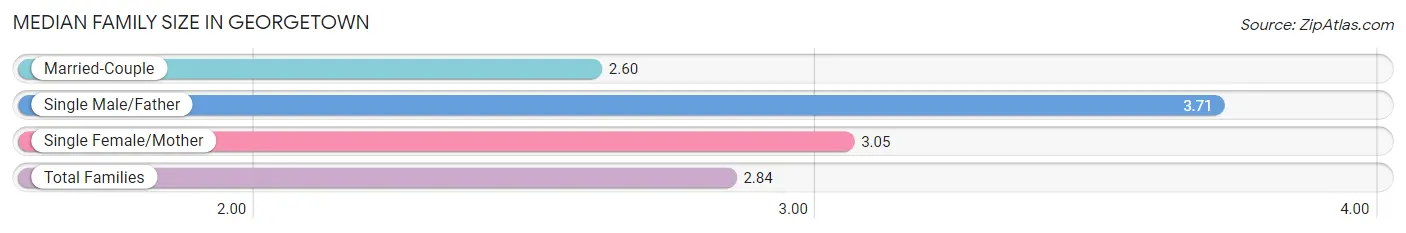
| Family Type | # Families | Family Size |
| Married-Couple | 1,485 (63.8%) | 2.60 |
| Single Male/Father | 255 (11.0%) | 3.71 |
| Single Female/Mother | 587 (25.2%) | 3.05 |
| Total Families | 2,327 (100.0%) | 2.84 |
Median Household Size in Georgetown
The median household size in Georgetown is 2.22 persons per household, with single male/father households (255 | 7.0%) accounting for the largest median household size of 3.95 persons per household. non-family households (1,343 | 36.6%) represent the smallest median household size with 1.05 persons per household.
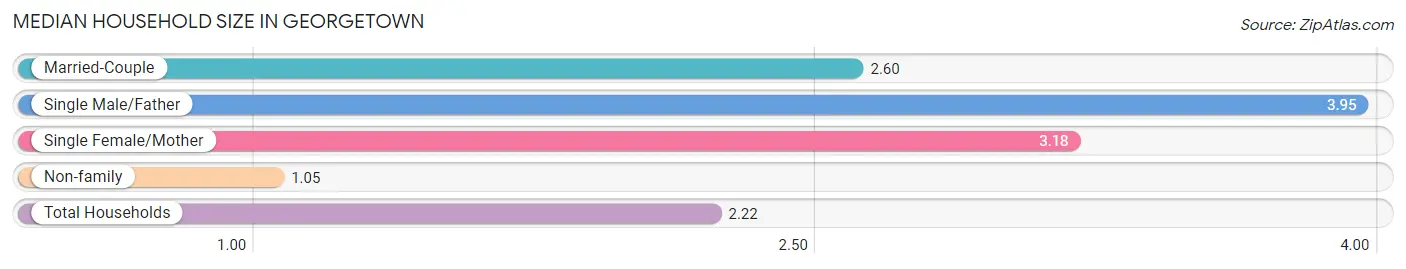
| Household Type | # Households | Household Size |
| Married-Couple | 1,485 (40.5%) | 2.60 |
| Single Male/Father | 255 (7.0%) | 3.95 |
| Single Female/Mother | 587 (16.0%) | 3.18 |
| Non-family | 1,343 (36.6%) | 1.05 |
| Total Households | 3,670 (100.0%) | 2.22 |
Household Size by Marriage Status in Georgetown
Out of a total of 3,670 households in Georgetown, 2,327 (63.4%) are family households, while 1,343 (36.6%) are nonfamily households. The most numerous type of family households are 2-person households, comprising 1,428, and the most common type of nonfamily households are 1-person households, comprising 1,283.
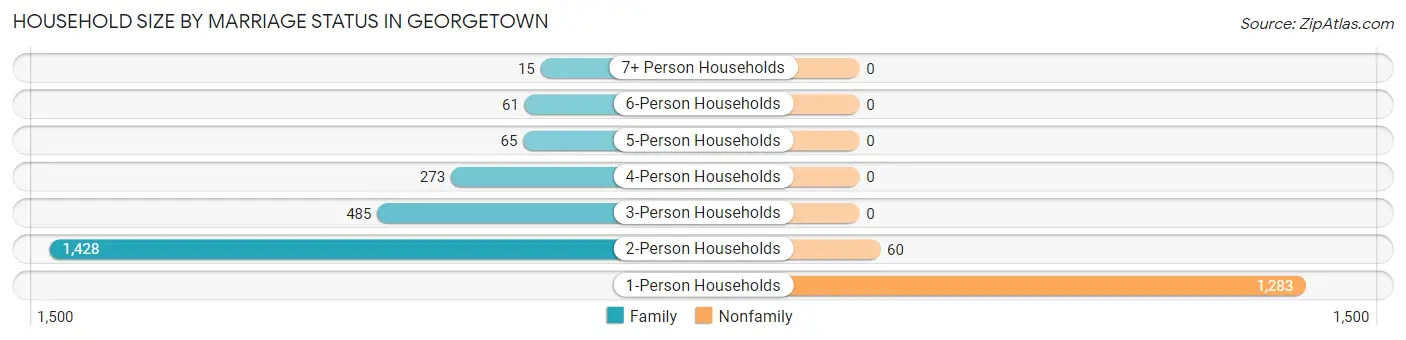
| Household Size | Family Households | Nonfamily Households |
| 1-Person Households | - | 1,283 (35.0%) |
| 2-Person Households | 1,428 (38.9%) | 60 (1.6%) |
| 3-Person Households | 485 (13.2%) | 0 (0.0%) |
| 4-Person Households | 273 (7.4%) | 0 (0.0%) |
| 5-Person Households | 65 (1.8%) | 0 (0.0%) |
| 6-Person Households | 61 (1.7%) | 0 (0.0%) |
| 7+ Person Households | 15 (0.4%) | 0 (0.0%) |
| Total | 2,327 (63.4%) | 1,343 (36.6%) |
Female Fertility in Georgetown
Fertility by Age in Georgetown
Average fertility rate in Georgetown is 32.0 births per 1,000 women. Women in the age bracket of 20 to 34 years have the highest fertility rate with 102.0 births per 1,000 women. Women in the age bracket of 20 to 34 years acount for 100.0% of all women with births.
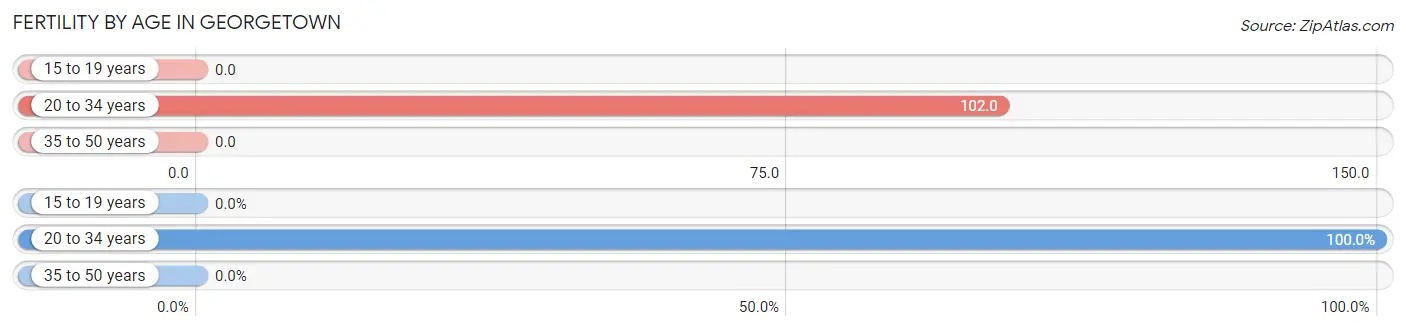
| Age Bracket | Women with Births | Births / 1,000 Women |
| 15 to 19 years | 0 (0.0%) | 0.0 |
| 20 to 34 years | 55 (100.0%) | 102.0 |
| 35 to 50 years | 0 (0.0%) | 0.0 |
| Total | 55 (100.0%) | 32.0 |
Fertility by Age by Marriage Status in Georgetown
16.4% of women with births (55) in Georgetown are married. The highest percentage of unmarried women with births falls into 20 to 34 years age bracket with 83.6% of them unmarried at the time of birth, while the lowest percentage of unmarried women with births belong to 20 to 34 years age bracket with 83.6% of them unmarried.
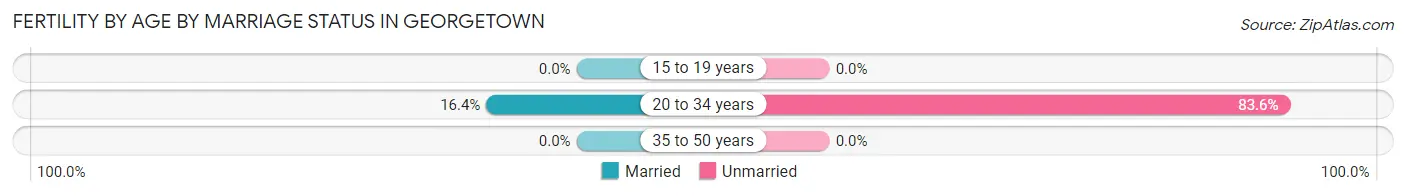
| Age Bracket | Married | Unmarried |
| 15 to 19 years | 0 (0.0%) | 0 (0.0%) |
| 20 to 34 years | 9 (16.4%) | 46 (83.6%) |
| 35 to 50 years | 0 (0.0%) | 0 (0.0%) |
| Total | 9 (16.4%) | 46 (83.6%) |
Fertility by Education in Georgetown
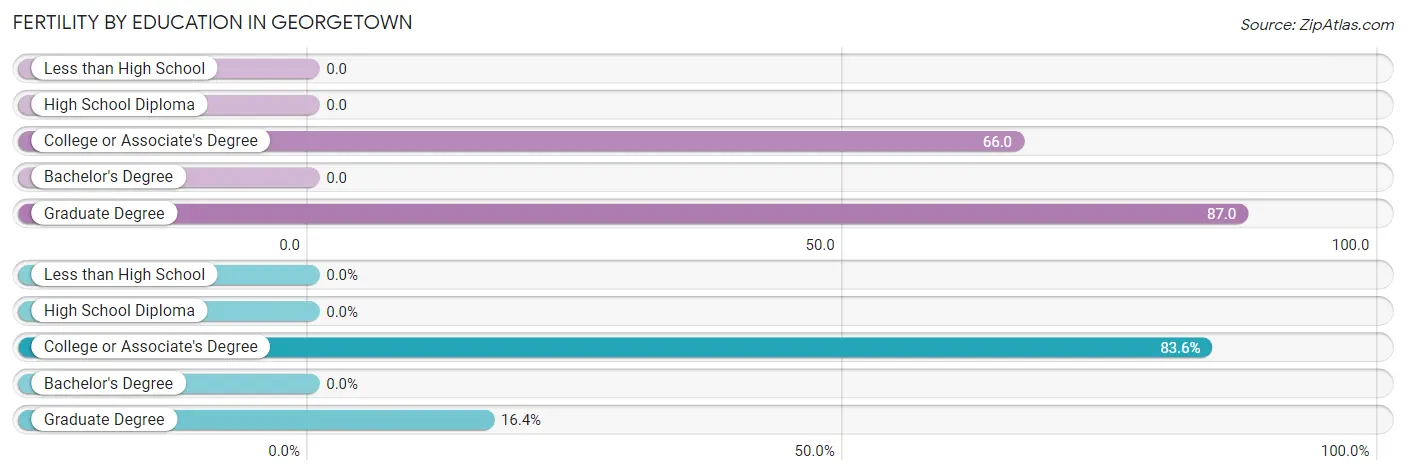
| Educational Attainment | Women with Births | Births / 1,000 Women |
| Less than High School | 0 (0.0%) | 0.0 |
| High School Diploma | 0 (0.0%) | 0.0 |
| College or Associate's Degree | 46 (83.6%) | 66.0 |
| Bachelor's Degree | 0 (0.0%) | 0.0 |
| Graduate Degree | 9 (16.4%) | 87.0 |
| Total | 55 (100.0%) | 32.0 |
Fertility by Education by Marriage Status in Georgetown
83.6% of women with births in Georgetown are unmarried. Women with the educational attainment of graduate degree are most likely to be married with 100.0% of them married at childbirth, while women with the educational attainment of college or associate's degree are least likely to be married with 100.0% of them unmarried at childbirth.
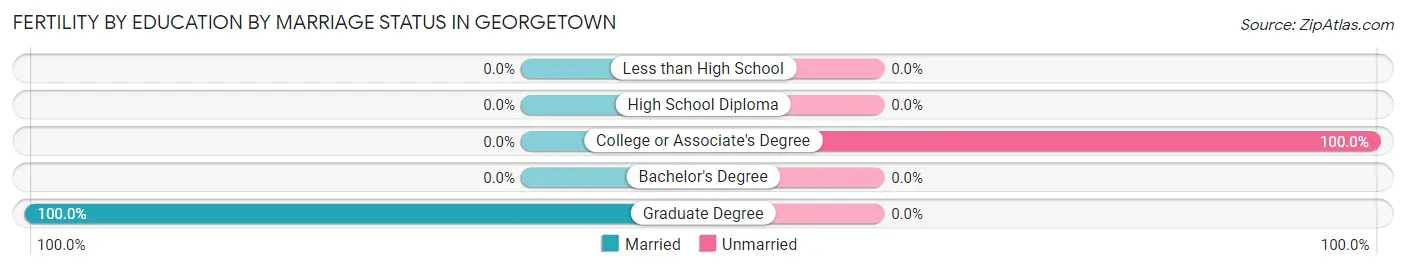
| Educational Attainment | Married | Unmarried |
| Less than High School | 0 (0.0%) | 0 (0.0%) |
| High School Diploma | 0 (0.0%) | 0 (0.0%) |
| College or Associate's Degree | 0 (0.0%) | 46 (100.0%) |
| Bachelor's Degree | 0 (0.0%) | 0 (0.0%) |
| Graduate Degree | 9 (100.0%) | 0 (0.0%) |
| Total | 9 (16.4%) | 46 (83.6%) |
Employment Characteristics in Georgetown
Employment by Class of Employer in Georgetown
Among the 3,688 employed individuals in Georgetown, private company employees (2,576 | 69.9%), not-for-profit organizations (403 | 10.9%), and self-employed (not incorporated) (251 | 6.8%) make up the most common classes of employment.
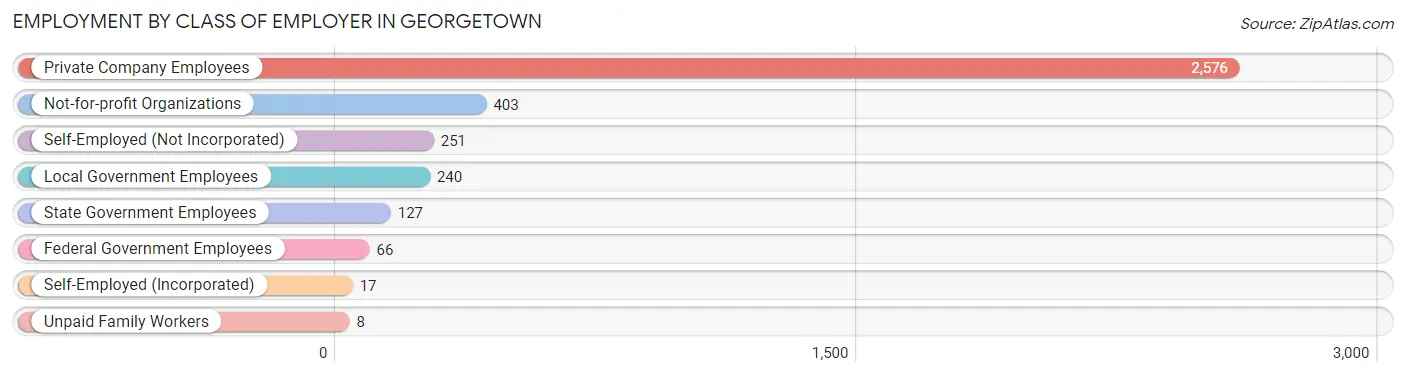
| Employer Class | # Employees | % Employees |
| Private Company Employees | 2,576 | 69.9% |
| Self-Employed (Incorporated) | 17 | 0.5% |
| Self-Employed (Not Incorporated) | 251 | 6.8% |
| Not-for-profit Organizations | 403 | 10.9% |
| Local Government Employees | 240 | 6.5% |
| State Government Employees | 127 | 3.4% |
| Federal Government Employees | 66 | 1.8% |
| Unpaid Family Workers | 8 | 0.2% |
| Total | 3,688 | 100.0% |
Employment Status by Age in Georgetown
According to the labor force statistics for Georgetown, out of the total population over 16 years of age (7,461), 54.9% or 4,096 individuals are in the labor force, with 9.2% or 377 of them unemployed. The age group with the highest labor force participation rate is 30 to 34 years, with 100.0% or 397 individuals in the labor force. Within the labor force, the 20 to 24 years age range has the highest percentage of unemployed individuals, with 32.0% or 188 of them being unemployed.
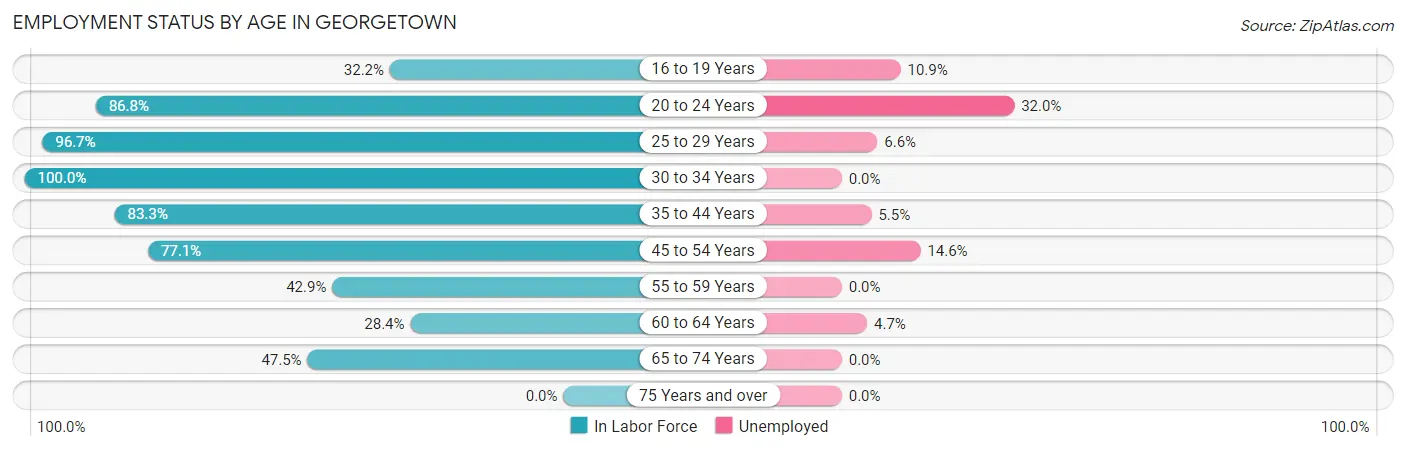
| Age Bracket | In Labor Force | Unemployed |
| 16 to 19 Years | 119 (32.2%) | 13 (10.9%) |
| 20 to 24 Years | 586 (86.8%) | 188 (32.0%) |
| 25 to 29 Years | 351 (96.7%) | 23 (6.6%) |
| 30 to 34 Years | 397 (100.0%) | 0 (0.0%) |
| 35 to 44 Years | 839 (83.3%) | 46 (5.5%) |
| 45 to 54 Years | 635 (77.1%) | 93 (14.6%) |
| 55 to 59 Years | 233 (42.9%) | 0 (0.0%) |
| 60 to 64 Years | 296 (28.4%) | 14 (4.7%) |
| 65 to 74 Years | 642 (47.5%) | 0 (0.0%) |
| 75 Years and over | 0 (0.0%) | 0 (0.0%) |
| Total | 4,096 (54.9%) | 377 (9.2%) |
Employment Status by Educational Attainment in Georgetown
According to labor force statistics for Georgetown, 65.9% of individuals (2,753) out of the total population between 25 and 64 years of age (4,178) are in the labor force, with 6.4% or 176 of them being unemployed. The group with the highest labor force participation rate are those with the educational attainment of bachelor's degree or higher, with 84.6% or 986 individuals in the labor force. Within the labor force, individuals with college / associate degree education have the highest percentage of unemployment, with 12.0% or 121 of them being unemployed.
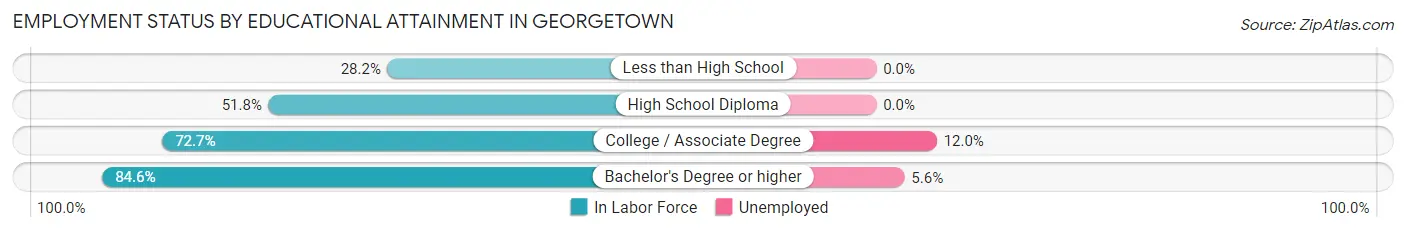
| Educational Attainment | In Labor Force | Unemployed |
| Less than High School | 101 (28.2%) | 0 (0.0%) |
| High School Diploma | 655 (51.8%) | 0 (0.0%) |
| College / Associate Degree | 1,011 (72.7%) | 167 (12.0%) |
| Bachelor's Degree or higher | 986 (84.6%) | 65 (5.6%) |
| Total | 2,753 (65.9%) | 267 (6.4%) |
Employment Occupations by Sex in Georgetown
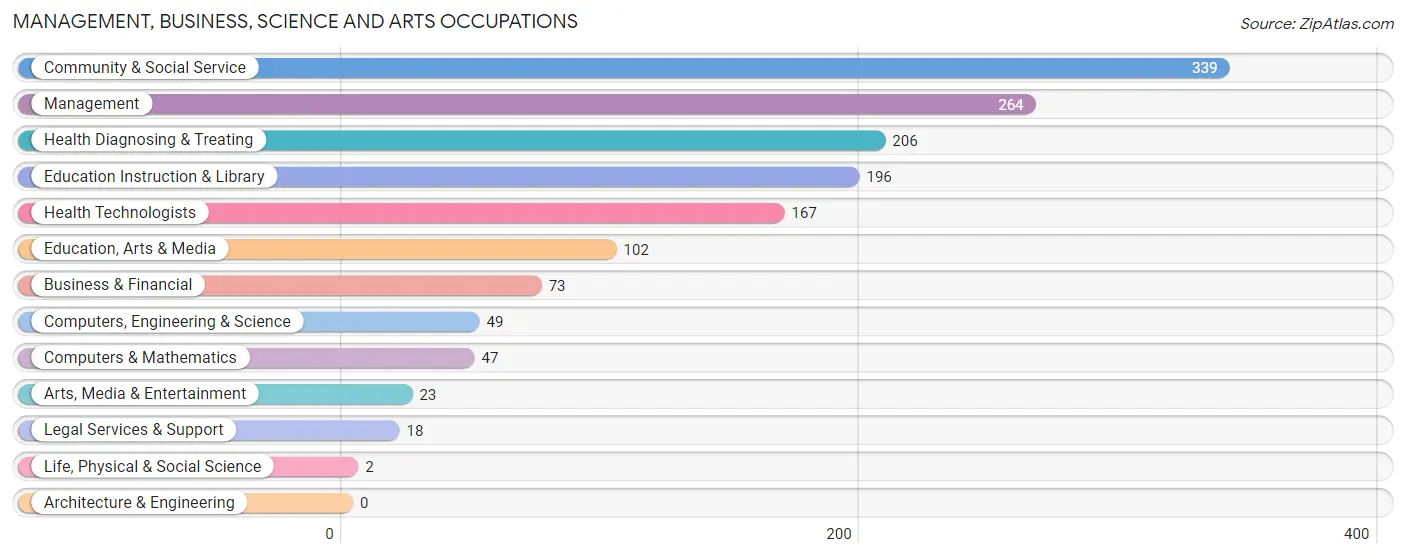
Management, Business, Science and Arts Occupations
The most common Management, Business, Science and Arts occupations in Georgetown are Community & Social Service (339 | 9.1%), Management (264 | 7.1%), Health Diagnosing & Treating (206 | 5.5%), Education Instruction & Library (196 | 5.3%), and Health Technologists (167 | 4.5%).
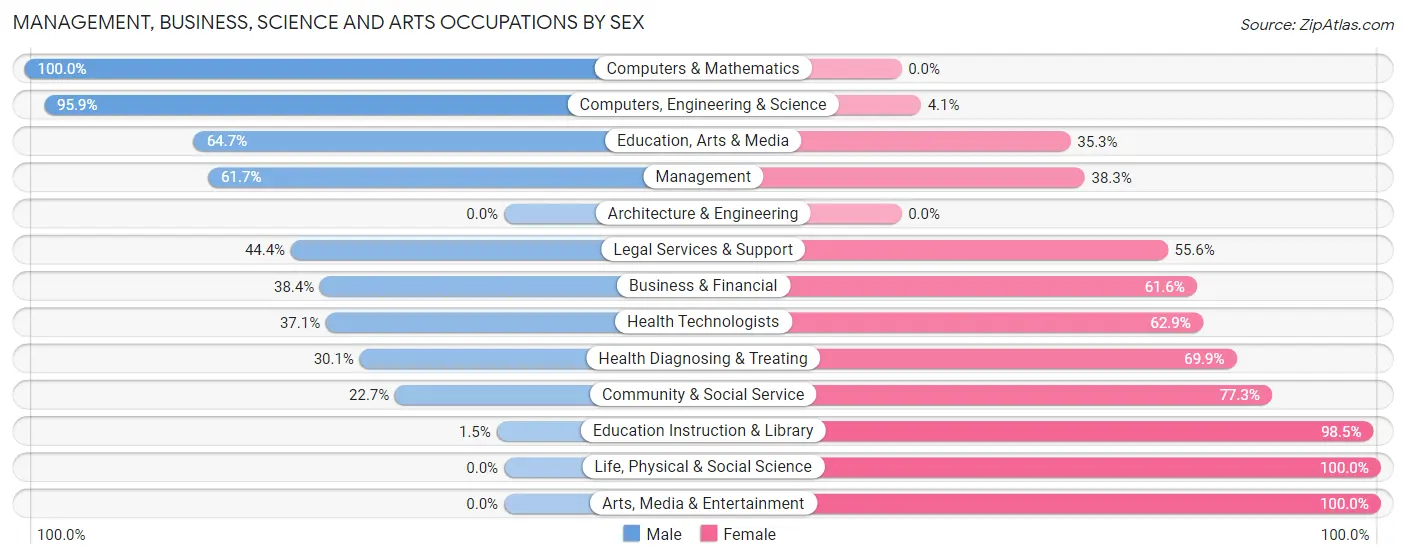
Management, Business, Science and Arts Occupations by Sex
Within the Management, Business, Science and Arts occupations in Georgetown, the most male-oriented occupations are Computers & Mathematics (100.0%), Computers, Engineering & Science (95.9%), and Education, Arts & Media (64.7%), while the most female-oriented occupations are Life, Physical & Social Science (100.0%), Arts, Media & Entertainment (100.0%), and Education Instruction & Library (98.5%).
| Occupation | Male | Female |
| Management | 163 (61.7%) | 101 (38.3%) |
| Business & Financial | 28 (38.4%) | 45 (61.6%) |
| Computers, Engineering & Science | 47 (95.9%) | 2 (4.1%) |
| Computers & Mathematics | 47 (100.0%) | 0 (0.0%) |
| Architecture & Engineering | 0 (0.0%) | 0 (0.0%) |
| Life, Physical & Social Science | 0 (0.0%) | 2 (100.0%) |
| Community & Social Service | 77 (22.7%) | 262 (77.3%) |
| Education, Arts & Media | 66 (64.7%) | 36 (35.3%) |
| Legal Services & Support | 8 (44.4%) | 10 (55.6%) |
| Education Instruction & Library | 3 (1.5%) | 193 (98.5%) |
| Arts, Media & Entertainment | 0 (0.0%) | 23 (100.0%) |
| Health Diagnosing & Treating | 62 (30.1%) | 144 (69.9%) |
| Health Technologists | 62 (37.1%) | 105 (62.9%) |
| Total (Category) | 377 (40.5%) | 554 (59.5%) |
| Total (Overall) | 2,039 (54.8%) | 1,683 (45.2%) |
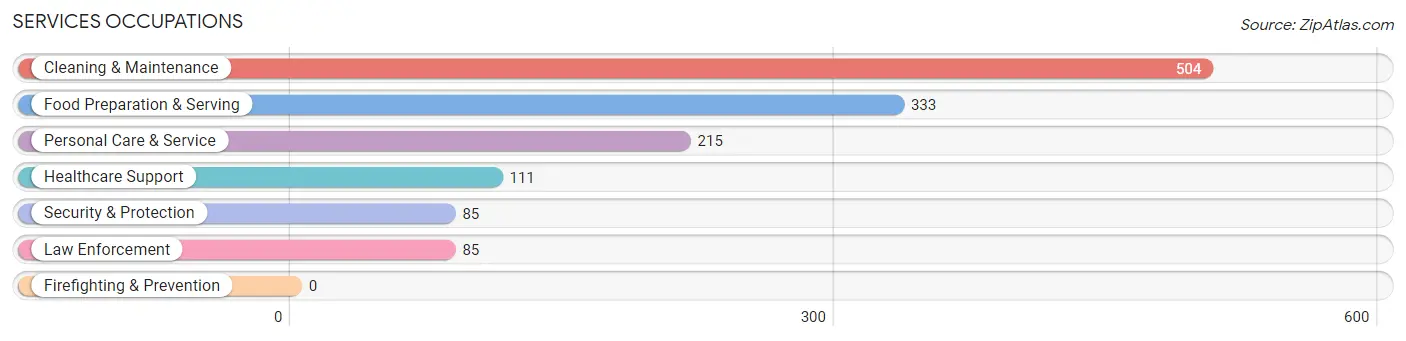
Services Occupations
The most common Services occupations in Georgetown are Cleaning & Maintenance (504 | 13.5%), Food Preparation & Serving (333 | 8.9%), Personal Care & Service (215 | 5.8%), Healthcare Support (111 | 3.0%), and Security & Protection (85 | 2.3%).
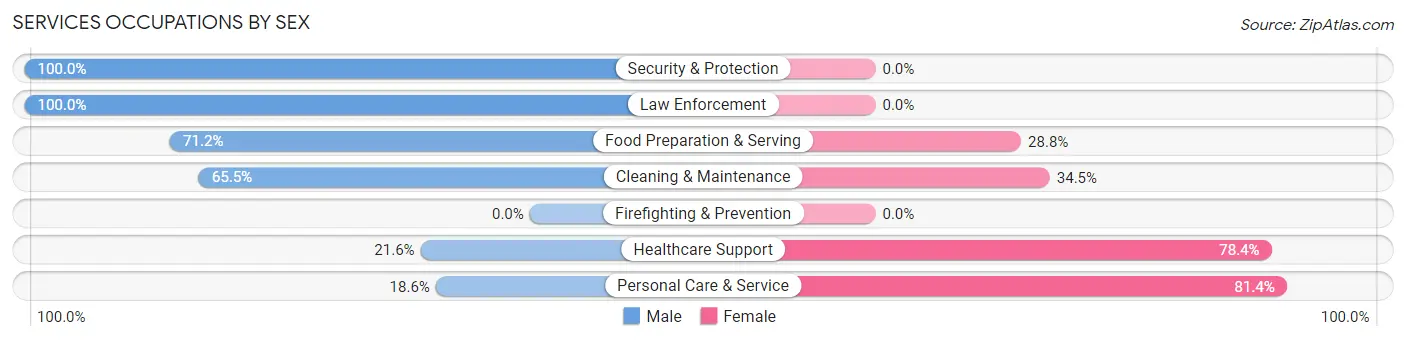
Services Occupations by Sex
Within the Services occupations in Georgetown, the most male-oriented occupations are Security & Protection (100.0%), Law Enforcement (100.0%), and Food Preparation & Serving (71.2%), while the most female-oriented occupations are Personal Care & Service (81.4%), Healthcare Support (78.4%), and Cleaning & Maintenance (34.5%).
| Occupation | Male | Female |
| Healthcare Support | 24 (21.6%) | 87 (78.4%) |
| Security & Protection | 85 (100.0%) | 0 (0.0%) |
| Firefighting & Prevention | 0 (0.0%) | 0 (0.0%) |
| Law Enforcement | 85 (100.0%) | 0 (0.0%) |
| Food Preparation & Serving | 237 (71.2%) | 96 (28.8%) |
| Cleaning & Maintenance | 330 (65.5%) | 174 (34.5%) |
| Personal Care & Service | 40 (18.6%) | 175 (81.4%) |
| Total (Category) | 716 (57.4%) | 532 (42.6%) |
| Total (Overall) | 2,039 (54.8%) | 1,683 (45.2%) |
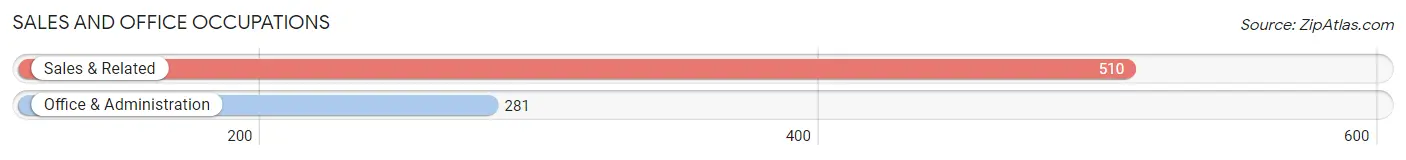
Sales and Office Occupations
The most common Sales and Office occupations in Georgetown are Sales & Related (510 | 13.7%), and Office & Administration (281 | 7.5%).
Sales and Office Occupations by Sex
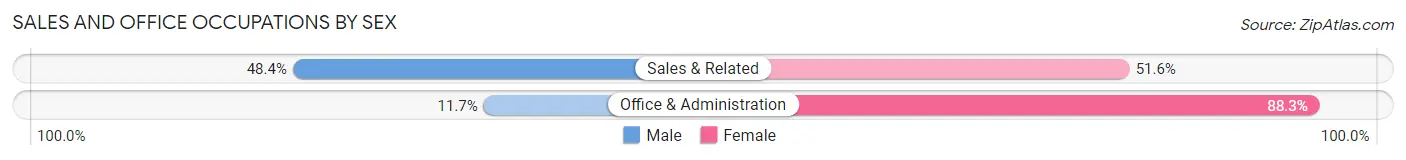
| Occupation | Male | Female |
| Sales & Related | 247 (48.4%) | 263 (51.6%) |
| Office & Administration | 33 (11.7%) | 248 (88.3%) |
| Total (Category) | 280 (35.4%) | 511 (64.6%) |
| Total (Overall) | 2,039 (54.8%) | 1,683 (45.2%) |
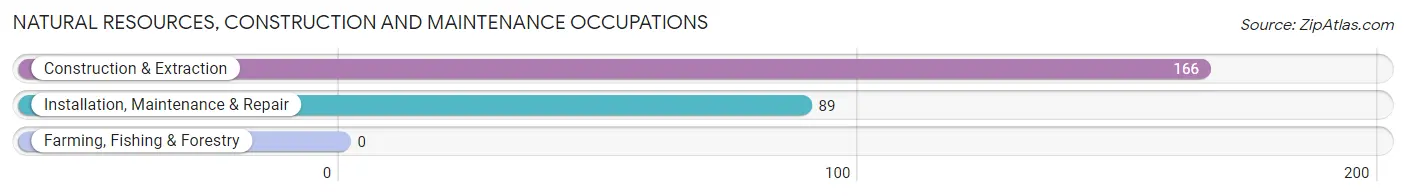
Natural Resources, Construction and Maintenance Occupations
The most common Natural Resources, Construction and Maintenance occupations in Georgetown are Construction & Extraction (166 | 4.5%), and Installation, Maintenance & Repair (89 | 2.4%).
Natural Resources, Construction and Maintenance Occupations by Sex
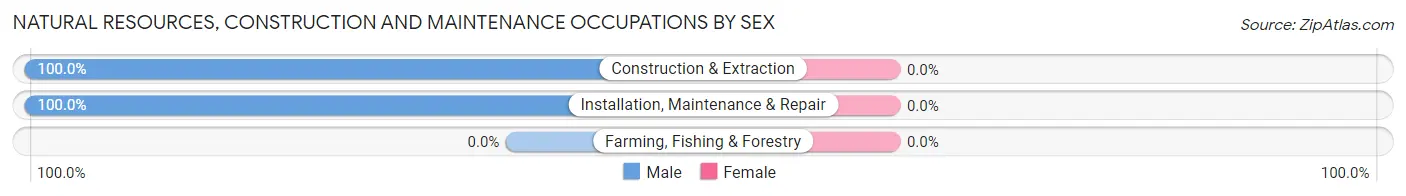
| Occupation | Male | Female |
| Farming, Fishing & Forestry | 0 (0.0%) | 0 (0.0%) |
| Construction & Extraction | 166 (100.0%) | 0 (0.0%) |
| Installation, Maintenance & Repair | 89 (100.0%) | 0 (0.0%) |
| Total (Category) | 255 (100.0%) | 0 (0.0%) |
| Total (Overall) | 2,039 (54.8%) | 1,683 (45.2%) |
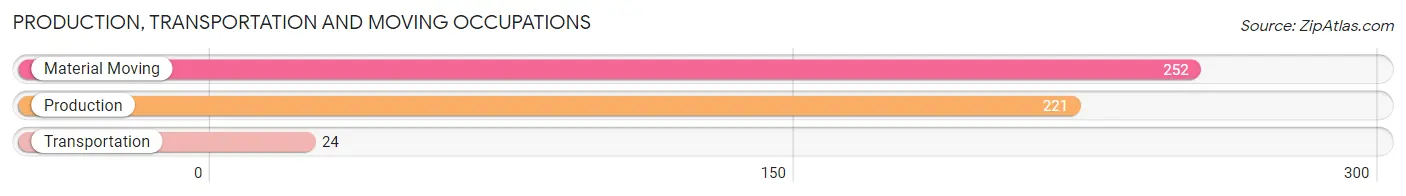
Production, Transportation and Moving Occupations
The most common Production, Transportation and Moving occupations in Georgetown are Material Moving (252 | 6.8%), Production (221 | 5.9%), and Transportation (24 | 0.6%).
Production, Transportation and Moving Occupations by Sex
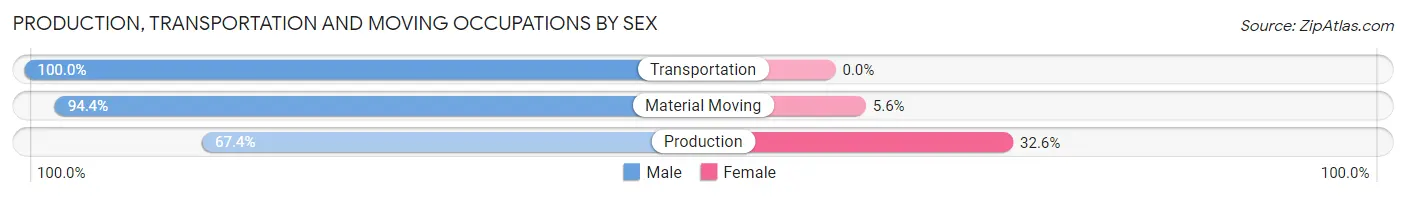
| Occupation | Male | Female |
| Production | 149 (67.4%) | 72 (32.6%) |
| Transportation | 24 (100.0%) | 0 (0.0%) |
| Material Moving | 238 (94.4%) | 14 (5.6%) |
| Total (Category) | 411 (82.7%) | 86 (17.3%) |
| Total (Overall) | 2,039 (54.8%) | 1,683 (45.2%) |
Employment Industries by Sex in Georgetown
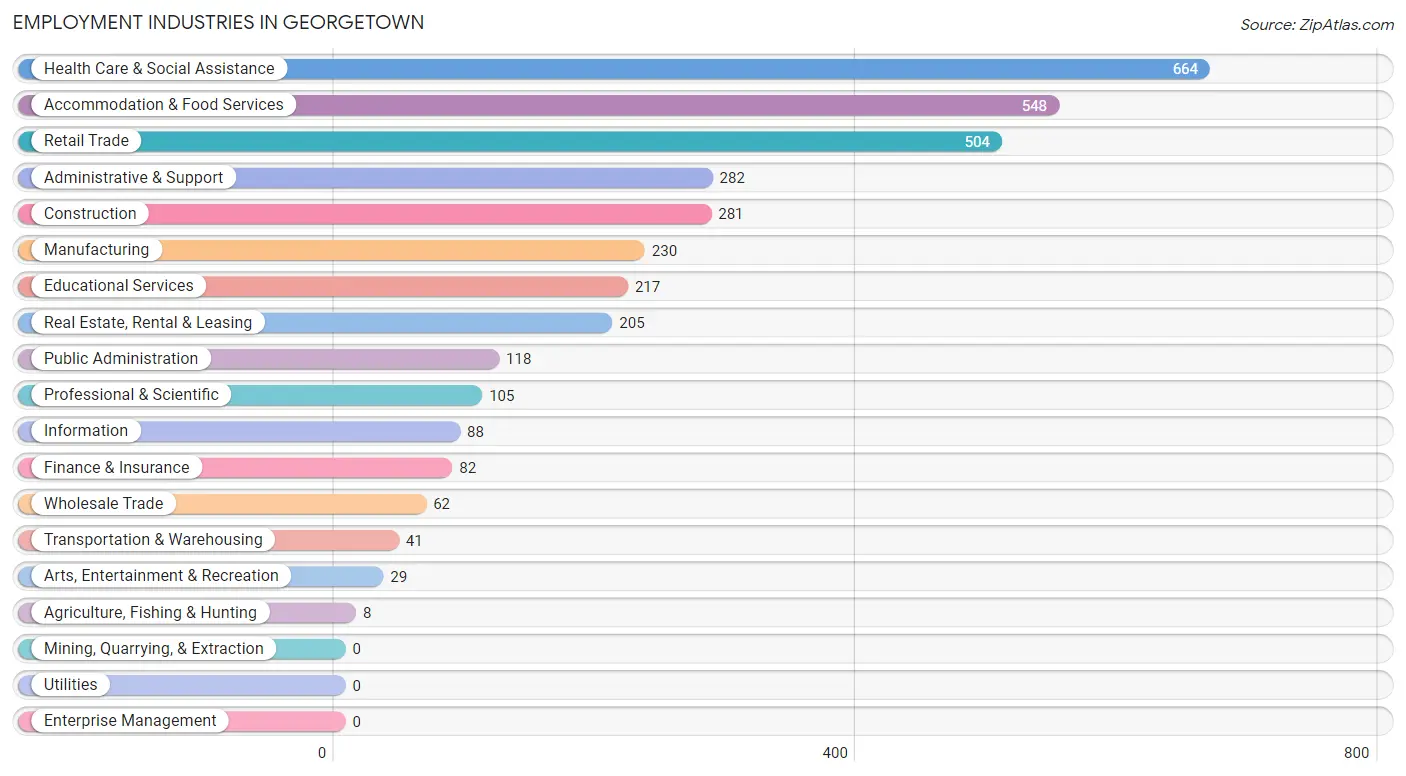
Employment Industries in Georgetown
The major employment industries in Georgetown include Health Care & Social Assistance (664 | 17.8%), Accommodation & Food Services (548 | 14.7%), Retail Trade (504 | 13.5%), Administrative & Support (282 | 7.6%), and Construction (281 | 7.5%).
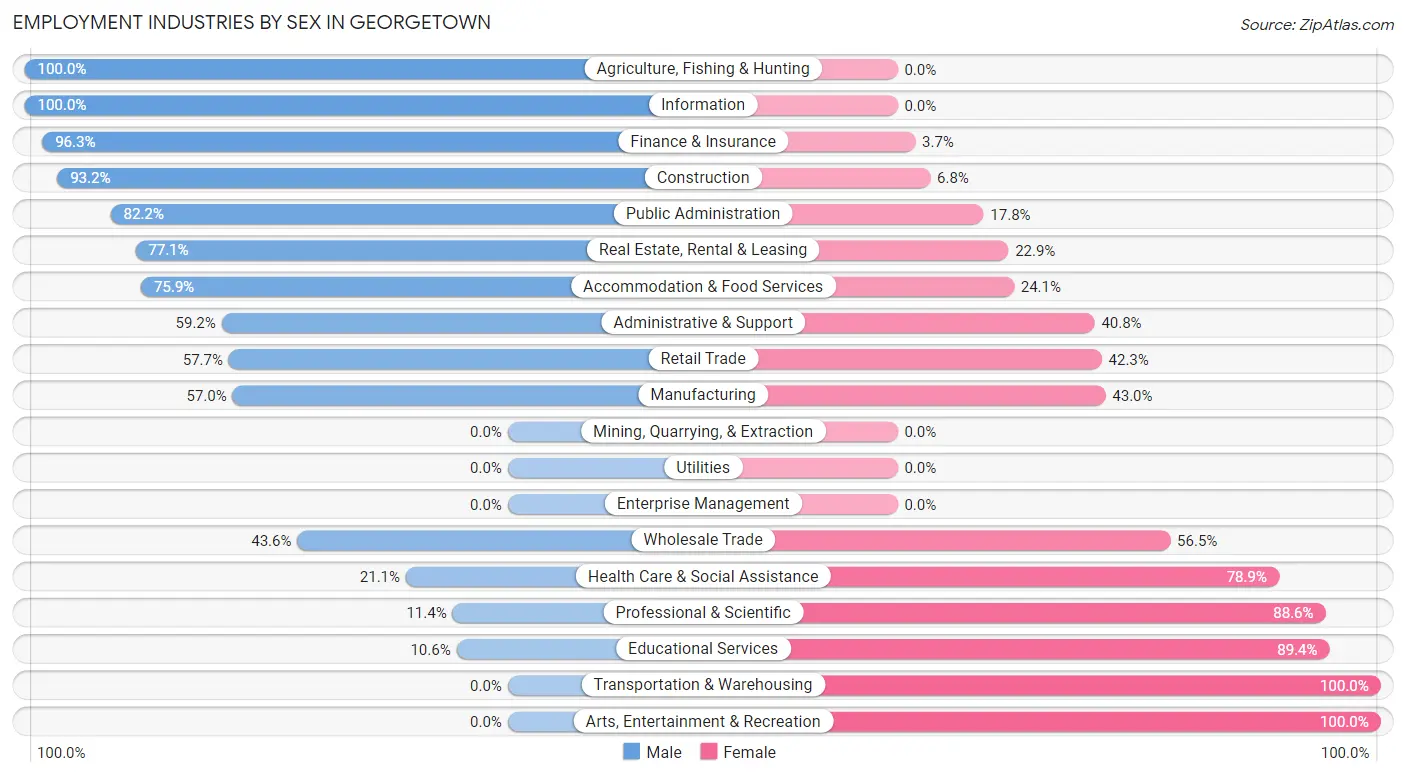
Employment Industries by Sex in Georgetown
The Georgetown industries that see more men than women are Agriculture, Fishing & Hunting (100.0%), Information (100.0%), and Finance & Insurance (96.3%), whereas the industries that tend to have a higher number of women are Transportation & Warehousing (100.0%), Arts, Entertainment & Recreation (100.0%), and Educational Services (89.4%).
| Industry | Male | Female |
| Agriculture, Fishing & Hunting | 8 (100.0%) | 0 (0.0%) |
| Mining, Quarrying, & Extraction | 0 (0.0%) | 0 (0.0%) |
| Construction | 262 (93.2%) | 19 (6.8%) |
| Manufacturing | 131 (57.0%) | 99 (43.0%) |
| Wholesale Trade | 27 (43.5%) | 35 (56.5%) |
| Retail Trade | 291 (57.7%) | 213 (42.3%) |
| Transportation & Warehousing | 0 (0.0%) | 41 (100.0%) |
| Utilities | 0 (0.0%) | 0 (0.0%) |
| Information | 88 (100.0%) | 0 (0.0%) |
| Finance & Insurance | 79 (96.3%) | 3 (3.7%) |
| Real Estate, Rental & Leasing | 158 (77.1%) | 47 (22.9%) |
| Professional & Scientific | 12 (11.4%) | 93 (88.6%) |
| Enterprise Management | 0 (0.0%) | 0 (0.0%) |
| Administrative & Support | 167 (59.2%) | 115 (40.8%) |
| Educational Services | 23 (10.6%) | 194 (89.4%) |
| Health Care & Social Assistance | 140 (21.1%) | 524 (78.9%) |
| Arts, Entertainment & Recreation | 0 (0.0%) | 29 (100.0%) |
| Accommodation & Food Services | 416 (75.9%) | 132 (24.1%) |
| Public Administration | 97 (82.2%) | 21 (17.8%) |
| Total | 2,039 (54.8%) | 1,683 (45.2%) |
Education in Georgetown
School Enrollment in Georgetown
The most common levels of schooling among the 1,462 students in Georgetown are high school (482 | 33.0%), middle school (376 | 25.7%), and college / undergraduate (239 | 16.4%).
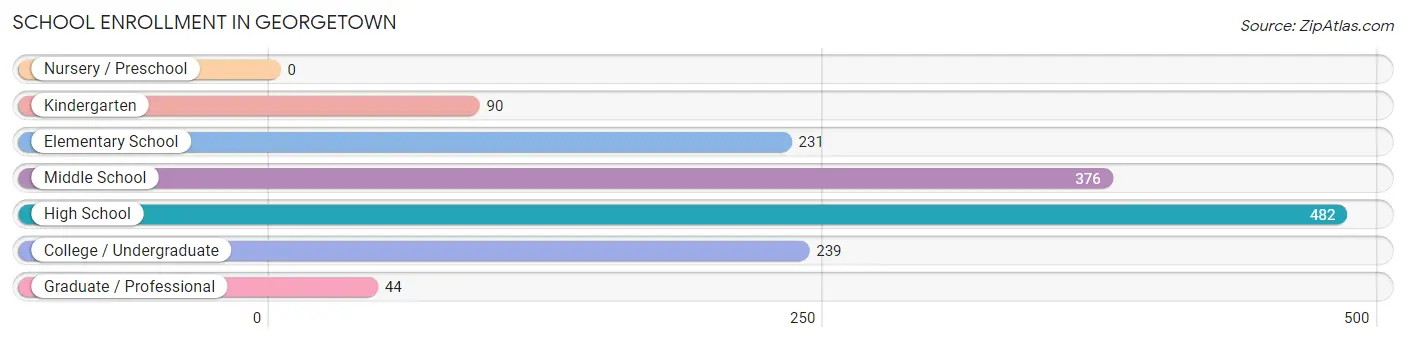
| School Level | # Students | % Students |
| Nursery / Preschool | 0 | 0.0% |
| Kindergarten | 90 | 6.2% |
| Elementary School | 231 | 15.8% |
| Middle School | 376 | 25.7% |
| High School | 482 | 33.0% |
| College / Undergraduate | 239 | 16.4% |
| Graduate / Professional | 44 | 3.0% |
| Total | 1,462 | 100.0% |
School Enrollment by Age by Funding Source in Georgetown
Out of a total of 1,462 students who are enrolled in schools in Georgetown, 83 (5.7%) attend a private institution, while the remaining 1,379 (94.3%) are enrolled in public schools. The age group of 20 to 24 year olds has the highest likelihood of being enrolled in private schools, with 57 (26.3% in the age bracket) enrolled. Conversely, the age group of 5 to 9 year old has the lowest likelihood of being enrolled in a private school, with 263 (100.0% in the age bracket) attending a public institution.
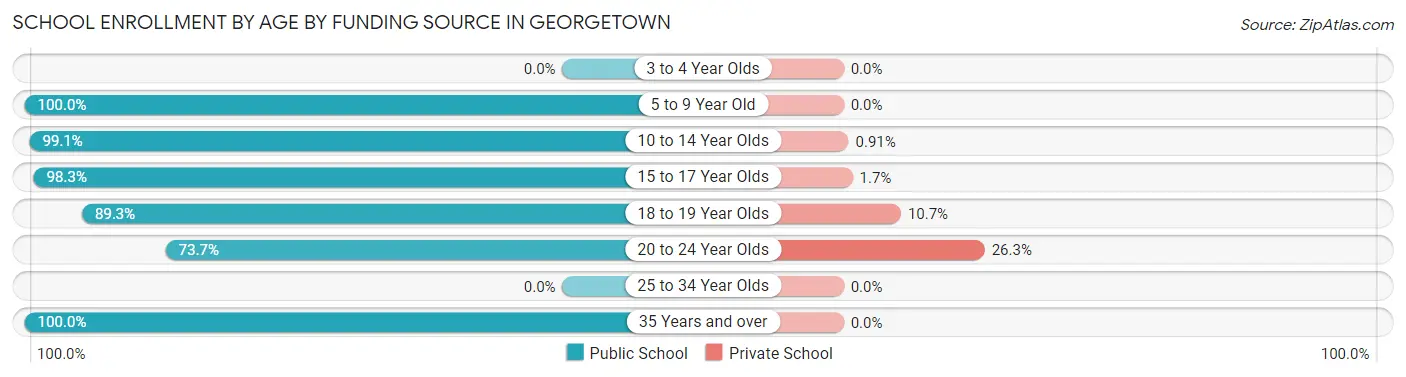
| Age Bracket | Public School | Private School |
| 3 to 4 Year Olds | 0 (0.0%) | 0 (0.0%) |
| 5 to 9 Year Old | 263 (100.0%) | 0 (0.0%) |
| 10 to 14 Year Olds | 434 (99.1%) | 4 (0.9%) |
| 15 to 17 Year Olds | 356 (98.3%) | 6 (1.7%) |
| 18 to 19 Year Olds | 134 (89.3%) | 16 (10.7%) |
| 20 to 24 Year Olds | 160 (73.7%) | 57 (26.3%) |
| 25 to 34 Year Olds | 0 (0.0%) | 0 (0.0%) |
| 35 Years and over | 32 (100.0%) | 0 (0.0%) |
| Total | 1,379 (94.3%) | 83 (5.7%) |
Educational Attainment by Field of Study in Georgetown
Business (443 | 22.7%), education (424 | 21.7%), bio, nature & agricultural (204 | 10.4%), physical & health sciences (174 | 8.9%), and science & technology (174 | 8.9%) are the most common fields of study among 1,953 individuals in Georgetown who have obtained a bachelor's degree or higher.
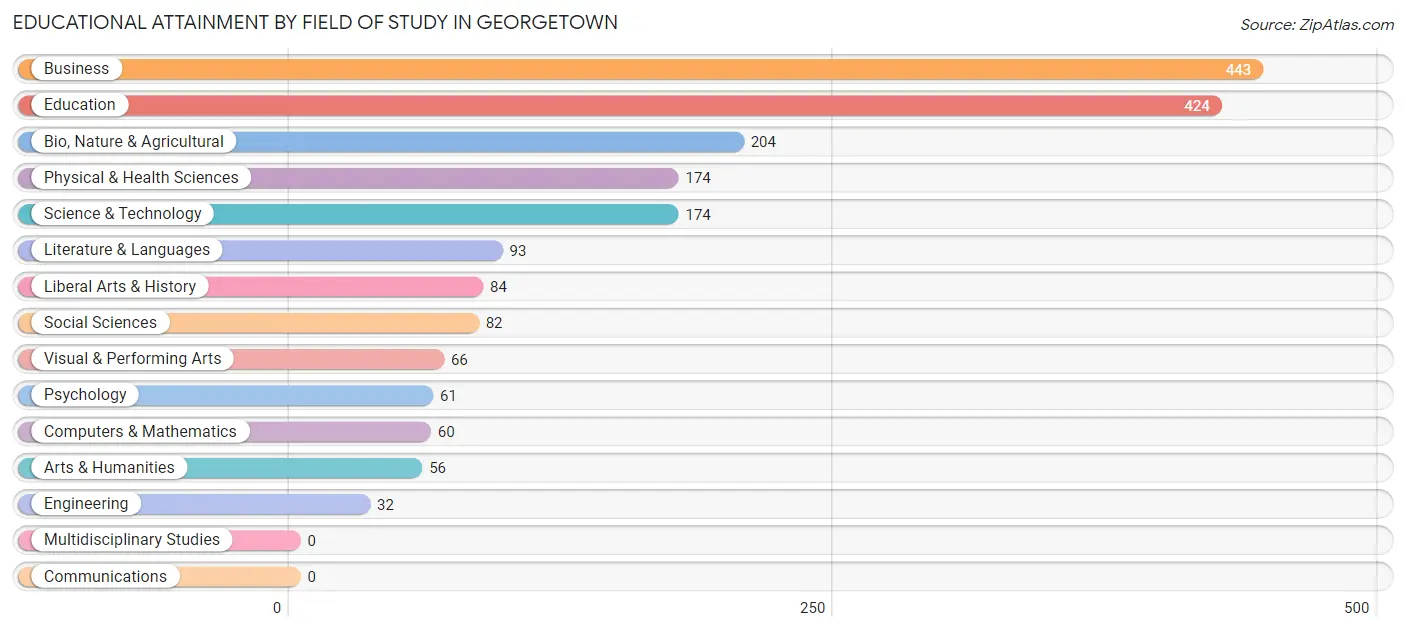
| Field of Study | # Graduates | % Graduates |
| Computers & Mathematics | 60 | 3.1% |
| Bio, Nature & Agricultural | 204 | 10.4% |
| Physical & Health Sciences | 174 | 8.9% |
| Psychology | 61 | 3.1% |
| Social Sciences | 82 | 4.2% |
| Engineering | 32 | 1.6% |
| Multidisciplinary Studies | 0 | 0.0% |
| Science & Technology | 174 | 8.9% |
| Business | 443 | 22.7% |
| Education | 424 | 21.7% |
| Literature & Languages | 93 | 4.8% |
| Liberal Arts & History | 84 | 4.3% |
| Visual & Performing Arts | 66 | 3.4% |
| Communications | 0 | 0.0% |
| Arts & Humanities | 56 | 2.9% |
| Total | 1,953 | 100.0% |
Transportation & Commute in Georgetown
Vehicle Availability by Sex in Georgetown
The most prevalent vehicle ownership categories in Georgetown are males with 1 vehicle (566, accounting for 28.1%) and females with 1 vehicle (665, making up 33.9%).
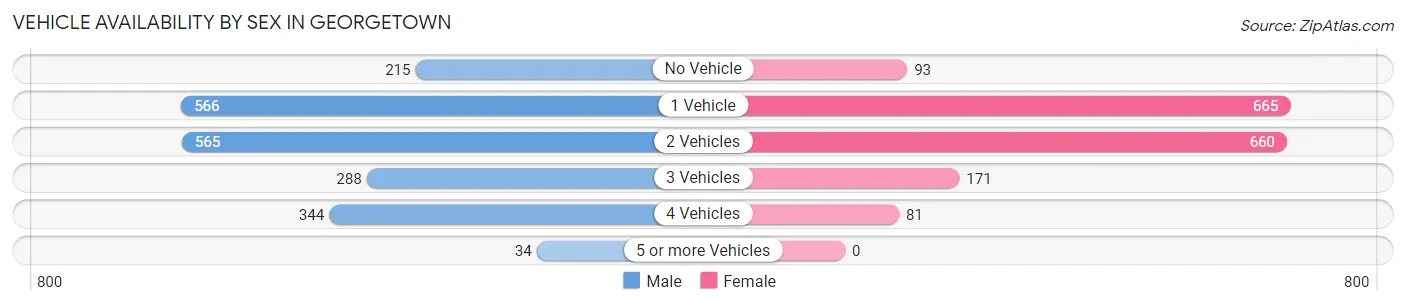
| Vehicles Available | Male | Female |
| No Vehicle | 215 (10.7%) | 93 (5.6%) |
| 1 Vehicle | 566 (28.1%) | 665 (39.8%) |
| 2 Vehicles | 565 (28.1%) | 660 (39.5%) |
| 3 Vehicles | 288 (14.3%) | 171 (10.2%) |
| 4 Vehicles | 344 (17.1%) | 81 (4.9%) |
| 5 or more Vehicles | 34 (1.7%) | 0 (0.0%) |
| Total | 2,012 (100.0%) | 1,670 (100.0%) |
Commute Time in Georgetown
The most frequently occuring commute durations in Georgetown are 5 to 9 minutes (894 commuters, 25.4%), 10 to 14 minutes (548 commuters, 15.6%), and 30 to 34 minutes (449 commuters, 12.8%).
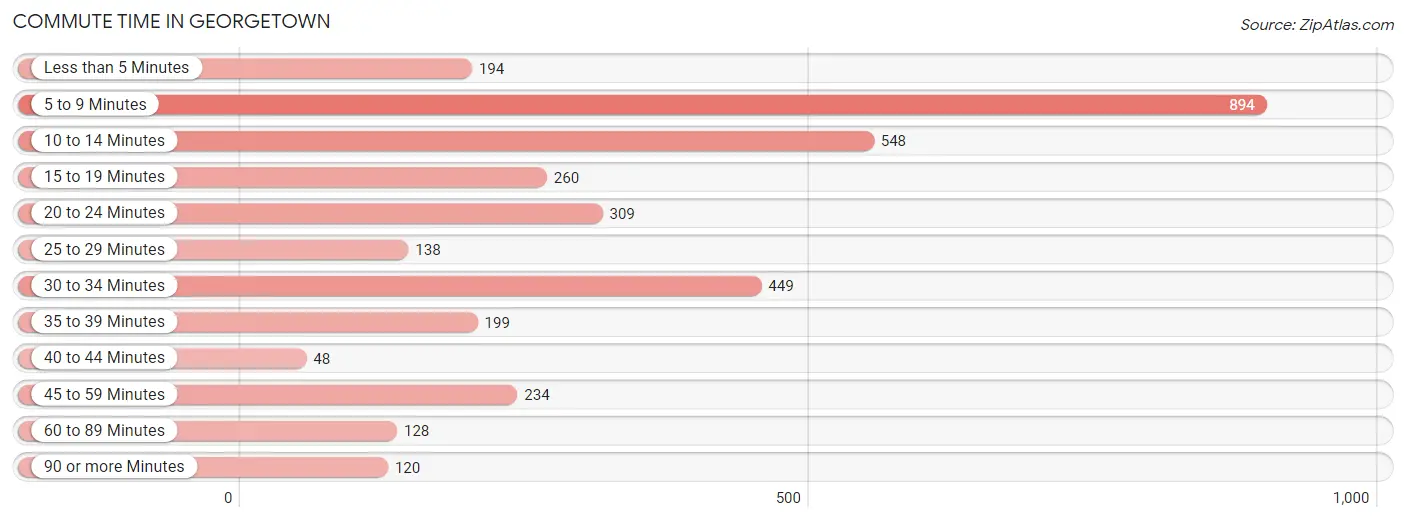
| Commute Time | # Commuters | % Commuters |
| Less than 5 Minutes | 194 | 5.5% |
| 5 to 9 Minutes | 894 | 25.4% |
| 10 to 14 Minutes | 548 | 15.6% |
| 15 to 19 Minutes | 260 | 7.4% |
| 20 to 24 Minutes | 309 | 8.8% |
| 25 to 29 Minutes | 138 | 3.9% |
| 30 to 34 Minutes | 449 | 12.8% |
| 35 to 39 Minutes | 199 | 5.7% |
| 40 to 44 Minutes | 48 | 1.4% |
| 45 to 59 Minutes | 234 | 6.7% |
| 60 to 89 Minutes | 128 | 3.6% |
| 90 or more Minutes | 120 | 3.4% |
Commute Time by Sex in Georgetown
The most common commute times in Georgetown are 5 to 9 minutes (404 commuters, 20.8%) for males and 5 to 9 minutes (490 commuters, 31.1%) for females.
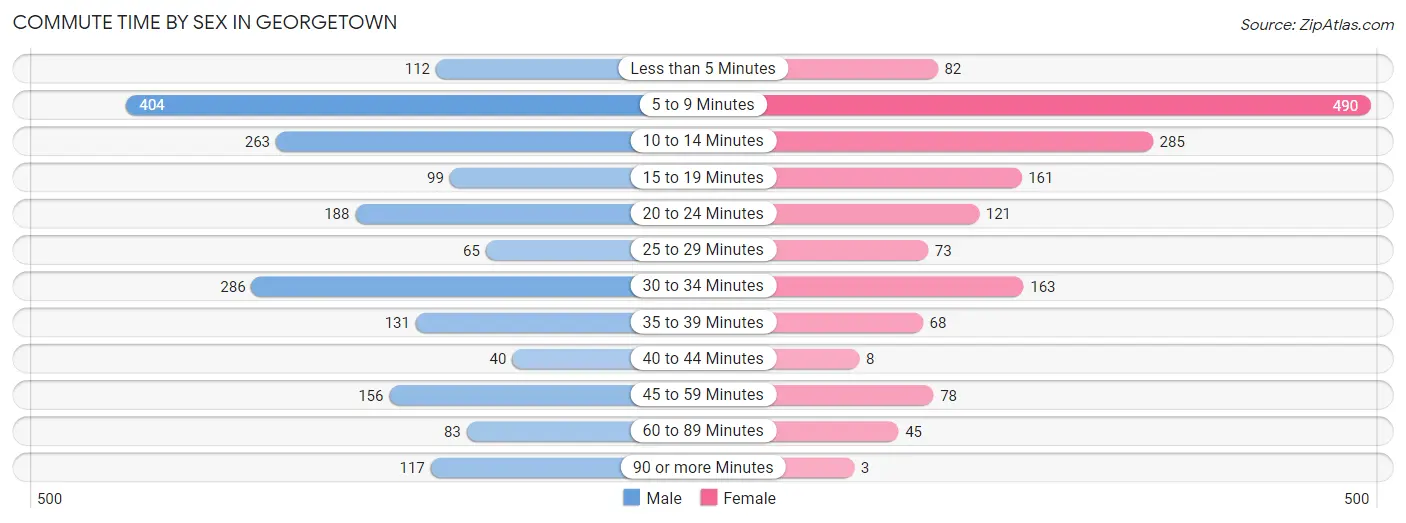
| Commute Time | Male | Female |
| Less than 5 Minutes | 112 (5.8%) | 82 (5.2%) |
| 5 to 9 Minutes | 404 (20.8%) | 490 (31.1%) |
| 10 to 14 Minutes | 263 (13.5%) | 285 (18.1%) |
| 15 to 19 Minutes | 99 (5.1%) | 161 (10.2%) |
| 20 to 24 Minutes | 188 (9.7%) | 121 (7.7%) |
| 25 to 29 Minutes | 65 (3.3%) | 73 (4.6%) |
| 30 to 34 Minutes | 286 (14.7%) | 163 (10.3%) |
| 35 to 39 Minutes | 131 (6.7%) | 68 (4.3%) |
| 40 to 44 Minutes | 40 (2.1%) | 8 (0.5%) |
| 45 to 59 Minutes | 156 (8.0%) | 78 (5.0%) |
| 60 to 89 Minutes | 83 (4.3%) | 45 (2.9%) |
| 90 or more Minutes | 117 (6.0%) | 3 (0.2%) |
Time of Departure to Work by Sex in Georgetown
The most frequent times of departure to work in Georgetown are 7:00 AM to 7:29 AM (335, 17.2%) for males and 8:00 AM to 8:29 AM (332, 21.0%) for females.
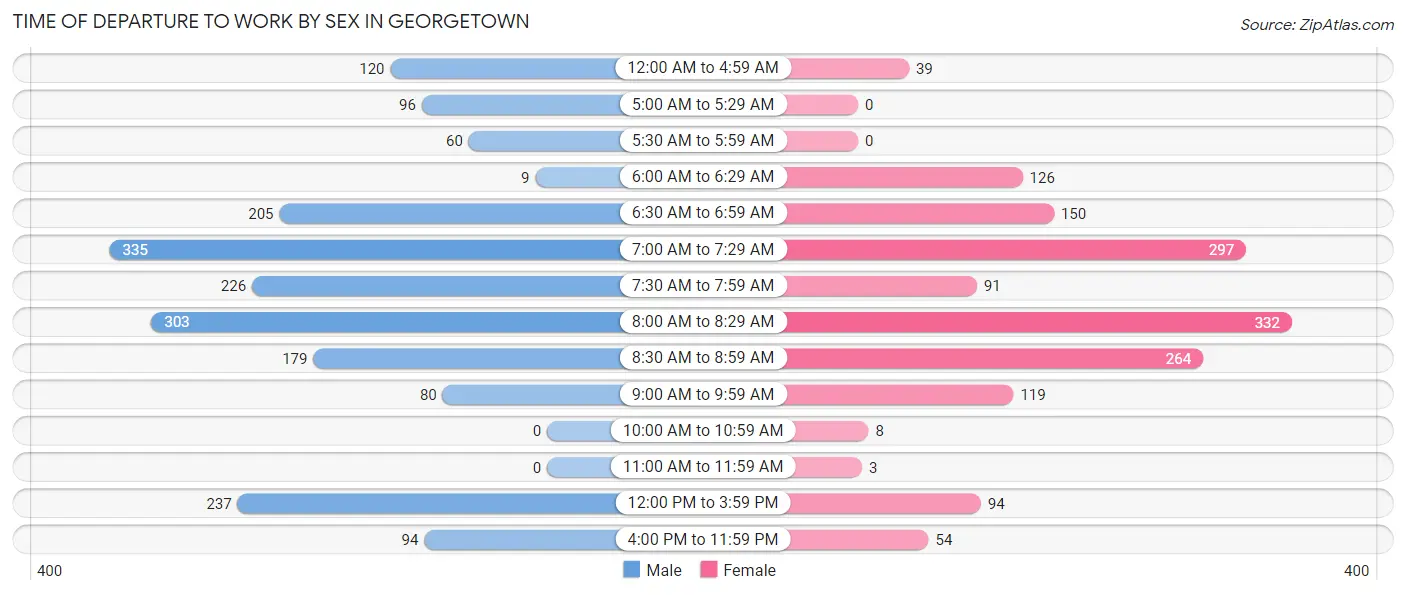
| Time of Departure | Male | Female |
| 12:00 AM to 4:59 AM | 120 (6.2%) | 39 (2.5%) |
| 5:00 AM to 5:29 AM | 96 (4.9%) | 0 (0.0%) |
| 5:30 AM to 5:59 AM | 60 (3.1%) | 0 (0.0%) |
| 6:00 AM to 6:29 AM | 9 (0.5%) | 126 (8.0%) |
| 6:30 AM to 6:59 AM | 205 (10.5%) | 150 (9.5%) |
| 7:00 AM to 7:29 AM | 335 (17.2%) | 297 (18.8%) |
| 7:30 AM to 7:59 AM | 226 (11.6%) | 91 (5.8%) |
| 8:00 AM to 8:29 AM | 303 (15.6%) | 332 (21.0%) |
| 8:30 AM to 8:59 AM | 179 (9.2%) | 264 (16.7%) |
| 9:00 AM to 9:59 AM | 80 (4.1%) | 119 (7.5%) |
| 10:00 AM to 10:59 AM | 0 (0.0%) | 8 (0.5%) |
| 11:00 AM to 11:59 AM | 0 (0.0%) | 3 (0.2%) |
| 12:00 PM to 3:59 PM | 237 (12.2%) | 94 (6.0%) |
| 4:00 PM to 11:59 PM | 94 (4.8%) | 54 (3.4%) |
| Total | 1,944 (100.0%) | 1,577 (100.0%) |
Housing Occupancy in Georgetown
Occupancy by Ownership in Georgetown
Of the total 3,670 dwellings in Georgetown, owner-occupied units account for 2,517 (68.6%), while renter-occupied units make up 1,153 (31.4%).
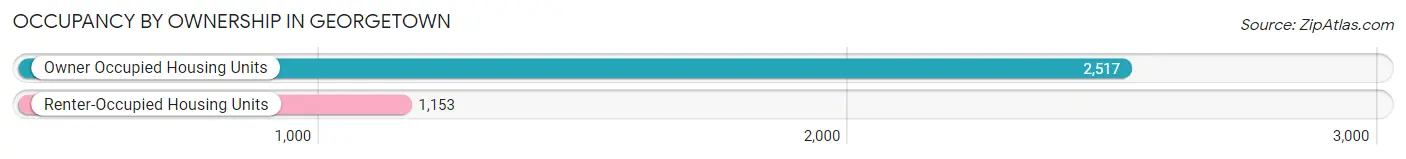
| Occupancy | # Housing Units | % Housing Units |
| Owner Occupied Housing Units | 2,517 | 68.6% |
| Renter-Occupied Housing Units | 1,153 | 31.4% |
| Total Occupied Housing Units | 3,670 | 100.0% |
Occupancy by Household Size in Georgetown
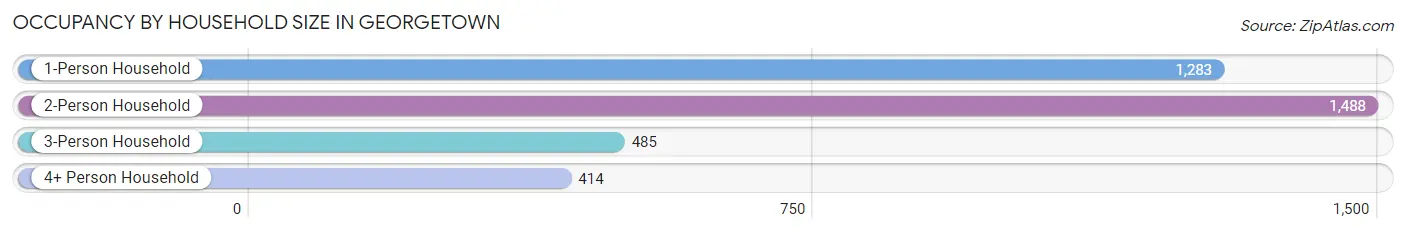
| Household Size | # Housing Units | % Housing Units |
| 1-Person Household | 1,283 | 35.0% |
| 2-Person Household | 1,488 | 40.5% |
| 3-Person Household | 485 | 13.2% |
| 4+ Person Household | 414 | 11.3% |
| Total Housing Units | 3,670 | 100.0% |
Occupancy by Ownership by Household Size in Georgetown
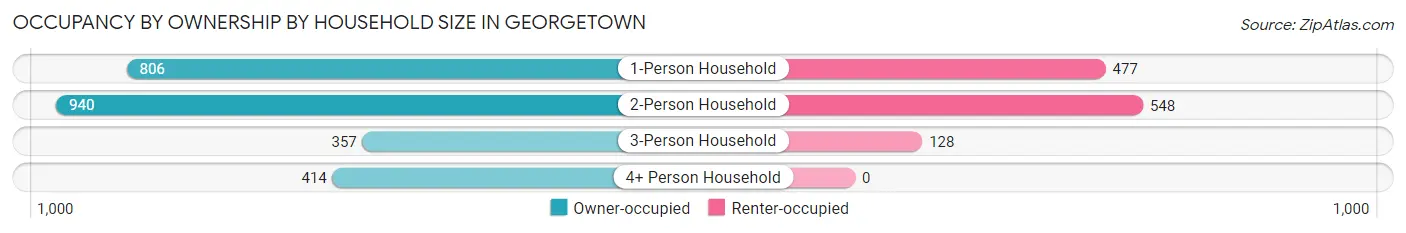
| Household Size | Owner-occupied | Renter-occupied |
| 1-Person Household | 806 (62.8%) | 477 (37.2%) |
| 2-Person Household | 940 (63.2%) | 548 (36.8%) |
| 3-Person Household | 357 (73.6%) | 128 (26.4%) |
| 4+ Person Household | 414 (100.0%) | 0 (0.0%) |
| Total Housing Units | 2,517 (68.6%) | 1,153 (31.4%) |
Occupancy by Educational Attainment in Georgetown
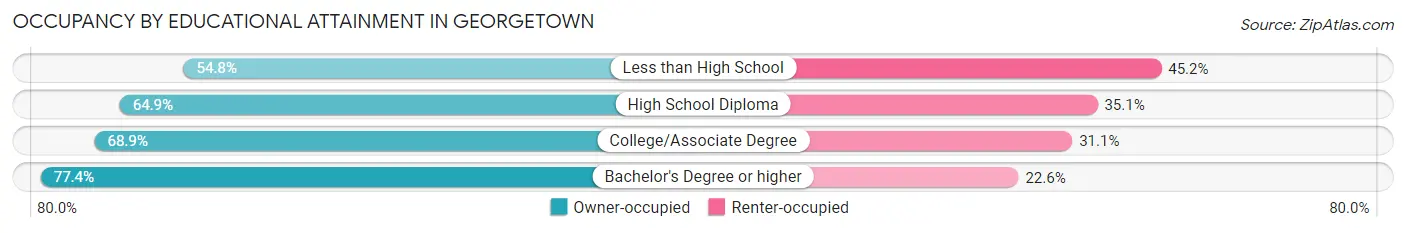
| Household Size | Owner-occupied | Renter-occupied |
| Less than High School | 235 (54.8%) | 194 (45.2%) |
| High School Diploma | 684 (64.9%) | 370 (35.1%) |
| College/Associate Degree | 771 (68.9%) | 348 (31.1%) |
| Bachelor's Degree or higher | 827 (77.4%) | 241 (22.6%) |
Occupancy by Age of Householder in Georgetown
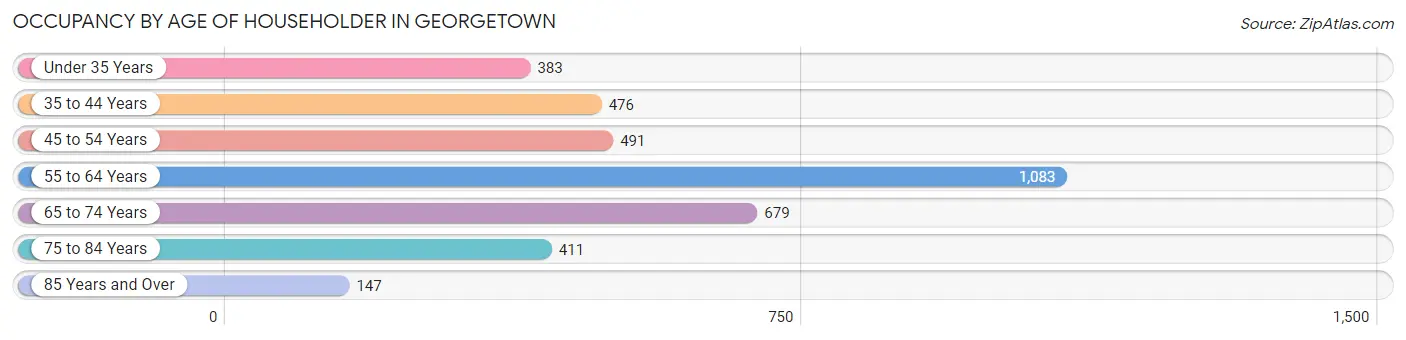
| Age Bracket | # Households | % Households |
| Under 35 Years | 383 | 10.4% |
| 35 to 44 Years | 476 | 13.0% |
| 45 to 54 Years | 491 | 13.4% |
| 55 to 64 Years | 1,083 | 29.5% |
| 65 to 74 Years | 679 | 18.5% |
| 75 to 84 Years | 411 | 11.2% |
| 85 Years and Over | 147 | 4.0% |
| Total | 3,670 | 100.0% |
Housing Finances in Georgetown
Median Income by Occupancy in Georgetown
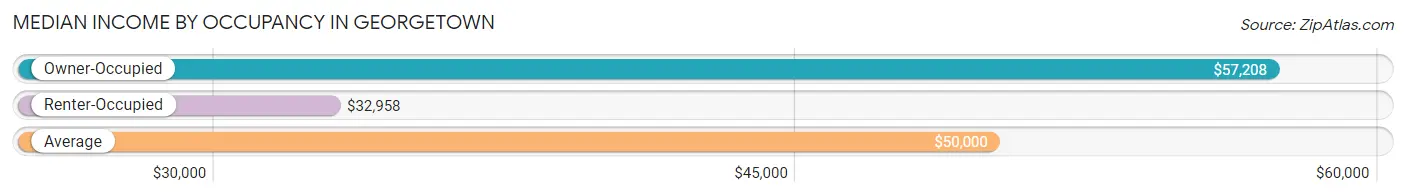
| Occupancy Type | # Households | Median Income |
| Owner-Occupied | 2,517 (68.6%) | $57,208 |
| Renter-Occupied | 1,153 (31.4%) | $32,958 |
| Average | 3,670 (100.0%) | $50,000 |
Occupancy by Householder Income Bracket in Georgetown
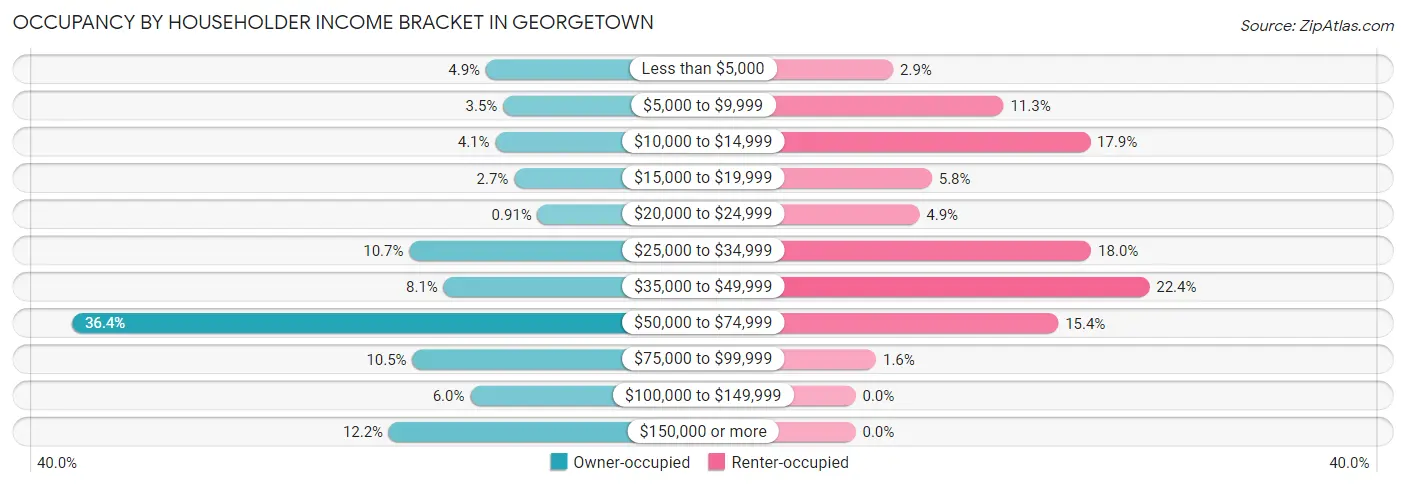
| Income Bracket | Owner-occupied | Renter-occupied |
| Less than $5,000 | 122 (4.9%) | 33 (2.9%) |
| $5,000 to $9,999 | 89 (3.5%) | 130 (11.3%) |
| $10,000 to $14,999 | 104 (4.1%) | 206 (17.9%) |
| $15,000 to $19,999 | 68 (2.7%) | 67 (5.8%) |
| $20,000 to $24,999 | 23 (0.9%) | 56 (4.9%) |
| $25,000 to $34,999 | 269 (10.7%) | 207 (17.9%) |
| $35,000 to $49,999 | 203 (8.1%) | 258 (22.4%) |
| $50,000 to $74,999 | 916 (36.4%) | 178 (15.4%) |
| $75,000 to $99,999 | 263 (10.4%) | 18 (1.6%) |
| $100,000 to $149,999 | 152 (6.0%) | 0 (0.0%) |
| $150,000 or more | 308 (12.2%) | 0 (0.0%) |
| Total | 2,517 (100.0%) | 1,153 (100.0%) |
Monthly Housing Cost Tiers in Georgetown
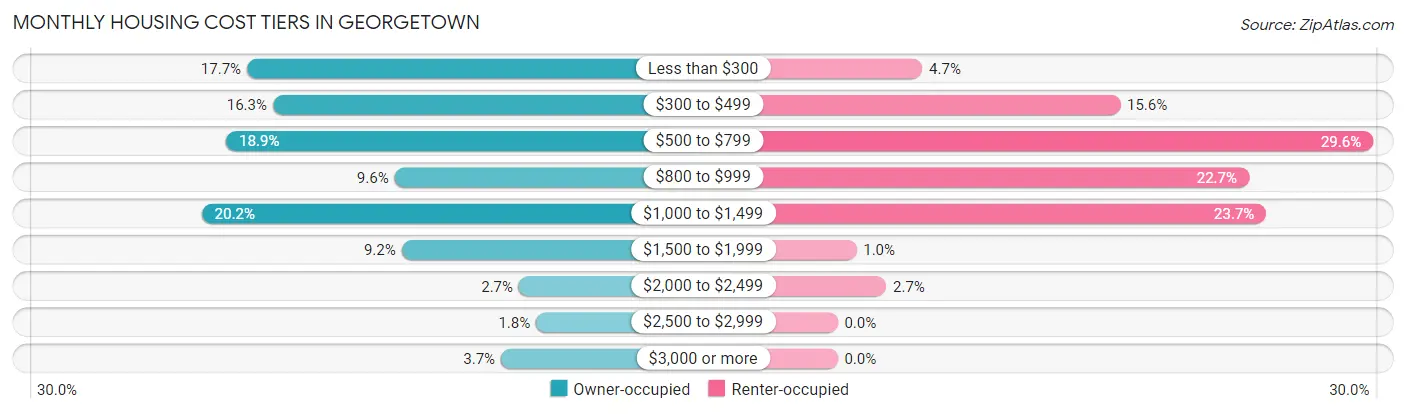
| Monthly Cost | Owner-occupied | Renter-occupied |
| Less than $300 | 446 (17.7%) | 54 (4.7%) |
| $300 to $499 | 410 (16.3%) | 180 (15.6%) |
| $500 to $799 | 475 (18.9%) | 341 (29.6%) |
| $800 to $999 | 241 (9.6%) | 262 (22.7%) |
| $1,000 to $1,499 | 509 (20.2%) | 273 (23.7%) |
| $1,500 to $1,999 | 231 (9.2%) | 12 (1.0%) |
| $2,000 to $2,499 | 68 (2.7%) | 31 (2.7%) |
| $2,500 to $2,999 | 44 (1.8%) | 0 (0.0%) |
| $3,000 or more | 93 (3.7%) | 0 (0.0%) |
| Total | 2,517 (100.0%) | 1,153 (100.0%) |
Physical Housing Characteristics in Georgetown
Housing Structures in Georgetown
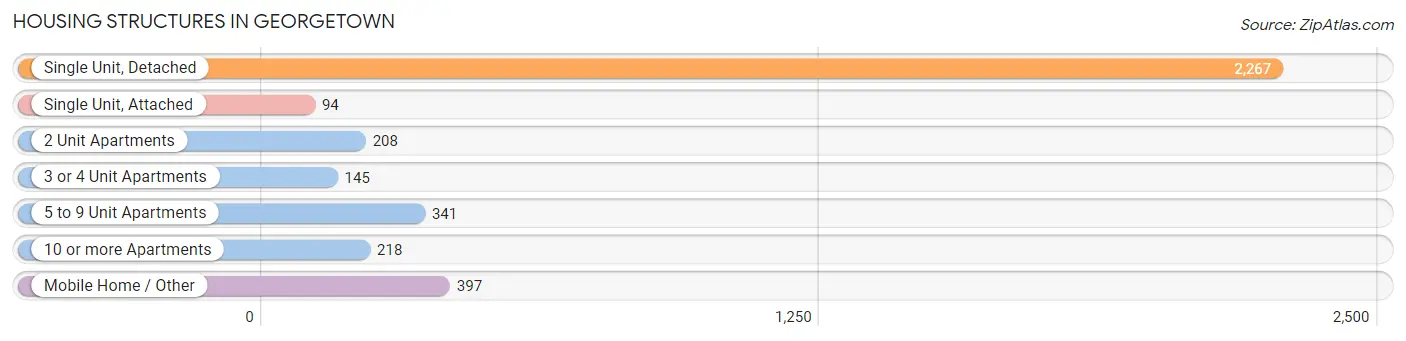
| Structure Type | # Housing Units | % Housing Units |
| Single Unit, Detached | 2,267 | 61.8% |
| Single Unit, Attached | 94 | 2.6% |
| 2 Unit Apartments | 208 | 5.7% |
| 3 or 4 Unit Apartments | 145 | 4.0% |
| 5 to 9 Unit Apartments | 341 | 9.3% |
| 10 or more Apartments | 218 | 5.9% |
| Mobile Home / Other | 397 | 10.8% |
| Total | 3,670 | 100.0% |
Housing Structures by Occupancy in Georgetown
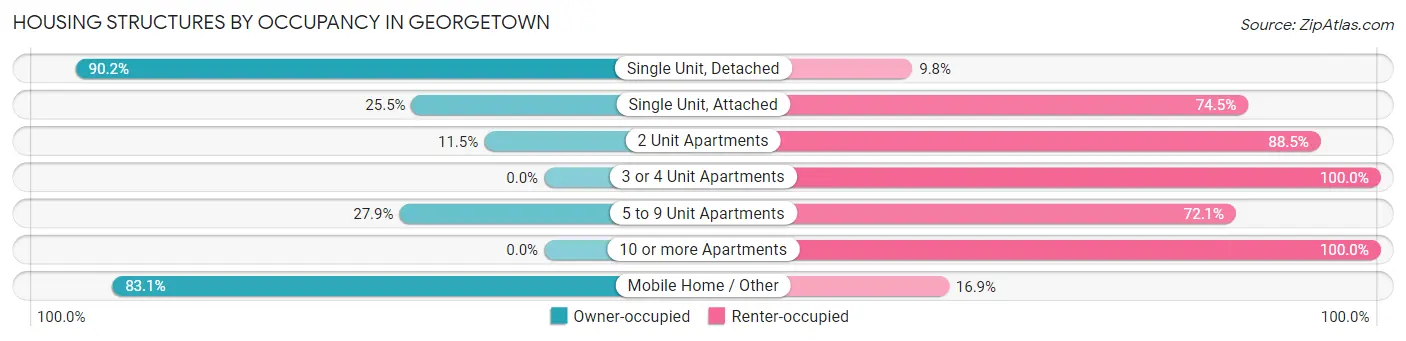
| Structure Type | Owner-occupied | Renter-occupied |
| Single Unit, Detached | 2,044 (90.2%) | 223 (9.8%) |
| Single Unit, Attached | 24 (25.5%) | 70 (74.5%) |
| 2 Unit Apartments | 24 (11.5%) | 184 (88.5%) |
| 3 or 4 Unit Apartments | 0 (0.0%) | 145 (100.0%) |
| 5 to 9 Unit Apartments | 95 (27.9%) | 246 (72.1%) |
| 10 or more Apartments | 0 (0.0%) | 218 (100.0%) |
| Mobile Home / Other | 330 (83.1%) | 67 (16.9%) |
| Total | 2,517 (68.6%) | 1,153 (31.4%) |
Housing Structures by Number of Rooms in Georgetown
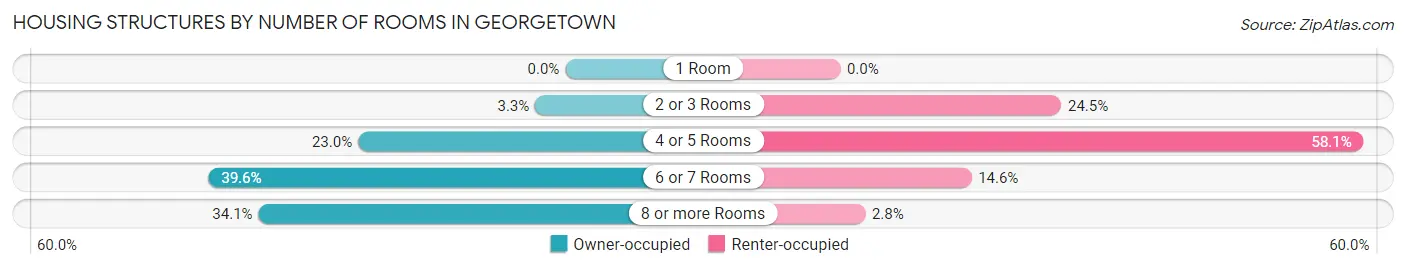
| Number of Rooms | Owner-occupied | Renter-occupied |
| 1 Room | 0 (0.0%) | 0 (0.0%) |
| 2 or 3 Rooms | 84 (3.3%) | 283 (24.5%) |
| 4 or 5 Rooms | 579 (23.0%) | 670 (58.1%) |
| 6 or 7 Rooms | 997 (39.6%) | 168 (14.6%) |
| 8 or more Rooms | 857 (34.1%) | 32 (2.8%) |
| Total | 2,517 (100.0%) | 1,153 (100.0%) |
Housing Structure by Heating Type in Georgetown
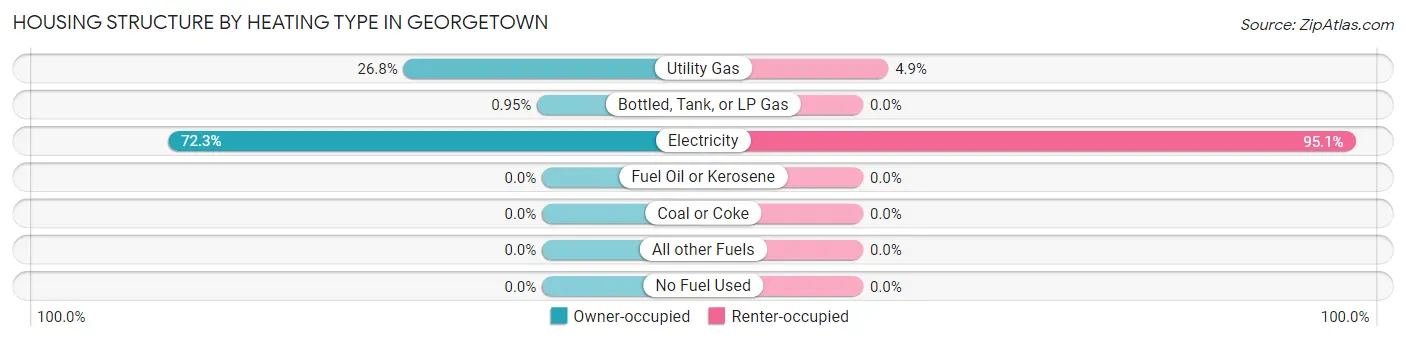
| Heating Type | Owner-occupied | Renter-occupied |
| Utility Gas | 674 (26.8%) | 56 (4.9%) |
| Bottled, Tank, or LP Gas | 24 (0.9%) | 0 (0.0%) |
| Electricity | 1,819 (72.3%) | 1,097 (95.1%) |
| Fuel Oil or Kerosene | 0 (0.0%) | 0 (0.0%) |
| Coal or Coke | 0 (0.0%) | 0 (0.0%) |
| All other Fuels | 0 (0.0%) | 0 (0.0%) |
| No Fuel Used | 0 (0.0%) | 0 (0.0%) |
| Total | 2,517 (100.0%) | 1,153 (100.0%) |
Household Vehicle Usage in Georgetown
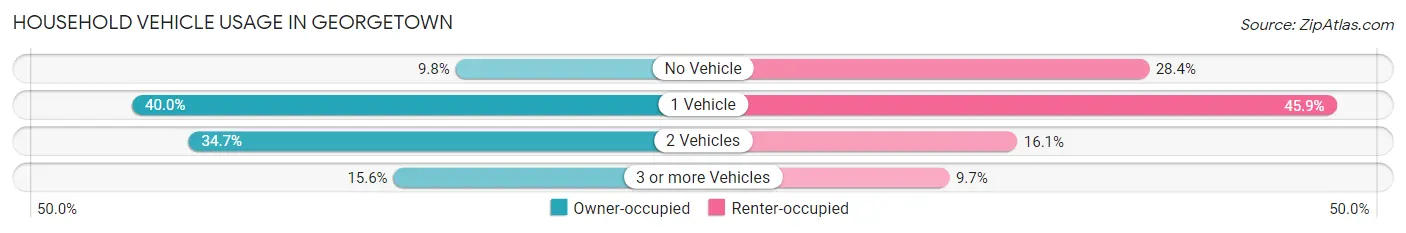
| Vehicles per Household | Owner-occupied | Renter-occupied |
| No Vehicle | 246 (9.8%) | 327 (28.4%) |
| 1 Vehicle | 1,006 (40.0%) | 529 (45.9%) |
| 2 Vehicles | 873 (34.7%) | 185 (16.1%) |
| 3 or more Vehicles | 392 (15.6%) | 112 (9.7%) |
| Total | 2,517 (100.0%) | 1,153 (100.0%) |
Real Estate & Mortgages in Georgetown
Real Estate and Mortgage Overview in Georgetown
| Characteristic | Without Mortgage | With Mortgage |
| Housing Units | 1,406 | 1,111 |
| Median Property Value | $143,200 | $179,900 |
| Median Household Income | $56,338 | $264 |
| Monthly Housing Costs | $418 | $93 |
| Real Estate Taxes | $750 | $0 |
Property Value by Mortgage Status in Georgetown
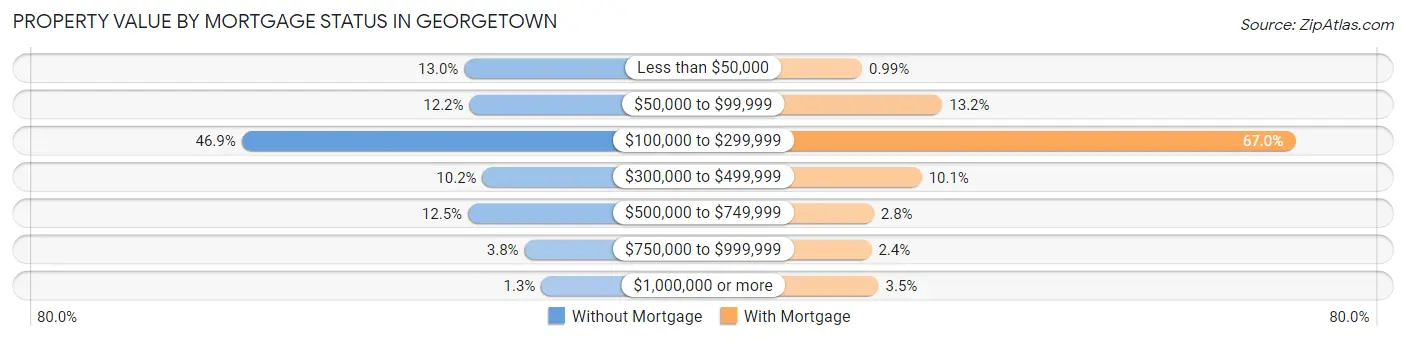
| Property Value | Without Mortgage | With Mortgage |
| Less than $50,000 | 183 (13.0%) | 11 (1.0%) |
| $50,000 to $99,999 | 172 (12.2%) | 147 (13.2%) |
| $100,000 to $299,999 | 660 (46.9%) | 744 (67.0%) |
| $300,000 to $499,999 | 144 (10.2%) | 112 (10.1%) |
| $500,000 to $749,999 | 175 (12.4%) | 31 (2.8%) |
| $750,000 to $999,999 | 54 (3.8%) | 27 (2.4%) |
| $1,000,000 or more | 18 (1.3%) | 39 (3.5%) |
| Total | 1,406 (100.0%) | 1,111 (100.0%) |
Household Income by Mortgage Status in Georgetown
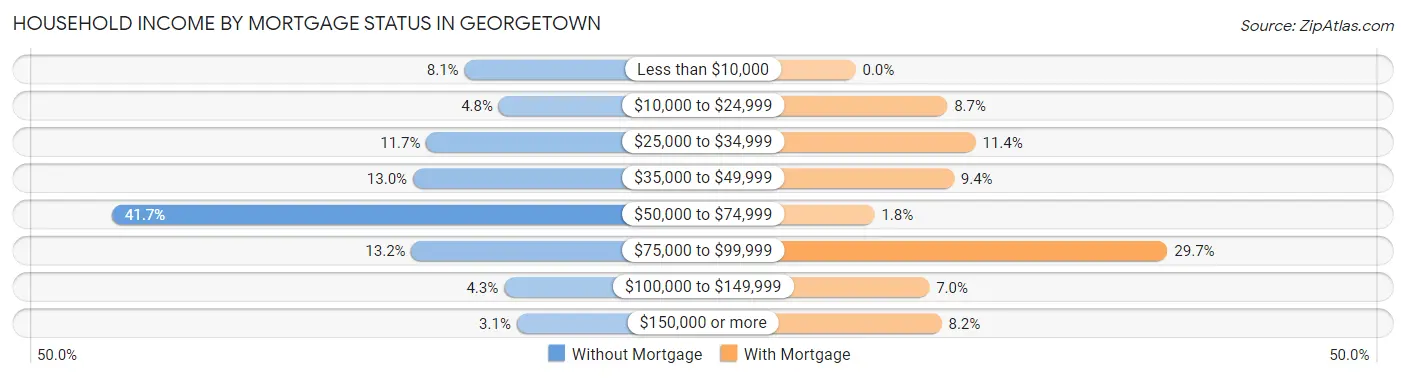
| Household Income | Without Mortgage | With Mortgage |
| Less than $10,000 | 114 (8.1%) | 0 (0.0%) |
| $10,000 to $24,999 | 68 (4.8%) | 97 (8.7%) |
| $25,000 to $34,999 | 165 (11.7%) | 127 (11.4%) |
| $35,000 to $49,999 | 183 (13.0%) | 104 (9.4%) |
| $50,000 to $74,999 | 586 (41.7%) | 20 (1.8%) |
| $75,000 to $99,999 | 185 (13.2%) | 330 (29.7%) |
| $100,000 to $149,999 | 61 (4.3%) | 78 (7.0%) |
| $150,000 or more | 44 (3.1%) | 91 (8.2%) |
| Total | 1,406 (100.0%) | 1,111 (100.0%) |
Property Value to Household Income Ratio in Georgetown
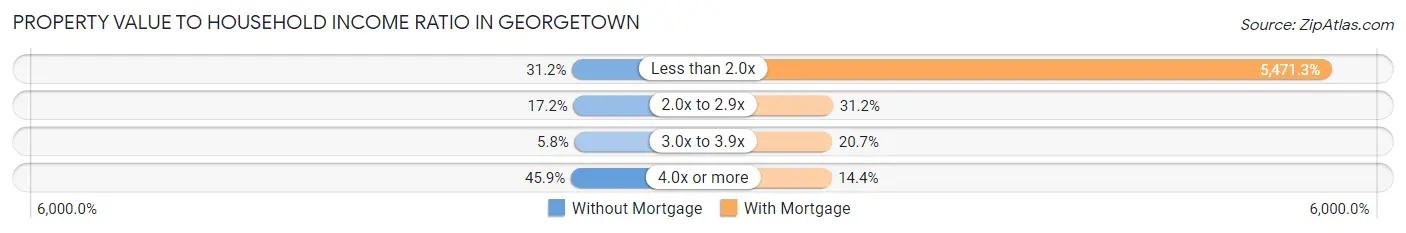
| Value-to-Income Ratio | Without Mortgage | With Mortgage |
| Less than 2.0x | 438 (31.1%) | 60,786 (5,471.3%) |
| 2.0x to 2.9x | 242 (17.2%) | 347 (31.2%) |
| 3.0x to 3.9x | 81 (5.8%) | 230 (20.7%) |
| 4.0x or more | 645 (45.9%) | 160 (14.4%) |
| Total | 1,406 (100.0%) | 1,111 (100.0%) |
Real Estate Taxes by Mortgage Status in Georgetown
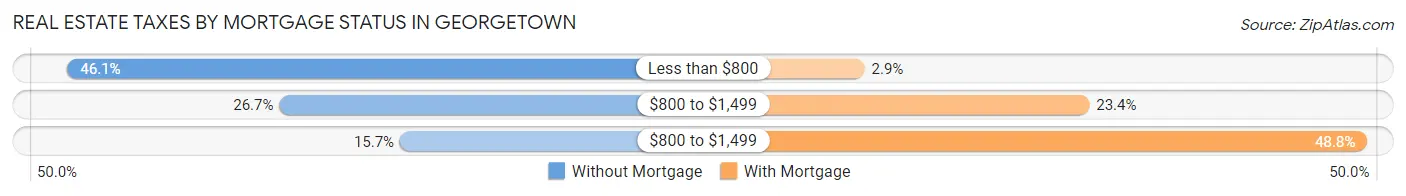
| Property Taxes | Without Mortgage | With Mortgage |
| Less than $800 | 648 (46.1%) | 32 (2.9%) |
| $800 to $1,499 | 376 (26.7%) | 260 (23.4%) |
| $800 to $1,499 | 221 (15.7%) | 542 (48.8%) |
| Total | 1,406 (100.0%) | 1,111 (100.0%) |
Health & Disability in Georgetown
Health Insurance Coverage by Age in Georgetown
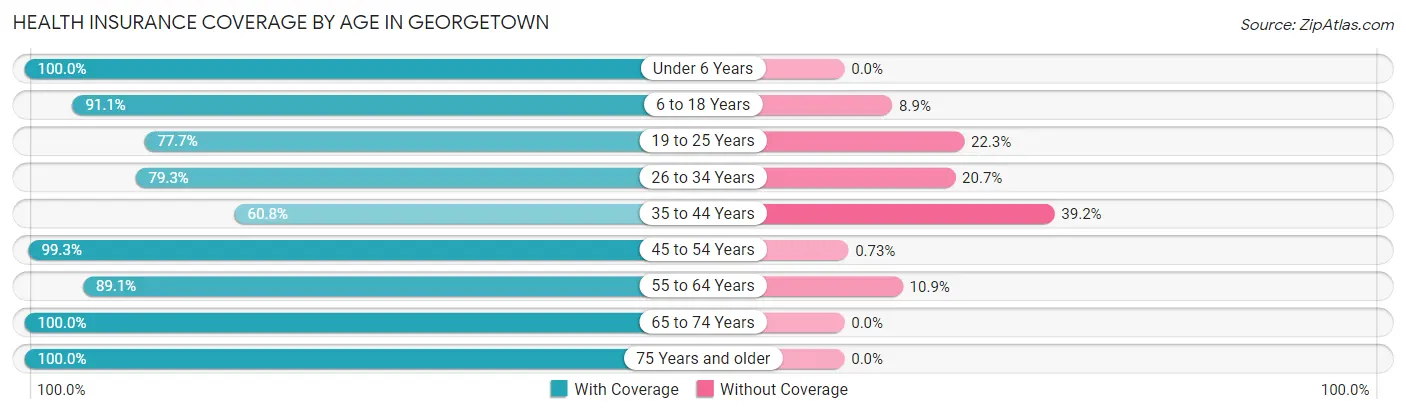
| Age Bracket | With Coverage | Without Coverage |
| Under 6 Years | 190 (100.0%) | 0 (0.0%) |
| 6 to 18 Years | 1,061 (91.1%) | 104 (8.9%) |
| 19 to 25 Years | 640 (77.7%) | 184 (22.3%) |
| 26 to 34 Years | 499 (79.3%) | 130 (20.7%) |
| 35 to 44 Years | 607 (60.8%) | 391 (39.2%) |
| 45 to 54 Years | 818 (99.3%) | 6 (0.7%) |
| 55 to 64 Years | 1,368 (89.1%) | 167 (10.9%) |
| 65 to 74 Years | 1,287 (100.0%) | 0 (0.0%) |
| 75 Years and older | 712 (100.0%) | 0 (0.0%) |
| Total | 7,182 (88.0%) | 982 (12.0%) |
Health Insurance Coverage by Citizenship Status in Georgetown
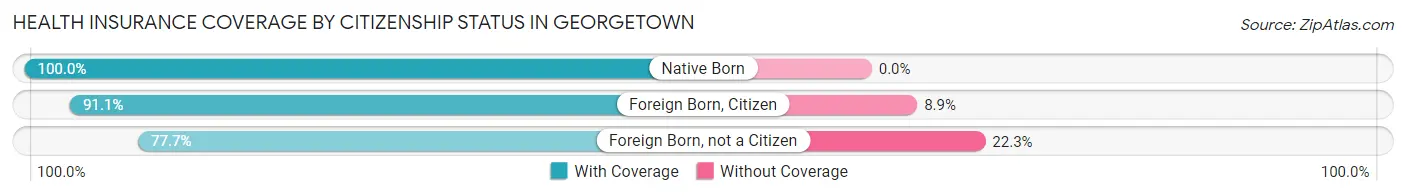
| Citizenship Status | With Coverage | Without Coverage |
| Native Born | 190 (100.0%) | 0 (0.0%) |
| Foreign Born, Citizen | 1,061 (91.1%) | 104 (8.9%) |
| Foreign Born, not a Citizen | 640 (77.7%) | 184 (22.3%) |
Health Insurance Coverage by Household Income in Georgetown
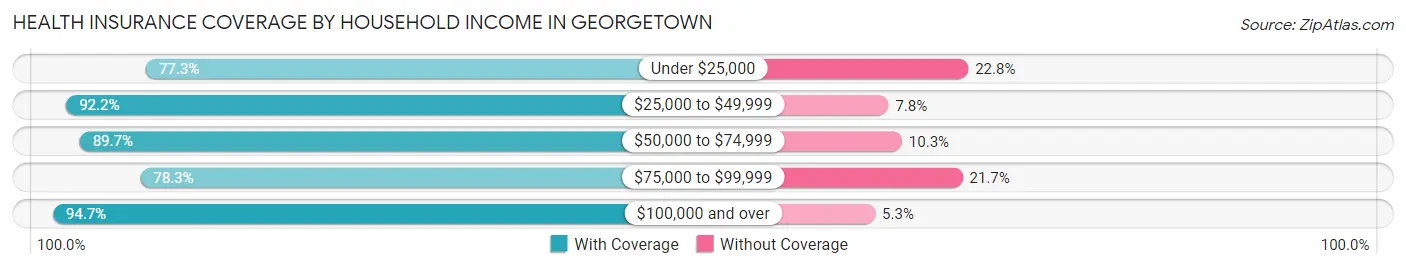
| Household Income | With Coverage | Without Coverage |
| Under $25,000 | 1,046 (77.2%) | 308 (22.8%) |
| $25,000 to $49,999 | 1,794 (92.2%) | 152 (7.8%) |
| $50,000 to $74,999 | 2,275 (89.7%) | 262 (10.3%) |
| $75,000 to $99,999 | 650 (78.3%) | 180 (21.7%) |
| $100,000 and over | 1,408 (94.7%) | 79 (5.3%) |
Public vs Private Health Insurance Coverage by Age in Georgetown
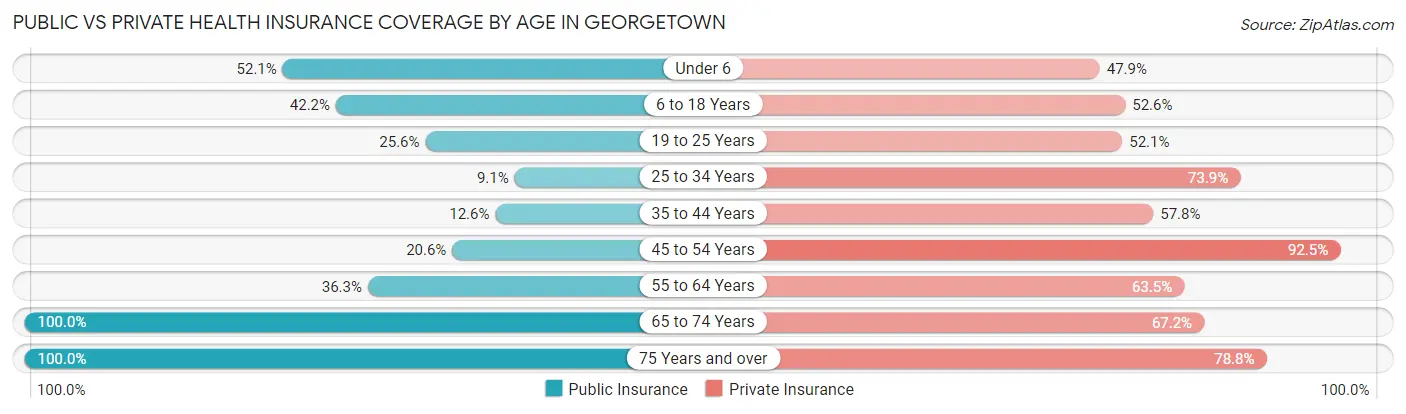
| Age Bracket | Public Insurance | Private Insurance |
| Under 6 | 99 (52.1%) | 91 (47.9%) |
| 6 to 18 Years | 492 (42.2%) | 613 (52.6%) |
| 19 to 25 Years | 211 (25.6%) | 429 (52.1%) |
| 25 to 34 Years | 57 (9.1%) | 465 (73.9%) |
| 35 to 44 Years | 126 (12.6%) | 577 (57.8%) |
| 45 to 54 Years | 170 (20.6%) | 762 (92.5%) |
| 55 to 64 Years | 557 (36.3%) | 975 (63.5%) |
| 65 to 74 Years | 1,287 (100.0%) | 865 (67.2%) |
| 75 Years and over | 712 (100.0%) | 561 (78.8%) |
| Total | 3,711 (45.5%) | 5,338 (65.4%) |
Disability Status by Sex by Age in Georgetown
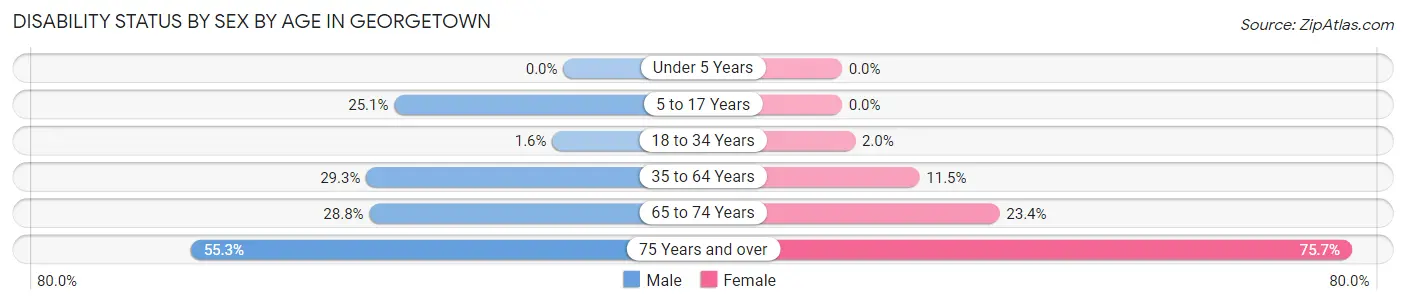
| Age Bracket | Male | Female |
| Under 5 Years | 0 (0.0%) | 0 (0.0%) |
| 5 to 17 Years | 112 (25.1%) | 0 (0.0%) |
| 18 to 34 Years | 15 (1.6%) | 13 (2.0%) |
| 35 to 64 Years | 449 (29.3%) | 210 (11.5%) |
| 65 to 74 Years | 159 (28.8%) | 172 (23.4%) |
| 75 Years and over | 109 (55.3%) | 390 (75.7%) |
Disability Class by Sex by Age in Georgetown
Disability Class: Hearing Difficulty
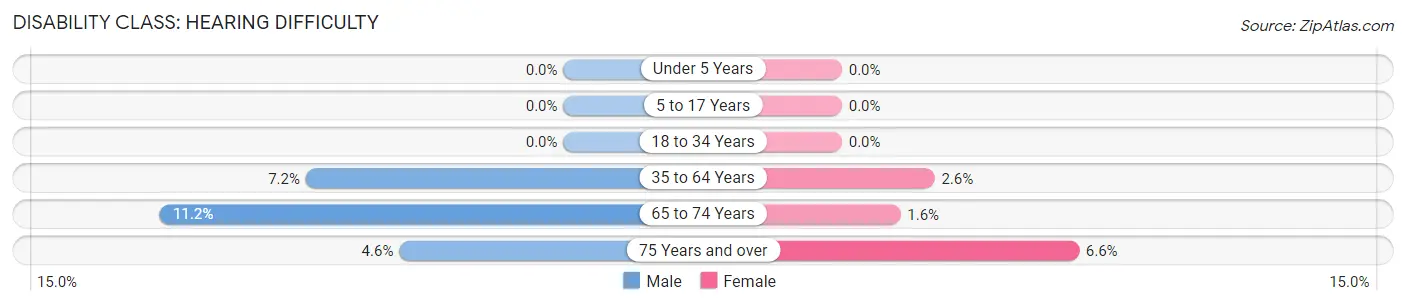
| Age Bracket | Male | Female |
| Under 5 Years | 0 (0.0%) | 0 (0.0%) |
| 5 to 17 Years | 0 (0.0%) | 0 (0.0%) |
| 18 to 34 Years | 0 (0.0%) | 0 (0.0%) |
| 35 to 64 Years | 110 (7.2%) | 47 (2.6%) |
| 65 to 74 Years | 62 (11.2%) | 12 (1.6%) |
| 75 Years and over | 9 (4.6%) | 34 (6.6%) |
Disability Class: Vision Difficulty
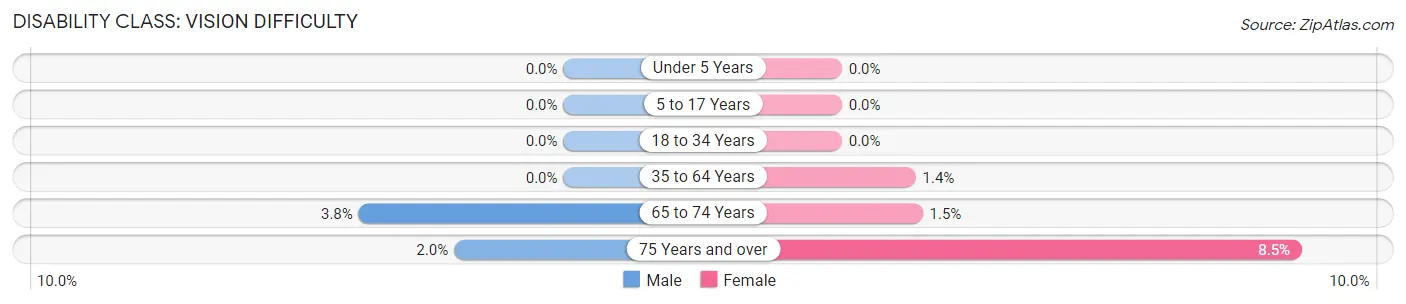
| Age Bracket | Male | Female |
| Under 5 Years | 0 (0.0%) | 0 (0.0%) |
| 5 to 17 Years | 0 (0.0%) | 0 (0.0%) |
| 18 to 34 Years | 0 (0.0%) | 0 (0.0%) |
| 35 to 64 Years | 0 (0.0%) | 25 (1.4%) |
| 65 to 74 Years | 21 (3.8%) | 11 (1.5%) |
| 75 Years and over | 4 (2.0%) | 44 (8.5%) |
Disability Class: Cognitive Difficulty
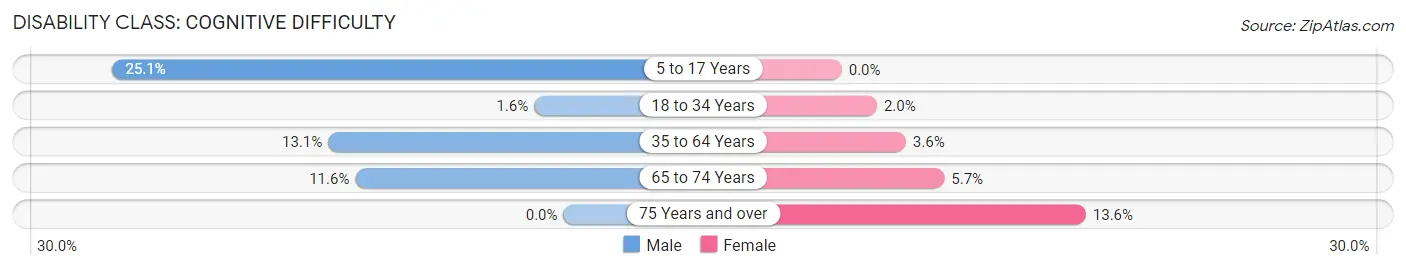
| Age Bracket | Male | Female |
| 5 to 17 Years | 112 (25.1%) | 0 (0.0%) |
| 18 to 34 Years | 15 (1.6%) | 13 (2.0%) |
| 35 to 64 Years | 201 (13.1%) | 65 (3.6%) |
| 65 to 74 Years | 64 (11.6%) | 42 (5.7%) |
| 75 Years and over | 0 (0.0%) | 70 (13.6%) |
Disability Class: Ambulatory Difficulty
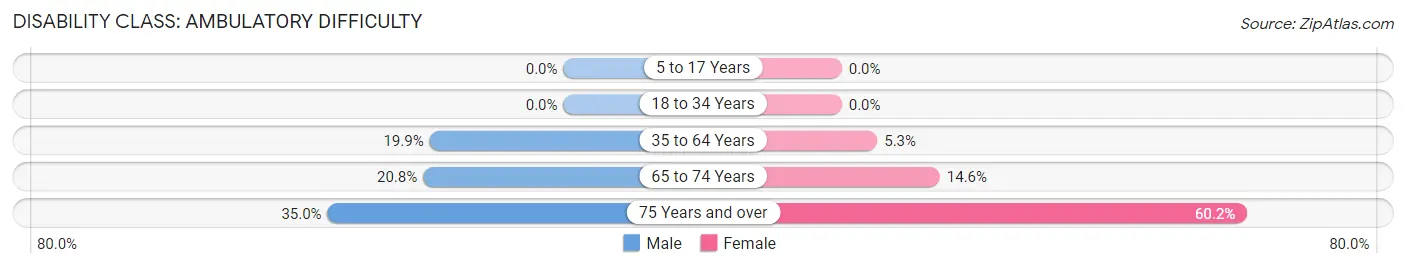
| Age Bracket | Male | Female |
| 5 to 17 Years | 0 (0.0%) | 0 (0.0%) |
| 18 to 34 Years | 0 (0.0%) | 0 (0.0%) |
| 35 to 64 Years | 305 (19.9%) | 96 (5.3%) |
| 65 to 74 Years | 115 (20.8%) | 107 (14.6%) |
| 75 Years and over | 69 (35.0%) | 310 (60.2%) |
Disability Class: Self-Care Difficulty
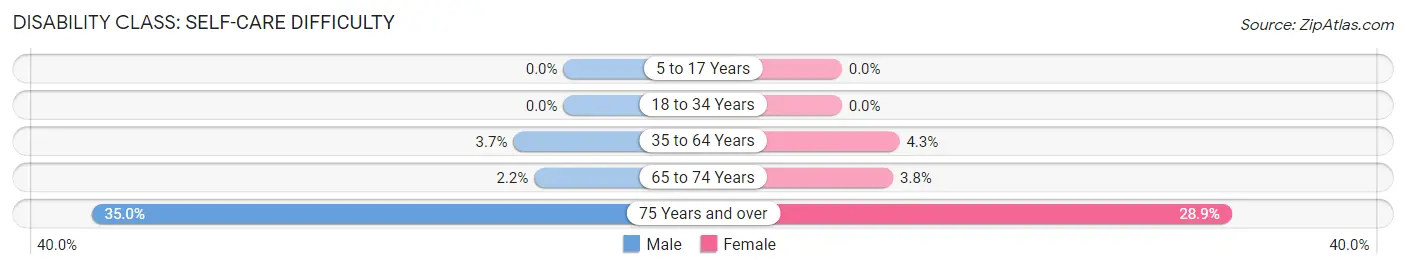
| Age Bracket | Male | Female |
| 5 to 17 Years | 0 (0.0%) | 0 (0.0%) |
| 18 to 34 Years | 0 (0.0%) | 0 (0.0%) |
| 35 to 64 Years | 57 (3.7%) | 78 (4.3%) |
| 65 to 74 Years | 12 (2.2%) | 28 (3.8%) |
| 75 Years and over | 69 (35.0%) | 149 (28.9%) |
Technology Access in Georgetown
Computing Device Access in Georgetown
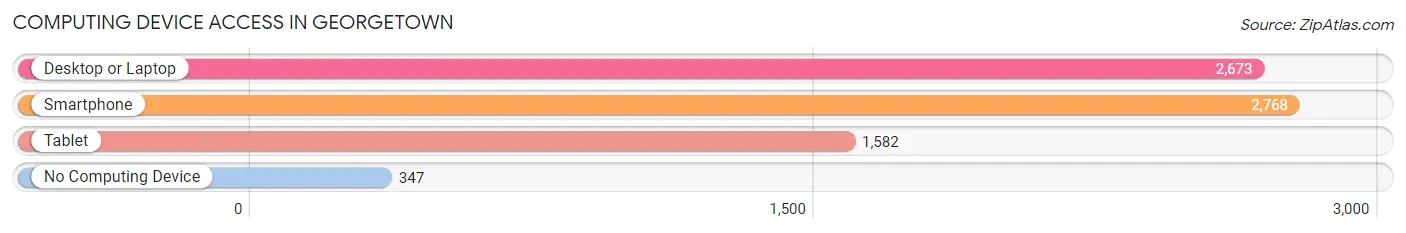
| Device Type | # Households | % Households |
| Desktop or Laptop | 2,673 | 72.8% |
| Smartphone | 2,768 | 75.4% |
| Tablet | 1,582 | 43.1% |
| No Computing Device | 347 | 9.5% |
| Total | 3,670 | 100.0% |
Internet Access in Georgetown
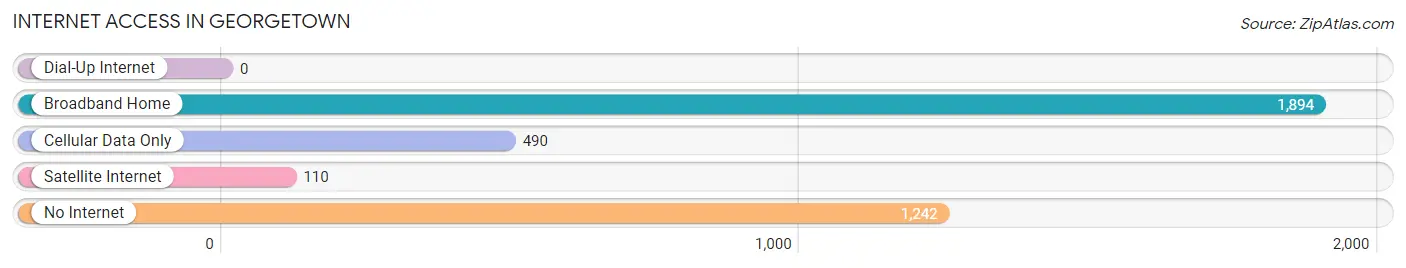
| Internet Type | # Households | % Households |
| Dial-Up Internet | 0 | 0.0% |
| Broadband Home | 1,894 | 51.6% |
| Cellular Data Only | 490 | 13.4% |
| Satellite Internet | 110 | 3.0% |
| No Internet | 1,242 | 33.8% |
| Total | 3,670 | 100.0% |
Georgetown Summary
Georgetown, South Carolina is a small city located in the northeastern corner of the state. It is the county seat of Georgetown County and is situated on the banks of the Sampit River. The city is known for its historic downtown area, which is home to many of the city’s oldest buildings. Georgetown is also known for its beautiful beaches, which attract visitors from all over the world.
Geography
Georgetown is located in the northeastern corner of South Carolina, approximately 30 miles south of Myrtle Beach. The city is situated on the banks of the Sampit River, which flows into the Atlantic Ocean. The city is surrounded by the Francis Marion National Forest, which provides a natural buffer from the hustle and bustle of the nearby cities. The city is also located near the Waccamaw National Wildlife Refuge, which is home to a variety of wildlife species.
The city has a total area of 8.3 square miles, of which 8.2 square miles is land and 0.1 square miles is water. The city is located at an elevation of approximately 10 feet above sea level.
Economy
Georgetown’s economy is largely based on tourism and the service industry. The city is home to several hotels, restaurants, and other tourist attractions. The city is also home to several manufacturing companies, including a paper mill and a boat manufacturing plant.
The city is also home to several educational institutions, including the University of South Carolina at Georgetown and the Georgetown Technical College.
Demographics
As of the 2010 census, Georgetown had a population of 9,163. The racial makeup of the city was 68.3% White, 28.2% African American, 0.3% Native American, 0.7% Asian, 0.1% Pacific Islander, 0.7% from other races, and 1.9% from two or more races. Hispanic or Latino of any race were 2.2% of the population.
The median income for a household in the city was $35,945, and the median income for a family was $41,945. The per capita income for the city was $19,945. About 17.2% of families and 20.3% of the population were below the poverty line, including 28.2% of those under age 18 and 11.2% of those age 65 or over.
Conclusion
Georgetown, South Carolina is a small city located in the northeastern corner of the state. It is the county seat of Georgetown County and is situated on the banks of the Sampit River. The city is known for its historic downtown area, which is home to many of the city’s oldest buildings. Georgetown is also known for its beautiful beaches, which attract visitors from all over the world. The city’s economy is largely based on tourism and the service industry, and it is home to several educational institutions. As of the 2010 census, Georgetown had a population of 9,163. The median income for a household in the city was $35,945, and the median income for a family was $41,945.
Common Questions
What is Per Capita Income in Georgetown?
Per Capita income in Georgetown is $28,945.
What is the Median Family Income in Georgetown?
Median Family Income in Georgetown is $56,761.
What is the Median Household income in Georgetown?
Median Household Income in Georgetown is $50,000.
What is Income or Wage Gap in Georgetown?
Income or Wage Gap in Georgetown is 4.8%.
Women in Georgetown earn 95.2 cents for every dollar earned by a man.
What is Family Income Deficit in Georgetown?
Family Income Deficit in Georgetown is $5,438.
Families that are below poverty line in Georgetown earn $5,438 less on average than the poverty threshold level.
What is Inequality or Gini Index in Georgetown?
Inequality or Gini Index in Georgetown is 0.49.
What is the Total Population of Georgetown?
Total Population of Georgetown is 8,465.
What is the Total Male Population of Georgetown?
Total Male Population of Georgetown is 3,823.
What is the Total Female Population of Georgetown?
Total Female Population of Georgetown is 4,642.
What is the Ratio of Males per 100 Females in Georgetown?
There are 82.36 Males per 100 Females in Georgetown.
What is the Ratio of Females per 100 Males in Georgetown?
There are 121.42 Females per 100 Males in Georgetown.
What is the Median Population Age in Georgetown?
Median Population Age in Georgetown is 48.8 Years.
What is the Average Family Size in Georgetown
Average Family Size in Georgetown is 2.8 People.
What is the Average Household Size in Georgetown
Average Household Size in Georgetown is 2.2 People.
How Large is the Labor Force in Georgetown?
There are 4,096 People in the Labor Forcein in Georgetown.
What is the Percentage of People in the Labor Force in Georgetown?
54.9% of People are in the Labor Force in Georgetown.
What is the Unemployment Rate in Georgetown?
Unemployment Rate in Georgetown is 9.2%.