Rushville, IL Map & Demographics
Rushville Map
Rushville Overview
$31,939
PER CAPITA INCOME
$64,583
AVG FAMILY INCOME
$49,719
AVG HOUSEHOLD INCOME
7.5%
WAGE / INCOME GAP [ % ]
92.5¢/ $1
WAGE / INCOME GAP [ $ ]
0.41
INEQUALITY / GINI INDEX
2,610
TOTAL POPULATION
1,186
MALE POPULATION
1,424
FEMALE POPULATION
83.29
MALES / 100 FEMALES
120.07
FEMALES / 100 MALES
45.1
MEDIAN AGE
2.8
AVG FAMILY SIZE
2.0
AVG HOUSEHOLD SIZE
1,395
LABOR FORCE [ PEOPLE ]
64.0%
PERCENT IN LABOR FORCE
8.4%
UNEMPLOYMENT RATE
Rushville Zip Codes
Rushville Area Codes
Income in Rushville
Income Overview in Rushville
Per Capita Income in Rushville is $31,939, while median incomes of families and households are $64,583 and $49,719 respectively.
| Characteristic | Number | Measure |
| Per Capita Income | 2,610 | $31,939 |
| Median Family Income | 583 | $64,583 |
| Mean Family Income | 583 | $69,051 |
| Median Household Income | 1,252 | $49,719 |
| Mean Household Income | 1,252 | $66,636 |
| Income Deficit | 583 | $0 |
| Wage / Income Gap (%) | 2,610 | 7.45% |
| Wage / Income Gap ($) | 2,610 | 92.55¢ per $1 |
| Gini / Inequality Index | 2,610 | 0.41 |
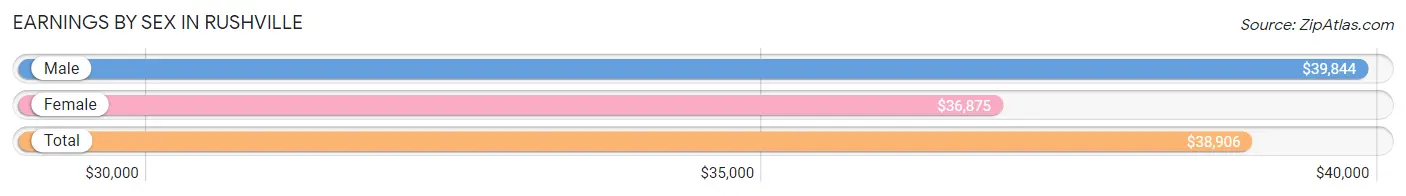
Earnings by Sex in Rushville
Average Earnings in Rushville are $38,906, $39,844 for men and $36,875 for women, a difference of 7.4%.
| Sex | Number | Average Earnings |
| Male | 749 (52.4%) | $39,844 |
| Female | 679 (47.5%) | $36,875 |
| Total | 1,428 (100.0%) | $38,906 |
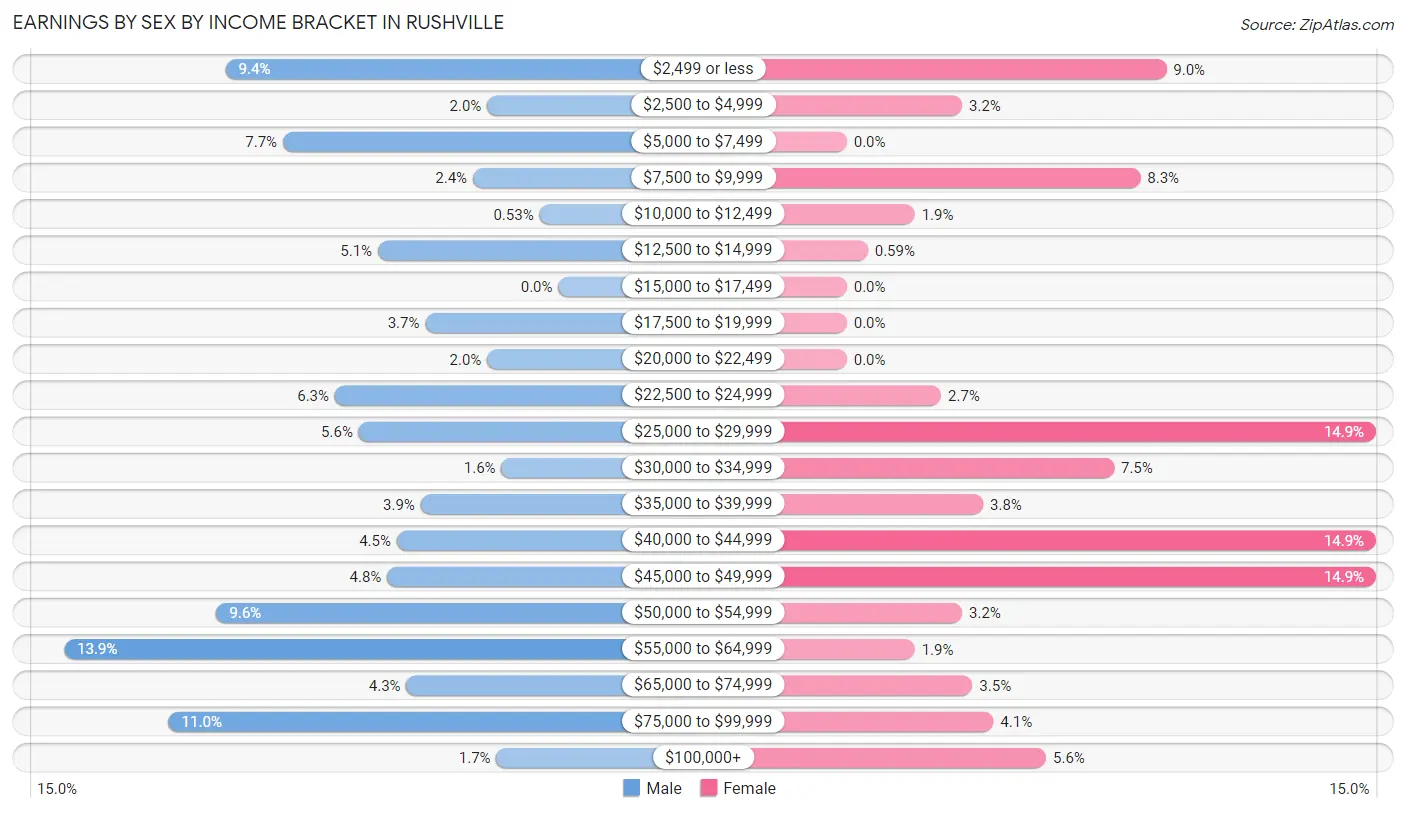
Earnings by Sex by Income Bracket in Rushville
The most common earnings brackets in Rushville are $55,000 to $64,999 for men (104 | 13.9%) and $25,000 to $29,999 for women (101 | 14.9%).
| Income | Male | Female |
| $2,499 or less | 70 (9.3%) | 61 (9.0%) |
| $2,500 to $4,999 | 15 (2.0%) | 22 (3.2%) |
| $5,000 to $7,499 | 58 (7.7%) | 0 (0.0%) |
| $7,500 to $9,999 | 18 (2.4%) | 56 (8.3%) |
| $10,000 to $12,499 | 4 (0.5%) | 13 (1.9%) |
| $12,500 to $14,999 | 38 (5.1%) | 4 (0.6%) |
| $15,000 to $17,499 | 0 (0.0%) | 0 (0.0%) |
| $17,500 to $19,999 | 28 (3.7%) | 0 (0.0%) |
| $20,000 to $22,499 | 15 (2.0%) | 0 (0.0%) |
| $22,500 to $24,999 | 47 (6.3%) | 18 (2.6%) |
| $25,000 to $29,999 | 42 (5.6%) | 101 (14.9%) |
| $30,000 to $34,999 | 12 (1.6%) | 51 (7.5%) |
| $35,000 to $39,999 | 29 (3.9%) | 26 (3.8%) |
| $40,000 to $44,999 | 34 (4.5%) | 101 (14.9%) |
| $45,000 to $49,999 | 36 (4.8%) | 101 (14.9%) |
| $50,000 to $54,999 | 72 (9.6%) | 22 (3.2%) |
| $55,000 to $64,999 | 104 (13.9%) | 13 (1.9%) |
| $65,000 to $74,999 | 32 (4.3%) | 24 (3.5%) |
| $75,000 to $99,999 | 82 (11.0%) | 28 (4.1%) |
| $100,000+ | 13 (1.7%) | 38 (5.6%) |
| Total | 749 (100.0%) | 679 (100.0%) |
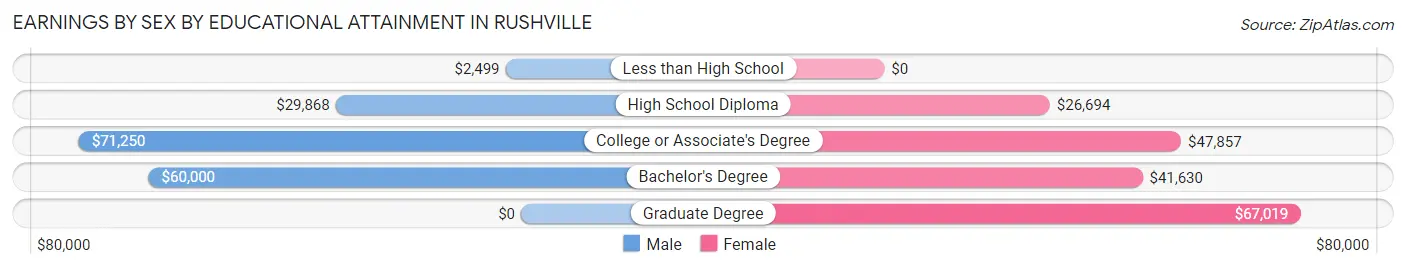
Earnings by Sex by Educational Attainment in Rushville
Average earnings in Rushville are $41,898 for men and $40,668 for women, a difference of 2.9%. Men with an educational attainment of college or associate's degree enjoy the highest average annual earnings of $71,250, while those with less than high school education earn the least with $2,499. Women with an educational attainment of graduate degree earn the most with the average annual earnings of $67,019, while those with high school diploma education have the smallest earnings of $26,694.
| Educational Attainment | Male Income | Female Income |
| Less than High School | $2,499 | $0 |
| High School Diploma | $29,868 | $26,694 |
| College or Associate's Degree | $71,250 | $47,857 |
| Bachelor's Degree | $60,000 | $41,630 |
| Graduate Degree | - | - |
| Total | $41,898 | $40,668 |
Family Income in Rushville
Family Income Brackets in Rushville
According to the Rushville family income data, there are 159 families falling into the $75,000 to $99,999 income range, which is the most common income bracket and makes up 27.3% of all families. Conversely, the $150,000 to $199,999 income bracket is the least frequent group with only 9 families (1.5%) belonging to this category.
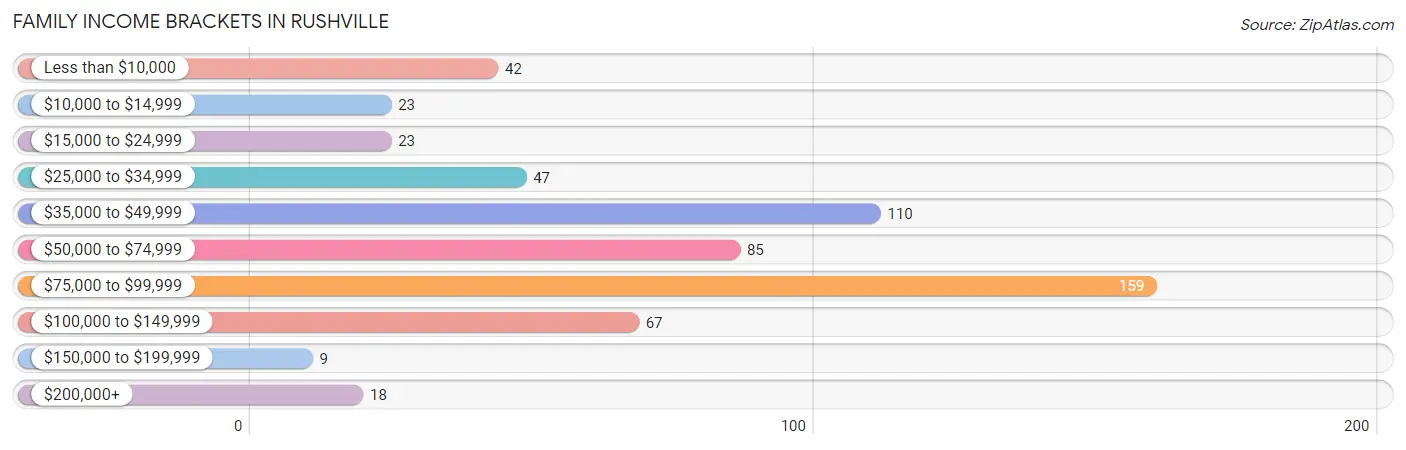
| Income Bracket | # Families | % Families |
| Less than $10,000 | 42 | 7.2% |
| $10,000 to $14,999 | 23 | 3.9% |
| $15,000 to $24,999 | 23 | 3.9% |
| $25,000 to $34,999 | 47 | 8.1% |
| $35,000 to $49,999 | 110 | 18.9% |
| $50,000 to $74,999 | 85 | 14.6% |
| $75,000 to $99,999 | 159 | 27.3% |
| $100,000 to $149,999 | 67 | 11.5% |
| $150,000 to $199,999 | 9 | 1.5% |
| $200,000+ | 18 | 3.1% |
Family Income by Famaliy Size in Rushville
4-person families (103 | 17.7%) account for the highest median family income in Rushville with $90,043 per family, while 2-person families (330 | 56.6%) have the highest median income of $27,812 per family member.
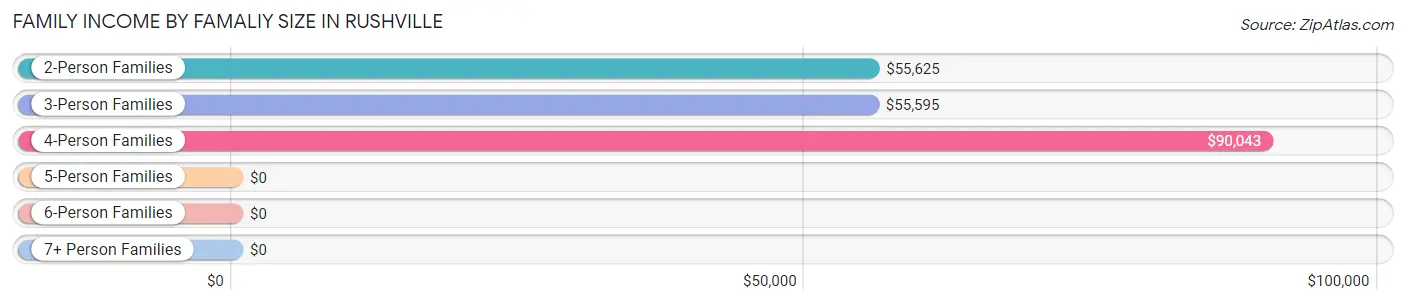
| Income Bracket | # Families | Median Income |
| 2-Person Families | 330 (56.6%) | $55,625 |
| 3-Person Families | 104 (17.8%) | $55,595 |
| 4-Person Families | 103 (17.7%) | $90,043 |
| 5-Person Families | 40 (6.9%) | $0 |
| 6-Person Families | 6 (1.0%) | $0 |
| 7+ Person Families | 0 (0.0%) | $0 |
| Total | 583 (100.0%) | $64,583 |
Family Income by Number of Earners in Rushville
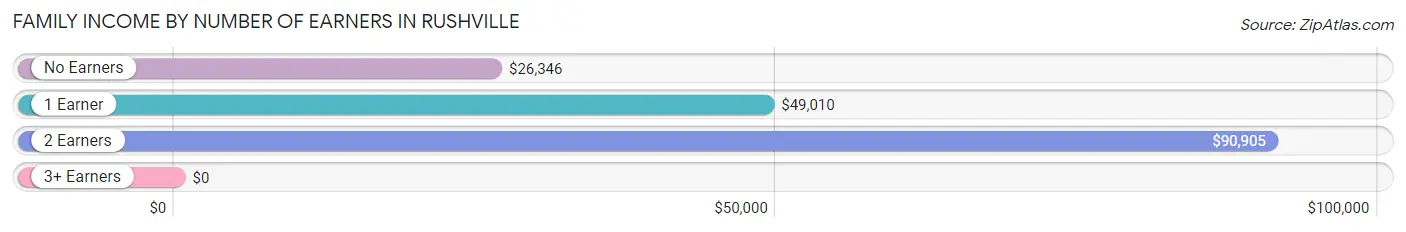
| Number of Earners | # Families | Median Income |
| No Earners | 130 (22.3%) | $26,346 |
| 1 Earner | 129 (22.1%) | $49,010 |
| 2 Earners | 297 (50.9%) | $90,905 |
| 3+ Earners | 27 (4.6%) | $0 |
| Total | 583 (100.0%) | $64,583 |
Household Income in Rushville
Household Income Brackets in Rushville
With 255 households falling in the category, the $35,000 to $49,999 income range is the most frequent in Rushville, accounting for 20.4% of all households. In contrast, only 9 households (0.7%) fall into the $150,000 to $199,999 income bracket, making it the least populous group.
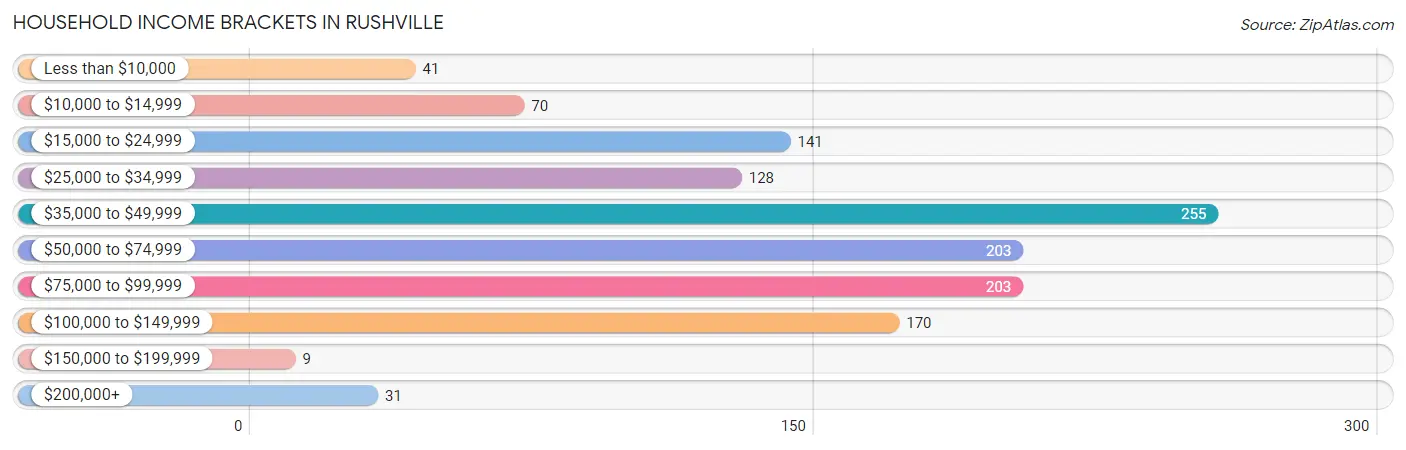
| Income Bracket | # Households | % Households |
| Less than $10,000 | 41 | 3.3% |
| $10,000 to $14,999 | 70 | 5.6% |
| $15,000 to $24,999 | 141 | 11.3% |
| $25,000 to $34,999 | 128 | 10.2% |
| $35,000 to $49,999 | 255 | 20.4% |
| $50,000 to $74,999 | 203 | 16.2% |
| $75,000 to $99,999 | 203 | 16.2% |
| $100,000 to $149,999 | 170 | 13.6% |
| $150,000 to $199,999 | 9 | 0.7% |
| $200,000+ | 31 | 2.5% |
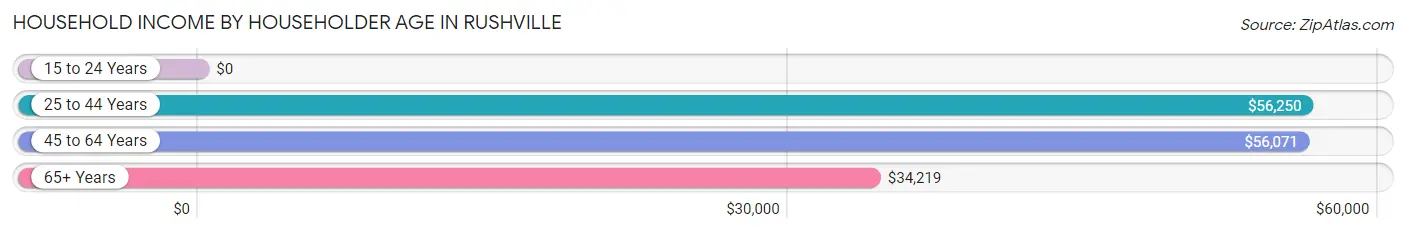
Household Income by Householder Age in Rushville
The median household income in Rushville is $49,719, with the highest median household income of $56,250 found in the 25 to 44 years age bracket for the primary householder. A total of 369 households (29.5%) fall into this category. Meanwhile, the 15 to 24 years age bracket for the primary householder has the lowest median household income of $0, with 50 households (4.0%) in this group.
| Income Bracket | # Households | Median Income |
| 15 to 24 Years | 50 (4.0%) | $0 |
| 25 to 44 Years | 369 (29.5%) | $56,250 |
| 45 to 64 Years | 444 (35.5%) | $56,071 |
| 65+ Years | 389 (31.1%) | $34,219 |
| Total | 1,252 (100.0%) | $49,719 |
Poverty in Rushville
Income Below Poverty by Sex and Age in Rushville
With 18.9% poverty level for males and 15.2% for females among the residents of Rushville, under 5 year old males and 5 year old females are the most vulnerable to poverty, with 33 males (55.0%) and 24 females (72.7%) in their respective age groups living below the poverty level.
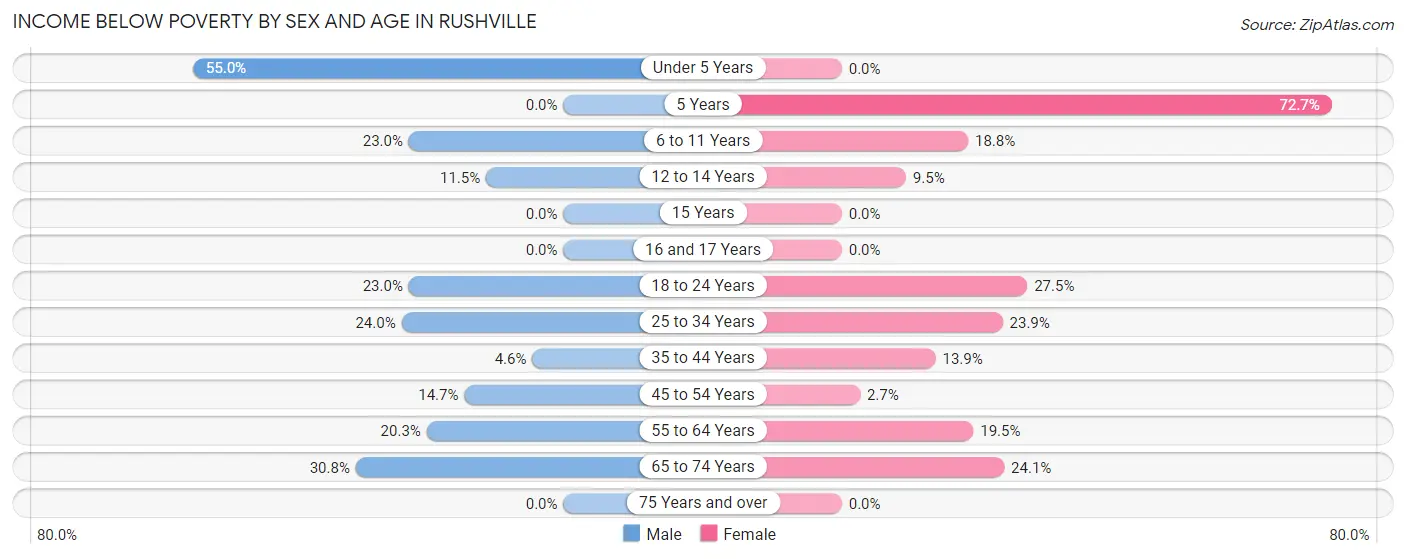
| Age Bracket | Male | Female |
| Under 5 Years | 33 (55.0%) | 0 (0.0%) |
| 5 Years | 0 (0.0%) | 24 (72.7%) |
| 6 to 11 Years | 14 (23.0%) | 12 (18.8%) |
| 12 to 14 Years | 7 (11.5%) | 8 (9.5%) |
| 15 Years | 0 (0.0%) | 0 (0.0%) |
| 16 and 17 Years | 0 (0.0%) | 0 (0.0%) |
| 18 to 24 Years | 31 (23.0%) | 19 (27.5%) |
| 25 to 34 Years | 44 (24.0%) | 48 (23.9%) |
| 35 to 44 Years | 7 (4.6%) | 11 (13.9%) |
| 45 to 54 Years | 20 (14.7%) | 5 (2.7%) |
| 55 to 64 Years | 27 (20.3%) | 42 (19.5%) |
| 65 to 74 Years | 37 (30.8%) | 34 (24.1%) |
| 75 Years and over | 0 (0.0%) | 0 (0.0%) |
| Total | 220 (18.9%) | 203 (15.2%) |
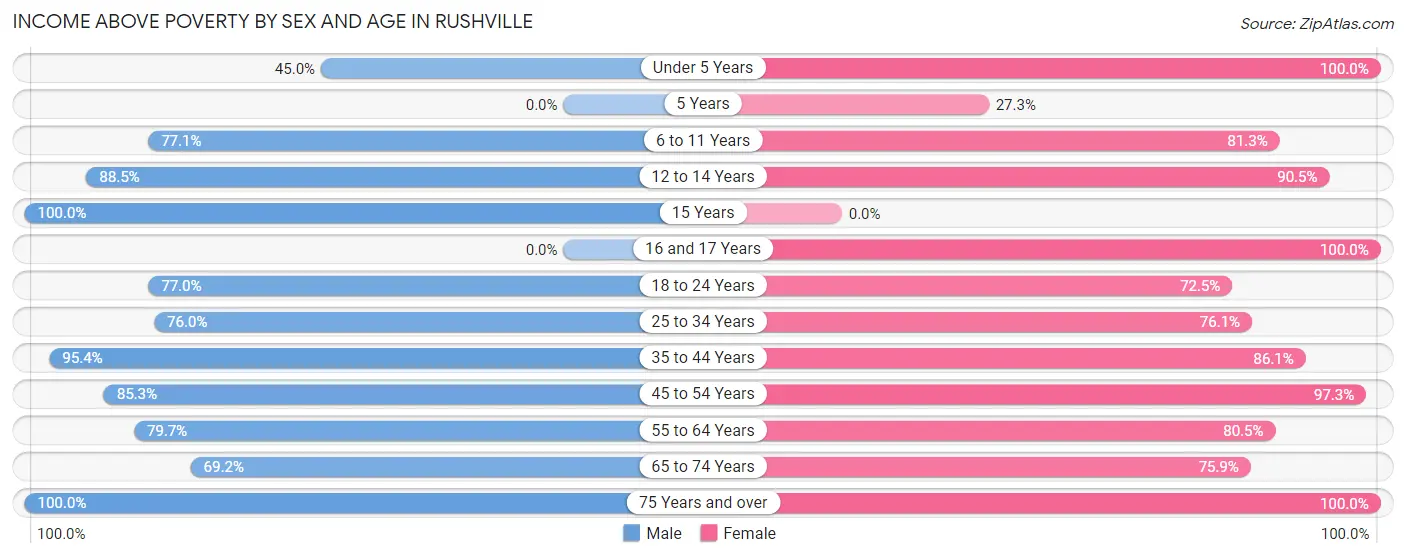
Income Above Poverty by Sex and Age in Rushville
According to the poverty statistics in Rushville, males aged 15 years and females aged under 5 years are the age groups that are most secure financially, with 100.0% of males and 100.0% of females in these age groups living above the poverty line.
| Age Bracket | Male | Female |
| Under 5 Years | 27 (45.0%) | 25 (100.0%) |
| 5 Years | 0 (0.0%) | 9 (27.3%) |
| 6 to 11 Years | 47 (77.0%) | 52 (81.2%) |
| 12 to 14 Years | 54 (88.5%) | 76 (90.5%) |
| 15 Years | 11 (100.0%) | 0 (0.0%) |
| 16 and 17 Years | 0 (0.0%) | 31 (100.0%) |
| 18 to 24 Years | 104 (77.0%) | 50 (72.5%) |
| 25 to 34 Years | 139 (76.0%) | 153 (76.1%) |
| 35 to 44 Years | 145 (95.4%) | 68 (86.1%) |
| 45 to 54 Years | 116 (85.3%) | 180 (97.3%) |
| 55 to 64 Years | 106 (79.7%) | 173 (80.5%) |
| 65 to 74 Years | 83 (69.2%) | 107 (75.9%) |
| 75 Years and over | 111 (100.0%) | 206 (100.0%) |
| Total | 943 (81.1%) | 1,130 (84.8%) |
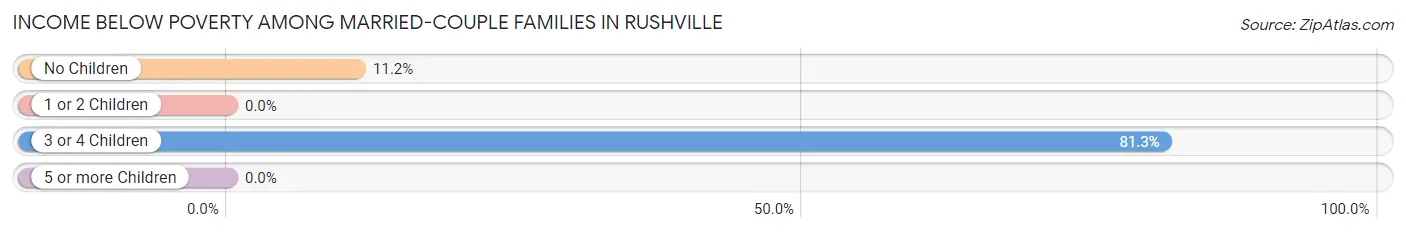
Income Below Poverty Among Married-Couple Families in Rushville
The poverty statistics for married-couple families in Rushville show that 14.8% or 59 of the total 398 families live below the poverty line. Families with 3 or 4 children have the highest poverty rate of 81.2%, comprising of 26 families. On the other hand, families with 1 or 2 children have the lowest poverty rate of 0.0%, which includes 0 families.
| Children | Above Poverty | Below Poverty |
| No Children | 263 (88.8%) | 33 (11.2%) |
| 1 or 2 Children | 70 (100.0%) | 0 (0.0%) |
| 3 or 4 Children | 6 (18.8%) | 26 (81.2%) |
| 5 or more Children | 0 (0.0%) | 0 (0.0%) |
| Total | 339 (85.2%) | 59 (14.8%) |
Income Below Poverty Among Single-Parent Households in Rushville
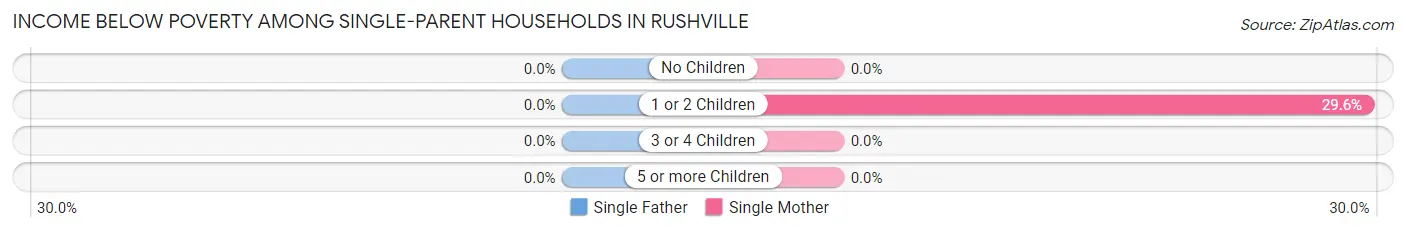
| Children | Single Father | Single Mother |
| No Children | 0 (0.0%) | 0 (0.0%) |
| 1 or 2 Children | 0 (0.0%) | 32 (29.6%) |
| 3 or 4 Children | 0 (0.0%) | 0 (0.0%) |
| 5 or more Children | 0 (0.0%) | 0 (0.0%) |
| Total | 0 (0.0%) | 32 (19.5%) |
Income Below Poverty Among Married-Couple vs Single-Parent Households in Rushville
The poverty data for Rushville shows that 59 of the married-couple family households (14.8%) and 32 of the single-parent households (17.3%) are living below the poverty level. Within the married-couple family households, those with 3 or 4 children have the highest poverty rate, with 26 households (81.2%) falling below the poverty line. Among the single-parent households, those with 1 or 2 children have the highest poverty rate, with 32 household (26.2%) living below poverty.
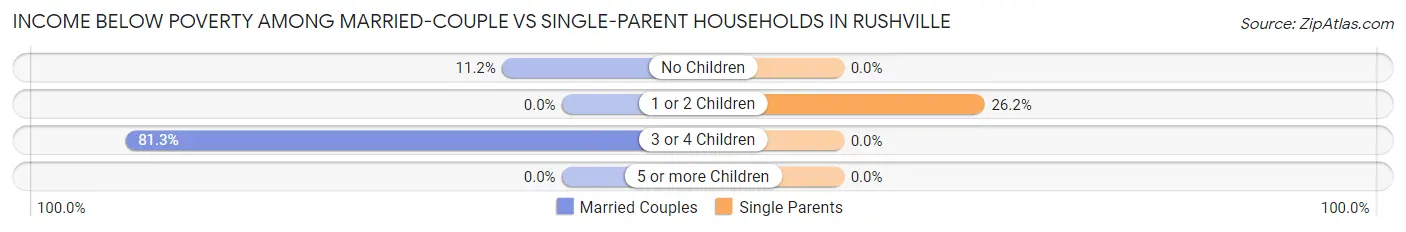
| Children | Married-Couple Families | Single-Parent Households |
| No Children | 33 (11.2%) | 0 (0.0%) |
| 1 or 2 Children | 0 (0.0%) | 32 (26.2%) |
| 3 or 4 Children | 26 (81.2%) | 0 (0.0%) |
| 5 or more Children | 0 (0.0%) | 0 (0.0%) |
| Total | 59 (14.8%) | 32 (17.3%) |
Race in Rushville
The most populous races in Rushville are White / Caucasian (2,484 | 95.2%), Black / African American (88 | 3.4%), and Hispanic or Latino (75 | 2.9%).
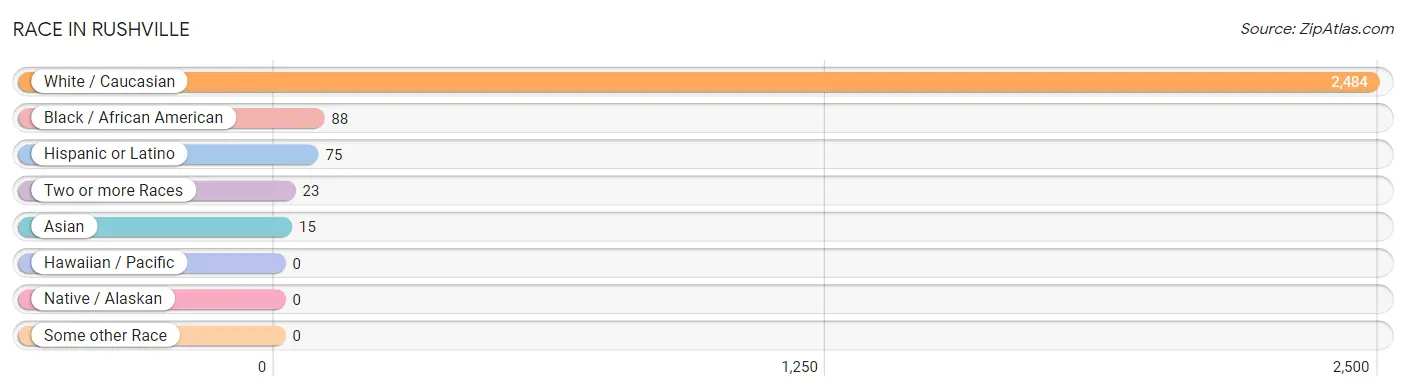
| Race | # Population | % Population |
| Asian | 15 | 0.6% |
| Black / African American | 88 | 3.4% |
| Hawaiian / Pacific | 0 | 0.0% |
| Hispanic or Latino | 75 | 2.9% |
| Native / Alaskan | 0 | 0.0% |
| White / Caucasian | 2,484 | 95.2% |
| Two or more Races | 23 | 0.9% |
| Some other Race | 0 | 0.0% |
| Total | 2,610 | 100.0% |
Ancestry in Rushville
The most populous ancestries reported in Rushville are English (418 | 16.0%), American (366 | 14.0%), German (312 | 11.9%), Irish (237 | 9.1%), and French (108 | 4.1%), together accounting for 55.2% of all Rushville residents.
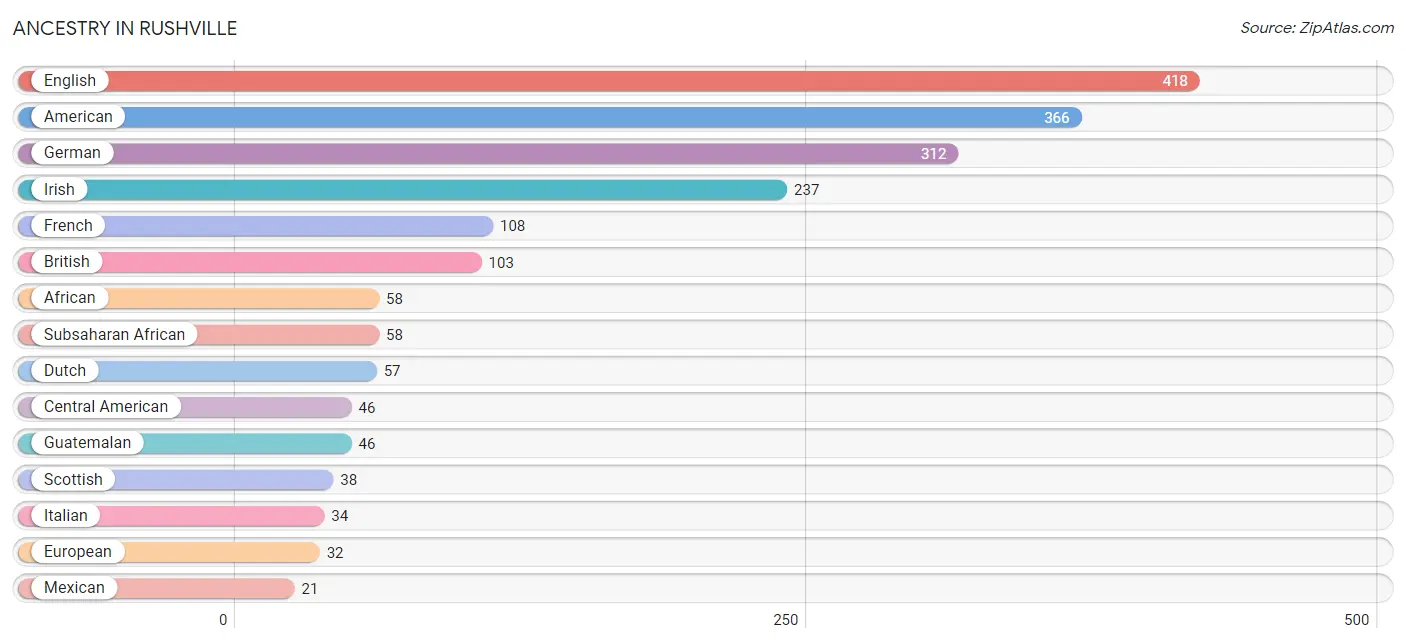
| Ancestry | # Population | % Population |
| African | 58 | 2.2% |
| American | 366 | 14.0% |
| British | 103 | 4.0% |
| Central American | 46 | 1.8% |
| Cherokee | 15 | 0.6% |
| Dutch | 57 | 2.2% |
| English | 418 | 16.0% |
| European | 32 | 1.2% |
| French | 108 | 4.1% |
| German | 312 | 11.9% |
| Guatemalan | 46 | 1.8% |
| Irish | 237 | 9.1% |
| Italian | 34 | 1.3% |
| Korean | 3 | 0.1% |
| Mexican | 21 | 0.8% |
| Norwegian | 16 | 0.6% |
| Pennsylvania German | 10 | 0.4% |
| Puerto Rican | 3 | 0.1% |
| Scandinavian | 9 | 0.3% |
| Scotch-Irish | 21 | 0.8% |
| Scottish | 38 | 1.5% |
| Sioux | 2 | 0.1% |
| Spaniard | 5 | 0.2% |
| Subsaharan African | 58 | 2.2% |
| Thai | 15 | 0.6% | View All 25 Rows |
Immigrants in Rushville
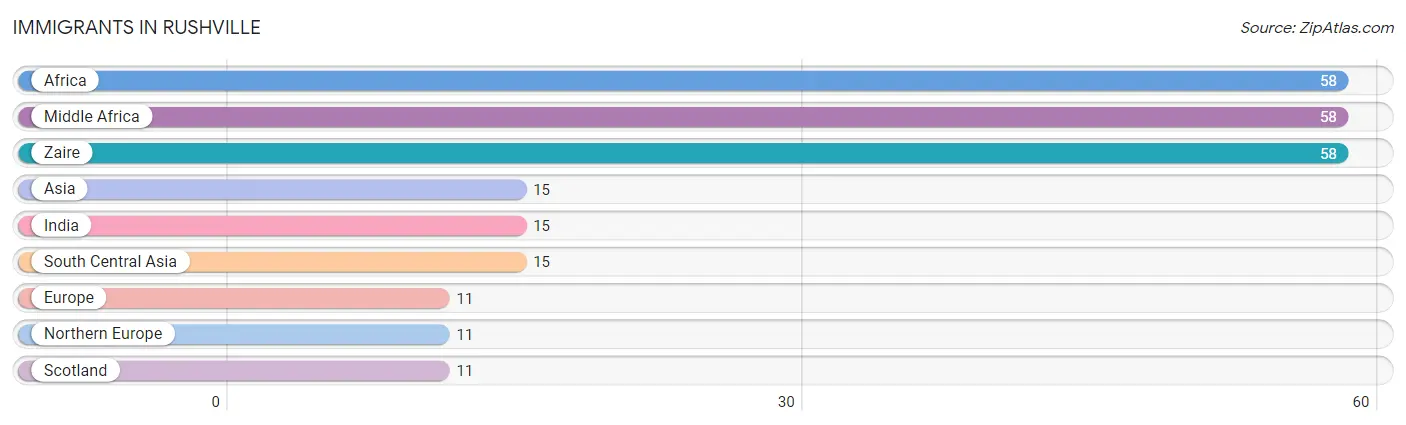
The most numerous immigrant groups reported in Rushville came from Africa (58 | 2.2%), Middle Africa (58 | 2.2%), Zaire (58 | 2.2%), Asia (15 | 0.6%), and India (15 | 0.6%), together accounting for 7.8% of all Rushville residents.
| Immigration Origin | # Population | % Population |
| Africa | 58 | 2.2% |
| Asia | 15 | 0.6% |
| Europe | 11 | 0.4% |
| India | 15 | 0.6% |
| Middle Africa | 58 | 2.2% |
| Northern Europe | 11 | 0.4% |
| Scotland | 11 | 0.4% |
| South Central Asia | 15 | 0.6% |
| Zaire | 58 | 2.2% | View All 9 Rows |
Sex and Age in Rushville
Sex and Age in Rushville
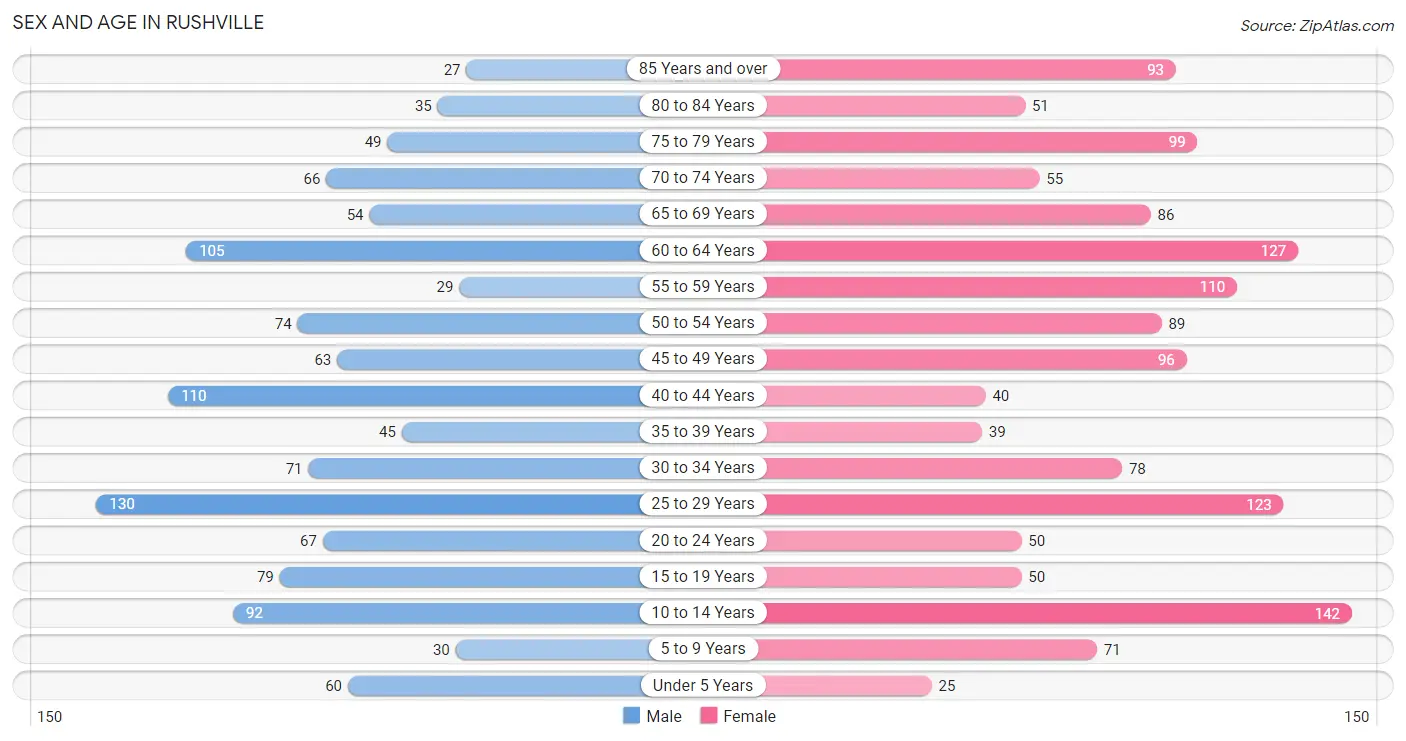
The most populous age groups in Rushville are 25 to 29 Years (130 | 11.0%) for men and 10 to 14 Years (142 | 10.0%) for women.
| Age Bracket | Male | Female |
| Under 5 Years | 60 (5.1%) | 25 (1.8%) |
| 5 to 9 Years | 30 (2.5%) | 71 (5.0%) |
| 10 to 14 Years | 92 (7.8%) | 142 (10.0%) |
| 15 to 19 Years | 79 (6.7%) | 50 (3.5%) |
| 20 to 24 Years | 67 (5.7%) | 50 (3.5%) |
| 25 to 29 Years | 130 (11.0%) | 123 (8.6%) |
| 30 to 34 Years | 71 (6.0%) | 78 (5.5%) |
| 35 to 39 Years | 45 (3.8%) | 39 (2.7%) |
| 40 to 44 Years | 110 (9.3%) | 40 (2.8%) |
| 45 to 49 Years | 63 (5.3%) | 96 (6.7%) |
| 50 to 54 Years | 74 (6.2%) | 89 (6.2%) |
| 55 to 59 Years | 29 (2.5%) | 110 (7.7%) |
| 60 to 64 Years | 105 (8.8%) | 127 (8.9%) |
| 65 to 69 Years | 54 (4.5%) | 86 (6.0%) |
| 70 to 74 Years | 66 (5.6%) | 55 (3.9%) |
| 75 to 79 Years | 49 (4.1%) | 99 (7.0%) |
| 80 to 84 Years | 35 (2.9%) | 51 (3.6%) |
| 85 Years and over | 27 (2.3%) | 93 (6.5%) |
| Total | 1,186 (100.0%) | 1,424 (100.0%) |
Families and Households in Rushville
Median Family Size in Rushville
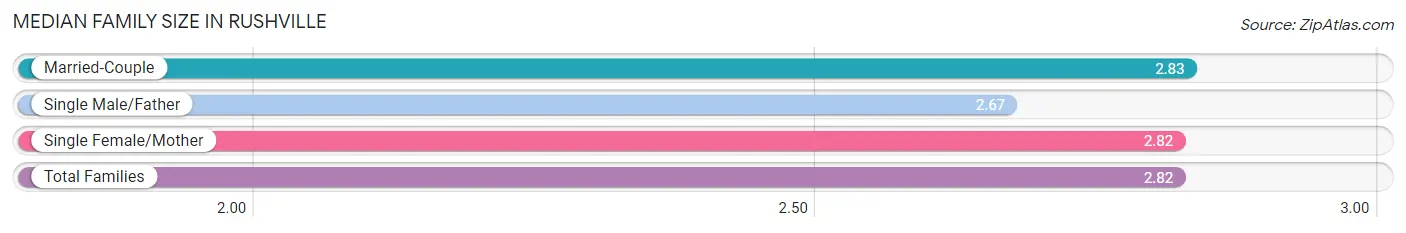
The median family size in Rushville is 2.82 persons per family, with married-couple families (398 | 68.3%) accounting for the largest median family size of 2.83 persons per family. On the other hand, single male/father families (21 | 3.6%) represent the smallest median family size with 2.67 persons per family.
| Family Type | # Families | Family Size |
| Married-Couple | 398 (68.3%) | 2.83 |
| Single Male/Father | 21 (3.6%) | 2.67 |
| Single Female/Mother | 164 (28.1%) | 2.82 |
| Total Families | 583 (100.0%) | 2.82 |
Median Household Size in Rushville
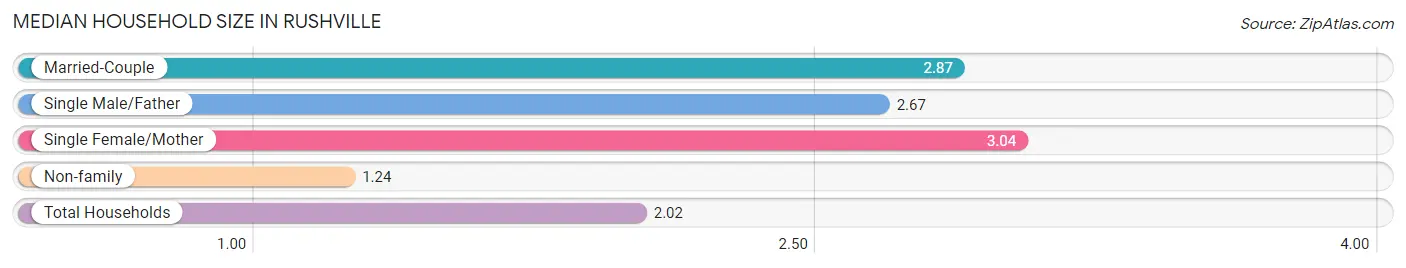
The median household size in Rushville is 2.02 persons per household, with single female/mother households (164 | 13.1%) accounting for the largest median household size of 3.04 persons per household. non-family households (669 | 53.4%) represent the smallest median household size with 1.24 persons per household.
| Household Type | # Households | Household Size |
| Married-Couple | 398 (31.8%) | 2.87 |
| Single Male/Father | 21 (1.7%) | 2.67 |
| Single Female/Mother | 164 (13.1%) | 3.04 |
| Non-family | 669 (53.4%) | 1.24 |
| Total Households | 1,252 (100.0%) | 2.02 |
Household Size by Marriage Status in Rushville
Out of a total of 1,252 households in Rushville, 583 (46.6%) are family households, while 669 (53.4%) are nonfamily households. The most numerous type of family households are 2-person households, comprising 324, and the most common type of nonfamily households are 1-person households, comprising 522.
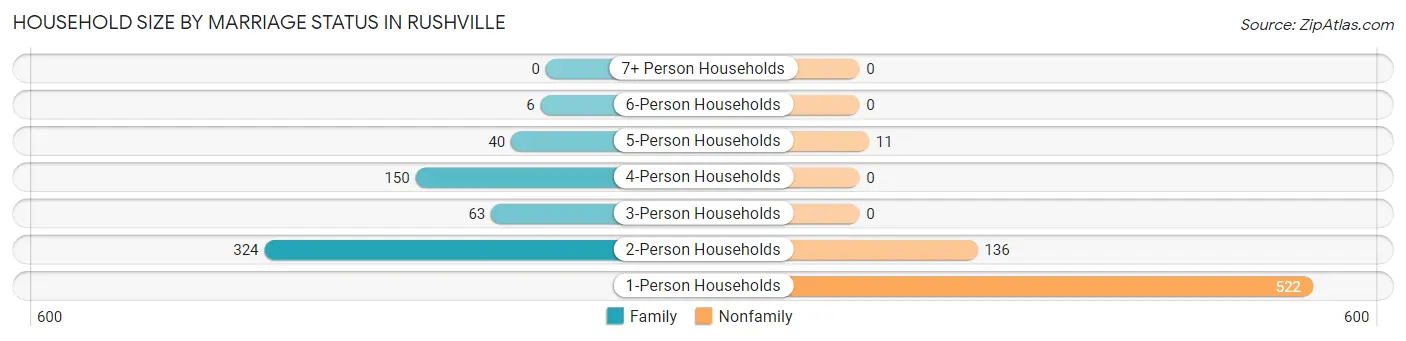
| Household Size | Family Households | Nonfamily Households |
| 1-Person Households | - | 522 (41.7%) |
| 2-Person Households | 324 (25.9%) | 136 (10.9%) |
| 3-Person Households | 63 (5.0%) | 0 (0.0%) |
| 4-Person Households | 150 (12.0%) | 0 (0.0%) |
| 5-Person Households | 40 (3.2%) | 11 (0.9%) |
| 6-Person Households | 6 (0.5%) | 0 (0.0%) |
| 7+ Person Households | 0 (0.0%) | 0 (0.0%) |
| Total | 583 (46.6%) | 669 (53.4%) |
Female Fertility in Rushville
Fertility by Age in Rushville
Average fertility rate in Rushville is 79.0 births per 1,000 women. Women in the age bracket of 20 to 34 years have the highest fertility rate with 159.0 births per 1,000 women. Women in the age bracket of 20 to 34 years acount for 100.0% of all women with births.
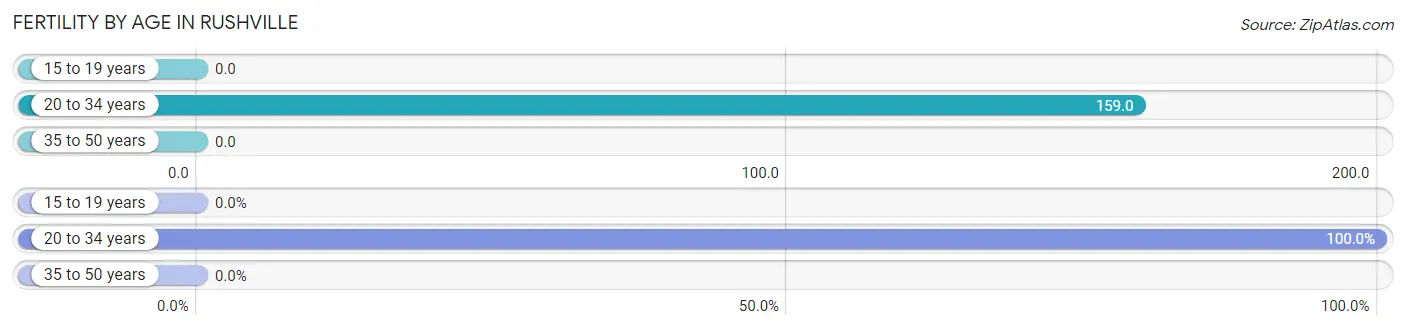
| Age Bracket | Women with Births | Births / 1,000 Women |
| 15 to 19 years | 0 (0.0%) | 0.0 |
| 20 to 34 years | 40 (100.0%) | 159.0 |
| 35 to 50 years | 0 (0.0%) | 0.0 |
| Total | 40 (100.0%) | 79.0 |
Fertility by Age by Marriage Status in Rushville
55.0% of women with births (40) in Rushville are married. The highest percentage of unmarried women with births falls into 20 to 34 years age bracket with 45.0% of them unmarried at the time of birth, while the lowest percentage of unmarried women with births belong to 20 to 34 years age bracket with 45.0% of them unmarried.
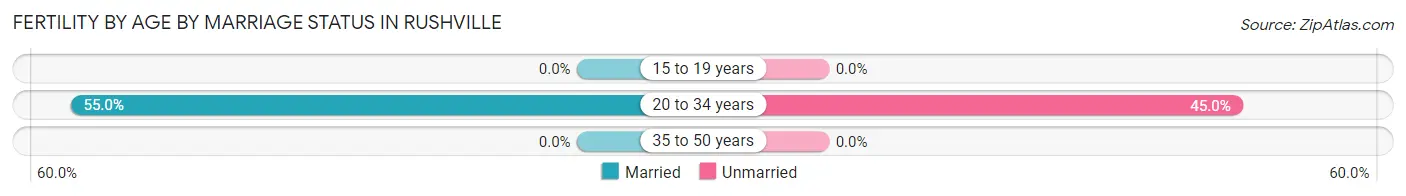
| Age Bracket | Married | Unmarried |
| 15 to 19 years | 0 (0.0%) | 0 (0.0%) |
| 20 to 34 years | 22 (55.0%) | 18 (45.0%) |
| 35 to 50 years | 0 (0.0%) | 0 (0.0%) |
| Total | 22 (55.0%) | 18 (45.0%) |
Fertility by Education in Rushville
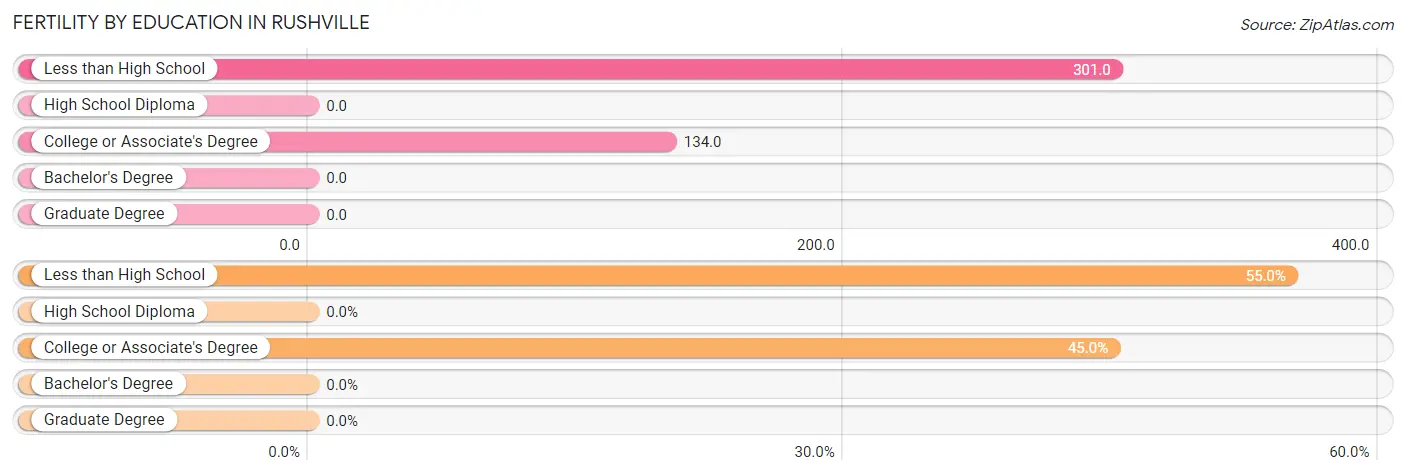
| Educational Attainment | Women with Births | Births / 1,000 Women |
| Less than High School | 22 (55.0%) | 301.0 |
| High School Diploma | 0 (0.0%) | 0.0 |
| College or Associate's Degree | 18 (45.0%) | 134.0 |
| Bachelor's Degree | 0 (0.0%) | 0.0 |
| Graduate Degree | 0 (0.0%) | 0.0 |
| Total | 40 (100.0%) | 79.0 |
Fertility by Education by Marriage Status in Rushville
45.0% of women with births in Rushville are unmarried. Women with the educational attainment of less than high school are most likely to be married with 100.0% of them married at childbirth, while women with the educational attainment of college or associate's degree are least likely to be married with 100.0% of them unmarried at childbirth.
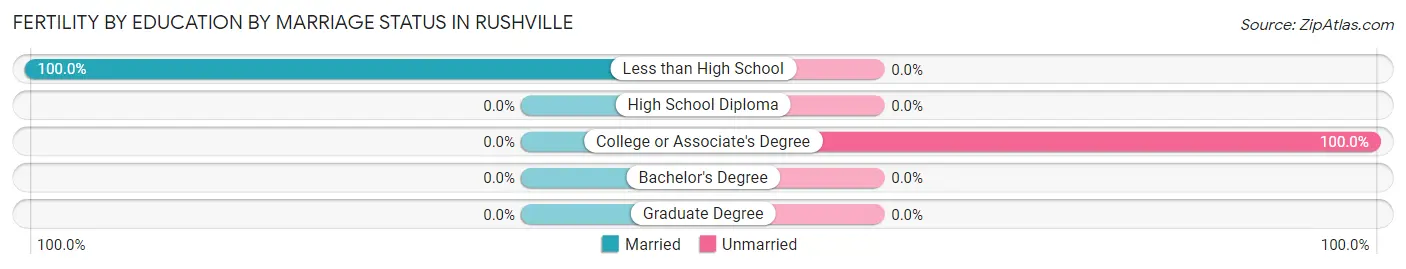
| Educational Attainment | Married | Unmarried |
| Less than High School | 22 (100.0%) | 0 (0.0%) |
| High School Diploma | 0 (0.0%) | 0 (0.0%) |
| College or Associate's Degree | 0 (0.0%) | 18 (100.0%) |
| Bachelor's Degree | 0 (0.0%) | 0 (0.0%) |
| Graduate Degree | 0 (0.0%) | 0 (0.0%) |
| Total | 22 (55.0%) | 18 (45.0%) |
Employment Characteristics in Rushville
Employment by Class of Employer in Rushville
Among the 1,277 employed individuals in Rushville, private company employees (800 | 62.6%), state government employees (161 | 12.6%), and local government employees (155 | 12.1%) make up the most common classes of employment.
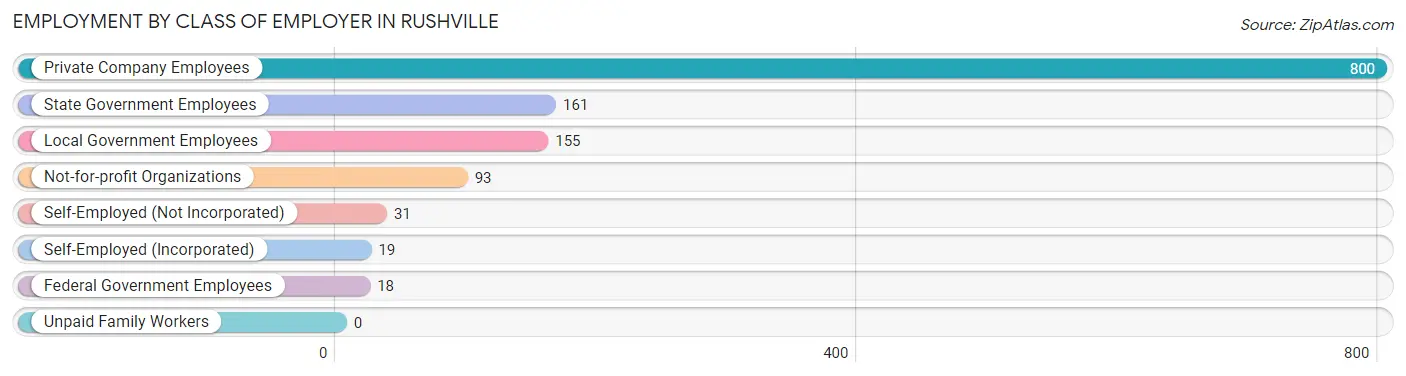
| Employer Class | # Employees | % Employees |
| Private Company Employees | 800 | 62.6% |
| Self-Employed (Incorporated) | 19 | 1.5% |
| Self-Employed (Not Incorporated) | 31 | 2.4% |
| Not-for-profit Organizations | 93 | 7.3% |
| Local Government Employees | 155 | 12.1% |
| State Government Employees | 161 | 12.6% |
| Federal Government Employees | 18 | 1.4% |
| Unpaid Family Workers | 0 | 0.0% |
| Total | 1,277 | 100.0% |
Employment Status by Age in Rushville
According to the labor force statistics for Rushville, out of the total population over 16 years of age (2,179), 64.0% or 1,395 individuals are in the labor force, with 8.4% or 117 of them unemployed. The age group with the highest labor force participation rate is 35 to 44 years, with 93.2% or 218 individuals in the labor force. Within the labor force, the 60 to 64 years age range has the highest percentage of unemployed individuals, with 26.5% or 52 of them being unemployed.
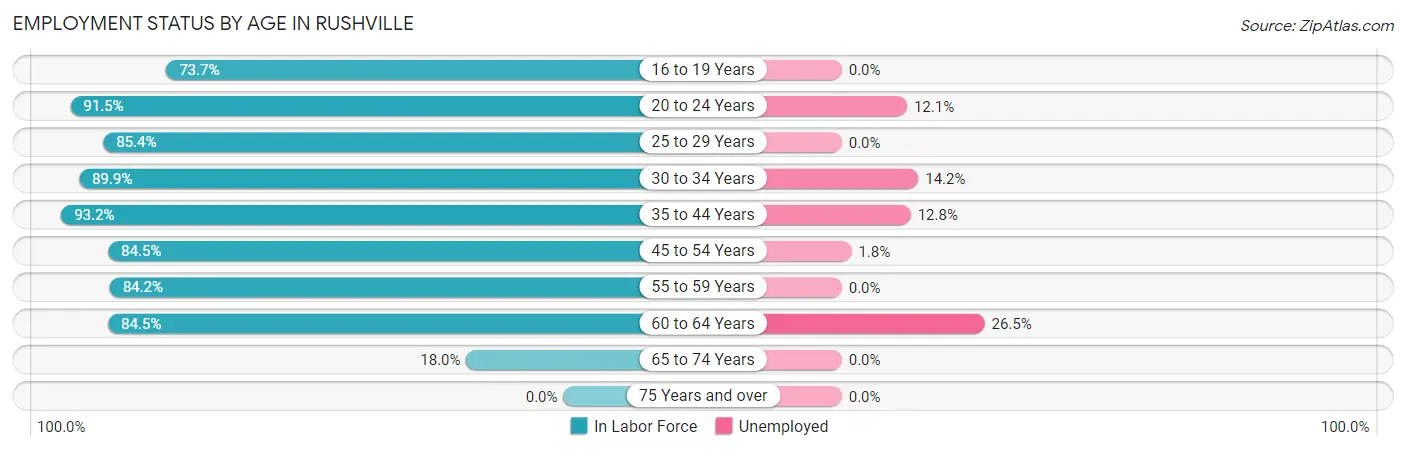
| Age Bracket | In Labor Force | Unemployed |
| 16 to 19 Years | 87 (73.7%) | 0 (0.0%) |
| 20 to 24 Years | 107 (91.5%) | 13 (12.1%) |
| 25 to 29 Years | 216 (85.4%) | 0 (0.0%) |
| 30 to 34 Years | 134 (89.9%) | 19 (14.2%) |
| 35 to 44 Years | 218 (93.2%) | 28 (12.8%) |
| 45 to 54 Years | 272 (84.5%) | 5 (1.8%) |
| 55 to 59 Years | 117 (84.2%) | 0 (0.0%) |
| 60 to 64 Years | 196 (84.5%) | 52 (26.5%) |
| 65 to 74 Years | 47 (18.0%) | 0 (0.0%) |
| 75 Years and over | 0 (0.0%) | 0 (0.0%) |
| Total | 1,395 (64.0%) | 117 (8.4%) |
Employment Status by Educational Attainment in Rushville
According to labor force statistics for Rushville, 86.8% of individuals (1,154) out of the total population between 25 and 64 years of age (1,329) are in the labor force, with 9.0% or 104 of them being unemployed. The group with the highest labor force participation rate are those with the educational attainment of bachelor's degree or higher, with 93.8% or 241 individuals in the labor force. Within the labor force, individuals with less than high school education have the highest percentage of unemployment, with 52.9% or 27 of them being unemployed.
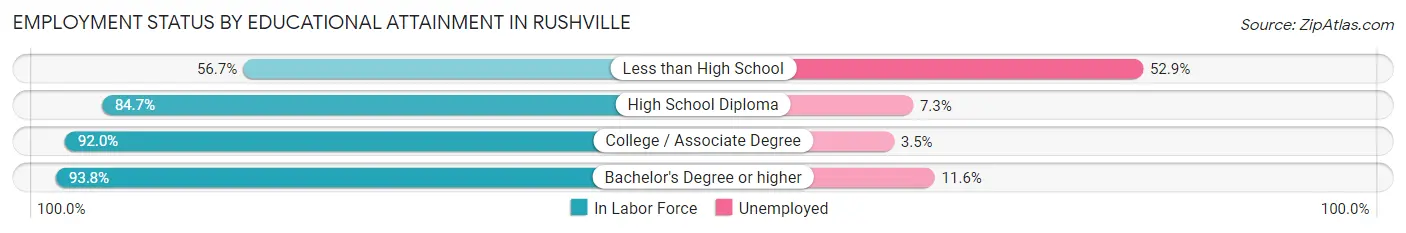
| Educational Attainment | In Labor Force | Unemployed |
| Less than High School | 51 (56.7%) | 48 (52.9%) |
| High School Diploma | 492 (84.7%) | 42 (7.3%) |
| College / Associate Degree | 369 (92.0%) | 14 (3.5%) |
| Bachelor's Degree or higher | 241 (93.8%) | 30 (11.6%) |
| Total | 1,154 (86.8%) | 120 (9.0%) |
Employment Occupations by Sex in Rushville
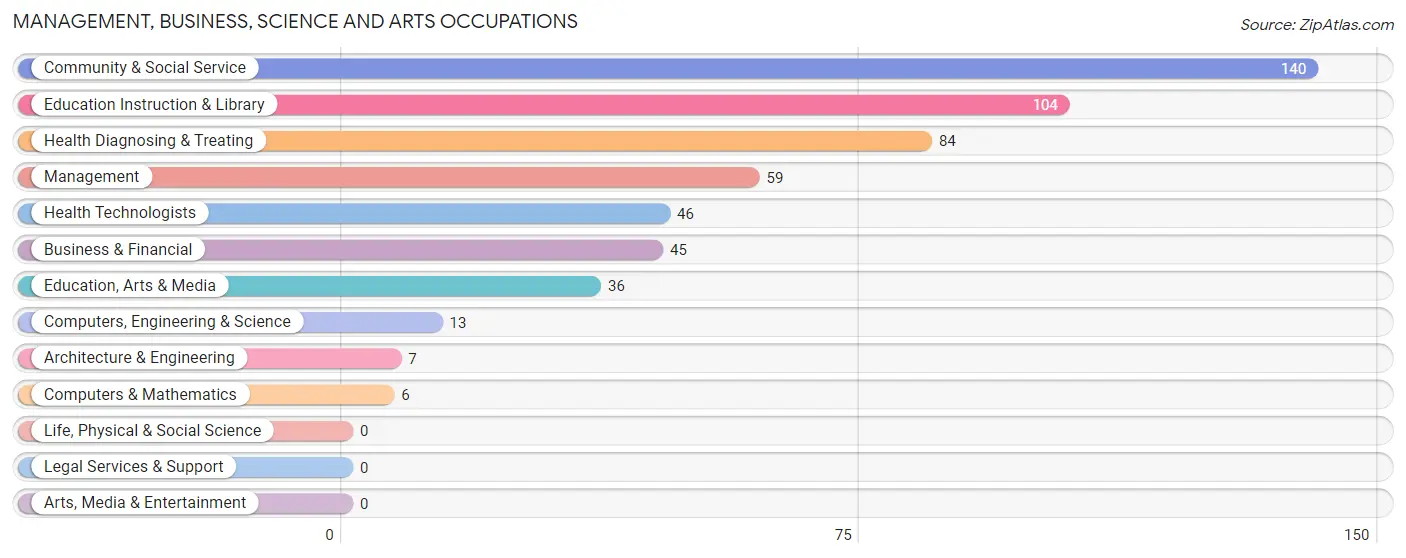
Management, Business, Science and Arts Occupations
The most common Management, Business, Science and Arts occupations in Rushville are Community & Social Service (140 | 11.0%), Education Instruction & Library (104 | 8.1%), Health Diagnosing & Treating (84 | 6.6%), Management (59 | 4.6%), and Health Technologists (46 | 3.6%).
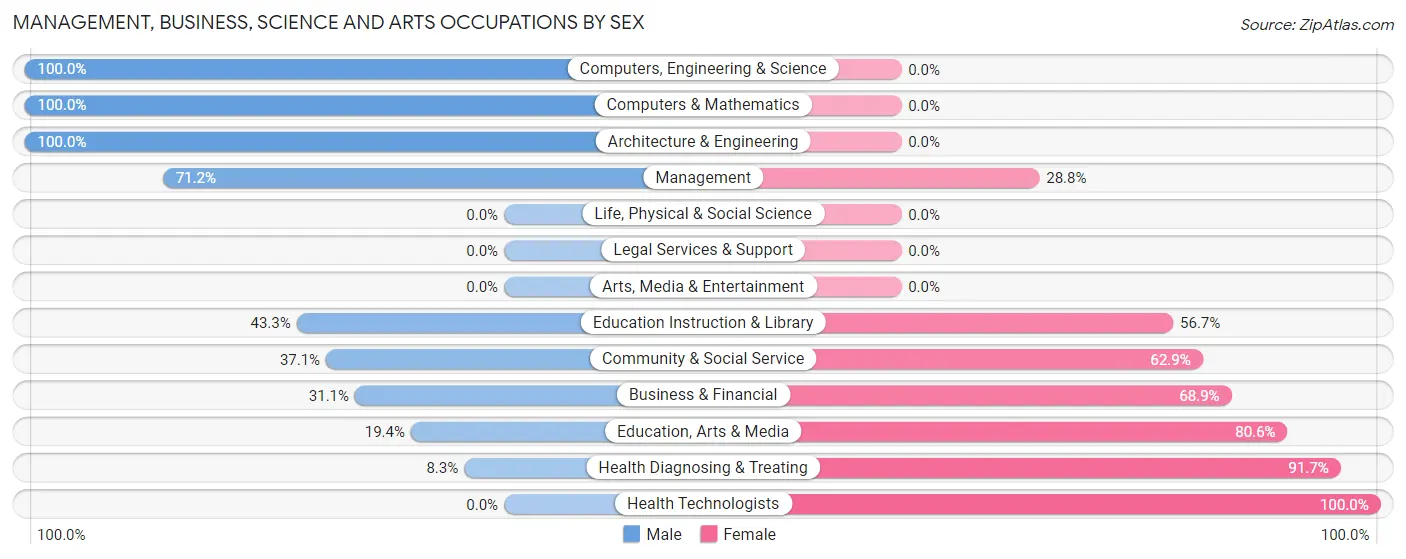
Management, Business, Science and Arts Occupations by Sex
Within the Management, Business, Science and Arts occupations in Rushville, the most male-oriented occupations are Computers, Engineering & Science (100.0%), Computers & Mathematics (100.0%), and Architecture & Engineering (100.0%), while the most female-oriented occupations are Health Technologists (100.0%), Health Diagnosing & Treating (91.7%), and Education, Arts & Media (80.6%).
| Occupation | Male | Female |
| Management | 42 (71.2%) | 17 (28.8%) |
| Business & Financial | 14 (31.1%) | 31 (68.9%) |
| Computers, Engineering & Science | 13 (100.0%) | 0 (0.0%) |
| Computers & Mathematics | 6 (100.0%) | 0 (0.0%) |
| Architecture & Engineering | 7 (100.0%) | 0 (0.0%) |
| Life, Physical & Social Science | 0 (0.0%) | 0 (0.0%) |
| Community & Social Service | 52 (37.1%) | 88 (62.9%) |
| Education, Arts & Media | 7 (19.4%) | 29 (80.6%) |
| Legal Services & Support | 0 (0.0%) | 0 (0.0%) |
| Education Instruction & Library | 45 (43.3%) | 59 (56.7%) |
| Arts, Media & Entertainment | 0 (0.0%) | 0 (0.0%) |
| Health Diagnosing & Treating | 7 (8.3%) | 77 (91.7%) |
| Health Technologists | 0 (0.0%) | 46 (100.0%) |
| Total (Category) | 128 (37.5%) | 213 (62.5%) |
| Total (Overall) | 625 (48.9%) | 652 (51.1%) |
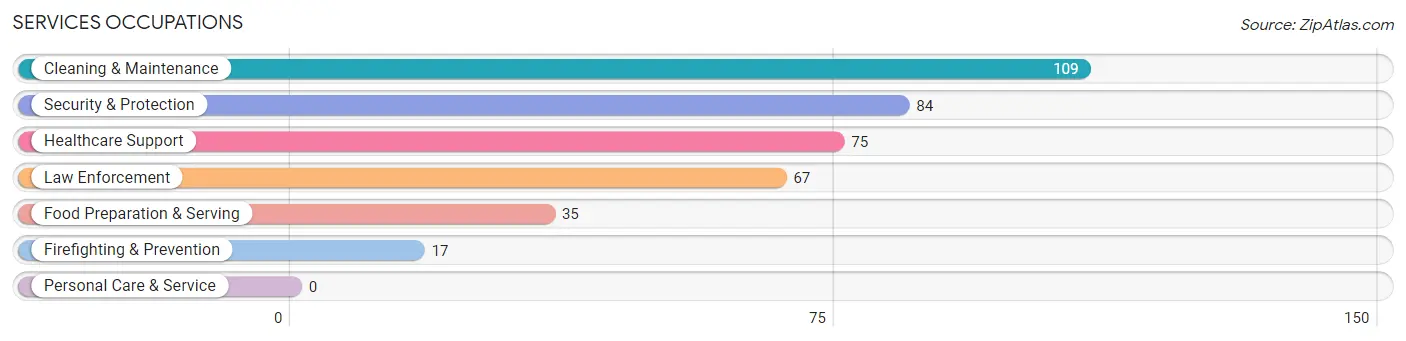
Services Occupations
The most common Services occupations in Rushville are Cleaning & Maintenance (109 | 8.5%), Security & Protection (84 | 6.6%), Healthcare Support (75 | 5.9%), Law Enforcement (67 | 5.2%), and Food Preparation & Serving (35 | 2.7%).
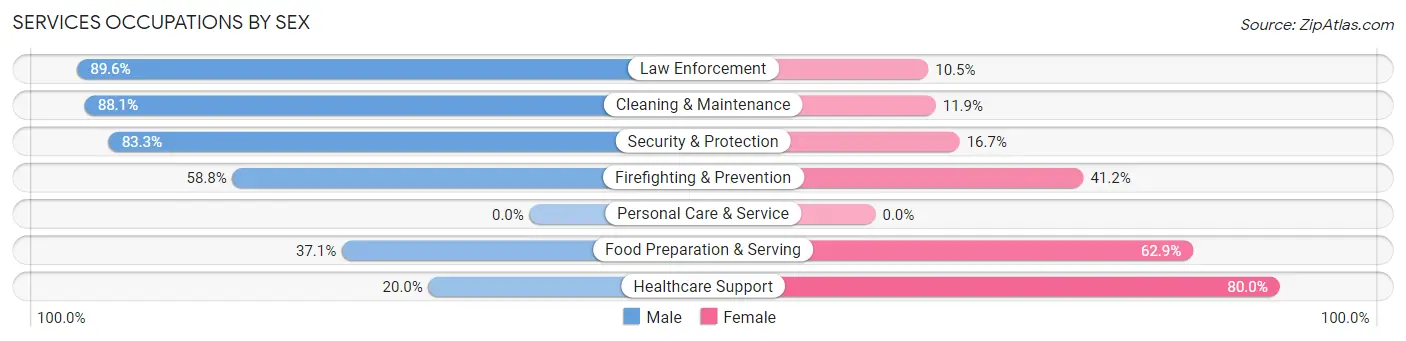
Services Occupations by Sex
Within the Services occupations in Rushville, the most male-oriented occupations are Law Enforcement (89.5%), Cleaning & Maintenance (88.1%), and Security & Protection (83.3%), while the most female-oriented occupations are Healthcare Support (80.0%), Food Preparation & Serving (62.9%), and Firefighting & Prevention (41.2%).
| Occupation | Male | Female |
| Healthcare Support | 15 (20.0%) | 60 (80.0%) |
| Security & Protection | 70 (83.3%) | 14 (16.7%) |
| Firefighting & Prevention | 10 (58.8%) | 7 (41.2%) |
| Law Enforcement | 60 (89.5%) | 7 (10.4%) |
| Food Preparation & Serving | 13 (37.1%) | 22 (62.9%) |
| Cleaning & Maintenance | 96 (88.1%) | 13 (11.9%) |
| Personal Care & Service | 0 (0.0%) | 0 (0.0%) |
| Total (Category) | 194 (64.0%) | 109 (36.0%) |
| Total (Overall) | 625 (48.9%) | 652 (51.1%) |
Sales and Office Occupations
The most common Sales and Office occupations in Rushville are Sales & Related (181 | 14.2%), and Office & Administration (144 | 11.3%).

Sales and Office Occupations by Sex

| Occupation | Male | Female |
| Sales & Related | 14 (7.7%) | 167 (92.3%) |
| Office & Administration | 29 (20.1%) | 115 (79.9%) |
| Total (Category) | 43 (13.2%) | 282 (86.8%) |
| Total (Overall) | 625 (48.9%) | 652 (51.1%) |
Natural Resources, Construction and Maintenance Occupations
The most common Natural Resources, Construction and Maintenance occupations in Rushville are Installation, Maintenance & Repair (42 | 3.3%), Farming, Fishing & Forestry (28 | 2.2%), and Construction & Extraction (14 | 1.1%).

Natural Resources, Construction and Maintenance Occupations by Sex

| Occupation | Male | Female |
| Farming, Fishing & Forestry | 15 (53.6%) | 13 (46.4%) |
| Construction & Extraction | 14 (100.0%) | 0 (0.0%) |
| Installation, Maintenance & Repair | 42 (100.0%) | 0 (0.0%) |
| Total (Category) | 71 (84.5%) | 13 (15.5%) |
| Total (Overall) | 625 (48.9%) | 652 (51.1%) |
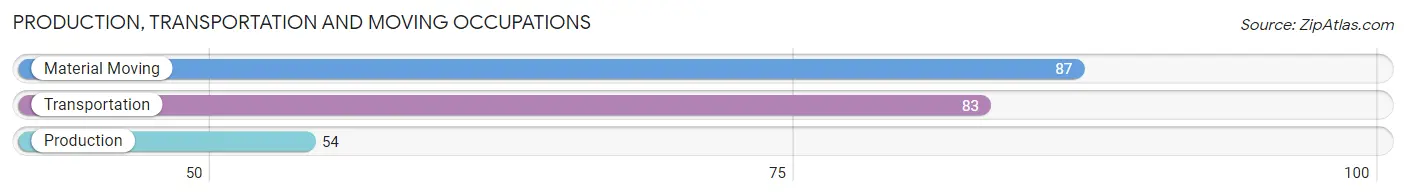
Production, Transportation and Moving Occupations
The most common Production, Transportation and Moving occupations in Rushville are Material Moving (87 | 6.8%), Transportation (83 | 6.5%), and Production (54 | 4.2%).
Production, Transportation and Moving Occupations by Sex
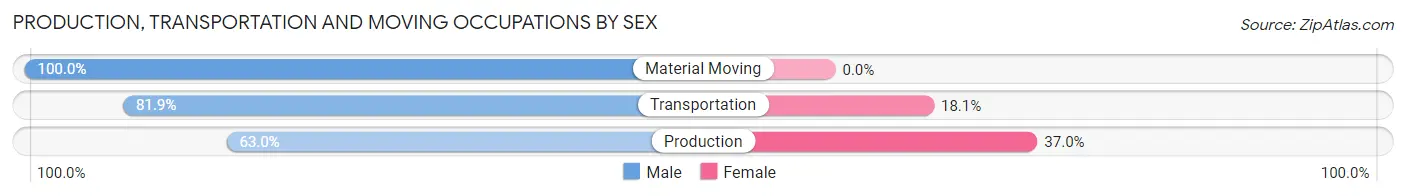
| Occupation | Male | Female |
| Production | 34 (63.0%) | 20 (37.0%) |
| Transportation | 68 (81.9%) | 15 (18.1%) |
| Material Moving | 87 (100.0%) | 0 (0.0%) |
| Total (Category) | 189 (84.4%) | 35 (15.6%) |
| Total (Overall) | 625 (48.9%) | 652 (51.1%) |
Employment Industries by Sex in Rushville
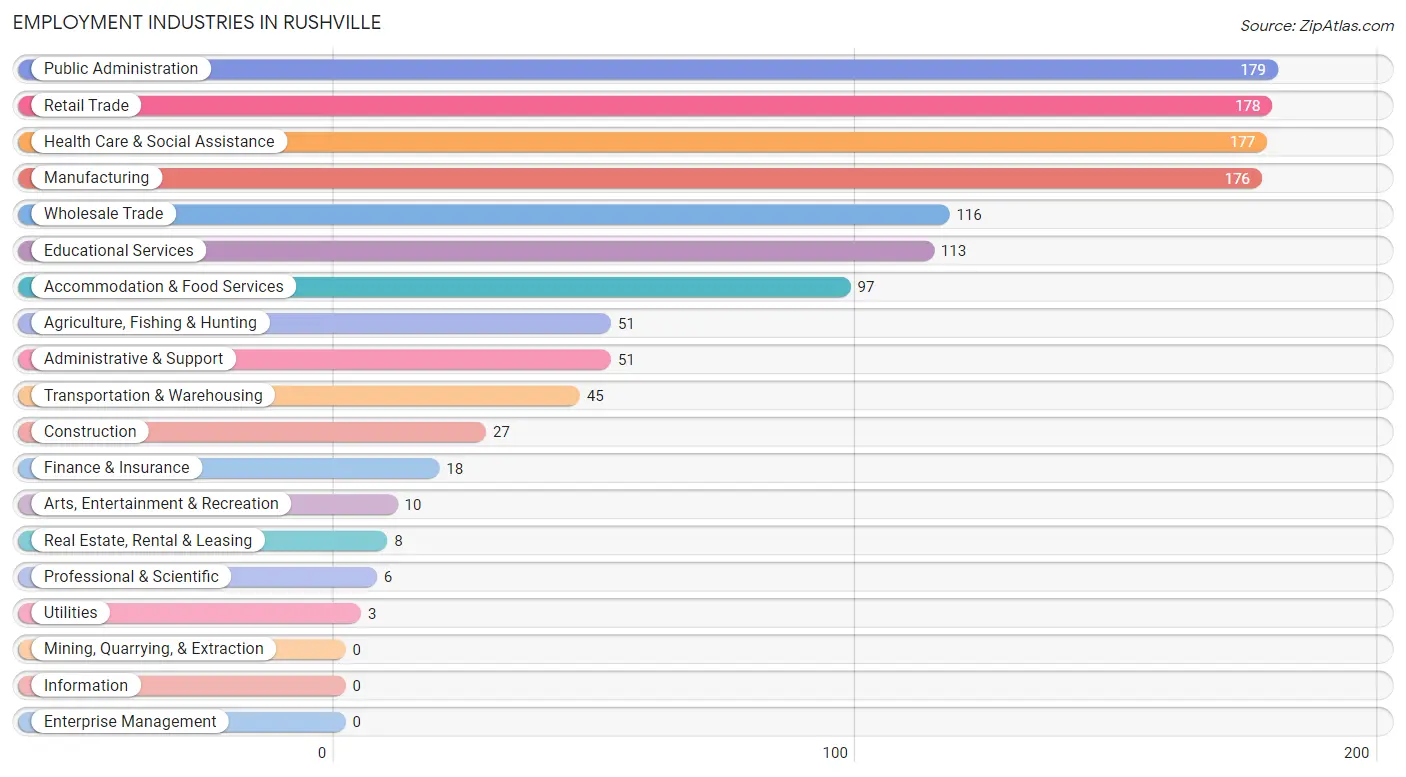
Employment Industries in Rushville
The major employment industries in Rushville include Public Administration (179 | 14.0%), Retail Trade (178 | 13.9%), Health Care & Social Assistance (177 | 13.9%), Manufacturing (176 | 13.8%), and Wholesale Trade (116 | 9.1%).
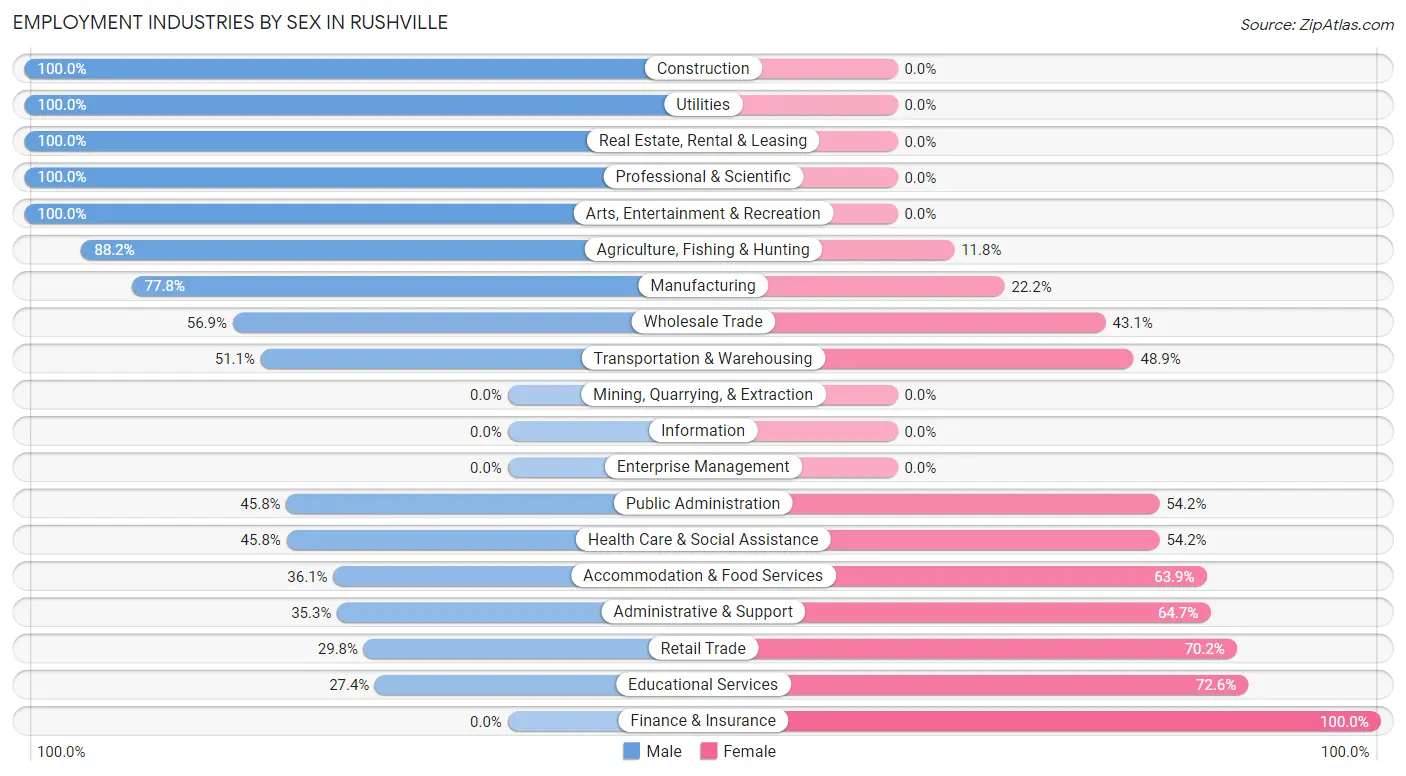
Employment Industries by Sex in Rushville
The Rushville industries that see more men than women are Construction (100.0%), Utilities (100.0%), and Real Estate, Rental & Leasing (100.0%), whereas the industries that tend to have a higher number of women are Finance & Insurance (100.0%), Educational Services (72.6%), and Retail Trade (70.2%).
| Industry | Male | Female |
| Agriculture, Fishing & Hunting | 45 (88.2%) | 6 (11.8%) |
| Mining, Quarrying, & Extraction | 0 (0.0%) | 0 (0.0%) |
| Construction | 27 (100.0%) | 0 (0.0%) |
| Manufacturing | 137 (77.8%) | 39 (22.2%) |
| Wholesale Trade | 66 (56.9%) | 50 (43.1%) |
| Retail Trade | 53 (29.8%) | 125 (70.2%) |
| Transportation & Warehousing | 23 (51.1%) | 22 (48.9%) |
| Utilities | 3 (100.0%) | 0 (0.0%) |
| Information | 0 (0.0%) | 0 (0.0%) |
| Finance & Insurance | 0 (0.0%) | 18 (100.0%) |
| Real Estate, Rental & Leasing | 8 (100.0%) | 0 (0.0%) |
| Professional & Scientific | 6 (100.0%) | 0 (0.0%) |
| Enterprise Management | 0 (0.0%) | 0 (0.0%) |
| Administrative & Support | 18 (35.3%) | 33 (64.7%) |
| Educational Services | 31 (27.4%) | 82 (72.6%) |
| Health Care & Social Assistance | 81 (45.8%) | 96 (54.2%) |
| Arts, Entertainment & Recreation | 10 (100.0%) | 0 (0.0%) |
| Accommodation & Food Services | 35 (36.1%) | 62 (63.9%) |
| Public Administration | 82 (45.8%) | 97 (54.2%) |
| Total | 625 (48.9%) | 652 (51.1%) |
Education in Rushville
School Enrollment in Rushville
The most common levels of schooling among the 447 students in Rushville are middle school (174 | 38.9%), elementary school (114 | 25.5%), and high school (62 | 13.9%).
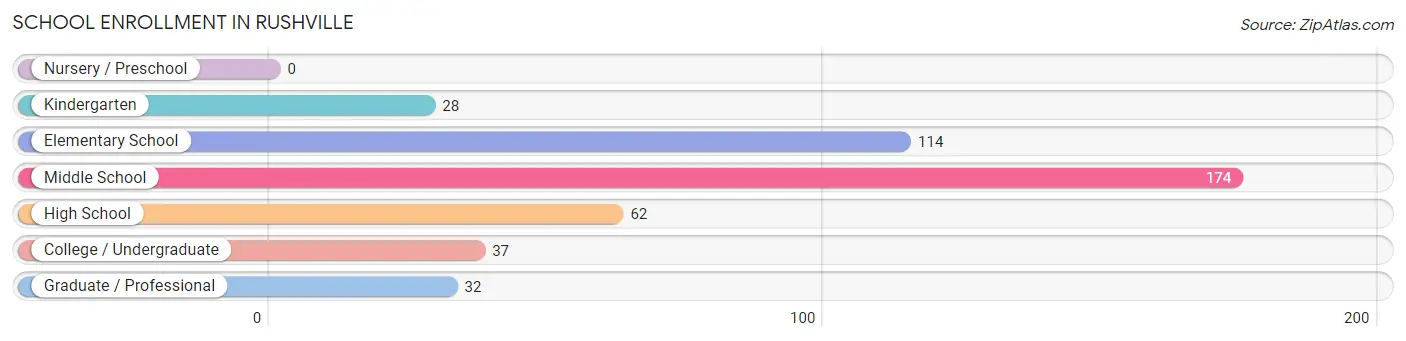
| School Level | # Students | % Students |
| Nursery / Preschool | 0 | 0.0% |
| Kindergarten | 28 | 6.3% |
| Elementary School | 114 | 25.5% |
| Middle School | 174 | 38.9% |
| High School | 62 | 13.9% |
| College / Undergraduate | 37 | 8.3% |
| Graduate / Professional | 32 | 7.2% |
| Total | 447 | 100.0% |
School Enrollment by Age by Funding Source in Rushville
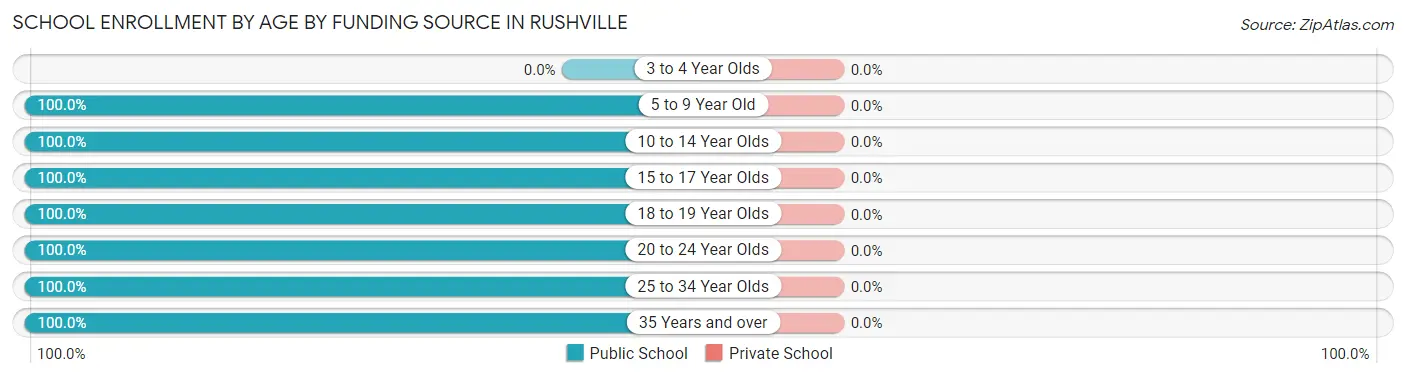
| Age Bracket | Public School | Private School |
| 3 to 4 Year Olds | 0 (0.0%) | 0 (0.0%) |
| 5 to 9 Year Old | 89 (100.0%) | 0 (0.0%) |
| 10 to 14 Year Olds | 234 (100.0%) | 0 (0.0%) |
| 15 to 17 Year Olds | 42 (100.0%) | 0 (0.0%) |
| 18 to 19 Year Olds | 37 (100.0%) | 0 (0.0%) |
| 20 to 24 Year Olds | 10 (100.0%) | 0 (0.0%) |
| 25 to 34 Year Olds | 7 (100.0%) | 0 (0.0%) |
| 35 Years and over | 28 (100.0%) | 0 (0.0%) |
| Total | 447 (100.0%) | 0 (0.0%) |
Educational Attainment by Field of Study in Rushville
Education (129 | 37.1%), arts & humanities (67 | 19.3%), psychology (43 | 12.4%), social sciences (32 | 9.2%), and physical & health sciences (24 | 6.9%) are the most common fields of study among 348 individuals in Rushville who have obtained a bachelor's degree or higher.
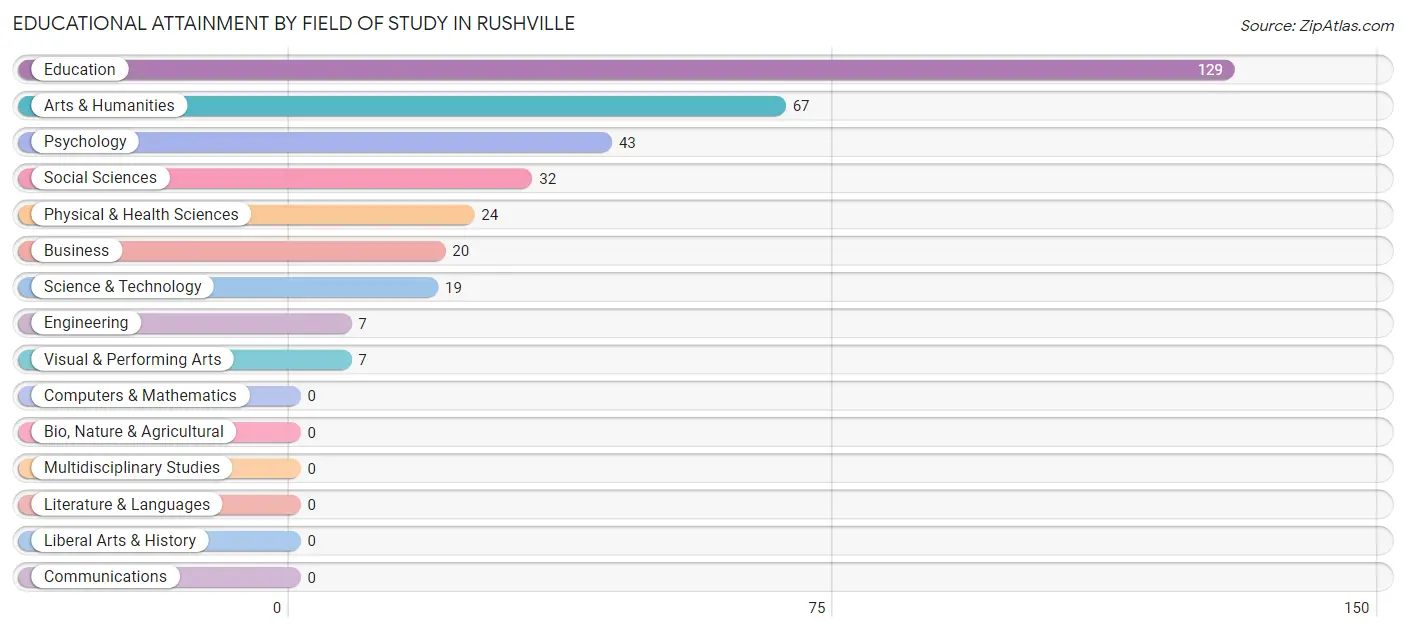
| Field of Study | # Graduates | % Graduates |
| Computers & Mathematics | 0 | 0.0% |
| Bio, Nature & Agricultural | 0 | 0.0% |
| Physical & Health Sciences | 24 | 6.9% |
| Psychology | 43 | 12.4% |
| Social Sciences | 32 | 9.2% |
| Engineering | 7 | 2.0% |
| Multidisciplinary Studies | 0 | 0.0% |
| Science & Technology | 19 | 5.5% |
| Business | 20 | 5.8% |
| Education | 129 | 37.1% |
| Literature & Languages | 0 | 0.0% |
| Liberal Arts & History | 0 | 0.0% |
| Visual & Performing Arts | 7 | 2.0% |
| Communications | 0 | 0.0% |
| Arts & Humanities | 67 | 19.3% |
| Total | 348 | 100.0% |
Transportation & Commute in Rushville
Vehicle Availability by Sex in Rushville
The most prevalent vehicle ownership categories in Rushville are males with 2 vehicles (291, accounting for 46.6%) and females with 2 vehicles (330, making up 44.6%).
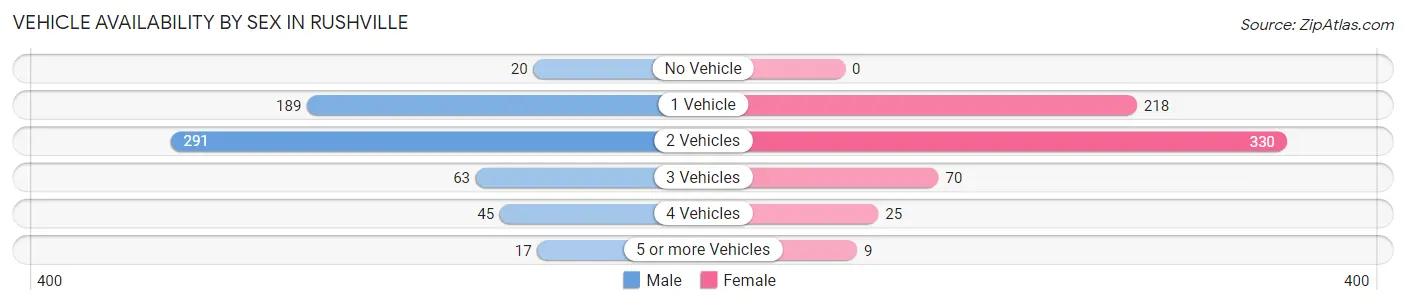
| Vehicles Available | Male | Female |
| No Vehicle | 20 (3.2%) | 0 (0.0%) |
| 1 Vehicle | 189 (30.2%) | 218 (33.4%) |
| 2 Vehicles | 291 (46.6%) | 330 (50.6%) |
| 3 Vehicles | 63 (10.1%) | 70 (10.7%) |
| 4 Vehicles | 45 (7.2%) | 25 (3.8%) |
| 5 or more Vehicles | 17 (2.7%) | 9 (1.4%) |
| Total | 625 (100.0%) | 652 (100.0%) |
Commute Time in Rushville
The most frequently occuring commute durations in Rushville are 5 to 9 minutes (467 commuters, 37.0%), 20 to 24 minutes (181 commuters, 14.3%), and 25 to 29 minutes (147 commuters, 11.6%).
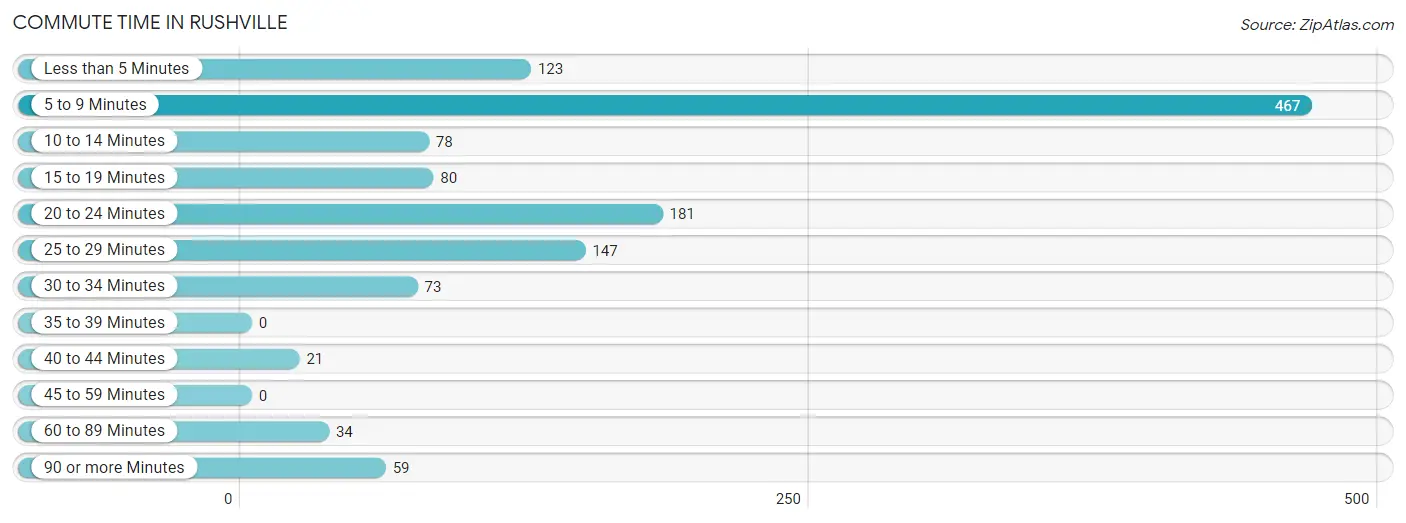
| Commute Time | # Commuters | % Commuters |
| Less than 5 Minutes | 123 | 9.7% |
| 5 to 9 Minutes | 467 | 37.0% |
| 10 to 14 Minutes | 78 | 6.2% |
| 15 to 19 Minutes | 80 | 6.3% |
| 20 to 24 Minutes | 181 | 14.3% |
| 25 to 29 Minutes | 147 | 11.6% |
| 30 to 34 Minutes | 73 | 5.8% |
| 35 to 39 Minutes | 0 | 0.0% |
| 40 to 44 Minutes | 21 | 1.7% |
| 45 to 59 Minutes | 0 | 0.0% |
| 60 to 89 Minutes | 34 | 2.7% |
| 90 or more Minutes | 59 | 4.7% |
Commute Time by Sex in Rushville
The most common commute times in Rushville are 5 to 9 minutes (200 commuters, 32.4%) for males and 5 to 9 minutes (267 commuters, 41.4%) for females.
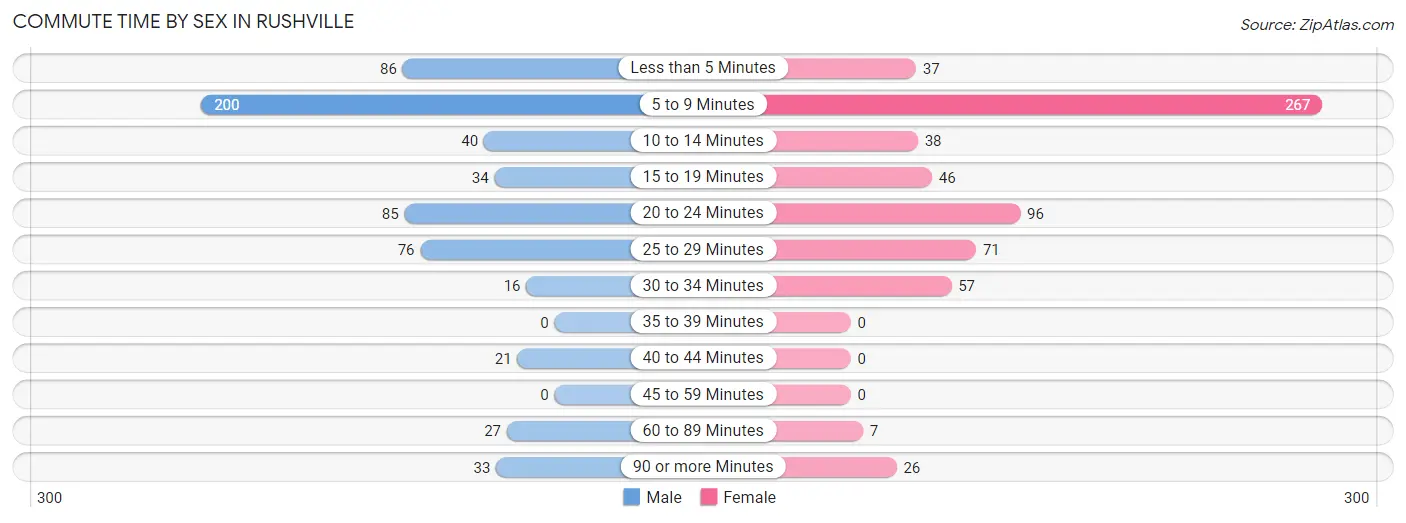
| Commute Time | Male | Female |
| Less than 5 Minutes | 86 (13.9%) | 37 (5.7%) |
| 5 to 9 Minutes | 200 (32.4%) | 267 (41.4%) |
| 10 to 14 Minutes | 40 (6.5%) | 38 (5.9%) |
| 15 to 19 Minutes | 34 (5.5%) | 46 (7.1%) |
| 20 to 24 Minutes | 85 (13.8%) | 96 (14.9%) |
| 25 to 29 Minutes | 76 (12.3%) | 71 (11.0%) |
| 30 to 34 Minutes | 16 (2.6%) | 57 (8.8%) |
| 35 to 39 Minutes | 0 (0.0%) | 0 (0.0%) |
| 40 to 44 Minutes | 21 (3.4%) | 0 (0.0%) |
| 45 to 59 Minutes | 0 (0.0%) | 0 (0.0%) |
| 60 to 89 Minutes | 27 (4.4%) | 7 (1.1%) |
| 90 or more Minutes | 33 (5.3%) | 26 (4.0%) |
Time of Departure to Work by Sex in Rushville
The most frequent times of departure to work in Rushville are 4:00 PM to 11:59 PM (115, 18.6%) for males and 7:30 AM to 7:59 AM (158, 24.5%) for females.
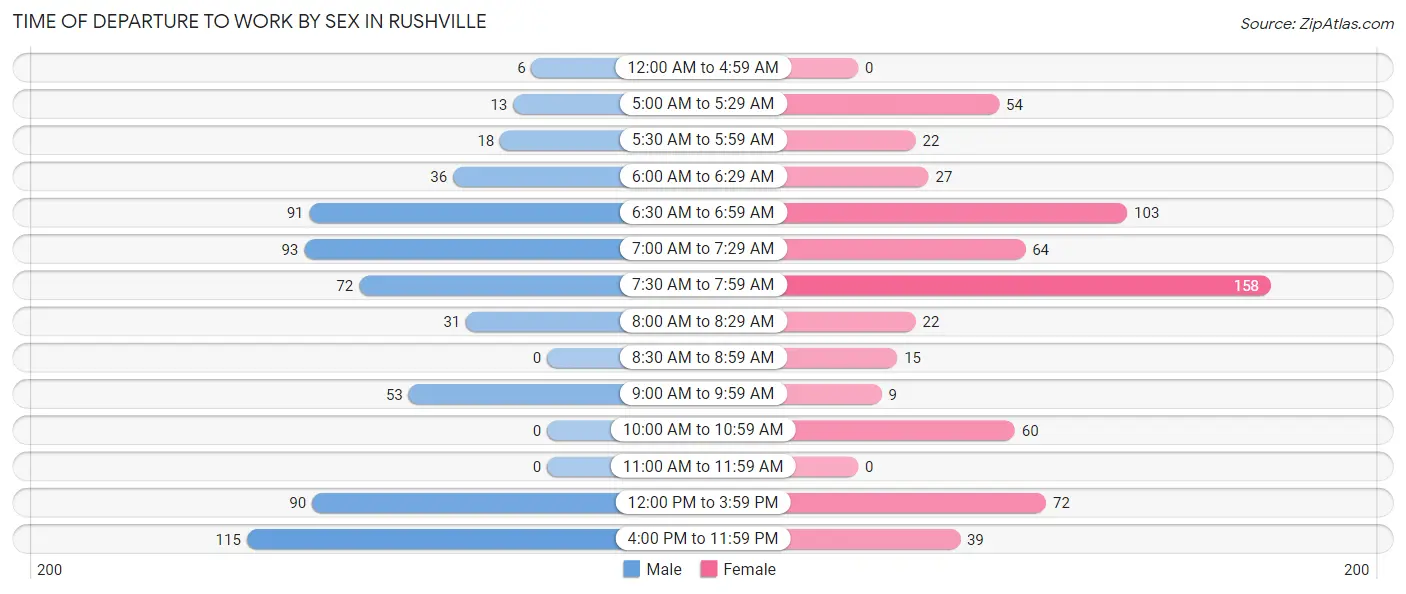
| Time of Departure | Male | Female |
| 12:00 AM to 4:59 AM | 6 (1.0%) | 0 (0.0%) |
| 5:00 AM to 5:29 AM | 13 (2.1%) | 54 (8.4%) |
| 5:30 AM to 5:59 AM | 18 (2.9%) | 22 (3.4%) |
| 6:00 AM to 6:29 AM | 36 (5.8%) | 27 (4.2%) |
| 6:30 AM to 6:59 AM | 91 (14.7%) | 103 (16.0%) |
| 7:00 AM to 7:29 AM | 93 (15.0%) | 64 (9.9%) |
| 7:30 AM to 7:59 AM | 72 (11.7%) | 158 (24.5%) |
| 8:00 AM to 8:29 AM | 31 (5.0%) | 22 (3.4%) |
| 8:30 AM to 8:59 AM | 0 (0.0%) | 15 (2.3%) |
| 9:00 AM to 9:59 AM | 53 (8.6%) | 9 (1.4%) |
| 10:00 AM to 10:59 AM | 0 (0.0%) | 60 (9.3%) |
| 11:00 AM to 11:59 AM | 0 (0.0%) | 0 (0.0%) |
| 12:00 PM to 3:59 PM | 90 (14.6%) | 72 (11.2%) |
| 4:00 PM to 11:59 PM | 115 (18.6%) | 39 (6.0%) |
| Total | 618 (100.0%) | 645 (100.0%) |
Housing Occupancy in Rushville
Occupancy by Ownership in Rushville
Of the total 1,252 dwellings in Rushville, owner-occupied units account for 901 (72.0%), while renter-occupied units make up 351 (28.0%).
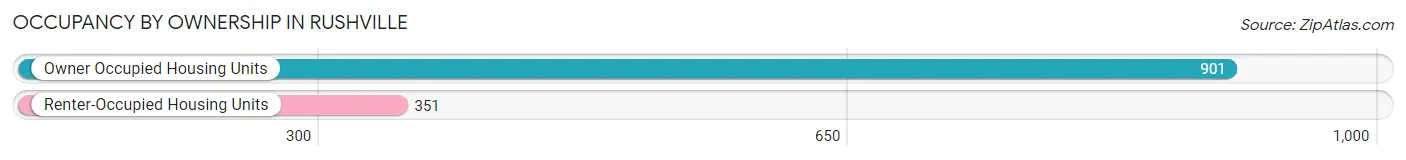
| Occupancy | # Housing Units | % Housing Units |
| Owner Occupied Housing Units | 901 | 72.0% |
| Renter-Occupied Housing Units | 351 | 28.0% |
| Total Occupied Housing Units | 1,252 | 100.0% |
Occupancy by Household Size in Rushville
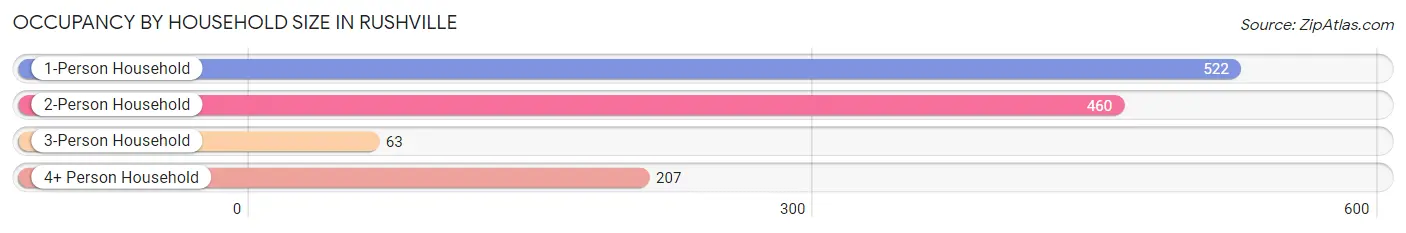
| Household Size | # Housing Units | % Housing Units |
| 1-Person Household | 522 | 41.7% |
| 2-Person Household | 460 | 36.7% |
| 3-Person Household | 63 | 5.0% |
| 4+ Person Household | 207 | 16.5% |
| Total Housing Units | 1,252 | 100.0% |
Occupancy by Ownership by Household Size in Rushville
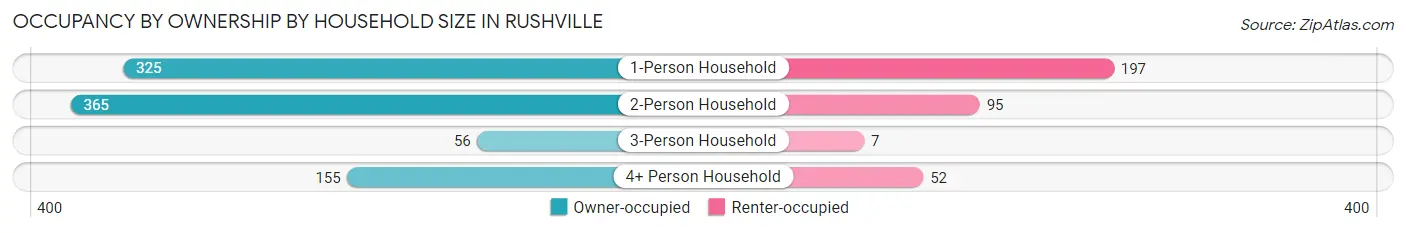
| Household Size | Owner-occupied | Renter-occupied |
| 1-Person Household | 325 (62.3%) | 197 (37.7%) |
| 2-Person Household | 365 (79.3%) | 95 (20.6%) |
| 3-Person Household | 56 (88.9%) | 7 (11.1%) |
| 4+ Person Household | 155 (74.9%) | 52 (25.1%) |
| Total Housing Units | 901 (72.0%) | 351 (28.0%) |
Occupancy by Educational Attainment in Rushville
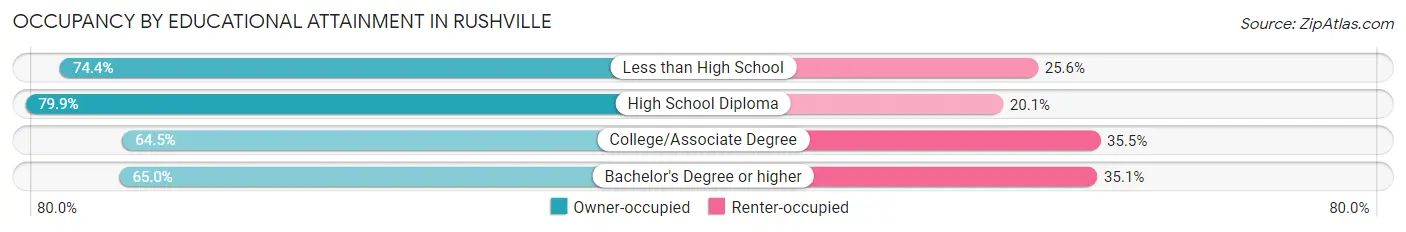
| Household Size | Owner-occupied | Renter-occupied |
| Less than High School | 29 (74.4%) | 10 (25.6%) |
| High School Diploma | 461 (79.9%) | 116 (20.1%) |
| College/Associate Degree | 285 (64.5%) | 157 (35.5%) |
| Bachelor's Degree or higher | 126 (64.9%) | 68 (35.0%) |
Occupancy by Age of Householder in Rushville

| Age Bracket | # Households | % Households |
| Under 35 Years | 269 | 21.5% |
| 35 to 44 Years | 150 | 12.0% |
| 45 to 54 Years | 201 | 16.1% |
| 55 to 64 Years | 243 | 19.4% |
| 65 to 74 Years | 163 | 13.0% |
| 75 to 84 Years | 186 | 14.9% |
| 85 Years and Over | 40 | 3.2% |
| Total | 1,252 | 100.0% |
Housing Finances in Rushville
Median Income by Occupancy in Rushville
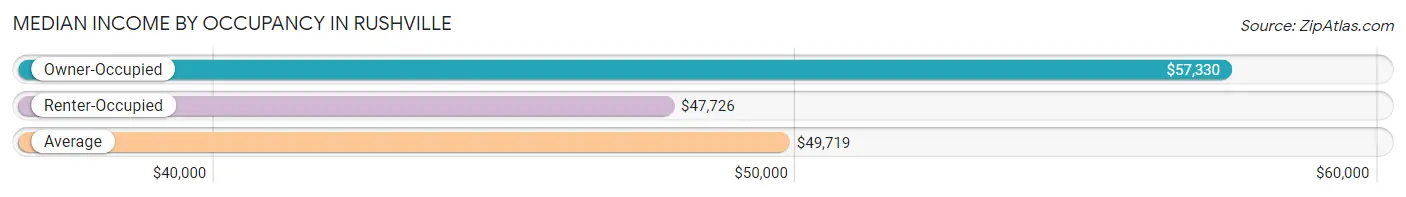
| Occupancy Type | # Households | Median Income |
| Owner-Occupied | 901 (72.0%) | $57,330 |
| Renter-Occupied | 351 (28.0%) | $47,726 |
| Average | 1,252 (100.0%) | $49,719 |
Occupancy by Householder Income Bracket in Rushville
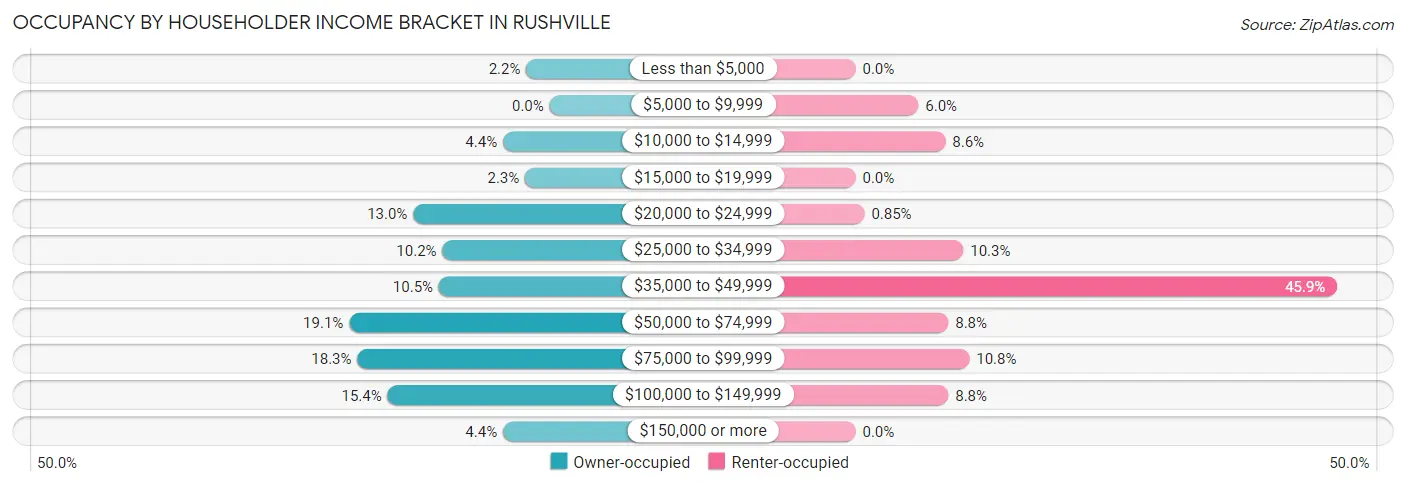
| Income Bracket | Owner-occupied | Renter-occupied |
| Less than $5,000 | 20 (2.2%) | 0 (0.0%) |
| $5,000 to $9,999 | 0 (0.0%) | 21 (6.0%) |
| $10,000 to $14,999 | 40 (4.4%) | 30 (8.6%) |
| $15,000 to $19,999 | 21 (2.3%) | 0 (0.0%) |
| $20,000 to $24,999 | 117 (13.0%) | 3 (0.9%) |
| $25,000 to $34,999 | 92 (10.2%) | 36 (10.3%) |
| $35,000 to $49,999 | 95 (10.5%) | 161 (45.9%) |
| $50,000 to $74,999 | 172 (19.1%) | 31 (8.8%) |
| $75,000 to $99,999 | 165 (18.3%) | 38 (10.8%) |
| $100,000 to $149,999 | 139 (15.4%) | 31 (8.8%) |
| $150,000 or more | 40 (4.4%) | 0 (0.0%) |
| Total | 901 (100.0%) | 351 (100.0%) |
Monthly Housing Cost Tiers in Rushville
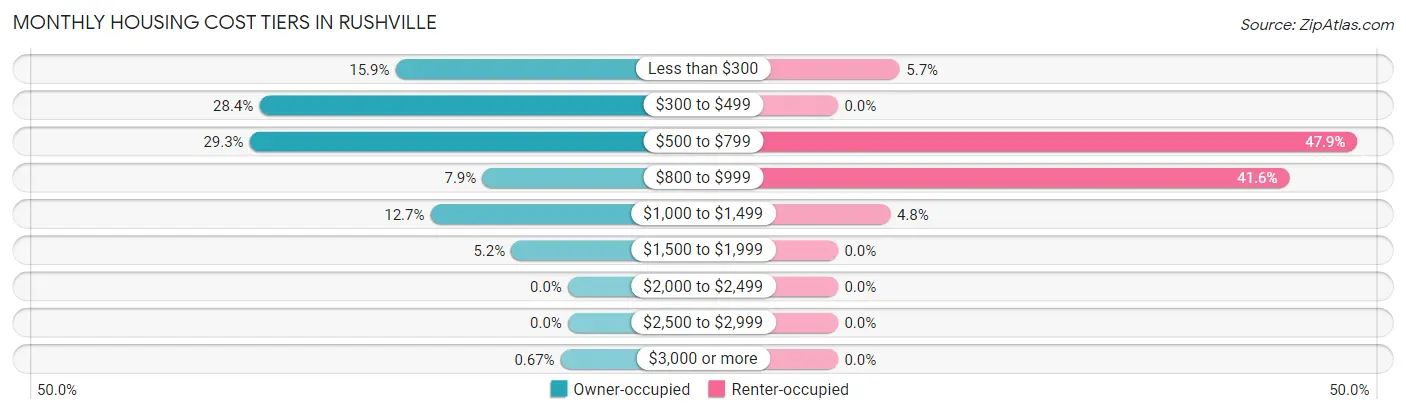
| Monthly Cost | Owner-occupied | Renter-occupied |
| Less than $300 | 143 (15.9%) | 20 (5.7%) |
| $300 to $499 | 256 (28.4%) | 0 (0.0%) |
| $500 to $799 | 264 (29.3%) | 168 (47.9%) |
| $800 to $999 | 71 (7.9%) | 146 (41.6%) |
| $1,000 to $1,499 | 114 (12.7%) | 17 (4.8%) |
| $1,500 to $1,999 | 47 (5.2%) | 0 (0.0%) |
| $2,000 to $2,499 | 0 (0.0%) | 0 (0.0%) |
| $2,500 to $2,999 | 0 (0.0%) | 0 (0.0%) |
| $3,000 or more | 6 (0.7%) | 0 (0.0%) |
| Total | 901 (100.0%) | 351 (100.0%) |
Physical Housing Characteristics in Rushville
Housing Structures in Rushville
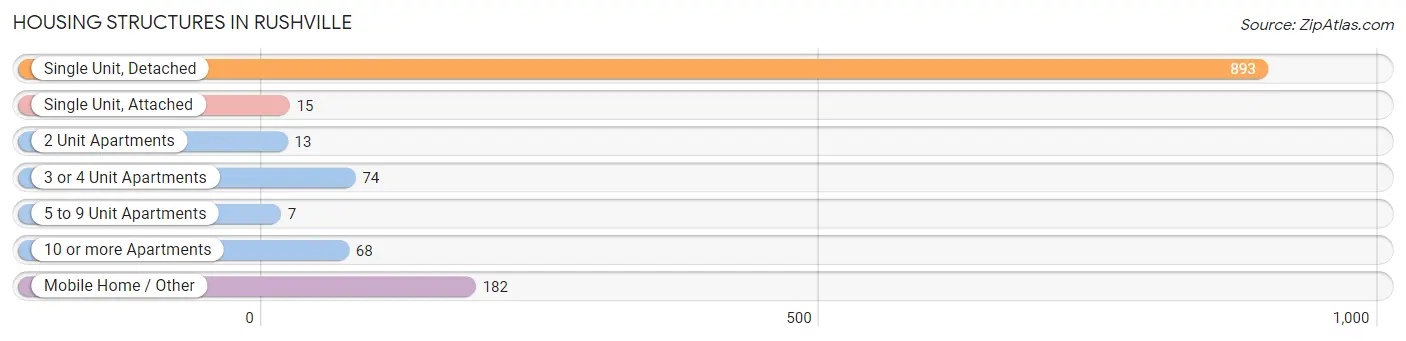
| Structure Type | # Housing Units | % Housing Units |
| Single Unit, Detached | 893 | 71.3% |
| Single Unit, Attached | 15 | 1.2% |
| 2 Unit Apartments | 13 | 1.0% |
| 3 or 4 Unit Apartments | 74 | 5.9% |
| 5 to 9 Unit Apartments | 7 | 0.6% |
| 10 or more Apartments | 68 | 5.4% |
| Mobile Home / Other | 182 | 14.5% |
| Total | 1,252 | 100.0% |
Housing Structures by Occupancy in Rushville
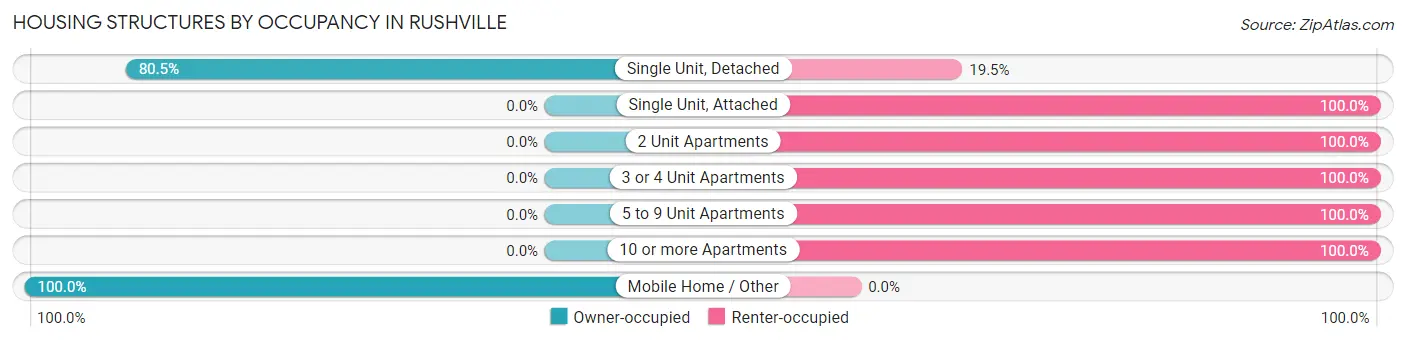
| Structure Type | Owner-occupied | Renter-occupied |
| Single Unit, Detached | 719 (80.5%) | 174 (19.5%) |
| Single Unit, Attached | 0 (0.0%) | 15 (100.0%) |
| 2 Unit Apartments | 0 (0.0%) | 13 (100.0%) |
| 3 or 4 Unit Apartments | 0 (0.0%) | 74 (100.0%) |
| 5 to 9 Unit Apartments | 0 (0.0%) | 7 (100.0%) |
| 10 or more Apartments | 0 (0.0%) | 68 (100.0%) |
| Mobile Home / Other | 182 (100.0%) | 0 (0.0%) |
| Total | 901 (72.0%) | 351 (28.0%) |
Housing Structures by Number of Rooms in Rushville
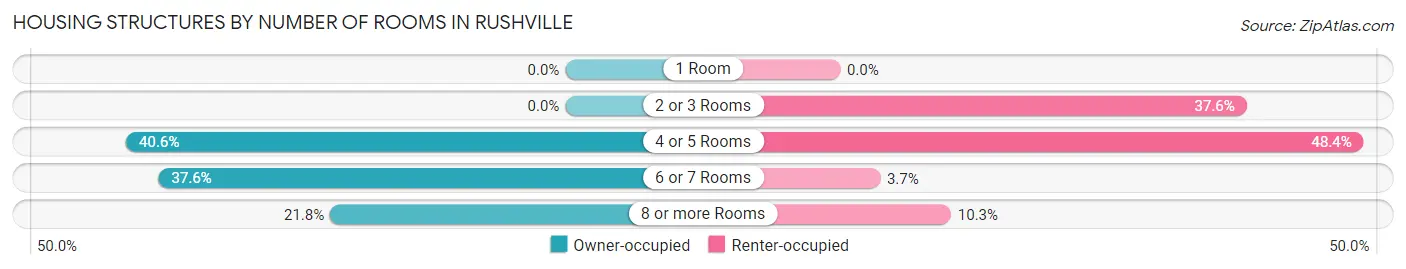
| Number of Rooms | Owner-occupied | Renter-occupied |
| 1 Room | 0 (0.0%) | 0 (0.0%) |
| 2 or 3 Rooms | 0 (0.0%) | 132 (37.6%) |
| 4 or 5 Rooms | 366 (40.6%) | 170 (48.4%) |
| 6 or 7 Rooms | 339 (37.6%) | 13 (3.7%) |
| 8 or more Rooms | 196 (21.7%) | 36 (10.3%) |
| Total | 901 (100.0%) | 351 (100.0%) |
Housing Structure by Heating Type in Rushville
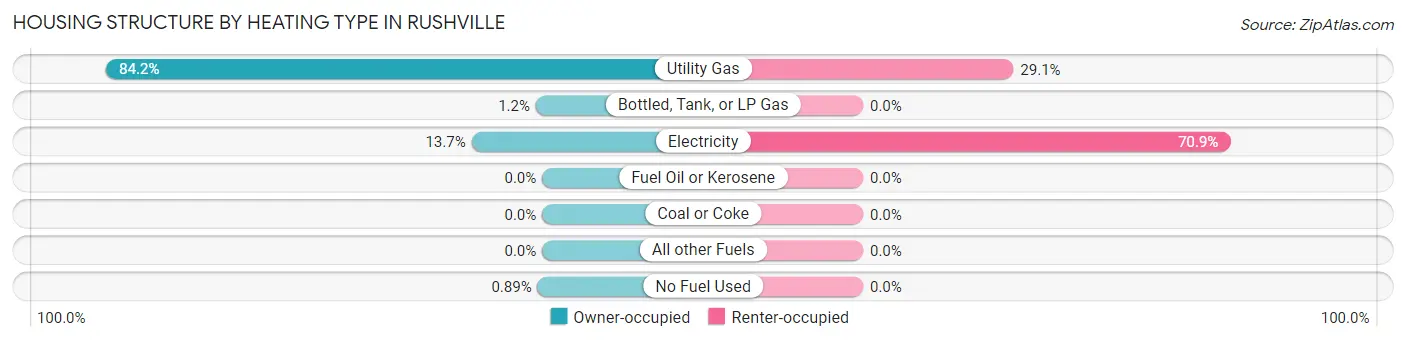
| Heating Type | Owner-occupied | Renter-occupied |
| Utility Gas | 759 (84.2%) | 102 (29.1%) |
| Bottled, Tank, or LP Gas | 11 (1.2%) | 0 (0.0%) |
| Electricity | 123 (13.7%) | 249 (70.9%) |
| Fuel Oil or Kerosene | 0 (0.0%) | 0 (0.0%) |
| Coal or Coke | 0 (0.0%) | 0 (0.0%) |
| All other Fuels | 0 (0.0%) | 0 (0.0%) |
| No Fuel Used | 8 (0.9%) | 0 (0.0%) |
| Total | 901 (100.0%) | 351 (100.0%) |
Household Vehicle Usage in Rushville
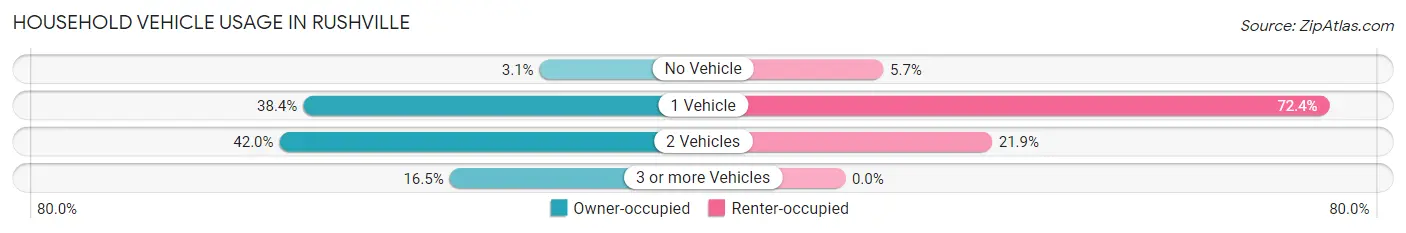
| Vehicles per Household | Owner-occupied | Renter-occupied |
| No Vehicle | 28 (3.1%) | 20 (5.7%) |
| 1 Vehicle | 346 (38.4%) | 254 (72.4%) |
| 2 Vehicles | 378 (41.9%) | 77 (21.9%) |
| 3 or more Vehicles | 149 (16.5%) | 0 (0.0%) |
| Total | 901 (100.0%) | 351 (100.0%) |
Real Estate & Mortgages in Rushville
Real Estate and Mortgage Overview in Rushville
| Characteristic | Without Mortgage | With Mortgage |
| Housing Units | 516 | 385 |
| Median Property Value | $67,500 | $86,600 |
| Median Household Income | $37,500 | $18 |
| Monthly Housing Costs | $386 | $6 |
| Real Estate Taxes | $1,107 | $6 |
Property Value by Mortgage Status in Rushville
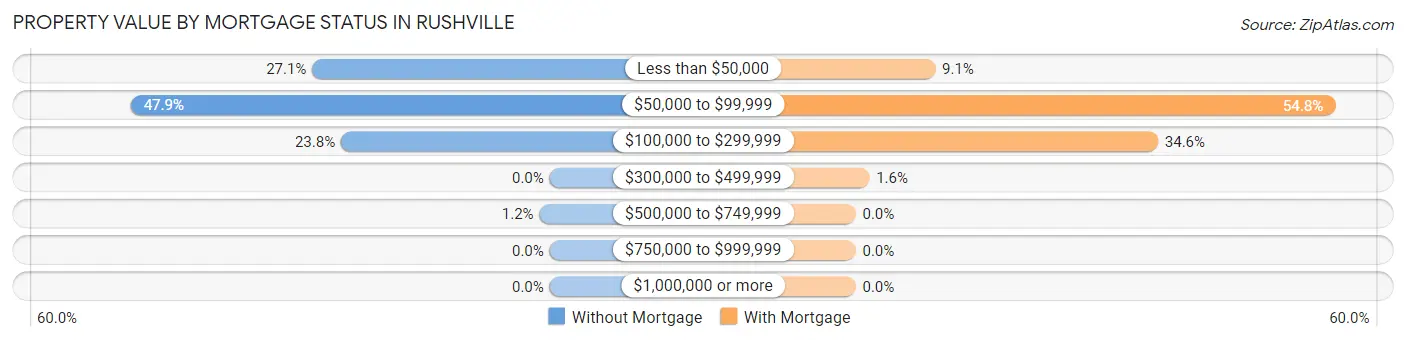
| Property Value | Without Mortgage | With Mortgage |
| Less than $50,000 | 140 (27.1%) | 35 (9.1%) |
| $50,000 to $99,999 | 247 (47.9%) | 211 (54.8%) |
| $100,000 to $299,999 | 123 (23.8%) | 133 (34.5%) |
| $300,000 to $499,999 | 0 (0.0%) | 6 (1.6%) |
| $500,000 to $749,999 | 6 (1.2%) | 0 (0.0%) |
| $750,000 to $999,999 | 0 (0.0%) | 0 (0.0%) |
| $1,000,000 or more | 0 (0.0%) | 0 (0.0%) |
| Total | 516 (100.0%) | 385 (100.0%) |
Household Income by Mortgage Status in Rushville
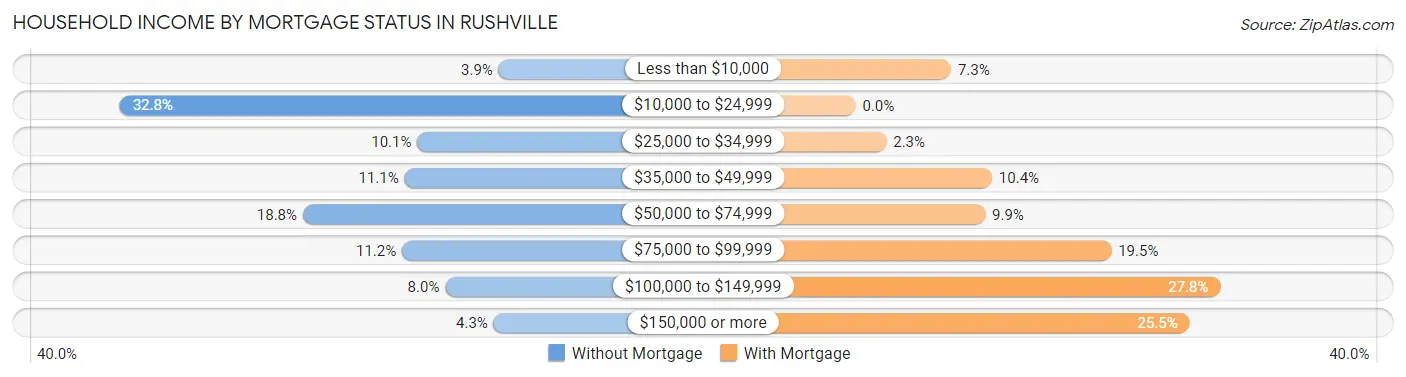
| Household Income | Without Mortgage | With Mortgage |
| Less than $10,000 | 20 (3.9%) | 28 (7.3%) |
| $10,000 to $24,999 | 169 (32.8%) | 0 (0.0%) |
| $25,000 to $34,999 | 52 (10.1%) | 9 (2.3%) |
| $35,000 to $49,999 | 57 (11.1%) | 40 (10.4%) |
| $50,000 to $74,999 | 97 (18.8%) | 38 (9.9%) |
| $75,000 to $99,999 | 58 (11.2%) | 75 (19.5%) |
| $100,000 to $149,999 | 41 (8.0%) | 107 (27.8%) |
| $150,000 or more | 22 (4.3%) | 98 (25.5%) |
| Total | 516 (100.0%) | 385 (100.0%) |
Property Value to Household Income Ratio in Rushville
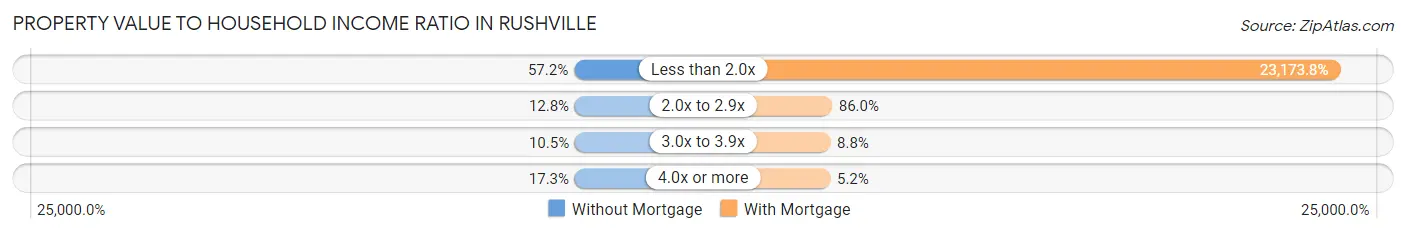
| Value-to-Income Ratio | Without Mortgage | With Mortgage |
| Less than 2.0x | 295 (57.2%) | 89,219 (23,173.8%) |
| 2.0x to 2.9x | 66 (12.8%) | 331 (86.0%) |
| 3.0x to 3.9x | 54 (10.5%) | 34 (8.8%) |
| 4.0x or more | 89 (17.2%) | 20 (5.2%) |
| Total | 516 (100.0%) | 385 (100.0%) |
Real Estate Taxes by Mortgage Status in Rushville
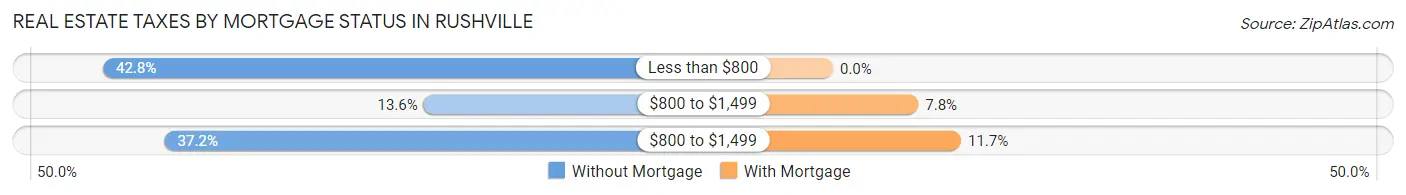
| Property Taxes | Without Mortgage | With Mortgage |
| Less than $800 | 221 (42.8%) | 0 (0.0%) |
| $800 to $1,499 | 70 (13.6%) | 30 (7.8%) |
| $800 to $1,499 | 192 (37.2%) | 45 (11.7%) |
| Total | 516 (100.0%) | 385 (100.0%) |
Health & Disability in Rushville
Health Insurance Coverage by Age in Rushville
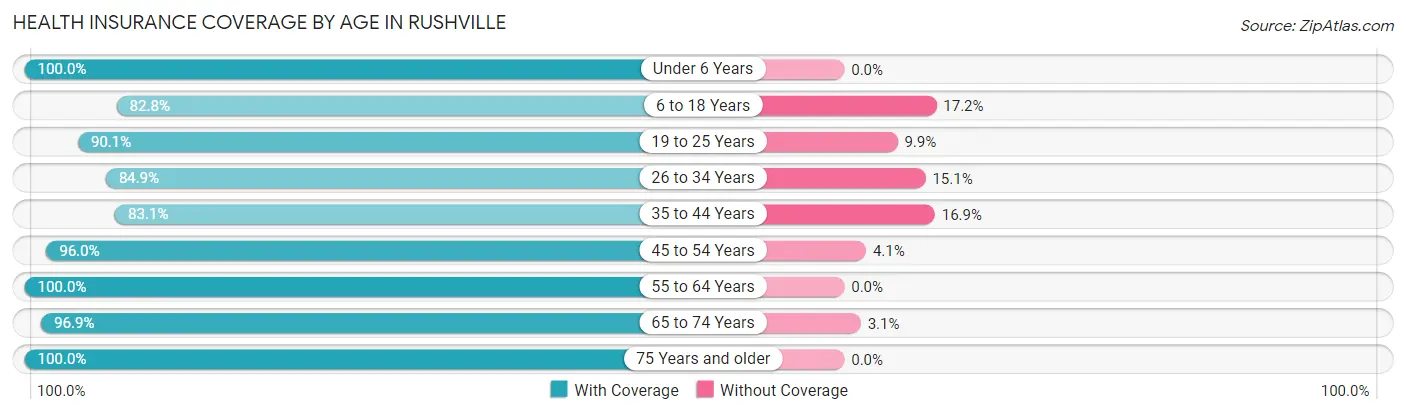
| Age Bracket | With Coverage | Without Coverage |
| Under 6 Years | 118 (100.0%) | 0 (0.0%) |
| 6 to 18 Years | 357 (82.8%) | 74 (17.2%) |
| 19 to 25 Years | 118 (90.1%) | 13 (9.9%) |
| 26 to 34 Years | 314 (84.9%) | 56 (15.1%) |
| 35 to 44 Years | 192 (83.1%) | 39 (16.9%) |
| 45 to 54 Years | 308 (96.0%) | 13 (4.1%) |
| 55 to 64 Years | 348 (100.0%) | 0 (0.0%) |
| 65 to 74 Years | 253 (96.9%) | 8 (3.1%) |
| 75 Years and older | 317 (100.0%) | 0 (0.0%) |
| Total | 2,325 (92.0%) | 203 (8.0%) |
Health Insurance Coverage by Citizenship Status in Rushville
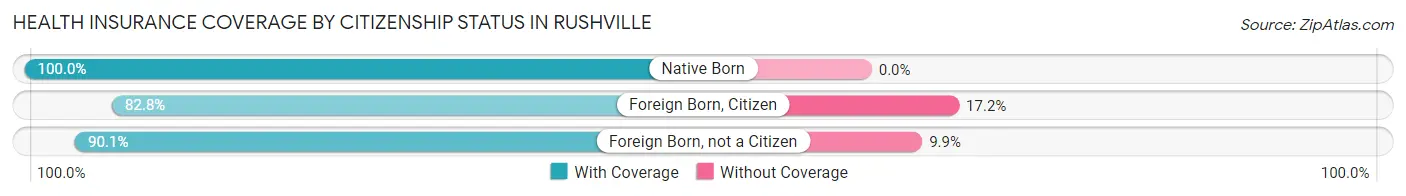
| Citizenship Status | With Coverage | Without Coverage |
| Native Born | 118 (100.0%) | 0 (0.0%) |
| Foreign Born, Citizen | 357 (82.8%) | 74 (17.2%) |
| Foreign Born, not a Citizen | 118 (90.1%) | 13 (9.9%) |
Health Insurance Coverage by Household Income in Rushville
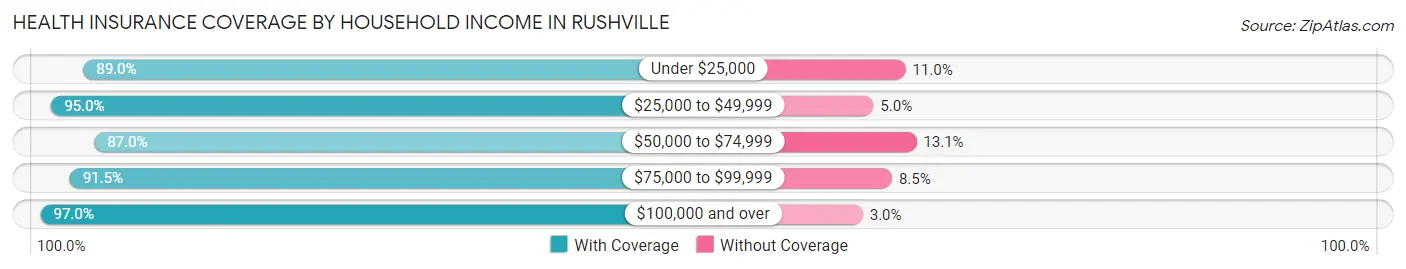
| Household Income | With Coverage | Without Coverage |
| Under $25,000 | 364 (89.0%) | 45 (11.0%) |
| $25,000 to $49,999 | 590 (95.0%) | 31 (5.0%) |
| $50,000 to $74,999 | 453 (87.0%) | 68 (13.1%) |
| $75,000 to $99,999 | 498 (91.5%) | 46 (8.5%) |
| $100,000 and over | 420 (97.0%) | 13 (3.0%) |
Public vs Private Health Insurance Coverage by Age in Rushville
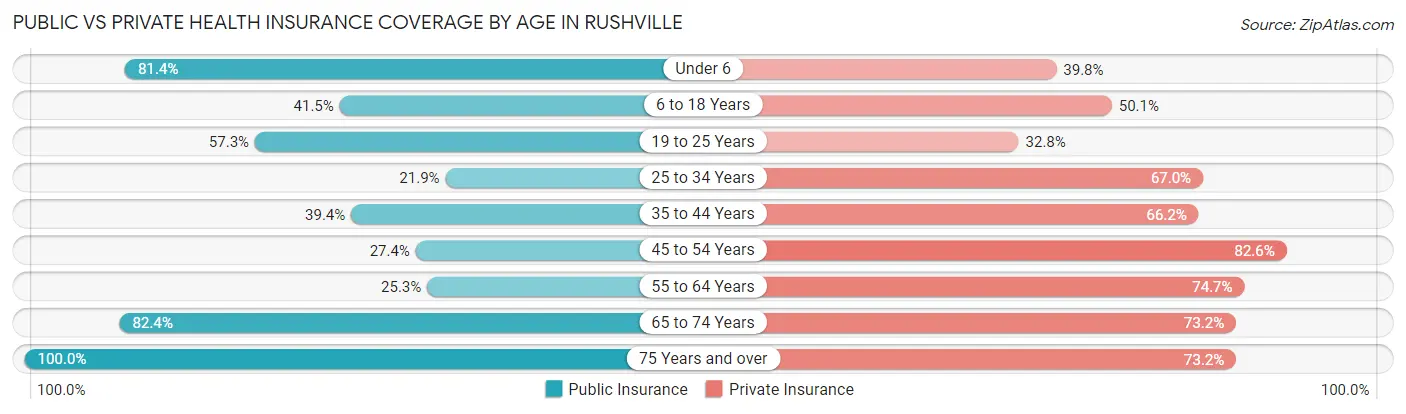
| Age Bracket | Public Insurance | Private Insurance |
| Under 6 | 96 (81.4%) | 47 (39.8%) |
| 6 to 18 Years | 179 (41.5%) | 216 (50.1%) |
| 19 to 25 Years | 75 (57.3%) | 43 (32.8%) |
| 25 to 34 Years | 81 (21.9%) | 248 (67.0%) |
| 35 to 44 Years | 91 (39.4%) | 153 (66.2%) |
| 45 to 54 Years | 88 (27.4%) | 265 (82.6%) |
| 55 to 64 Years | 88 (25.3%) | 260 (74.7%) |
| 65 to 74 Years | 215 (82.4%) | 191 (73.2%) |
| 75 Years and over | 317 (100.0%) | 232 (73.2%) |
| Total | 1,230 (48.7%) | 1,655 (65.5%) |
Disability Status by Sex by Age in Rushville
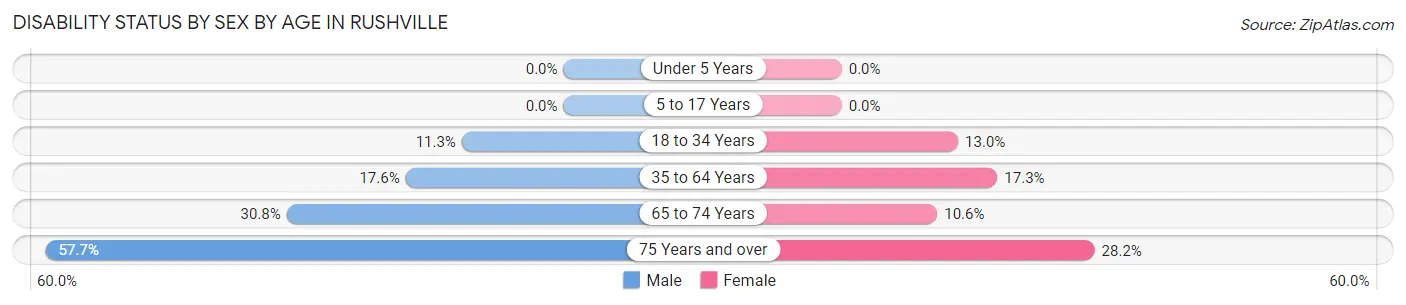
| Age Bracket | Male | Female |
| Under 5 Years | 0 (0.0%) | 0 (0.0%) |
| 5 to 17 Years | 0 (0.0%) | 0 (0.0%) |
| 18 to 34 Years | 36 (11.3%) | 35 (13.0%) |
| 35 to 64 Years | 74 (17.6%) | 83 (17.3%) |
| 65 to 74 Years | 37 (30.8%) | 15 (10.6%) |
| 75 Years and over | 64 (57.7%) | 58 (28.2%) |
Disability Class by Sex by Age in Rushville
Disability Class: Hearing Difficulty
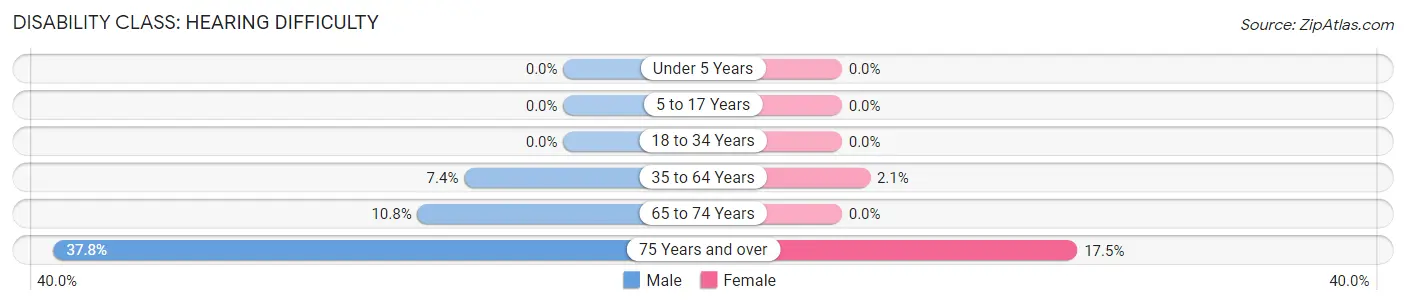
| Age Bracket | Male | Female |
| Under 5 Years | 0 (0.0%) | 0 (0.0%) |
| 5 to 17 Years | 0 (0.0%) | 0 (0.0%) |
| 18 to 34 Years | 0 (0.0%) | 0 (0.0%) |
| 35 to 64 Years | 31 (7.4%) | 10 (2.1%) |
| 65 to 74 Years | 13 (10.8%) | 0 (0.0%) |
| 75 Years and over | 42 (37.8%) | 36 (17.5%) |
Disability Class: Vision Difficulty
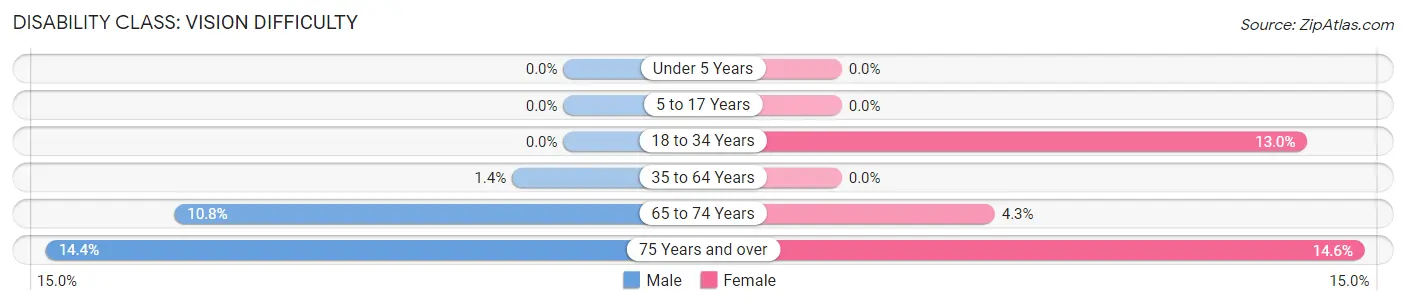
| Age Bracket | Male | Female |
| Under 5 Years | 0 (0.0%) | 0 (0.0%) |
| 5 to 17 Years | 0 (0.0%) | 0 (0.0%) |
| 18 to 34 Years | 0 (0.0%) | 35 (13.0%) |
| 35 to 64 Years | 6 (1.4%) | 0 (0.0%) |
| 65 to 74 Years | 13 (10.8%) | 6 (4.3%) |
| 75 Years and over | 16 (14.4%) | 30 (14.6%) |
Disability Class: Cognitive Difficulty
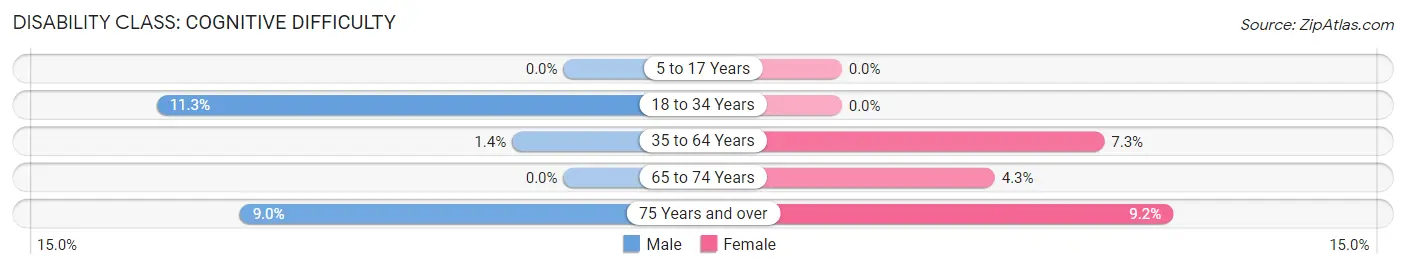
| Age Bracket | Male | Female |
| 5 to 17 Years | 0 (0.0%) | 0 (0.0%) |
| 18 to 34 Years | 36 (11.3%) | 0 (0.0%) |
| 35 to 64 Years | 6 (1.4%) | 35 (7.3%) |
| 65 to 74 Years | 0 (0.0%) | 6 (4.3%) |
| 75 Years and over | 10 (9.0%) | 19 (9.2%) |
Disability Class: Ambulatory Difficulty
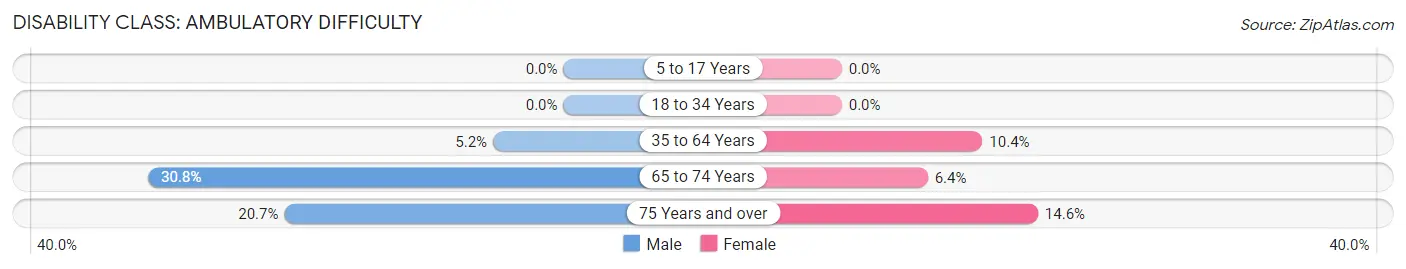
| Age Bracket | Male | Female |
| 5 to 17 Years | 0 (0.0%) | 0 (0.0%) |
| 18 to 34 Years | 0 (0.0%) | 0 (0.0%) |
| 35 to 64 Years | 22 (5.2%) | 50 (10.4%) |
| 65 to 74 Years | 37 (30.8%) | 9 (6.4%) |
| 75 Years and over | 23 (20.7%) | 30 (14.6%) |
Disability Class: Self-Care Difficulty
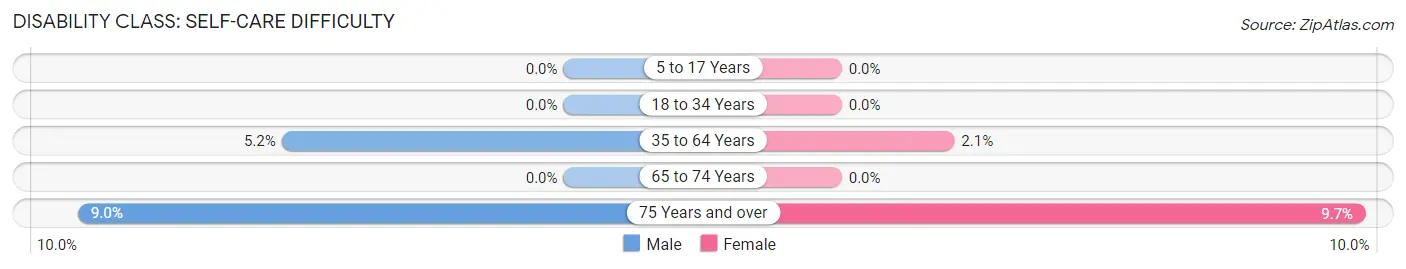
| Age Bracket | Male | Female |
| 5 to 17 Years | 0 (0.0%) | 0 (0.0%) |
| 18 to 34 Years | 0 (0.0%) | 0 (0.0%) |
| 35 to 64 Years | 22 (5.2%) | 10 (2.1%) |
| 65 to 74 Years | 0 (0.0%) | 0 (0.0%) |
| 75 Years and over | 10 (9.0%) | 20 (9.7%) |
Technology Access in Rushville
Computing Device Access in Rushville
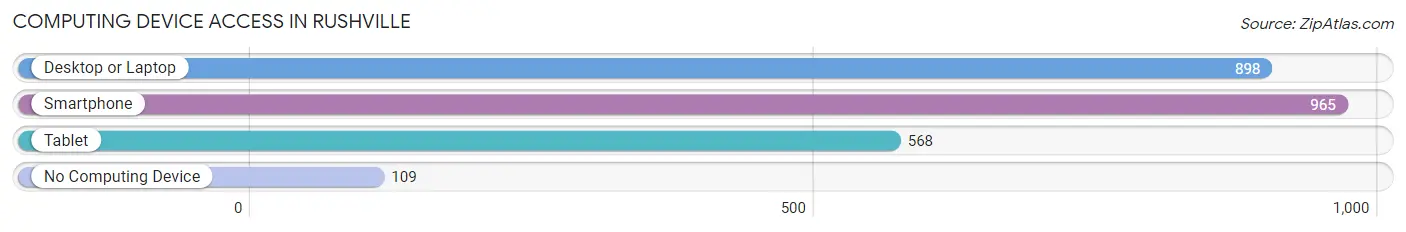
| Device Type | # Households | % Households |
| Desktop or Laptop | 898 | 71.7% |
| Smartphone | 965 | 77.1% |
| Tablet | 568 | 45.4% |
| No Computing Device | 109 | 8.7% |
| Total | 1,252 | 100.0% |
Internet Access in Rushville
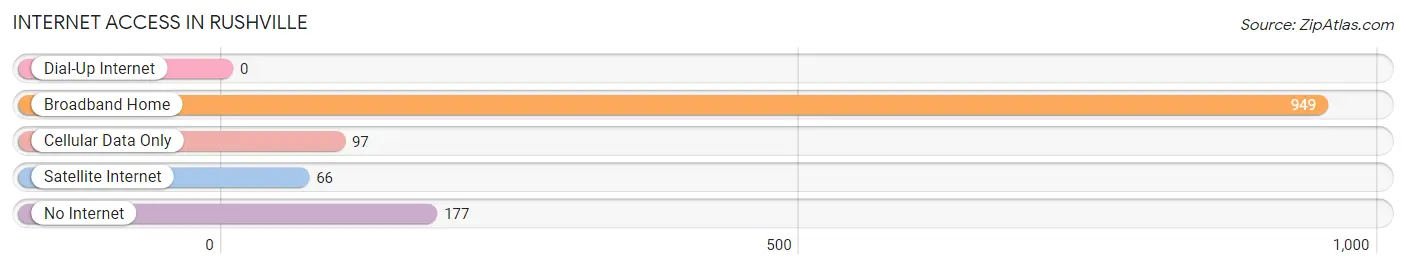
| Internet Type | # Households | % Households |
| Dial-Up Internet | 0 | 0.0% |
| Broadband Home | 949 | 75.8% |
| Cellular Data Only | 97 | 7.7% |
| Satellite Internet | 66 | 5.3% |
| No Internet | 177 | 14.1% |
| Total | 1,252 | 100.0% |
Rushville Summary
History
The city of Rushville, Illinois is located in the western part of the state, in Schuyler County. It is the county seat and the largest city in the county. The city was founded in 1827 by William Rush, a local landowner, and was named after him. The city was incorporated in 1837 and has since grown to a population of over 4,000 people.
The city of Rushville has a rich history that dates back to the early 1800s. The first settlers in the area were Native Americans, who were followed by European settlers in the early 1800s. The first settlers in the area were mostly farmers, who were attracted to the area due to its fertile soil and abundant natural resources.
The city of Rushville was an important stop on the Underground Railroad, which was a network of secret routes and safe houses used by African-American slaves to escape to freedom in the northern United States and Canada. The city was also an important stop on the Illinois Central Railroad, which was built in the 1850s and connected the city to Chicago and other major cities in the Midwest.
The city of Rushville has also been an important center for industry and commerce. In the late 1800s, the city was home to several factories, including a flour mill, a sawmill, a brickyard, and a furniture factory. The city also had several stores and businesses, including a bank, a hotel, and a newspaper.
Geography
Rushville is located in the western part of the state of Illinois, in Schuyler County. The city is situated on the banks of the Little Wabash River, which flows through the city. The city is located about 50 miles south of Peoria and about 100 miles northwest of Indianapolis.
The city of Rushville has a total area of 4.2 square miles, all of which is land. The city is located in a flat, open area, with no major hills or mountains. The city is located in the Central Till Plains region of Illinois, which is characterized by flat, open terrain and fertile soil.
Economy
The economy of Rushville is largely based on agriculture and manufacturing. The city is home to several large farms, which produce corn, soybeans, and other crops. The city is also home to several manufacturing companies, which produce a variety of products, including furniture, clothing, and automotive parts.
The city of Rushville is also home to several businesses and services, including banks, restaurants, and retail stores. The city is also home to several educational institutions, including a community college and a vocational school.
Demographics
As of the 2010 census, the city of Rushville had a population of 4,099 people. The racial makeup of the city was 97.3% White, 0.7% African American, 0.2% Native American, 0.3% Asian, 0.1% Pacific Islander, 0.4% from other races, and 1.0% from two or more races. Hispanic or Latino of any race were 1.3% of the population.
The median income for a household in the city was $37,917, and the median income for a family was $45,938. The per capita income for the city was $18,945. About 11.2% of families and 14.2% of the population were below the poverty line, including 19.2% of those under age 18 and 8.2% of those age 65 or over.
Common Questions
What is Per Capita Income in Rushville?
Per Capita income in Rushville is $31,939.
What is the Median Family Income in Rushville?
Median Family Income in Rushville is $64,583.
What is the Median Household income in Rushville?
Median Household Income in Rushville is $49,719.
What is Income or Wage Gap in Rushville?
Income or Wage Gap in Rushville is 7.5%.
Women in Rushville earn 92.5 cents for every dollar earned by a man.
What is Inequality or Gini Index in Rushville?
Inequality or Gini Index in Rushville is 0.41.
What is the Total Population of Rushville?
Total Population of Rushville is 2,610.
What is the Total Male Population of Rushville?
Total Male Population of Rushville is 1,186.
What is the Total Female Population of Rushville?
Total Female Population of Rushville is 1,424.
What is the Ratio of Males per 100 Females in Rushville?
There are 83.29 Males per 100 Females in Rushville.
What is the Ratio of Females per 100 Males in Rushville?
There are 120.07 Females per 100 Males in Rushville.
What is the Median Population Age in Rushville?
Median Population Age in Rushville is 45.1 Years.
What is the Average Family Size in Rushville
Average Family Size in Rushville is 2.8 People.
What is the Average Household Size in Rushville
Average Household Size in Rushville is 2.0 People.
How Large is the Labor Force in Rushville?
There are 1,395 People in the Labor Forcein in Rushville.
What is the Percentage of People in the Labor Force in Rushville?
64.0% of People are in the Labor Force in Rushville.
What is the Unemployment Rate in Rushville?
Unemployment Rate in Rushville is 8.4%.