Chipley, FL Map & Demographics
Chipley Map
Chipley Overview
$20,558
PER CAPITA INCOME
$48,750
AVG FAMILY INCOME
$35,469
AVG HOUSEHOLD INCOME
16.5%
WAGE / INCOME GAP [ % ]
83.5¢/ $1
WAGE / INCOME GAP [ $ ]
$8,530
FAMILY INCOME DEFICIT
0.46
INEQUALITY / GINI INDEX
3,644
TOTAL POPULATION
1,628
MALE POPULATION
2,016
FEMALE POPULATION
80.75
MALES / 100 FEMALES
123.83
FEMALES / 100 MALES
32.9
MEDIAN AGE
3.4
AVG FAMILY SIZE
2.5
AVG HOUSEHOLD SIZE
1,538
LABOR FORCE [ PEOPLE ]
56.8%
PERCENT IN LABOR FORCE
9.9%
UNEMPLOYMENT RATE
Chipley Zip Codes
Chipley Area Codes
Income in Chipley
Income Overview in Chipley
Per Capita Income in Chipley is $20,558, while median incomes of families and households are $48,750 and $35,469 respectively.
| Characteristic | Number | Measure |
| Per Capita Income | 3,644 | $20,558 |
| Median Family Income | 835 | $48,750 |
| Mean Family Income | 835 | $64,552 |
| Median Household Income | 1,375 | $35,469 |
| Mean Household Income | 1,375 | $51,595 |
| Income Deficit | 835 | $8,530 |
| Wage / Income Gap (%) | 3,644 | 16.50% |
| Wage / Income Gap ($) | 3,644 | 83.50¢ per $1 |
| Gini / Inequality Index | 3,644 | 0.46 |
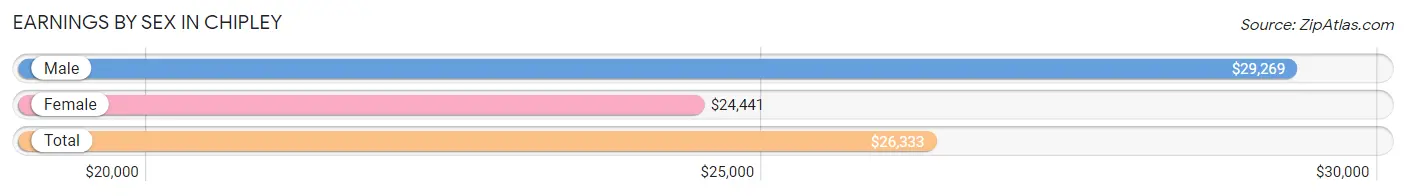
Earnings by Sex in Chipley
Average Earnings in Chipley are $26,333, $29,269 for men and $24,441 for women, a difference of 16.5%.
| Sex | Number | Average Earnings |
| Male | 809 (48.0%) | $29,269 |
| Female | 876 (52.0%) | $24,441 |
| Total | 1,685 (100.0%) | $26,333 |
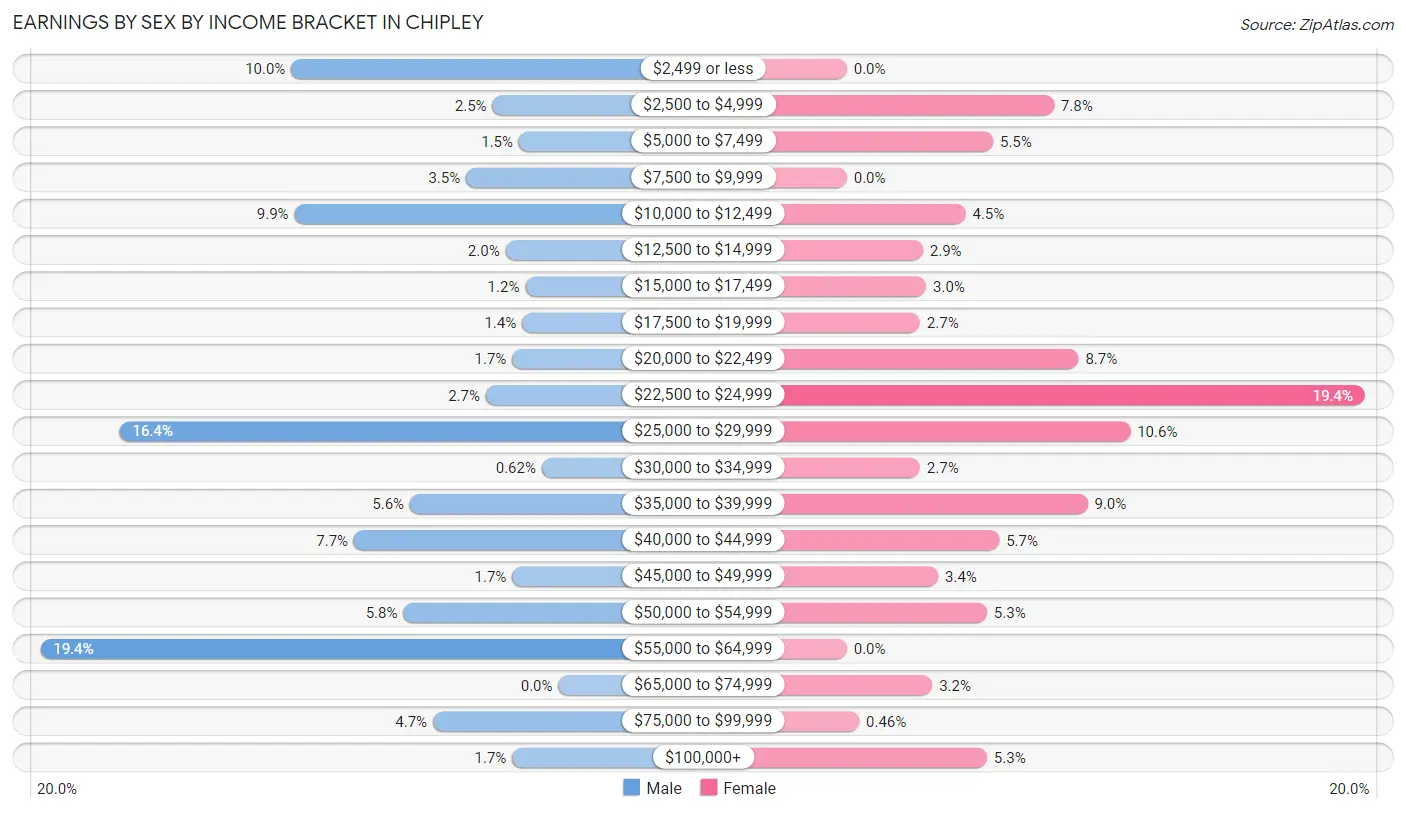
Earnings by Sex by Income Bracket in Chipley
The most common earnings brackets in Chipley are $55,000 to $64,999 for men (157 | 19.4%) and $22,500 to $24,999 for women (170 | 19.4%).
| Income | Male | Female |
| $2,499 or less | 81 (10.0%) | 0 (0.0%) |
| $2,500 to $4,999 | 20 (2.5%) | 68 (7.8%) |
| $5,000 to $7,499 | 12 (1.5%) | 48 (5.5%) |
| $7,500 to $9,999 | 28 (3.5%) | 0 (0.0%) |
| $10,000 to $12,499 | 80 (9.9%) | 39 (4.4%) |
| $12,500 to $14,999 | 16 (2.0%) | 25 (2.9%) |
| $15,000 to $17,499 | 10 (1.2%) | 26 (3.0%) |
| $17,500 to $19,999 | 11 (1.4%) | 24 (2.7%) |
| $20,000 to $22,499 | 14 (1.7%) | 76 (8.7%) |
| $22,500 to $24,999 | 22 (2.7%) | 170 (19.4%) |
| $25,000 to $29,999 | 133 (16.4%) | 93 (10.6%) |
| $30,000 to $34,999 | 5 (0.6%) | 24 (2.7%) |
| $35,000 to $39,999 | 45 (5.6%) | 79 (9.0%) |
| $40,000 to $44,999 | 62 (7.7%) | 50 (5.7%) |
| $45,000 to $49,999 | 14 (1.7%) | 30 (3.4%) |
| $50,000 to $54,999 | 47 (5.8%) | 46 (5.2%) |
| $55,000 to $64,999 | 157 (19.4%) | 0 (0.0%) |
| $65,000 to $74,999 | 0 (0.0%) | 28 (3.2%) |
| $75,000 to $99,999 | 38 (4.7%) | 4 (0.5%) |
| $100,000+ | 14 (1.7%) | 46 (5.2%) |
| Total | 809 (100.0%) | 876 (100.0%) |
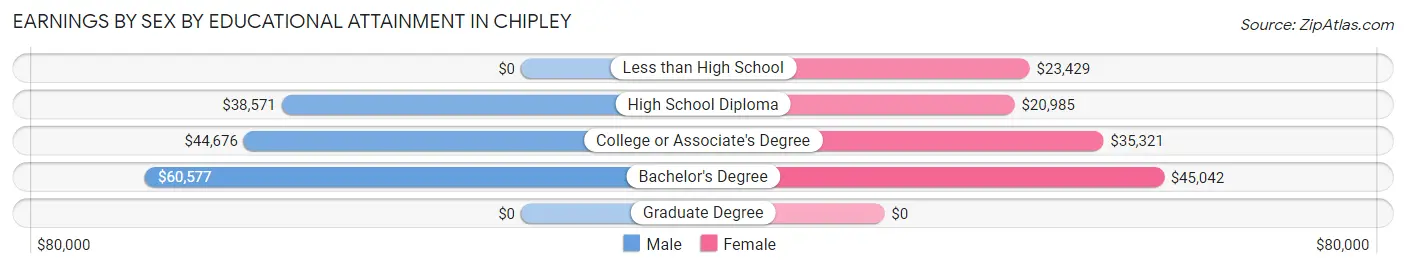
Earnings by Sex by Educational Attainment in Chipley
Average earnings in Chipley are $43,295 for men and $24,529 for women, a difference of 43.3%. Men with an educational attainment of bachelor's degree enjoy the highest average annual earnings of $60,577, while those with high school diploma education earn the least with $38,571. Women with an educational attainment of bachelor's degree earn the most with the average annual earnings of $45,042, while those with high school diploma education have the smallest earnings of $20,985.
| Educational Attainment | Male Income | Female Income |
| Less than High School | - | - |
| High School Diploma | $38,571 | $20,985 |
| College or Associate's Degree | $44,676 | $35,321 |
| Bachelor's Degree | $60,577 | $45,042 |
| Graduate Degree | - | - |
| Total | $43,295 | $24,529 |
Family Income in Chipley
Family Income Brackets in Chipley
According to the Chipley family income data, there are 197 families falling into the $75,000 to $99,999 income range, which is the most common income bracket and makes up 23.6% of all families.
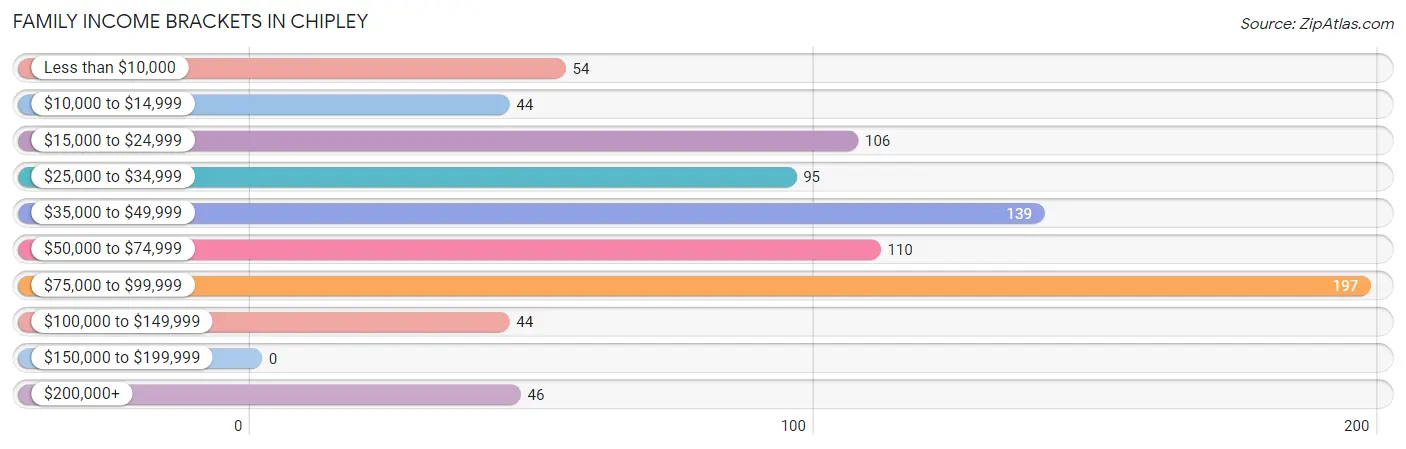
| Income Bracket | # Families | % Families |
| Less than $10,000 | 54 | 6.5% |
| $10,000 to $14,999 | 44 | 5.3% |
| $15,000 to $24,999 | 106 | 12.7% |
| $25,000 to $34,999 | 95 | 11.4% |
| $35,000 to $49,999 | 139 | 16.6% |
| $50,000 to $74,999 | 110 | 13.2% |
| $75,000 to $99,999 | 197 | 23.6% |
| $100,000 to $149,999 | 44 | 5.3% |
| $150,000 to $199,999 | 0 | 0.0% |
| $200,000+ | 46 | 5.5% |
Family Income by Famaliy Size in Chipley
3-person families (328 | 39.3%) account for the highest median family income in Chipley with $80,921 per family, while 3-person families (328 | 39.3%) have the highest median income of $26,974 per family member.
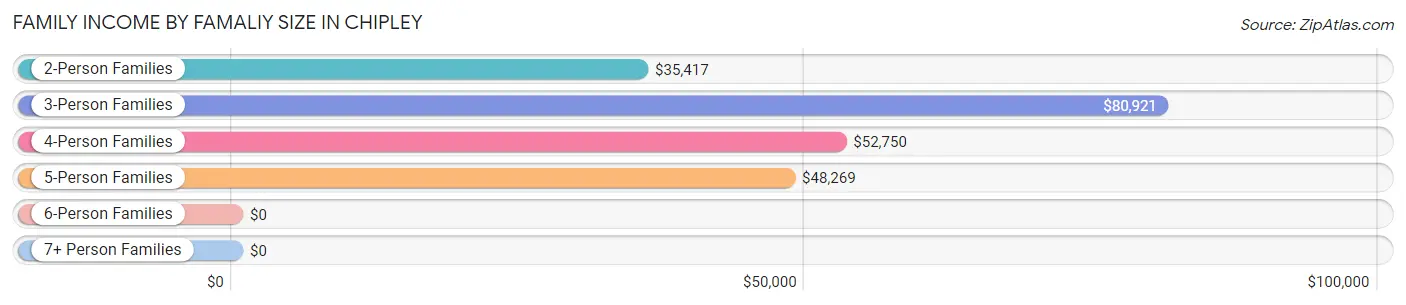
| Income Bracket | # Families | Median Income |
| 2-Person Families | 304 (36.4%) | $35,417 |
| 3-Person Families | 328 (39.3%) | $80,921 |
| 4-Person Families | 155 (18.6%) | $52,750 |
| 5-Person Families | 48 (5.8%) | $48,269 |
| 6-Person Families | 0 (0.0%) | $0 |
| 7+ Person Families | 0 (0.0%) | $0 |
| Total | 835 (100.0%) | $48,750 |
Family Income by Number of Earners in Chipley
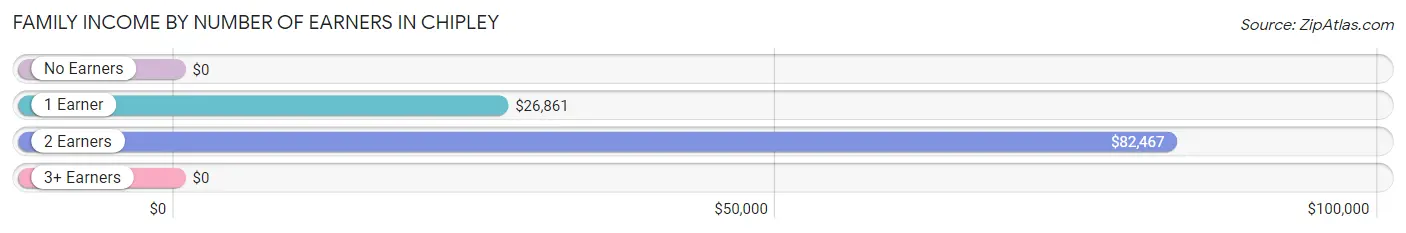
| Number of Earners | # Families | Median Income |
| No Earners | 120 (14.4%) | $0 |
| 1 Earner | 259 (31.0%) | $26,861 |
| 2 Earners | 381 (45.6%) | $82,467 |
| 3+ Earners | 75 (9.0%) | $0 |
| Total | 835 (100.0%) | $48,750 |
Household Income in Chipley
Household Income Brackets in Chipley
With 223 households falling in the category, the $50,000 to $74,999 income range is the most frequent in Chipley, accounting for 16.2% of all households.
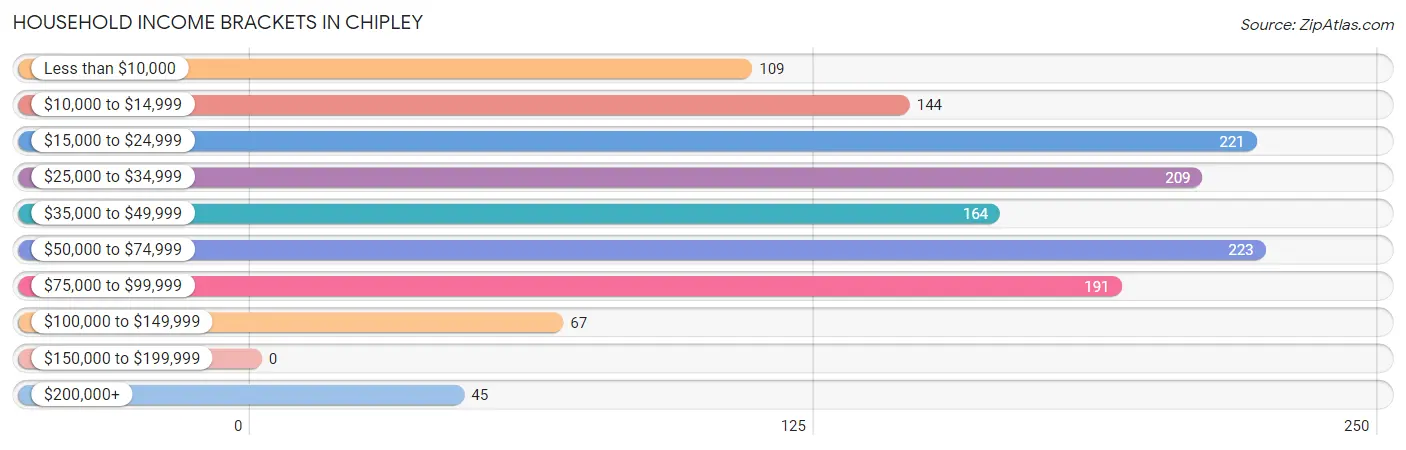
| Income Bracket | # Households | % Households |
| Less than $10,000 | 109 | 7.9% |
| $10,000 to $14,999 | 144 | 10.5% |
| $15,000 to $24,999 | 221 | 16.1% |
| $25,000 to $34,999 | 209 | 15.2% |
| $35,000 to $49,999 | 164 | 11.9% |
| $50,000 to $74,999 | 223 | 16.2% |
| $75,000 to $99,999 | 191 | 13.9% |
| $100,000 to $149,999 | 67 | 4.9% |
| $150,000 to $199,999 | 0 | 0.0% |
| $200,000+ | 45 | 3.3% |
Household Income by Householder Age in Chipley
The median household income in Chipley is $35,469, with the highest median household income of $51,786 found in the 25 to 44 years age bracket for the primary householder. A total of 456 households (33.2%) fall into this category.
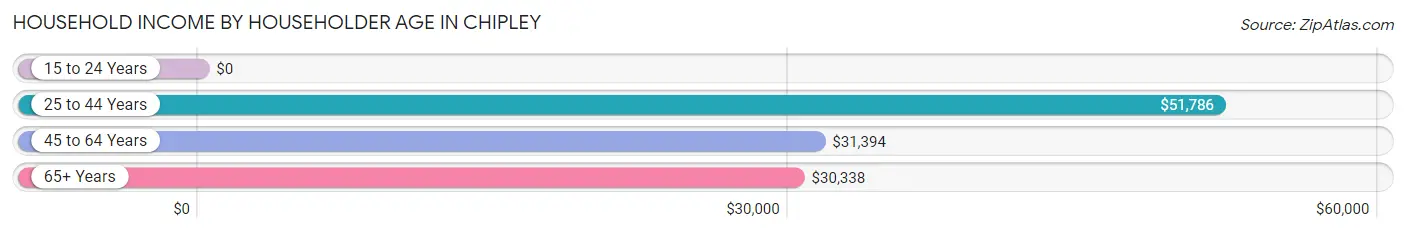
| Income Bracket | # Households | Median Income |
| 15 to 24 Years | 0 (0.0%) | $0 |
| 25 to 44 Years | 456 (33.2%) | $51,786 |
| 45 to 64 Years | 575 (41.8%) | $31,394 |
| 65+ Years | 344 (25.0%) | $30,338 |
| Total | 1,375 (100.0%) | $35,469 |
Poverty in Chipley
Income Below Poverty by Sex and Age in Chipley
With 23.4% poverty level for males and 23.7% for females among the residents of Chipley, 18 to 24 year old males and 5 year old females are the most vulnerable to poverty, with 120 males (57.4%) and 20 females (100.0%) in their respective age groups living below the poverty level.
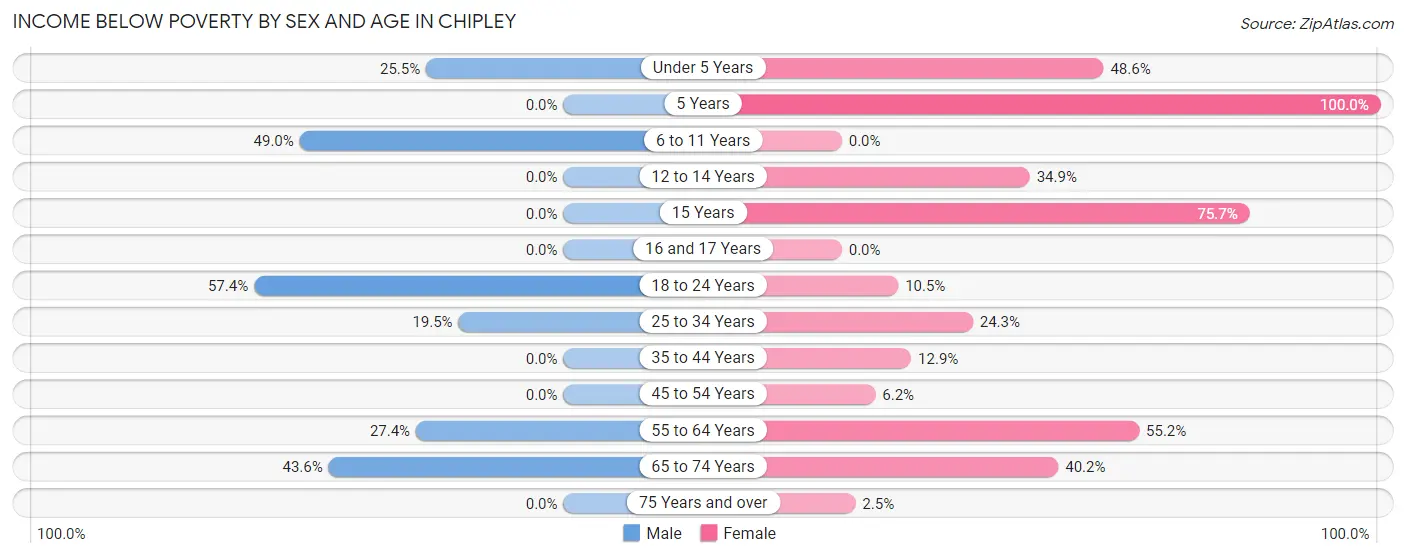
| Age Bracket | Male | Female |
| Under 5 Years | 13 (25.5%) | 85 (48.6%) |
| 5 Years | 0 (0.0%) | 20 (100.0%) |
| 6 to 11 Years | 116 (48.9%) | 0 (0.0%) |
| 12 to 14 Years | 0 (0.0%) | 15 (34.9%) |
| 15 Years | 0 (0.0%) | 28 (75.7%) |
| 16 and 17 Years | 0 (0.0%) | 0 (0.0%) |
| 18 to 24 Years | 120 (57.4%) | 18 (10.5%) |
| 25 to 34 Years | 37 (19.5%) | 81 (24.3%) |
| 35 to 44 Years | 0 (0.0%) | 13 (12.9%) |
| 45 to 54 Years | 0 (0.0%) | 25 (6.2%) |
| 55 to 64 Years | 29 (27.4%) | 133 (55.2%) |
| 65 to 74 Years | 34 (43.6%) | 45 (40.2%) |
| 75 Years and over | 0 (0.0%) | 5 (2.5%) |
| Total | 349 (23.4%) | 468 (23.7%) |
Income Above Poverty by Sex and Age in Chipley
According to the poverty statistics in Chipley, males aged 12 to 14 years and females aged 6 to 11 years are the age groups that are most secure financially, with 100.0% of males and 100.0% of females in these age groups living above the poverty line.
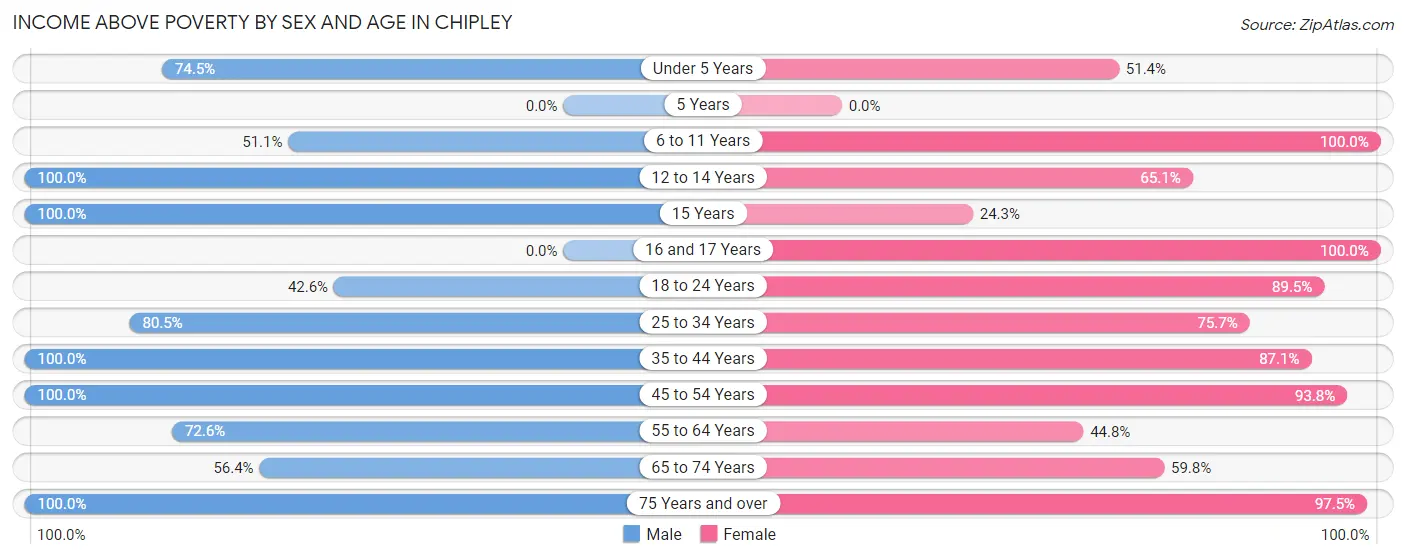
| Age Bracket | Male | Female |
| Under 5 Years | 38 (74.5%) | 90 (51.4%) |
| 5 Years | 0 (0.0%) | 0 (0.0%) |
| 6 to 11 Years | 121 (51.0%) | 125 (100.0%) |
| 12 to 14 Years | 135 (100.0%) | 28 (65.1%) |
| 15 Years | 95 (100.0%) | 9 (24.3%) |
| 16 and 17 Years | 0 (0.0%) | 13 (100.0%) |
| 18 to 24 Years | 89 (42.6%) | 154 (89.5%) |
| 25 to 34 Years | 153 (80.5%) | 252 (75.7%) |
| 35 to 44 Years | 137 (100.0%) | 88 (87.1%) |
| 45 to 54 Years | 204 (100.0%) | 376 (93.8%) |
| 55 to 64 Years | 77 (72.6%) | 108 (44.8%) |
| 65 to 74 Years | 44 (56.4%) | 67 (59.8%) |
| 75 Years and over | 48 (100.0%) | 193 (97.5%) |
| Total | 1,141 (76.6%) | 1,503 (76.3%) |
Income Below Poverty Among Married-Couple Families in Chipley
The poverty statistics for married-couple families in Chipley show that 9.5% or 47 of the total 497 families live below the poverty line. Families with no children have the highest poverty rate of 13.6%, comprising of 27 families. On the other hand, families with 3 or 4 children have the lowest poverty rate of 0.0%, which includes 0 families.
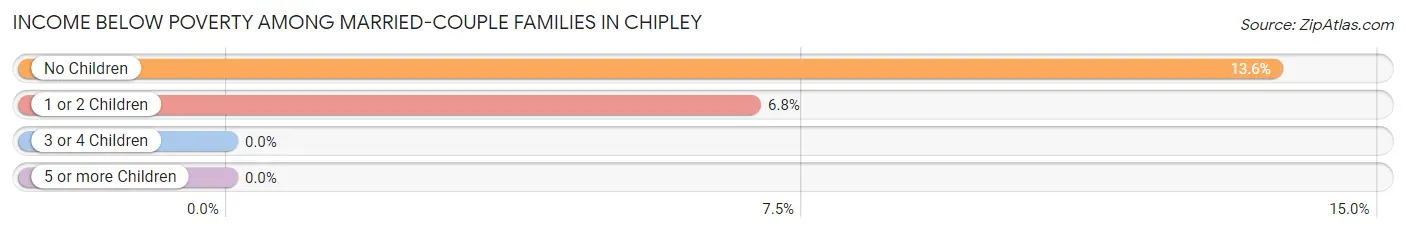
| Children | Above Poverty | Below Poverty |
| No Children | 171 (86.4%) | 27 (13.6%) |
| 1 or 2 Children | 273 (93.2%) | 20 (6.8%) |
| 3 or 4 Children | 6 (100.0%) | 0 (0.0%) |
| 5 or more Children | 0 (0.0%) | 0 (0.0%) |
| Total | 450 (90.5%) | 47 (9.5%) |
Income Below Poverty Among Single-Parent Households in Chipley
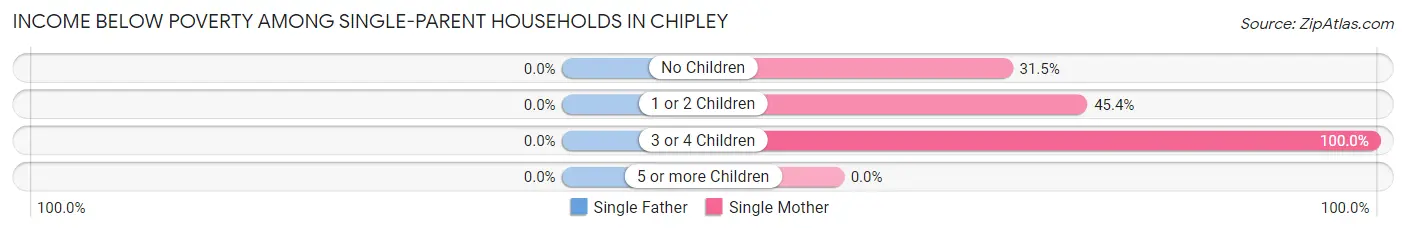
| Children | Single Father | Single Mother |
| No Children | 0 (0.0%) | 39 (31.5%) |
| 1 or 2 Children | 0 (0.0%) | 88 (45.4%) |
| 3 or 4 Children | 0 (0.0%) | 16 (100.0%) |
| 5 or more Children | 0 (0.0%) | 0 (0.0%) |
| Total | 0 (0.0%) | 143 (42.8%) |
Income Below Poverty Among Married-Couple vs Single-Parent Households in Chipley
The poverty data for Chipley shows that 47 of the married-couple family households (9.5%) and 143 of the single-parent households (42.3%) are living below the poverty level. Within the married-couple family households, those with no children have the highest poverty rate, with 27 households (13.6%) falling below the poverty line. Among the single-parent households, those with 3 or 4 children have the highest poverty rate, with 16 household (100.0%) living below poverty.
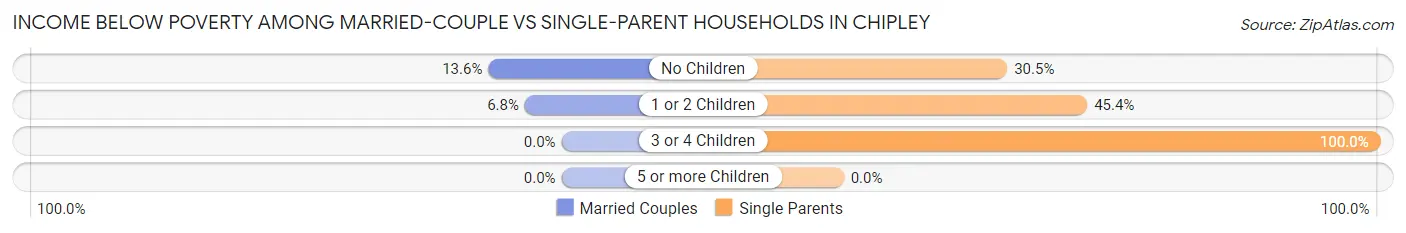
| Children | Married-Couple Families | Single-Parent Households |
| No Children | 27 (13.6%) | 39 (30.5%) |
| 1 or 2 Children | 20 (6.8%) | 88 (45.4%) |
| 3 or 4 Children | 0 (0.0%) | 16 (100.0%) |
| 5 or more Children | 0 (0.0%) | 0 (0.0%) |
| Total | 47 (9.5%) | 143 (42.3%) |
Race in Chipley
The most populous races in Chipley are White / Caucasian (2,291 | 62.9%), Black / African American (815 | 22.4%), and Hispanic or Latino (481 | 13.2%).
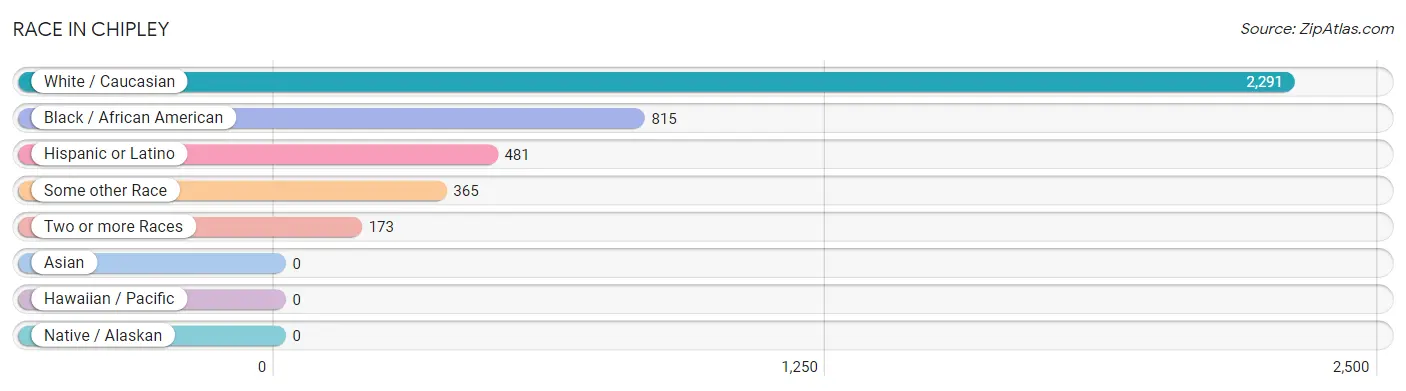
| Race | # Population | % Population |
| Asian | 0 | 0.0% |
| Black / African American | 815 | 22.4% |
| Hawaiian / Pacific | 0 | 0.0% |
| Hispanic or Latino | 481 | 13.2% |
| Native / Alaskan | 0 | 0.0% |
| White / Caucasian | 2,291 | 62.9% |
| Two or more Races | 173 | 4.8% |
| Some other Race | 365 | 10.0% |
| Total | 3,644 | 100.0% |
Ancestry in Chipley
The most populous ancestries reported in Chipley are American (1,067 | 29.3%), Central American (327 | 9.0%), Honduran (327 | 9.0%), Irish (212 | 5.8%), and English (159 | 4.4%), together accounting for 57.4% of all Chipley residents.
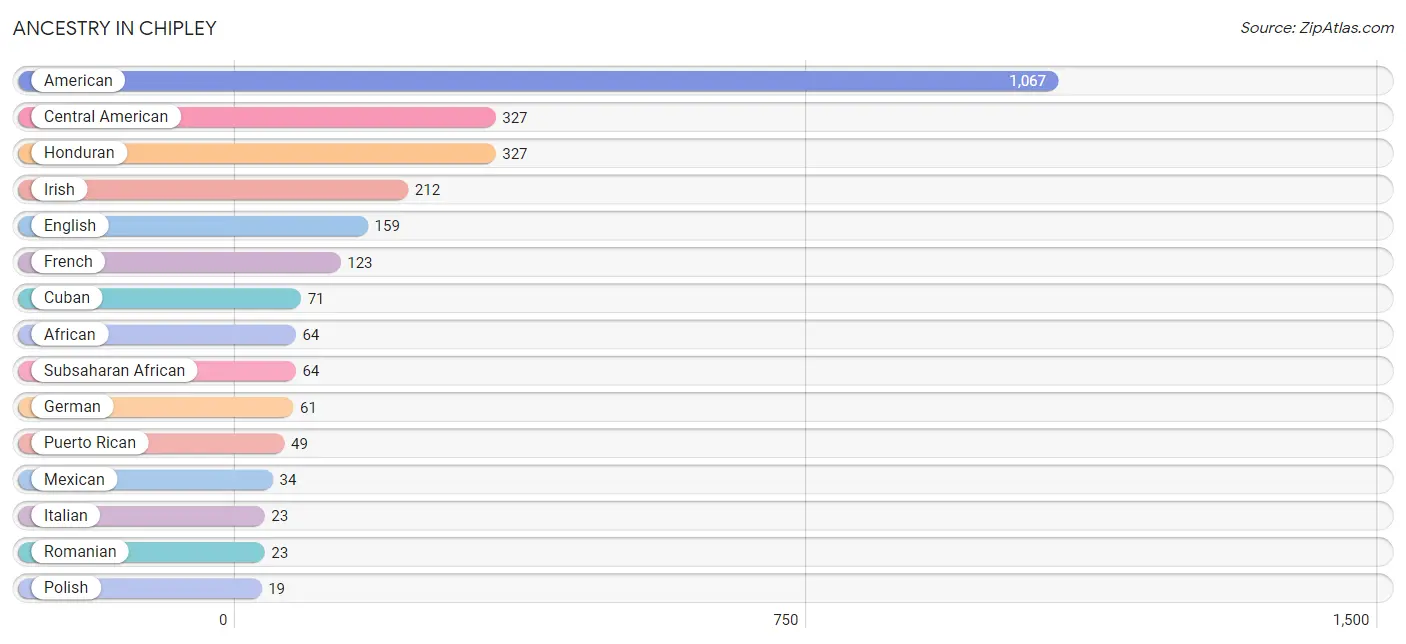
| Ancestry | # Population | % Population |
| African | 64 | 1.8% |
| American | 1,067 | 29.3% |
| Blackfeet | 3 | 0.1% |
| British | 8 | 0.2% |
| Central American | 327 | 9.0% |
| Cherokee | 3 | 0.1% |
| Creek | 2 | 0.1% |
| Cuban | 71 | 1.9% |
| Dutch | 8 | 0.2% |
| English | 159 | 4.4% |
| French | 123 | 3.4% |
| German | 61 | 1.7% |
| Honduran | 327 | 9.0% |
| Irish | 212 | 5.8% |
| Italian | 23 | 0.6% |
| Jamaican | 12 | 0.3% |
| Latvian | 13 | 0.4% |
| Mexican | 34 | 0.9% |
| Polish | 19 | 0.5% |
| Puerto Rican | 49 | 1.3% |
| Romanian | 23 | 0.6% |
| Scandinavian | 12 | 0.3% |
| Scotch-Irish | 14 | 0.4% |
| Scottish | 16 | 0.4% |
| Subsaharan African | 64 | 1.8% |
| Ukrainian | 8 | 0.2% |
| Welsh | 3 | 0.1% | View All 27 Rows |
Immigrants in Chipley
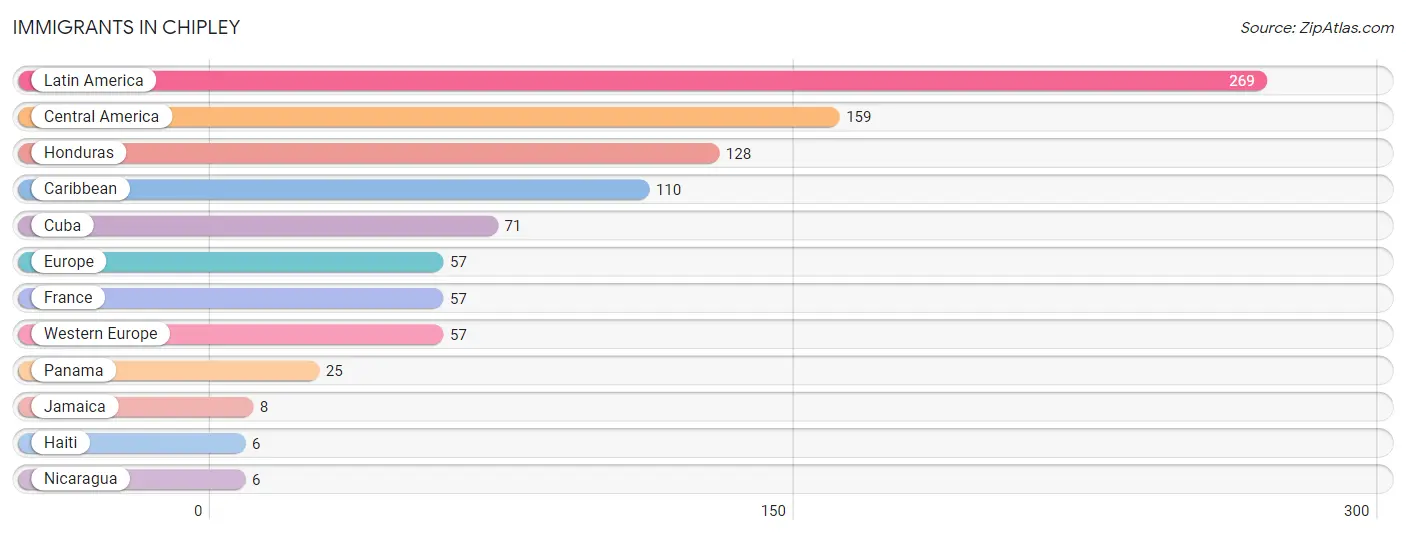
The most numerous immigrant groups reported in Chipley came from Latin America (269 | 7.4%), Central America (159 | 4.4%), Honduras (128 | 3.5%), Caribbean (110 | 3.0%), and Cuba (71 | 1.9%), together accounting for 20.2% of all Chipley residents.
| Immigration Origin | # Population | % Population |
| Caribbean | 110 | 3.0% |
| Central America | 159 | 4.4% |
| Cuba | 71 | 1.9% |
| Europe | 57 | 1.6% |
| France | 57 | 1.6% |
| Haiti | 6 | 0.2% |
| Honduras | 128 | 3.5% |
| Jamaica | 8 | 0.2% |
| Latin America | 269 | 7.4% |
| Nicaragua | 6 | 0.2% |
| Panama | 25 | 0.7% |
| Western Europe | 57 | 1.6% | View All 12 Rows |
Sex and Age in Chipley
Sex and Age in Chipley
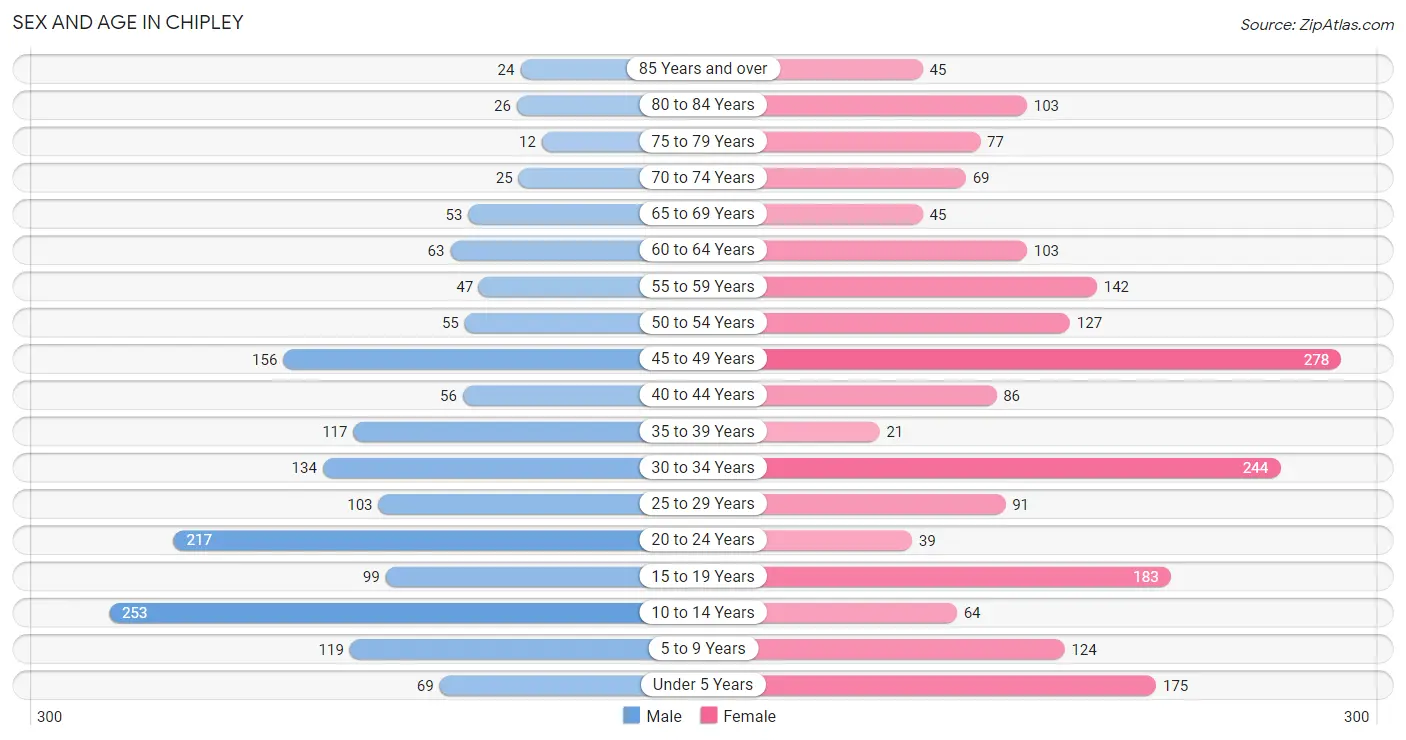
The most populous age groups in Chipley are 10 to 14 Years (253 | 15.5%) for men and 45 to 49 Years (278 | 13.8%) for women.
| Age Bracket | Male | Female |
| Under 5 Years | 69 (4.2%) | 175 (8.7%) |
| 5 to 9 Years | 119 (7.3%) | 124 (6.1%) |
| 10 to 14 Years | 253 (15.5%) | 64 (3.2%) |
| 15 to 19 Years | 99 (6.1%) | 183 (9.1%) |
| 20 to 24 Years | 217 (13.3%) | 39 (1.9%) |
| 25 to 29 Years | 103 (6.3%) | 91 (4.5%) |
| 30 to 34 Years | 134 (8.2%) | 244 (12.1%) |
| 35 to 39 Years | 117 (7.2%) | 21 (1.0%) |
| 40 to 44 Years | 56 (3.4%) | 86 (4.3%) |
| 45 to 49 Years | 156 (9.6%) | 278 (13.8%) |
| 50 to 54 Years | 55 (3.4%) | 127 (6.3%) |
| 55 to 59 Years | 47 (2.9%) | 142 (7.0%) |
| 60 to 64 Years | 63 (3.9%) | 103 (5.1%) |
| 65 to 69 Years | 53 (3.3%) | 45 (2.2%) |
| 70 to 74 Years | 25 (1.5%) | 69 (3.4%) |
| 75 to 79 Years | 12 (0.7%) | 77 (3.8%) |
| 80 to 84 Years | 26 (1.6%) | 103 (5.1%) |
| 85 Years and over | 24 (1.5%) | 45 (2.2%) |
| Total | 1,628 (100.0%) | 2,016 (100.0%) |
Families and Households in Chipley
Median Family Size in Chipley
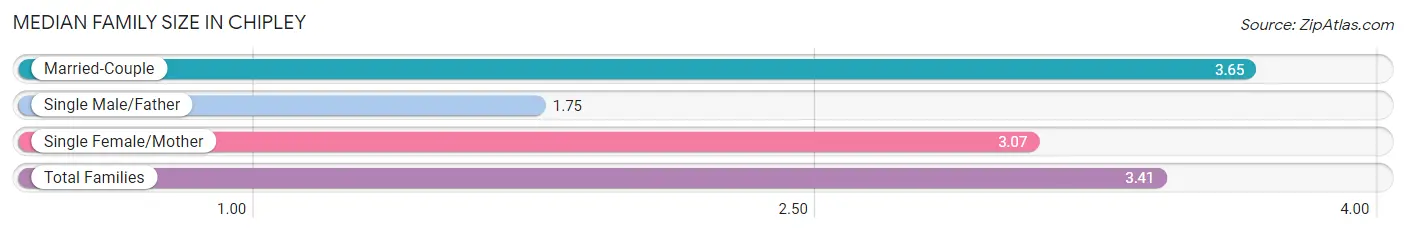
The median family size in Chipley is 3.41 persons per family, with married-couple families (497 | 59.5%) accounting for the largest median family size of 3.65 persons per family. On the other hand, single male/father families (4 | 0.5%) represent the smallest median family size with 1.75 persons per family.
| Family Type | # Families | Family Size |
| Married-Couple | 497 (59.5%) | 3.65 |
| Single Male/Father | 4 (0.5%) | 1.75 |
| Single Female/Mother | 334 (40.0%) | 3.07 |
| Total Families | 835 (100.0%) | 3.41 |
Median Household Size in Chipley
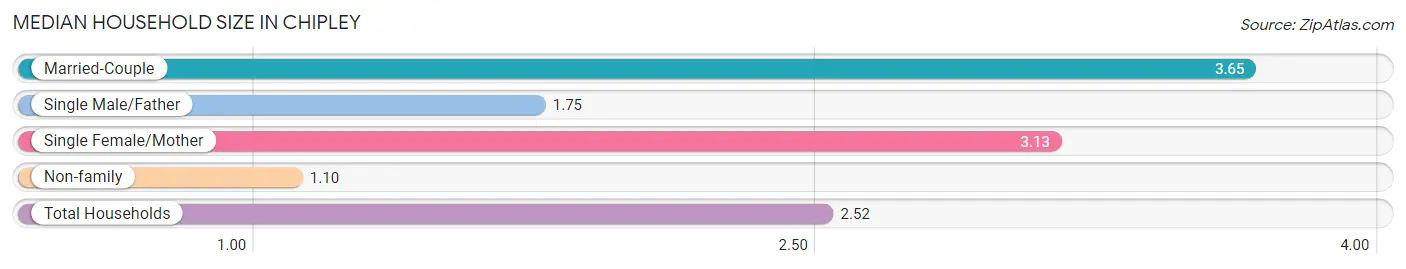
The median household size in Chipley is 2.52 persons per household, with married-couple households (497 | 36.1%) accounting for the largest median household size of 3.65 persons per household. non-family households (540 | 39.3%) represent the smallest median household size with 1.10 persons per household.
| Household Type | # Households | Household Size |
| Married-Couple | 497 (36.1%) | 3.65 |
| Single Male/Father | 4 (0.3%) | 1.75 |
| Single Female/Mother | 334 (24.3%) | 3.13 |
| Non-family | 540 (39.3%) | 1.10 |
| Total Households | 1,375 (100.0%) | 2.52 |
Household Size by Marriage Status in Chipley
Out of a total of 1,375 households in Chipley, 835 (60.7%) are family households, while 540 (39.3%) are nonfamily households. The most numerous type of family households are 3-person households, comprising 346, and the most common type of nonfamily households are 1-person households, comprising 523.
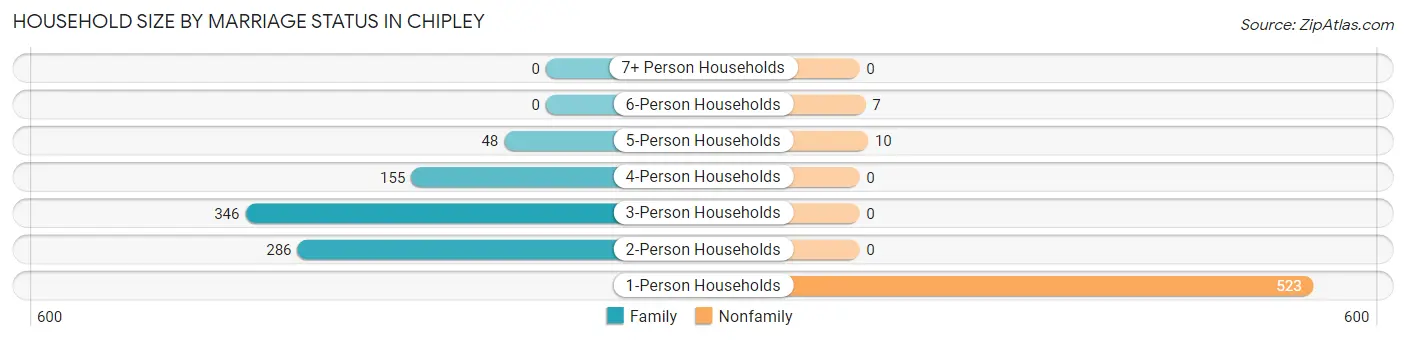
| Household Size | Family Households | Nonfamily Households |
| 1-Person Households | - | 523 (38.0%) |
| 2-Person Households | 286 (20.8%) | 0 (0.0%) |
| 3-Person Households | 346 (25.2%) | 0 (0.0%) |
| 4-Person Households | 155 (11.3%) | 0 (0.0%) |
| 5-Person Households | 48 (3.5%) | 10 (0.7%) |
| 6-Person Households | 0 (0.0%) | 7 (0.5%) |
| 7+ Person Households | 0 (0.0%) | 0 (0.0%) |
| Total | 835 (60.7%) | 540 (39.3%) |
Female Fertility in Chipley
Fertility by Age in Chipley
Average fertility rate in Chipley is 51.0 births per 1,000 women. Women in the age bracket of 20 to 34 years have the highest fertility rate with 128.0 births per 1,000 women. Women in the age bracket of 20 to 34 years acount for 100.0% of all women with births.
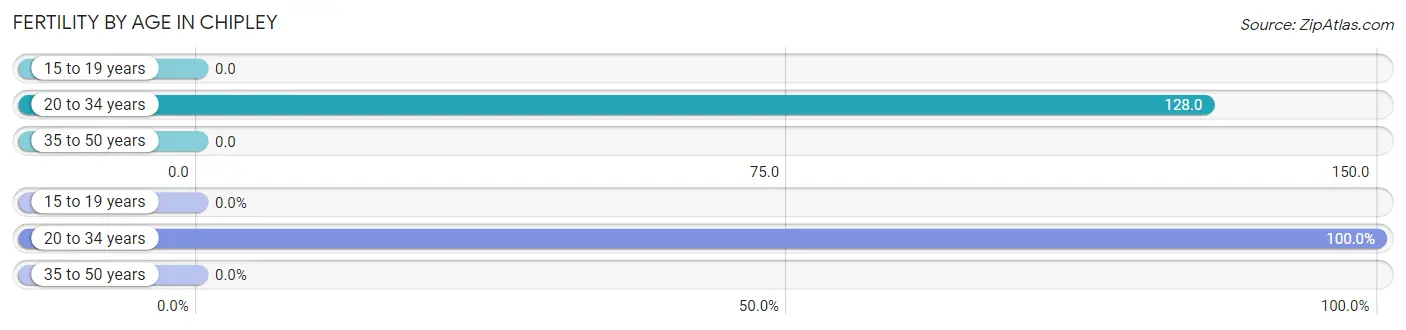
| Age Bracket | Women with Births | Births / 1,000 Women |
| 15 to 19 years | 0 (0.0%) | 0.0 |
| 20 to 34 years | 48 (100.0%) | 128.0 |
| 35 to 50 years | 0 (0.0%) | 0.0 |
| Total | 48 (100.0%) | 51.0 |
Fertility by Age by Marriage Status in Chipley
62.5% of women with births (48) in Chipley are married. The highest percentage of unmarried women with births falls into 20 to 34 years age bracket with 37.5% of them unmarried at the time of birth, while the lowest percentage of unmarried women with births belong to 20 to 34 years age bracket with 37.5% of them unmarried.
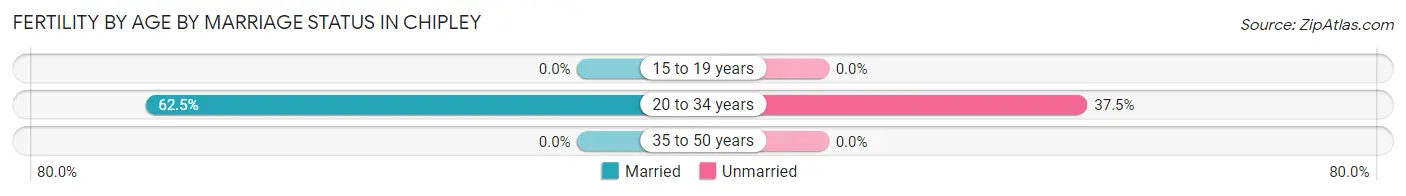
| Age Bracket | Married | Unmarried |
| 15 to 19 years | 0 (0.0%) | 0 (0.0%) |
| 20 to 34 years | 30 (62.5%) | 18 (37.5%) |
| 35 to 50 years | 0 (0.0%) | 0 (0.0%) |
| Total | 30 (62.5%) | 18 (37.5%) |
Fertility by Education in Chipley
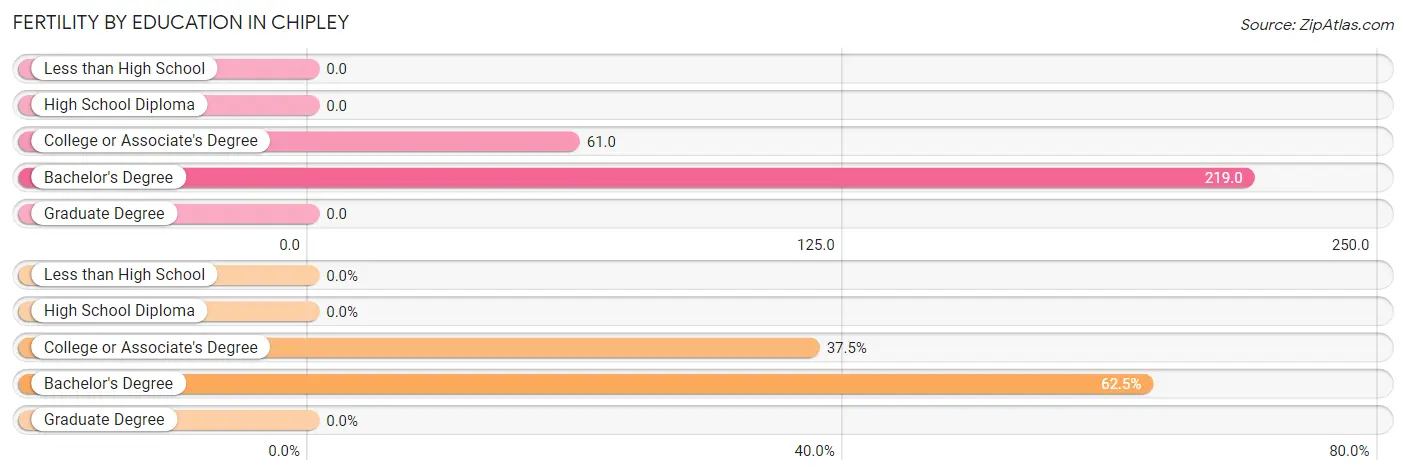
| Educational Attainment | Women with Births | Births / 1,000 Women |
| Less than High School | 0 (0.0%) | 0.0 |
| High School Diploma | 0 (0.0%) | 0.0 |
| College or Associate's Degree | 18 (37.5%) | 61.0 |
| Bachelor's Degree | 30 (62.5%) | 219.0 |
| Graduate Degree | 0 (0.0%) | 0.0 |
| Total | 48 (100.0%) | 51.0 |
Fertility by Education by Marriage Status in Chipley
37.5% of women with births in Chipley are unmarried. Women with the educational attainment of bachelor's degree are most likely to be married with 100.0% of them married at childbirth, while women with the educational attainment of college or associate's degree are least likely to be married with 100.0% of them unmarried at childbirth.
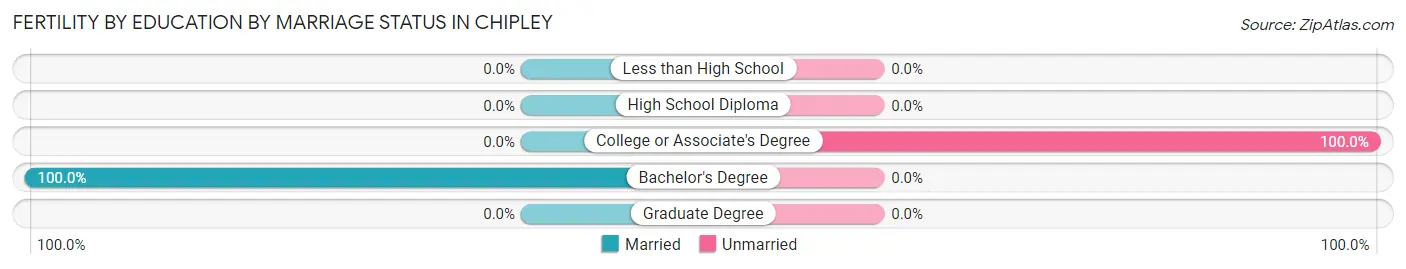
| Educational Attainment | Married | Unmarried |
| Less than High School | 0 (0.0%) | 0 (0.0%) |
| High School Diploma | 0 (0.0%) | 0 (0.0%) |
| College or Associate's Degree | 0 (0.0%) | 18 (100.0%) |
| Bachelor's Degree | 30 (100.0%) | 0 (0.0%) |
| Graduate Degree | 0 (0.0%) | 0 (0.0%) |
| Total | 30 (62.5%) | 18 (37.5%) |
Employment Characteristics in Chipley
Employment by Class of Employer in Chipley
Among the 1,385 employed individuals in Chipley, private company employees (745 | 53.8%), local government employees (262 | 18.9%), and state government employees (164 | 11.8%) make up the most common classes of employment.
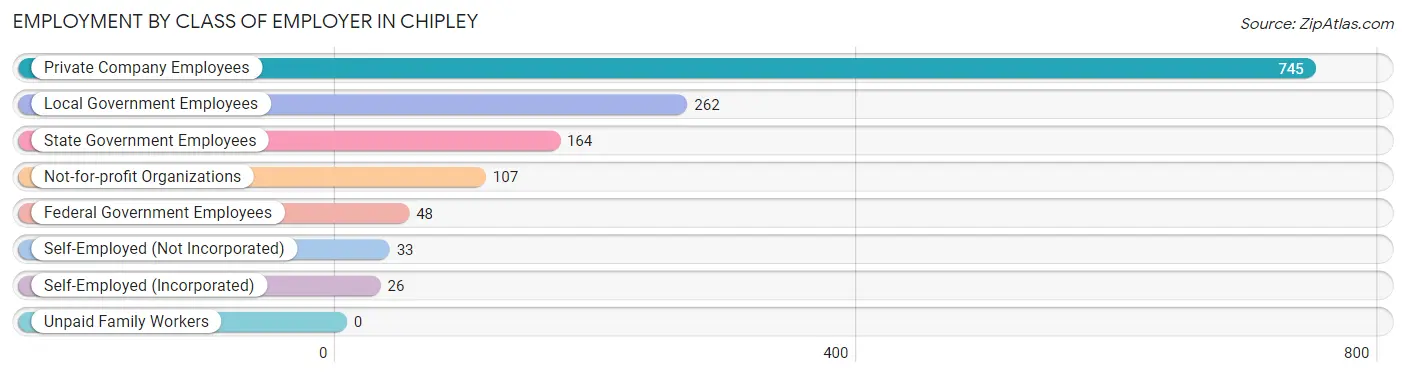
| Employer Class | # Employees | % Employees |
| Private Company Employees | 745 | 53.8% |
| Self-Employed (Incorporated) | 26 | 1.9% |
| Self-Employed (Not Incorporated) | 33 | 2.4% |
| Not-for-profit Organizations | 107 | 7.7% |
| Local Government Employees | 262 | 18.9% |
| State Government Employees | 164 | 11.8% |
| Federal Government Employees | 48 | 3.5% |
| Unpaid Family Workers | 0 | 0.0% |
| Total | 1,385 | 100.0% |
Employment Status by Age in Chipley
According to the labor force statistics for Chipley, out of the total population over 16 years of age (2,708), 56.8% or 1,538 individuals are in the labor force, with 9.9% or 152 of them unemployed. The age group with the highest labor force participation rate is 45 to 54 years, with 89.8% or 553 individuals in the labor force. Within the labor force, the 20 to 24 years age range has the highest percentage of unemployed individuals, with 69.4% or 120 of them being unemployed.
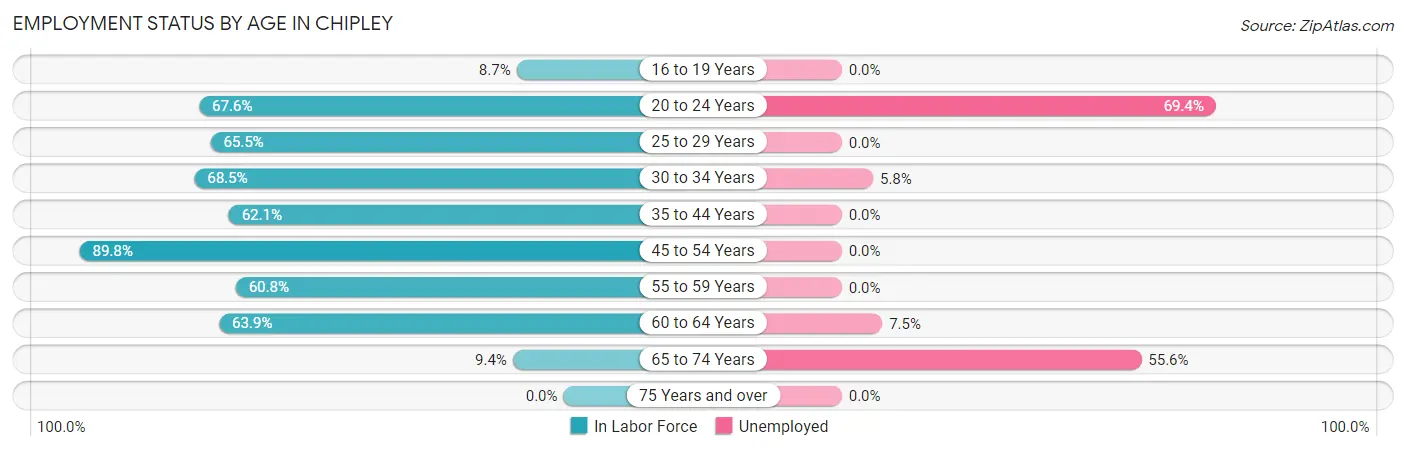
| Age Bracket | In Labor Force | Unemployed |
| 16 to 19 Years | 13 (8.7%) | 0 (0.0%) |
| 20 to 24 Years | 173 (67.6%) | 120 (69.4%) |
| 25 to 29 Years | 127 (65.5%) | 0 (0.0%) |
| 30 to 34 Years | 259 (68.5%) | 15 (5.8%) |
| 35 to 44 Years | 174 (62.1%) | 0 (0.0%) |
| 45 to 54 Years | 553 (89.8%) | 0 (0.0%) |
| 55 to 59 Years | 115 (60.8%) | 0 (0.0%) |
| 60 to 64 Years | 106 (63.9%) | 8 (7.5%) |
| 65 to 74 Years | 18 (9.4%) | 10 (55.6%) |
| 75 Years and over | 0 (0.0%) | 0 (0.0%) |
| Total | 1,538 (56.8%) | 152 (9.9%) |
Employment Status by Educational Attainment in Chipley
According to labor force statistics for Chipley, 73.2% of individuals (1,334) out of the total population between 25 and 64 years of age (1,823) are in the labor force, with 1.7% or 23 of them being unemployed. The group with the highest labor force participation rate are those with the educational attainment of less than high school, with 76.5% or 346 individuals in the labor force. Within the labor force, individuals with high school diploma education have the highest percentage of unemployment, with 5.1% or 23 of them being unemployed.
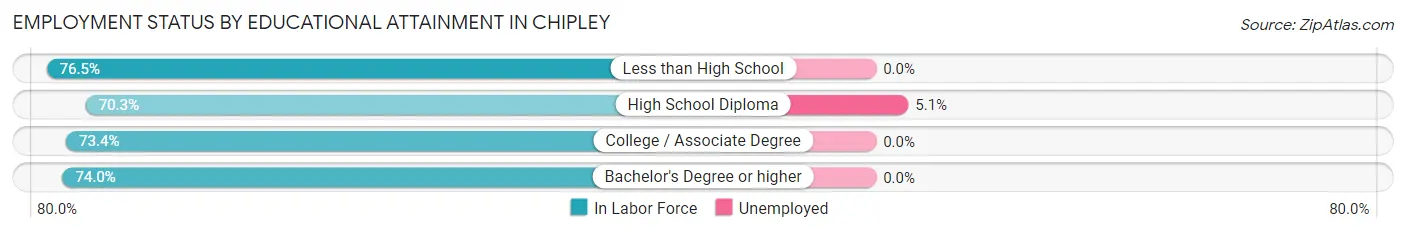
| Educational Attainment | In Labor Force | Unemployed |
| Less than High School | 346 (76.5%) | 0 (0.0%) |
| High School Diploma | 455 (70.3%) | 33 (5.1%) |
| College / Associate Degree | 303 (73.4%) | 0 (0.0%) |
| Bachelor's Degree or higher | 230 (74.0%) | 0 (0.0%) |
| Total | 1,334 (73.2%) | 31 (1.7%) |
Employment Occupations by Sex in Chipley
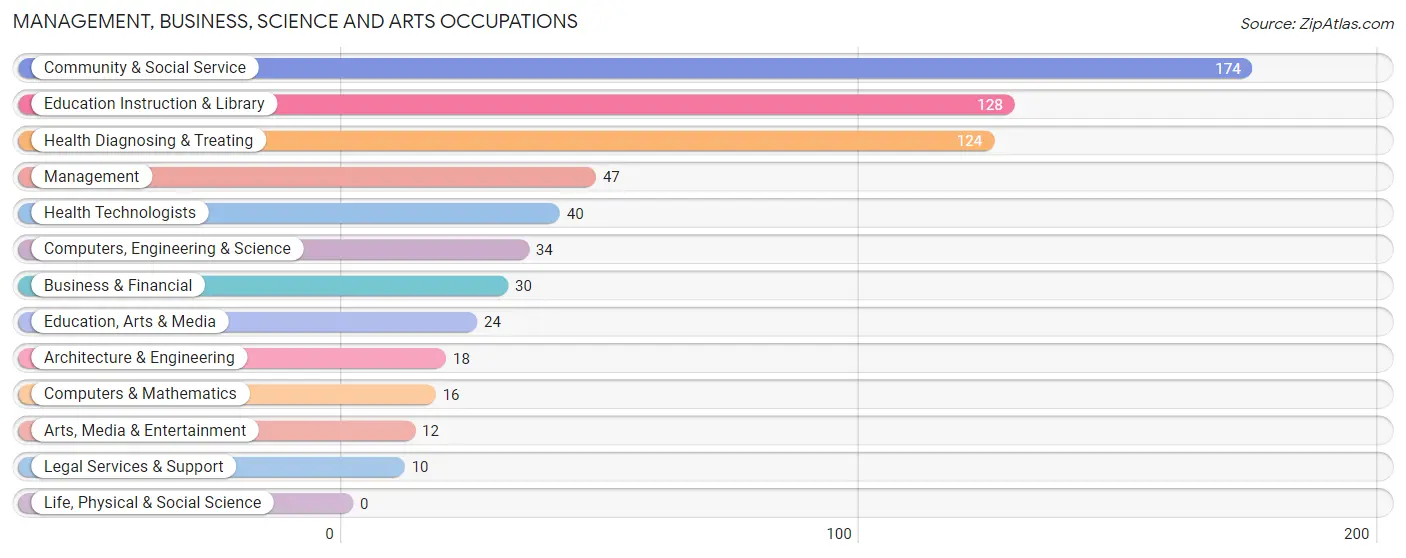
Management, Business, Science and Arts Occupations
The most common Management, Business, Science and Arts occupations in Chipley are Community & Social Service (174 | 12.6%), Education Instruction & Library (128 | 9.2%), Health Diagnosing & Treating (124 | 8.9%), Management (47 | 3.4%), and Health Technologists (40 | 2.9%).
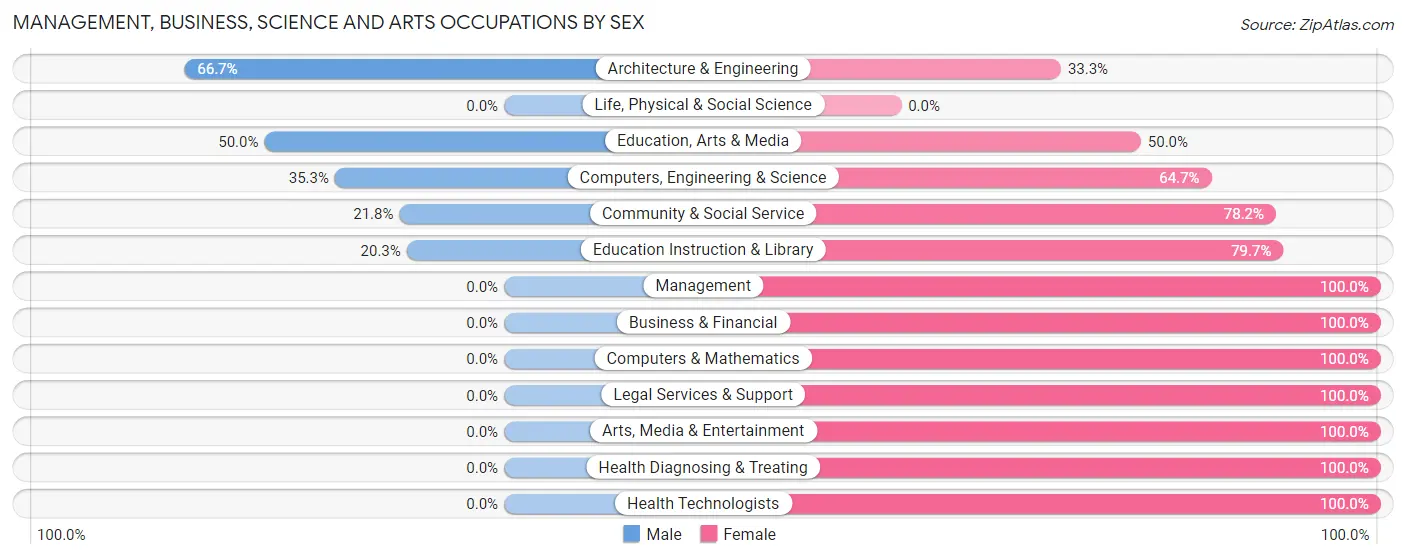
Management, Business, Science and Arts Occupations by Sex
Within the Management, Business, Science and Arts occupations in Chipley, the most male-oriented occupations are Architecture & Engineering (66.7%), Education, Arts & Media (50.0%), and Computers, Engineering & Science (35.3%), while the most female-oriented occupations are Management (100.0%), Business & Financial (100.0%), and Computers & Mathematics (100.0%).
| Occupation | Male | Female |
| Management | 0 (0.0%) | 47 (100.0%) |
| Business & Financial | 0 (0.0%) | 30 (100.0%) |
| Computers, Engineering & Science | 12 (35.3%) | 22 (64.7%) |
| Computers & Mathematics | 0 (0.0%) | 16 (100.0%) |
| Architecture & Engineering | 12 (66.7%) | 6 (33.3%) |
| Life, Physical & Social Science | 0 (0.0%) | 0 (0.0%) |
| Community & Social Service | 38 (21.8%) | 136 (78.2%) |
| Education, Arts & Media | 12 (50.0%) | 12 (50.0%) |
| Legal Services & Support | 0 (0.0%) | 10 (100.0%) |
| Education Instruction & Library | 26 (20.3%) | 102 (79.7%) |
| Arts, Media & Entertainment | 0 (0.0%) | 12 (100.0%) |
| Health Diagnosing & Treating | 0 (0.0%) | 124 (100.0%) |
| Health Technologists | 0 (0.0%) | 40 (100.0%) |
| Total (Category) | 50 (12.2%) | 359 (87.8%) |
| Total (Overall) | 558 (40.3%) | 827 (59.7%) |
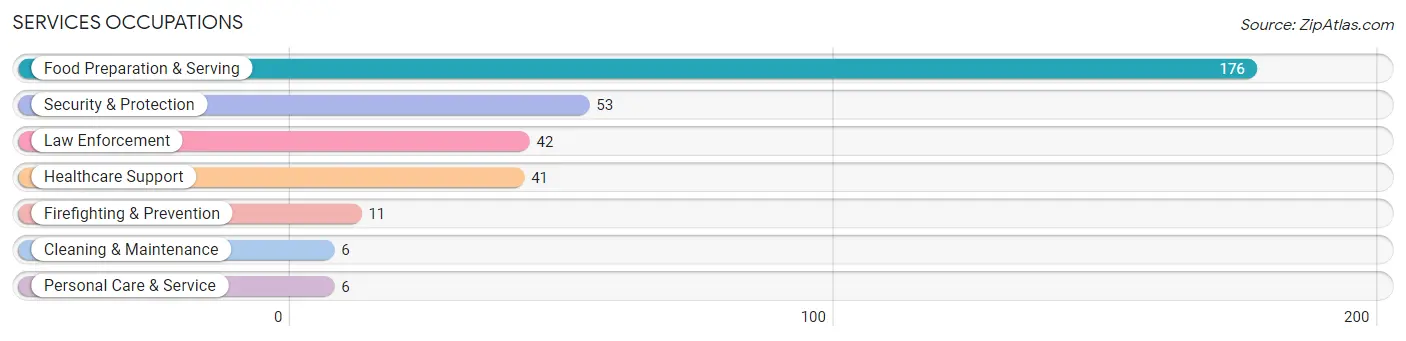
Services Occupations
The most common Services occupations in Chipley are Food Preparation & Serving (176 | 12.7%), Security & Protection (53 | 3.8%), Law Enforcement (42 | 3.0%), Healthcare Support (41 | 3.0%), and Firefighting & Prevention (11 | 0.8%).
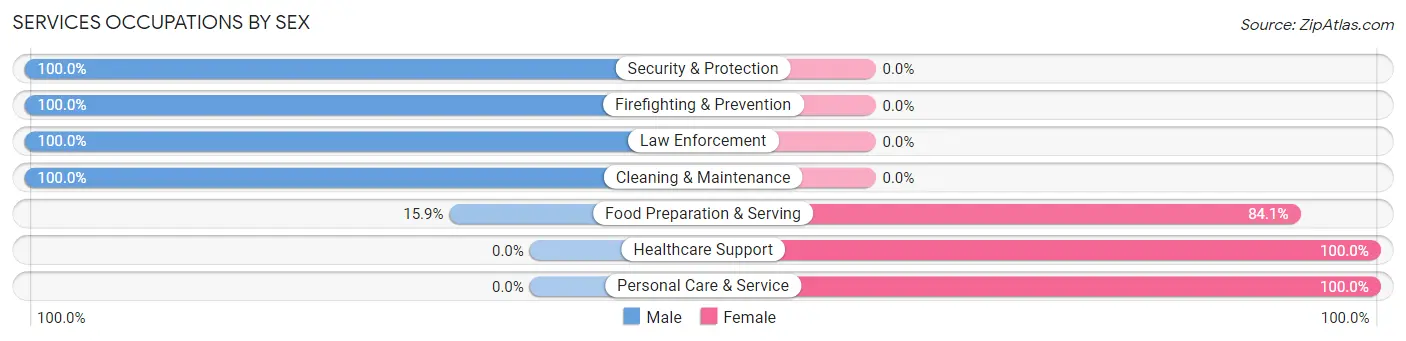
Services Occupations by Sex
Within the Services occupations in Chipley, the most male-oriented occupations are Security & Protection (100.0%), Firefighting & Prevention (100.0%), and Law Enforcement (100.0%), while the most female-oriented occupations are Healthcare Support (100.0%), Personal Care & Service (100.0%), and Food Preparation & Serving (84.1%).
| Occupation | Male | Female |
| Healthcare Support | 0 (0.0%) | 41 (100.0%) |
| Security & Protection | 53 (100.0%) | 0 (0.0%) |
| Firefighting & Prevention | 11 (100.0%) | 0 (0.0%) |
| Law Enforcement | 42 (100.0%) | 0 (0.0%) |
| Food Preparation & Serving | 28 (15.9%) | 148 (84.1%) |
| Cleaning & Maintenance | 6 (100.0%) | 0 (0.0%) |
| Personal Care & Service | 0 (0.0%) | 6 (100.0%) |
| Total (Category) | 87 (30.8%) | 195 (69.2%) |
| Total (Overall) | 558 (40.3%) | 827 (59.7%) |
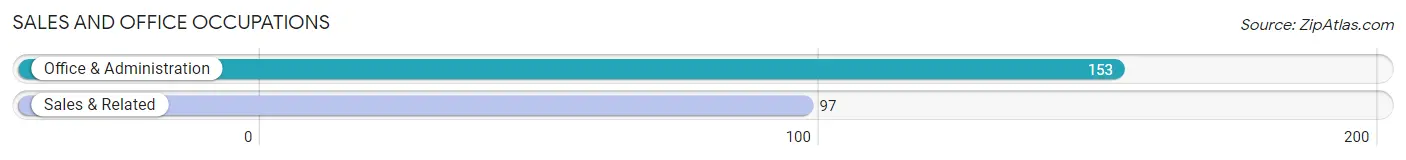
Sales and Office Occupations
The most common Sales and Office occupations in Chipley are Office & Administration (153 | 11.1%), and Sales & Related (97 | 7.0%).
Sales and Office Occupations by Sex
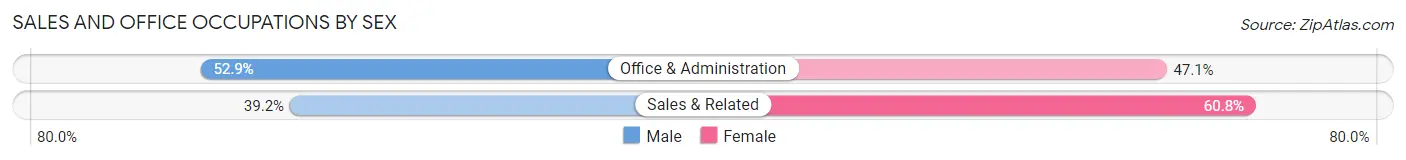
| Occupation | Male | Female |
| Sales & Related | 38 (39.2%) | 59 (60.8%) |
| Office & Administration | 81 (52.9%) | 72 (47.1%) |
| Total (Category) | 119 (47.6%) | 131 (52.4%) |
| Total (Overall) | 558 (40.3%) | 827 (59.7%) |
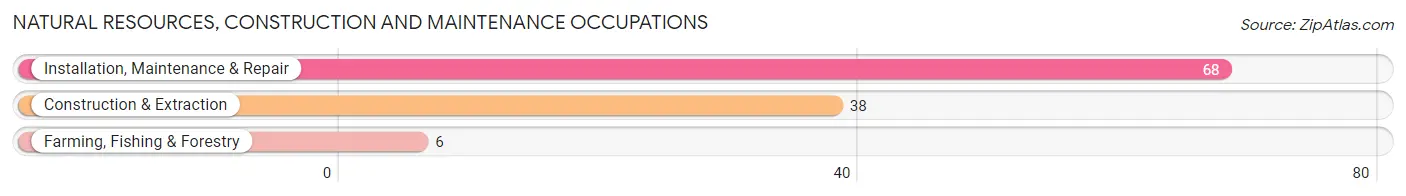
Natural Resources, Construction and Maintenance Occupations
The most common Natural Resources, Construction and Maintenance occupations in Chipley are Installation, Maintenance & Repair (68 | 4.9%), Construction & Extraction (38 | 2.7%), and Farming, Fishing & Forestry (6 | 0.4%).
Natural Resources, Construction and Maintenance Occupations by Sex
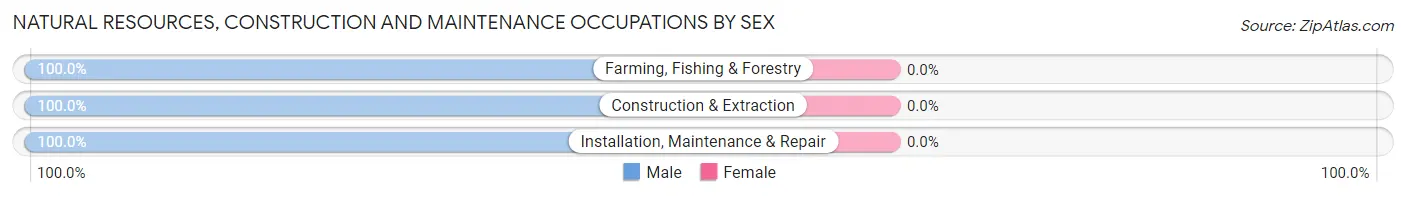
| Occupation | Male | Female |
| Farming, Fishing & Forestry | 6 (100.0%) | 0 (0.0%) |
| Construction & Extraction | 38 (100.0%) | 0 (0.0%) |
| Installation, Maintenance & Repair | 68 (100.0%) | 0 (0.0%) |
| Total (Category) | 112 (100.0%) | 0 (0.0%) |
| Total (Overall) | 558 (40.3%) | 827 (59.7%) |
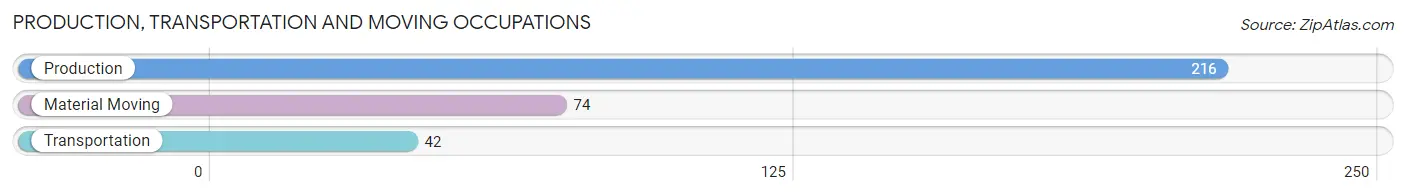
Production, Transportation and Moving Occupations
The most common Production, Transportation and Moving occupations in Chipley are Production (216 | 15.6%), Material Moving (74 | 5.3%), and Transportation (42 | 3.0%).
Production, Transportation and Moving Occupations by Sex
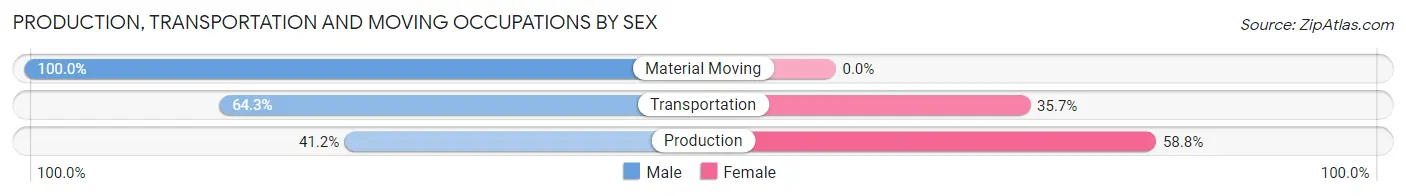
| Occupation | Male | Female |
| Production | 89 (41.2%) | 127 (58.8%) |
| Transportation | 27 (64.3%) | 15 (35.7%) |
| Material Moving | 74 (100.0%) | 0 (0.0%) |
| Total (Category) | 190 (57.2%) | 142 (42.8%) |
| Total (Overall) | 558 (40.3%) | 827 (59.7%) |
Employment Industries by Sex in Chipley
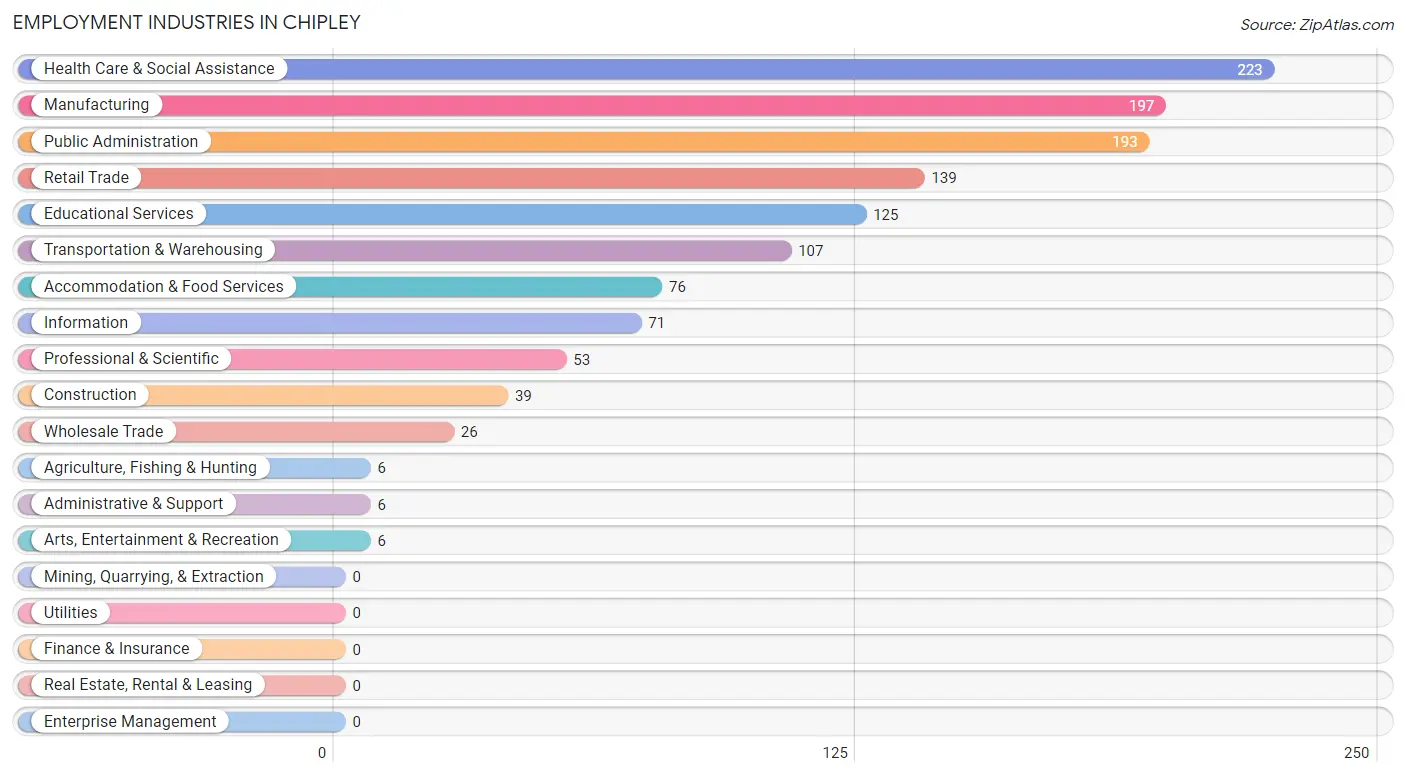
Employment Industries in Chipley
The major employment industries in Chipley include Health Care & Social Assistance (223 | 16.1%), Manufacturing (197 | 14.2%), Public Administration (193 | 13.9%), Retail Trade (139 | 10.0%), and Educational Services (125 | 9.0%).
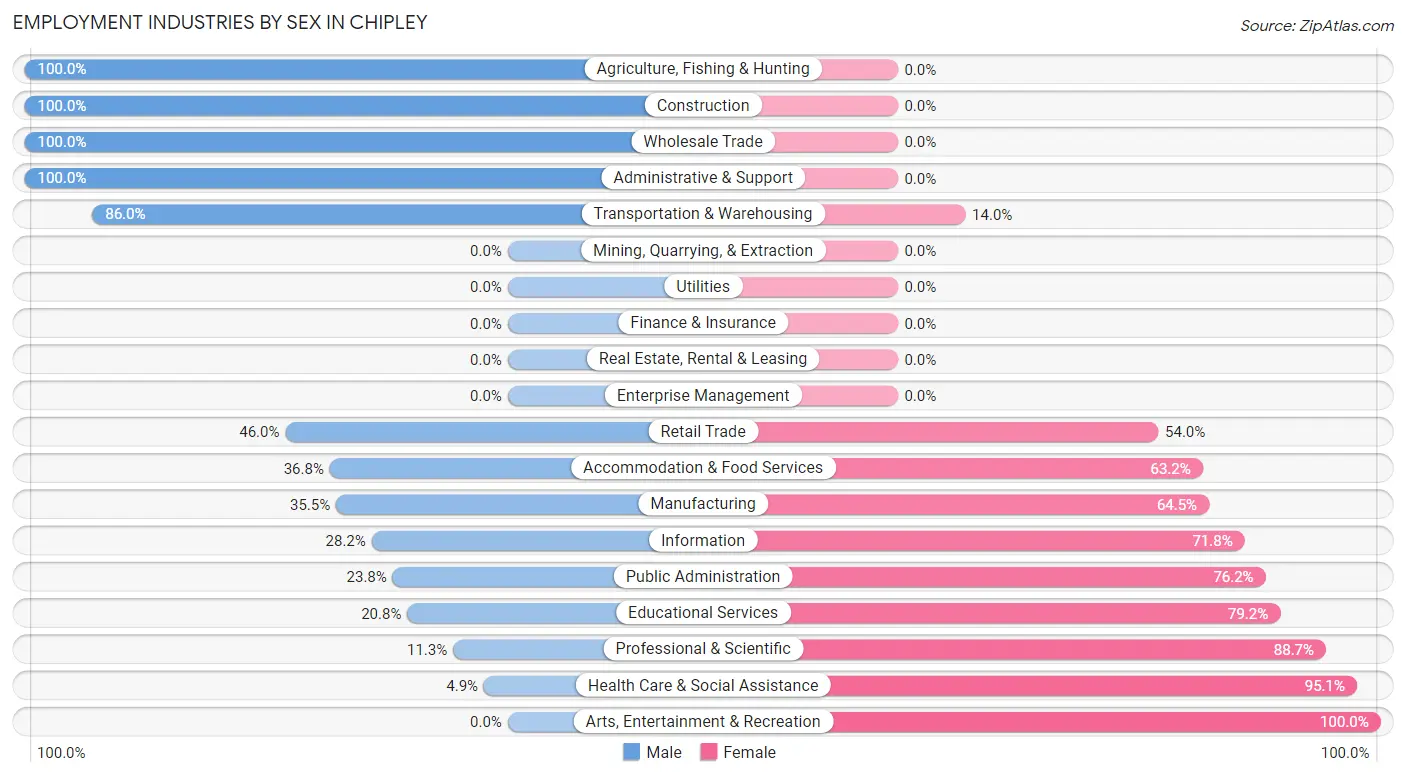
Employment Industries by Sex in Chipley
The Chipley industries that see more men than women are Agriculture, Fishing & Hunting (100.0%), Construction (100.0%), and Wholesale Trade (100.0%), whereas the industries that tend to have a higher number of women are Arts, Entertainment & Recreation (100.0%), Health Care & Social Assistance (95.1%), and Professional & Scientific (88.7%).
| Industry | Male | Female |
| Agriculture, Fishing & Hunting | 6 (100.0%) | 0 (0.0%) |
| Mining, Quarrying, & Extraction | 0 (0.0%) | 0 (0.0%) |
| Construction | 39 (100.0%) | 0 (0.0%) |
| Manufacturing | 70 (35.5%) | 127 (64.5%) |
| Wholesale Trade | 26 (100.0%) | 0 (0.0%) |
| Retail Trade | 64 (46.0%) | 75 (54.0%) |
| Transportation & Warehousing | 92 (86.0%) | 15 (14.0%) |
| Utilities | 0 (0.0%) | 0 (0.0%) |
| Information | 20 (28.2%) | 51 (71.8%) |
| Finance & Insurance | 0 (0.0%) | 0 (0.0%) |
| Real Estate, Rental & Leasing | 0 (0.0%) | 0 (0.0%) |
| Professional & Scientific | 6 (11.3%) | 47 (88.7%) |
| Enterprise Management | 0 (0.0%) | 0 (0.0%) |
| Administrative & Support | 6 (100.0%) | 0 (0.0%) |
| Educational Services | 26 (20.8%) | 99 (79.2%) |
| Health Care & Social Assistance | 11 (4.9%) | 212 (95.1%) |
| Arts, Entertainment & Recreation | 0 (0.0%) | 6 (100.0%) |
| Accommodation & Food Services | 28 (36.8%) | 48 (63.2%) |
| Public Administration | 46 (23.8%) | 147 (76.2%) |
| Total | 558 (40.3%) | 827 (59.7%) |
Education in Chipley
School Enrollment in Chipley
The most common levels of schooling among the 880 students in Chipley are middle school (313 | 35.6%), elementary school (203 | 23.1%), and college / undergraduate (162 | 18.4%).
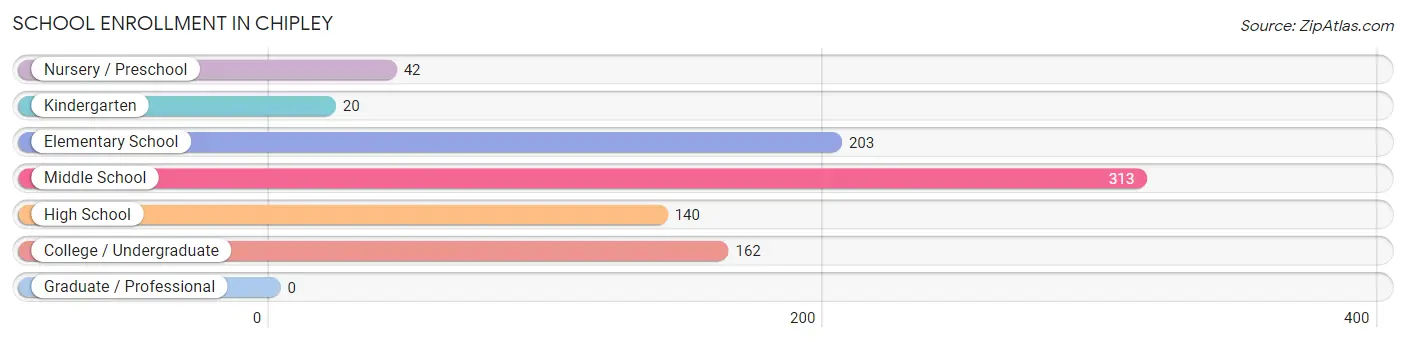
| School Level | # Students | % Students |
| Nursery / Preschool | 42 | 4.8% |
| Kindergarten | 20 | 2.3% |
| Elementary School | 203 | 23.1% |
| Middle School | 313 | 35.6% |
| High School | 140 | 15.9% |
| College / Undergraduate | 162 | 18.4% |
| Graduate / Professional | 0 | 0.0% |
| Total | 880 | 100.0% |
School Enrollment by Age by Funding Source in Chipley
Out of a total of 880 students who are enrolled in schools in Chipley, 104 (11.8%) attend a private institution, while the remaining 776 (88.2%) are enrolled in public schools. The age group of 5 to 9 year old has the highest likelihood of being enrolled in private schools, with 45 (20.2% in the age bracket) enrolled. Conversely, the age group of 15 to 17 year olds has the lowest likelihood of being enrolled in a private school, with 132 (100.0% in the age bracket) attending a public institution.
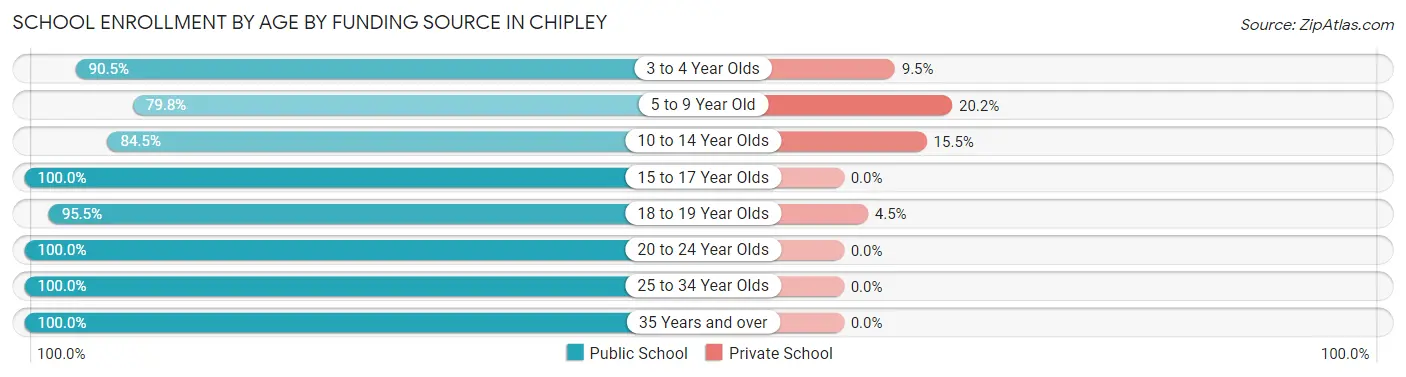
| Age Bracket | Public School | Private School |
| 3 to 4 Year Olds | 38 (90.5%) | 4 (9.5%) |
| 5 to 9 Year Old | 178 (79.8%) | 45 (20.2%) |
| 10 to 14 Year Olds | 268 (84.5%) | 49 (15.5%) |
| 15 to 17 Year Olds | 132 (100.0%) | 0 (0.0%) |
| 18 to 19 Year Olds | 127 (95.5%) | 6 (4.5%) |
| 20 to 24 Year Olds | 10 (100.0%) | 0 (0.0%) |
| 25 to 34 Year Olds | 10 (100.0%) | 0 (0.0%) |
| 35 Years and over | 13 (100.0%) | 0 (0.0%) |
| Total | 776 (88.2%) | 104 (11.8%) |
Educational Attainment by Field of Study in Chipley
Education (143 | 33.6%), science & technology (132 | 31.0%), arts & humanities (36 | 8.5%), psychology (30 | 7.0%), and engineering (27 | 6.3%) are the most common fields of study among 426 individuals in Chipley who have obtained a bachelor's degree or higher.

| Field of Study | # Graduates | % Graduates |
| Computers & Mathematics | 0 | 0.0% |
| Bio, Nature & Agricultural | 19 | 4.5% |
| Physical & Health Sciences | 0 | 0.0% |
| Psychology | 30 | 7.0% |
| Social Sciences | 8 | 1.9% |
| Engineering | 27 | 6.3% |
| Multidisciplinary Studies | 0 | 0.0% |
| Science & Technology | 132 | 31.0% |
| Business | 14 | 3.3% |
| Education | 143 | 33.6% |
| Literature & Languages | 0 | 0.0% |
| Liberal Arts & History | 4 | 0.9% |
| Visual & Performing Arts | 0 | 0.0% |
| Communications | 13 | 3.0% |
| Arts & Humanities | 36 | 8.5% |
| Total | 426 | 100.0% |
Transportation & Commute in Chipley
Vehicle Availability by Sex in Chipley
The most prevalent vehicle ownership categories in Chipley are males with 2 vehicles (258, accounting for 46.2%) and females with 2 vehicles (416, making up 31.2%).
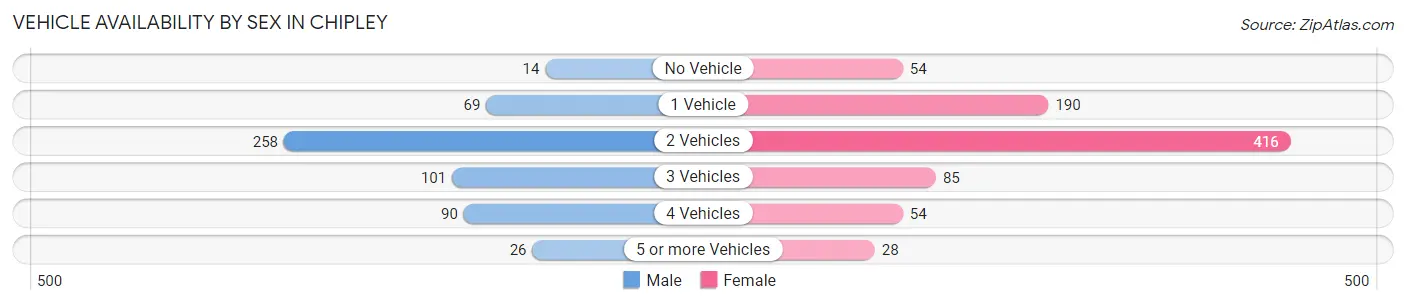
| Vehicles Available | Male | Female |
| No Vehicle | 14 (2.5%) | 54 (6.5%) |
| 1 Vehicle | 69 (12.4%) | 190 (23.0%) |
| 2 Vehicles | 258 (46.2%) | 416 (50.3%) |
| 3 Vehicles | 101 (18.1%) | 85 (10.3%) |
| 4 Vehicles | 90 (16.1%) | 54 (6.5%) |
| 5 or more Vehicles | 26 (4.7%) | 28 (3.4%) |
| Total | 558 (100.0%) | 827 (100.0%) |
Commute Time in Chipley
The most frequently occuring commute durations in Chipley are 5 to 9 minutes (326 commuters, 23.7%), 60 to 89 minutes (208 commuters, 15.1%), and 10 to 14 minutes (173 commuters, 12.6%).
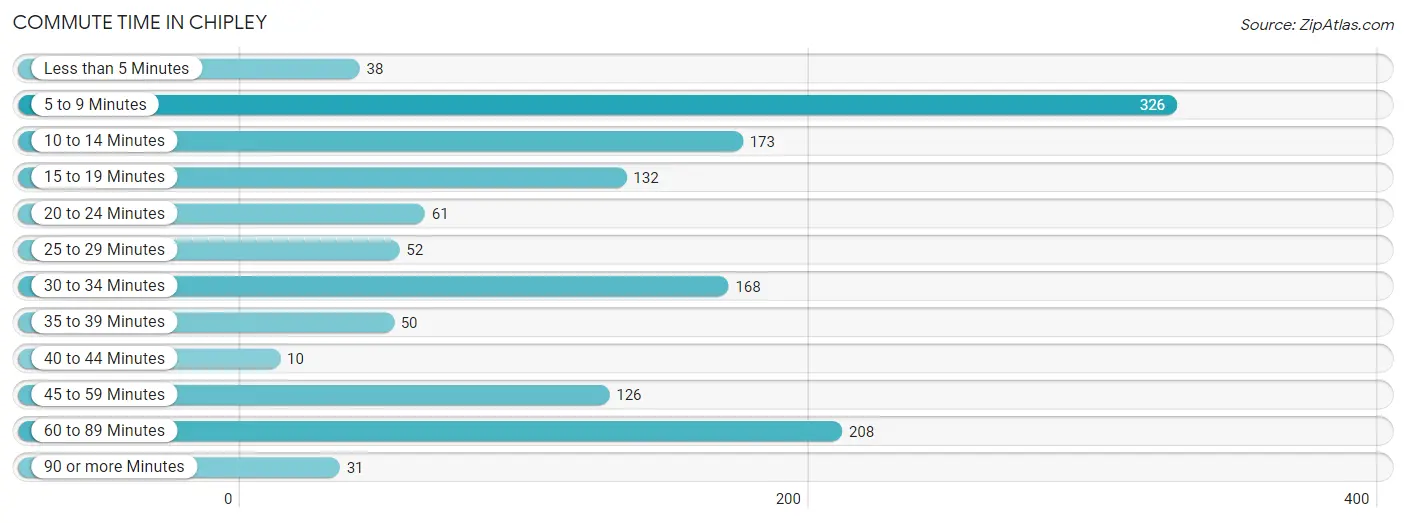
| Commute Time | # Commuters | % Commuters |
| Less than 5 Minutes | 38 | 2.8% |
| 5 to 9 Minutes | 326 | 23.7% |
| 10 to 14 Minutes | 173 | 12.6% |
| 15 to 19 Minutes | 132 | 9.6% |
| 20 to 24 Minutes | 61 | 4.4% |
| 25 to 29 Minutes | 52 | 3.8% |
| 30 to 34 Minutes | 168 | 12.2% |
| 35 to 39 Minutes | 50 | 3.6% |
| 40 to 44 Minutes | 10 | 0.7% |
| 45 to 59 Minutes | 126 | 9.2% |
| 60 to 89 Minutes | 208 | 15.1% |
| 90 or more Minutes | 31 | 2.2% |
Commute Time by Sex in Chipley
The most common commute times in Chipley are 5 to 9 minutes (158 commuters, 28.8%) for males and 5 to 9 minutes (168 commuters, 20.3%) for females.
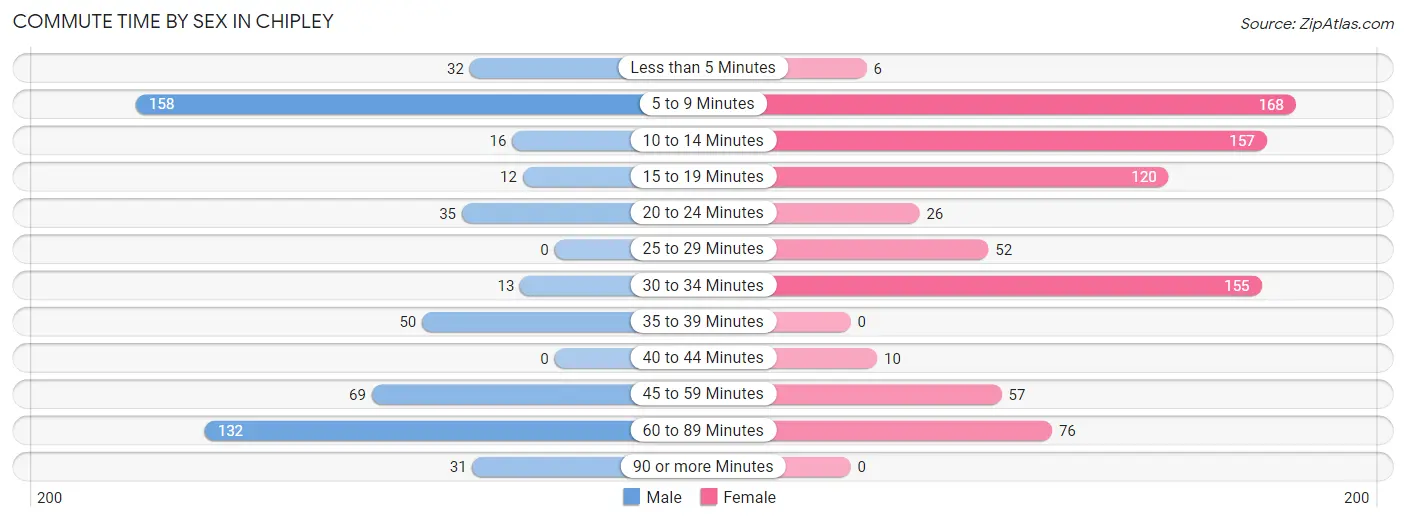
| Commute Time | Male | Female |
| Less than 5 Minutes | 32 (5.8%) | 6 (0.7%) |
| 5 to 9 Minutes | 158 (28.8%) | 168 (20.3%) |
| 10 to 14 Minutes | 16 (2.9%) | 157 (19.0%) |
| 15 to 19 Minutes | 12 (2.2%) | 120 (14.5%) |
| 20 to 24 Minutes | 35 (6.4%) | 26 (3.1%) |
| 25 to 29 Minutes | 0 (0.0%) | 52 (6.3%) |
| 30 to 34 Minutes | 13 (2.4%) | 155 (18.7%) |
| 35 to 39 Minutes | 50 (9.1%) | 0 (0.0%) |
| 40 to 44 Minutes | 0 (0.0%) | 10 (1.2%) |
| 45 to 59 Minutes | 69 (12.6%) | 57 (6.9%) |
| 60 to 89 Minutes | 132 (24.1%) | 76 (9.2%) |
| 90 or more Minutes | 31 (5.7%) | 0 (0.0%) |
Time of Departure to Work by Sex in Chipley
The most frequent times of departure to work in Chipley are 5:00 AM to 5:29 AM (115, 21.0%) for males and 6:30 AM to 6:59 AM (185, 22.4%) for females.
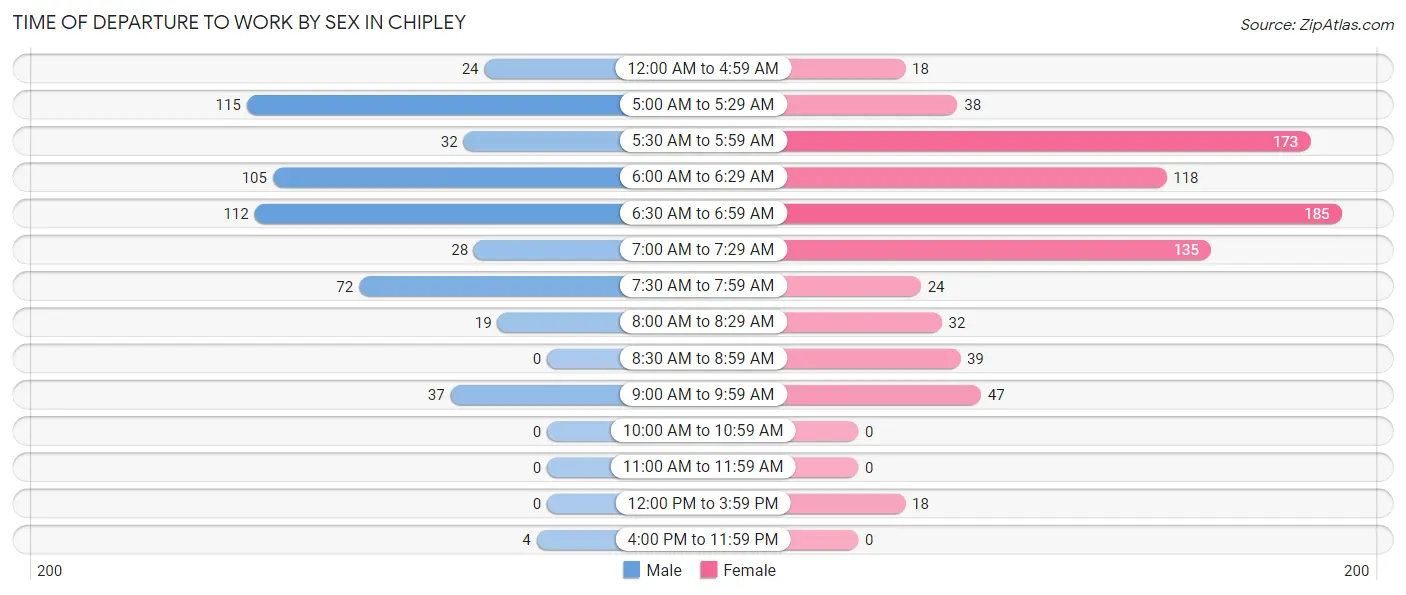
| Time of Departure | Male | Female |
| 12:00 AM to 4:59 AM | 24 (4.4%) | 18 (2.2%) |
| 5:00 AM to 5:29 AM | 115 (21.0%) | 38 (4.6%) |
| 5:30 AM to 5:59 AM | 32 (5.8%) | 173 (20.9%) |
| 6:00 AM to 6:29 AM | 105 (19.2%) | 118 (14.3%) |
| 6:30 AM to 6:59 AM | 112 (20.4%) | 185 (22.4%) |
| 7:00 AM to 7:29 AM | 28 (5.1%) | 135 (16.3%) |
| 7:30 AM to 7:59 AM | 72 (13.1%) | 24 (2.9%) |
| 8:00 AM to 8:29 AM | 19 (3.5%) | 32 (3.9%) |
| 8:30 AM to 8:59 AM | 0 (0.0%) | 39 (4.7%) |
| 9:00 AM to 9:59 AM | 37 (6.8%) | 47 (5.7%) |
| 10:00 AM to 10:59 AM | 0 (0.0%) | 0 (0.0%) |
| 11:00 AM to 11:59 AM | 0 (0.0%) | 0 (0.0%) |
| 12:00 PM to 3:59 PM | 0 (0.0%) | 18 (2.2%) |
| 4:00 PM to 11:59 PM | 4 (0.7%) | 0 (0.0%) |
| Total | 548 (100.0%) | 827 (100.0%) |
Housing Occupancy in Chipley
Occupancy by Ownership in Chipley
Of the total 1,375 dwellings in Chipley, owner-occupied units account for 863 (62.8%), while renter-occupied units make up 512 (37.2%).
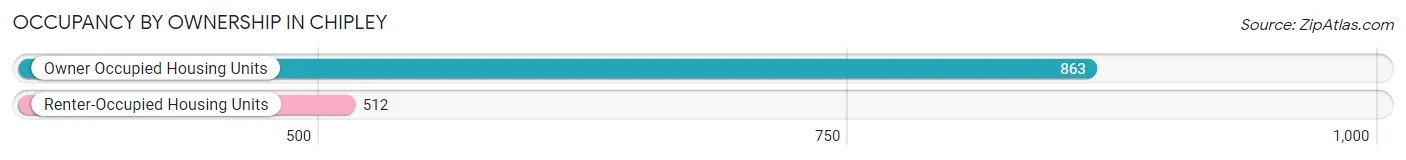
| Occupancy | # Housing Units | % Housing Units |
| Owner Occupied Housing Units | 863 | 62.8% |
| Renter-Occupied Housing Units | 512 | 37.2% |
| Total Occupied Housing Units | 1,375 | 100.0% |
Occupancy by Household Size in Chipley
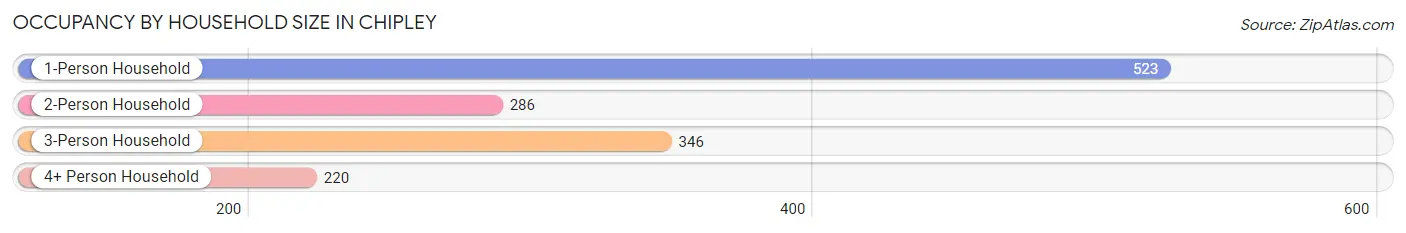
| Household Size | # Housing Units | % Housing Units |
| 1-Person Household | 523 | 38.0% |
| 2-Person Household | 286 | 20.8% |
| 3-Person Household | 346 | 25.2% |
| 4+ Person Household | 220 | 16.0% |
| Total Housing Units | 1,375 | 100.0% |
Occupancy by Ownership by Household Size in Chipley
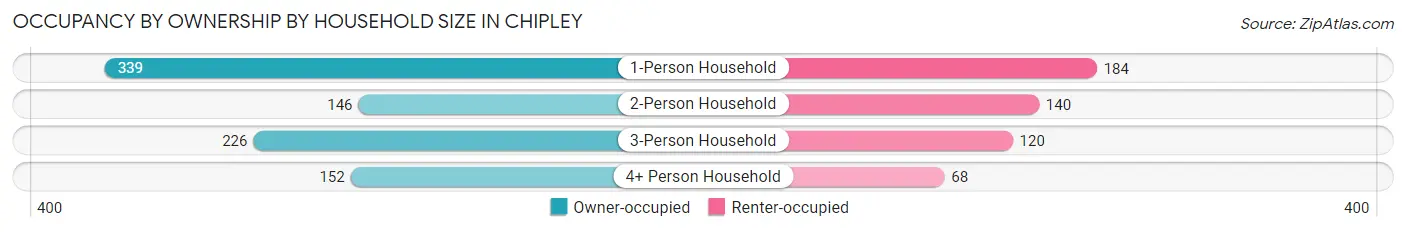
| Household Size | Owner-occupied | Renter-occupied |
| 1-Person Household | 339 (64.8%) | 184 (35.2%) |
| 2-Person Household | 146 (51.0%) | 140 (48.9%) |
| 3-Person Household | 226 (65.3%) | 120 (34.7%) |
| 4+ Person Household | 152 (69.1%) | 68 (30.9%) |
| Total Housing Units | 863 (62.8%) | 512 (37.2%) |
Occupancy by Educational Attainment in Chipley
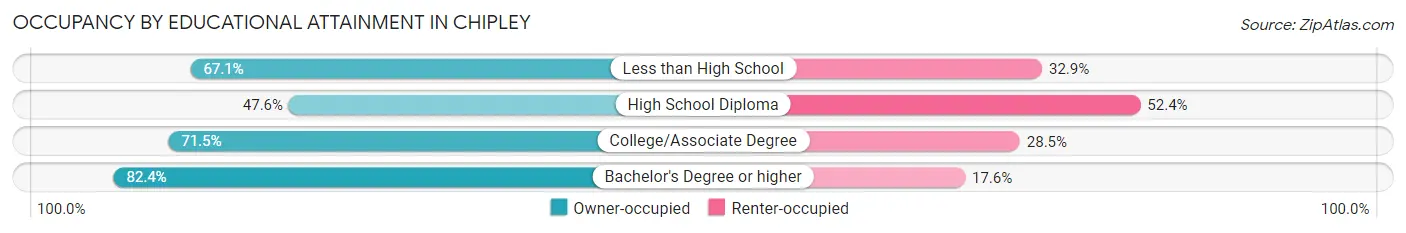
| Household Size | Owner-occupied | Renter-occupied |
| Less than High School | 151 (67.1%) | 74 (32.9%) |
| High School Diploma | 269 (47.6%) | 296 (52.4%) |
| College/Associate Degree | 256 (71.5%) | 102 (28.5%) |
| Bachelor's Degree or higher | 187 (82.4%) | 40 (17.6%) |
Occupancy by Age of Householder in Chipley
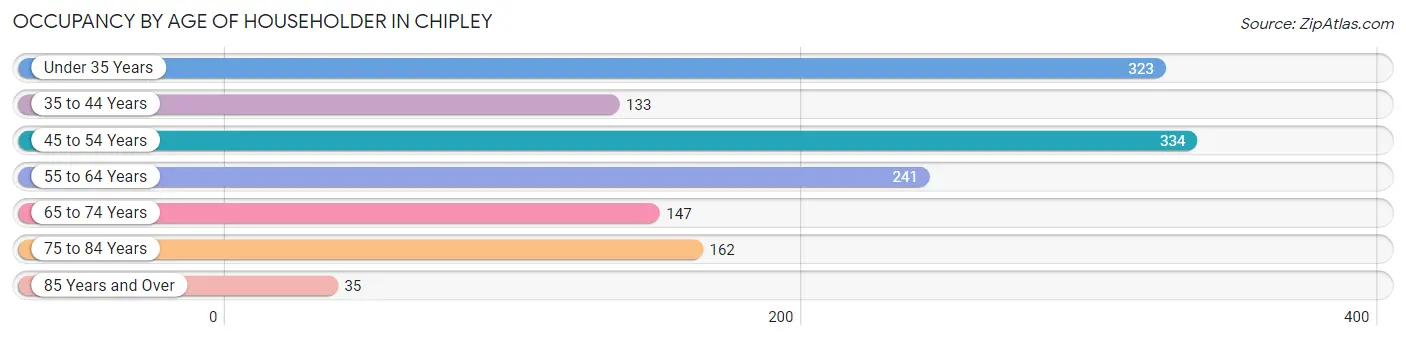
| Age Bracket | # Households | % Households |
| Under 35 Years | 323 | 23.5% |
| 35 to 44 Years | 133 | 9.7% |
| 45 to 54 Years | 334 | 24.3% |
| 55 to 64 Years | 241 | 17.5% |
| 65 to 74 Years | 147 | 10.7% |
| 75 to 84 Years | 162 | 11.8% |
| 85 Years and Over | 35 | 2.5% |
| Total | 1,375 | 100.0% |
Housing Finances in Chipley
Median Income by Occupancy in Chipley
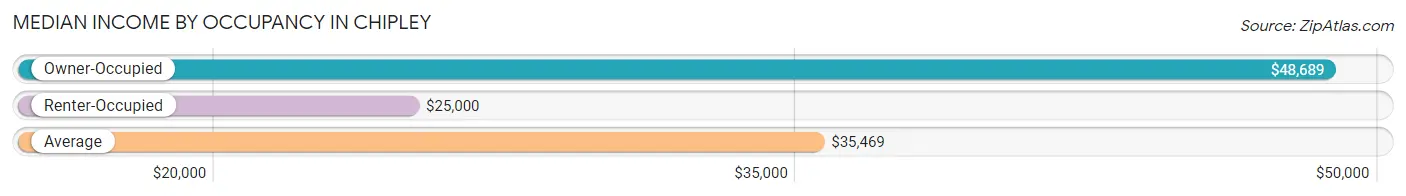
| Occupancy Type | # Households | Median Income |
| Owner-Occupied | 863 (62.8%) | $48,689 |
| Renter-Occupied | 512 (37.2%) | $25,000 |
| Average | 1,375 (100.0%) | $35,469 |
Occupancy by Householder Income Bracket in Chipley
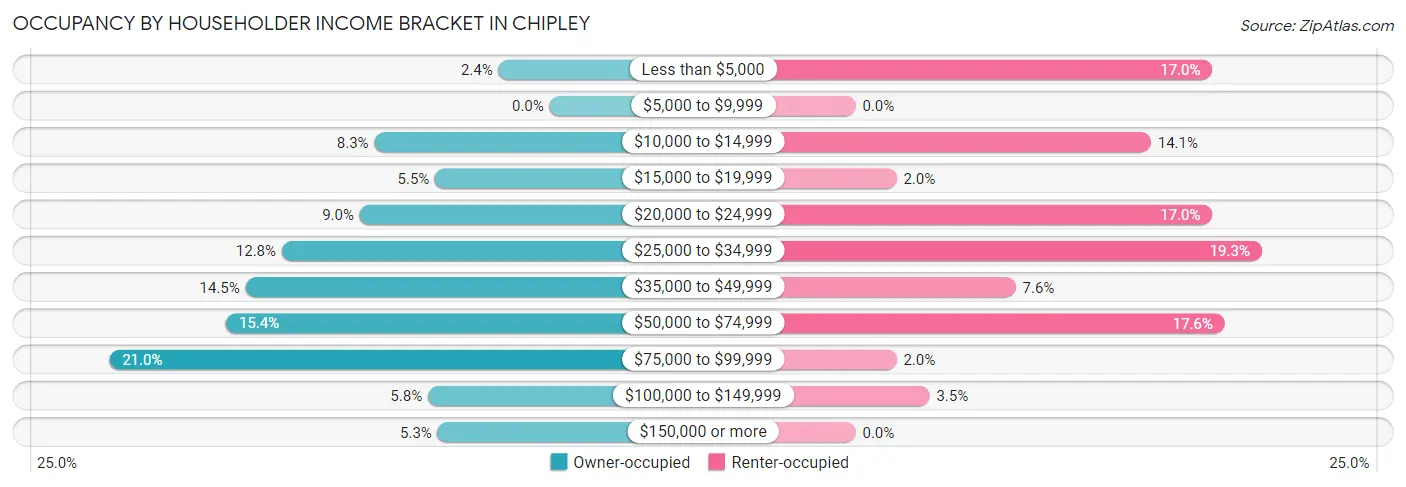
| Income Bracket | Owner-occupied | Renter-occupied |
| Less than $5,000 | 21 (2.4%) | 87 (17.0%) |
| $5,000 to $9,999 | 0 (0.0%) | 0 (0.0%) |
| $10,000 to $14,999 | 72 (8.3%) | 72 (14.1%) |
| $15,000 to $19,999 | 47 (5.4%) | 10 (1.9%) |
| $20,000 to $24,999 | 78 (9.0%) | 87 (17.0%) |
| $25,000 to $34,999 | 110 (12.8%) | 99 (19.3%) |
| $35,000 to $49,999 | 125 (14.5%) | 39 (7.6%) |
| $50,000 to $74,999 | 133 (15.4%) | 90 (17.6%) |
| $75,000 to $99,999 | 181 (21.0%) | 10 (1.9%) |
| $100,000 to $149,999 | 50 (5.8%) | 18 (3.5%) |
| $150,000 or more | 46 (5.3%) | 0 (0.0%) |
| Total | 863 (100.0%) | 512 (100.0%) |
Monthly Housing Cost Tiers in Chipley
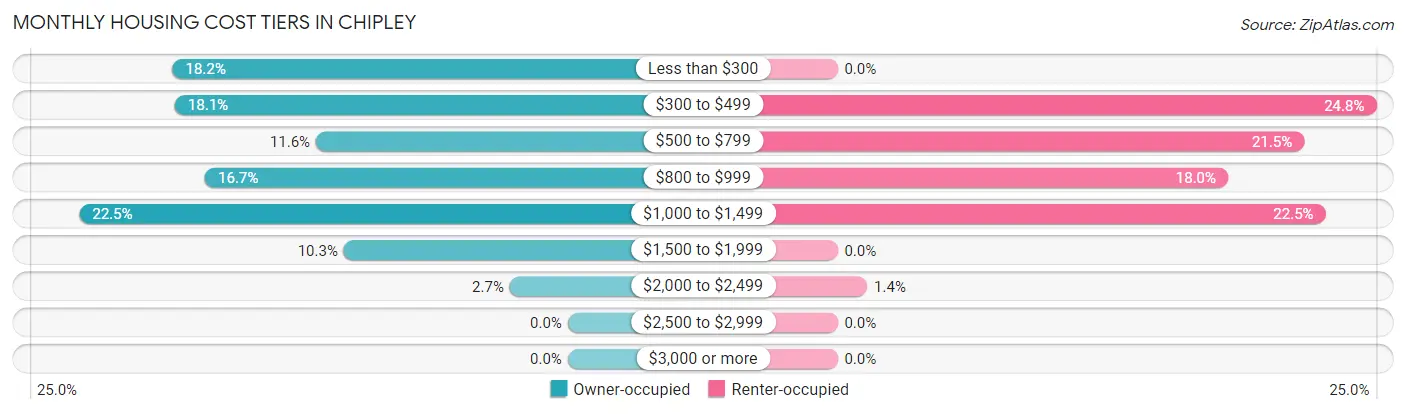
| Monthly Cost | Owner-occupied | Renter-occupied |
| Less than $300 | 157 (18.2%) | 0 (0.0%) |
| $300 to $499 | 156 (18.1%) | 127 (24.8%) |
| $500 to $799 | 100 (11.6%) | 110 (21.5%) |
| $800 to $999 | 144 (16.7%) | 92 (18.0%) |
| $1,000 to $1,499 | 194 (22.5%) | 115 (22.5%) |
| $1,500 to $1,999 | 89 (10.3%) | 0 (0.0%) |
| $2,000 to $2,499 | 23 (2.7%) | 7 (1.4%) |
| $2,500 to $2,999 | 0 (0.0%) | 0 (0.0%) |
| $3,000 or more | 0 (0.0%) | 0 (0.0%) |
| Total | 863 (100.0%) | 512 (100.0%) |
Physical Housing Characteristics in Chipley
Housing Structures in Chipley
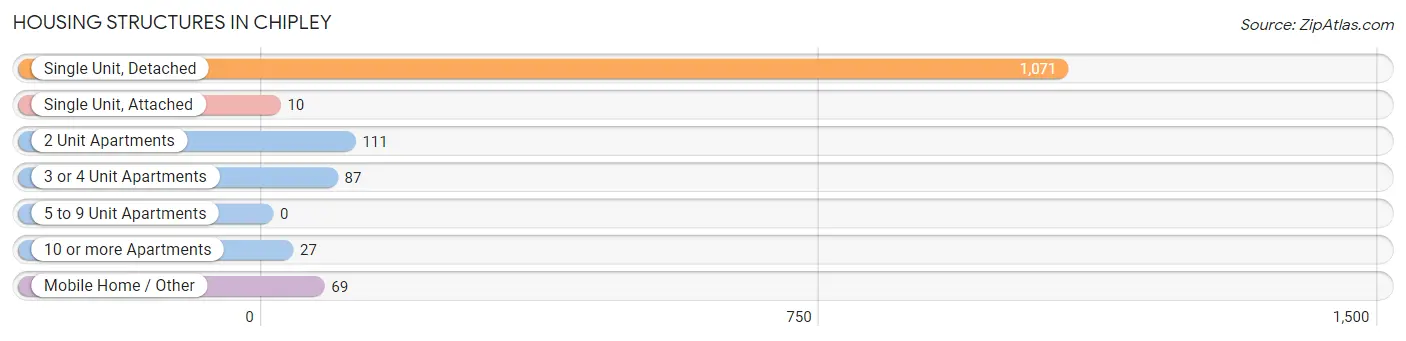
| Structure Type | # Housing Units | % Housing Units |
| Single Unit, Detached | 1,071 | 77.9% |
| Single Unit, Attached | 10 | 0.7% |
| 2 Unit Apartments | 111 | 8.1% |
| 3 or 4 Unit Apartments | 87 | 6.3% |
| 5 to 9 Unit Apartments | 0 | 0.0% |
| 10 or more Apartments | 27 | 2.0% |
| Mobile Home / Other | 69 | 5.0% |
| Total | 1,375 | 100.0% |
Housing Structures by Occupancy in Chipley
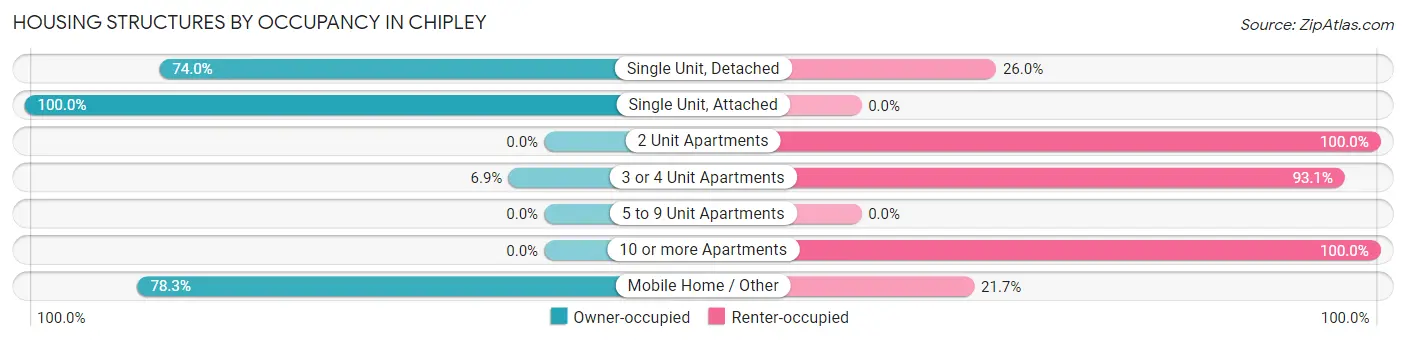
| Structure Type | Owner-occupied | Renter-occupied |
| Single Unit, Detached | 793 (74.0%) | 278 (26.0%) |
| Single Unit, Attached | 10 (100.0%) | 0 (0.0%) |
| 2 Unit Apartments | 0 (0.0%) | 111 (100.0%) |
| 3 or 4 Unit Apartments | 6 (6.9%) | 81 (93.1%) |
| 5 to 9 Unit Apartments | 0 (0.0%) | 0 (0.0%) |
| 10 or more Apartments | 0 (0.0%) | 27 (100.0%) |
| Mobile Home / Other | 54 (78.3%) | 15 (21.7%) |
| Total | 863 (62.8%) | 512 (37.2%) |
Housing Structures by Number of Rooms in Chipley
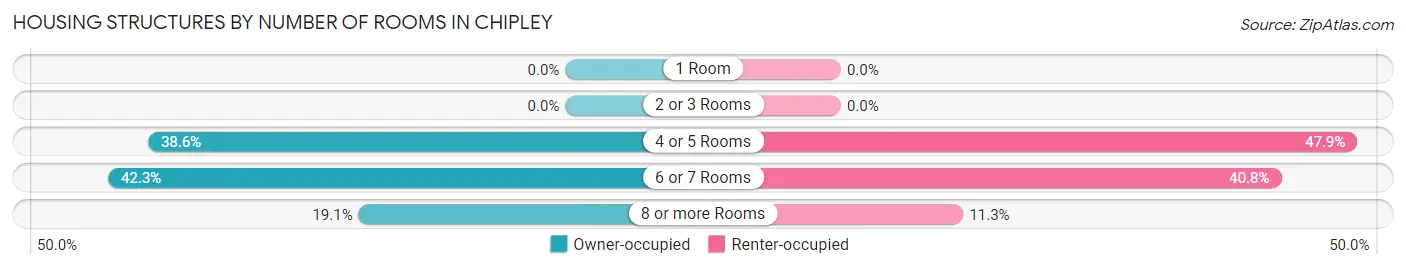
| Number of Rooms | Owner-occupied | Renter-occupied |
| 1 Room | 0 (0.0%) | 0 (0.0%) |
| 2 or 3 Rooms | 0 (0.0%) | 0 (0.0%) |
| 4 or 5 Rooms | 333 (38.6%) | 245 (47.8%) |
| 6 or 7 Rooms | 365 (42.3%) | 209 (40.8%) |
| 8 or more Rooms | 165 (19.1%) | 58 (11.3%) |
| Total | 863 (100.0%) | 512 (100.0%) |
Housing Structure by Heating Type in Chipley
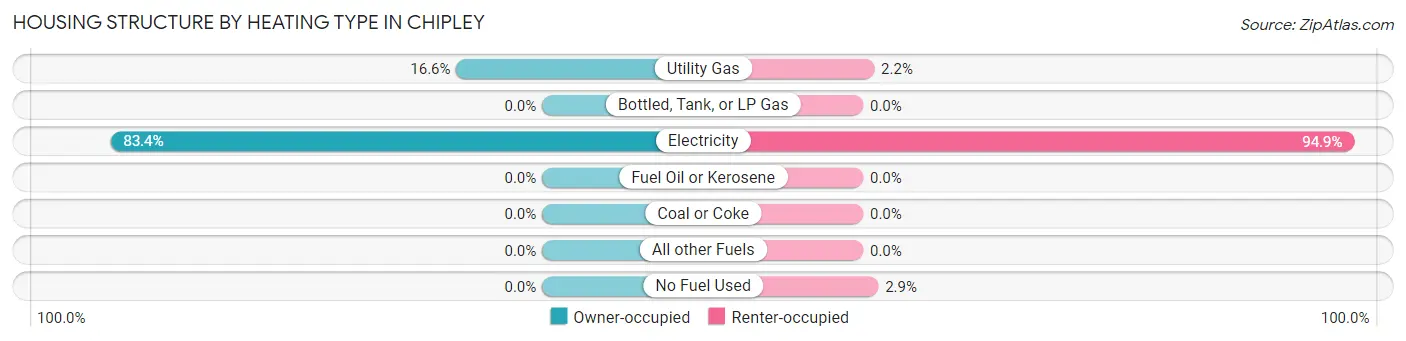
| Heating Type | Owner-occupied | Renter-occupied |
| Utility Gas | 143 (16.6%) | 11 (2.1%) |
| Bottled, Tank, or LP Gas | 0 (0.0%) | 0 (0.0%) |
| Electricity | 720 (83.4%) | 486 (94.9%) |
| Fuel Oil or Kerosene | 0 (0.0%) | 0 (0.0%) |
| Coal or Coke | 0 (0.0%) | 0 (0.0%) |
| All other Fuels | 0 (0.0%) | 0 (0.0%) |
| No Fuel Used | 0 (0.0%) | 15 (2.9%) |
| Total | 863 (100.0%) | 512 (100.0%) |
Household Vehicle Usage in Chipley
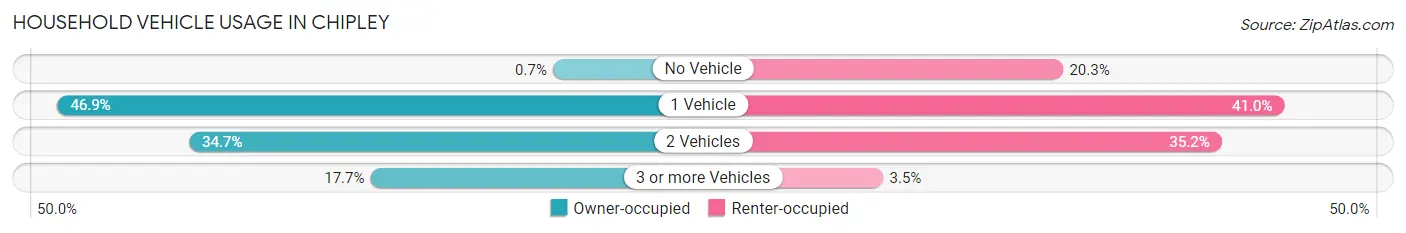
| Vehicles per Household | Owner-occupied | Renter-occupied |
| No Vehicle | 6 (0.7%) | 104 (20.3%) |
| 1 Vehicle | 405 (46.9%) | 210 (41.0%) |
| 2 Vehicles | 299 (34.6%) | 180 (35.2%) |
| 3 or more Vehicles | 153 (17.7%) | 18 (3.5%) |
| Total | 863 (100.0%) | 512 (100.0%) |
Real Estate & Mortgages in Chipley
Real Estate and Mortgage Overview in Chipley
| Characteristic | Without Mortgage | With Mortgage |
| Housing Units | 436 | 427 |
| Median Property Value | $83,500 | $132,600 |
| Median Household Income | $31,050 | $40 |
| Monthly Housing Costs | $361 | $0 |
| Real Estate Taxes | $751 | $20 |
Property Value by Mortgage Status in Chipley
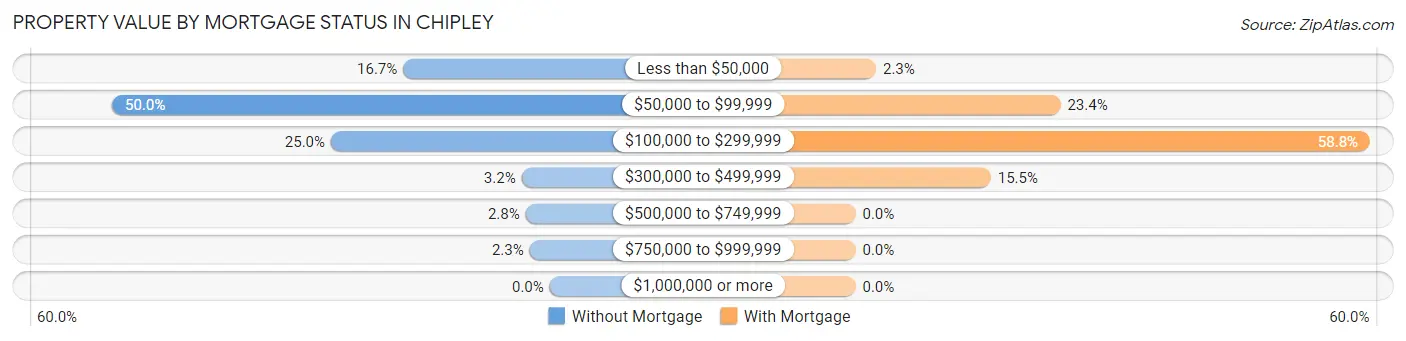
| Property Value | Without Mortgage | With Mortgage |
| Less than $50,000 | 73 (16.7%) | 10 (2.3%) |
| $50,000 to $99,999 | 218 (50.0%) | 100 (23.4%) |
| $100,000 to $299,999 | 109 (25.0%) | 251 (58.8%) |
| $300,000 to $499,999 | 14 (3.2%) | 66 (15.5%) |
| $500,000 to $749,999 | 12 (2.8%) | 0 (0.0%) |
| $750,000 to $999,999 | 10 (2.3%) | 0 (0.0%) |
| $1,000,000 or more | 0 (0.0%) | 0 (0.0%) |
| Total | 436 (100.0%) | 427 (100.0%) |
Household Income by Mortgage Status in Chipley
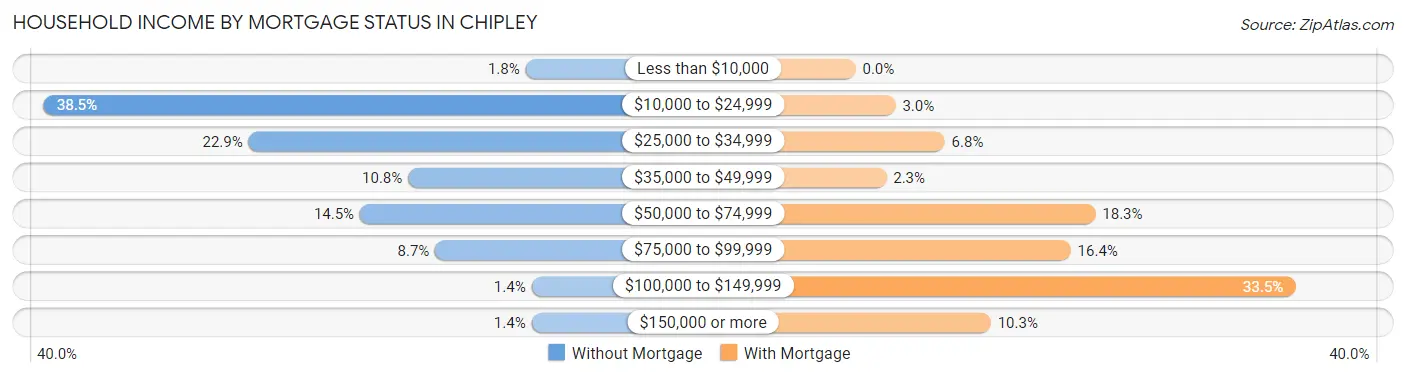
| Household Income | Without Mortgage | With Mortgage |
| Less than $10,000 | 8 (1.8%) | 0 (0.0%) |
| $10,000 to $24,999 | 168 (38.5%) | 13 (3.0%) |
| $25,000 to $34,999 | 100 (22.9%) | 29 (6.8%) |
| $35,000 to $49,999 | 47 (10.8%) | 10 (2.3%) |
| $50,000 to $74,999 | 63 (14.4%) | 78 (18.3%) |
| $75,000 to $99,999 | 38 (8.7%) | 70 (16.4%) |
| $100,000 to $149,999 | 6 (1.4%) | 143 (33.5%) |
| $150,000 or more | 6 (1.4%) | 44 (10.3%) |
| Total | 436 (100.0%) | 427 (100.0%) |
Property Value to Household Income Ratio in Chipley
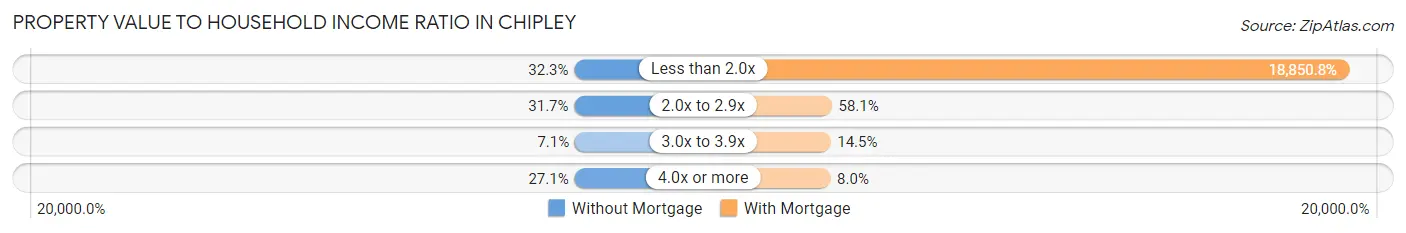
| Value-to-Income Ratio | Without Mortgage | With Mortgage |
| Less than 2.0x | 141 (32.3%) | 80,493 (18,850.8%) |
| 2.0x to 2.9x | 138 (31.7%) | 248 (58.1%) |
| 3.0x to 3.9x | 31 (7.1%) | 62 (14.5%) |
| 4.0x or more | 118 (27.1%) | 34 (8.0%) |
| Total | 436 (100.0%) | 427 (100.0%) |
Real Estate Taxes by Mortgage Status in Chipley
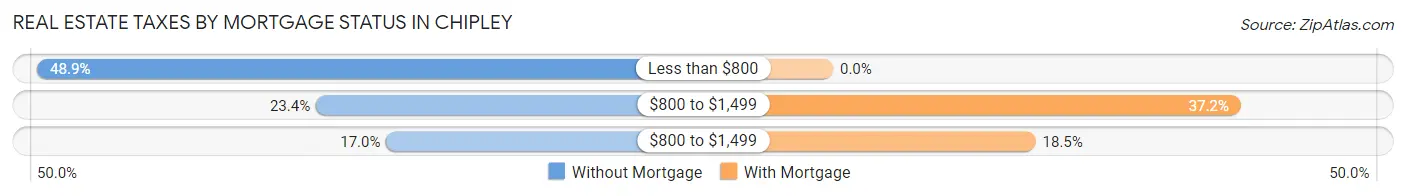
| Property Taxes | Without Mortgage | With Mortgage |
| Less than $800 | 213 (48.8%) | 0 (0.0%) |
| $800 to $1,499 | 102 (23.4%) | 159 (37.2%) |
| $800 to $1,499 | 74 (17.0%) | 79 (18.5%) |
| Total | 436 (100.0%) | 427 (100.0%) |
Health & Disability in Chipley
Health Insurance Coverage by Age in Chipley
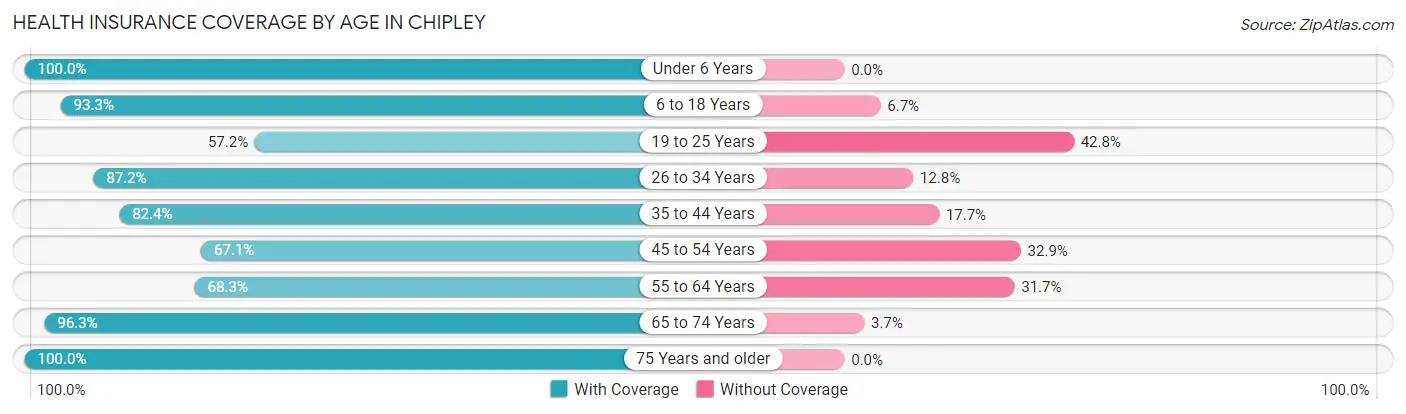
| Age Bracket | With Coverage | Without Coverage |
| Under 6 Years | 264 (100.0%) | 0 (0.0%) |
| 6 to 18 Years | 639 (93.3%) | 46 (6.7%) |
| 19 to 25 Years | 218 (57.2%) | 163 (42.8%) |
| 26 to 34 Years | 456 (87.2%) | 67 (12.8%) |
| 35 to 44 Years | 196 (82.4%) | 42 (17.6%) |
| 45 to 54 Years | 406 (67.1%) | 199 (32.9%) |
| 55 to 64 Years | 237 (68.3%) | 110 (31.7%) |
| 65 to 74 Years | 183 (96.3%) | 7 (3.7%) |
| 75 Years and older | 246 (100.0%) | 0 (0.0%) |
| Total | 2,845 (81.8%) | 634 (18.2%) |
Health Insurance Coverage by Citizenship Status in Chipley
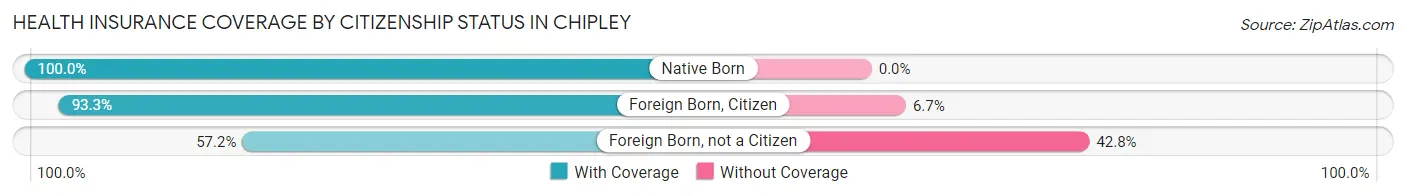
| Citizenship Status | With Coverage | Without Coverage |
| Native Born | 264 (100.0%) | 0 (0.0%) |
| Foreign Born, Citizen | 639 (93.3%) | 46 (6.7%) |
| Foreign Born, not a Citizen | 218 (57.2%) | 163 (42.8%) |
Health Insurance Coverage by Household Income in Chipley
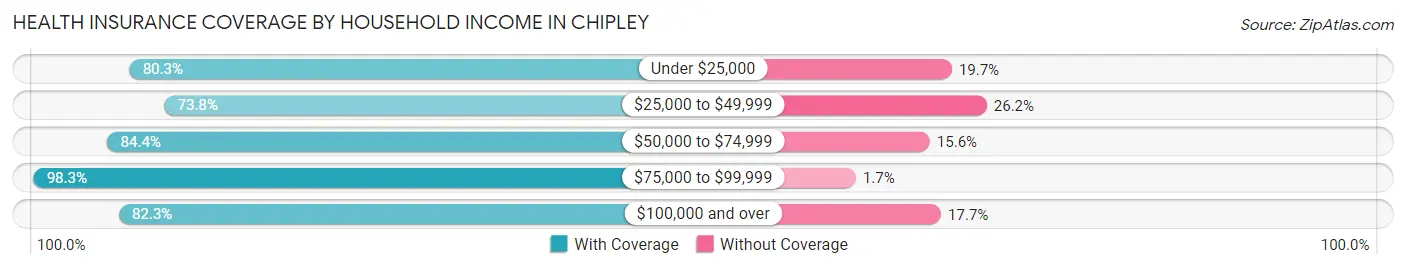
| Household Income | With Coverage | Without Coverage |
| Under $25,000 | 738 (80.3%) | 181 (19.7%) |
| $25,000 to $49,999 | 846 (73.8%) | 301 (26.2%) |
| $50,000 to $74,999 | 396 (84.4%) | 73 (15.6%) |
| $75,000 to $99,999 | 573 (98.3%) | 10 (1.7%) |
| $100,000 and over | 284 (82.3%) | 61 (17.7%) |
Public vs Private Health Insurance Coverage by Age in Chipley
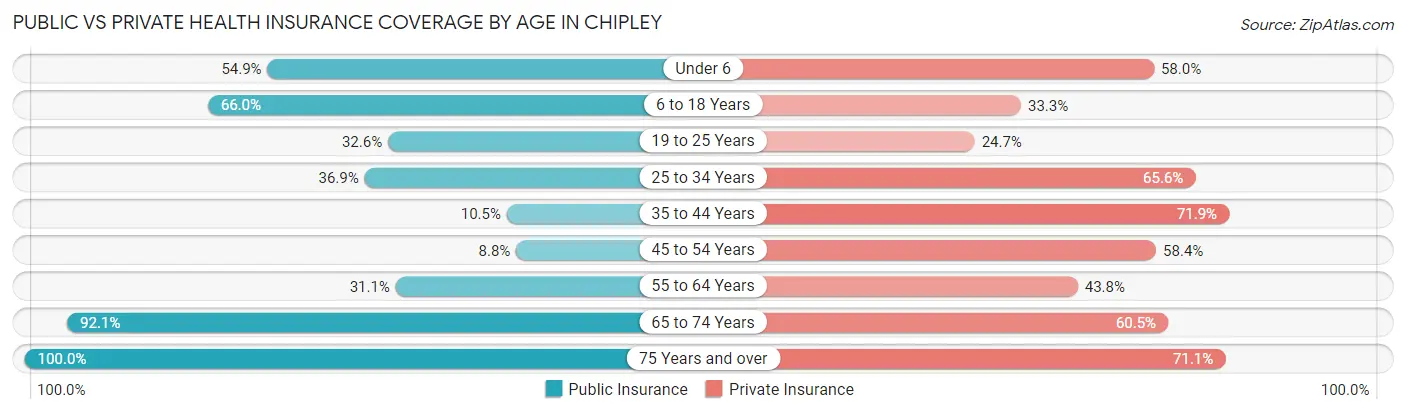
| Age Bracket | Public Insurance | Private Insurance |
| Under 6 | 145 (54.9%) | 153 (58.0%) |
| 6 to 18 Years | 452 (66.0%) | 228 (33.3%) |
| 19 to 25 Years | 124 (32.6%) | 94 (24.7%) |
| 25 to 34 Years | 193 (36.9%) | 343 (65.6%) |
| 35 to 44 Years | 25 (10.5%) | 171 (71.9%) |
| 45 to 54 Years | 53 (8.8%) | 353 (58.4%) |
| 55 to 64 Years | 108 (31.1%) | 152 (43.8%) |
| 65 to 74 Years | 175 (92.1%) | 115 (60.5%) |
| 75 Years and over | 246 (100.0%) | 175 (71.1%) |
| Total | 1,521 (43.7%) | 1,784 (51.3%) |
Disability Status by Sex by Age in Chipley
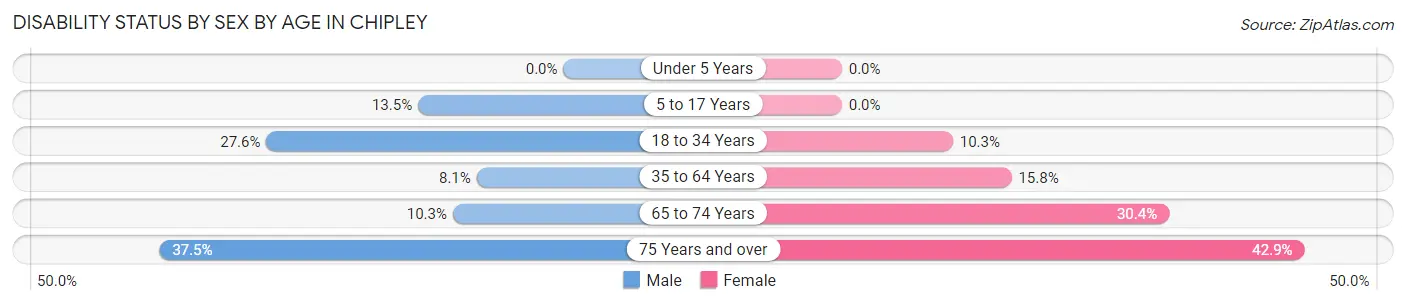
| Age Bracket | Male | Female |
| Under 5 Years | 0 (0.0%) | 0 (0.0%) |
| 5 to 17 Years | 63 (13.5%) | 0 (0.0%) |
| 18 to 34 Years | 110 (27.6%) | 52 (10.3%) |
| 35 to 64 Years | 36 (8.1%) | 117 (15.8%) |
| 65 to 74 Years | 8 (10.3%) | 34 (30.4%) |
| 75 Years and over | 18 (37.5%) | 85 (42.9%) |
Disability Class by Sex by Age in Chipley
Disability Class: Hearing Difficulty
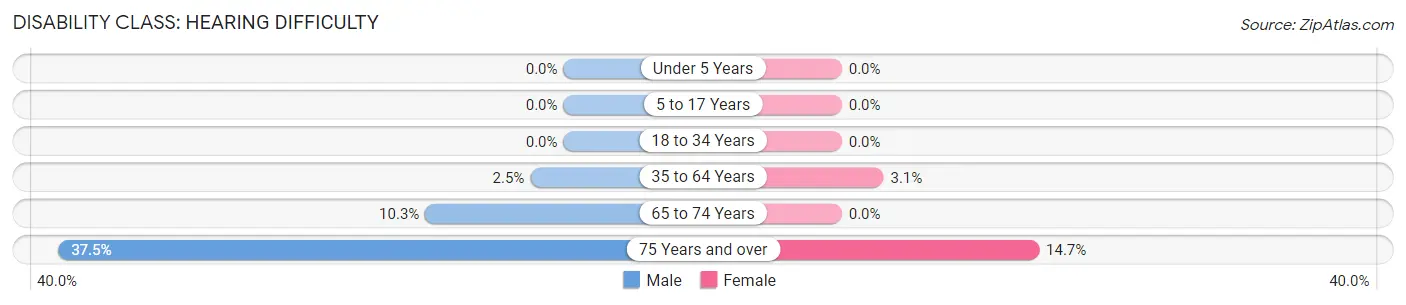
| Age Bracket | Male | Female |
| Under 5 Years | 0 (0.0%) | 0 (0.0%) |
| 5 to 17 Years | 0 (0.0%) | 0 (0.0%) |
| 18 to 34 Years | 0 (0.0%) | 0 (0.0%) |
| 35 to 64 Years | 11 (2.5%) | 23 (3.1%) |
| 65 to 74 Years | 8 (10.3%) | 0 (0.0%) |
| 75 Years and over | 18 (37.5%) | 29 (14.6%) |
Disability Class: Vision Difficulty
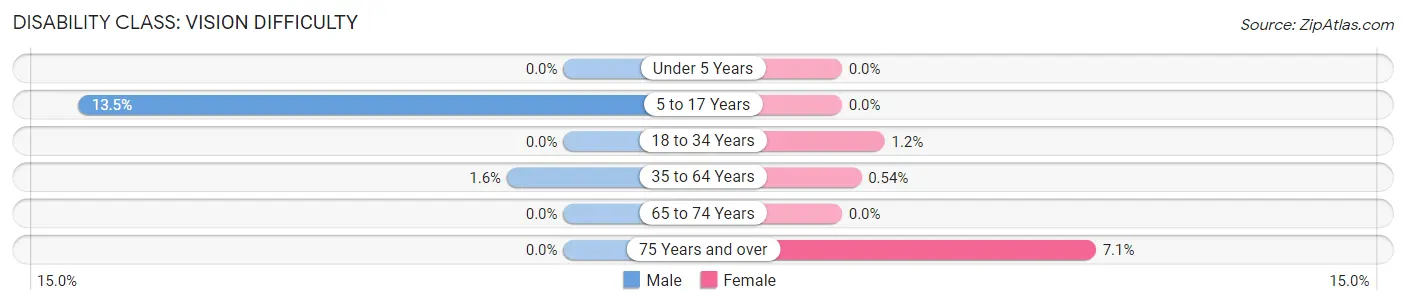
| Age Bracket | Male | Female |
| Under 5 Years | 0 (0.0%) | 0 (0.0%) |
| 5 to 17 Years | 63 (13.5%) | 0 (0.0%) |
| 18 to 34 Years | 0 (0.0%) | 6 (1.2%) |
| 35 to 64 Years | 7 (1.6%) | 4 (0.5%) |
| 65 to 74 Years | 0 (0.0%) | 0 (0.0%) |
| 75 Years and over | 0 (0.0%) | 14 (7.1%) |
Disability Class: Cognitive Difficulty
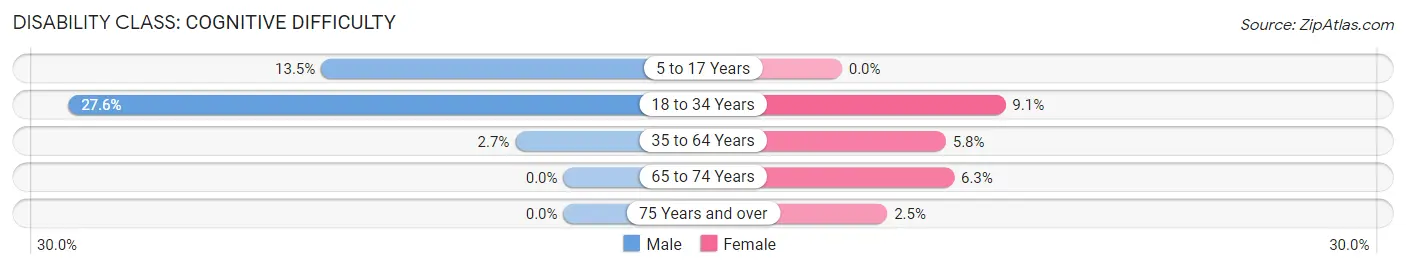
| Age Bracket | Male | Female |
| 5 to 17 Years | 63 (13.5%) | 0 (0.0%) |
| 18 to 34 Years | 110 (27.6%) | 46 (9.1%) |
| 35 to 64 Years | 12 (2.7%) | 43 (5.8%) |
| 65 to 74 Years | 0 (0.0%) | 7 (6.2%) |
| 75 Years and over | 0 (0.0%) | 5 (2.5%) |
Disability Class: Ambulatory Difficulty
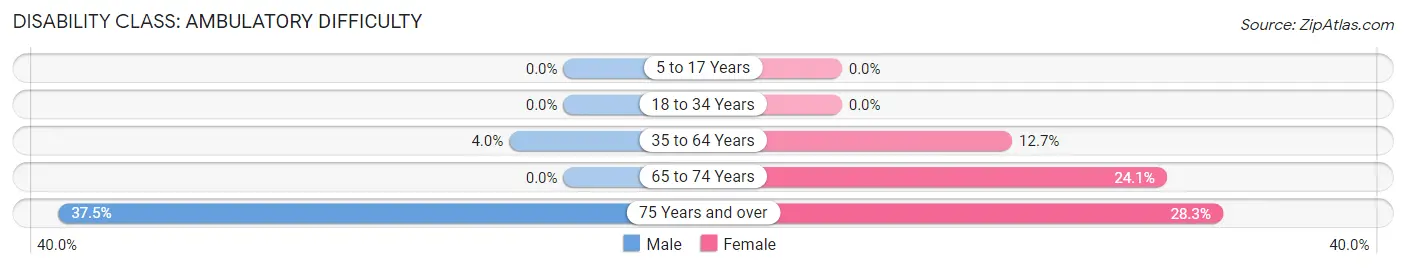
| Age Bracket | Male | Female |
| 5 to 17 Years | 0 (0.0%) | 0 (0.0%) |
| 18 to 34 Years | 0 (0.0%) | 0 (0.0%) |
| 35 to 64 Years | 18 (4.0%) | 94 (12.7%) |
| 65 to 74 Years | 0 (0.0%) | 27 (24.1%) |
| 75 Years and over | 18 (37.5%) | 56 (28.3%) |
Disability Class: Self-Care Difficulty
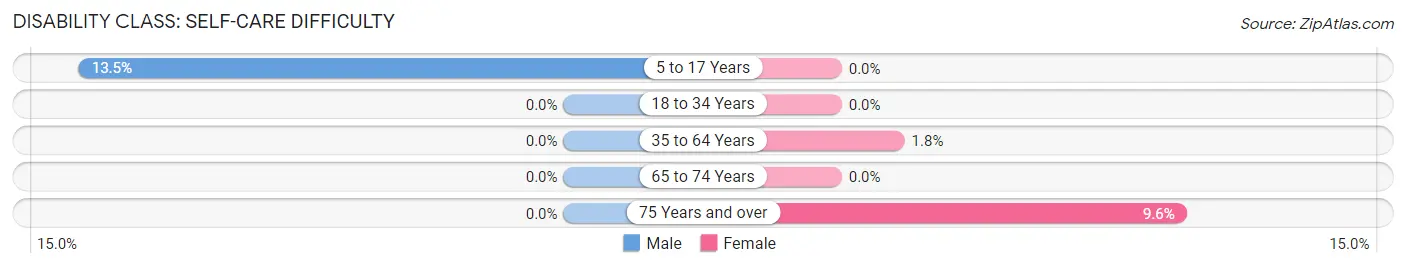
| Age Bracket | Male | Female |
| 5 to 17 Years | 63 (13.5%) | 0 (0.0%) |
| 18 to 34 Years | 0 (0.0%) | 0 (0.0%) |
| 35 to 64 Years | 0 (0.0%) | 13 (1.8%) |
| 65 to 74 Years | 0 (0.0%) | 0 (0.0%) |
| 75 Years and over | 0 (0.0%) | 19 (9.6%) |
Technology Access in Chipley
Computing Device Access in Chipley
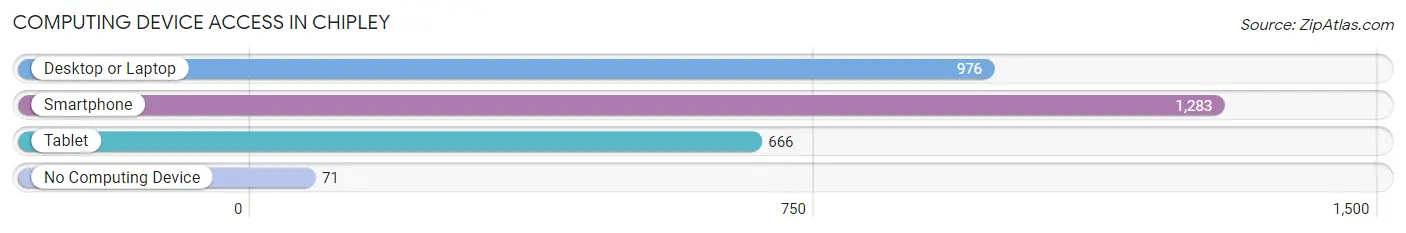
| Device Type | # Households | % Households |
| Desktop or Laptop | 976 | 71.0% |
| Smartphone | 1,283 | 93.3% |
| Tablet | 666 | 48.4% |
| No Computing Device | 71 | 5.2% |
| Total | 1,375 | 100.0% |
Internet Access in Chipley
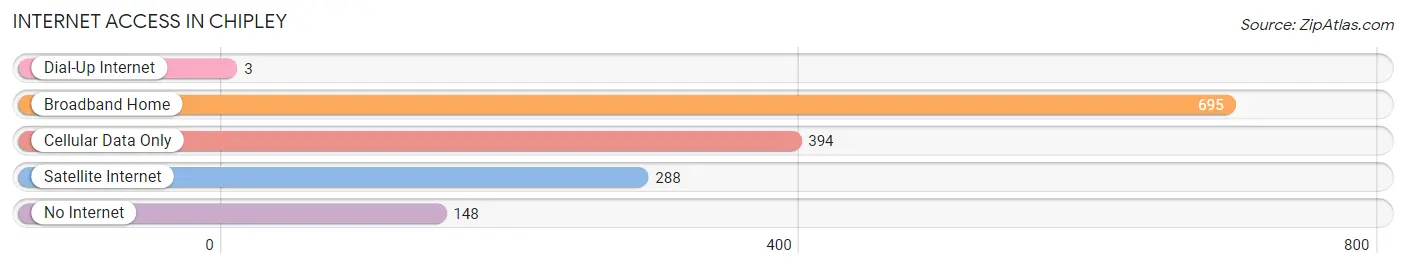
| Internet Type | # Households | % Households |
| Dial-Up Internet | 3 | 0.2% |
| Broadband Home | 695 | 50.5% |
| Cellular Data Only | 394 | 28.6% |
| Satellite Internet | 288 | 20.9% |
| No Internet | 148 | 10.8% |
| Total | 1,375 | 100.0% |
Chipley Summary
History
The city of Chipley, Florida is located in the panhandle of the state, in Washington County. It is the county seat of Washington County and is located about 30 miles northwest of Panama City. The city was founded in 1882 by railroad magnate, William Dudley Chipley. He was the president of the Pensacola and Atlantic Railroad and was instrumental in the development of the city.
The city was originally named Orange Hill, but was later changed to Chipley in honor of its founder. The city was incorporated in 1885 and was the first city in Washington County to be incorporated.
Chipley was a major center of the turpentine industry in the late 19th and early 20th centuries. The city was also a major center of the lumber industry, with several sawmills located in the area.
The city was also home to a large number of African-American residents, many of whom were employed in the turpentine and lumber industries. The city was also home to a large number of churches, many of which were African-American churches.
Geography
Chipley is located in the panhandle of Florida, in Washington County. It is located about 30 miles northwest of Panama City. The city is situated on the banks of the Chipola River, which flows through the city. The city is located in a flat, low-lying area, with an elevation of just over 100 feet.
The city has a total area of 4.2 square miles, all of which is land. The city is located in a humid subtropical climate zone, with hot, humid summers and mild winters. The average annual temperature is around 70 degrees Fahrenheit.
Economy
The economy of Chipley is largely based on agriculture and manufacturing. The city is home to several large agricultural operations, including poultry farms, cattle ranches, and vegetable farms. The city is also home to several manufacturing companies, including a paper mill, a furniture factory, and a plastics factory.
The city is also home to several retail stores, restaurants, and other businesses. The city is also home to a number of government offices, including the Washington County Courthouse.
Demographics
As of the 2010 census, the population of Chipley was 3,605. The population is largely white, with African-Americans making up about 20% of the population. The median household income is around $30,000, and the median home value is around $90,000. The city has a poverty rate of around 20%.
The city is served by the Washington County School District, which includes four elementary schools, one middle school, and one high school. The city is also home to a number of private schools, including a Catholic school and a Baptist school.
Conclusion
Chipley, Florida is a small city located in the panhandle of the state, in Washington County. The city was founded in 1882 by railroad magnate William Dudley Chipley and was originally named Orange Hill. The city is largely agricultural and manufacturing based, with several large agricultural operations and manufacturing companies located in the city. The population of Chipley is largely white, with African-Americans making up about 20% of the population. The city is served by the Washington County School District and is home to several private schools.
Common Questions
What is Per Capita Income in Chipley?
Per Capita income in Chipley is $20,558.
What is the Median Family Income in Chipley?
Median Family Income in Chipley is $48,750.
What is the Median Household income in Chipley?
Median Household Income in Chipley is $35,469.
What is Income or Wage Gap in Chipley?
Income or Wage Gap in Chipley is 16.5%.
Women in Chipley earn 83.5 cents for every dollar earned by a man.
What is Family Income Deficit in Chipley?
Family Income Deficit in Chipley is $8,530.
Families that are below poverty line in Chipley earn $8,530 less on average than the poverty threshold level.
What is Inequality or Gini Index in Chipley?
Inequality or Gini Index in Chipley is 0.46.
What is the Total Population of Chipley?
Total Population of Chipley is 3,644.
What is the Total Male Population of Chipley?
Total Male Population of Chipley is 1,628.
What is the Total Female Population of Chipley?
Total Female Population of Chipley is 2,016.
What is the Ratio of Males per 100 Females in Chipley?
There are 80.75 Males per 100 Females in Chipley.
What is the Ratio of Females per 100 Males in Chipley?
There are 123.83 Females per 100 Males in Chipley.
What is the Median Population Age in Chipley?
Median Population Age in Chipley is 32.9 Years.
What is the Average Family Size in Chipley
Average Family Size in Chipley is 3.4 People.
What is the Average Household Size in Chipley
Average Household Size in Chipley is 2.5 People.
How Large is the Labor Force in Chipley?
There are 1,538 People in the Labor Forcein in Chipley.
What is the Percentage of People in the Labor Force in Chipley?
56.8% of People are in the Labor Force in Chipley.
What is the Unemployment Rate in Chipley?
Unemployment Rate in Chipley is 9.9%.