Flint Hill, VA Map & Demographics
Flint Hill Map
Flint Hill Overview
$24,976
PER CAPITA INCOME
0.34
INEQUALITY / GINI INDEX
319
TOTAL POPULATION
174
MALE POPULATION
145
FEMALE POPULATION
120.00
MALES / 100 FEMALES
83.33
FEMALES / 100 MALES
28.0
MEDIAN AGE
4.7
AVG FAMILY SIZE
4.5
AVG HOUSEHOLD SIZE
45
LABOR FORCE [ PEOPLE ]
25.0%
PERCENT IN LABOR FORCE
Flint Hill Zip Codes
Flint Hill Area Codes
Income in Flint Hill
Income Overview in Flint Hill
| Characteristic | Number | Measure |
| Per Capita Income | 319 | $24,976 |
| Median Family Income | 67 | $0 |
| Mean Family Income | 67 | $104,301 |
| Median Household Income | 71 | $0 |
| Mean Household Income | 71 | $102,427 |
| Income Deficit | 67 | $0 |
| Wage / Income Gap (%) | 319 | 0.00% |
| Wage / Income Gap ($) | 319 | 100.00¢ per $1 |
| Gini / Inequality Index | 319 | 0.34 |
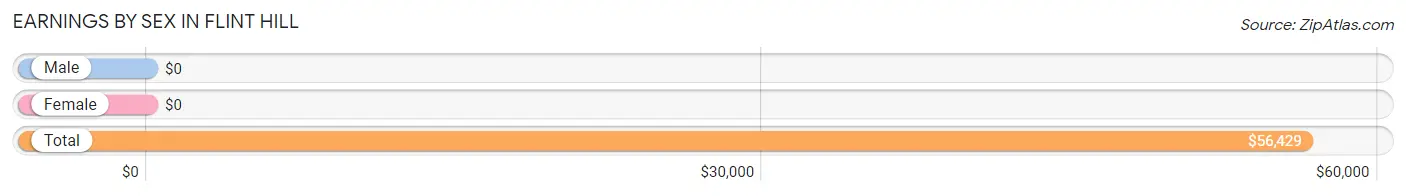
Earnings by Sex in Flint Hill
| Sex | Number | Average Earnings |
| Male | 45 (86.5%) | $0 |
| Female | 7 (13.5%) | $0 |
| Total | 52 (100.0%) | $56,429 |
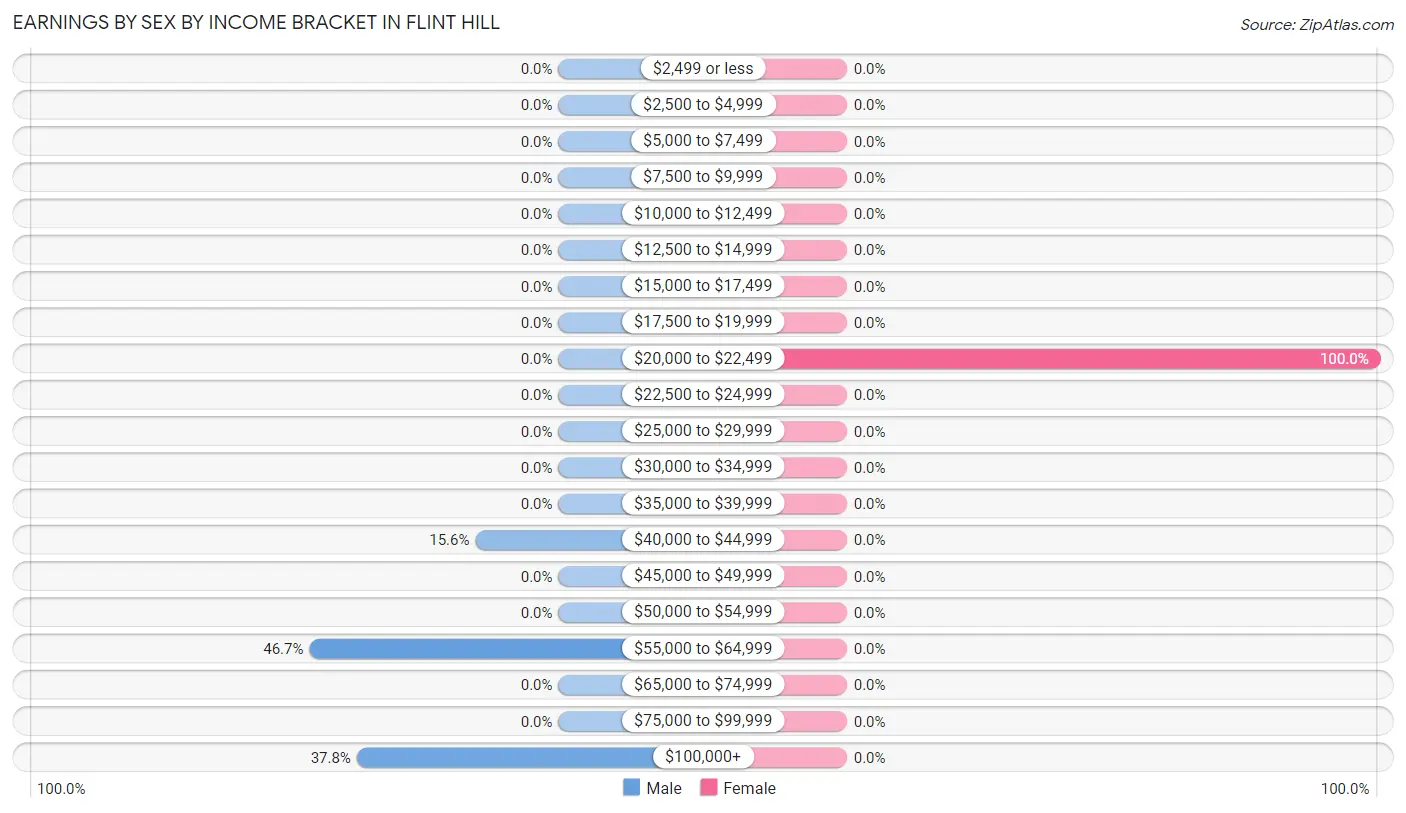
Earnings by Sex by Income Bracket in Flint Hill
The most common earnings brackets in Flint Hill are $55,000 to $64,999 for men (21 | 46.7%) and $20,000 to $22,499 for women (7 | 100.0%).
| Income | Male | Female |
| $2,499 or less | 0 (0.0%) | 0 (0.0%) |
| $2,500 to $4,999 | 0 (0.0%) | 0 (0.0%) |
| $5,000 to $7,499 | 0 (0.0%) | 0 (0.0%) |
| $7,500 to $9,999 | 0 (0.0%) | 0 (0.0%) |
| $10,000 to $12,499 | 0 (0.0%) | 0 (0.0%) |
| $12,500 to $14,999 | 0 (0.0%) | 0 (0.0%) |
| $15,000 to $17,499 | 0 (0.0%) | 0 (0.0%) |
| $17,500 to $19,999 | 0 (0.0%) | 0 (0.0%) |
| $20,000 to $22,499 | 0 (0.0%) | 7 (100.0%) |
| $22,500 to $24,999 | 0 (0.0%) | 0 (0.0%) |
| $25,000 to $29,999 | 0 (0.0%) | 0 (0.0%) |
| $30,000 to $34,999 | 0 (0.0%) | 0 (0.0%) |
| $35,000 to $39,999 | 0 (0.0%) | 0 (0.0%) |
| $40,000 to $44,999 | 7 (15.6%) | 0 (0.0%) |
| $45,000 to $49,999 | 0 (0.0%) | 0 (0.0%) |
| $50,000 to $54,999 | 0 (0.0%) | 0 (0.0%) |
| $55,000 to $64,999 | 21 (46.7%) | 0 (0.0%) |
| $65,000 to $74,999 | 0 (0.0%) | 0 (0.0%) |
| $75,000 to $99,999 | 0 (0.0%) | 0 (0.0%) |
| $100,000+ | 17 (37.8%) | 0 (0.0%) |
| Total | 45 (100.0%) | 7 (100.0%) |
Earnings by Sex by Educational Attainment in Flint Hill
| Educational Attainment | Male Income | Female Income |
| Less than High School | - | - |
| High School Diploma | - | - |
| College or Associate's Degree | - | - |
| Bachelor's Degree | - | - |
| Graduate Degree | - | - |
| Total | - | - |
Family Income in Flint Hill
Family Income Brackets in Flint Hill
According to the Flint Hill family income data, there are 26 families falling into the $50,000 to $74,999 income range, which is the most common income bracket and makes up 38.8% of all families.
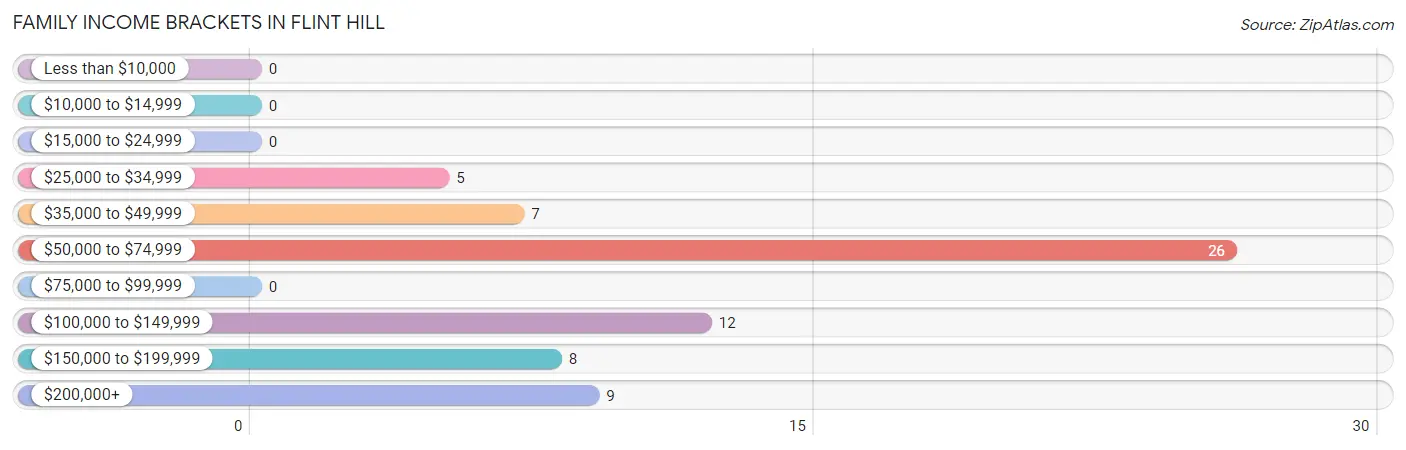
| Income Bracket | # Families | % Families |
| Less than $10,000 | 0 | 0.0% |
| $10,000 to $14,999 | 0 | 0.0% |
| $15,000 to $24,999 | 0 | 0.0% |
| $25,000 to $34,999 | 5 | 7.5% |
| $35,000 to $49,999 | 7 | 10.4% |
| $50,000 to $74,999 | 26 | 38.8% |
| $75,000 to $99,999 | 0 | 0.0% |
| $100,000 to $149,999 | 12 | 17.9% |
| $150,000 to $199,999 | 8 | 11.9% |
| $200,000+ | 9 | 13.4% |
Family Income by Famaliy Size in Flint Hill
2-person families (26 | 38.8%) account for the highest median family income in Flint Hill with $129,167 per family, while 2-person families (26 | 38.8%) have the highest median income of $64,584 per family member.
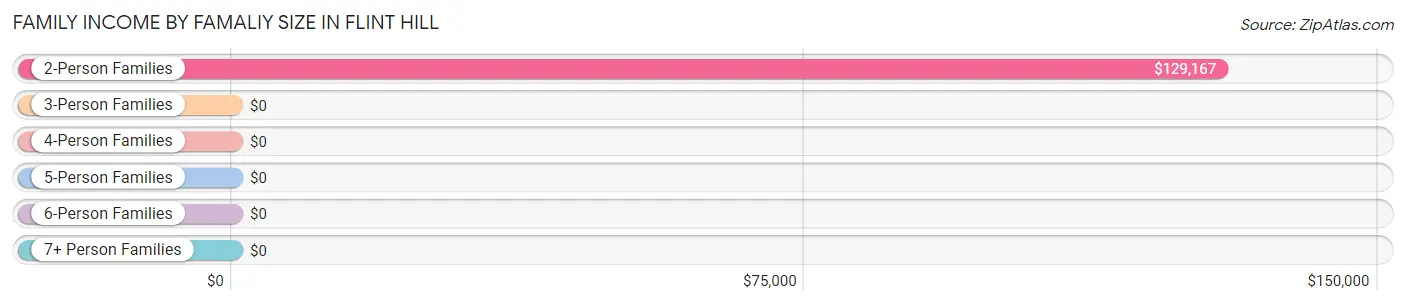
| Income Bracket | # Families | Median Income |
| 2-Person Families | 26 (38.8%) | $129,167 |
| 3-Person Families | 12 (17.9%) | $0 |
| 4-Person Families | 0 (0.0%) | $0 |
| 5-Person Families | 0 (0.0%) | $0 |
| 6-Person Families | 8 (11.9%) | $0 |
| 7+ Person Families | 21 (31.3%) | $0 |
| Total | 67 (100.0%) | $0 |
Family Income by Number of Earners in Flint Hill
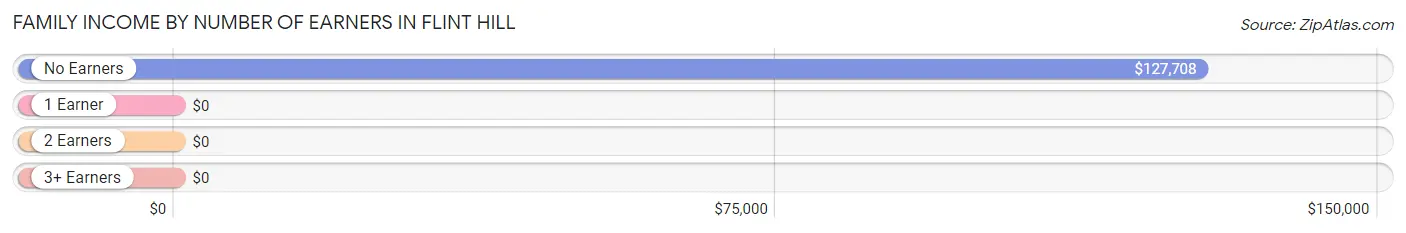
| Number of Earners | # Families | Median Income |
| No Earners | 22 (32.8%) | $127,708 |
| 1 Earner | 36 (53.7%) | $0 |
| 2 Earners | 9 (13.4%) | $0 |
| 3+ Earners | 0 (0.0%) | $0 |
| Total | 67 (100.0%) | $0 |
Household Income in Flint Hill
Household Income Brackets in Flint Hill
With 30 households falling in the category, the $50,000 to $74,999 income range is the most frequent in Flint Hill, accounting for 42.2% of all households.
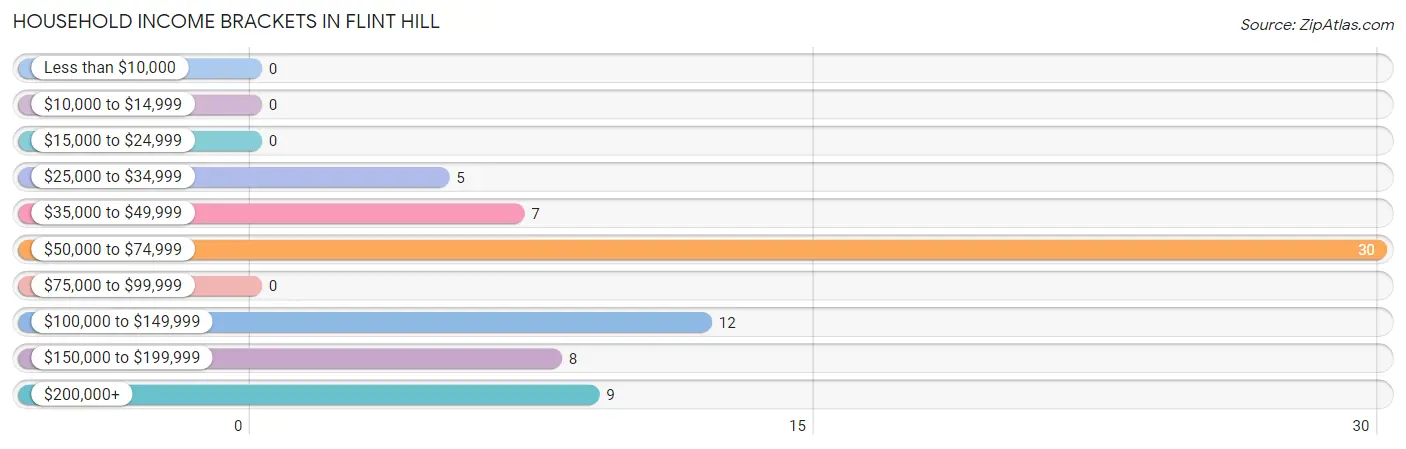
| Income Bracket | # Households | % Households |
| Less than $10,000 | 0 | 0.0% |
| $10,000 to $14,999 | 0 | 0.0% |
| $15,000 to $24,999 | 0 | 0.0% |
| $25,000 to $34,999 | 5 | 7.0% |
| $35,000 to $49,999 | 7 | 9.9% |
| $50,000 to $74,999 | 30 | 42.3% |
| $75,000 to $99,999 | 0 | 0.0% |
| $100,000 to $149,999 | 12 | 16.9% |
| $150,000 to $199,999 | 8 | 11.3% |
| $200,000+ | 9 | 12.7% |
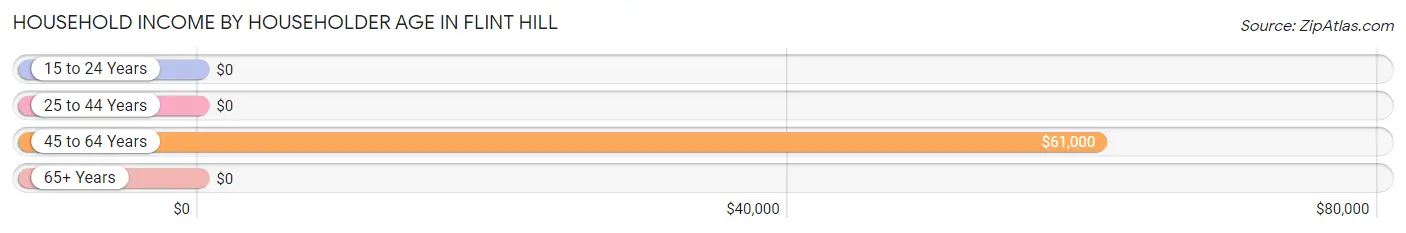
Household Income by Householder Age in Flint Hill
The median household income in Flint Hill is $0, with the highest median household income of $61,000 found in the 45 to 64 years age bracket for the primary householder. A total of 14 households (19.7%) fall into this category.
| Income Bracket | # Households | Median Income |
| 15 to 24 Years | 0 (0.0%) | $0 |
| 25 to 44 Years | 36 (50.7%) | $0 |
| 45 to 64 Years | 14 (19.7%) | $61,000 |
| 65+ Years | 21 (29.6%) | $0 |
| Total | 71 (100.0%) | $0 |
Poverty in Flint Hill
Income Below Poverty by Sex and Age in Flint Hill
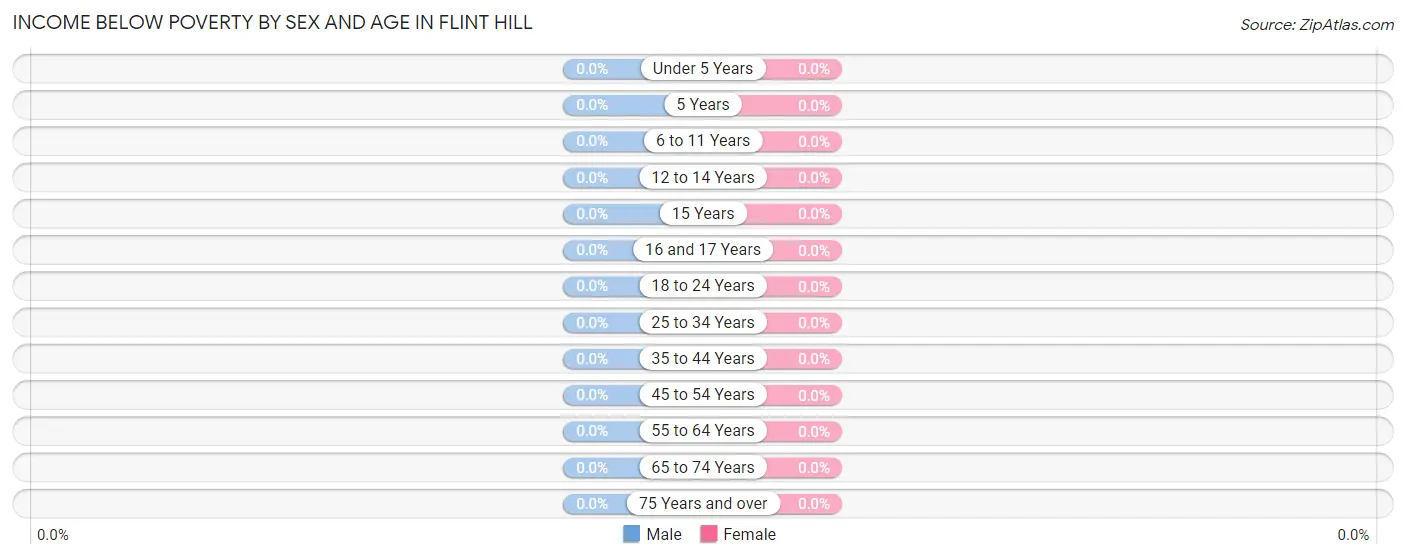
| Age Bracket | Male | Female |
| Under 5 Years | 0 (0.0%) | 0 (0.0%) |
| 5 Years | 0 (0.0%) | 0 (0.0%) |
| 6 to 11 Years | 0 (0.0%) | 0 (0.0%) |
| 12 to 14 Years | 0 (0.0%) | 0 (0.0%) |
| 15 Years | 0 (0.0%) | 0 (0.0%) |
| 16 and 17 Years | 0 (0.0%) | 0 (0.0%) |
| 18 to 24 Years | 0 (0.0%) | 0 (0.0%) |
| 25 to 34 Years | 0 (0.0%) | 0 (0.0%) |
| 35 to 44 Years | 0 (0.0%) | 0 (0.0%) |
| 45 to 54 Years | 0 (0.0%) | 0 (0.0%) |
| 55 to 64 Years | 0 (0.0%) | 0 (0.0%) |
| 65 to 74 Years | 0 (0.0%) | 0 (0.0%) |
| 75 Years and over | 0 (0.0%) | 0 (0.0%) |
| Total | 0 (0.0%) | 0 (0.0%) |
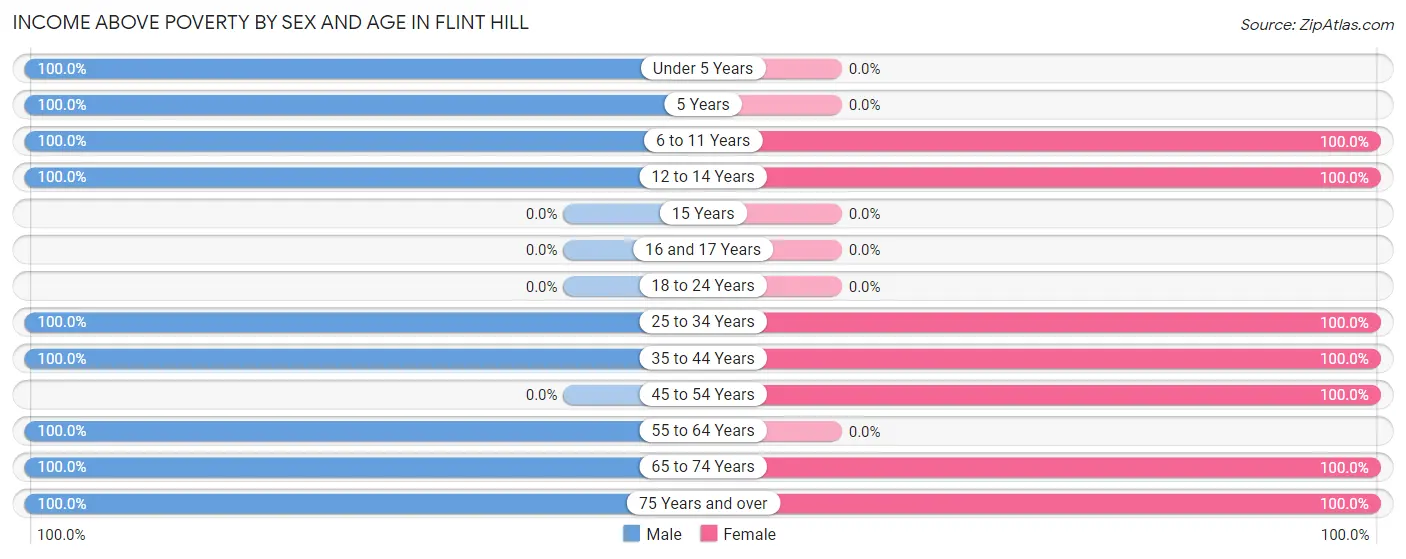
Income Above Poverty by Sex and Age in Flint Hill
According to the poverty statistics in Flint Hill, males aged under 5 years and females aged 6 to 11 years are the age groups that are most secure financially, with 100.0% of males and 100.0% of females in these age groups living above the poverty line.
| Age Bracket | Male | Female |
| Under 5 Years | 36 (100.0%) | 0 (0.0%) |
| 5 Years | 12 (100.0%) | 0 (0.0%) |
| 6 to 11 Years | 9 (100.0%) | 50 (100.0%) |
| 12 to 14 Years | 21 (100.0%) | 11 (100.0%) |
| 15 Years | 0 (0.0%) | 0 (0.0%) |
| 16 and 17 Years | 0 (0.0%) | 0 (0.0%) |
| 18 to 24 Years | 0 (0.0%) | 0 (0.0%) |
| 25 to 34 Years | 7 (100.0%) | 29 (100.0%) |
| 35 to 44 Years | 29 (100.0%) | 10 (100.0%) |
| 45 to 54 Years | 0 (0.0%) | 10 (100.0%) |
| 55 to 64 Years | 14 (100.0%) | 0 (0.0%) |
| 65 to 74 Years | 9 (100.0%) | 15 (100.0%) |
| 75 Years and over | 37 (100.0%) | 20 (100.0%) |
| Total | 174 (100.0%) | 145 (100.0%) |
Income Below Poverty Among Married-Couple Families in Flint Hill
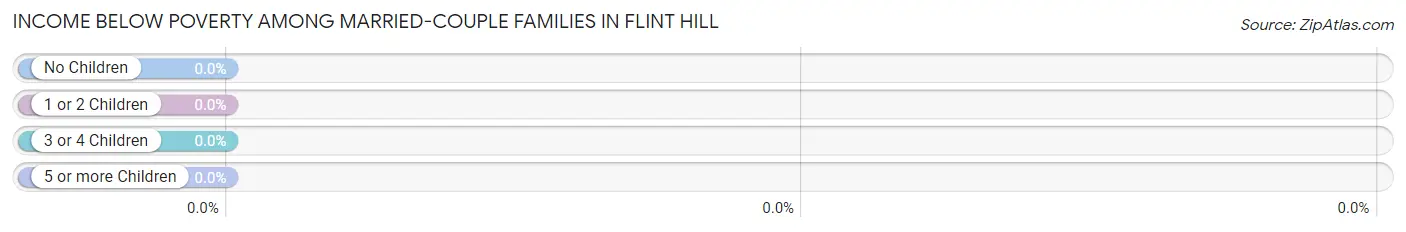
| Children | Above Poverty | Below Poverty |
| No Children | 26 (100.0%) | 0 (0.0%) |
| 1 or 2 Children | 7 (100.0%) | 0 (0.0%) |
| 3 or 4 Children | 8 (100.0%) | 0 (0.0%) |
| 5 or more Children | 21 (100.0%) | 0 (0.0%) |
| Total | 62 (100.0%) | 0 (0.0%) |
Income Below Poverty Among Single-Parent Households in Flint Hill
| Children | Single Father | Single Mother |
| No Children | 0 (0.0%) | 0 (0.0%) |
| 1 or 2 Children | 0 (0.0%) | 0 (0.0%) |
| 3 or 4 Children | 0 (0.0%) | 0 (0.0%) |
| 5 or more Children | 0 (0.0%) | 0 (0.0%) |
| Total | 0 (0.0%) | 0 (0.0%) |
Income Below Poverty Among Married-Couple vs Single-Parent Households in Flint Hill
| Children | Married-Couple Families | Single-Parent Households |
| No Children | 0 (0.0%) | 0 (0.0%) |
| 1 or 2 Children | 0 (0.0%) | 0 (0.0%) |
| 3 or 4 Children | 0 (0.0%) | 0 (0.0%) |
| 5 or more Children | 0 (0.0%) | 0 (0.0%) |
| Total | 0 (0.0%) | 0 (0.0%) |
Race in Flint Hill
The most populous races in Flint Hill are White / Caucasian (241 | 75.5%), Hispanic or Latino (82 | 25.7%), and Some other Race (57 | 17.9%).
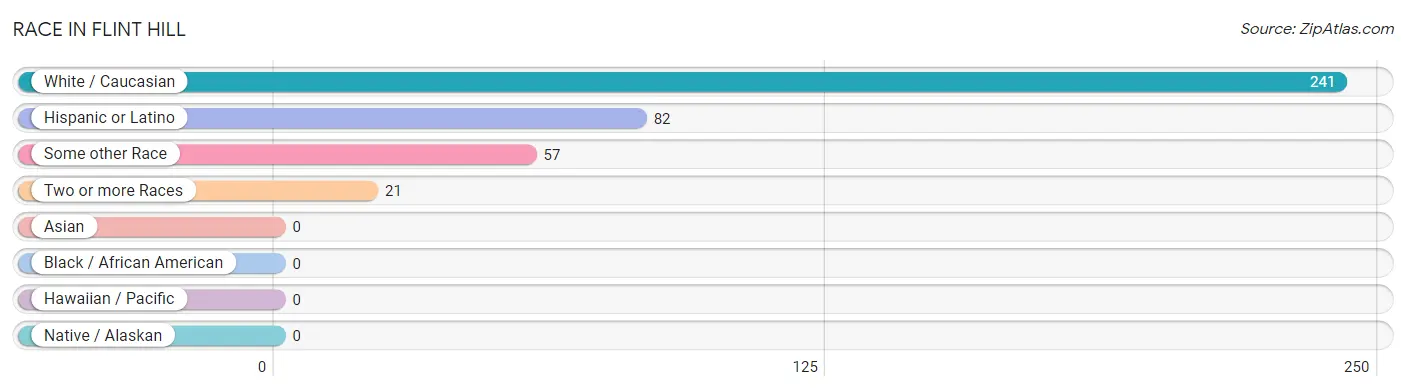
| Race | # Population | % Population |
| Asian | 0 | 0.0% |
| Black / African American | 0 | 0.0% |
| Hawaiian / Pacific | 0 | 0.0% |
| Hispanic or Latino | 82 | 25.7% |
| Native / Alaskan | 0 | 0.0% |
| White / Caucasian | 241 | 75.5% |
| Two or more Races | 21 | 6.6% |
| Some other Race | 57 | 17.9% |
| Total | 319 | 100.0% |
Ancestry in Flint Hill
The most populous ancestries reported in Flint Hill are American (42 | 13.2%), Puerto Rican (36 | 11.3%), English (30 | 9.4%), Scotch-Irish (28 | 8.8%), and Laotian (21 | 6.6%), together accounting for 49.2% of all Flint Hill residents.
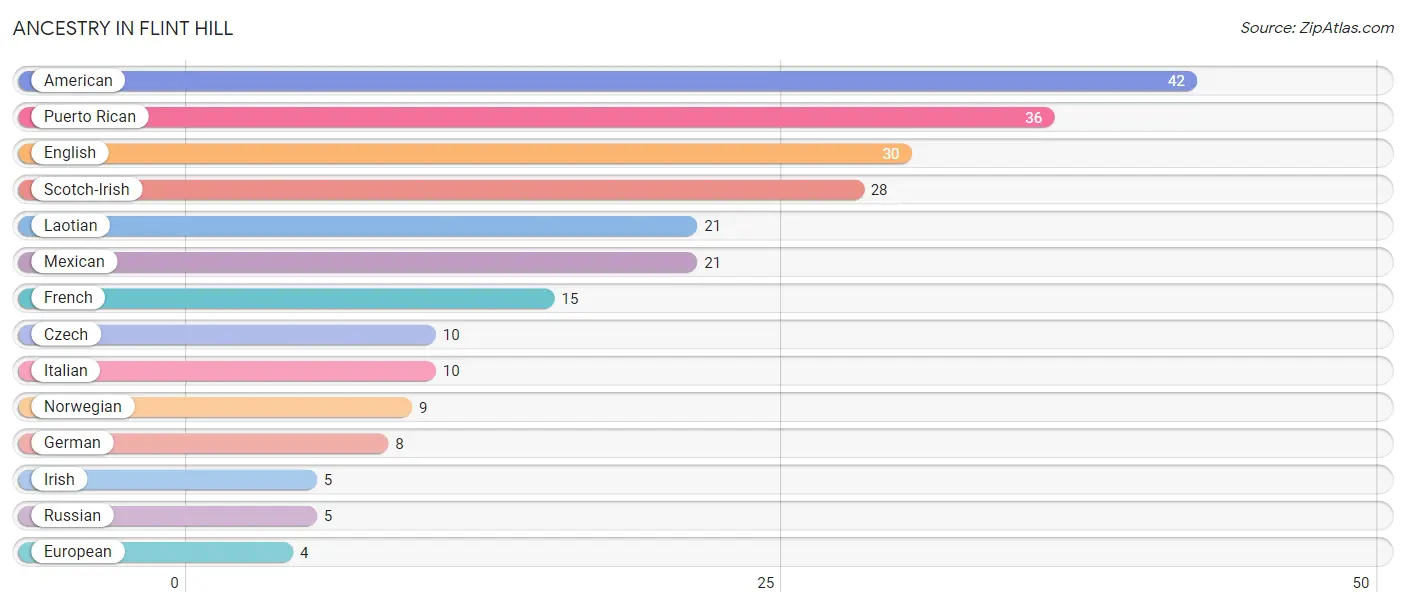
| Ancestry | # Population | % Population |
| American | 42 | 13.2% |
| Czech | 10 | 3.1% |
| English | 30 | 9.4% |
| European | 4 | 1.3% |
| French | 15 | 4.7% |
| German | 8 | 2.5% |
| Irish | 5 | 1.6% |
| Italian | 10 | 3.1% |
| Laotian | 21 | 6.6% |
| Mexican | 21 | 6.6% |
| Norwegian | 9 | 2.8% |
| Puerto Rican | 36 | 11.3% |
| Russian | 5 | 1.6% |
| Scotch-Irish | 28 | 8.8% | View All 14 Rows |
Immigrants in Flint Hill
The most numerous immigrant groups reported in Flint Hill came from Europe (37 | 11.6%), England (30 | 9.4%), Northern Europe (30 | 9.4%), Asia (25 | 7.8%), and Philippines (25 | 7.8%), together accounting for 46.1% of all Flint Hill residents.
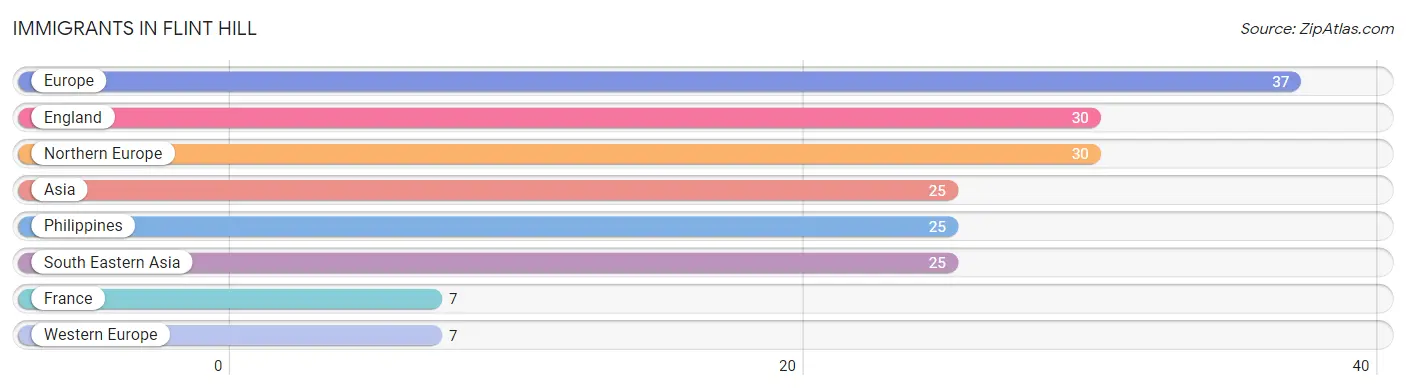
| Immigration Origin | # Population | % Population |
| Asia | 25 | 7.8% |
| England | 30 | 9.4% |
| Europe | 37 | 11.6% |
| France | 7 | 2.2% |
| Northern Europe | 30 | 9.4% |
| Philippines | 25 | 7.8% |
| South Eastern Asia | 25 | 7.8% |
| Western Europe | 7 | 2.2% | View All 8 Rows |
Sex and Age in Flint Hill
Sex and Age in Flint Hill
The most populous age groups in Flint Hill are 75 to 79 Years (37 | 21.3%) for men and 5 to 9 Years (41 | 28.3%) for women.
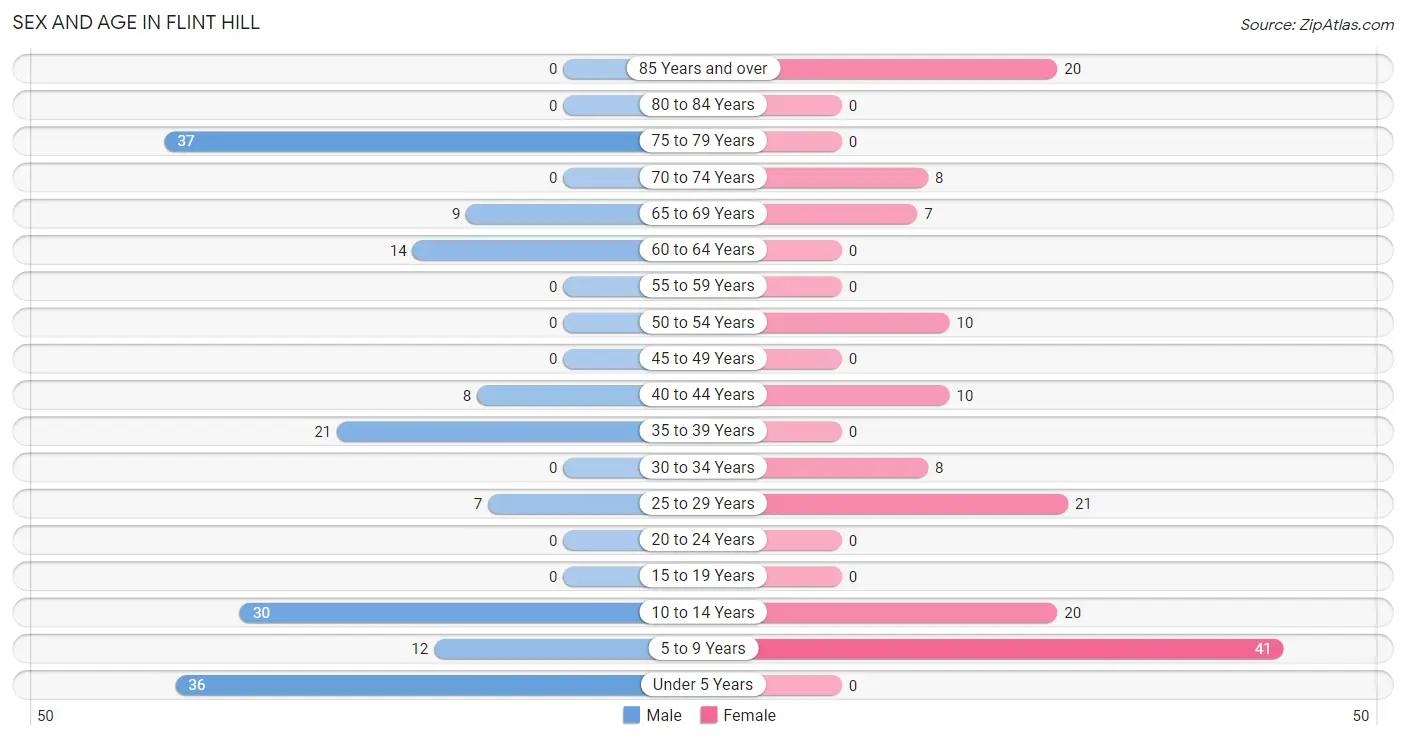
| Age Bracket | Male | Female |
| Under 5 Years | 36 (20.7%) | 0 (0.0%) |
| 5 to 9 Years | 12 (6.9%) | 41 (28.3%) |
| 10 to 14 Years | 30 (17.2%) | 20 (13.8%) |
| 15 to 19 Years | 0 (0.0%) | 0 (0.0%) |
| 20 to 24 Years | 0 (0.0%) | 0 (0.0%) |
| 25 to 29 Years | 7 (4.0%) | 21 (14.5%) |
| 30 to 34 Years | 0 (0.0%) | 8 (5.5%) |
| 35 to 39 Years | 21 (12.1%) | 0 (0.0%) |
| 40 to 44 Years | 8 (4.6%) | 10 (6.9%) |
| 45 to 49 Years | 0 (0.0%) | 0 (0.0%) |
| 50 to 54 Years | 0 (0.0%) | 10 (6.9%) |
| 55 to 59 Years | 0 (0.0%) | 0 (0.0%) |
| 60 to 64 Years | 14 (8.1%) | 0 (0.0%) |
| 65 to 69 Years | 9 (5.2%) | 7 (4.8%) |
| 70 to 74 Years | 0 (0.0%) | 8 (5.5%) |
| 75 to 79 Years | 37 (21.3%) | 0 (0.0%) |
| 80 to 84 Years | 0 (0.0%) | 0 (0.0%) |
| 85 Years and over | 0 (0.0%) | 20 (13.8%) |
| Total | 174 (100.0%) | 145 (100.0%) |
Families and Households in Flint Hill
Median Family Size in Flint Hill
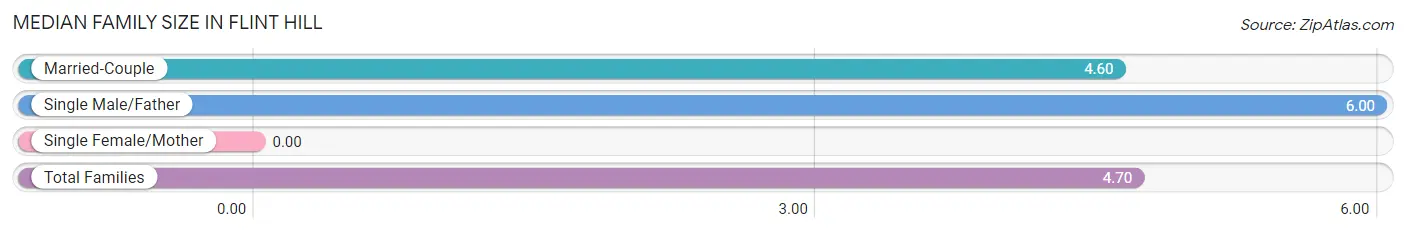
| Family Type | # Families | Family Size |
| Married-Couple | 62 (92.5%) | 4.60 |
| Single Male/Father | 5 (7.5%) | 6.00 |
| Single Female/Mother | 0 (0.0%) | - |
| Total Families | 67 (100.0%) | 4.70 |
Median Household Size in Flint Hill
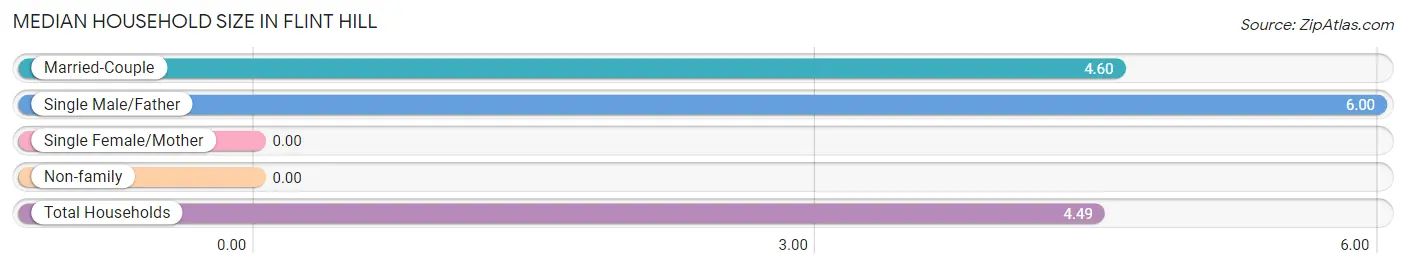
| Household Type | # Households | Household Size |
| Married-Couple | 62 (87.3%) | 4.60 |
| Single Male/Father | 5 (7.0%) | 6.00 |
| Single Female/Mother | 0 (0.0%) | - |
| Non-family | 4 (5.6%) | - |
| Total Households | 71 (100.0%) | 4.49 |
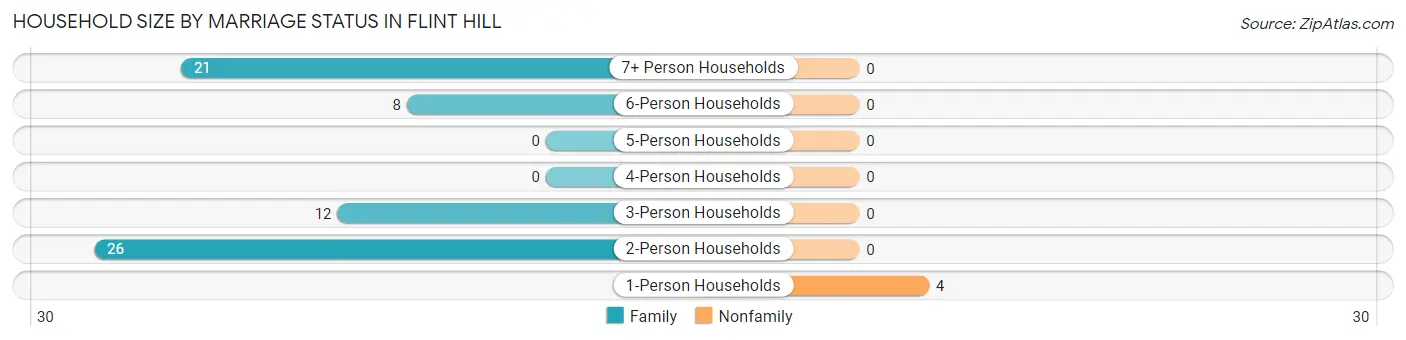
Household Size by Marriage Status in Flint Hill
Out of a total of 71 households in Flint Hill, 67 (94.4%) are family households, while 4 (5.6%) are nonfamily households. The most numerous type of family households are 2-person households, comprising 26, and the most common type of nonfamily households are 1-person households, comprising 4.
| Household Size | Family Households | Nonfamily Households |
| 1-Person Households | - | 4 (5.6%) |
| 2-Person Households | 26 (36.6%) | 0 (0.0%) |
| 3-Person Households | 12 (16.9%) | 0 (0.0%) |
| 4-Person Households | 0 (0.0%) | 0 (0.0%) |
| 5-Person Households | 0 (0.0%) | 0 (0.0%) |
| 6-Person Households | 8 (11.3%) | 0 (0.0%) |
| 7+ Person Households | 21 (29.6%) | 0 (0.0%) |
| Total | 67 (94.4%) | 4 (5.6%) |
Female Fertility in Flint Hill
Fertility by Age in Flint Hill
| Age Bracket | Women with Births | Births / 1,000 Women |
| 15 to 19 years | 0 (0.0%) | 0.0 |
| 20 to 34 years | 0 (0.0%) | 0.0 |
| 35 to 50 years | 0 (0.0%) | 0.0 |
| Total | 0 (0.0%) | 0.0 |
Fertility by Age by Marriage Status in Flint Hill
| Age Bracket | Married | Unmarried |
| 15 to 19 years | 0 (0.0%) | 0 (0.0%) |
| 20 to 34 years | 0 (0.0%) | 0 (0.0%) |
| 35 to 50 years | 0 (0.0%) | 0 (0.0%) |
| Total | 0 (0.0%) | 0 (0.0%) |
Fertility by Education in Flint Hill
| Educational Attainment | Women with Births | Births / 1,000 Women |
| Less than High School | 0 (0.0%) | 0.0 |
| High School Diploma | 0 (0.0%) | 0.0 |
| College or Associate's Degree | 0 (0.0%) | 0.0 |
| Bachelor's Degree | 0 (0.0%) | 0.0 |
| Graduate Degree | 0 (0.0%) | 0.0 |
| Total | 0 (0.0%) | 0.0 |
Fertility by Education by Marriage Status in Flint Hill
| Educational Attainment | Married | Unmarried |
| Less than High School | 0 (0.0%) | 0 (0.0%) |
| High School Diploma | 0 (0.0%) | 0 (0.0%) |
| College or Associate's Degree | 0 (0.0%) | 0 (0.0%) |
| Bachelor's Degree | 0 (0.0%) | 0 (0.0%) |
| Graduate Degree | 0 (0.0%) | 0 (0.0%) |
| Total | 0 (0.0%) | 0 (0.0%) |
Employment Characteristics in Flint Hill
Employment by Class of Employer in Flint Hill
Among the 45 employed individuals in Flint Hill, private company employees (24 | 53.3%), and self-employed (not incorporated) (21 | 46.7%) make up the most common classes of employment.
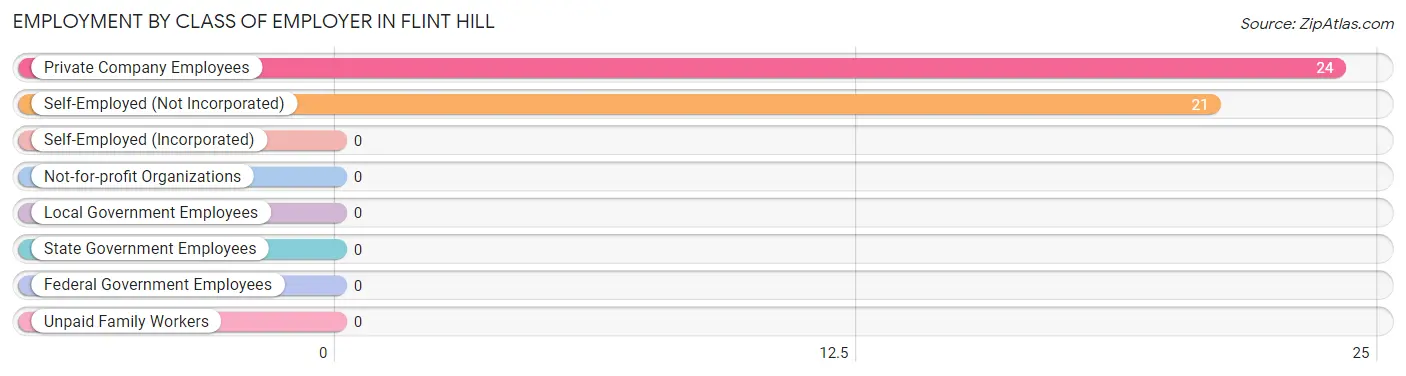
| Employer Class | # Employees | % Employees |
| Private Company Employees | 24 | 53.3% |
| Self-Employed (Incorporated) | 0 | 0.0% |
| Self-Employed (Not Incorporated) | 21 | 46.7% |
| Not-for-profit Organizations | 0 | 0.0% |
| Local Government Employees | 0 | 0.0% |
| State Government Employees | 0 | 0.0% |
| Federal Government Employees | 0 | 0.0% |
| Unpaid Family Workers | 0 | 0.0% |
| Total | 45 | 100.0% |
Employment Status by Age in Flint Hill
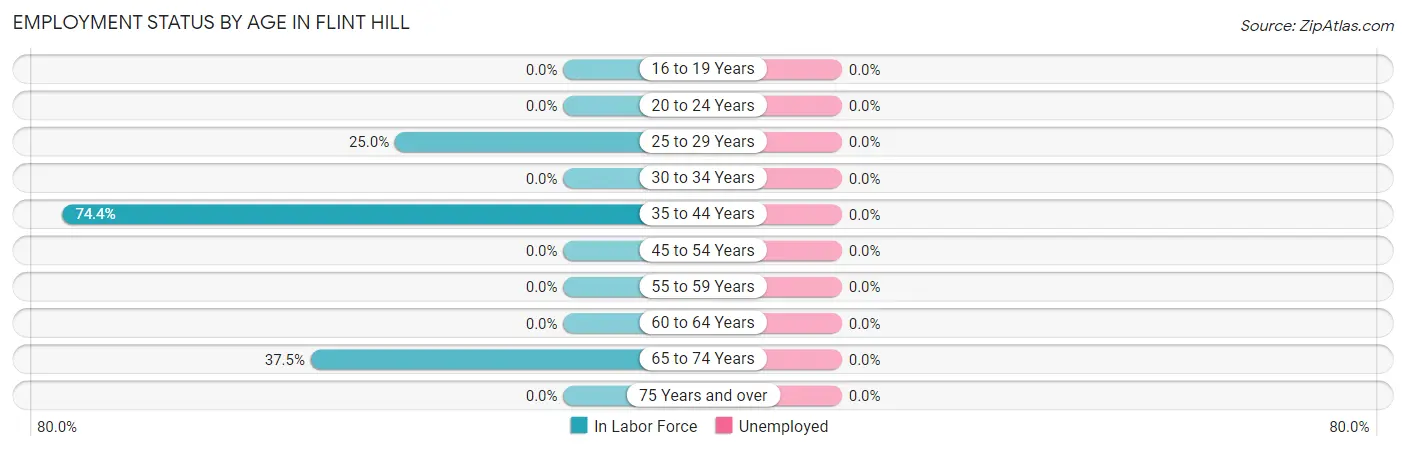
| Age Bracket | In Labor Force | Unemployed |
| 16 to 19 Years | 0 (0.0%) | 0 (0.0%) |
| 20 to 24 Years | 0 (0.0%) | 0 (0.0%) |
| 25 to 29 Years | 7 (25.0%) | 0 (0.0%) |
| 30 to 34 Years | 0 (0.0%) | 0 (0.0%) |
| 35 to 44 Years | 29 (74.4%) | 0 (0.0%) |
| 45 to 54 Years | 0 (0.0%) | 0 (0.0%) |
| 55 to 59 Years | 0 (0.0%) | 0 (0.0%) |
| 60 to 64 Years | 0 (0.0%) | 0 (0.0%) |
| 65 to 74 Years | 9 (37.5%) | 0 (0.0%) |
| 75 Years and over | 0 (0.0%) | 0 (0.0%) |
| Total | 45 (25.0%) | 0 (0.0%) |
Employment Status by Educational Attainment in Flint Hill
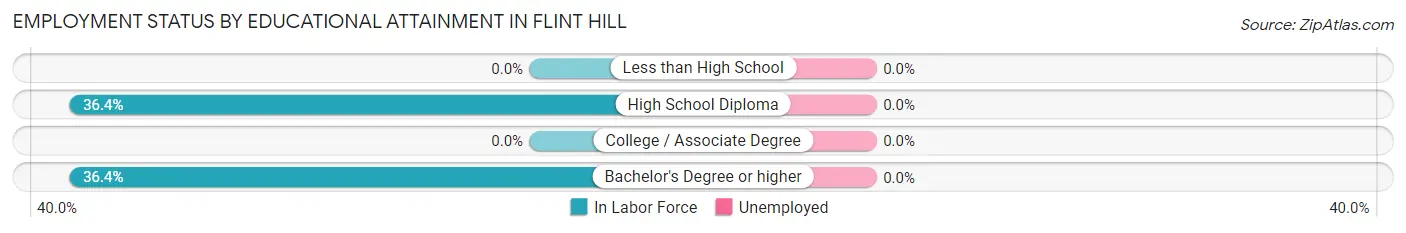
| Educational Attainment | In Labor Force | Unemployed |
| Less than High School | 0 (0.0%) | 0 (0.0%) |
| High School Diploma | 28 (36.4%) | 0 (0.0%) |
| College / Associate Degree | 0 (0.0%) | 0 (0.0%) |
| Bachelor's Degree or higher | 8 (36.4%) | 0 (0.0%) |
| Total | 36 (36.4%) | 0 (0.0%) |
Employment Occupations by Sex in Flint Hill
Management, Business, Science and Arts Occupations
The most common Management, Business, Science and Arts occupations in Flint Hill are , and Business & Financial (9 | 20.0%).
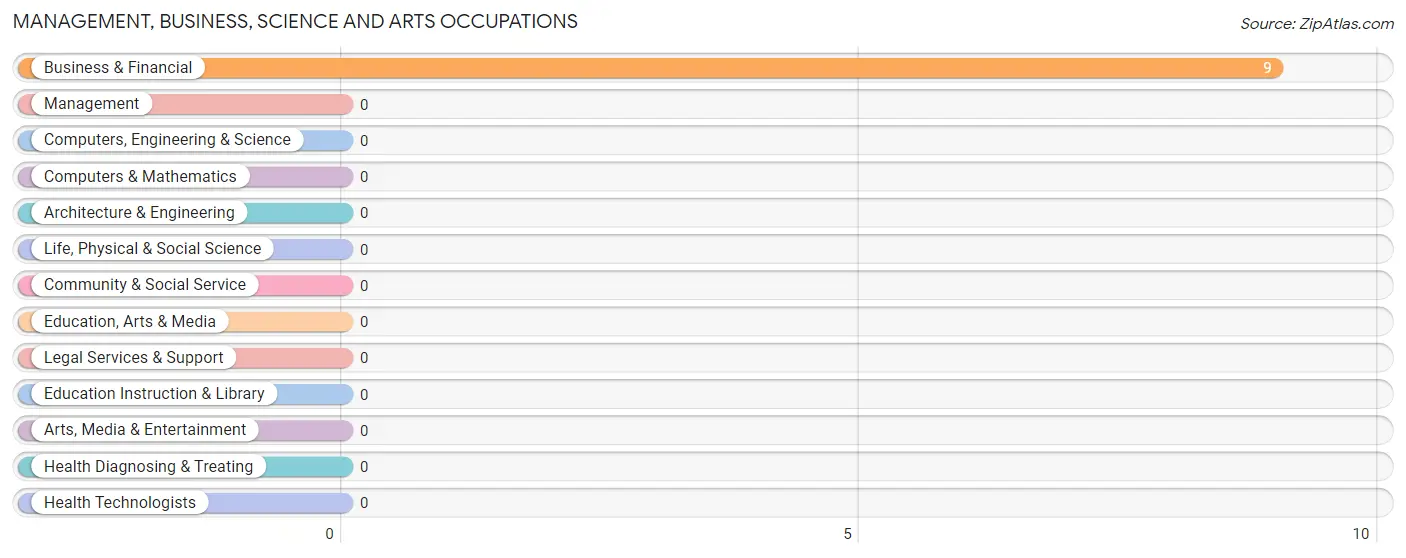
Management, Business, Science and Arts Occupations by Sex
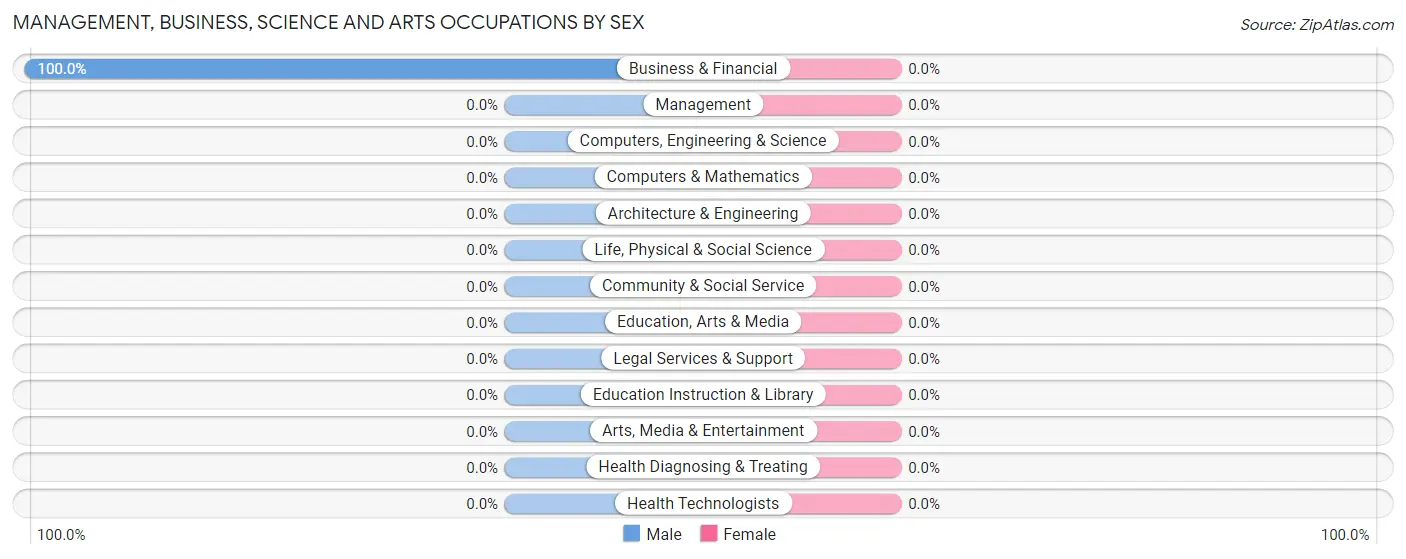
| Occupation | Male | Female |
| Management | 0 (0.0%) | 0 (0.0%) |
| Business & Financial | 9 (100.0%) | 0 (0.0%) |
| Computers, Engineering & Science | 0 (0.0%) | 0 (0.0%) |
| Computers & Mathematics | 0 (0.0%) | 0 (0.0%) |
| Architecture & Engineering | 0 (0.0%) | 0 (0.0%) |
| Life, Physical & Social Science | 0 (0.0%) | 0 (0.0%) |
| Community & Social Service | 0 (0.0%) | 0 (0.0%) |
| Education, Arts & Media | 0 (0.0%) | 0 (0.0%) |
| Legal Services & Support | 0 (0.0%) | 0 (0.0%) |
| Education Instruction & Library | 0 (0.0%) | 0 (0.0%) |
| Arts, Media & Entertainment | 0 (0.0%) | 0 (0.0%) |
| Health Diagnosing & Treating | 0 (0.0%) | 0 (0.0%) |
| Health Technologists | 0 (0.0%) | 0 (0.0%) |
| Total (Category) | 9 (100.0%) | 0 (0.0%) |
| Total (Overall) | 45 (100.0%) | 0 (0.0%) |
Services Occupations
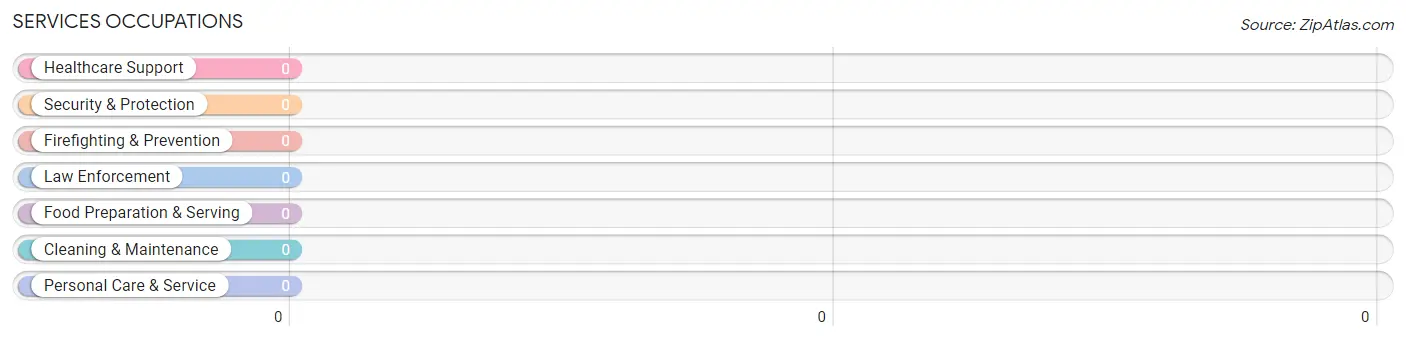
Services Occupations by Sex
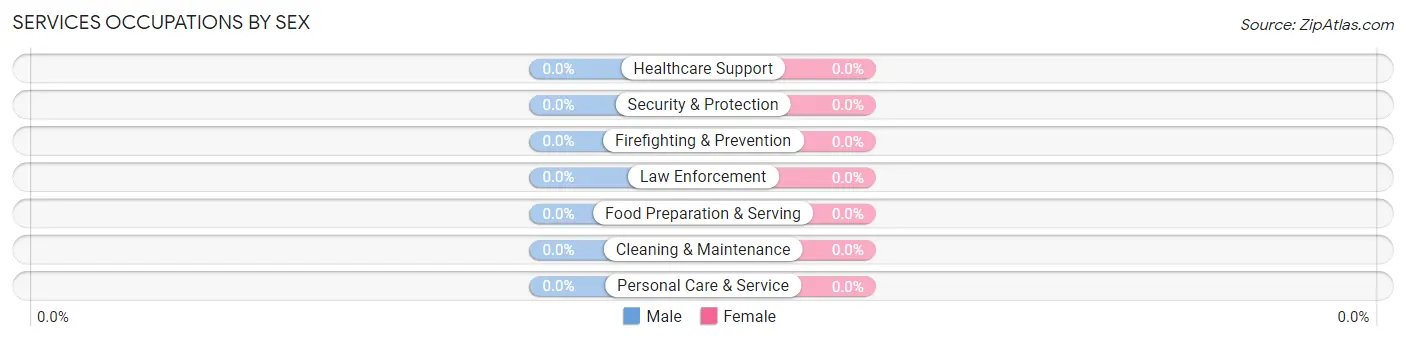
| Occupation | Male | Female |
| Healthcare Support | 0 (0.0%) | 0 (0.0%) |
| Security & Protection | 0 (0.0%) | 0 (0.0%) |
| Firefighting & Prevention | 0 (0.0%) | 0 (0.0%) |
| Law Enforcement | 0 (0.0%) | 0 (0.0%) |
| Food Preparation & Serving | 0 (0.0%) | 0 (0.0%) |
| Cleaning & Maintenance | 0 (0.0%) | 0 (0.0%) |
| Personal Care & Service | 0 (0.0%) | 0 (0.0%) |
| Total (Category) | 0 (0.0%) | 0 (0.0%) |
| Total (Overall) | 45 (100.0%) | 0 (0.0%) |
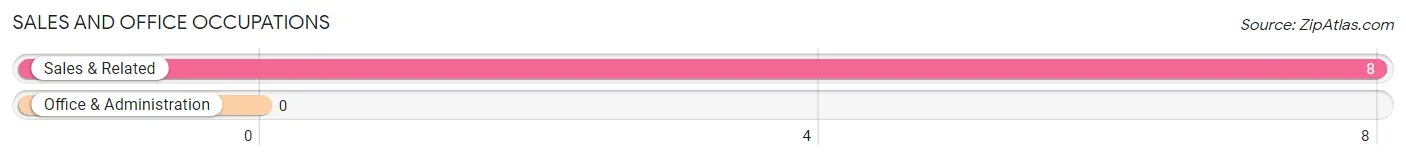
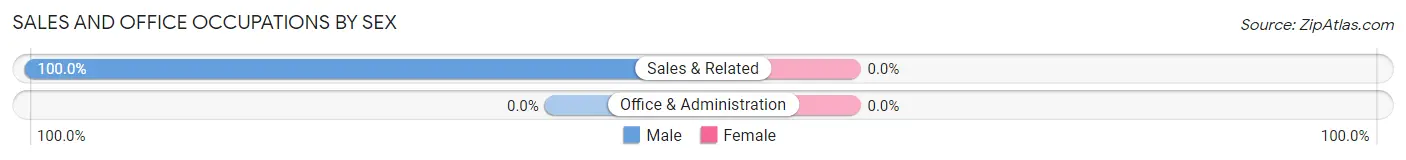
Sales and Office Occupations
The most common Sales and Office occupations in Flint Hill are , and Sales & Related (8 | 17.8%).
Sales and Office Occupations by Sex
| Occupation | Male | Female |
| Sales & Related | 8 (100.0%) | 0 (0.0%) |
| Office & Administration | 0 (0.0%) | 0 (0.0%) |
| Total (Category) | 8 (100.0%) | 0 (0.0%) |
| Total (Overall) | 45 (100.0%) | 0 (0.0%) |
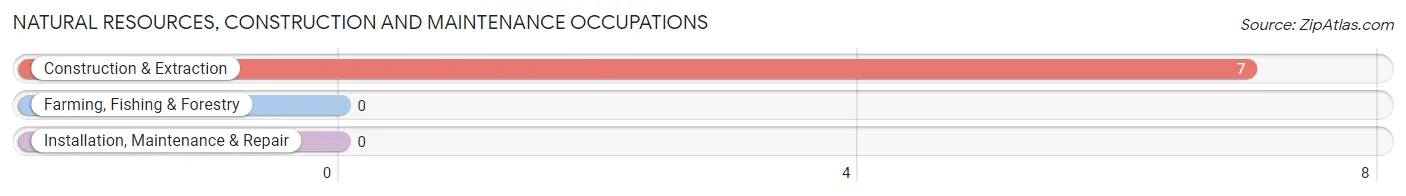
Natural Resources, Construction and Maintenance Occupations
The most common Natural Resources, Construction and Maintenance occupations in Flint Hill are , and Construction & Extraction (7 | 15.6%).
Natural Resources, Construction and Maintenance Occupations by Sex
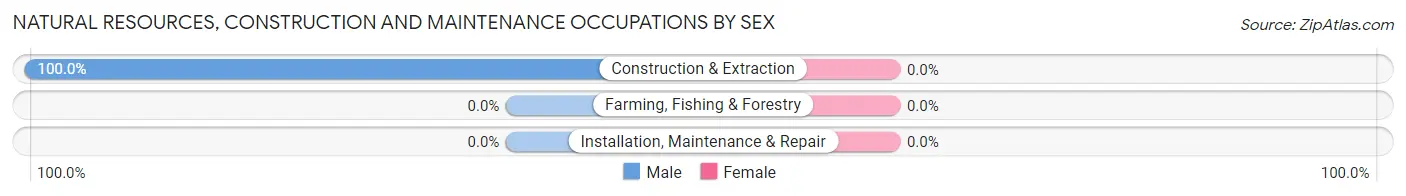
| Occupation | Male | Female |
| Farming, Fishing & Forestry | 0 (0.0%) | 0 (0.0%) |
| Construction & Extraction | 7 (100.0%) | 0 (0.0%) |
| Installation, Maintenance & Repair | 0 (0.0%) | 0 (0.0%) |
| Total (Category) | 7 (100.0%) | 0 (0.0%) |
| Total (Overall) | 45 (100.0%) | 0 (0.0%) |
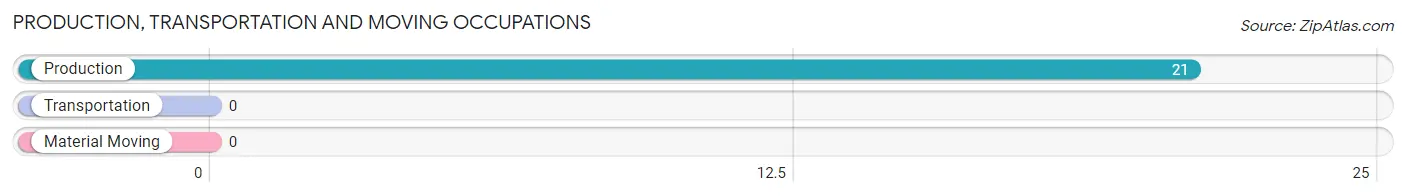
Production, Transportation and Moving Occupations
The most common Production, Transportation and Moving occupations in Flint Hill are , and Production (21 | 46.7%).
Production, Transportation and Moving Occupations by Sex
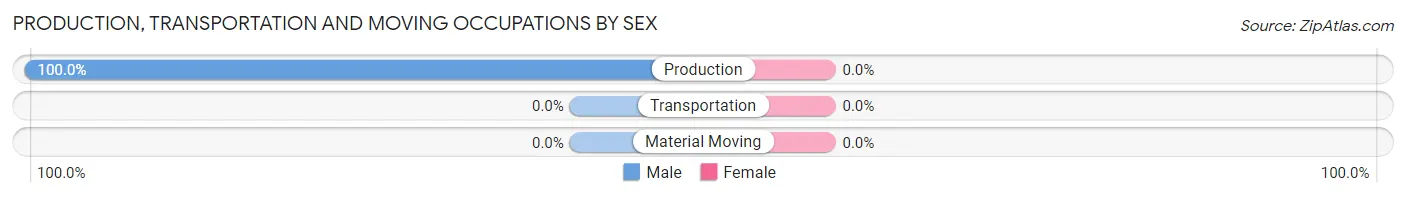
| Occupation | Male | Female |
| Production | 21 (100.0%) | 0 (0.0%) |
| Transportation | 0 (0.0%) | 0 (0.0%) |
| Material Moving | 0 (0.0%) | 0 (0.0%) |
| Total (Category) | 21 (100.0%) | 0 (0.0%) |
| Total (Overall) | 45 (100.0%) | 0 (0.0%) |
Employment Industries by Sex in Flint Hill
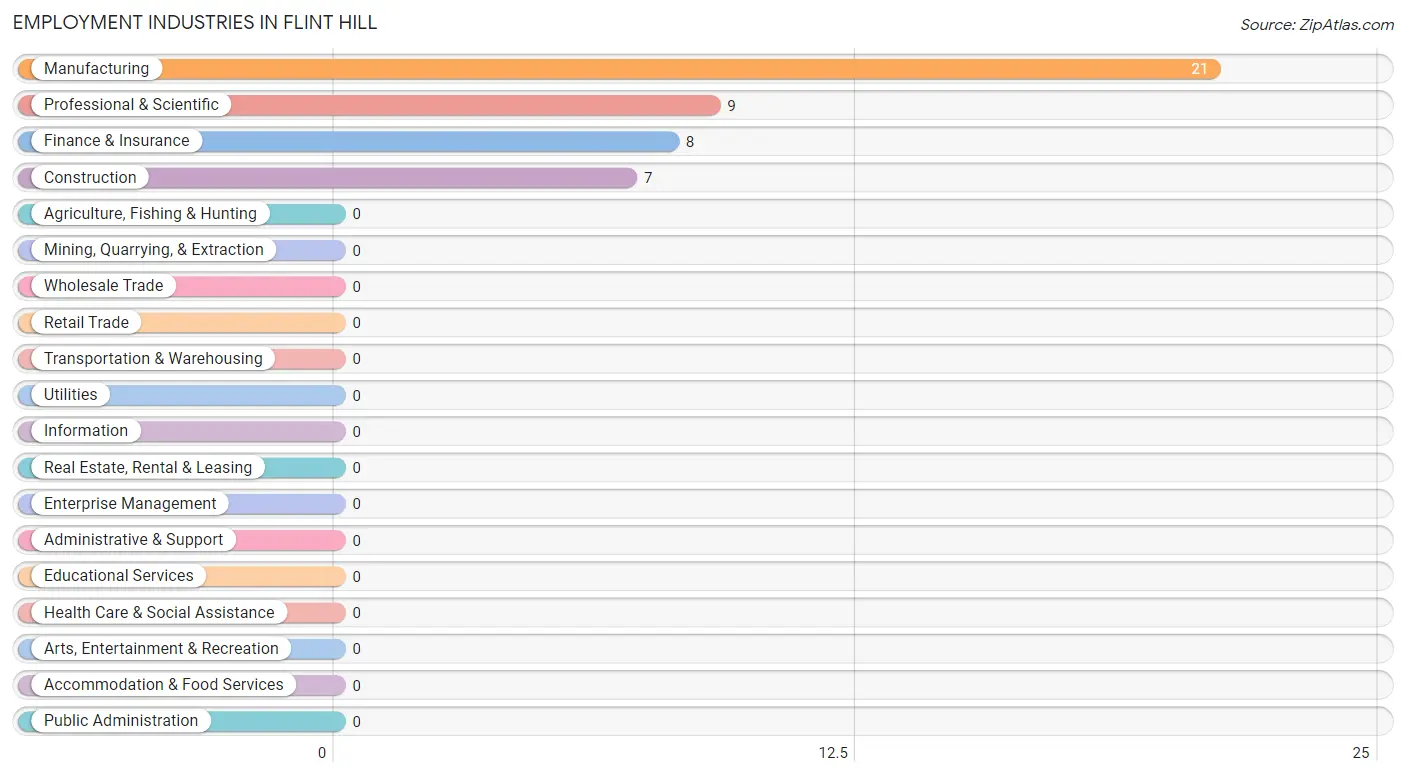
Employment Industries in Flint Hill
The major employment industries in Flint Hill include Manufacturing (21 | 46.7%), Professional & Scientific (9 | 20.0%), Finance & Insurance (8 | 17.8%), and Construction (7 | 15.6%).
Employment Industries by Sex in Flint Hill
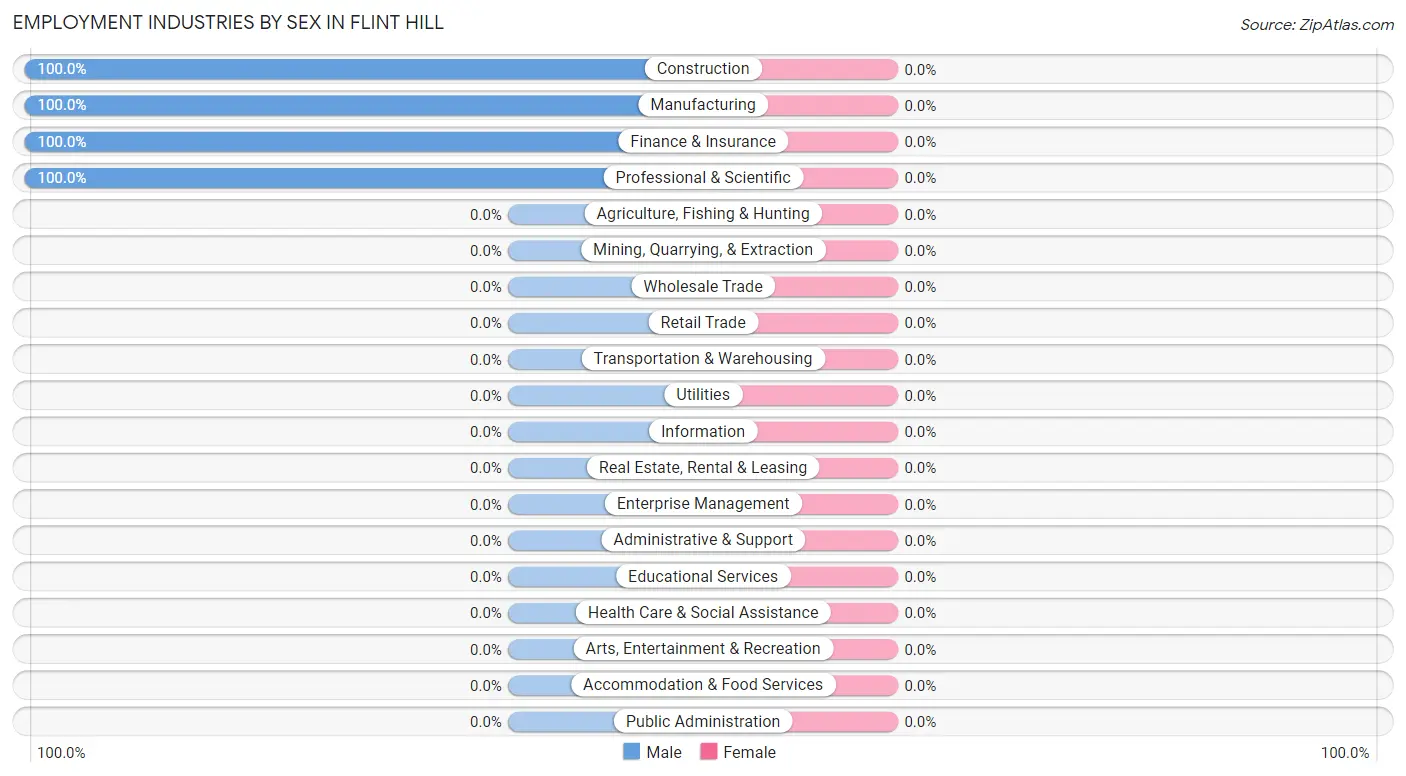
| Industry | Male | Female |
| Agriculture, Fishing & Hunting | 0 (0.0%) | 0 (0.0%) |
| Mining, Quarrying, & Extraction | 0 (0.0%) | 0 (0.0%) |
| Construction | 7 (100.0%) | 0 (0.0%) |
| Manufacturing | 21 (100.0%) | 0 (0.0%) |
| Wholesale Trade | 0 (0.0%) | 0 (0.0%) |
| Retail Trade | 0 (0.0%) | 0 (0.0%) |
| Transportation & Warehousing | 0 (0.0%) | 0 (0.0%) |
| Utilities | 0 (0.0%) | 0 (0.0%) |
| Information | 0 (0.0%) | 0 (0.0%) |
| Finance & Insurance | 8 (100.0%) | 0 (0.0%) |
| Real Estate, Rental & Leasing | 0 (0.0%) | 0 (0.0%) |
| Professional & Scientific | 9 (100.0%) | 0 (0.0%) |
| Enterprise Management | 0 (0.0%) | 0 (0.0%) |
| Administrative & Support | 0 (0.0%) | 0 (0.0%) |
| Educational Services | 0 (0.0%) | 0 (0.0%) |
| Health Care & Social Assistance | 0 (0.0%) | 0 (0.0%) |
| Arts, Entertainment & Recreation | 0 (0.0%) | 0 (0.0%) |
| Accommodation & Food Services | 0 (0.0%) | 0 (0.0%) |
| Public Administration | 0 (0.0%) | 0 (0.0%) |
| Total | 45 (100.0%) | 0 (0.0%) |
Education in Flint Hill
School Enrollment in Flint Hill
The most common levels of schooling among the 91 students in Flint Hill are elementary school (49 | 53.8%), middle school (32 | 35.2%), and kindergarten (10 | 11.0%).
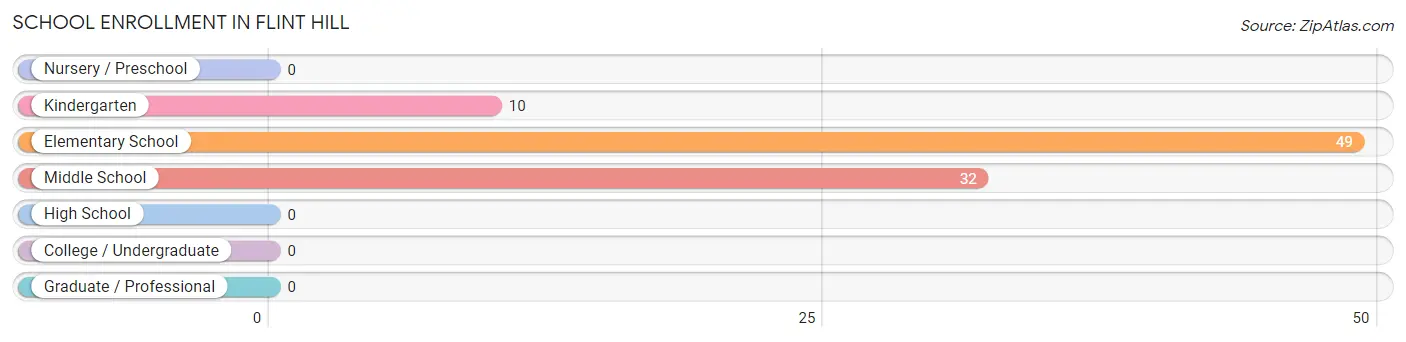
| School Level | # Students | % Students |
| Nursery / Preschool | 0 | 0.0% |
| Kindergarten | 10 | 11.0% |
| Elementary School | 49 | 53.8% |
| Middle School | 32 | 35.2% |
| High School | 0 | 0.0% |
| College / Undergraduate | 0 | 0.0% |
| Graduate / Professional | 0 | 0.0% |
| Total | 91 | 100.0% |
School Enrollment by Age by Funding Source in Flint Hill
Out of a total of 91 students who are enrolled in schools in Flint Hill, 30 (33.0%) attend a private institution, while the remaining 61 (67.0%) are enrolled in public schools. The age group of 10 to 14 year olds has the highest likelihood of being enrolled in private schools, with 21 (42.0% in the age bracket) enrolled. Conversely, the age group of 5 to 9 year old has the lowest likelihood of being enrolled in a private school, with 32 (78.0% in the age bracket) attending a public institution.
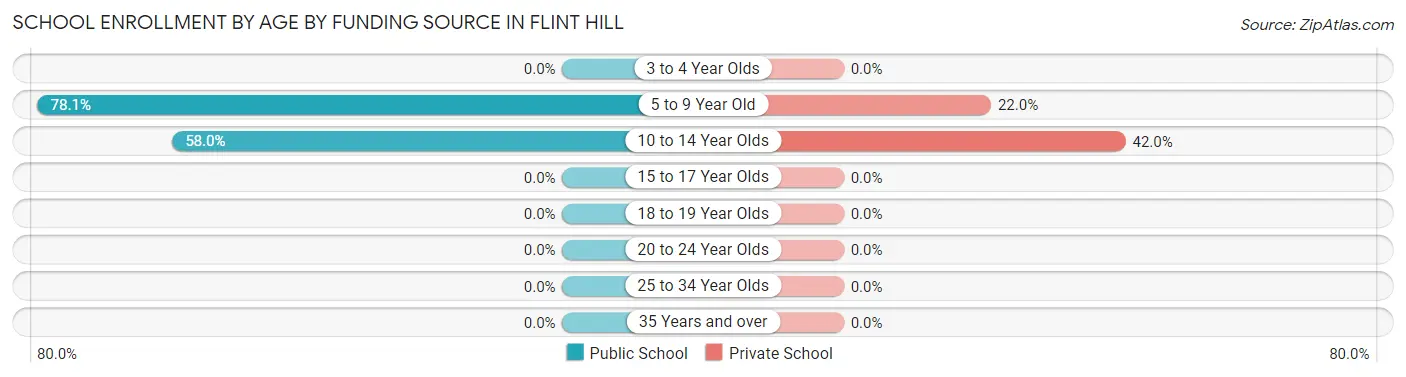
| Age Bracket | Public School | Private School |
| 3 to 4 Year Olds | 0 (0.0%) | 0 (0.0%) |
| 5 to 9 Year Old | 32 (78.0%) | 9 (22.0%) |
| 10 to 14 Year Olds | 29 (58.0%) | 21 (42.0%) |
| 15 to 17 Year Olds | 0 (0.0%) | 0 (0.0%) |
| 18 to 19 Year Olds | 0 (0.0%) | 0 (0.0%) |
| 20 to 24 Year Olds | 0 (0.0%) | 0 (0.0%) |
| 25 to 34 Year Olds | 0 (0.0%) | 0 (0.0%) |
| 35 Years and over | 0 (0.0%) | 0 (0.0%) |
| Total | 61 (67.0%) | 30 (33.0%) |
Educational Attainment by Field of Study in Flint Hill
Business (25 | 50.0%), and literature & languages (25 | 50.0%) are the most common fields of study among 50 individuals in Flint Hill who have obtained a bachelor's degree or higher.
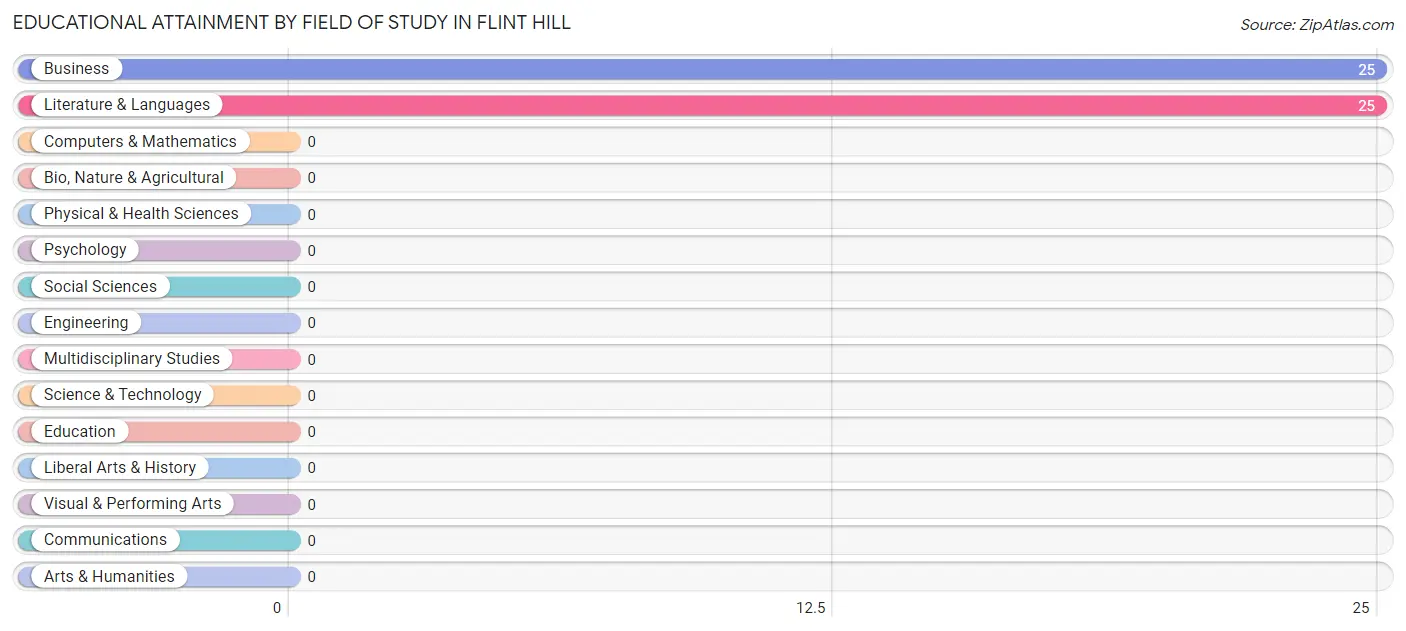
| Field of Study | # Graduates | % Graduates |
| Computers & Mathematics | 0 | 0.0% |
| Bio, Nature & Agricultural | 0 | 0.0% |
| Physical & Health Sciences | 0 | 0.0% |
| Psychology | 0 | 0.0% |
| Social Sciences | 0 | 0.0% |
| Engineering | 0 | 0.0% |
| Multidisciplinary Studies | 0 | 0.0% |
| Science & Technology | 0 | 0.0% |
| Business | 25 | 50.0% |
| Education | 0 | 0.0% |
| Literature & Languages | 25 | 50.0% |
| Liberal Arts & History | 0 | 0.0% |
| Visual & Performing Arts | 0 | 0.0% |
| Communications | 0 | 0.0% |
| Arts & Humanities | 0 | 0.0% |
| Total | 50 | 100.0% |
Transportation & Commute in Flint Hill
Vehicle Availability by Sex in Flint Hill
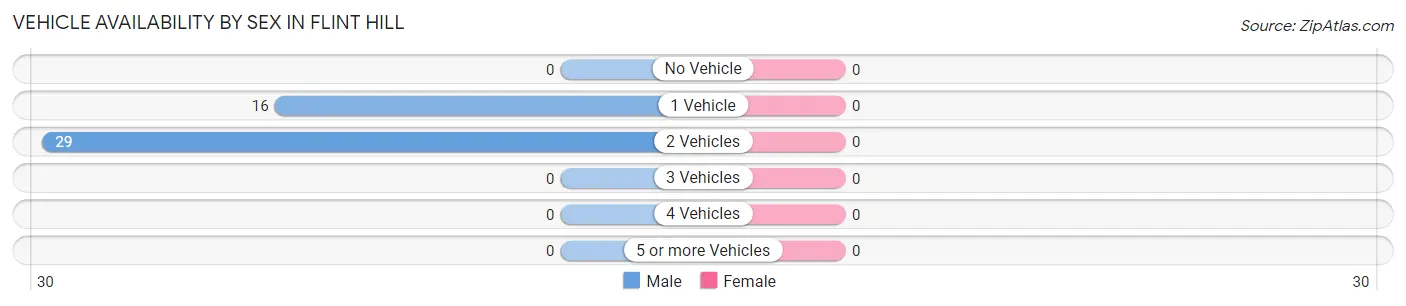
| Vehicles Available | Male | Female |
| No Vehicle | 0 (0.0%) | 0 (0.0%) |
| 1 Vehicle | 16 (35.6%) | 0 (0.0%) |
| 2 Vehicles | 29 (64.4%) | 0 (0.0%) |
| 3 Vehicles | 0 (0.0%) | 0 (0.0%) |
| 4 Vehicles | 0 (0.0%) | 0 (0.0%) |
| 5 or more Vehicles | 0 (0.0%) | 0 (0.0%) |
| Total | 45 (100.0%) | 0 (0.0%) |
Commute Time in Flint Hill
The most frequently occuring commute durations in Flint Hill are less than 5 minutes (21 commuters, 75.0%), 5 to 9 minutes (7 commuters, 25.0%), and 10 to 14 minutes (0 commuters, 0.0%).
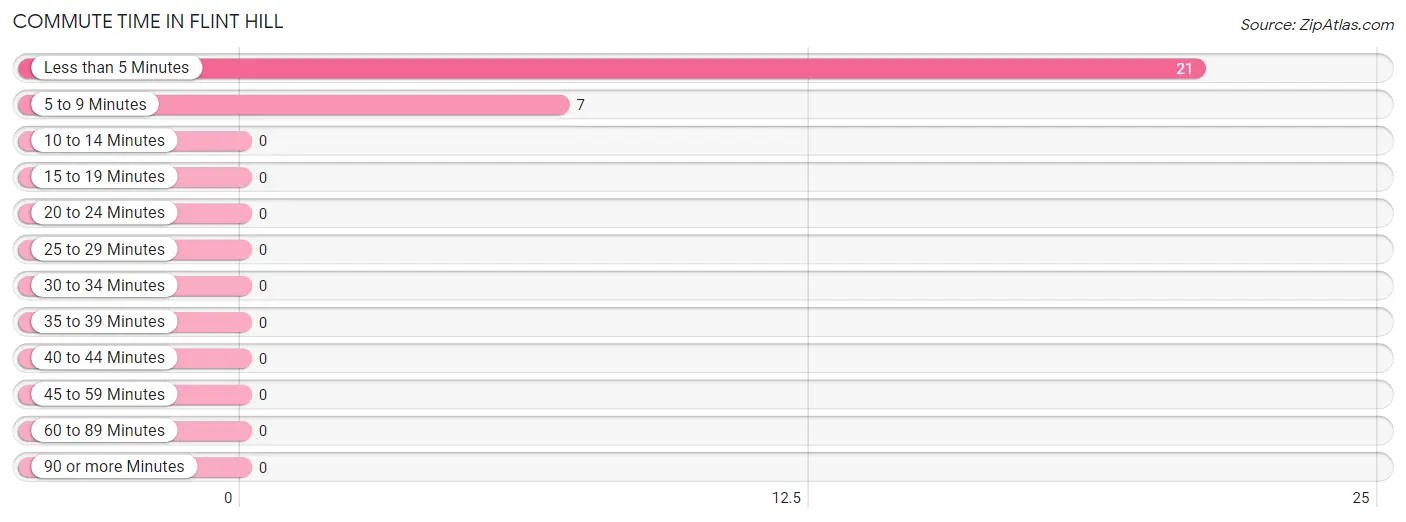
| Commute Time | # Commuters | % Commuters |
| Less than 5 Minutes | 21 | 75.0% |
| 5 to 9 Minutes | 7 | 25.0% |
| 10 to 14 Minutes | 0 | 0.0% |
| 15 to 19 Minutes | 0 | 0.0% |
| 20 to 24 Minutes | 0 | 0.0% |
| 25 to 29 Minutes | 0 | 0.0% |
| 30 to 34 Minutes | 0 | 0.0% |
| 35 to 39 Minutes | 0 | 0.0% |
| 40 to 44 Minutes | 0 | 0.0% |
| 45 to 59 Minutes | 0 | 0.0% |
| 60 to 89 Minutes | 0 | 0.0% |
| 90 or more Minutes | 0 | 0.0% |
Commute Time by Sex in Flint Hill
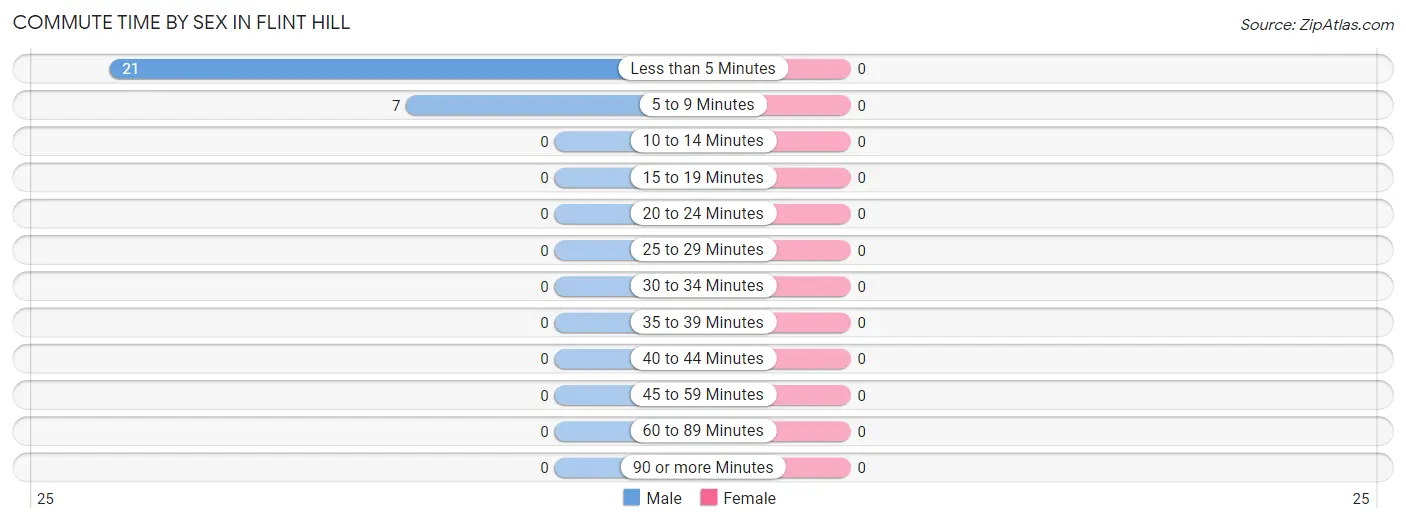
| Commute Time | Male | Female |
| Less than 5 Minutes | 21 (75.0%) | 0 (0.0%) |
| 5 to 9 Minutes | 7 (25.0%) | 0 (0.0%) |
| 10 to 14 Minutes | 0 (0.0%) | 0 (0.0%) |
| 15 to 19 Minutes | 0 (0.0%) | 0 (0.0%) |
| 20 to 24 Minutes | 0 (0.0%) | 0 (0.0%) |
| 25 to 29 Minutes | 0 (0.0%) | 0 (0.0%) |
| 30 to 34 Minutes | 0 (0.0%) | 0 (0.0%) |
| 35 to 39 Minutes | 0 (0.0%) | 0 (0.0%) |
| 40 to 44 Minutes | 0 (0.0%) | 0 (0.0%) |
| 45 to 59 Minutes | 0 (0.0%) | 0 (0.0%) |
| 60 to 89 Minutes | 0 (0.0%) | 0 (0.0%) |
| 90 or more Minutes | 0 (0.0%) | 0 (0.0%) |
Time of Departure to Work by Sex in Flint Hill
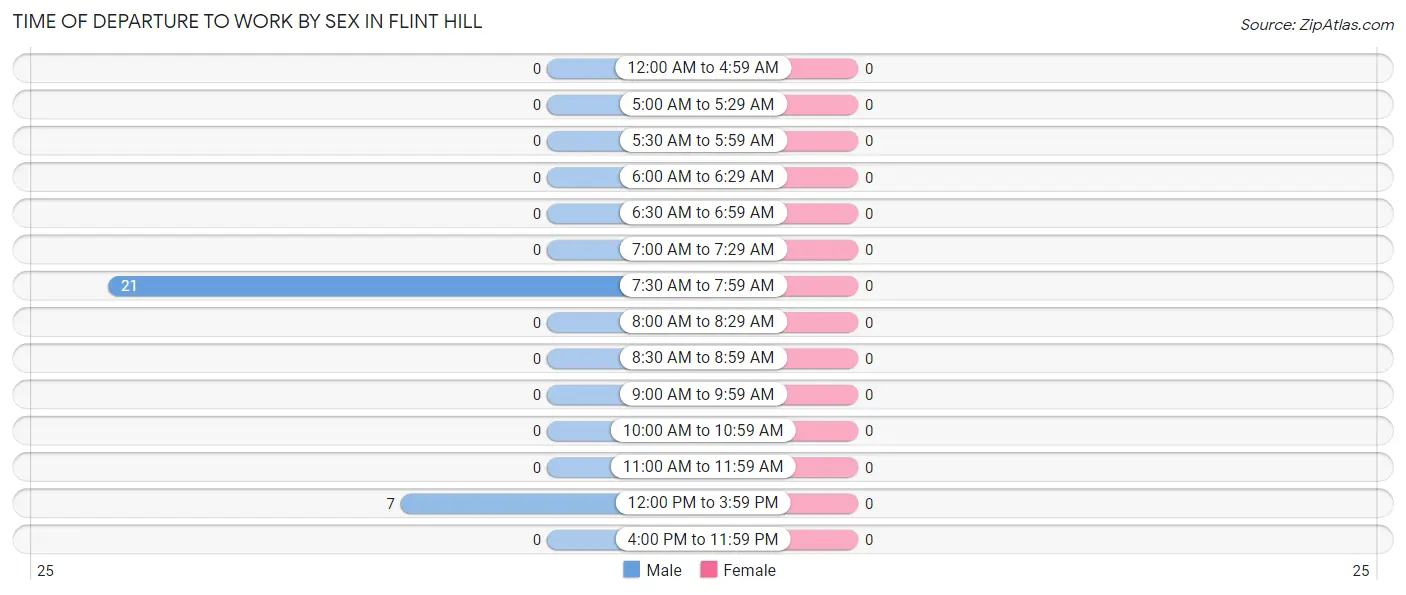
| Time of Departure | Male | Female |
| 12:00 AM to 4:59 AM | 0 (0.0%) | 0 (0.0%) |
| 5:00 AM to 5:29 AM | 0 (0.0%) | 0 (0.0%) |
| 5:30 AM to 5:59 AM | 0 (0.0%) | 0 (0.0%) |
| 6:00 AM to 6:29 AM | 0 (0.0%) | 0 (0.0%) |
| 6:30 AM to 6:59 AM | 0 (0.0%) | 0 (0.0%) |
| 7:00 AM to 7:29 AM | 0 (0.0%) | 0 (0.0%) |
| 7:30 AM to 7:59 AM | 21 (75.0%) | 0 (0.0%) |
| 8:00 AM to 8:29 AM | 0 (0.0%) | 0 (0.0%) |
| 8:30 AM to 8:59 AM | 0 (0.0%) | 0 (0.0%) |
| 9:00 AM to 9:59 AM | 0 (0.0%) | 0 (0.0%) |
| 10:00 AM to 10:59 AM | 0 (0.0%) | 0 (0.0%) |
| 11:00 AM to 11:59 AM | 0 (0.0%) | 0 (0.0%) |
| 12:00 PM to 3:59 PM | 7 (25.0%) | 0 (0.0%) |
| 4:00 PM to 11:59 PM | 0 (0.0%) | 0 (0.0%) |
| Total | 28 (100.0%) | 0 (0.0%) |
Housing Occupancy in Flint Hill
Occupancy by Ownership in Flint Hill
Of the total 71 dwellings in Flint Hill, owner-occupied units account for 38 (53.5%), while renter-occupied units make up 33 (46.5%).
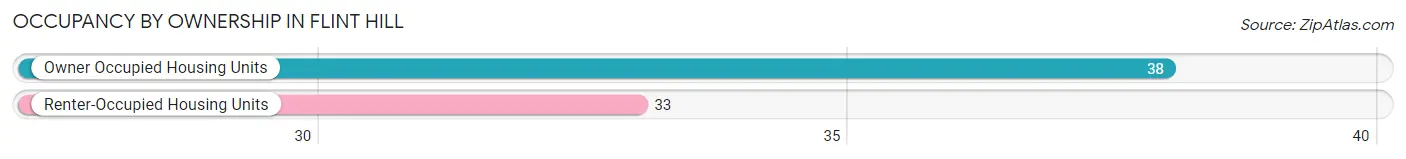
| Occupancy | # Housing Units | % Housing Units |
| Owner Occupied Housing Units | 38 | 53.5% |
| Renter-Occupied Housing Units | 33 | 46.5% |
| Total Occupied Housing Units | 71 | 100.0% |
Occupancy by Household Size in Flint Hill
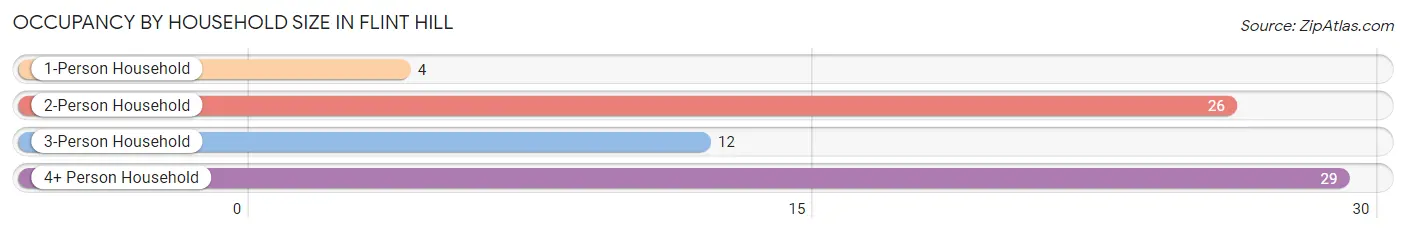
| Household Size | # Housing Units | % Housing Units |
| 1-Person Household | 4 | 5.6% |
| 2-Person Household | 26 | 36.6% |
| 3-Person Household | 12 | 16.9% |
| 4+ Person Household | 29 | 40.8% |
| Total Housing Units | 71 | 100.0% |
Occupancy by Ownership by Household Size in Flint Hill
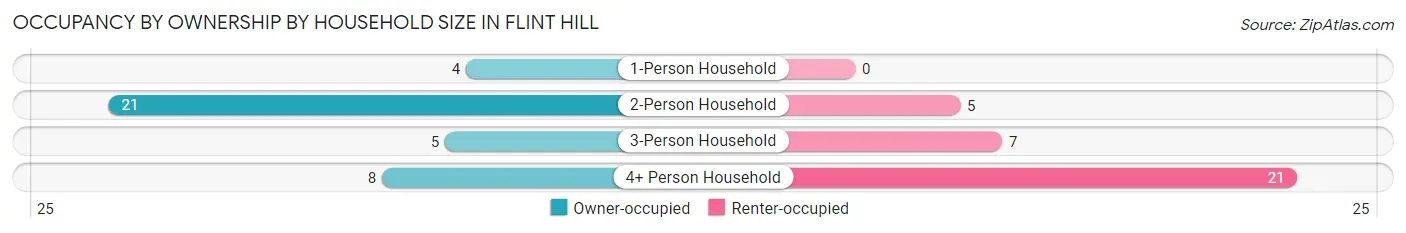
| Household Size | Owner-occupied | Renter-occupied |
| 1-Person Household | 4 (100.0%) | 0 (0.0%) |
| 2-Person Household | 21 (80.8%) | 5 (19.2%) |
| 3-Person Household | 5 (41.7%) | 7 (58.3%) |
| 4+ Person Household | 8 (27.6%) | 21 (72.4%) |
| Total Housing Units | 38 (53.5%) | 33 (46.5%) |
Occupancy by Educational Attainment in Flint Hill
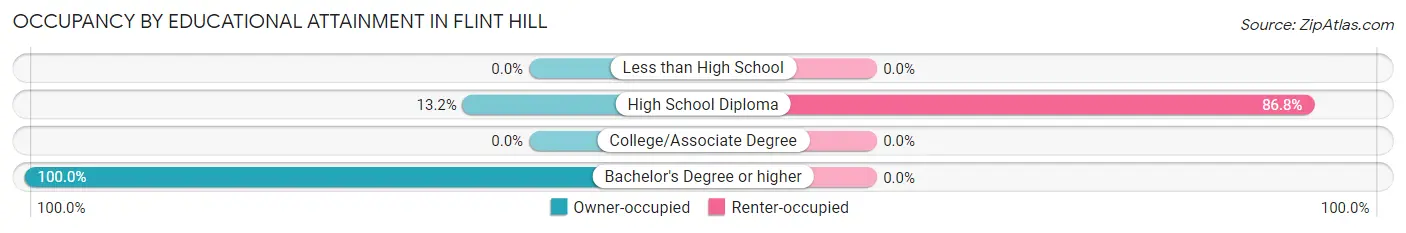
| Household Size | Owner-occupied | Renter-occupied |
| Less than High School | 0 (0.0%) | 0 (0.0%) |
| High School Diploma | 5 (13.2%) | 33 (86.8%) |
| College/Associate Degree | 0 (0.0%) | 0 (0.0%) |
| Bachelor's Degree or higher | 33 (100.0%) | 0 (0.0%) |
Occupancy by Age of Householder in Flint Hill
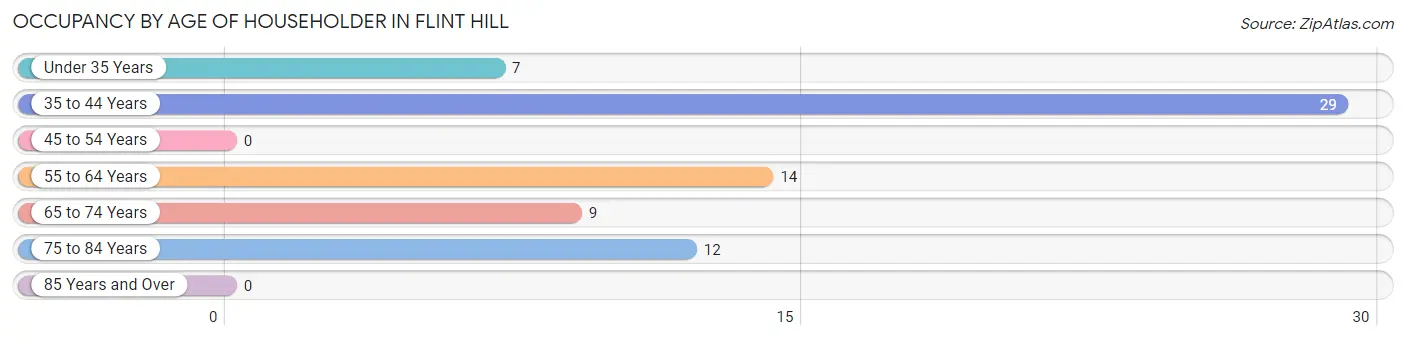
| Age Bracket | # Households | % Households |
| Under 35 Years | 7 | 9.9% |
| 35 to 44 Years | 29 | 40.8% |
| 45 to 54 Years | 0 | 0.0% |
| 55 to 64 Years | 14 | 19.7% |
| 65 to 74 Years | 9 | 12.7% |
| 75 to 84 Years | 12 | 16.9% |
| 85 Years and Over | 0 | 0.0% |
| Total | 71 | 100.0% |
Housing Finances in Flint Hill
Median Income by Occupancy in Flint Hill
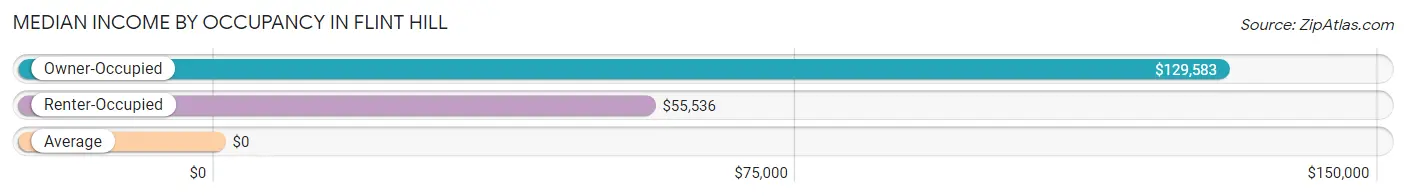
| Occupancy Type | # Households | Median Income |
| Owner-Occupied | 38 (53.5%) | $129,583 |
| Renter-Occupied | 33 (46.5%) | $55,536 |
| Average | 71 (100.0%) | $0 |
Occupancy by Householder Income Bracket in Flint Hill
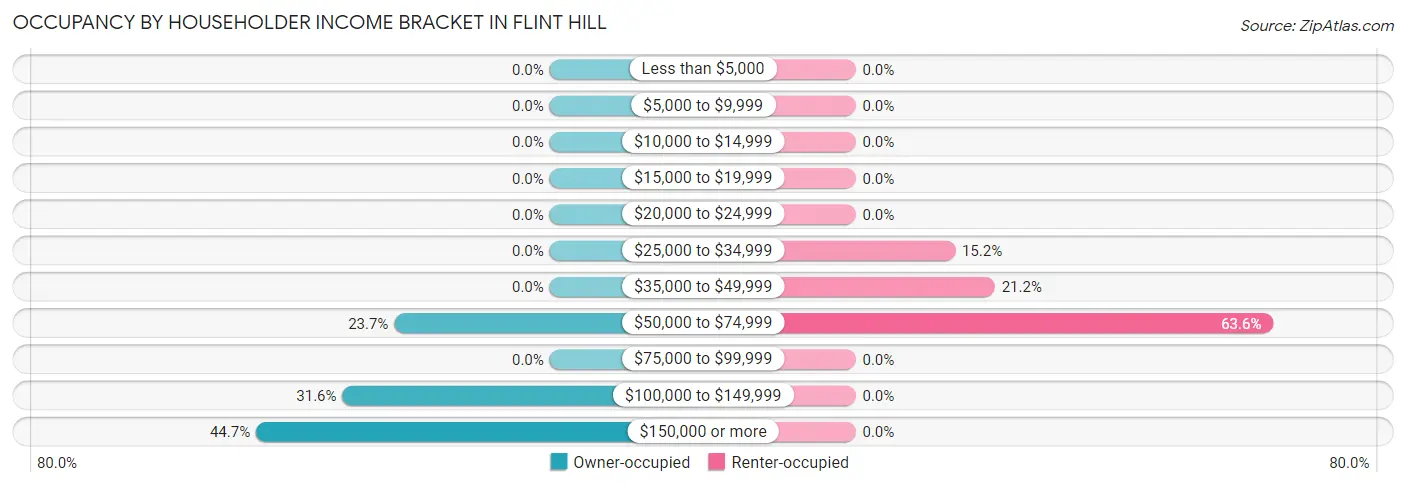
| Income Bracket | Owner-occupied | Renter-occupied |
| Less than $5,000 | 0 (0.0%) | 0 (0.0%) |
| $5,000 to $9,999 | 0 (0.0%) | 0 (0.0%) |
| $10,000 to $14,999 | 0 (0.0%) | 0 (0.0%) |
| $15,000 to $19,999 | 0 (0.0%) | 0 (0.0%) |
| $20,000 to $24,999 | 0 (0.0%) | 0 (0.0%) |
| $25,000 to $34,999 | 0 (0.0%) | 5 (15.1%) |
| $35,000 to $49,999 | 0 (0.0%) | 7 (21.2%) |
| $50,000 to $74,999 | 9 (23.7%) | 21 (63.6%) |
| $75,000 to $99,999 | 0 (0.0%) | 0 (0.0%) |
| $100,000 to $149,999 | 12 (31.6%) | 0 (0.0%) |
| $150,000 or more | 17 (44.7%) | 0 (0.0%) |
| Total | 38 (100.0%) | 33 (100.0%) |
Monthly Housing Cost Tiers in Flint Hill
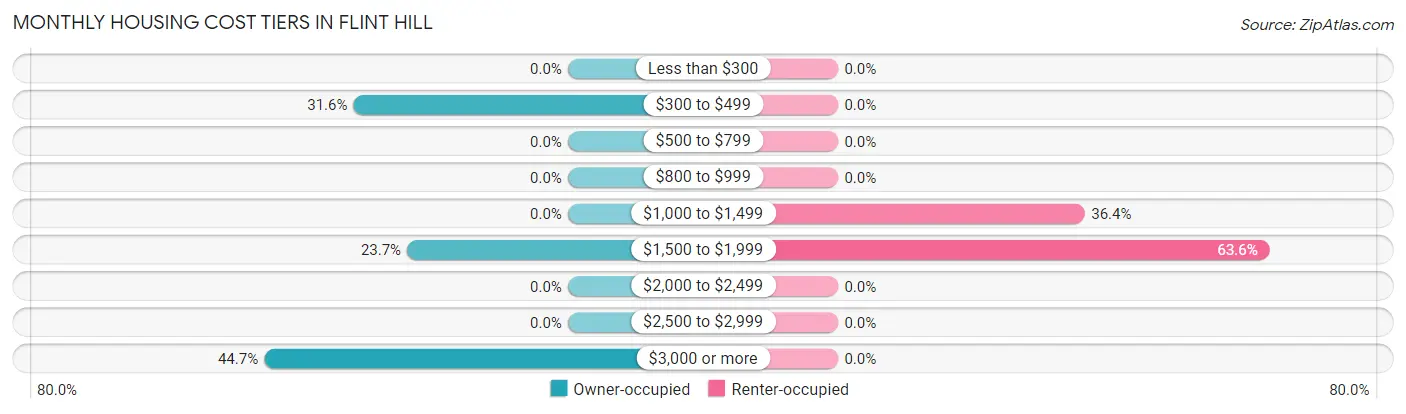
| Monthly Cost | Owner-occupied | Renter-occupied |
| Less than $300 | 0 (0.0%) | 0 (0.0%) |
| $300 to $499 | 12 (31.6%) | 0 (0.0%) |
| $500 to $799 | 0 (0.0%) | 0 (0.0%) |
| $800 to $999 | 0 (0.0%) | 0 (0.0%) |
| $1,000 to $1,499 | 0 (0.0%) | 12 (36.4%) |
| $1,500 to $1,999 | 9 (23.7%) | 21 (63.6%) |
| $2,000 to $2,499 | 0 (0.0%) | 0 (0.0%) |
| $2,500 to $2,999 | 0 (0.0%) | 0 (0.0%) |
| $3,000 or more | 17 (44.7%) | 0 (0.0%) |
| Total | 38 (100.0%) | 33 (100.0%) |
Physical Housing Characteristics in Flint Hill
Housing Structures in Flint Hill
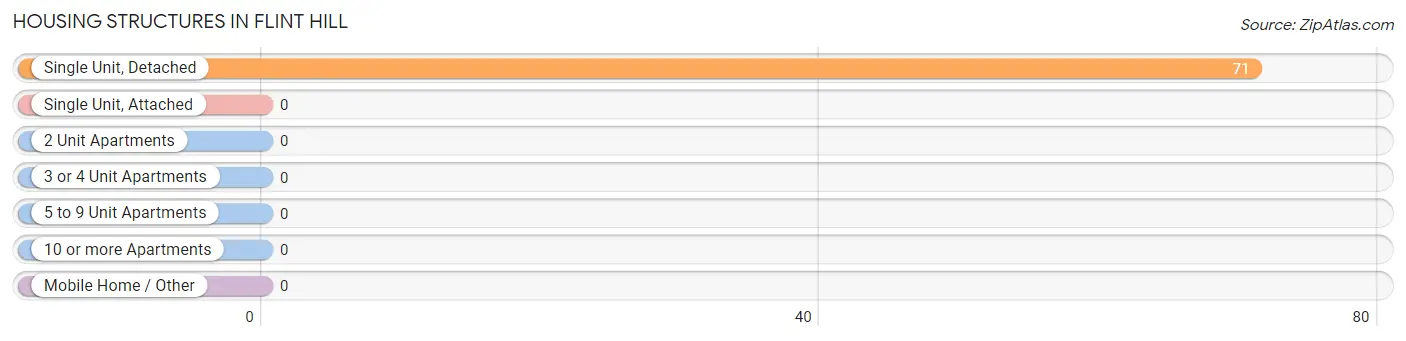
| Structure Type | # Housing Units | % Housing Units |
| Single Unit, Detached | 71 | 100.0% |
| Single Unit, Attached | 0 | 0.0% |
| 2 Unit Apartments | 0 | 0.0% |
| 3 or 4 Unit Apartments | 0 | 0.0% |
| 5 to 9 Unit Apartments | 0 | 0.0% |
| 10 or more Apartments | 0 | 0.0% |
| Mobile Home / Other | 0 | 0.0% |
| Total | 71 | 100.0% |
Housing Structures by Occupancy in Flint Hill
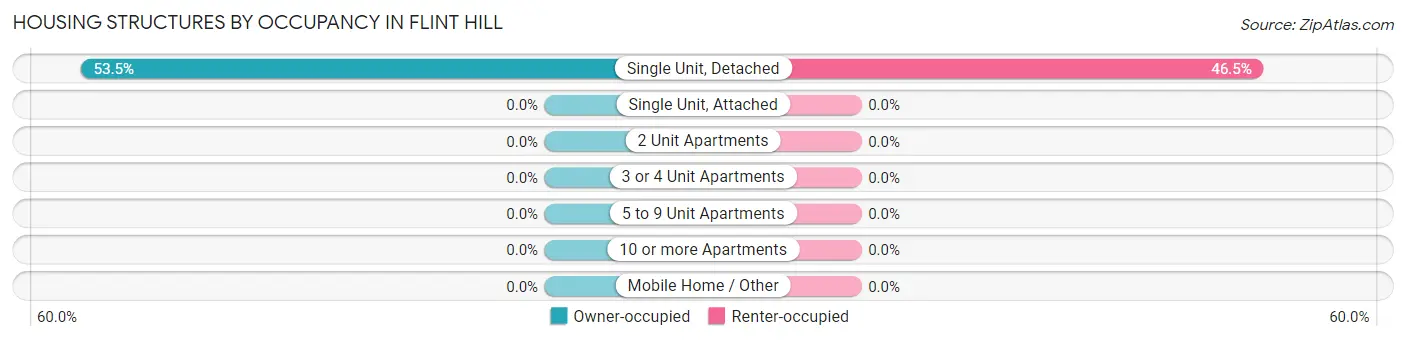
| Structure Type | Owner-occupied | Renter-occupied |
| Single Unit, Detached | 38 (53.5%) | 33 (46.5%) |
| Single Unit, Attached | 0 (0.0%) | 0 (0.0%) |
| 2 Unit Apartments | 0 (0.0%) | 0 (0.0%) |
| 3 or 4 Unit Apartments | 0 (0.0%) | 0 (0.0%) |
| 5 to 9 Unit Apartments | 0 (0.0%) | 0 (0.0%) |
| 10 or more Apartments | 0 (0.0%) | 0 (0.0%) |
| Mobile Home / Other | 0 (0.0%) | 0 (0.0%) |
| Total | 38 (53.5%) | 33 (46.5%) |
Housing Structures by Number of Rooms in Flint Hill
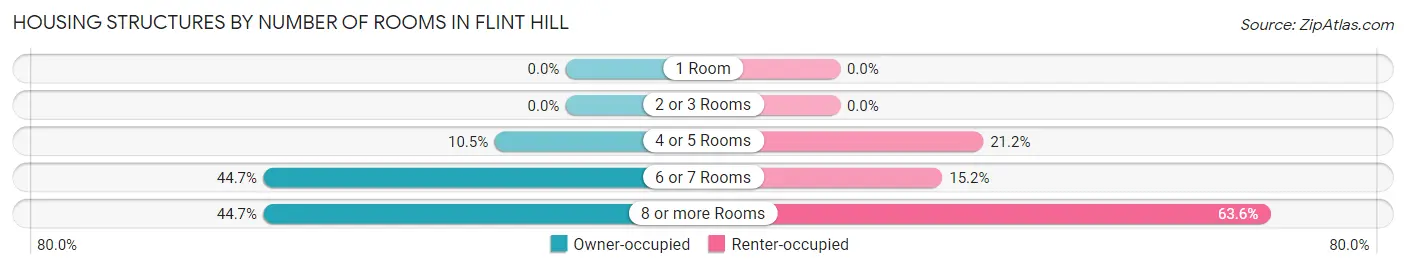
| Number of Rooms | Owner-occupied | Renter-occupied |
| 1 Room | 0 (0.0%) | 0 (0.0%) |
| 2 or 3 Rooms | 0 (0.0%) | 0 (0.0%) |
| 4 or 5 Rooms | 4 (10.5%) | 7 (21.2%) |
| 6 or 7 Rooms | 17 (44.7%) | 5 (15.1%) |
| 8 or more Rooms | 17 (44.7%) | 21 (63.6%) |
| Total | 38 (100.0%) | 33 (100.0%) |
Housing Structure by Heating Type in Flint Hill
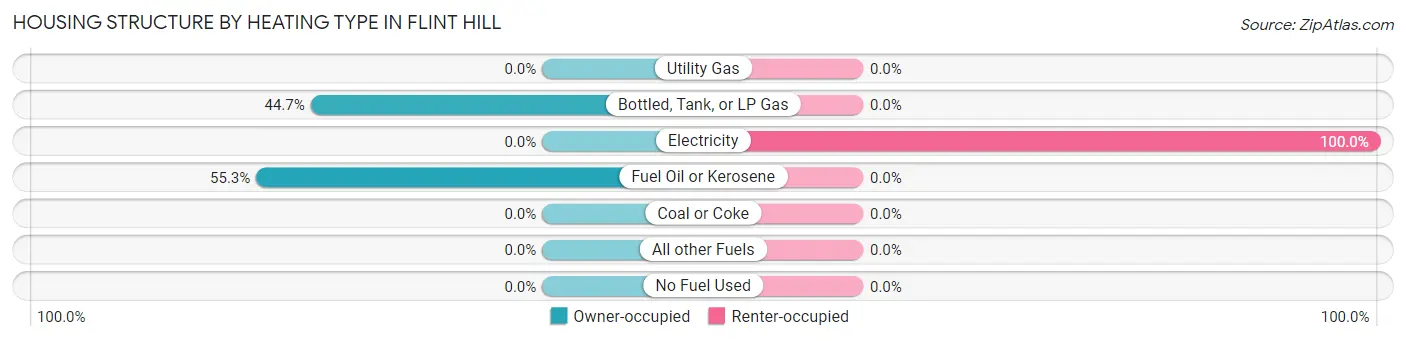
| Heating Type | Owner-occupied | Renter-occupied |
| Utility Gas | 0 (0.0%) | 0 (0.0%) |
| Bottled, Tank, or LP Gas | 17 (44.7%) | 0 (0.0%) |
| Electricity | 0 (0.0%) | 33 (100.0%) |
| Fuel Oil or Kerosene | 21 (55.3%) | 0 (0.0%) |
| Coal or Coke | 0 (0.0%) | 0 (0.0%) |
| All other Fuels | 0 (0.0%) | 0 (0.0%) |
| No Fuel Used | 0 (0.0%) | 0 (0.0%) |
| Total | 38 (100.0%) | 33 (100.0%) |
Household Vehicle Usage in Flint Hill
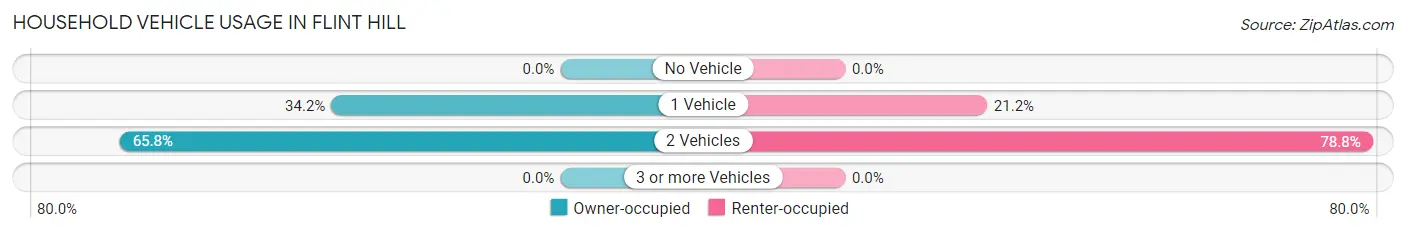
| Vehicles per Household | Owner-occupied | Renter-occupied |
| No Vehicle | 0 (0.0%) | 0 (0.0%) |
| 1 Vehicle | 13 (34.2%) | 7 (21.2%) |
| 2 Vehicles | 25 (65.8%) | 26 (78.8%) |
| 3 or more Vehicles | 0 (0.0%) | 0 (0.0%) |
| Total | 38 (100.0%) | 33 (100.0%) |
Real Estate & Mortgages in Flint Hill
Real Estate and Mortgage Overview in Flint Hill
| Characteristic | Without Mortgage | With Mortgage |
| Housing Units | 21 | 17 |
| Median Property Value | - | - |
| Median Household Income | - | - |
| Monthly Housing Costs | - | - |
| Real Estate Taxes | - | - |
Property Value by Mortgage Status in Flint Hill
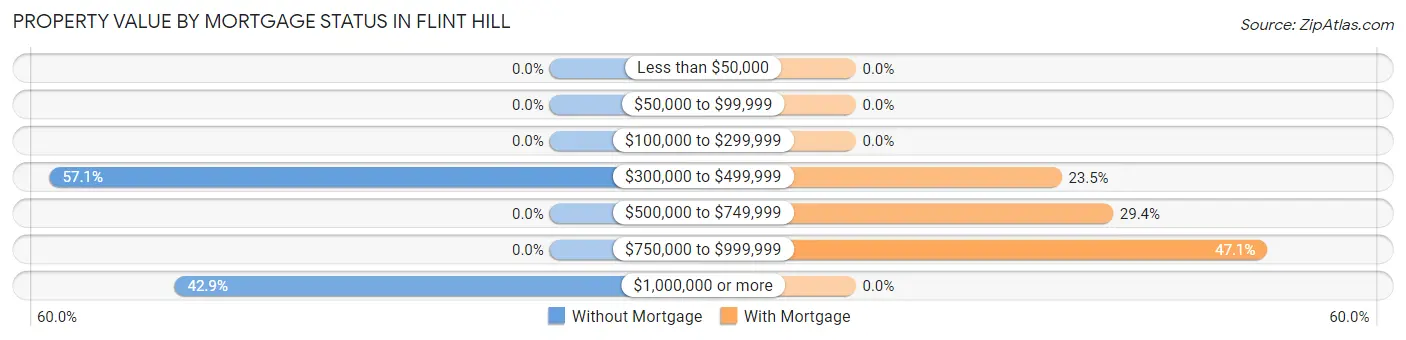
| Property Value | Without Mortgage | With Mortgage |
| Less than $50,000 | 0 (0.0%) | 0 (0.0%) |
| $50,000 to $99,999 | 0 (0.0%) | 0 (0.0%) |
| $100,000 to $299,999 | 0 (0.0%) | 0 (0.0%) |
| $300,000 to $499,999 | 12 (57.1%) | 4 (23.5%) |
| $500,000 to $749,999 | 0 (0.0%) | 5 (29.4%) |
| $750,000 to $999,999 | 0 (0.0%) | 8 (47.1%) |
| $1,000,000 or more | 9 (42.9%) | 0 (0.0%) |
| Total | 21 (100.0%) | 17 (100.0%) |
Household Income by Mortgage Status in Flint Hill
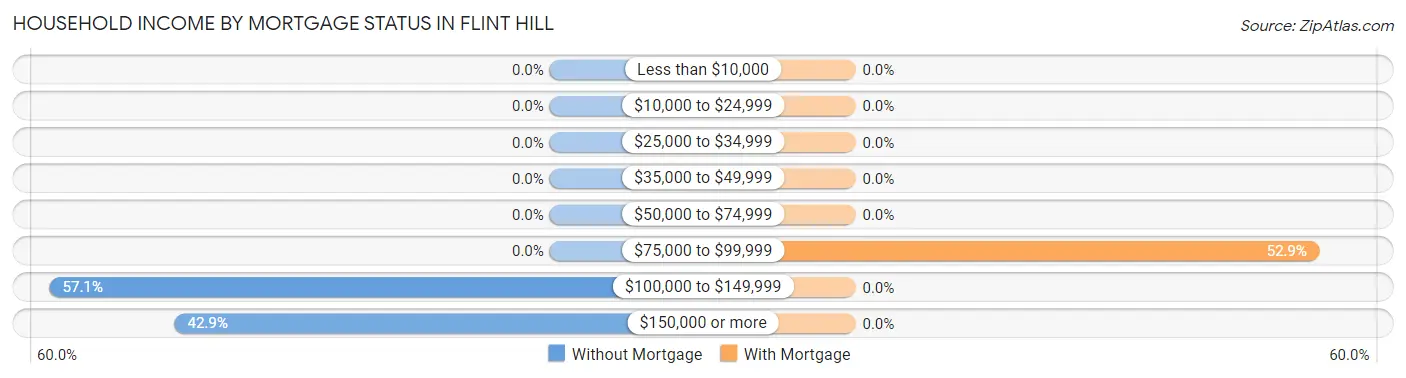
| Household Income | Without Mortgage | With Mortgage |
| Less than $10,000 | 0 (0.0%) | 0 (0.0%) |
| $10,000 to $24,999 | 0 (0.0%) | 0 (0.0%) |
| $25,000 to $34,999 | 0 (0.0%) | 0 (0.0%) |
| $35,000 to $49,999 | 0 (0.0%) | 0 (0.0%) |
| $50,000 to $74,999 | 0 (0.0%) | 0 (0.0%) |
| $75,000 to $99,999 | 0 (0.0%) | 9 (52.9%) |
| $100,000 to $149,999 | 12 (57.1%) | 0 (0.0%) |
| $150,000 or more | 9 (42.9%) | 0 (0.0%) |
| Total | 21 (100.0%) | 17 (100.0%) |
Property Value to Household Income Ratio in Flint Hill
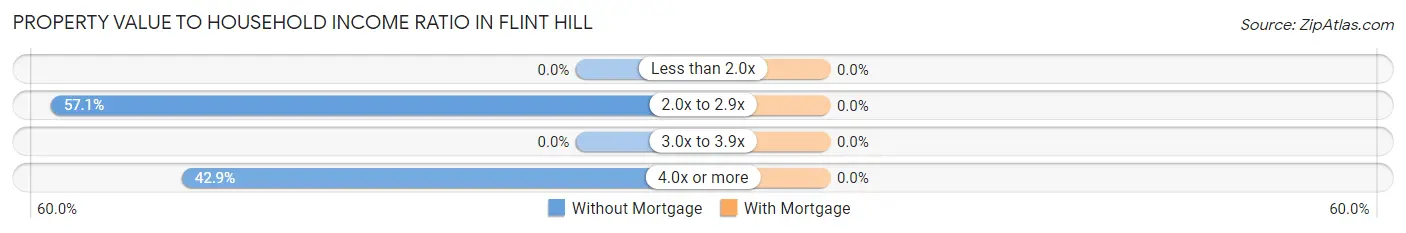
| Value-to-Income Ratio | Without Mortgage | With Mortgage |
| Less than 2.0x | 0 (0.0%) | 0 (0.0%) |
| 2.0x to 2.9x | 12 (57.1%) | 0 (0.0%) |
| 3.0x to 3.9x | 0 (0.0%) | 0 (0.0%) |
| 4.0x or more | 9 (42.9%) | 0 (0.0%) |
| Total | 21 (100.0%) | 17 (100.0%) |
Real Estate Taxes by Mortgage Status in Flint Hill
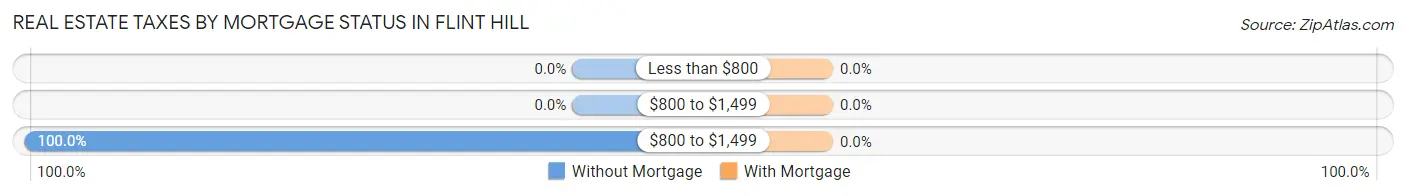
| Property Taxes | Without Mortgage | With Mortgage |
| Less than $800 | 0 (0.0%) | 0 (0.0%) |
| $800 to $1,499 | 0 (0.0%) | 0 (0.0%) |
| $800 to $1,499 | 21 (100.0%) | 0 (0.0%) |
| Total | 21 (100.0%) | 17 (100.0%) |
Health & Disability in Flint Hill
Health Insurance Coverage by Age in Flint Hill
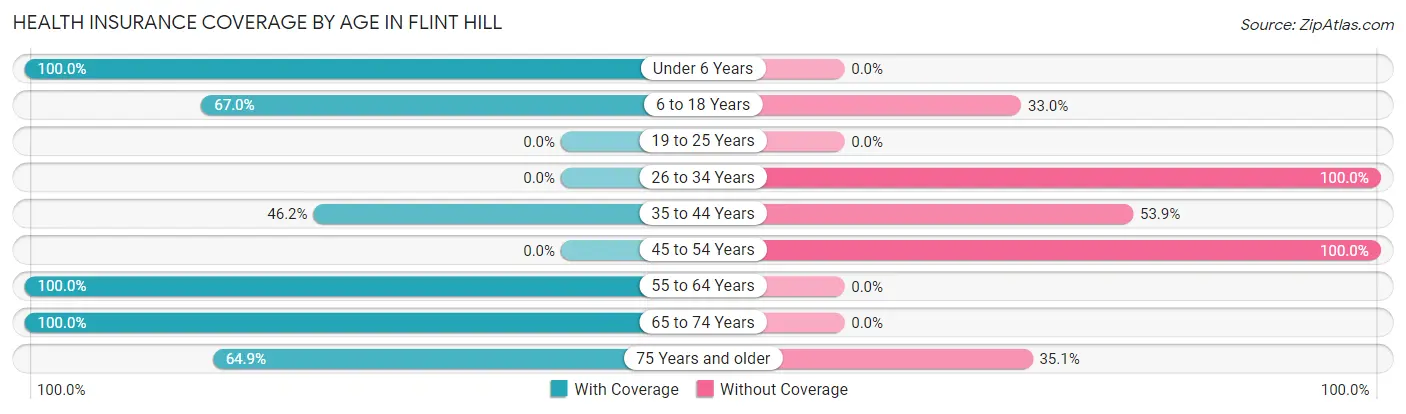
| Age Bracket | With Coverage | Without Coverage |
| Under 6 Years | 48 (100.0%) | 0 (0.0%) |
| 6 to 18 Years | 61 (67.0%) | 30 (33.0%) |
| 19 to 25 Years | 0 (0.0%) | 0 (0.0%) |
| 26 to 34 Years | 0 (0.0%) | 36 (100.0%) |
| 35 to 44 Years | 18 (46.2%) | 21 (53.8%) |
| 45 to 54 Years | 0 (0.0%) | 10 (100.0%) |
| 55 to 64 Years | 14 (100.0%) | 0 (0.0%) |
| 65 to 74 Years | 24 (100.0%) | 0 (0.0%) |
| 75 Years and older | 37 (64.9%) | 20 (35.1%) |
| Total | 202 (63.3%) | 117 (36.7%) |
Health Insurance Coverage by Citizenship Status in Flint Hill
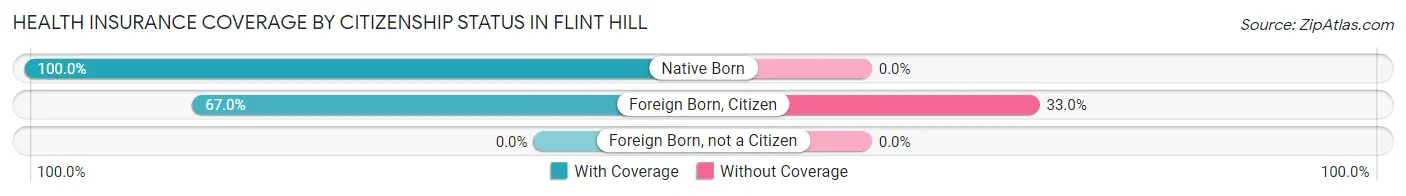
| Citizenship Status | With Coverage | Without Coverage |
| Native Born | 48 (100.0%) | 0 (0.0%) |
| Foreign Born, Citizen | 61 (67.0%) | 30 (33.0%) |
| Foreign Born, not a Citizen | 0 (0.0%) | 0 (0.0%) |
Health Insurance Coverage by Household Income in Flint Hill
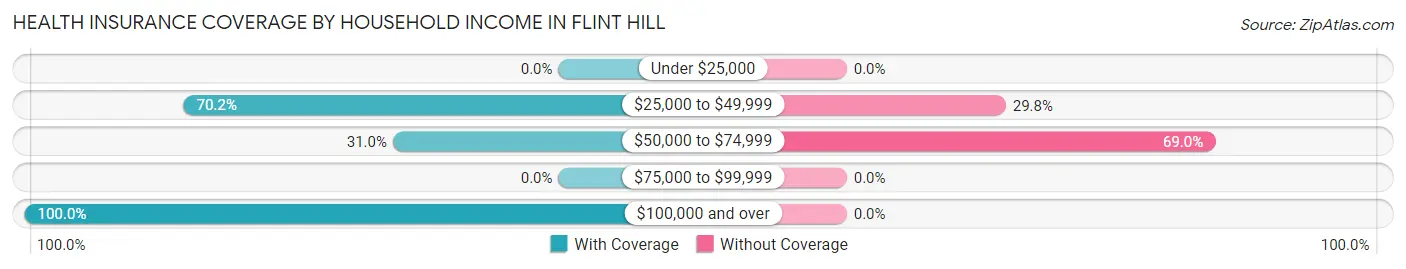
| Household Income | With Coverage | Without Coverage |
| Under $25,000 | 0 (0.0%) | 0 (0.0%) |
| $25,000 to $49,999 | 66 (70.2%) | 28 (29.8%) |
| $50,000 to $74,999 | 40 (31.0%) | 89 (69.0%) |
| $75,000 to $99,999 | 0 (0.0%) | 0 (0.0%) |
| $100,000 and over | 96 (100.0%) | 0 (0.0%) |
Public vs Private Health Insurance Coverage by Age in Flint Hill
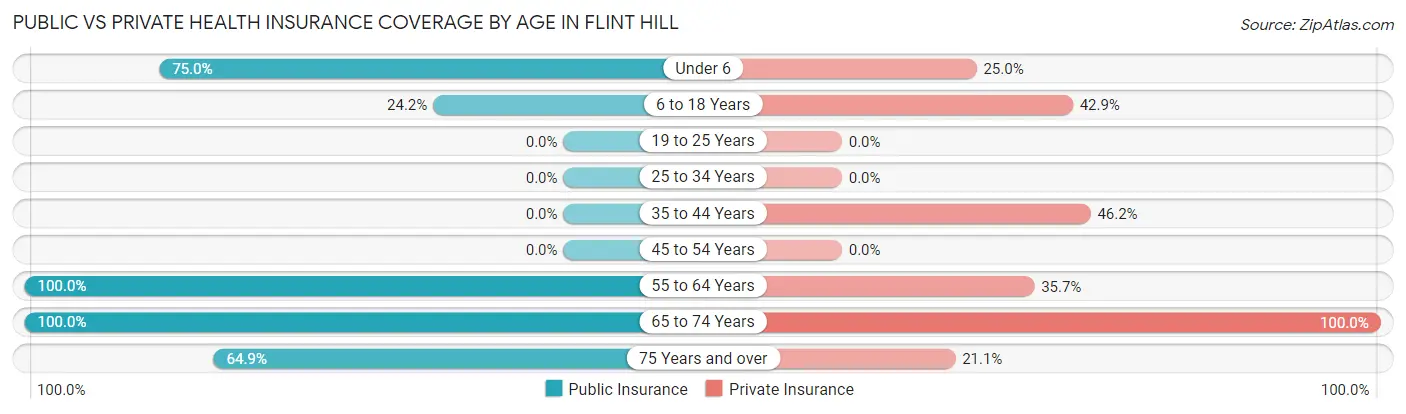
| Age Bracket | Public Insurance | Private Insurance |
| Under 6 | 36 (75.0%) | 12 (25.0%) |
| 6 to 18 Years | 22 (24.2%) | 39 (42.9%) |
| 19 to 25 Years | 0 (0.0%) | 0 (0.0%) |
| 25 to 34 Years | 0 (0.0%) | 0 (0.0%) |
| 35 to 44 Years | 0 (0.0%) | 18 (46.2%) |
| 45 to 54 Years | 0 (0.0%) | 0 (0.0%) |
| 55 to 64 Years | 14 (100.0%) | 5 (35.7%) |
| 65 to 74 Years | 24 (100.0%) | 24 (100.0%) |
| 75 Years and over | 37 (64.9%) | 12 (21.0%) |
| Total | 133 (41.7%) | 110 (34.5%) |
Disability Status by Sex by Age in Flint Hill
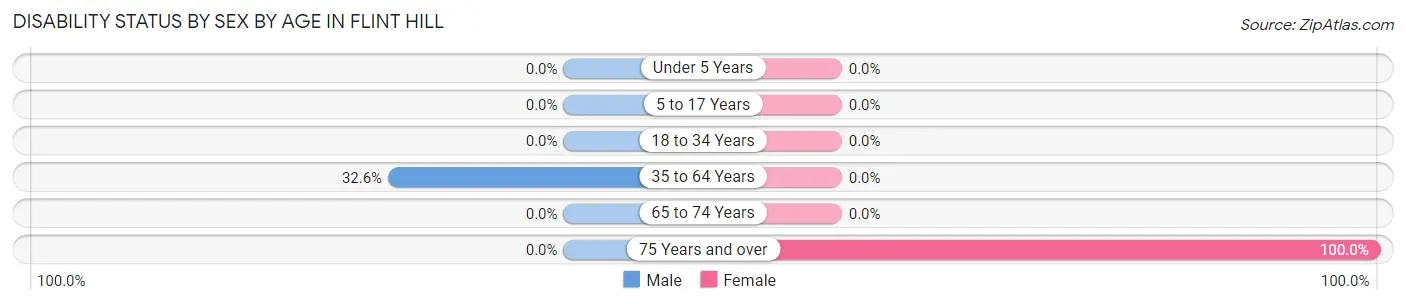
| Age Bracket | Male | Female |
| Under 5 Years | 0 (0.0%) | 0 (0.0%) |
| 5 to 17 Years | 0 (0.0%) | 0 (0.0%) |
| 18 to 34 Years | 0 (0.0%) | 0 (0.0%) |
| 35 to 64 Years | 14 (32.6%) | 0 (0.0%) |
| 65 to 74 Years | 0 (0.0%) | 0 (0.0%) |
| 75 Years and over | 0 (0.0%) | 20 (100.0%) |
Disability Class by Sex by Age in Flint Hill
Disability Class: Hearing Difficulty
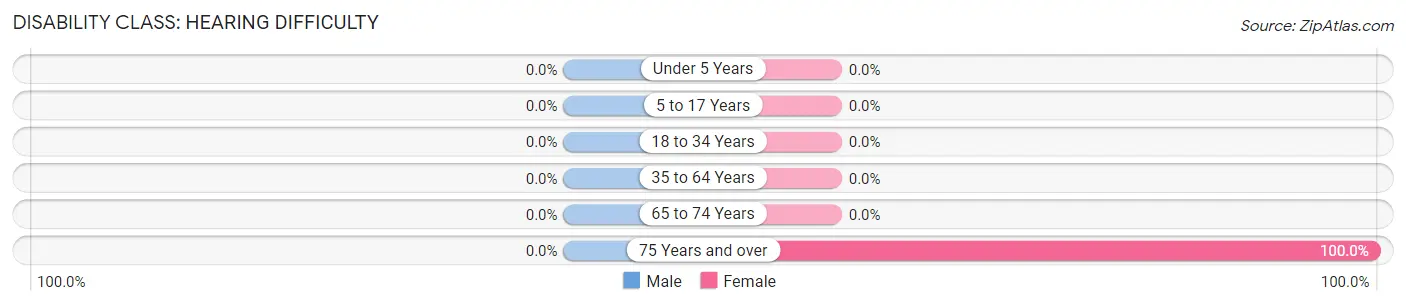
| Age Bracket | Male | Female |
| Under 5 Years | 0 (0.0%) | 0 (0.0%) |
| 5 to 17 Years | 0 (0.0%) | 0 (0.0%) |
| 18 to 34 Years | 0 (0.0%) | 0 (0.0%) |
| 35 to 64 Years | 0 (0.0%) | 0 (0.0%) |
| 65 to 74 Years | 0 (0.0%) | 0 (0.0%) |
| 75 Years and over | 0 (0.0%) | 20 (100.0%) |
Disability Class: Vision Difficulty
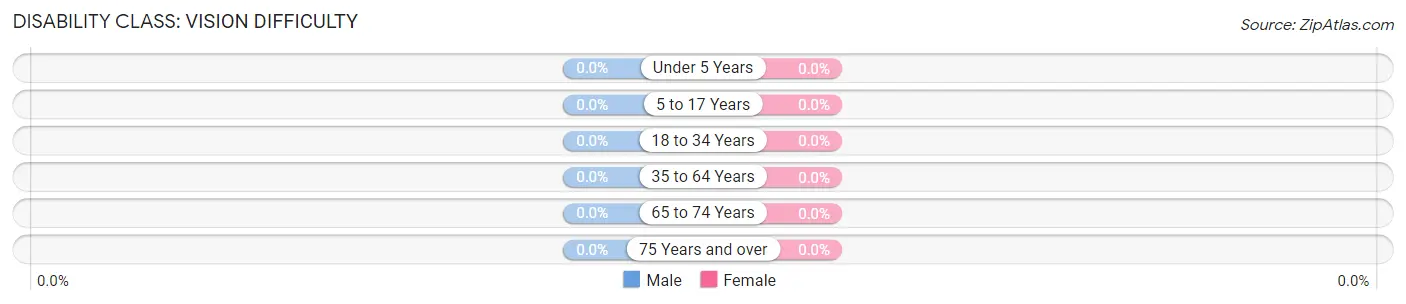
| Age Bracket | Male | Female |
| Under 5 Years | 0 (0.0%) | 0 (0.0%) |
| 5 to 17 Years | 0 (0.0%) | 0 (0.0%) |
| 18 to 34 Years | 0 (0.0%) | 0 (0.0%) |
| 35 to 64 Years | 0 (0.0%) | 0 (0.0%) |
| 65 to 74 Years | 0 (0.0%) | 0 (0.0%) |
| 75 Years and over | 0 (0.0%) | 0 (0.0%) |
Disability Class: Cognitive Difficulty
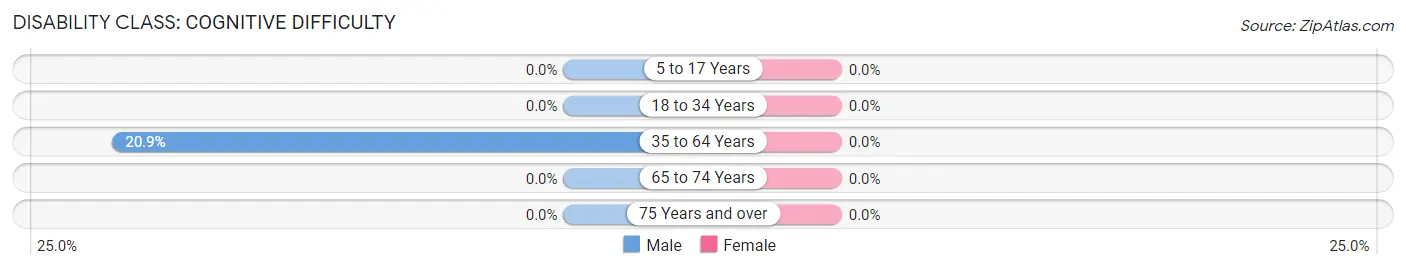
| Age Bracket | Male | Female |
| 5 to 17 Years | 0 (0.0%) | 0 (0.0%) |
| 18 to 34 Years | 0 (0.0%) | 0 (0.0%) |
| 35 to 64 Years | 9 (20.9%) | 0 (0.0%) |
| 65 to 74 Years | 0 (0.0%) | 0 (0.0%) |
| 75 Years and over | 0 (0.0%) | 0 (0.0%) |
Disability Class: Ambulatory Difficulty
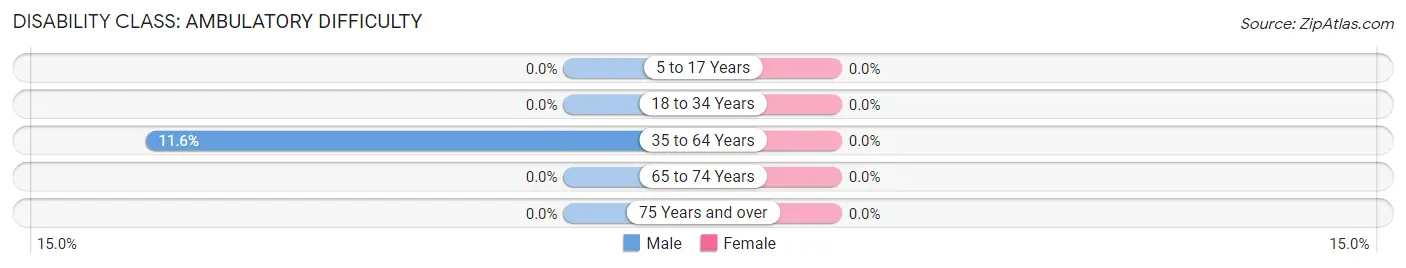
| Age Bracket | Male | Female |
| 5 to 17 Years | 0 (0.0%) | 0 (0.0%) |
| 18 to 34 Years | 0 (0.0%) | 0 (0.0%) |
| 35 to 64 Years | 5 (11.6%) | 0 (0.0%) |
| 65 to 74 Years | 0 (0.0%) | 0 (0.0%) |
| 75 Years and over | 0 (0.0%) | 0 (0.0%) |
Disability Class: Self-Care Difficulty
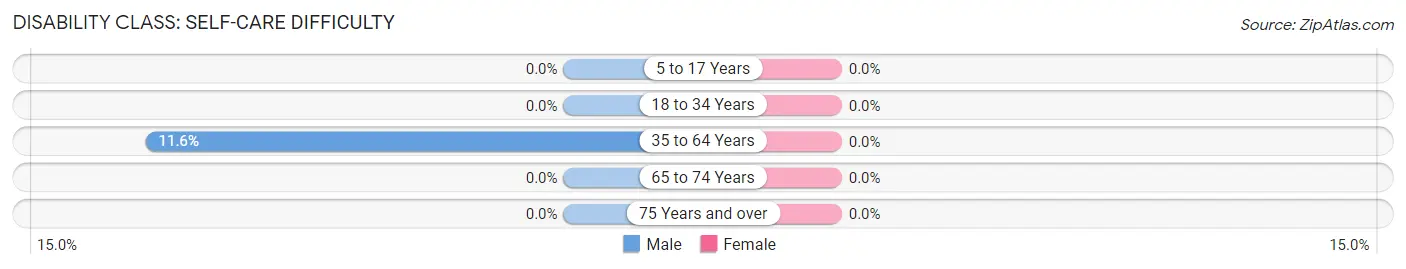
| Age Bracket | Male | Female |
| 5 to 17 Years | 0 (0.0%) | 0 (0.0%) |
| 18 to 34 Years | 0 (0.0%) | 0 (0.0%) |
| 35 to 64 Years | 5 (11.6%) | 0 (0.0%) |
| 65 to 74 Years | 0 (0.0%) | 0 (0.0%) |
| 75 Years and over | 0 (0.0%) | 0 (0.0%) |
Technology Access in Flint Hill
Computing Device Access in Flint Hill
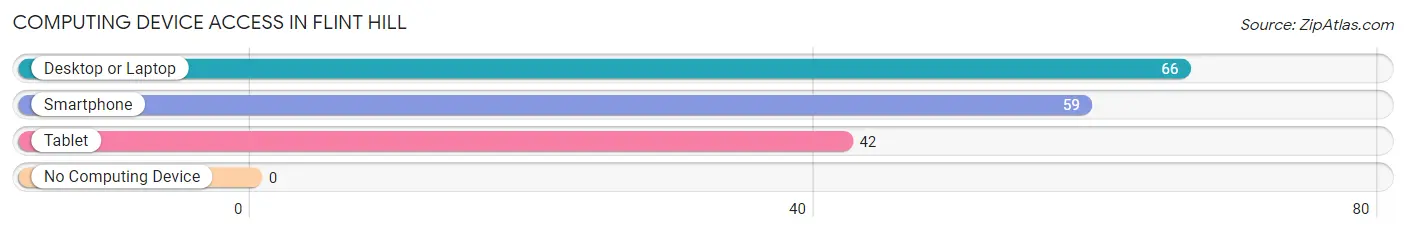
| Device Type | # Households | % Households |
| Desktop or Laptop | 66 | 93.0% |
| Smartphone | 59 | 83.1% |
| Tablet | 42 | 59.2% |
| No Computing Device | 0 | 0.0% |
| Total | 71 | 100.0% |
Internet Access in Flint Hill
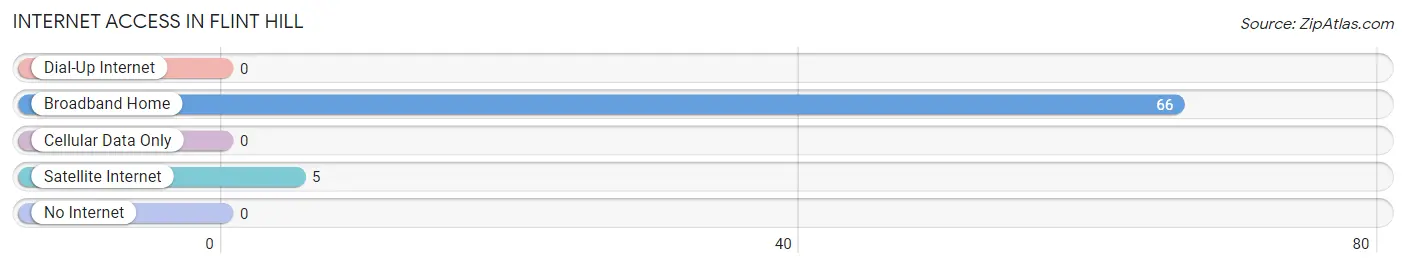
| Internet Type | # Households | % Households |
| Dial-Up Internet | 0 | 0.0% |
| Broadband Home | 66 | 93.0% |
| Cellular Data Only | 0 | 0.0% |
| Satellite Internet | 5 | 7.0% |
| No Internet | 0 | 0.0% |
| Total | 71 | 100.0% |
Flint Hill Summary
Flint Hill is a small unincorporated community located in Rappahannock County, Virginia. It is situated in the foothills of the Blue Ridge Mountains, approximately 70 miles west of Washington, D.C. The community is home to a population of approximately 500 people, and is known for its rural charm and scenic beauty.
History
The area that is now known as Flint Hill was first settled in the late 1700s by German and Scots-Irish immigrants. The community was originally known as “Flint Hill” due to the abundance of flint stones found in the area. The name was officially adopted in 1820 when the post office was established.
In the early 1800s, the area was home to a thriving agricultural industry, with tobacco, corn, wheat, and livestock being the primary crops. The community also had a number of small businesses, including a general store, a blacksmith, and a grist mill.
In the late 1800s, the area began to experience a decline in population as many of the residents moved away in search of better economic opportunities. This trend continued until the early 1900s, when the population began to slowly increase again.
Geography
Flint Hill is located in the foothills of the Blue Ridge Mountains in Rappahannock County, Virginia. The community is situated on the banks of the Thornton River, which flows through the area. The terrain is mostly rolling hills, with some flat areas near the river. The climate is temperate, with hot summers and cold winters.
Economy
The economy of Flint Hill is largely based on agriculture and tourism. The area is home to a number of small farms, which produce a variety of crops, including corn, wheat, and tobacco. The community also has a number of small businesses, including a general store, a blacksmith, and a grist mill.
In recent years, the area has become increasingly popular with tourists, who come to enjoy the rural charm and scenic beauty of the area. The community is home to a number of bed and breakfasts, as well as a number of wineries and vineyards.
Demographics
As of the 2010 census, the population of Flint Hill was 498. The racial makeup of the community was 95.2% White, 1.2% African American, 0.4% Native American, 0.2% Asian, and 2.8% from other races. The median household income was $45,000, and the median age was 44.
Conclusion
Flint Hill is a small unincorporated community located in Rappahannock County, Virginia. It is situated in the foothills of the Blue Ridge Mountains, and is known for its rural charm and scenic beauty. The economy of the area is largely based on agriculture and tourism, and the population is mostly White. The area is popular with tourists, who come to enjoy the rural charm and scenic beauty of the area.
Common Questions
What is Per Capita Income in Flint Hill?
Per Capita income in Flint Hill is $24,976.
What is Inequality or Gini Index in Flint Hill?
Inequality or Gini Index in Flint Hill is 0.34.
What is the Total Population of Flint Hill?
Total Population of Flint Hill is 319.
What is the Total Male Population of Flint Hill?
Total Male Population of Flint Hill is 174.
What is the Total Female Population of Flint Hill?
Total Female Population of Flint Hill is 145.
What is the Ratio of Males per 100 Females in Flint Hill?
There are 120.00 Males per 100 Females in Flint Hill.
What is the Ratio of Females per 100 Males in Flint Hill?
There are 83.33 Females per 100 Males in Flint Hill.
What is the Median Population Age in Flint Hill?
Median Population Age in Flint Hill is 28.0 Years.
What is the Average Family Size in Flint Hill
Average Family Size in Flint Hill is 4.7 People.
What is the Average Household Size in Flint Hill
Average Household Size in Flint Hill is 4.5 People.
How Large is the Labor Force in Flint Hill?
There are 45 People in the Labor Forcein in Flint Hill.
What is the Percentage of People in the Labor Force in Flint Hill?
25.0% of People are in the Labor Force in Flint Hill.