New Harmony, UT Map & Demographics
New Harmony Map
New Harmony Overview
$47,599
PER CAPITA INCOME
$102,188
AVG FAMILY INCOME
$80,486
AVG HOUSEHOLD INCOME
32.9%
WAGE / INCOME GAP [ % ]
67.1¢/ $1
WAGE / INCOME GAP [ $ ]
0.47
INEQUALITY / GINI INDEX
356
TOTAL POPULATION
192
MALE POPULATION
164
FEMALE POPULATION
117.07
MALES / 100 FEMALES
85.42
FEMALES / 100 MALES
43.3
MEDIAN AGE
3.1
AVG FAMILY SIZE
2.6
AVG HOUSEHOLD SIZE
149
LABOR FORCE [ PEOPLE ]
53.0%
PERCENT IN LABOR FORCE
2.0%
UNEMPLOYMENT RATE
New Harmony Zip Codes
New Harmony Area Codes
Income in New Harmony
Income Overview in New Harmony
Per Capita Income in New Harmony is $47,599, while median incomes of families and households are $102,188 and $80,486 respectively.
| Characteristic | Number | Measure |
| Per Capita Income | 356 | $47,599 |
| Median Family Income | 101 | $102,188 |
| Mean Family Income | 101 | $139,990 |
| Median Household Income | 137 | $80,486 |
| Mean Household Income | 137 | $120,168 |
| Income Deficit | 101 | $0 |
| Wage / Income Gap (%) | 356 | 32.91% |
| Wage / Income Gap ($) | 356 | 67.09¢ per $1 |
| Gini / Inequality Index | 356 | 0.47 |
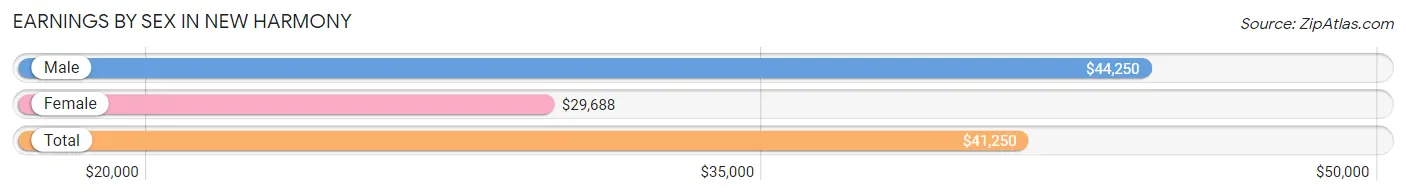
Earnings by Sex in New Harmony
Average Earnings in New Harmony are $41,250, $44,250 for men and $29,688 for women, a difference of 32.9%.
| Sex | Number | Average Earnings |
| Male | 85 (48.8%) | $44,250 |
| Female | 89 (51.1%) | $29,688 |
| Total | 174 (100.0%) | $41,250 |
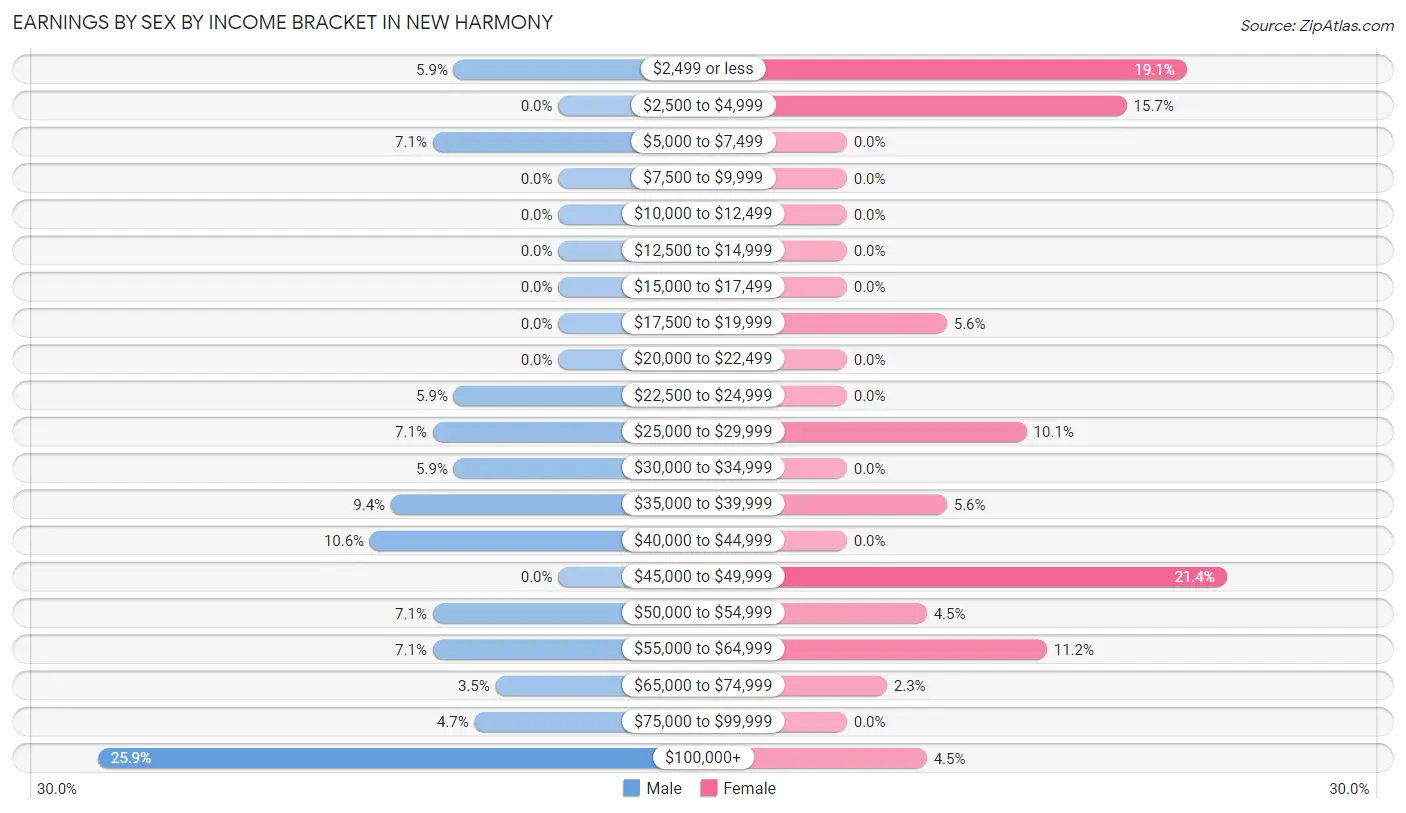
Earnings by Sex by Income Bracket in New Harmony
The most common earnings brackets in New Harmony are $100,000+ for men (22 | 25.9%) and $45,000 to $49,999 for women (19 | 21.3%).
| Income | Male | Female |
| $2,499 or less | 5 (5.9%) | 17 (19.1%) |
| $2,500 to $4,999 | 0 (0.0%) | 14 (15.7%) |
| $5,000 to $7,499 | 6 (7.1%) | 0 (0.0%) |
| $7,500 to $9,999 | 0 (0.0%) | 0 (0.0%) |
| $10,000 to $12,499 | 0 (0.0%) | 0 (0.0%) |
| $12,500 to $14,999 | 0 (0.0%) | 0 (0.0%) |
| $15,000 to $17,499 | 0 (0.0%) | 0 (0.0%) |
| $17,500 to $19,999 | 0 (0.0%) | 5 (5.6%) |
| $20,000 to $22,499 | 0 (0.0%) | 0 (0.0%) |
| $22,500 to $24,999 | 5 (5.9%) | 0 (0.0%) |
| $25,000 to $29,999 | 6 (7.1%) | 9 (10.1%) |
| $30,000 to $34,999 | 5 (5.9%) | 0 (0.0%) |
| $35,000 to $39,999 | 8 (9.4%) | 5 (5.6%) |
| $40,000 to $44,999 | 9 (10.6%) | 0 (0.0%) |
| $45,000 to $49,999 | 0 (0.0%) | 19 (21.3%) |
| $50,000 to $54,999 | 6 (7.1%) | 4 (4.5%) |
| $55,000 to $64,999 | 6 (7.1%) | 10 (11.2%) |
| $65,000 to $74,999 | 3 (3.5%) | 2 (2.2%) |
| $75,000 to $99,999 | 4 (4.7%) | 0 (0.0%) |
| $100,000+ | 22 (25.9%) | 4 (4.5%) |
| Total | 85 (100.0%) | 89 (100.0%) |
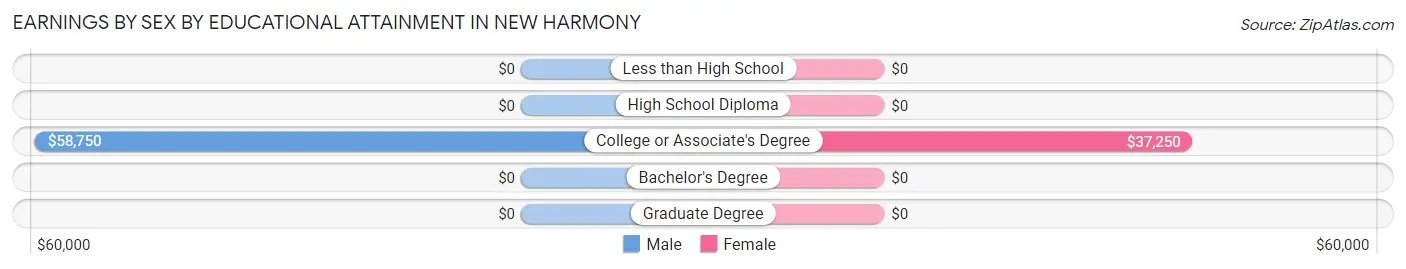
Earnings by Sex by Educational Attainment in New Harmony
Average earnings in New Harmony are $51,563 for men and $35,750 for women, a difference of 30.7%. Men with an educational attainment of college or associate's degree enjoy the highest average annual earnings of $58,750, while those with college or associate's degree education earn the least with $58,750. Women with an educational attainment of college or associate's degree earn the most with the average annual earnings of $37,250, while those with college or associate's degree education have the smallest earnings of $37,250.
| Educational Attainment | Male Income | Female Income |
| Less than High School | - | - |
| High School Diploma | - | - |
| College or Associate's Degree | $58,750 | $37,250 |
| Bachelor's Degree | - | - |
| Graduate Degree | - | - |
| Total | $51,563 | $35,750 |
Family Income in New Harmony
Family Income Brackets in New Harmony
According to the New Harmony family income data, there are 30 families falling into the $100,000 to $149,999 income range, which is the most common income bracket and makes up 29.7% of all families.
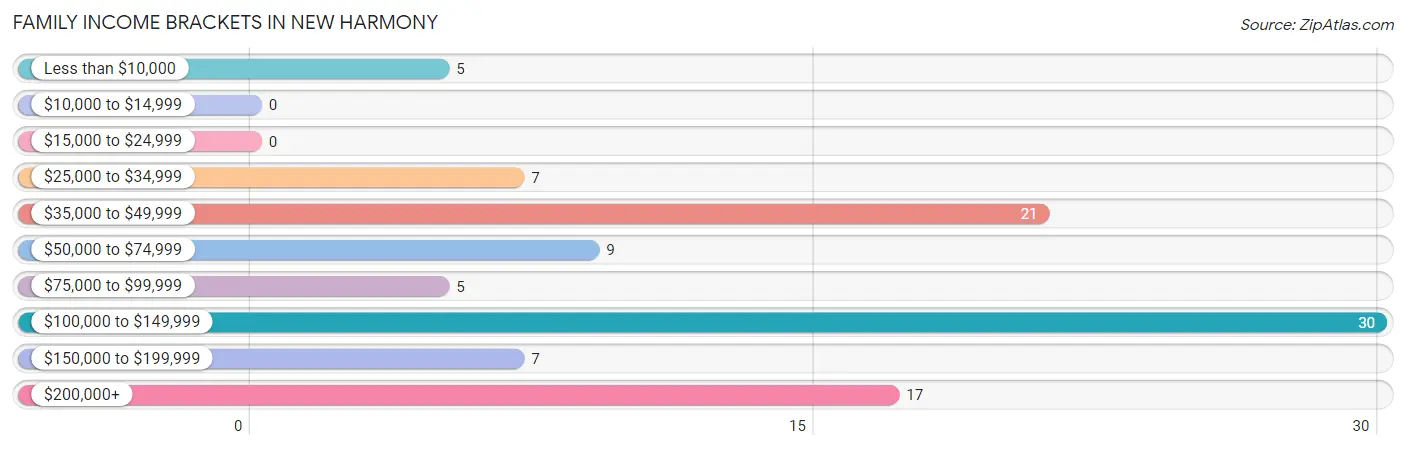
| Income Bracket | # Families | % Families |
| Less than $10,000 | 5 | 5.0% |
| $10,000 to $14,999 | 0 | 0.0% |
| $15,000 to $24,999 | 0 | 0.0% |
| $25,000 to $34,999 | 7 | 6.9% |
| $35,000 to $49,999 | 21 | 20.8% |
| $50,000 to $74,999 | 9 | 8.9% |
| $75,000 to $99,999 | 5 | 5.0% |
| $100,000 to $149,999 | 30 | 29.7% |
| $150,000 to $199,999 | 7 | 6.9% |
| $200,000+ | 17 | 16.8% |
Family Income by Famaliy Size in New Harmony
5-person families (21 | 20.8%) account for the highest median family income in New Harmony with $250,001 per family, while 5-person families (21 | 20.8%) have the highest median income of $50,000 per family member.
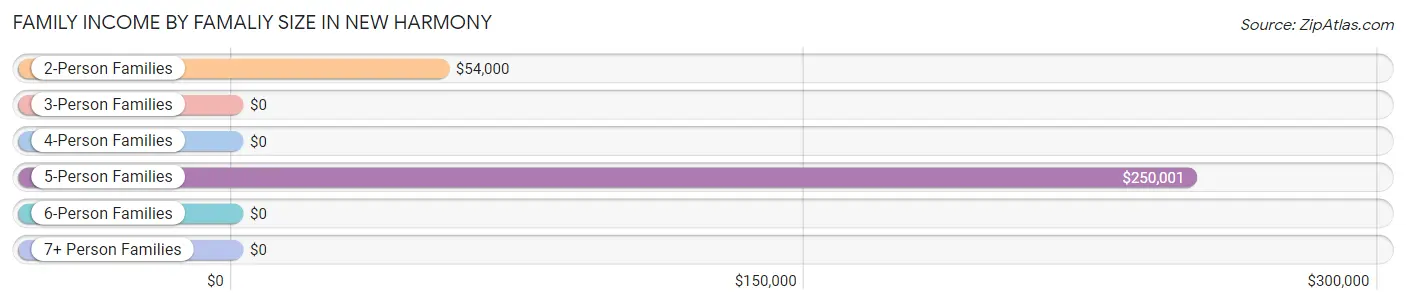
| Income Bracket | # Families | Median Income |
| 2-Person Families | 56 (55.4%) | $54,000 |
| 3-Person Families | 11 (10.9%) | $0 |
| 4-Person Families | 13 (12.9%) | $0 |
| 5-Person Families | 21 (20.8%) | $250,001 |
| 6-Person Families | 0 (0.0%) | $0 |
| 7+ Person Families | 0 (0.0%) | $0 |
| Total | 101 (100.0%) | $102,188 |
Family Income by Number of Earners in New Harmony
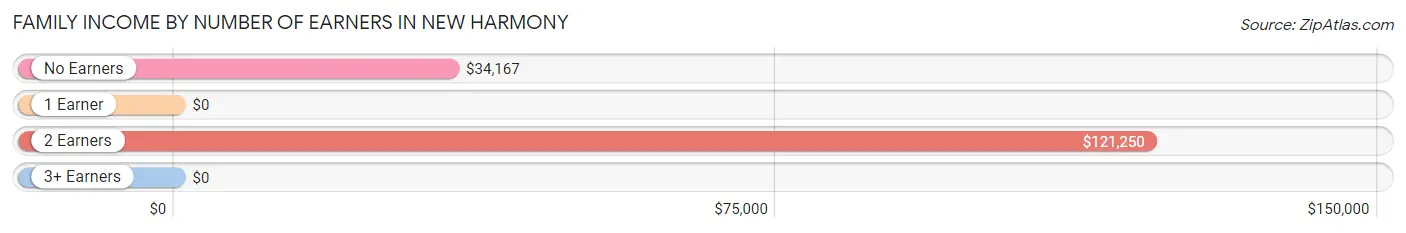
| Number of Earners | # Families | Median Income |
| No Earners | 22 (21.8%) | $34,167 |
| 1 Earner | 18 (17.8%) | $0 |
| 2 Earners | 58 (57.4%) | $121,250 |
| 3+ Earners | 3 (3.0%) | $0 |
| Total | 101 (100.0%) | $102,188 |
Household Income in New Harmony
Household Income Brackets in New Harmony
With 31 households falling in the category, the $35,000 to $49,999 income range is the most frequent in New Harmony, accounting for 22.6% of all households.
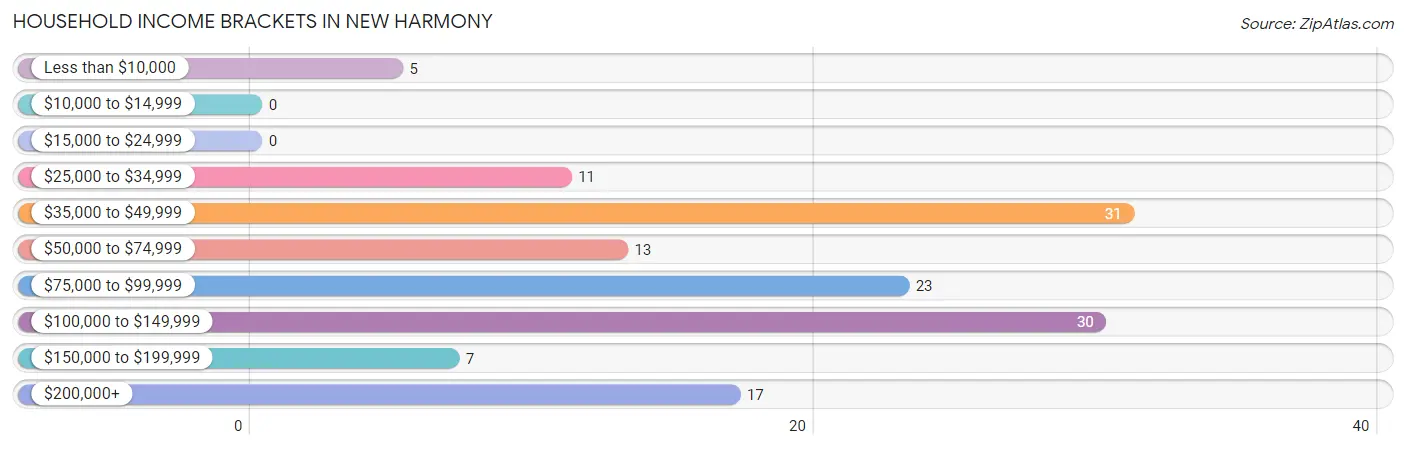
| Income Bracket | # Households | % Households |
| Less than $10,000 | 5 | 3.6% |
| $10,000 to $14,999 | 0 | 0.0% |
| $15,000 to $24,999 | 0 | 0.0% |
| $25,000 to $34,999 | 11 | 8.0% |
| $35,000 to $49,999 | 31 | 22.6% |
| $50,000 to $74,999 | 13 | 9.5% |
| $75,000 to $99,999 | 23 | 16.8% |
| $100,000 to $149,999 | 30 | 21.9% |
| $150,000 to $199,999 | 7 | 5.1% |
| $200,000+ | 17 | 12.4% |
Household Income by Householder Age in New Harmony
The median household income in New Harmony is $80,486, with the highest median household income of $81,042 found in the 65+ years age bracket for the primary householder. A total of 55 households (40.2%) fall into this category. Meanwhile, the 15 to 24 years age bracket for the primary householder has the lowest median household income of $0, with 3 households (2.2%) in this group.
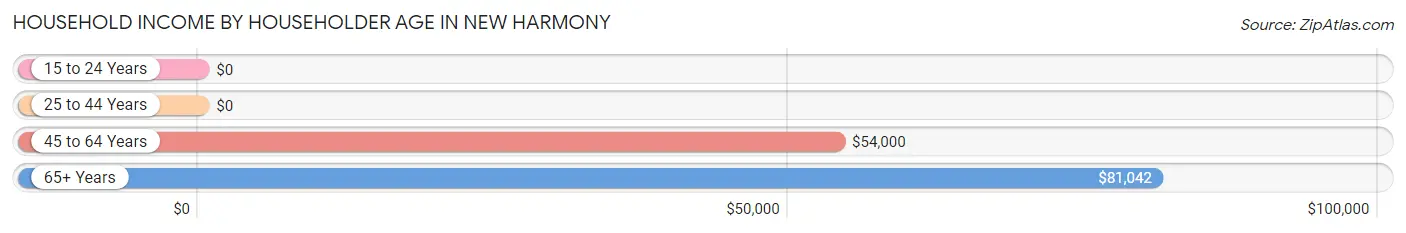
| Income Bracket | # Households | Median Income |
| 15 to 24 Years | 3 (2.2%) | $0 |
| 25 to 44 Years | 39 (28.5%) | $0 |
| 45 to 64 Years | 40 (29.2%) | $54,000 |
| 65+ Years | 55 (40.2%) | $81,042 |
| Total | 137 (100.0%) | $80,486 |
Poverty in New Harmony
Income Below Poverty by Sex and Age in New Harmony
With 2.6% poverty level for males and 5.5% for females among the residents of New Harmony, 45 to 54 year old males and 18 to 24 year old females are the most vulnerable to poverty, with 5 males (38.5%) and 4 females (100.0%) in their respective age groups living below the poverty level.
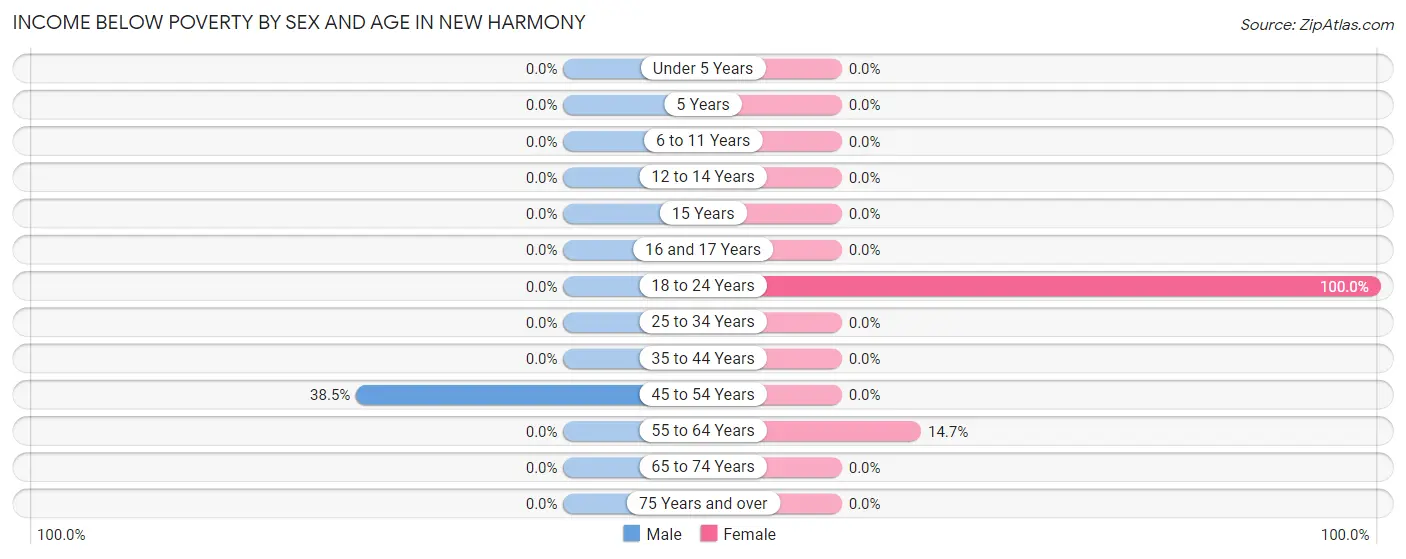
| Age Bracket | Male | Female |
| Under 5 Years | 0 (0.0%) | 0 (0.0%) |
| 5 Years | 0 (0.0%) | 0 (0.0%) |
| 6 to 11 Years | 0 (0.0%) | 0 (0.0%) |
| 12 to 14 Years | 0 (0.0%) | 0 (0.0%) |
| 15 Years | 0 (0.0%) | 0 (0.0%) |
| 16 and 17 Years | 0 (0.0%) | 0 (0.0%) |
| 18 to 24 Years | 0 (0.0%) | 4 (100.0%) |
| 25 to 34 Years | 0 (0.0%) | 0 (0.0%) |
| 35 to 44 Years | 0 (0.0%) | 0 (0.0%) |
| 45 to 54 Years | 5 (38.5%) | 0 (0.0%) |
| 55 to 64 Years | 0 (0.0%) | 5 (14.7%) |
| 65 to 74 Years | 0 (0.0%) | 0 (0.0%) |
| 75 Years and over | 0 (0.0%) | 0 (0.0%) |
| Total | 5 (2.6%) | 9 (5.5%) |
Income Above Poverty by Sex and Age in New Harmony
According to the poverty statistics in New Harmony, males aged under 5 years and females aged under 5 years are the age groups that are most secure financially, with 100.0% of males and 100.0% of females in these age groups living above the poverty line.
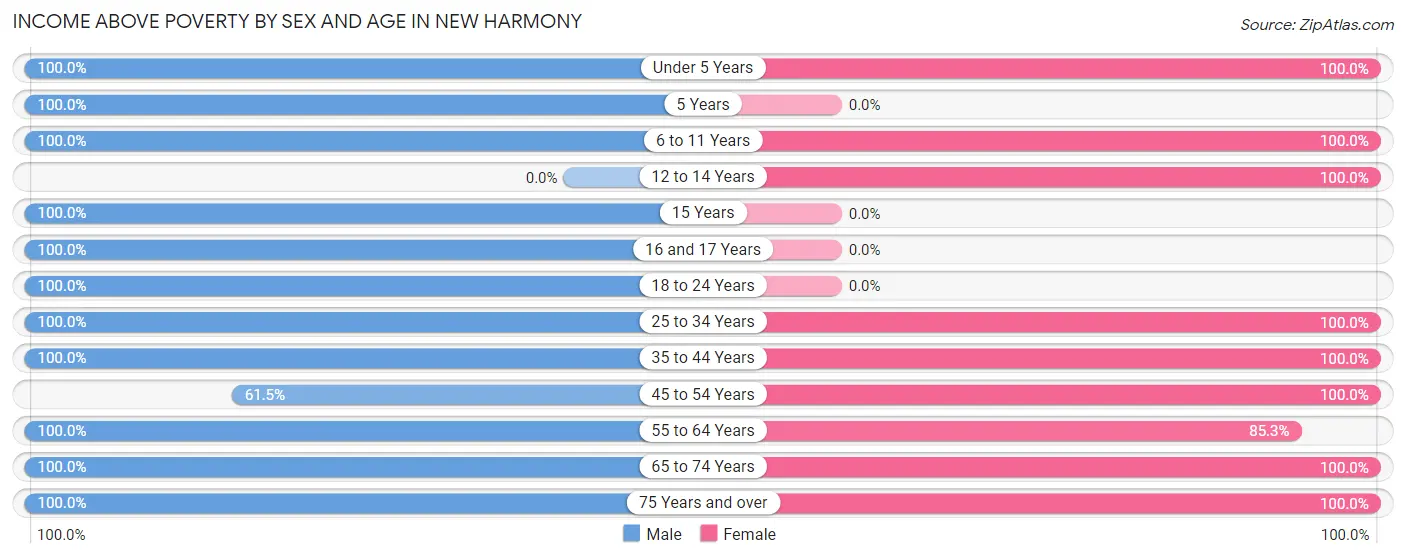
| Age Bracket | Male | Female |
| Under 5 Years | 13 (100.0%) | 9 (100.0%) |
| 5 Years | 22 (100.0%) | 0 (0.0%) |
| 6 to 11 Years | 11 (100.0%) | 8 (100.0%) |
| 12 to 14 Years | 0 (0.0%) | 3 (100.0%) |
| 15 Years | 9 (100.0%) | 0 (0.0%) |
| 16 and 17 Years | 3 (100.0%) | 0 (0.0%) |
| 18 to 24 Years | 8 (100.0%) | 0 (0.0%) |
| 25 to 34 Years | 30 (100.0%) | 29 (100.0%) |
| 35 to 44 Years | 13 (100.0%) | 25 (100.0%) |
| 45 to 54 Years | 8 (61.5%) | 14 (100.0%) |
| 55 to 64 Years | 17 (100.0%) | 29 (85.3%) |
| 65 to 74 Years | 15 (100.0%) | 13 (100.0%) |
| 75 Years and over | 38 (100.0%) | 25 (100.0%) |
| Total | 187 (97.4%) | 155 (94.5%) |
Income Below Poverty Among Married-Couple Families in New Harmony
The poverty statistics for married-couple families in New Harmony show that 5.9% or 5 of the total 85 families live below the poverty line. Families with no children have the highest poverty rate of 9.4%, comprising of 5 families. On the other hand, families with 1 or 2 children have the lowest poverty rate of 0.0%, which includes 0 families.
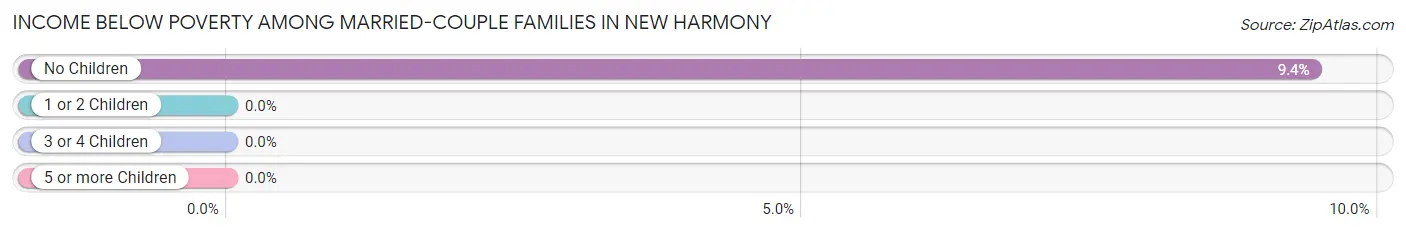
| Children | Above Poverty | Below Poverty |
| No Children | 48 (90.6%) | 5 (9.4%) |
| 1 or 2 Children | 15 (100.0%) | 0 (0.0%) |
| 3 or 4 Children | 17 (100.0%) | 0 (0.0%) |
| 5 or more Children | 0 (0.0%) | 0 (0.0%) |
| Total | 80 (94.1%) | 5 (5.9%) |
Income Below Poverty Among Single-Parent Households in New Harmony
| Children | Single Father | Single Mother |
| No Children | 0 (0.0%) | 0 (0.0%) |
| 1 or 2 Children | 0 (0.0%) | 0 (0.0%) |
| 3 or 4 Children | 0 (0.0%) | 0 (0.0%) |
| 5 or more Children | 0 (0.0%) | 0 (0.0%) |
| Total | 0 (0.0%) | 0 (0.0%) |
Income Below Poverty Among Married-Couple vs Single-Parent Households in New Harmony
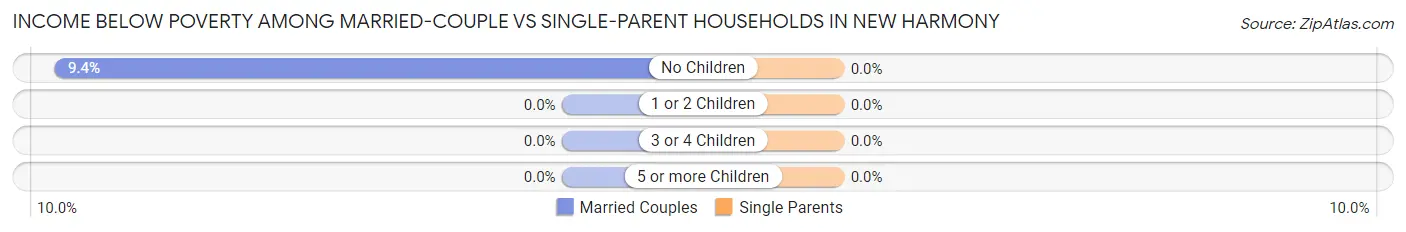
| Children | Married-Couple Families | Single-Parent Households |
| No Children | 5 (9.4%) | 0 (0.0%) |
| 1 or 2 Children | 0 (0.0%) | 0 (0.0%) |
| 3 or 4 Children | 0 (0.0%) | 0 (0.0%) |
| 5 or more Children | 0 (0.0%) | 0 (0.0%) |
| Total | 5 (5.9%) | 0 (0.0%) |
Race in New Harmony
The most populous races in New Harmony are White / Caucasian (338 | 94.9%), Hispanic or Latino (18 | 5.1%), and Two or more Races (18 | 5.1%).
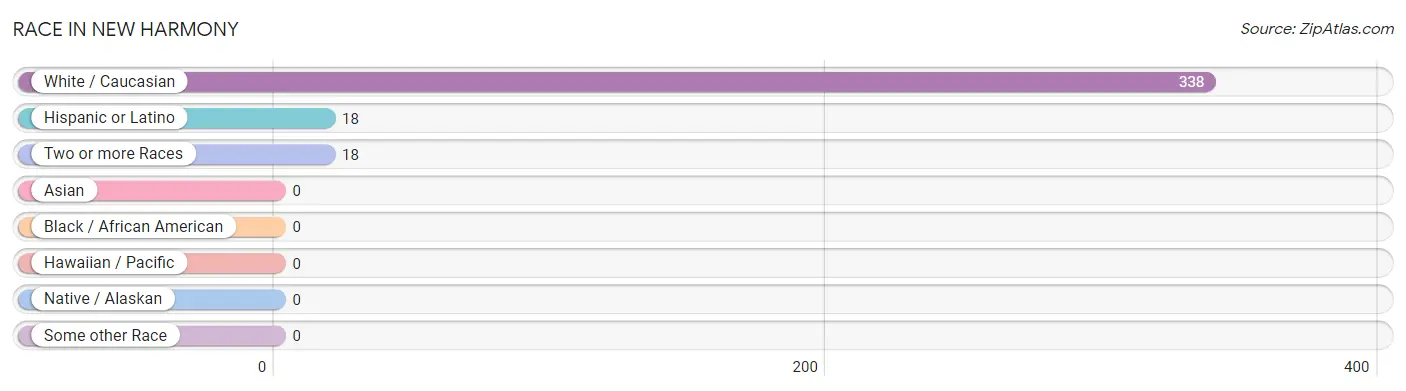
| Race | # Population | % Population |
| Asian | 0 | 0.0% |
| Black / African American | 0 | 0.0% |
| Hawaiian / Pacific | 0 | 0.0% |
| Hispanic or Latino | 18 | 5.1% |
| Native / Alaskan | 0 | 0.0% |
| White / Caucasian | 338 | 94.9% |
| Two or more Races | 18 | 5.1% |
| Some other Race | 0 | 0.0% |
| Total | 356 | 100.0% |
Ancestry in New Harmony
The most populous ancestries reported in New Harmony are English (148 | 41.6%), Swedish (56 | 15.7%), American (53 | 14.9%), Scottish (28 | 7.9%), and Irish (22 | 6.2%), together accounting for 86.2% of all New Harmony residents.
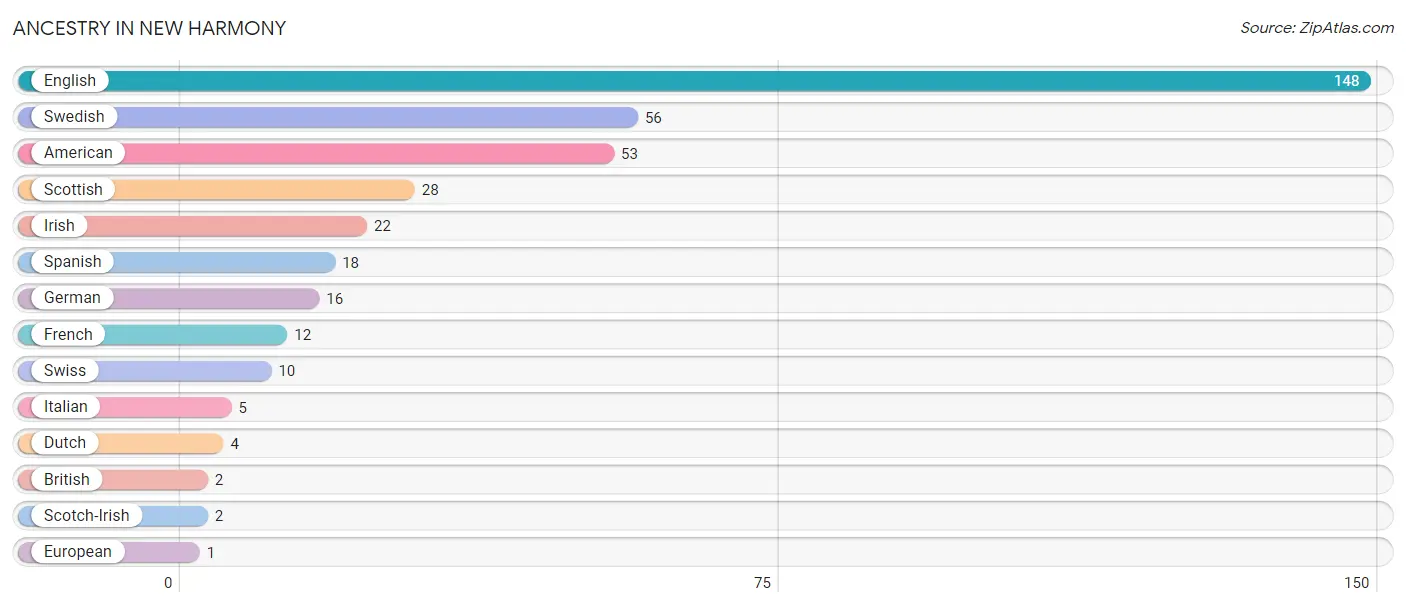
| Ancestry | # Population | % Population |
| American | 53 | 14.9% |
| British | 2 | 0.6% |
| Dutch | 4 | 1.1% |
| English | 148 | 41.6% |
| European | 1 | 0.3% |
| French | 12 | 3.4% |
| German | 16 | 4.5% |
| Irish | 22 | 6.2% |
| Italian | 5 | 1.4% |
| Scotch-Irish | 2 | 0.6% |
| Scottish | 28 | 7.9% |
| Spanish | 18 | 5.1% |
| Swedish | 56 | 15.7% |
| Swiss | 10 | 2.8% | View All 14 Rows |
Immigrants in New Harmony
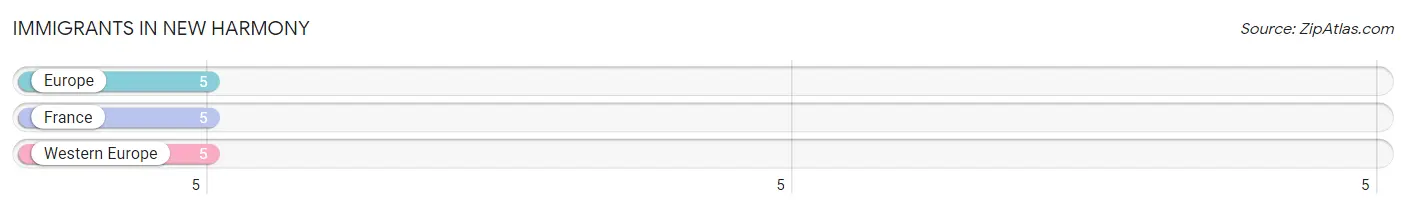
The most numerous immigrant groups reported in New Harmony came from Europe (5 | 1.4%), France (5 | 1.4%), and Western Europe (5 | 1.4%), together accounting for 4.2% of all New Harmony residents.
| Immigration Origin | # Population | % Population |
| Europe | 5 | 1.4% |
| France | 5 | 1.4% |
| Western Europe | 5 | 1.4% | View All 3 Rows |
Sex and Age in New Harmony
Sex and Age in New Harmony
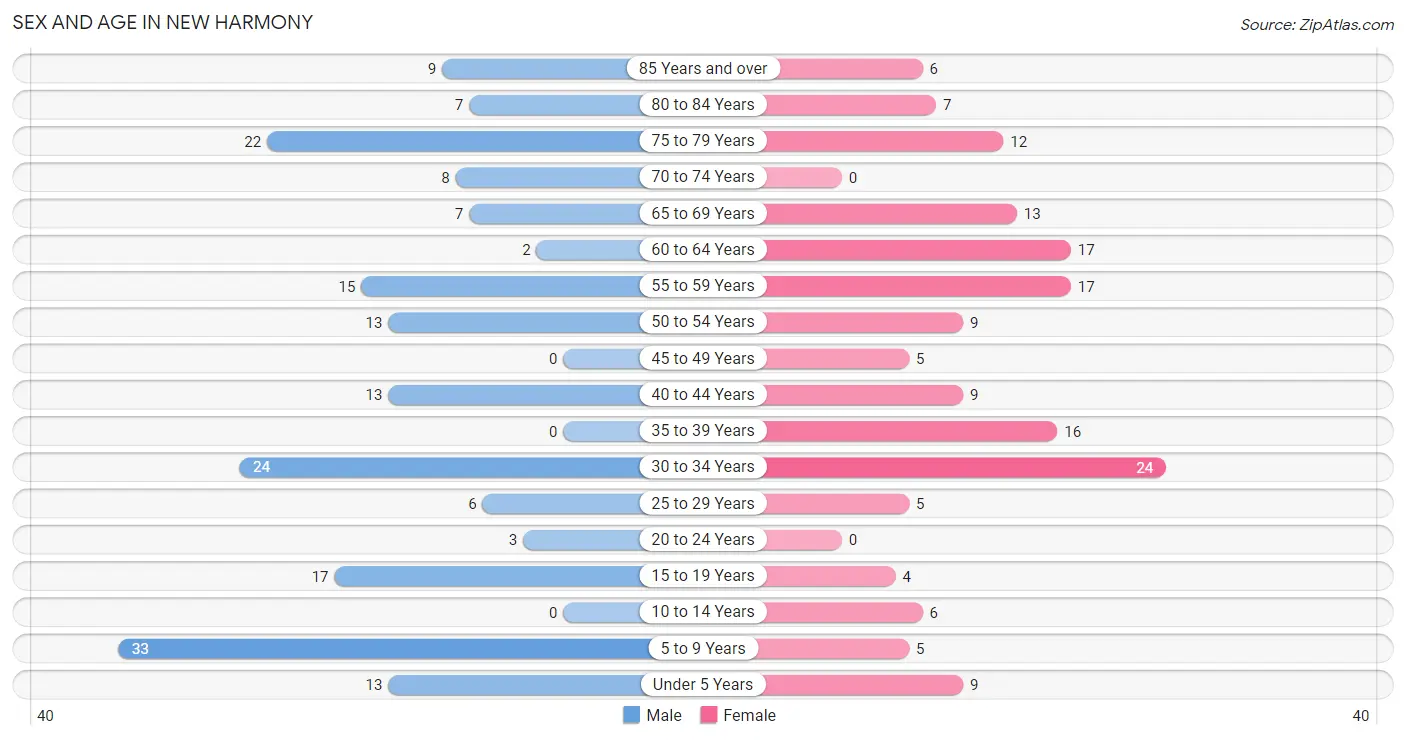
The most populous age groups in New Harmony are 5 to 9 Years (33 | 17.2%) for men and 30 to 34 Years (24 | 14.6%) for women.
| Age Bracket | Male | Female |
| Under 5 Years | 13 (6.8%) | 9 (5.5%) |
| 5 to 9 Years | 33 (17.2%) | 5 (3.0%) |
| 10 to 14 Years | 0 (0.0%) | 6 (3.7%) |
| 15 to 19 Years | 17 (8.8%) | 4 (2.4%) |
| 20 to 24 Years | 3 (1.6%) | 0 (0.0%) |
| 25 to 29 Years | 6 (3.1%) | 5 (3.0%) |
| 30 to 34 Years | 24 (12.5%) | 24 (14.6%) |
| 35 to 39 Years | 0 (0.0%) | 16 (9.8%) |
| 40 to 44 Years | 13 (6.8%) | 9 (5.5%) |
| 45 to 49 Years | 0 (0.0%) | 5 (3.0%) |
| 50 to 54 Years | 13 (6.8%) | 9 (5.5%) |
| 55 to 59 Years | 15 (7.8%) | 17 (10.4%) |
| 60 to 64 Years | 2 (1.0%) | 17 (10.4%) |
| 65 to 69 Years | 7 (3.6%) | 13 (7.9%) |
| 70 to 74 Years | 8 (4.2%) | 0 (0.0%) |
| 75 to 79 Years | 22 (11.5%) | 12 (7.3%) |
| 80 to 84 Years | 7 (3.6%) | 7 (4.3%) |
| 85 Years and over | 9 (4.7%) | 6 (3.7%) |
| Total | 192 (100.0%) | 164 (100.0%) |
Families and Households in New Harmony
Median Family Size in New Harmony
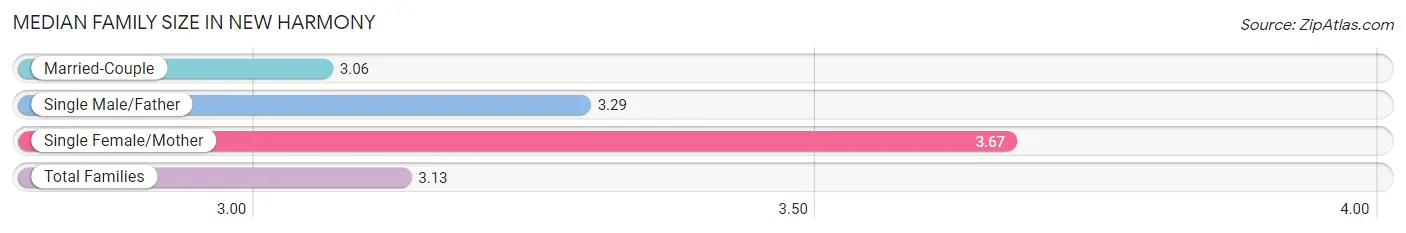
The median family size in New Harmony is 3.13 persons per family, with single female/mother families (9 | 8.9%) accounting for the largest median family size of 3.67 persons per family. On the other hand, married-couple families (85 | 84.2%) represent the smallest median family size with 3.06 persons per family.
| Family Type | # Families | Family Size |
| Married-Couple | 85 (84.2%) | 3.06 |
| Single Male/Father | 7 (6.9%) | 3.29 |
| Single Female/Mother | 9 (8.9%) | 3.67 |
| Total Families | 101 (100.0%) | 3.13 |
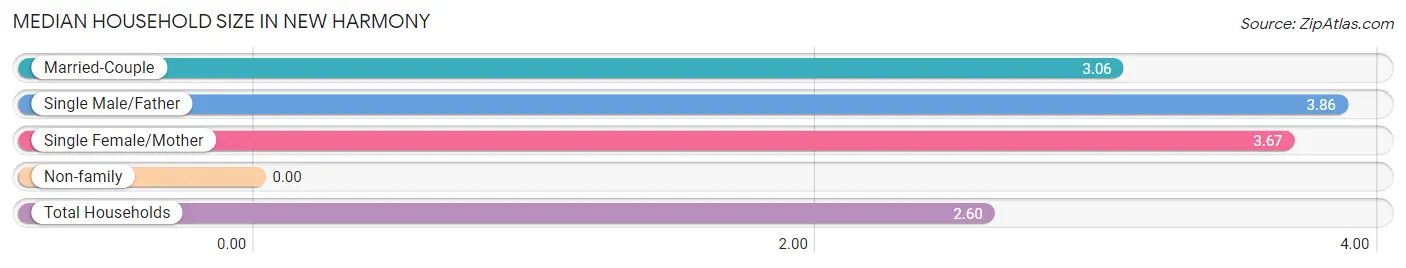
Median Household Size in New Harmony
| Household Type | # Households | Household Size |
| Married-Couple | 85 (62.0%) | 3.06 |
| Single Male/Father | 7 (5.1%) | 3.86 |
| Single Female/Mother | 9 (6.6%) | 3.67 |
| Non-family | 36 (26.3%) | - |
| Total Households | 137 (100.0%) | 2.60 |
Household Size by Marriage Status in New Harmony
Out of a total of 137 households in New Harmony, 101 (73.7%) are family households, while 36 (26.3%) are nonfamily households. The most numerous type of family households are 2-person households, comprising 56, and the most common type of nonfamily households are 1-person households, comprising 36.
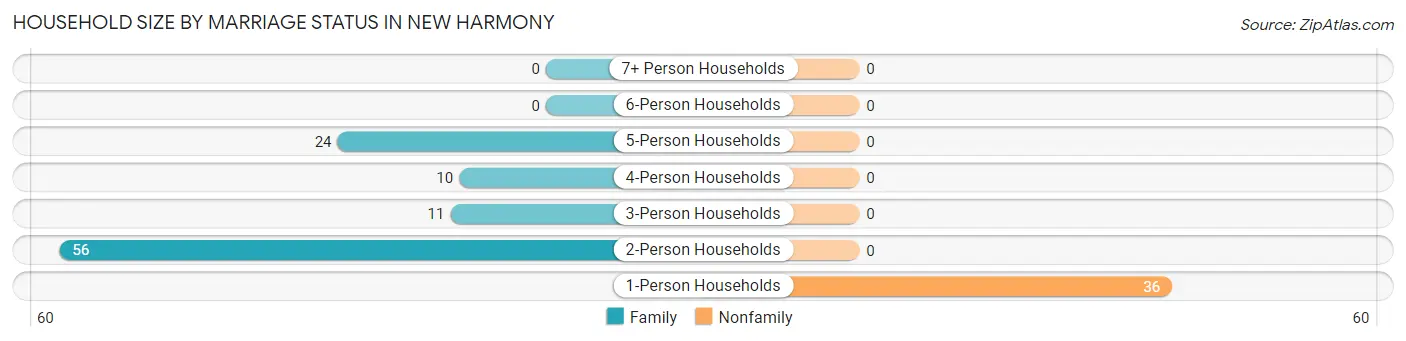
| Household Size | Family Households | Nonfamily Households |
| 1-Person Households | - | 36 (26.3%) |
| 2-Person Households | 56 (40.9%) | 0 (0.0%) |
| 3-Person Households | 11 (8.0%) | 0 (0.0%) |
| 4-Person Households | 10 (7.3%) | 0 (0.0%) |
| 5-Person Households | 24 (17.5%) | 0 (0.0%) |
| 6-Person Households | 0 (0.0%) | 0 (0.0%) |
| 7+ Person Households | 0 (0.0%) | 0 (0.0%) |
| Total | 101 (73.7%) | 36 (26.3%) |
Female Fertility in New Harmony
Fertility by Age in New Harmony
Average fertility rate in New Harmony is 132.0 births per 1,000 women. Women in the age bracket of 15 to 19 years have the highest fertility rate with 1,000.0 births per 1,000 women. Women in the age bracket of 20 to 34 years acount for 55.6% of all women with births.
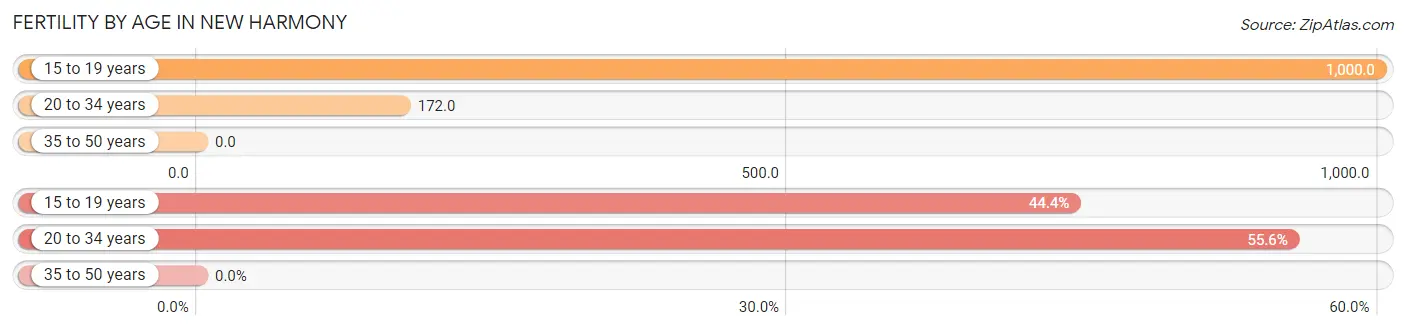
| Age Bracket | Women with Births | Births / 1,000 Women |
| 15 to 19 years | 4 (44.4%) | 1,000.0 |
| 20 to 34 years | 5 (55.6%) | 172.0 |
| 35 to 50 years | 0 (0.0%) | 0.0 |
| Total | 9 (100.0%) | 132.0 |
Fertility by Age by Marriage Status in New Harmony
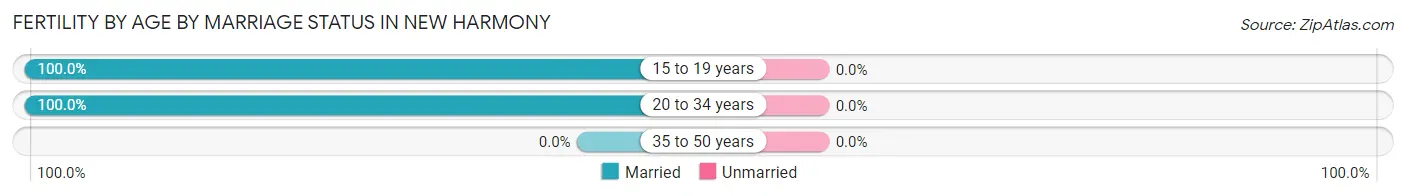
| Age Bracket | Married | Unmarried |
| 15 to 19 years | 4 (100.0%) | 0 (0.0%) |
| 20 to 34 years | 5 (100.0%) | 0 (0.0%) |
| 35 to 50 years | 0 (0.0%) | 0 (0.0%) |
| Total | 9 (100.0%) | 0 (0.0%) |
Fertility by Education in New Harmony
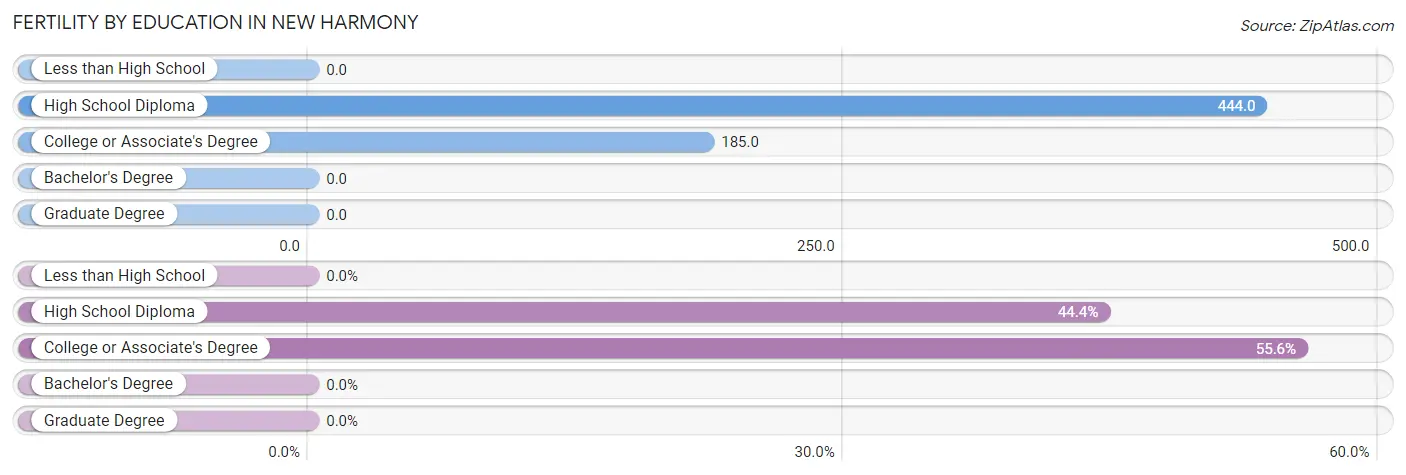
| Educational Attainment | Women with Births | Births / 1,000 Women |
| Less than High School | 0 (0.0%) | 0.0 |
| High School Diploma | 4 (44.4%) | 444.0 |
| College or Associate's Degree | 5 (55.6%) | 185.0 |
| Bachelor's Degree | 0 (0.0%) | 0.0 |
| Graduate Degree | 0 (0.0%) | 0.0 |
| Total | 9 (100.0%) | 132.0 |
Fertility by Education by Marriage Status in New Harmony
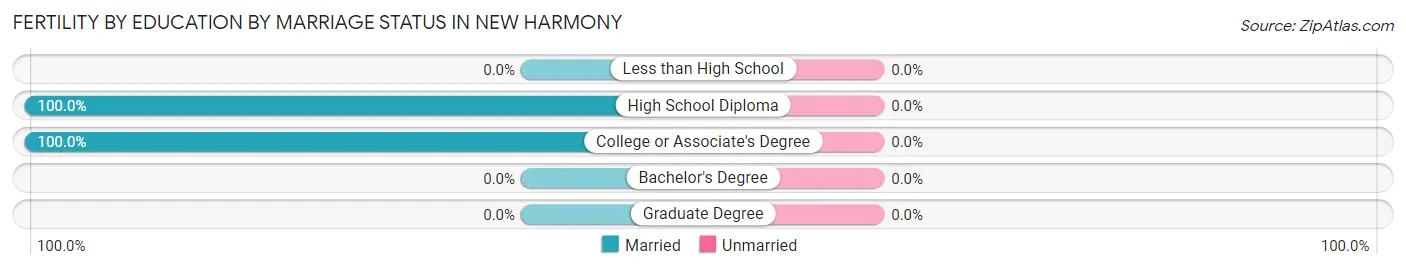
| Educational Attainment | Married | Unmarried |
| Less than High School | 0 (0.0%) | 0 (0.0%) |
| High School Diploma | 4 (100.0%) | 0 (0.0%) |
| College or Associate's Degree | 5 (100.0%) | 0 (0.0%) |
| Bachelor's Degree | 0 (0.0%) | 0 (0.0%) |
| Graduate Degree | 0 (0.0%) | 0 (0.0%) |
| Total | 9 (100.0%) | 0 (0.0%) |
Employment Characteristics in New Harmony
Employment by Class of Employer in New Harmony
Among the 144 employed individuals in New Harmony, private company employees (97 | 67.4%), self-employed (not incorporated) (21 | 14.6%), and local government employees (17 | 11.8%) make up the most common classes of employment.
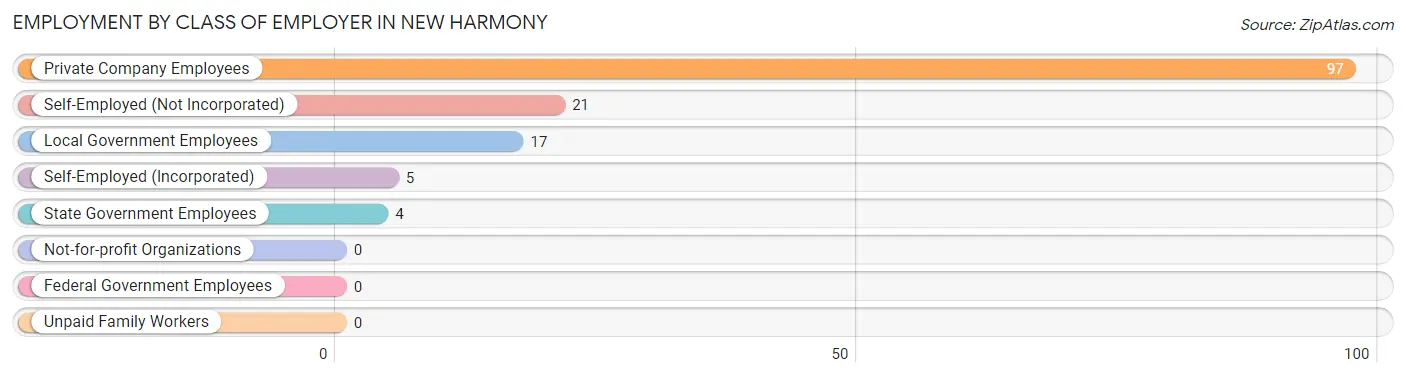
| Employer Class | # Employees | % Employees |
| Private Company Employees | 97 | 67.4% |
| Self-Employed (Incorporated) | 5 | 3.5% |
| Self-Employed (Not Incorporated) | 21 | 14.6% |
| Not-for-profit Organizations | 0 | 0.0% |
| Local Government Employees | 17 | 11.8% |
| State Government Employees | 4 | 2.8% |
| Federal Government Employees | 0 | 0.0% |
| Unpaid Family Workers | 0 | 0.0% |
| Total | 144 | 100.0% |
Employment Status by Age in New Harmony
According to the labor force statistics for New Harmony, out of the total population over 16 years of age (281), 53.0% or 149 individuals are in the labor force, with 2.0% or 3 of them unemployed. The age group with the highest labor force participation rate is 20 to 24 years, with 100.0% or 3 individuals in the labor force. Within the labor force, the 30 to 34 years age range has the highest percentage of unemployed individuals, with 10.3% or 3 of them being unemployed.
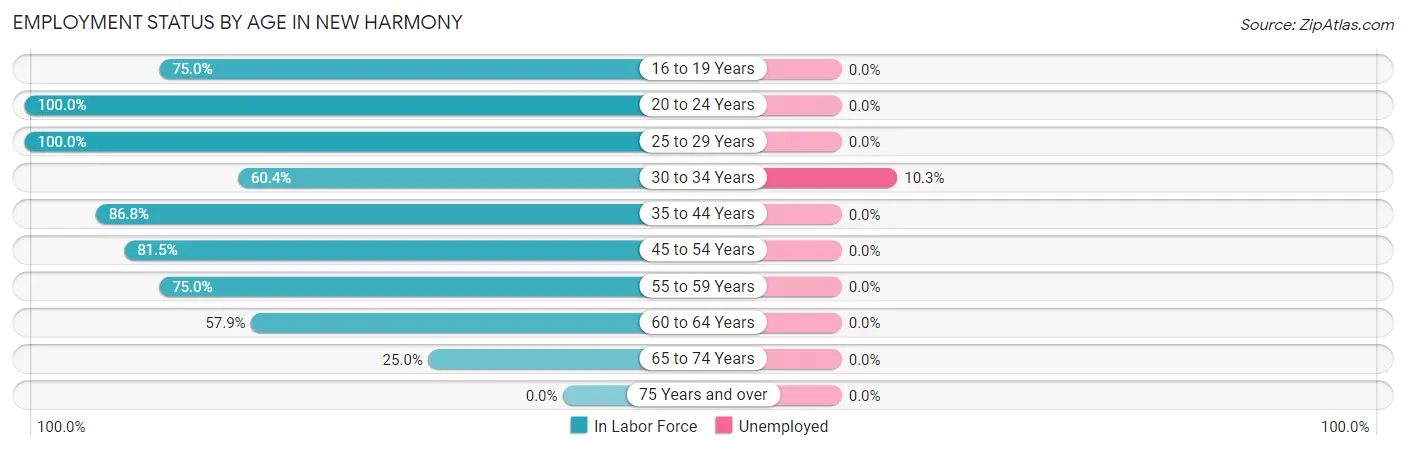
| Age Bracket | In Labor Force | Unemployed |
| 16 to 19 Years | 9 (75.0%) | 0 (0.0%) |
| 20 to 24 Years | 3 (100.0%) | 0 (0.0%) |
| 25 to 29 Years | 11 (100.0%) | 0 (0.0%) |
| 30 to 34 Years | 29 (60.4%) | 3 (10.3%) |
| 35 to 44 Years | 33 (86.8%) | 0 (0.0%) |
| 45 to 54 Years | 22 (81.5%) | 0 (0.0%) |
| 55 to 59 Years | 24 (75.0%) | 0 (0.0%) |
| 60 to 64 Years | 11 (57.9%) | 0 (0.0%) |
| 65 to 74 Years | 7 (25.0%) | 0 (0.0%) |
| 75 Years and over | 0 (0.0%) | 0 (0.0%) |
| Total | 149 (53.0%) | 3 (2.0%) |
Employment Status by Educational Attainment in New Harmony
According to labor force statistics for New Harmony, 74.3% of individuals (130) out of the total population between 25 and 64 years of age (175) are in the labor force, with 2.3% or 3 of them being unemployed. The group with the highest labor force participation rate are those with the educational attainment of college / associate degree, with 84.4% or 65 individuals in the labor force. Within the labor force, individuals with bachelor's degree or higher education have the highest percentage of unemployment, with 5.6% or 3 of them being unemployed.
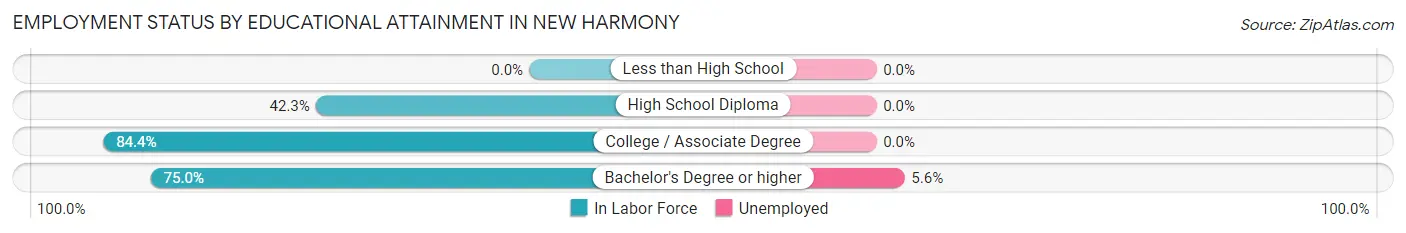
| Educational Attainment | In Labor Force | Unemployed |
| Less than High School | 0 (0.0%) | 0 (0.0%) |
| High School Diploma | 11 (42.3%) | 0 (0.0%) |
| College / Associate Degree | 65 (84.4%) | 0 (0.0%) |
| Bachelor's Degree or higher | 54 (75.0%) | 4 (5.6%) |
| Total | 130 (74.3%) | 4 (2.3%) |
Employment Occupations by Sex in New Harmony
Management, Business, Science and Arts Occupations
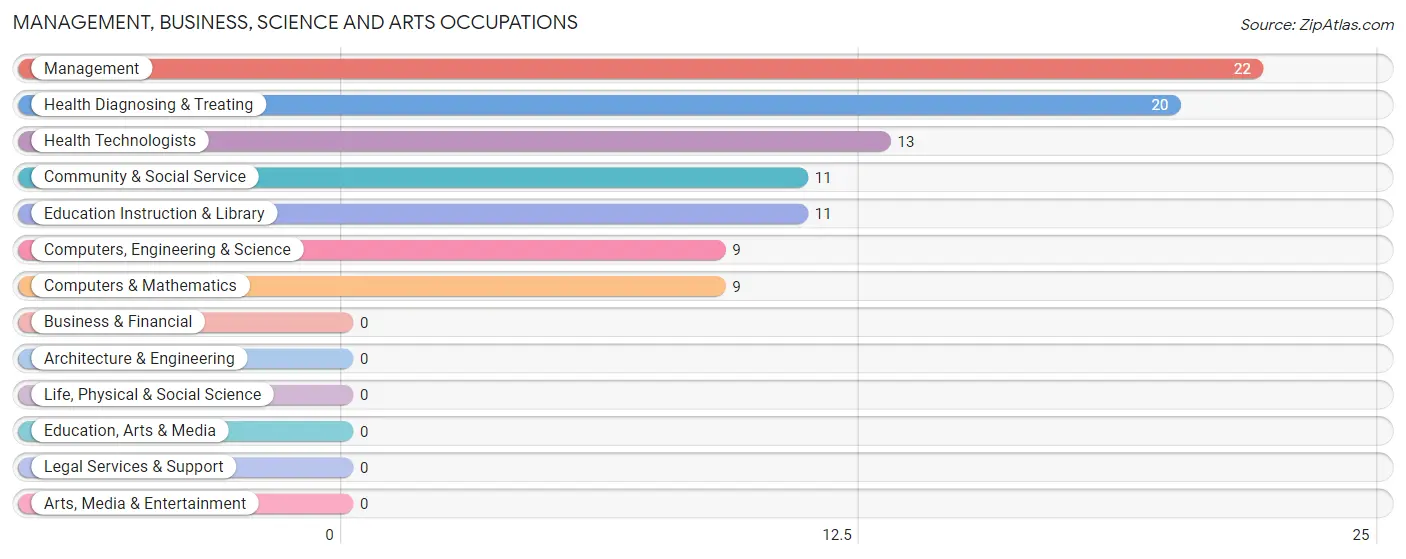
The most common Management, Business, Science and Arts occupations in New Harmony are Management (22 | 15.1%), Health Diagnosing & Treating (20 | 13.7%), Health Technologists (13 | 8.9%), Community & Social Service (11 | 7.5%), and Education Instruction & Library (11 | 7.5%).
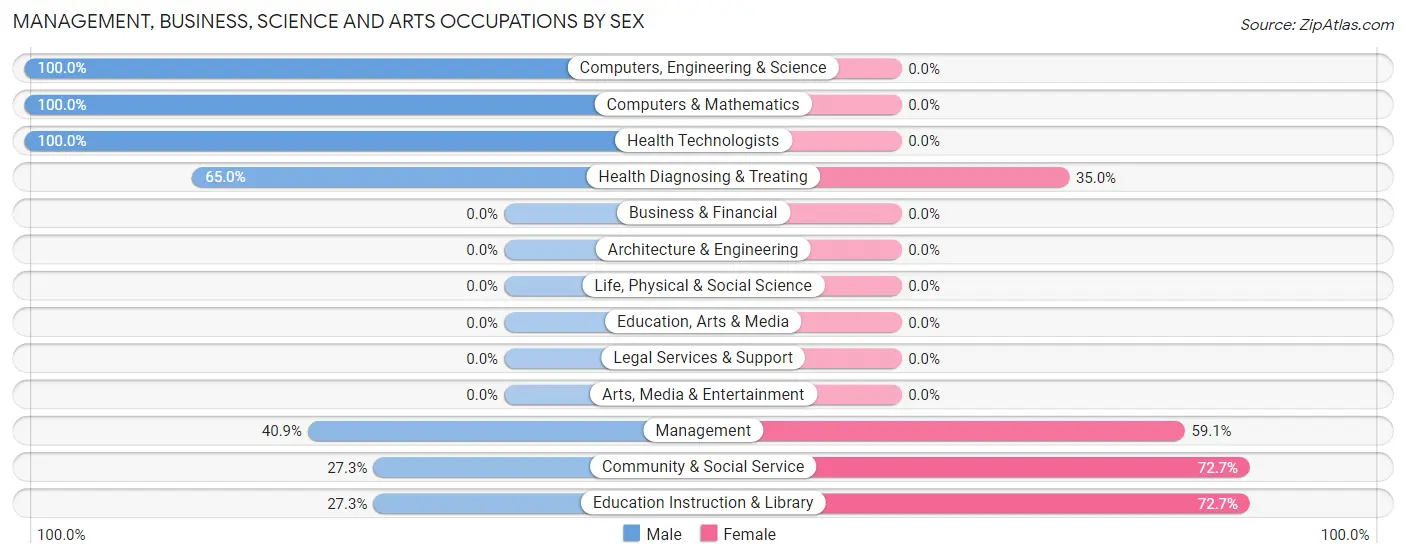
Management, Business, Science and Arts Occupations by Sex
Within the Management, Business, Science and Arts occupations in New Harmony, the most male-oriented occupations are Computers, Engineering & Science (100.0%), Computers & Mathematics (100.0%), and Health Technologists (100.0%), while the most female-oriented occupations are Community & Social Service (72.7%), Education Instruction & Library (72.7%), and Management (59.1%).
| Occupation | Male | Female |
| Management | 9 (40.9%) | 13 (59.1%) |
| Business & Financial | 0 (0.0%) | 0 (0.0%) |
| Computers, Engineering & Science | 9 (100.0%) | 0 (0.0%) |
| Computers & Mathematics | 9 (100.0%) | 0 (0.0%) |
| Architecture & Engineering | 0 (0.0%) | 0 (0.0%) |
| Life, Physical & Social Science | 0 (0.0%) | 0 (0.0%) |
| Community & Social Service | 3 (27.3%) | 8 (72.7%) |
| Education, Arts & Media | 0 (0.0%) | 0 (0.0%) |
| Legal Services & Support | 0 (0.0%) | 0 (0.0%) |
| Education Instruction & Library | 3 (27.3%) | 8 (72.7%) |
| Arts, Media & Entertainment | 0 (0.0%) | 0 (0.0%) |
| Health Diagnosing & Treating | 13 (65.0%) | 7 (35.0%) |
| Health Technologists | 13 (100.0%) | 0 (0.0%) |
| Total (Category) | 34 (54.8%) | 28 (45.2%) |
| Total (Overall) | 73 (50.0%) | 73 (50.0%) |
Services Occupations
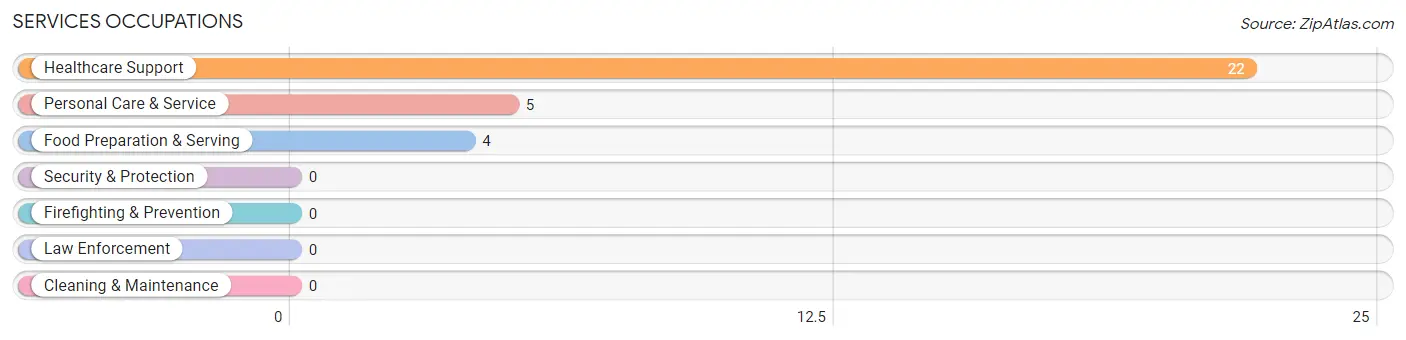
The most common Services occupations in New Harmony are Healthcare Support (22 | 15.1%), Personal Care & Service (5 | 3.4%), and Food Preparation & Serving (4 | 2.7%).
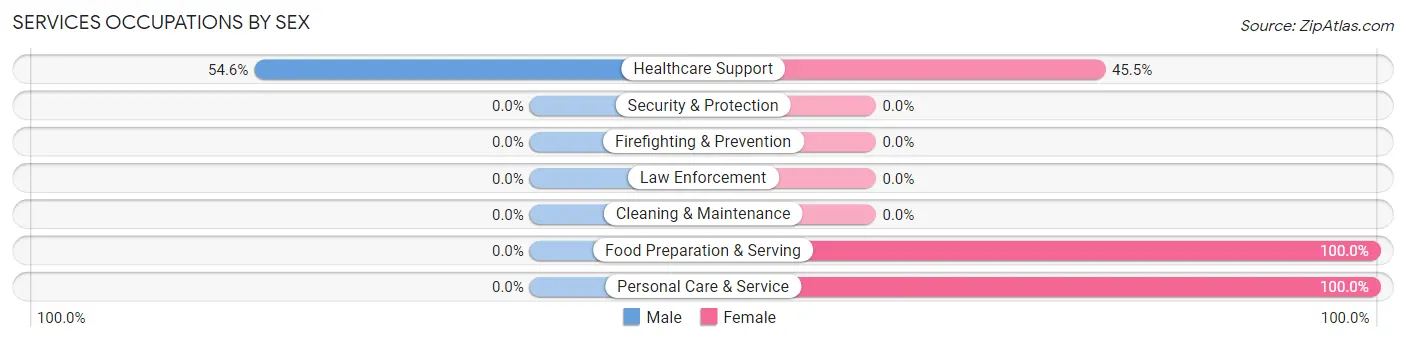
Services Occupations by Sex
| Occupation | Male | Female |
| Healthcare Support | 12 (54.5%) | 10 (45.5%) |
| Security & Protection | 0 (0.0%) | 0 (0.0%) |
| Firefighting & Prevention | 0 (0.0%) | 0 (0.0%) |
| Law Enforcement | 0 (0.0%) | 0 (0.0%) |
| Food Preparation & Serving | 0 (0.0%) | 4 (100.0%) |
| Cleaning & Maintenance | 0 (0.0%) | 0 (0.0%) |
| Personal Care & Service | 0 (0.0%) | 5 (100.0%) |
| Total (Category) | 12 (38.7%) | 19 (61.3%) |
| Total (Overall) | 73 (50.0%) | 73 (50.0%) |
Sales and Office Occupations
The most common Sales and Office occupations in New Harmony are Office & Administration (26 | 17.8%), and Sales & Related (5 | 3.4%).
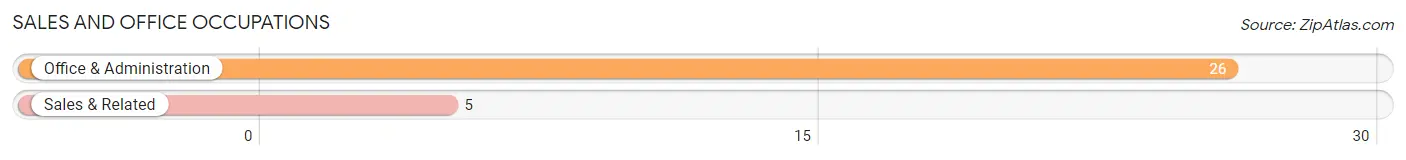
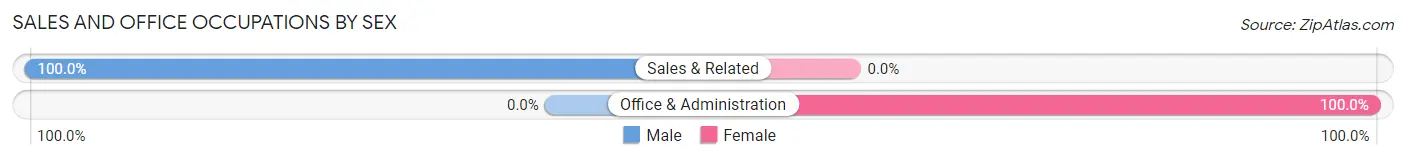
Sales and Office Occupations by Sex
| Occupation | Male | Female |
| Sales & Related | 5 (100.0%) | 0 (0.0%) |
| Office & Administration | 0 (0.0%) | 26 (100.0%) |
| Total (Category) | 5 (16.1%) | 26 (83.9%) |
| Total (Overall) | 73 (50.0%) | 73 (50.0%) |
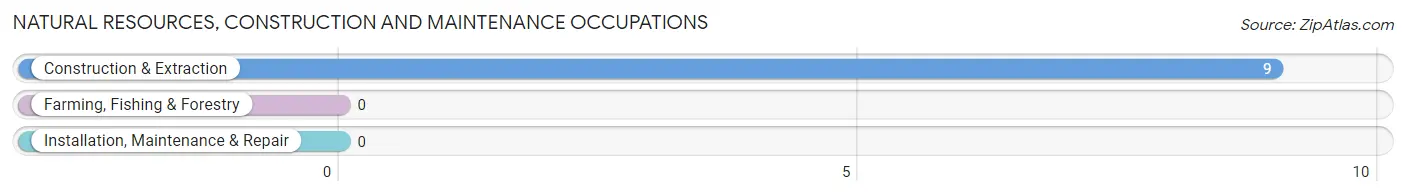
Natural Resources, Construction and Maintenance Occupations
The most common Natural Resources, Construction and Maintenance occupations in New Harmony are , and Construction & Extraction (9 | 6.2%).
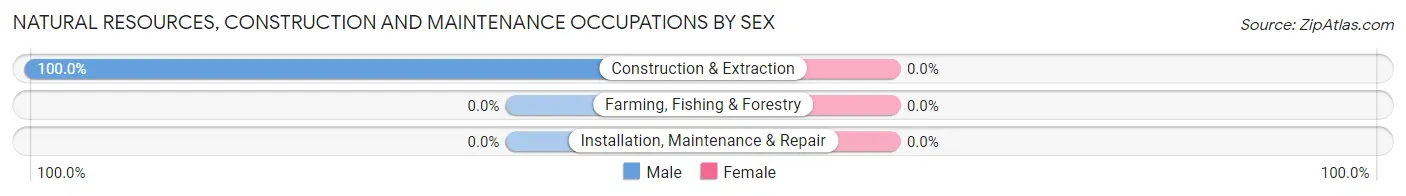
Natural Resources, Construction and Maintenance Occupations by Sex
| Occupation | Male | Female |
| Farming, Fishing & Forestry | 0 (0.0%) | 0 (0.0%) |
| Construction & Extraction | 9 (100.0%) | 0 (0.0%) |
| Installation, Maintenance & Repair | 0 (0.0%) | 0 (0.0%) |
| Total (Category) | 9 (100.0%) | 0 (0.0%) |
| Total (Overall) | 73 (50.0%) | 73 (50.0%) |
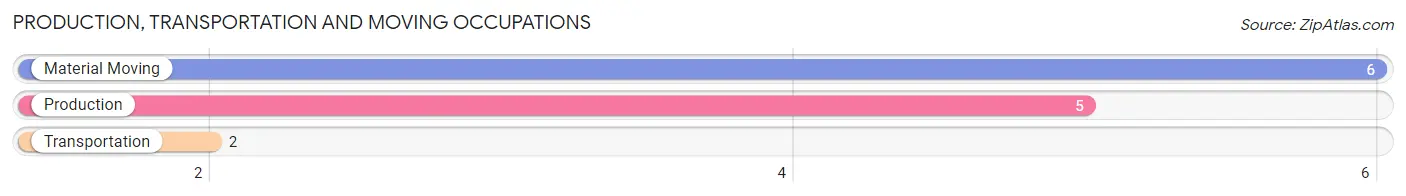
Production, Transportation and Moving Occupations
The most common Production, Transportation and Moving occupations in New Harmony are Material Moving (6 | 4.1%), Production (5 | 3.4%), and Transportation (2 | 1.4%).
Production, Transportation and Moving Occupations by Sex
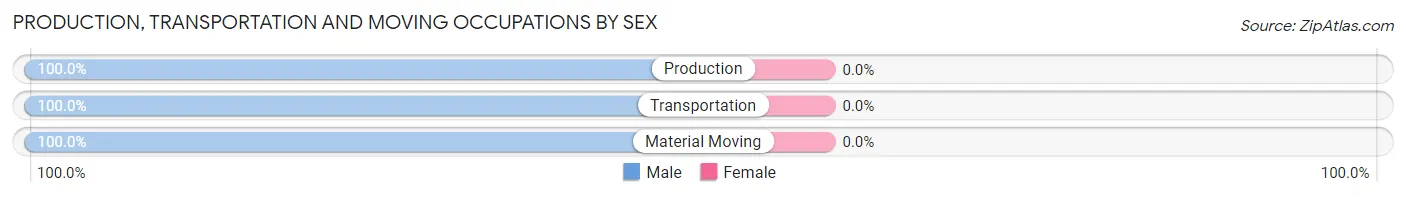
| Occupation | Male | Female |
| Production | 5 (100.0%) | 0 (0.0%) |
| Transportation | 2 (100.0%) | 0 (0.0%) |
| Material Moving | 6 (100.0%) | 0 (0.0%) |
| Total (Category) | 13 (100.0%) | 0 (0.0%) |
| Total (Overall) | 73 (50.0%) | 73 (50.0%) |
Employment Industries by Sex in New Harmony
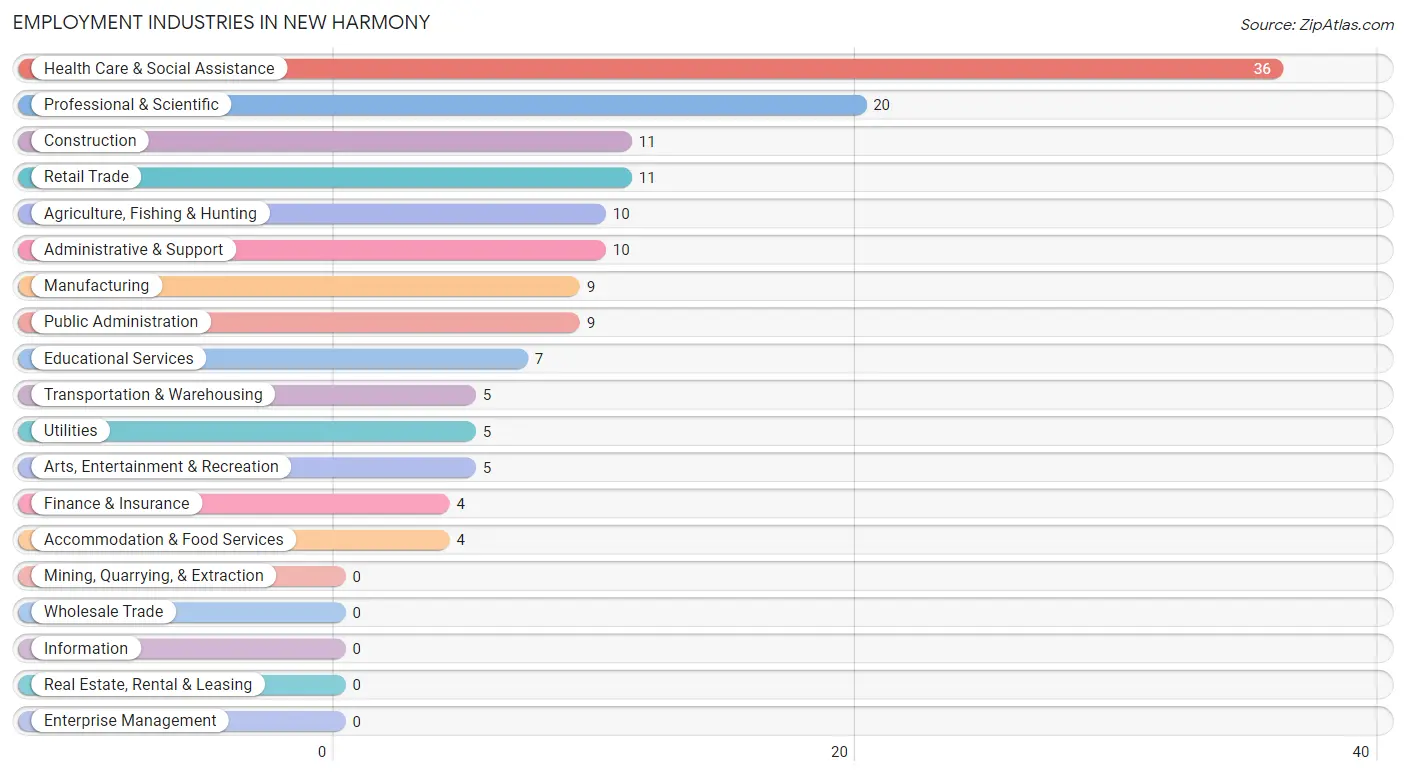
Employment Industries in New Harmony
The major employment industries in New Harmony include Health Care & Social Assistance (36 | 24.7%), Professional & Scientific (20 | 13.7%), Construction (11 | 7.5%), Retail Trade (11 | 7.5%), and Agriculture, Fishing & Hunting (10 | 6.9%).
Employment Industries by Sex in New Harmony
The New Harmony industries that see more men than women are Construction (100.0%), Professional & Scientific (70.0%), and Health Care & Social Assistance (69.4%), whereas the industries that tend to have a higher number of women are Transportation & Warehousing (100.0%), Utilities (100.0%), and Finance & Insurance (100.0%).
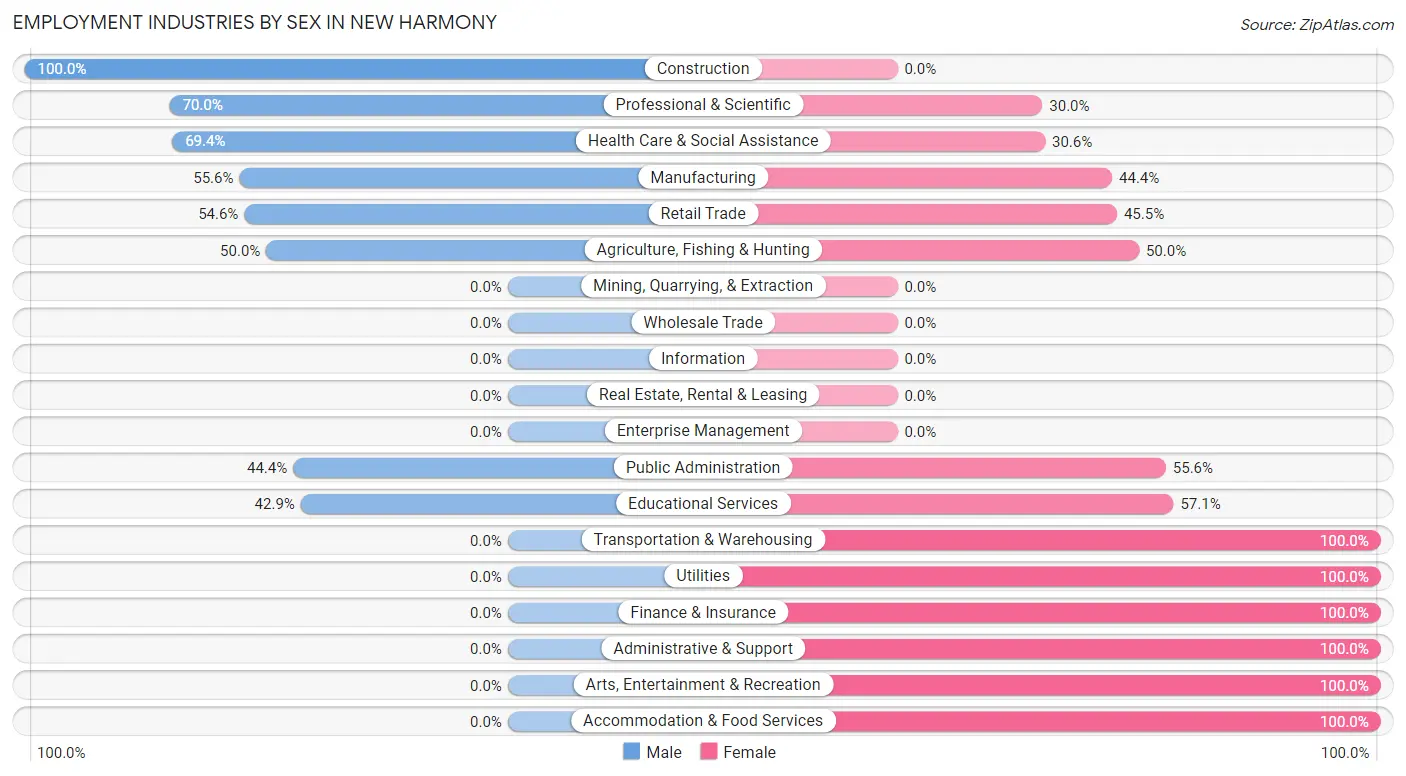
| Industry | Male | Female |
| Agriculture, Fishing & Hunting | 5 (50.0%) | 5 (50.0%) |
| Mining, Quarrying, & Extraction | 0 (0.0%) | 0 (0.0%) |
| Construction | 11 (100.0%) | 0 (0.0%) |
| Manufacturing | 5 (55.6%) | 4 (44.4%) |
| Wholesale Trade | 0 (0.0%) | 0 (0.0%) |
| Retail Trade | 6 (54.5%) | 5 (45.5%) |
| Transportation & Warehousing | 0 (0.0%) | 5 (100.0%) |
| Utilities | 0 (0.0%) | 5 (100.0%) |
| Information | 0 (0.0%) | 0 (0.0%) |
| Finance & Insurance | 0 (0.0%) | 4 (100.0%) |
| Real Estate, Rental & Leasing | 0 (0.0%) | 0 (0.0%) |
| Professional & Scientific | 14 (70.0%) | 6 (30.0%) |
| Enterprise Management | 0 (0.0%) | 0 (0.0%) |
| Administrative & Support | 0 (0.0%) | 10 (100.0%) |
| Educational Services | 3 (42.9%) | 4 (57.1%) |
| Health Care & Social Assistance | 25 (69.4%) | 11 (30.6%) |
| Arts, Entertainment & Recreation | 0 (0.0%) | 5 (100.0%) |
| Accommodation & Food Services | 0 (0.0%) | 4 (100.0%) |
| Public Administration | 4 (44.4%) | 5 (55.6%) |
| Total | 73 (50.0%) | 73 (50.0%) |
Education in New Harmony
School Enrollment in New Harmony
The most common levels of schooling among the 68 students in New Harmony are elementary school (16 | 23.5%), high school (12 | 17.6%), and college / undergraduate (12 | 17.6%).
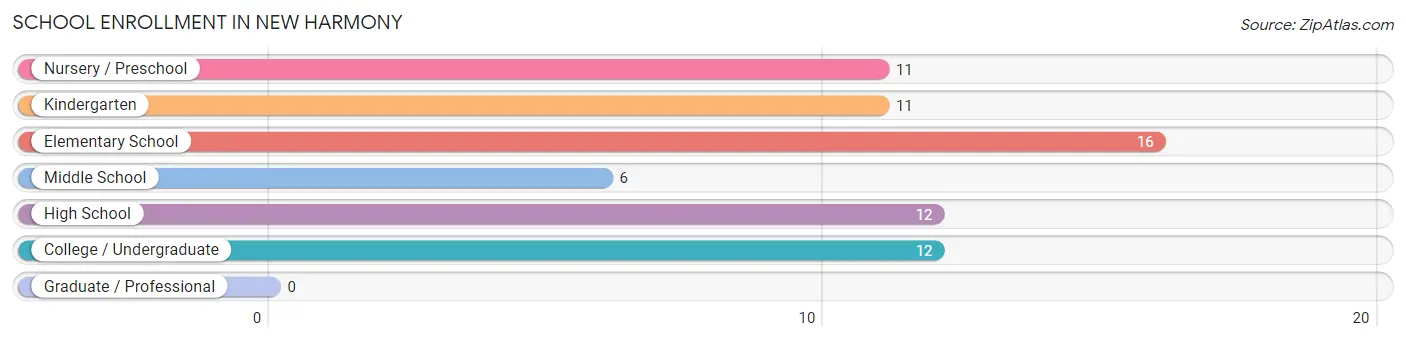
| School Level | # Students | % Students |
| Nursery / Preschool | 11 | 16.2% |
| Kindergarten | 11 | 16.2% |
| Elementary School | 16 | 23.5% |
| Middle School | 6 | 8.8% |
| High School | 12 | 17.6% |
| College / Undergraduate | 12 | 17.6% |
| Graduate / Professional | 0 | 0.0% |
| Total | 68 | 100.0% |
School Enrollment by Age by Funding Source in New Harmony
Out of a total of 68 students who are enrolled in schools in New Harmony, 20 (29.4%) attend a private institution, while the remaining 48 (70.6%) are enrolled in public schools. The age group of 5 to 9 year old has the highest likelihood of being enrolled in private schools, with 16 (42.1% in the age bracket) enrolled. Conversely, the age group of 10 to 14 year olds has the lowest likelihood of being enrolled in a private school, with 6 (100.0% in the age bracket) attending a public institution.
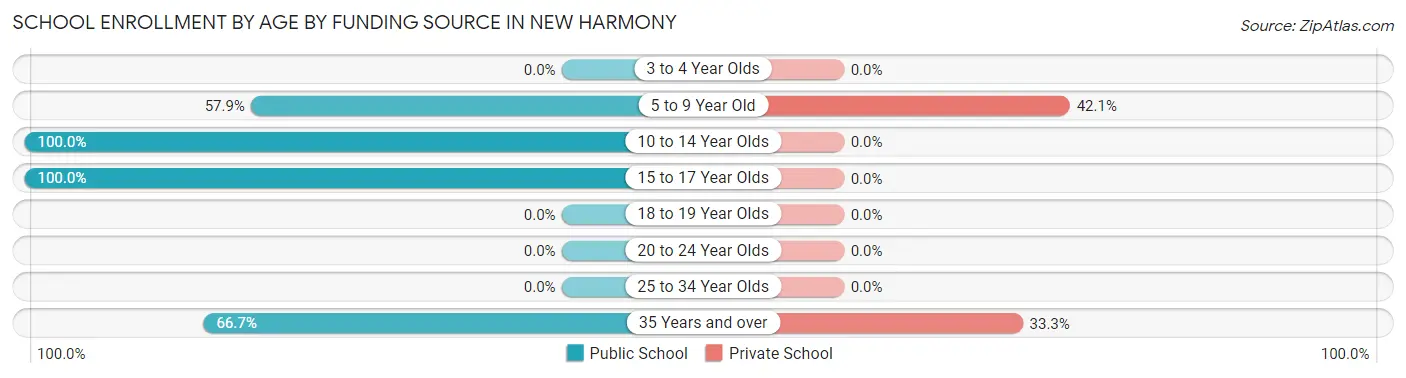
| Age Bracket | Public School | Private School |
| 3 to 4 Year Olds | 0 (0.0%) | 0 (0.0%) |
| 5 to 9 Year Old | 22 (57.9%) | 16 (42.1%) |
| 10 to 14 Year Olds | 6 (100.0%) | 0 (0.0%) |
| 15 to 17 Year Olds | 12 (100.0%) | 0 (0.0%) |
| 18 to 19 Year Olds | 0 (0.0%) | 0 (0.0%) |
| 20 to 24 Year Olds | 0 (0.0%) | 0 (0.0%) |
| 25 to 34 Year Olds | 0 (0.0%) | 0 (0.0%) |
| 35 Years and over | 8 (66.7%) | 4 (33.3%) |
| Total | 48 (70.6%) | 20 (29.4%) |
Educational Attainment by Field of Study in New Harmony
Education (20 | 20.2%), science & technology (19 | 19.2%), literature & languages (15 | 15.1%), liberal arts & history (11 | 11.1%), and business (8 | 8.1%) are the most common fields of study among 99 individuals in New Harmony who have obtained a bachelor's degree or higher.
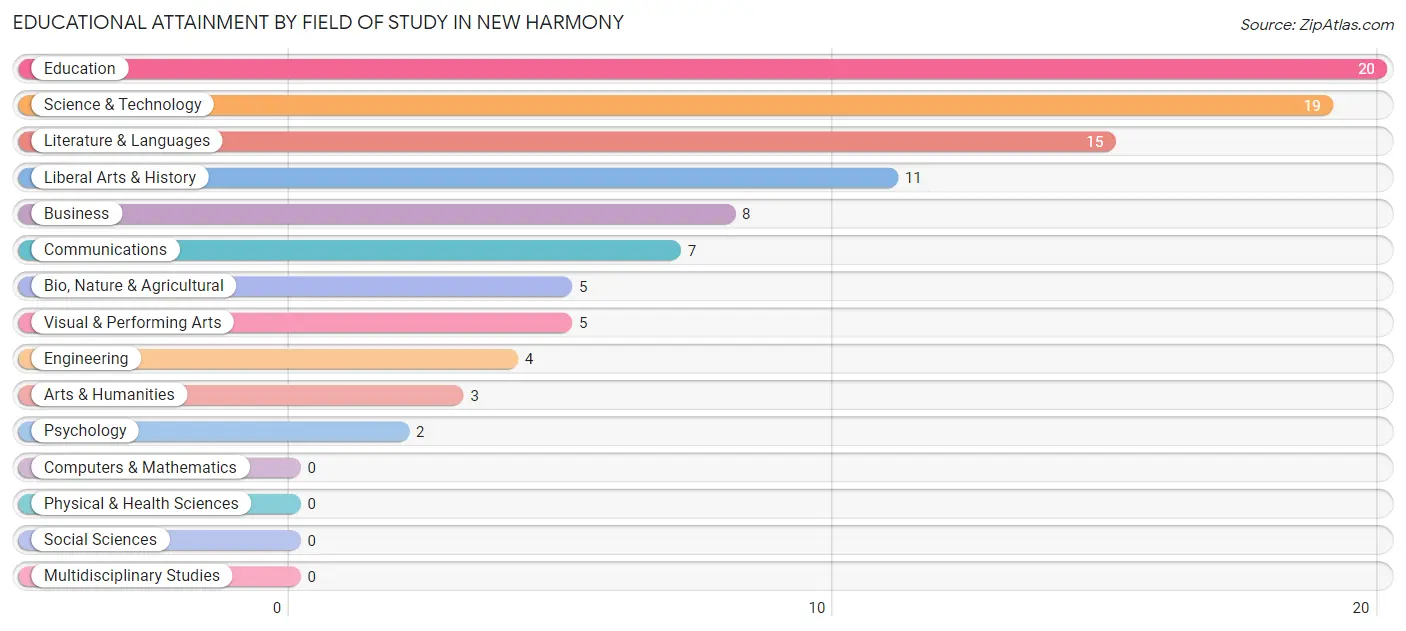
| Field of Study | # Graduates | % Graduates |
| Computers & Mathematics | 0 | 0.0% |
| Bio, Nature & Agricultural | 5 | 5.1% |
| Physical & Health Sciences | 0 | 0.0% |
| Psychology | 2 | 2.0% |
| Social Sciences | 0 | 0.0% |
| Engineering | 4 | 4.0% |
| Multidisciplinary Studies | 0 | 0.0% |
| Science & Technology | 19 | 19.2% |
| Business | 8 | 8.1% |
| Education | 20 | 20.2% |
| Literature & Languages | 15 | 15.1% |
| Liberal Arts & History | 11 | 11.1% |
| Visual & Performing Arts | 5 | 5.1% |
| Communications | 7 | 7.1% |
| Arts & Humanities | 3 | 3.0% |
| Total | 99 | 100.0% |
Transportation & Commute in New Harmony
Vehicle Availability by Sex in New Harmony
The most prevalent vehicle ownership categories in New Harmony are males with 2 vehicles (32, accounting for 45.1%) and females with 2 vehicles (21, making up 43.8%).
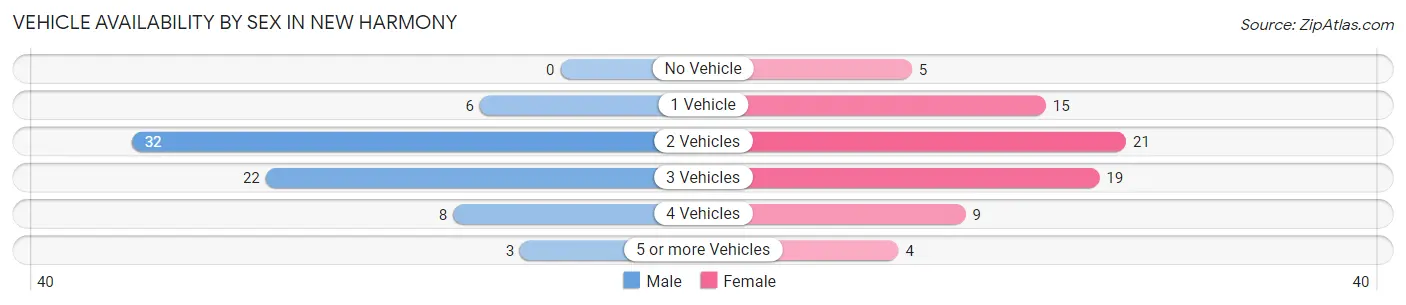
| Vehicles Available | Male | Female |
| No Vehicle | 0 (0.0%) | 5 (6.9%) |
| 1 Vehicle | 6 (8.5%) | 15 (20.5%) |
| 2 Vehicles | 32 (45.1%) | 21 (28.8%) |
| 3 Vehicles | 22 (31.0%) | 19 (26.0%) |
| 4 Vehicles | 8 (11.3%) | 9 (12.3%) |
| 5 or more Vehicles | 3 (4.2%) | 4 (5.5%) |
| Total | 71 (100.0%) | 73 (100.0%) |
Commute Time in New Harmony
The most frequently occuring commute durations in New Harmony are 30 to 34 minutes (36 commuters, 37.9%), 25 to 29 minutes (13 commuters, 13.7%), and 40 to 44 minutes (12 commuters, 12.6%).
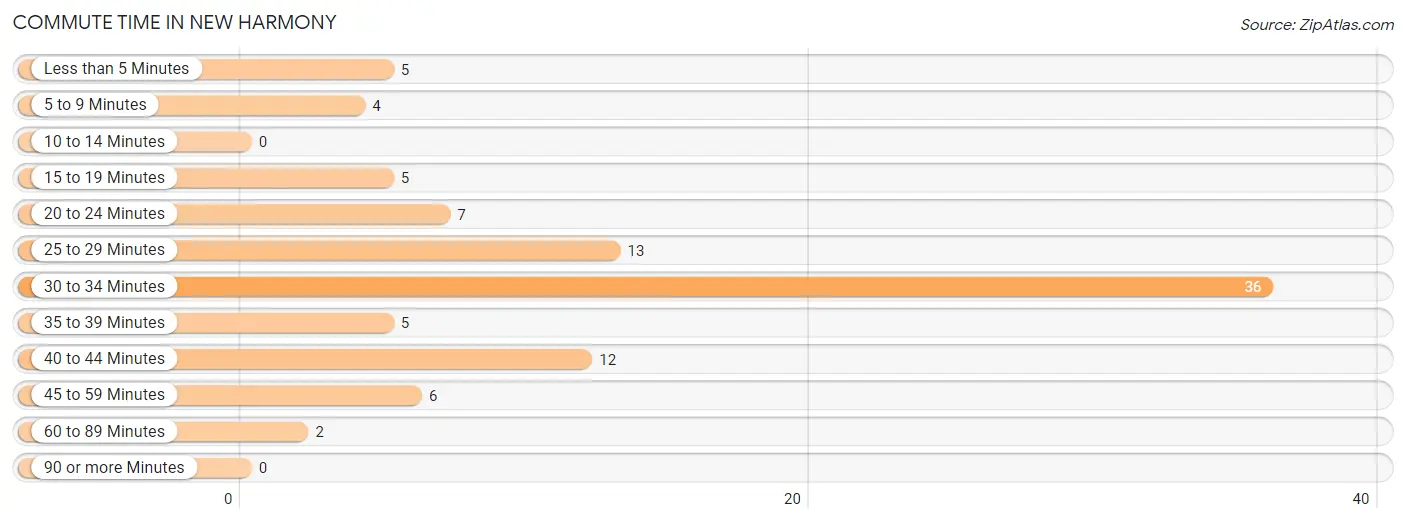
| Commute Time | # Commuters | % Commuters |
| Less than 5 Minutes | 5 | 5.3% |
| 5 to 9 Minutes | 4 | 4.2% |
| 10 to 14 Minutes | 0 | 0.0% |
| 15 to 19 Minutes | 5 | 5.3% |
| 20 to 24 Minutes | 7 | 7.4% |
| 25 to 29 Minutes | 13 | 13.7% |
| 30 to 34 Minutes | 36 | 37.9% |
| 35 to 39 Minutes | 5 | 5.3% |
| 40 to 44 Minutes | 12 | 12.6% |
| 45 to 59 Minutes | 6 | 6.3% |
| 60 to 89 Minutes | 2 | 2.1% |
| 90 or more Minutes | 0 | 0.0% |
Commute Time by Sex in New Harmony
The most common commute times in New Harmony are 30 to 34 minutes (27 commuters, 47.4%) for males and 30 to 34 minutes (9 commuters, 23.7%) for females.
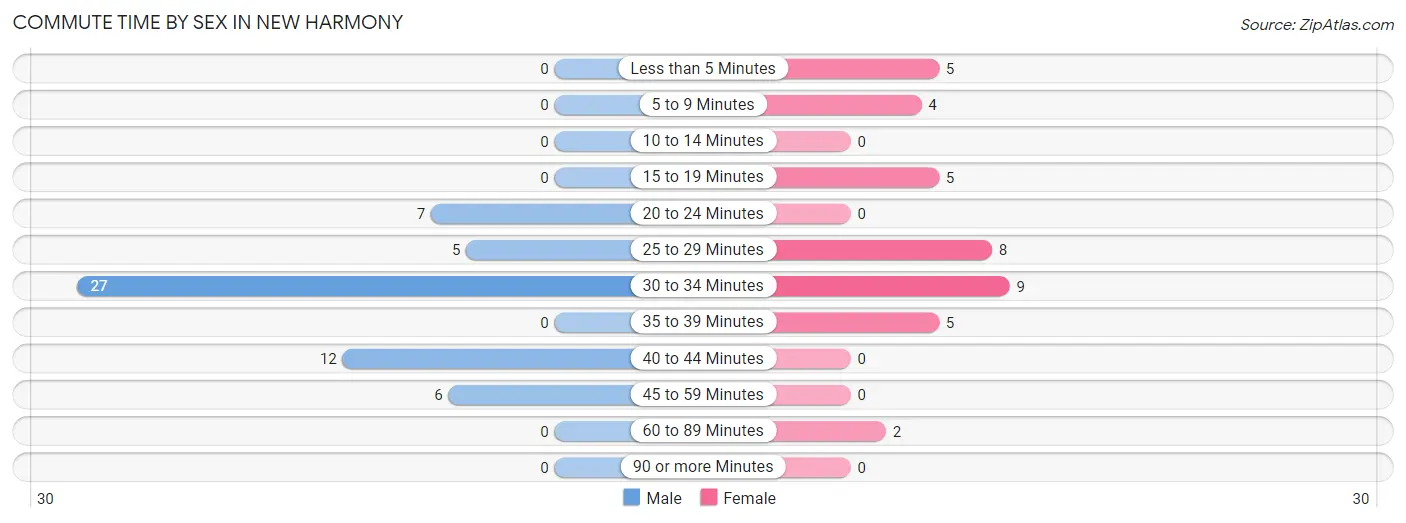
| Commute Time | Male | Female |
| Less than 5 Minutes | 0 (0.0%) | 5 (13.2%) |
| 5 to 9 Minutes | 0 (0.0%) | 4 (10.5%) |
| 10 to 14 Minutes | 0 (0.0%) | 0 (0.0%) |
| 15 to 19 Minutes | 0 (0.0%) | 5 (13.2%) |
| 20 to 24 Minutes | 7 (12.3%) | 0 (0.0%) |
| 25 to 29 Minutes | 5 (8.8%) | 8 (21.0%) |
| 30 to 34 Minutes | 27 (47.4%) | 9 (23.7%) |
| 35 to 39 Minutes | 0 (0.0%) | 5 (13.2%) |
| 40 to 44 Minutes | 12 (21.0%) | 0 (0.0%) |
| 45 to 59 Minutes | 6 (10.5%) | 0 (0.0%) |
| 60 to 89 Minutes | 0 (0.0%) | 2 (5.3%) |
| 90 or more Minutes | 0 (0.0%) | 0 (0.0%) |
Time of Departure to Work by Sex in New Harmony
The most frequent times of departure to work in New Harmony are 7:30 AM to 7:59 AM (29, 50.9%) for males and 12:00 AM to 4:59 AM (9, 23.7%) for females.
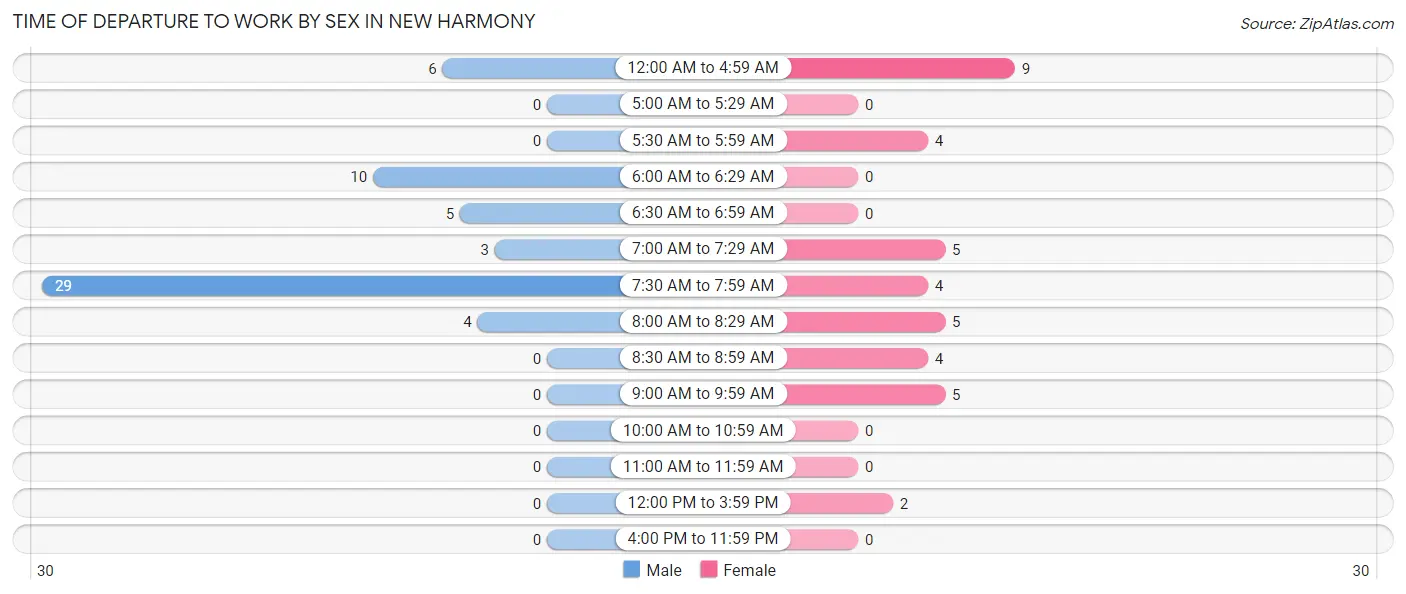
| Time of Departure | Male | Female |
| 12:00 AM to 4:59 AM | 6 (10.5%) | 9 (23.7%) |
| 5:00 AM to 5:29 AM | 0 (0.0%) | 0 (0.0%) |
| 5:30 AM to 5:59 AM | 0 (0.0%) | 4 (10.5%) |
| 6:00 AM to 6:29 AM | 10 (17.5%) | 0 (0.0%) |
| 6:30 AM to 6:59 AM | 5 (8.8%) | 0 (0.0%) |
| 7:00 AM to 7:29 AM | 3 (5.3%) | 5 (13.2%) |
| 7:30 AM to 7:59 AM | 29 (50.9%) | 4 (10.5%) |
| 8:00 AM to 8:29 AM | 4 (7.0%) | 5 (13.2%) |
| 8:30 AM to 8:59 AM | 0 (0.0%) | 4 (10.5%) |
| 9:00 AM to 9:59 AM | 0 (0.0%) | 5 (13.2%) |
| 10:00 AM to 10:59 AM | 0 (0.0%) | 0 (0.0%) |
| 11:00 AM to 11:59 AM | 0 (0.0%) | 0 (0.0%) |
| 12:00 PM to 3:59 PM | 0 (0.0%) | 2 (5.3%) |
| 4:00 PM to 11:59 PM | 0 (0.0%) | 0 (0.0%) |
| Total | 57 (100.0%) | 38 (100.0%) |
Housing Occupancy in New Harmony
Occupancy by Ownership in New Harmony
Of the total 137 dwellings in New Harmony, owner-occupied units account for 100 (73.0%), while renter-occupied units make up 37 (27.0%).
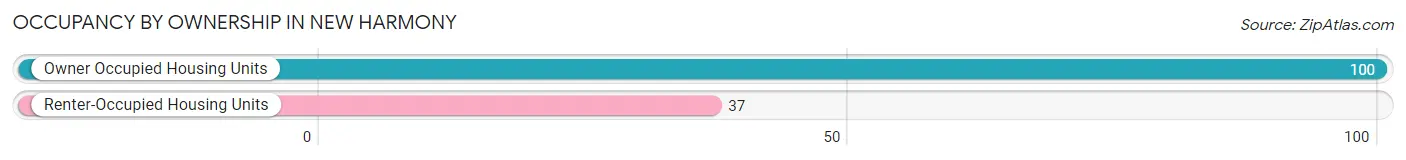
| Occupancy | # Housing Units | % Housing Units |
| Owner Occupied Housing Units | 100 | 73.0% |
| Renter-Occupied Housing Units | 37 | 27.0% |
| Total Occupied Housing Units | 137 | 100.0% |
Occupancy by Household Size in New Harmony
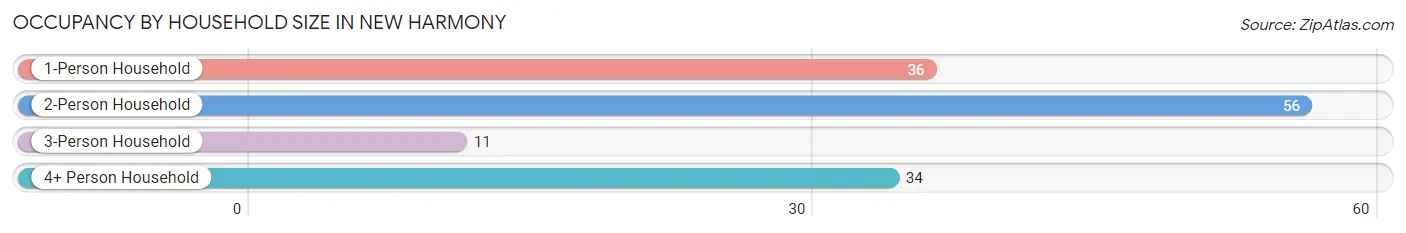
| Household Size | # Housing Units | % Housing Units |
| 1-Person Household | 36 | 26.3% |
| 2-Person Household | 56 | 40.9% |
| 3-Person Household | 11 | 8.0% |
| 4+ Person Household | 34 | 24.8% |
| Total Housing Units | 137 | 100.0% |
Occupancy by Ownership by Household Size in New Harmony
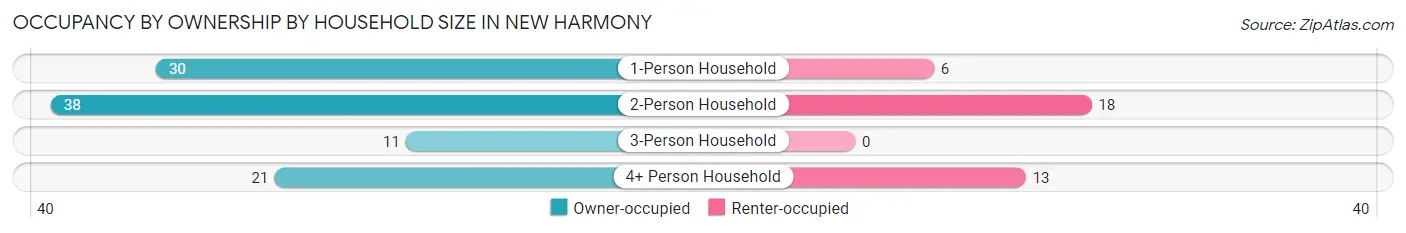
| Household Size | Owner-occupied | Renter-occupied |
| 1-Person Household | 30 (83.3%) | 6 (16.7%) |
| 2-Person Household | 38 (67.9%) | 18 (32.1%) |
| 3-Person Household | 11 (100.0%) | 0 (0.0%) |
| 4+ Person Household | 21 (61.8%) | 13 (38.2%) |
| Total Housing Units | 100 (73.0%) | 37 (27.0%) |
Occupancy by Educational Attainment in New Harmony
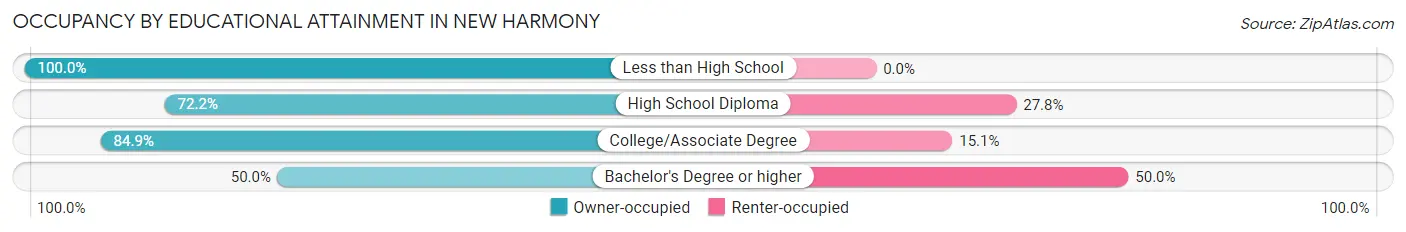
| Household Size | Owner-occupied | Renter-occupied |
| Less than High School | 18 (100.0%) | 0 (0.0%) |
| High School Diploma | 13 (72.2%) | 5 (27.8%) |
| College/Associate Degree | 45 (84.9%) | 8 (15.1%) |
| Bachelor's Degree or higher | 24 (50.0%) | 24 (50.0%) |
Occupancy by Age of Householder in New Harmony
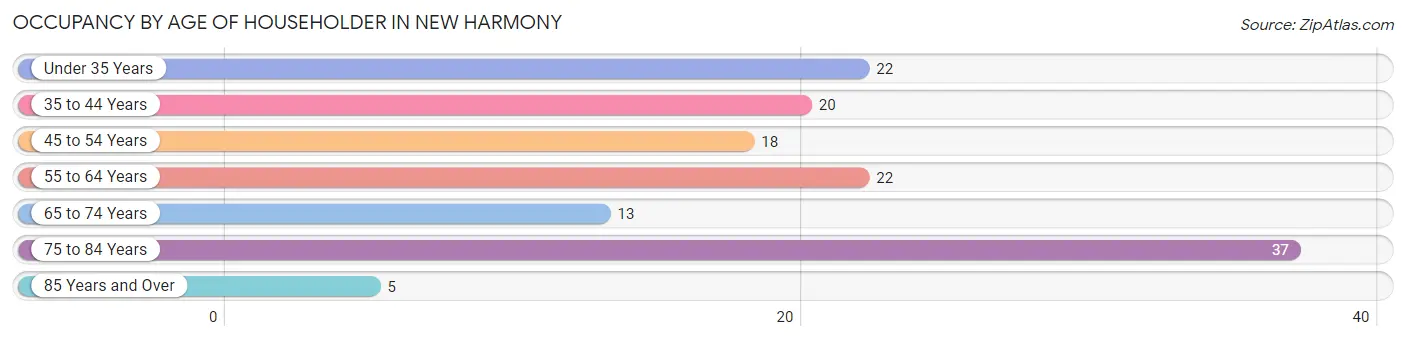
| Age Bracket | # Households | % Households |
| Under 35 Years | 22 | 16.1% |
| 35 to 44 Years | 20 | 14.6% |
| 45 to 54 Years | 18 | 13.1% |
| 55 to 64 Years | 22 | 16.1% |
| 65 to 74 Years | 13 | 9.5% |
| 75 to 84 Years | 37 | 27.0% |
| 85 Years and Over | 5 | 3.6% |
| Total | 137 | 100.0% |
Housing Finances in New Harmony
Median Income by Occupancy in New Harmony
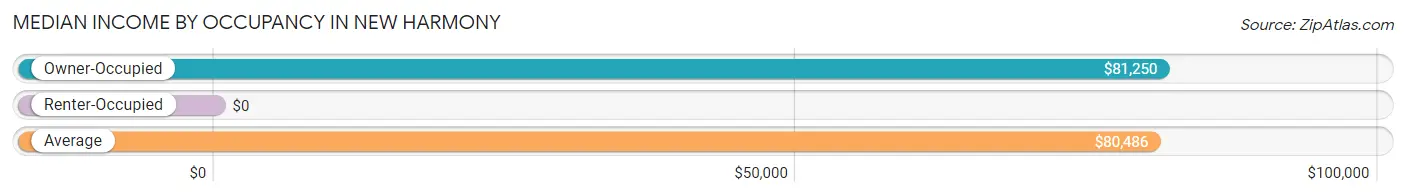
| Occupancy Type | # Households | Median Income |
| Owner-Occupied | 100 (73.0%) | $81,250 |
| Renter-Occupied | 37 (27.0%) | $0 |
| Average | 137 (100.0%) | $80,486 |
Occupancy by Householder Income Bracket in New Harmony
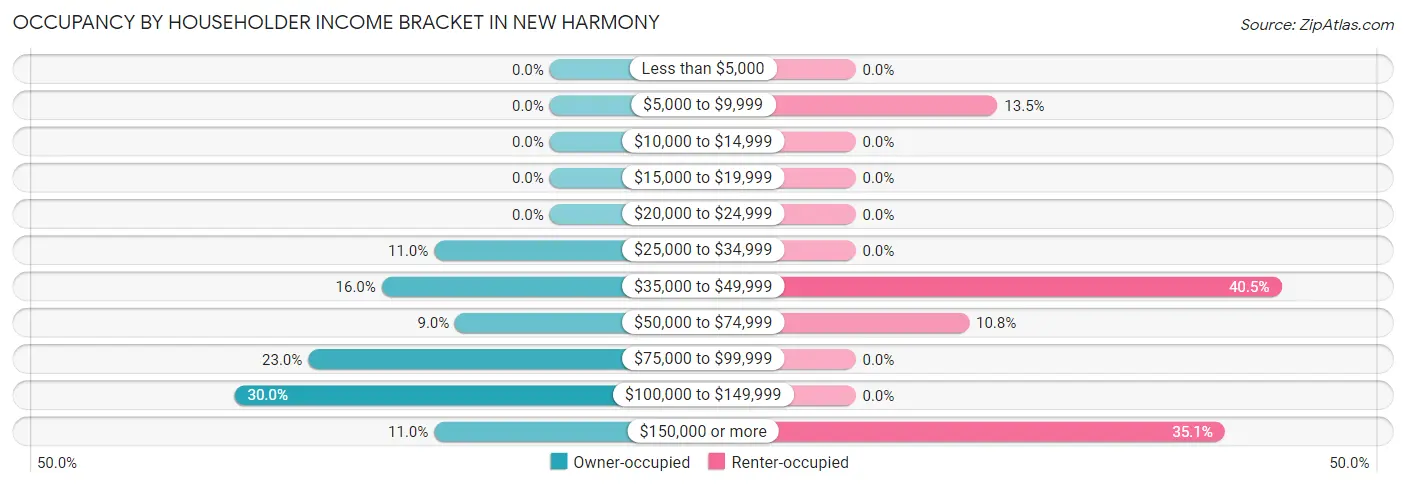
| Income Bracket | Owner-occupied | Renter-occupied |
| Less than $5,000 | 0 (0.0%) | 0 (0.0%) |
| $5,000 to $9,999 | 0 (0.0%) | 5 (13.5%) |
| $10,000 to $14,999 | 0 (0.0%) | 0 (0.0%) |
| $15,000 to $19,999 | 0 (0.0%) | 0 (0.0%) |
| $20,000 to $24,999 | 0 (0.0%) | 0 (0.0%) |
| $25,000 to $34,999 | 11 (11.0%) | 0 (0.0%) |
| $35,000 to $49,999 | 16 (16.0%) | 15 (40.5%) |
| $50,000 to $74,999 | 9 (9.0%) | 4 (10.8%) |
| $75,000 to $99,999 | 23 (23.0%) | 0 (0.0%) |
| $100,000 to $149,999 | 30 (30.0%) | 0 (0.0%) |
| $150,000 or more | 11 (11.0%) | 13 (35.1%) |
| Total | 100 (100.0%) | 37 (100.0%) |
Monthly Housing Cost Tiers in New Harmony
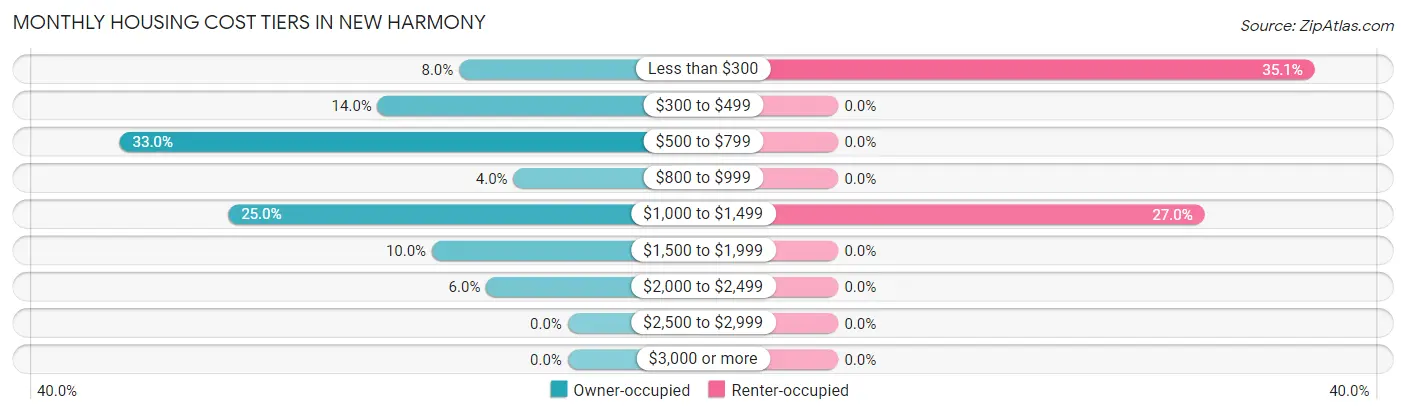
| Monthly Cost | Owner-occupied | Renter-occupied |
| Less than $300 | 8 (8.0%) | 13 (35.1%) |
| $300 to $499 | 14 (14.0%) | 0 (0.0%) |
| $500 to $799 | 33 (33.0%) | 0 (0.0%) |
| $800 to $999 | 4 (4.0%) | 0 (0.0%) |
| $1,000 to $1,499 | 25 (25.0%) | 10 (27.0%) |
| $1,500 to $1,999 | 10 (10.0%) | 0 (0.0%) |
| $2,000 to $2,499 | 6 (6.0%) | 0 (0.0%) |
| $2,500 to $2,999 | 0 (0.0%) | 0 (0.0%) |
| $3,000 or more | 0 (0.0%) | 0 (0.0%) |
| Total | 100 (100.0%) | 37 (100.0%) |
Physical Housing Characteristics in New Harmony
Housing Structures in New Harmony
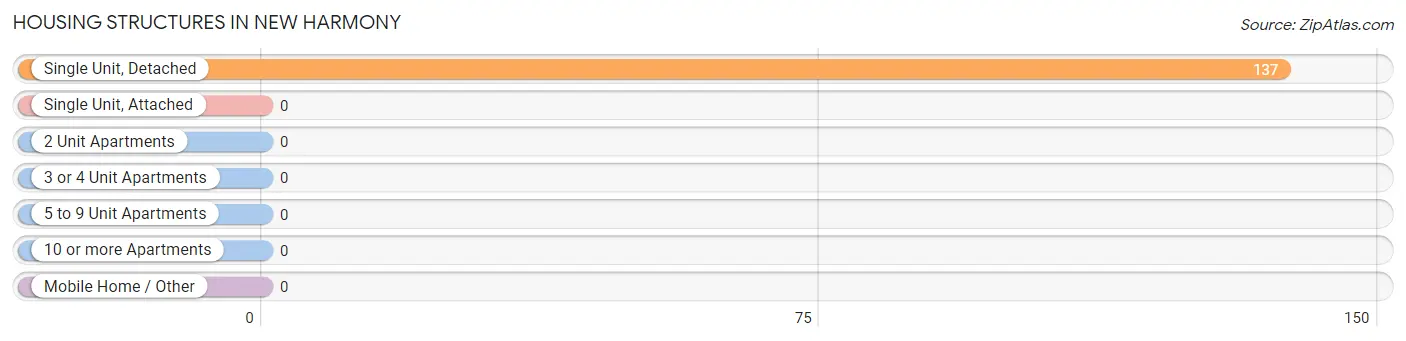
| Structure Type | # Housing Units | % Housing Units |
| Single Unit, Detached | 137 | 100.0% |
| Single Unit, Attached | 0 | 0.0% |
| 2 Unit Apartments | 0 | 0.0% |
| 3 or 4 Unit Apartments | 0 | 0.0% |
| 5 to 9 Unit Apartments | 0 | 0.0% |
| 10 or more Apartments | 0 | 0.0% |
| Mobile Home / Other | 0 | 0.0% |
| Total | 137 | 100.0% |
Housing Structures by Occupancy in New Harmony
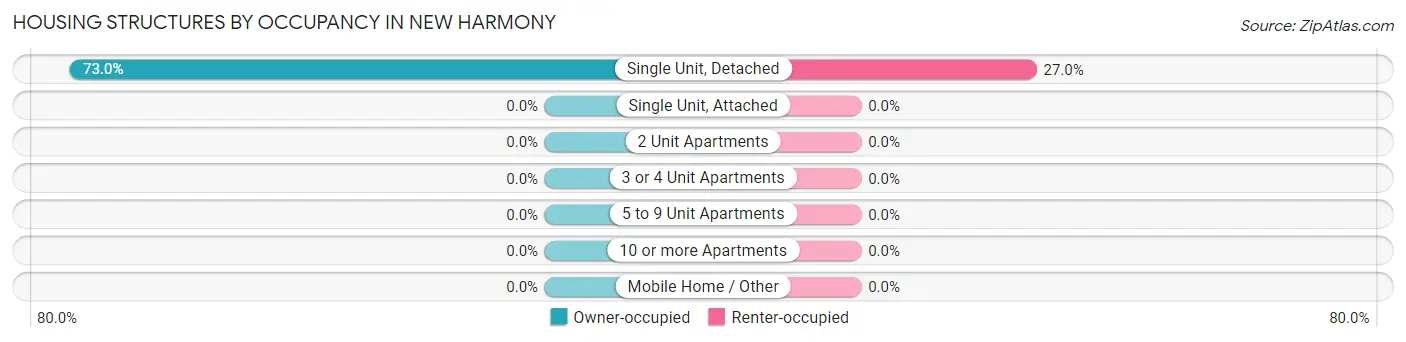
| Structure Type | Owner-occupied | Renter-occupied |
| Single Unit, Detached | 100 (73.0%) | 37 (27.0%) |
| Single Unit, Attached | 0 (0.0%) | 0 (0.0%) |
| 2 Unit Apartments | 0 (0.0%) | 0 (0.0%) |
| 3 or 4 Unit Apartments | 0 (0.0%) | 0 (0.0%) |
| 5 to 9 Unit Apartments | 0 (0.0%) | 0 (0.0%) |
| 10 or more Apartments | 0 (0.0%) | 0 (0.0%) |
| Mobile Home / Other | 0 (0.0%) | 0 (0.0%) |
| Total | 100 (73.0%) | 37 (27.0%) |
Housing Structures by Number of Rooms in New Harmony
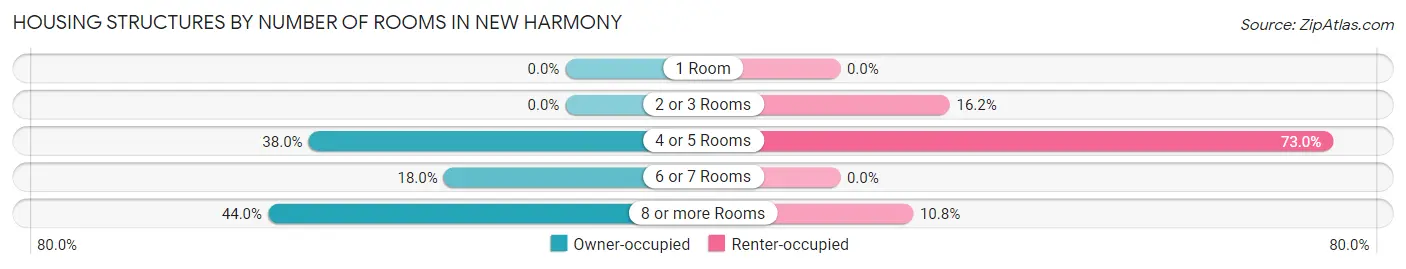
| Number of Rooms | Owner-occupied | Renter-occupied |
| 1 Room | 0 (0.0%) | 0 (0.0%) |
| 2 or 3 Rooms | 0 (0.0%) | 6 (16.2%) |
| 4 or 5 Rooms | 38 (38.0%) | 27 (73.0%) |
| 6 or 7 Rooms | 18 (18.0%) | 0 (0.0%) |
| 8 or more Rooms | 44 (44.0%) | 4 (10.8%) |
| Total | 100 (100.0%) | 37 (100.0%) |
Housing Structure by Heating Type in New Harmony
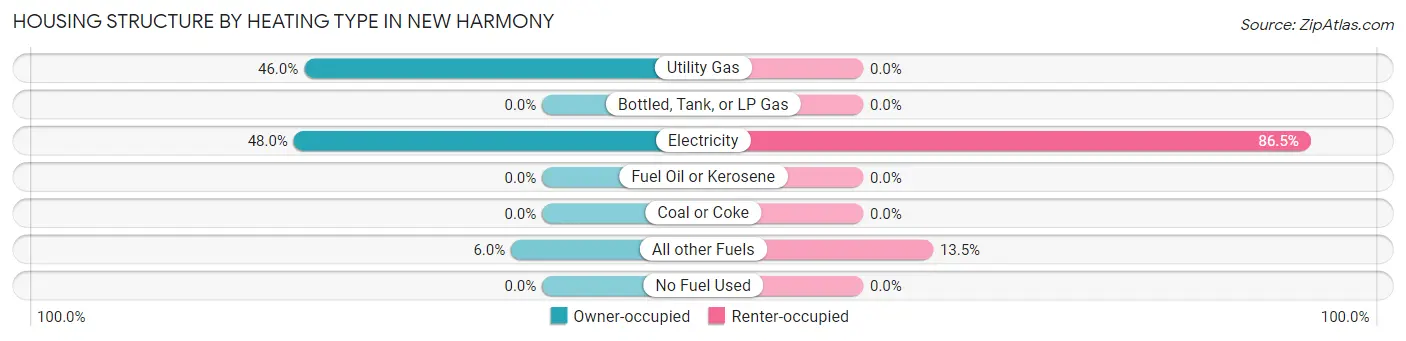
| Heating Type | Owner-occupied | Renter-occupied |
| Utility Gas | 46 (46.0%) | 0 (0.0%) |
| Bottled, Tank, or LP Gas | 0 (0.0%) | 0 (0.0%) |
| Electricity | 48 (48.0%) | 32 (86.5%) |
| Fuel Oil or Kerosene | 0 (0.0%) | 0 (0.0%) |
| Coal or Coke | 0 (0.0%) | 0 (0.0%) |
| All other Fuels | 6 (6.0%) | 5 (13.5%) |
| No Fuel Used | 0 (0.0%) | 0 (0.0%) |
| Total | 100 (100.0%) | 37 (100.0%) |
Household Vehicle Usage in New Harmony
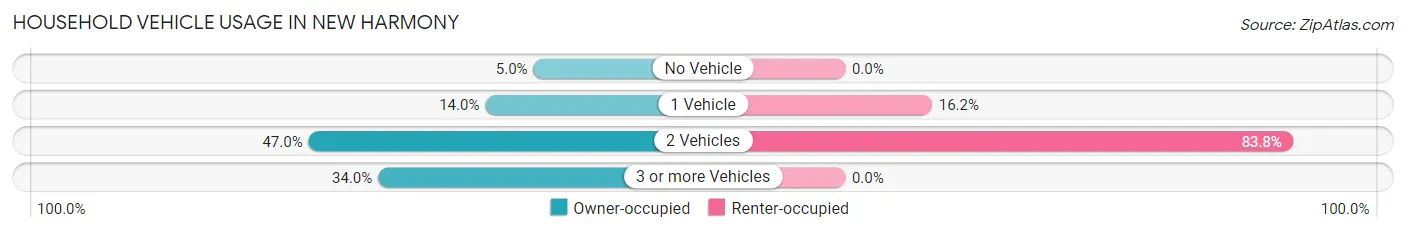
| Vehicles per Household | Owner-occupied | Renter-occupied |
| No Vehicle | 5 (5.0%) | 0 (0.0%) |
| 1 Vehicle | 14 (14.0%) | 6 (16.2%) |
| 2 Vehicles | 47 (47.0%) | 31 (83.8%) |
| 3 or more Vehicles | 34 (34.0%) | 0 (0.0%) |
| Total | 100 (100.0%) | 37 (100.0%) |
Real Estate & Mortgages in New Harmony
Real Estate and Mortgage Overview in New Harmony
| Characteristic | Without Mortgage | With Mortgage |
| Housing Units | 57 | 43 |
| Median Property Value | $594,700 | $296,900 |
| Median Household Income | $81,875 | $5 |
| Monthly Housing Costs | $706 | $0 |
| Real Estate Taxes | - | - |
Property Value by Mortgage Status in New Harmony
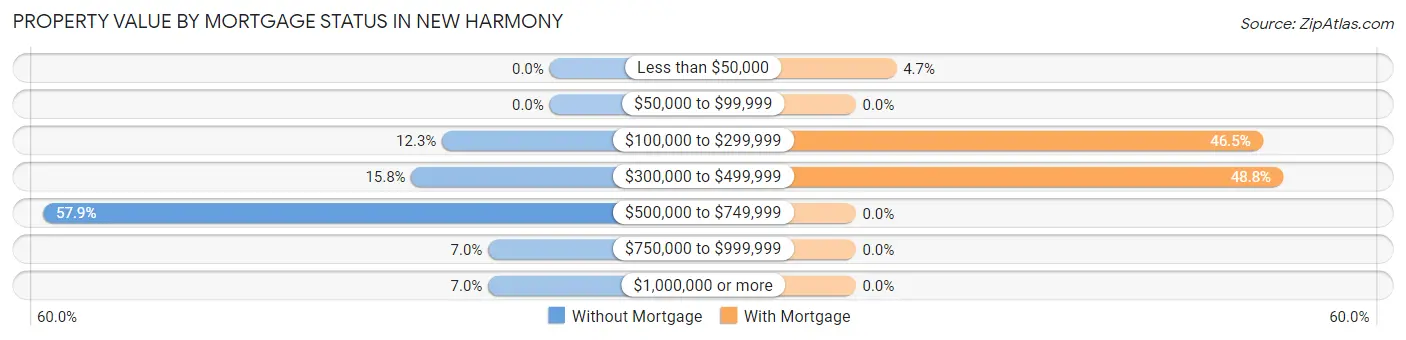
| Property Value | Without Mortgage | With Mortgage |
| Less than $50,000 | 0 (0.0%) | 2 (4.6%) |
| $50,000 to $99,999 | 0 (0.0%) | 0 (0.0%) |
| $100,000 to $299,999 | 7 (12.3%) | 20 (46.5%) |
| $300,000 to $499,999 | 9 (15.8%) | 21 (48.8%) |
| $500,000 to $749,999 | 33 (57.9%) | 0 (0.0%) |
| $750,000 to $999,999 | 4 (7.0%) | 0 (0.0%) |
| $1,000,000 or more | 4 (7.0%) | 0 (0.0%) |
| Total | 57 (100.0%) | 43 (100.0%) |
Household Income by Mortgage Status in New Harmony
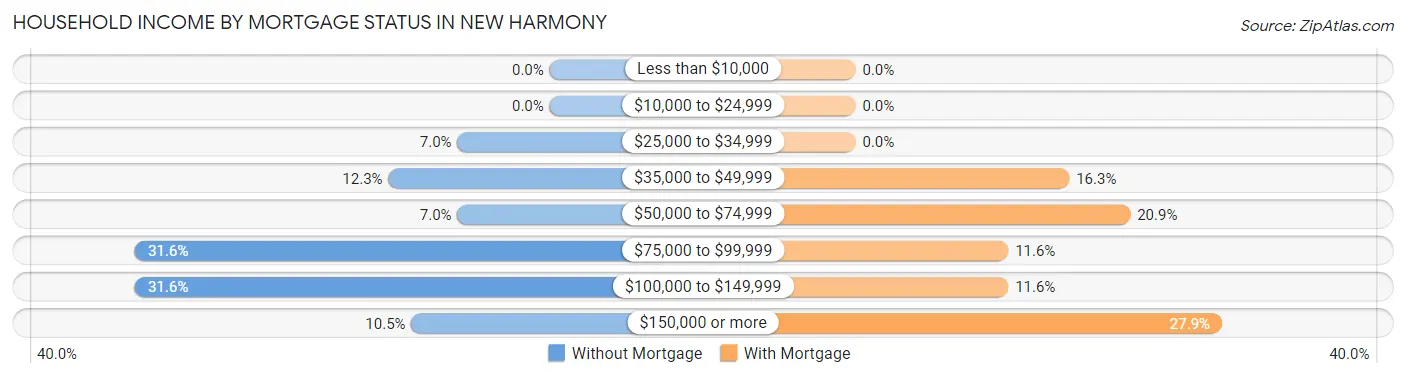
| Household Income | Without Mortgage | With Mortgage |
| Less than $10,000 | 0 (0.0%) | 0 (0.0%) |
| $10,000 to $24,999 | 0 (0.0%) | 0 (0.0%) |
| $25,000 to $34,999 | 4 (7.0%) | 0 (0.0%) |
| $35,000 to $49,999 | 7 (12.3%) | 7 (16.3%) |
| $50,000 to $74,999 | 4 (7.0%) | 9 (20.9%) |
| $75,000 to $99,999 | 18 (31.6%) | 5 (11.6%) |
| $100,000 to $149,999 | 18 (31.6%) | 5 (11.6%) |
| $150,000 or more | 6 (10.5%) | 12 (27.9%) |
| Total | 57 (100.0%) | 43 (100.0%) |
Property Value to Household Income Ratio in New Harmony
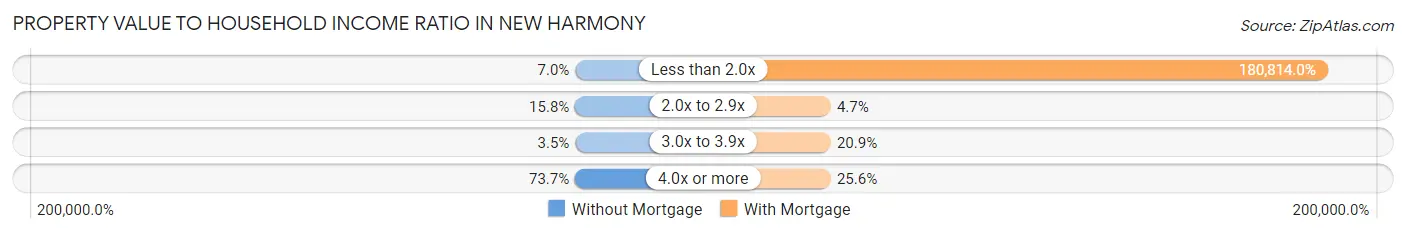
| Value-to-Income Ratio | Without Mortgage | With Mortgage |
| Less than 2.0x | 4 (7.0%) | 77,750 (180,813.9%) |
| 2.0x to 2.9x | 9 (15.8%) | 2 (4.6%) |
| 3.0x to 3.9x | 2 (3.5%) | 9 (20.9%) |
| 4.0x or more | 42 (73.7%) | 11 (25.6%) |
| Total | 57 (100.0%) | 43 (100.0%) |
Real Estate Taxes by Mortgage Status in New Harmony
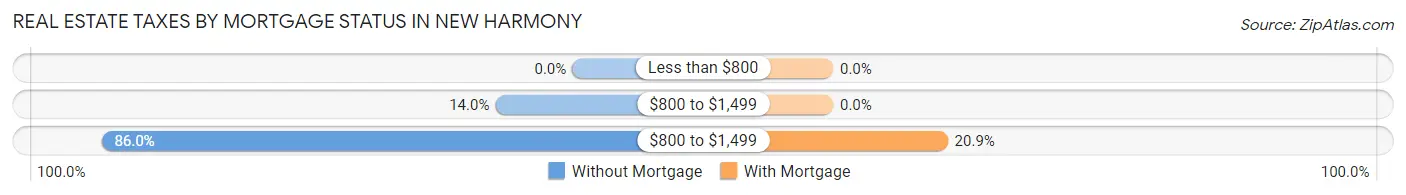
| Property Taxes | Without Mortgage | With Mortgage |
| Less than $800 | 0 (0.0%) | 0 (0.0%) |
| $800 to $1,499 | 8 (14.0%) | 0 (0.0%) |
| $800 to $1,499 | 49 (86.0%) | 9 (20.9%) |
| Total | 57 (100.0%) | 43 (100.0%) |
Health & Disability in New Harmony
Health Insurance Coverage by Age in New Harmony
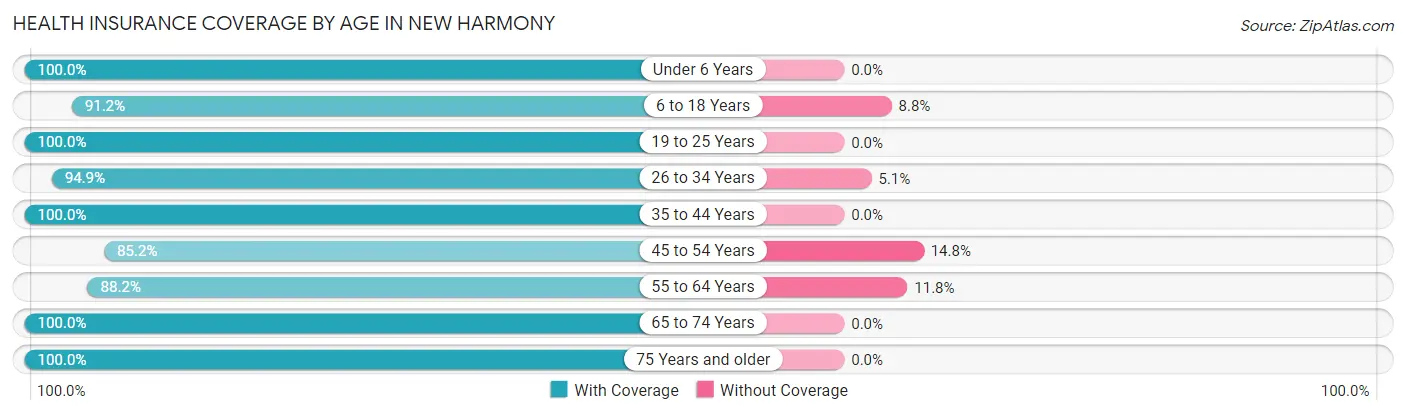
| Age Bracket | With Coverage | Without Coverage |
| Under 6 Years | 44 (100.0%) | 0 (0.0%) |
| 6 to 18 Years | 31 (91.2%) | 3 (8.8%) |
| 19 to 25 Years | 12 (100.0%) | 0 (0.0%) |
| 26 to 34 Years | 56 (94.9%) | 3 (5.1%) |
| 35 to 44 Years | 38 (100.0%) | 0 (0.0%) |
| 45 to 54 Years | 23 (85.2%) | 4 (14.8%) |
| 55 to 64 Years | 45 (88.2%) | 6 (11.8%) |
| 65 to 74 Years | 28 (100.0%) | 0 (0.0%) |
| 75 Years and older | 63 (100.0%) | 0 (0.0%) |
| Total | 340 (95.5%) | 16 (4.5%) |
Health Insurance Coverage by Citizenship Status in New Harmony
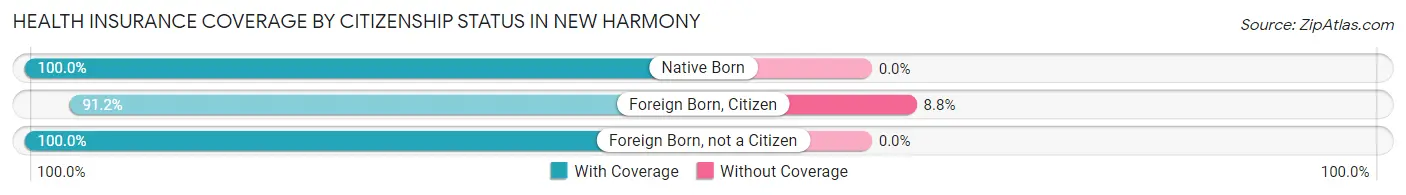
| Citizenship Status | With Coverage | Without Coverage |
| Native Born | 44 (100.0%) | 0 (0.0%) |
| Foreign Born, Citizen | 31 (91.2%) | 3 (8.8%) |
| Foreign Born, not a Citizen | 12 (100.0%) | 0 (0.0%) |
Health Insurance Coverage by Household Income in New Harmony
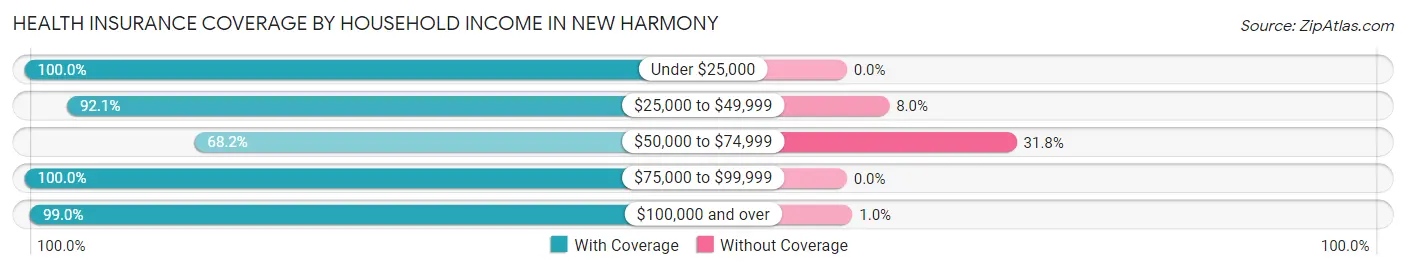
| Household Income | With Coverage | Without Coverage |
| Under $25,000 | 10 (100.0%) | 0 (0.0%) |
| $25,000 to $49,999 | 81 (92.0%) | 7 (8.0%) |
| $50,000 to $74,999 | 15 (68.2%) | 7 (31.8%) |
| $75,000 to $99,999 | 44 (100.0%) | 0 (0.0%) |
| $100,000 and over | 190 (99.0%) | 2 (1.0%) |
Public vs Private Health Insurance Coverage by Age in New Harmony
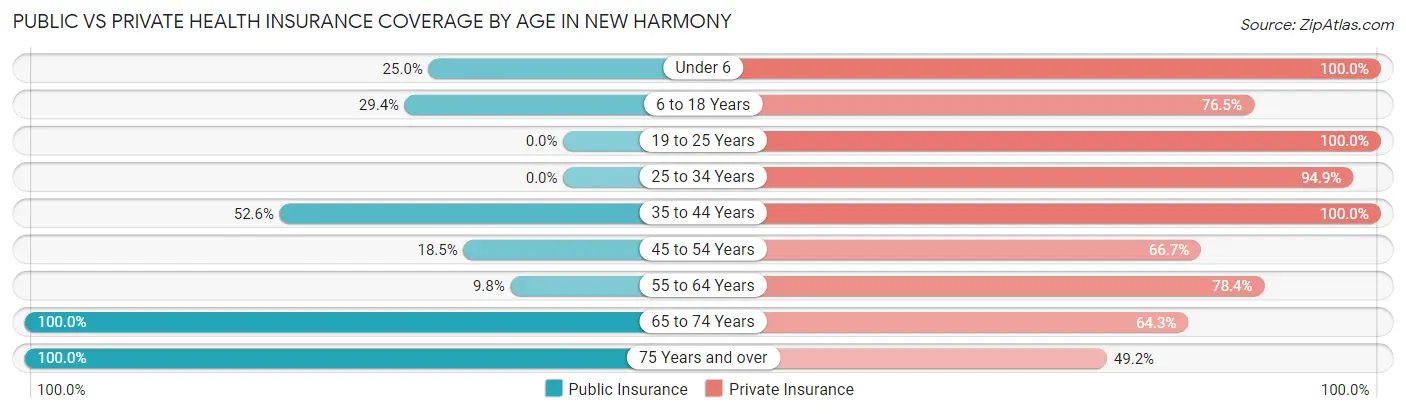
| Age Bracket | Public Insurance | Private Insurance |
| Under 6 | 11 (25.0%) | 44 (100.0%) |
| 6 to 18 Years | 10 (29.4%) | 26 (76.5%) |
| 19 to 25 Years | 0 (0.0%) | 12 (100.0%) |
| 25 to 34 Years | 0 (0.0%) | 56 (94.9%) |
| 35 to 44 Years | 20 (52.6%) | 38 (100.0%) |
| 45 to 54 Years | 5 (18.5%) | 18 (66.7%) |
| 55 to 64 Years | 5 (9.8%) | 40 (78.4%) |
| 65 to 74 Years | 28 (100.0%) | 18 (64.3%) |
| 75 Years and over | 63 (100.0%) | 31 (49.2%) |
| Total | 142 (39.9%) | 283 (79.5%) |
Disability Status by Sex by Age in New Harmony
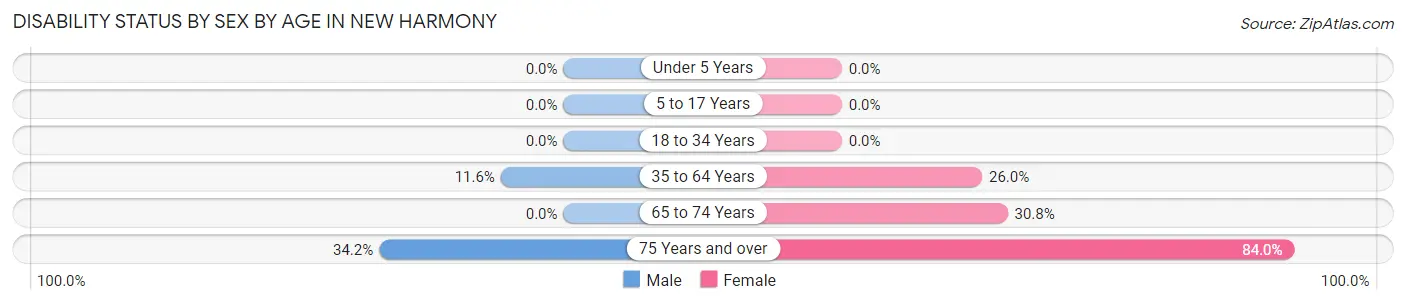
| Age Bracket | Male | Female |
| Under 5 Years | 0 (0.0%) | 0 (0.0%) |
| 5 to 17 Years | 0 (0.0%) | 0 (0.0%) |
| 18 to 34 Years | 0 (0.0%) | 0 (0.0%) |
| 35 to 64 Years | 5 (11.6%) | 19 (26.0%) |
| 65 to 74 Years | 0 (0.0%) | 4 (30.8%) |
| 75 Years and over | 13 (34.2%) | 21 (84.0%) |
Disability Class by Sex by Age in New Harmony
Disability Class: Hearing Difficulty
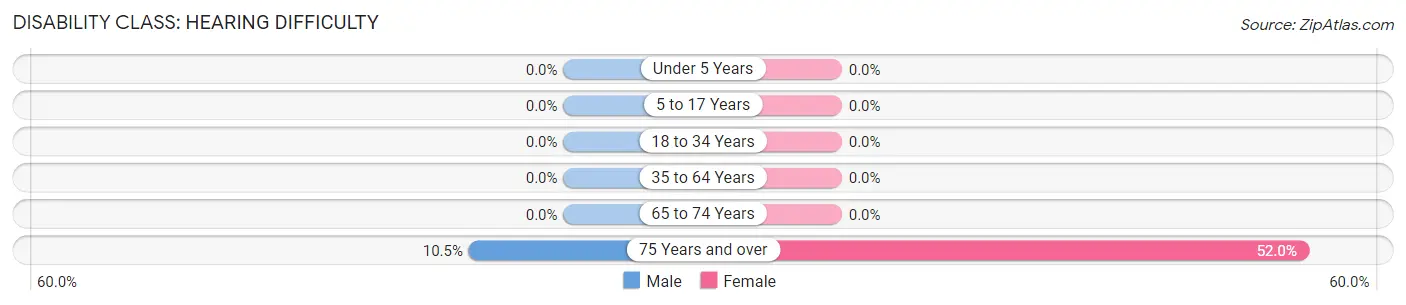
| Age Bracket | Male | Female |
| Under 5 Years | 0 (0.0%) | 0 (0.0%) |
| 5 to 17 Years | 0 (0.0%) | 0 (0.0%) |
| 18 to 34 Years | 0 (0.0%) | 0 (0.0%) |
| 35 to 64 Years | 0 (0.0%) | 0 (0.0%) |
| 65 to 74 Years | 0 (0.0%) | 0 (0.0%) |
| 75 Years and over | 4 (10.5%) | 13 (52.0%) |
Disability Class: Vision Difficulty
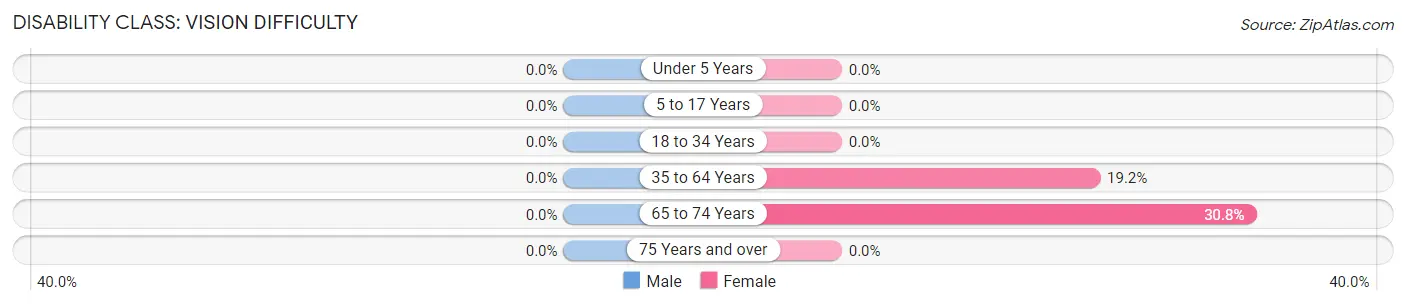
| Age Bracket | Male | Female |
| Under 5 Years | 0 (0.0%) | 0 (0.0%) |
| 5 to 17 Years | 0 (0.0%) | 0 (0.0%) |
| 18 to 34 Years | 0 (0.0%) | 0 (0.0%) |
| 35 to 64 Years | 0 (0.0%) | 14 (19.2%) |
| 65 to 74 Years | 0 (0.0%) | 4 (30.8%) |
| 75 Years and over | 0 (0.0%) | 0 (0.0%) |
Disability Class: Cognitive Difficulty
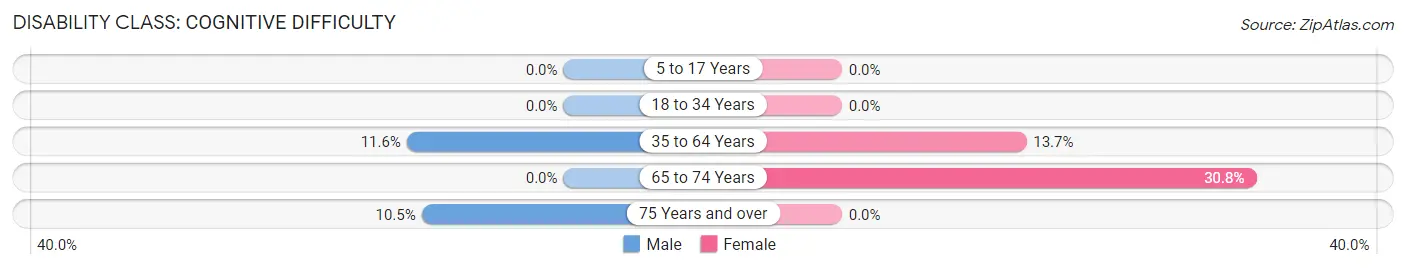
| Age Bracket | Male | Female |
| 5 to 17 Years | 0 (0.0%) | 0 (0.0%) |
| 18 to 34 Years | 0 (0.0%) | 0 (0.0%) |
| 35 to 64 Years | 5 (11.6%) | 10 (13.7%) |
| 65 to 74 Years | 0 (0.0%) | 4 (30.8%) |
| 75 Years and over | 4 (10.5%) | 0 (0.0%) |
Disability Class: Ambulatory Difficulty
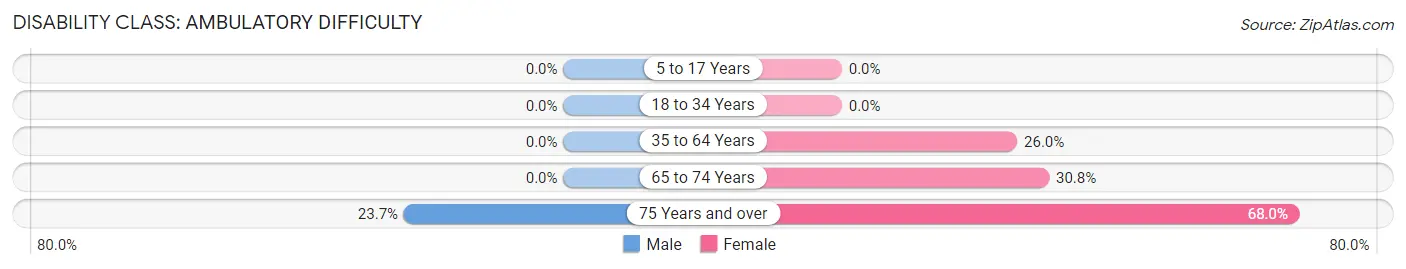
| Age Bracket | Male | Female |
| 5 to 17 Years | 0 (0.0%) | 0 (0.0%) |
| 18 to 34 Years | 0 (0.0%) | 0 (0.0%) |
| 35 to 64 Years | 0 (0.0%) | 19 (26.0%) |
| 65 to 74 Years | 0 (0.0%) | 4 (30.8%) |
| 75 Years and over | 9 (23.7%) | 17 (68.0%) |
Disability Class: Self-Care Difficulty
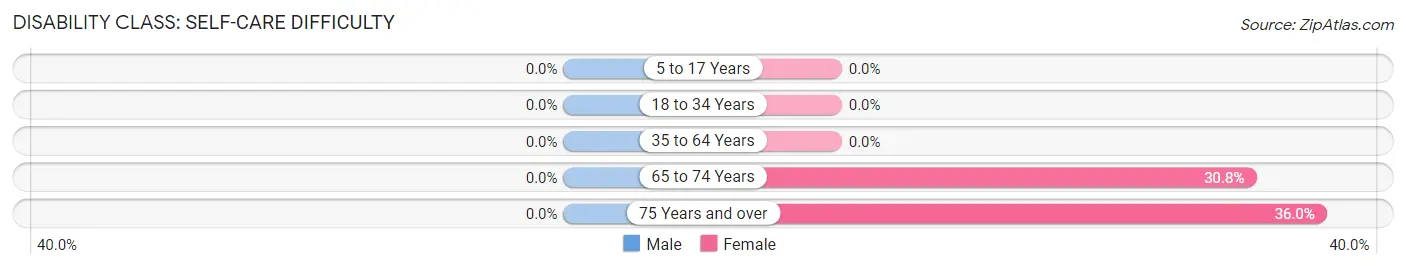
| Age Bracket | Male | Female |
| 5 to 17 Years | 0 (0.0%) | 0 (0.0%) |
| 18 to 34 Years | 0 (0.0%) | 0 (0.0%) |
| 35 to 64 Years | 0 (0.0%) | 0 (0.0%) |
| 65 to 74 Years | 0 (0.0%) | 4 (30.8%) |
| 75 Years and over | 0 (0.0%) | 9 (36.0%) |
Technology Access in New Harmony
Computing Device Access in New Harmony
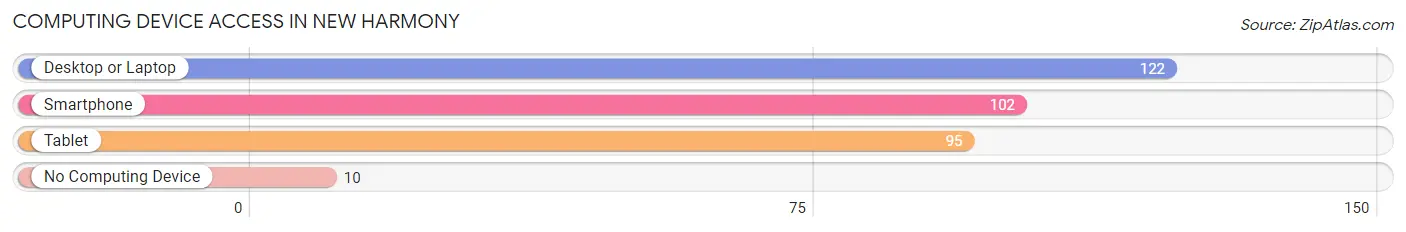
| Device Type | # Households | % Households |
| Desktop or Laptop | 122 | 89.0% |
| Smartphone | 102 | 74.5% |
| Tablet | 95 | 69.3% |
| No Computing Device | 10 | 7.3% |
| Total | 137 | 100.0% |
Internet Access in New Harmony
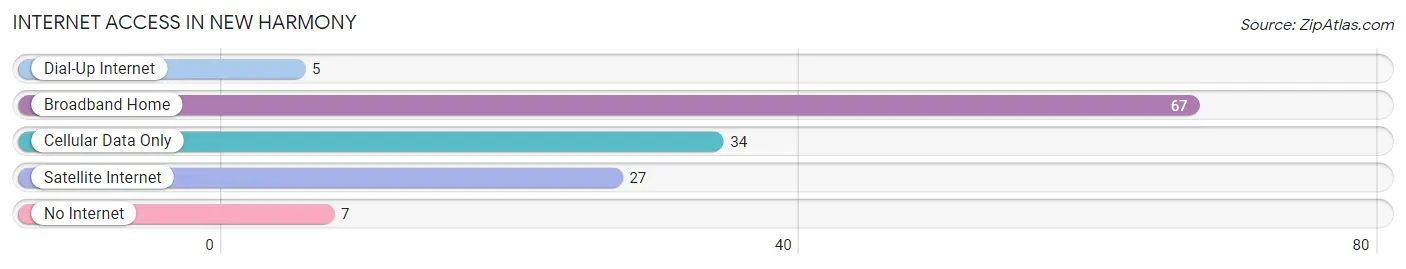
| Internet Type | # Households | % Households |
| Dial-Up Internet | 5 | 3.6% |
| Broadband Home | 67 | 48.9% |
| Cellular Data Only | 34 | 24.8% |
| Satellite Internet | 27 | 19.7% |
| No Internet | 7 | 5.1% |
| Total | 137 | 100.0% |
New Harmony Summary
History
New Harmony, Utah is a small town located in Washington County, Utah. It was founded in 1852 by a group of Mormon pioneers led by John D. Lee. The town was originally named Harmony, but was later changed to New Harmony to avoid confusion with another town in the area. The town was established as a farming community and was home to a variety of businesses, including a sawmill, a gristmill, a blacksmith shop, and a general store.
The town was also home to a number of churches, including the Church of Jesus Christ of Latter-day Saints, the Methodist Episcopal Church, and the Reorganized Church of Jesus Christ of Latter-day Saints. The town was also home to a number of schools, including the New Harmony Academy, which was established in 1875.
The town was also home to a number of businesses, including a hotel, a bank, a post office, and a newspaper. The town was also home to a number of fraternal organizations, including the Masonic Lodge, the Odd Fellows, and the Knights of Pythias.
The town was also home to a number of cultural and recreational activities, including a band, a theater, and a library. The town was also home to a number of festivals, including the New Harmony Days celebration, which was held annually from 1875 to the present day.
Geography
New Harmony is located in the southwestern corner of Utah, in Washington County. It is situated at the intersection of State Route 9 and State Route 17, approximately 25 miles north of St. George and 25 miles south of Cedar City. The town is located in a semi-arid desert climate, with hot summers and mild winters. The average annual temperature is approximately 65 degrees Fahrenheit.
The town is situated at an elevation of 4,400 feet above sea level, and is surrounded by a variety of terrain, including mountains, canyons, and desert. The town is located near the Virgin River, which provides a source of irrigation for the local farms and ranches.
Economy
The economy of New Harmony is largely based on agriculture and tourism. The town is home to a number of farms and ranches, which produce a variety of crops, including alfalfa, hay, corn, wheat, and beans. The town is also home to a number of tourist attractions, including the New Harmony Days celebration, the New Harmony Museum, and the New Harmony Golf Course.
The town is also home to a number of businesses, including restaurants, hotels, and retail stores. The town is also home to a number of manufacturing companies, including a furniture factory and a plastics factory.
Demographics
As of the 2010 census, the population of New Harmony was 1,092. The racial makeup of the town was 95.3% White, 0.7% Native American, 0.3% Asian, 0.2% African American, 0.1% Pacific Islander, and 2.4% from two or more races. The median household income was $37,500, and the median family income was $41,250. The per capita income was $17,845.
Conclusion
New Harmony, Utah is a small town located in Washington County, Utah. It was founded in 1852 by a group of Mormon pioneers and has since become a thriving agricultural and tourist community. The town is home to a variety of businesses, churches, schools, and cultural and recreational activities. The town is also home to a number of manufacturing companies, and the population of the town is largely white. The town is a great example of a small town in the American West that has managed to maintain its unique identity and culture while still adapting to the changing times.
Common Questions
What is Per Capita Income in New Harmony?
Per Capita income in New Harmony is $47,599.
What is the Median Family Income in New Harmony?
Median Family Income in New Harmony is $102,188.
What is the Median Household income in New Harmony?
Median Household Income in New Harmony is $80,486.
What is Income or Wage Gap in New Harmony?
Income or Wage Gap in New Harmony is 32.9%.
Women in New Harmony earn 67.1 cents for every dollar earned by a man.
What is Inequality or Gini Index in New Harmony?
Inequality or Gini Index in New Harmony is 0.47.
What is the Total Population of New Harmony?
Total Population of New Harmony is 356.
What is the Total Male Population of New Harmony?
Total Male Population of New Harmony is 192.
What is the Total Female Population of New Harmony?
Total Female Population of New Harmony is 164.
What is the Ratio of Males per 100 Females in New Harmony?
There are 117.07 Males per 100 Females in New Harmony.
What is the Ratio of Females per 100 Males in New Harmony?
There are 85.42 Females per 100 Males in New Harmony.
What is the Median Population Age in New Harmony?
Median Population Age in New Harmony is 43.3 Years.
What is the Average Family Size in New Harmony
Average Family Size in New Harmony is 3.1 People.
What is the Average Household Size in New Harmony
Average Household Size in New Harmony is 2.6 People.
How Large is the Labor Force in New Harmony?
There are 149 People in the Labor Forcein in New Harmony.
What is the Percentage of People in the Labor Force in New Harmony?
53.0% of People are in the Labor Force in New Harmony.
What is the Unemployment Rate in New Harmony?
Unemployment Rate in New Harmony is 2.0%.