Yorktown, VA Map & Demographics
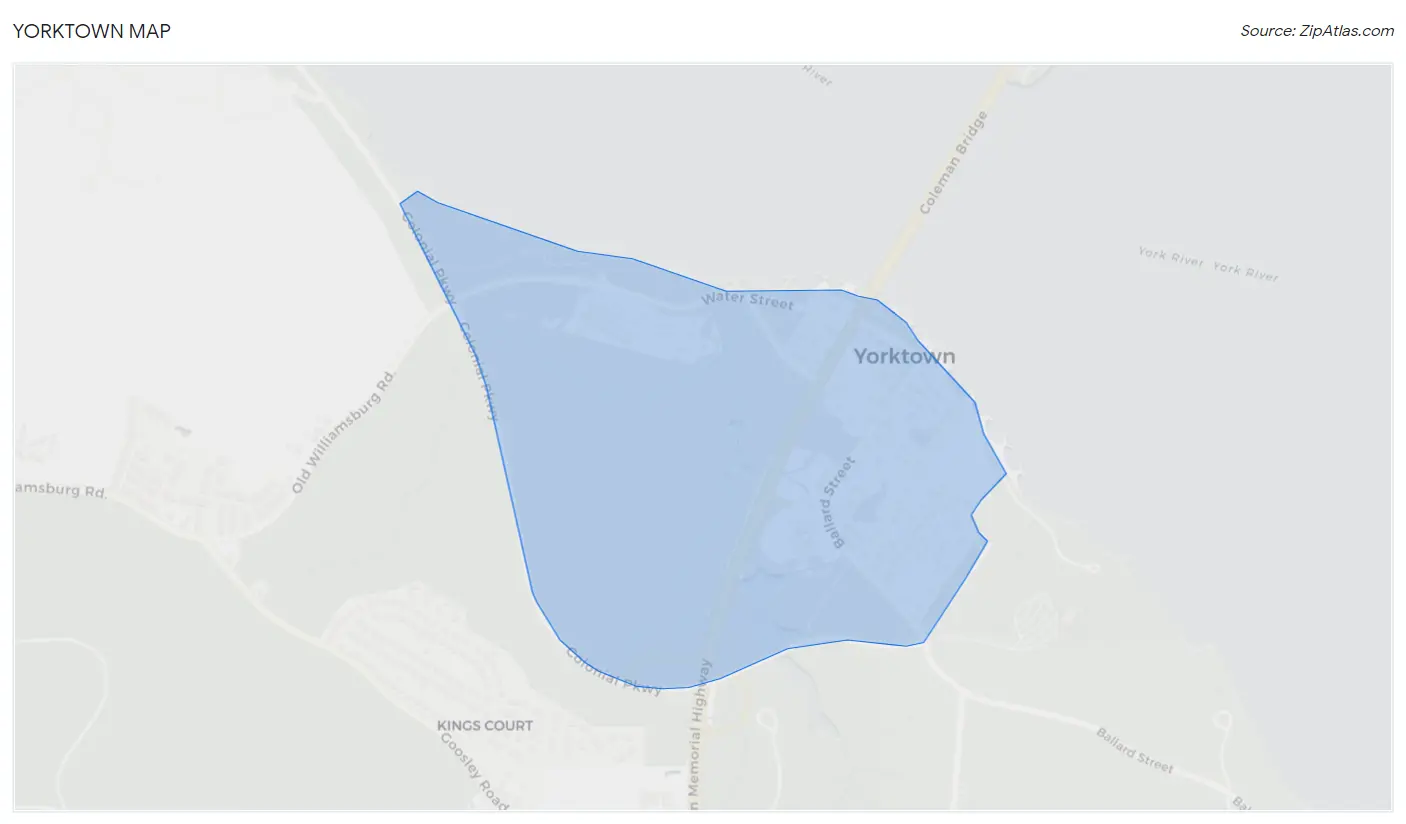
Yorktown Map
Yorktown Overview
$48,696
PER CAPITA INCOME
$104,625
AVG FAMILY INCOME
$78,750
AVG HOUSEHOLD INCOME
0.25
INEQUALITY / GINI INDEX
217
TOTAL POPULATION
126
MALE POPULATION
91
FEMALE POPULATION
138.46
MALES / 100 FEMALES
72.22
FEMALES / 100 MALES
59.3
MEDIAN AGE
2.2
AVG FAMILY SIZE
1.8
AVG HOUSEHOLD SIZE
151
LABOR FORCE [ PEOPLE ]
72.9%
PERCENT IN LABOR FORCE
Yorktown Area Codes
Income in Yorktown
Income Overview in Yorktown
Per Capita Income in Yorktown is $48,696, while median incomes of families and households are $104,625 and $78,750 respectively.
| Characteristic | Number | Measure |
| Per Capita Income | 217 | $48,696 |
| Median Family Income | 49 | $104,625 |
| Mean Family Income | 49 | $116,067 |
| Median Household Income | 120 | $78,750 |
| Mean Household Income | 120 | $84,419 |
| Income Deficit | 49 | $0 |
| Wage / Income Gap (%) | 217 | 0.00% |
| Wage / Income Gap ($) | 217 | 100.00¢ per $1 |
| Gini / Inequality Index | 217 | 0.25 |
Earnings by Sex in Yorktown
| Sex | Number | Average Earnings |
| Male | 99 (65.6%) | $0 |
| Female | 52 (34.4%) | $0 |
| Total | 151 (100.0%) | $0 |
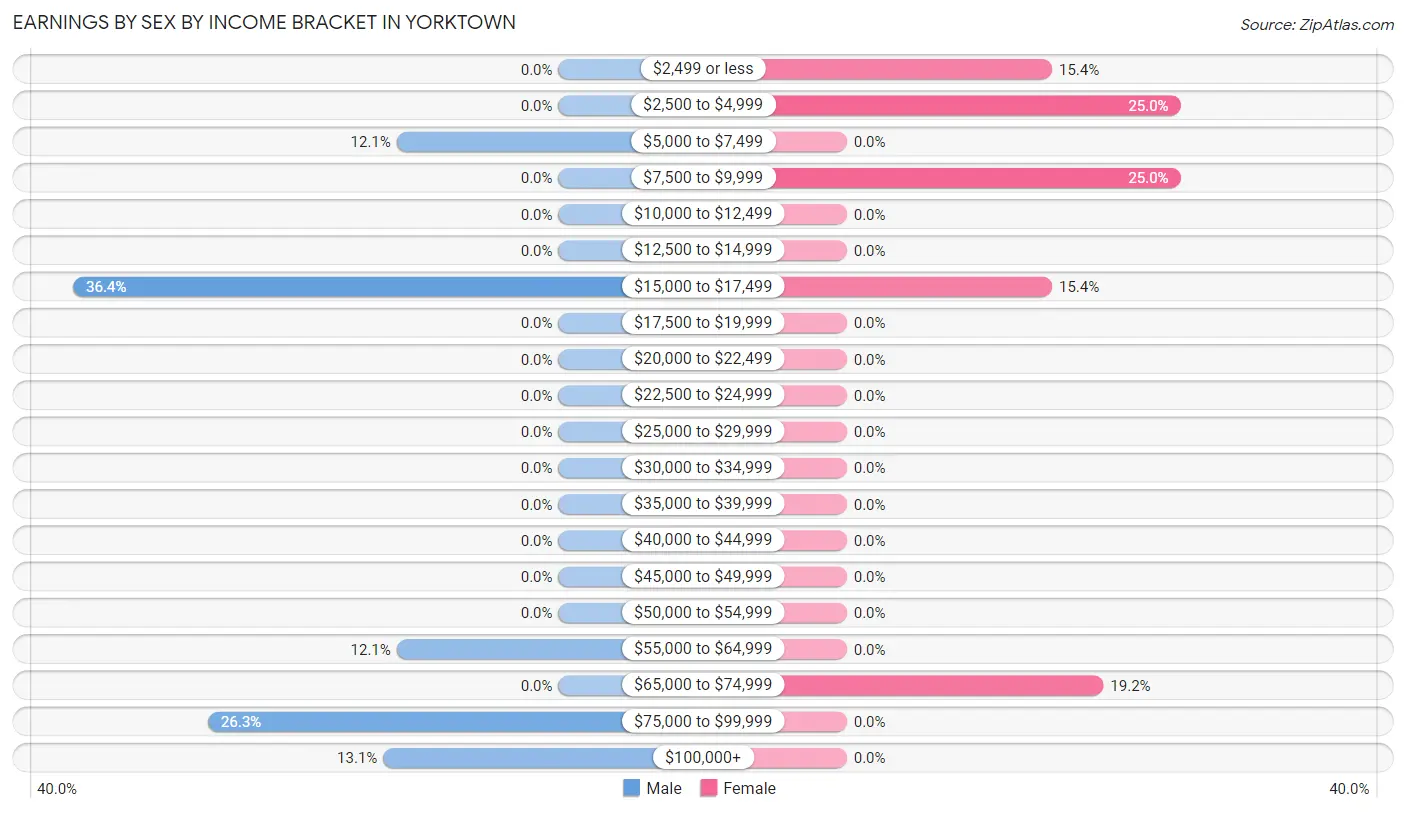
Earnings by Sex by Income Bracket in Yorktown
The most common earnings brackets in Yorktown are $15,000 to $17,499 for men (36 | 36.4%) and $2,500 to $4,999 for women (13 | 25.0%).
| Income | Male | Female |
| $2,499 or less | 0 (0.0%) | 8 (15.4%) |
| $2,500 to $4,999 | 0 (0.0%) | 13 (25.0%) |
| $5,000 to $7,499 | 12 (12.1%) | 0 (0.0%) |
| $7,500 to $9,999 | 0 (0.0%) | 13 (25.0%) |
| $10,000 to $12,499 | 0 (0.0%) | 0 (0.0%) |
| $12,500 to $14,999 | 0 (0.0%) | 0 (0.0%) |
| $15,000 to $17,499 | 36 (36.4%) | 8 (15.4%) |
| $17,500 to $19,999 | 0 (0.0%) | 0 (0.0%) |
| $20,000 to $22,499 | 0 (0.0%) | 0 (0.0%) |
| $22,500 to $24,999 | 0 (0.0%) | 0 (0.0%) |
| $25,000 to $29,999 | 0 (0.0%) | 0 (0.0%) |
| $30,000 to $34,999 | 0 (0.0%) | 0 (0.0%) |
| $35,000 to $39,999 | 0 (0.0%) | 0 (0.0%) |
| $40,000 to $44,999 | 0 (0.0%) | 0 (0.0%) |
| $45,000 to $49,999 | 0 (0.0%) | 0 (0.0%) |
| $50,000 to $54,999 | 0 (0.0%) | 0 (0.0%) |
| $55,000 to $64,999 | 12 (12.1%) | 0 (0.0%) |
| $65,000 to $74,999 | 0 (0.0%) | 10 (19.2%) |
| $75,000 to $99,999 | 26 (26.3%) | 0 (0.0%) |
| $100,000+ | 13 (13.1%) | 0 (0.0%) |
| Total | 99 (100.0%) | 52 (100.0%) |
Earnings by Sex by Educational Attainment in Yorktown
| Educational Attainment | Male Income | Female Income |
| Less than High School | - | - |
| High School Diploma | - | - |
| College or Associate's Degree | - | - |
| Bachelor's Degree | - | - |
| Graduate Degree | - | - |
| Total | - | - |
Family Income in Yorktown
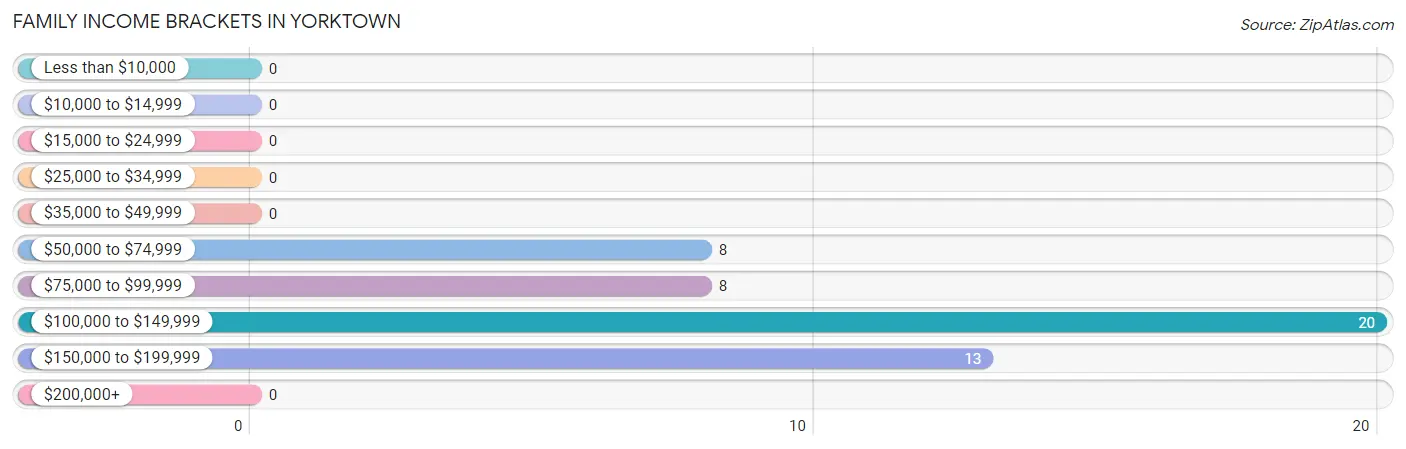
Family Income Brackets in Yorktown
According to the Yorktown family income data, there are 20 families falling into the $100,000 to $149,999 income range, which is the most common income bracket and makes up 40.8% of all families.
| Income Bracket | # Families | % Families |
| Less than $10,000 | 0 | 0.0% |
| $10,000 to $14,999 | 0 | 0.0% |
| $15,000 to $24,999 | 0 | 0.0% |
| $25,000 to $34,999 | 0 | 0.0% |
| $35,000 to $49,999 | 0 | 0.0% |
| $50,000 to $74,999 | 8 | 16.3% |
| $75,000 to $99,999 | 8 | 16.3% |
| $100,000 to $149,999 | 20 | 40.8% |
| $150,000 to $199,999 | 13 | 26.5% |
| $200,000+ | 0 | 0.0% |
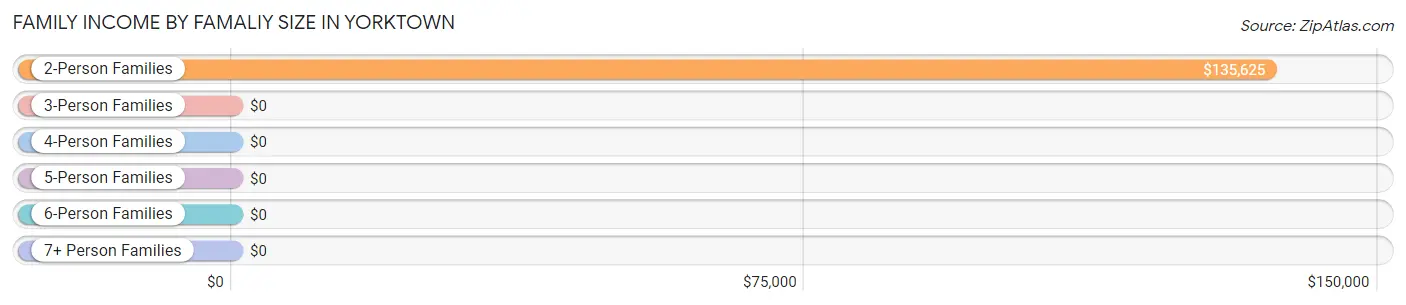
Family Income by Famaliy Size in Yorktown
2-person families (41 | 83.7%) account for the highest median family income in Yorktown with $135,625 per family, while 2-person families (41 | 83.7%) have the highest median income of $67,812 per family member.
| Income Bracket | # Families | Median Income |
| 2-Person Families | 41 (83.7%) | $135,625 |
| 3-Person Families | 8 (16.3%) | $0 |
| 4-Person Families | 0 (0.0%) | $0 |
| 5-Person Families | 0 (0.0%) | $0 |
| 6-Person Families | 0 (0.0%) | $0 |
| 7+ Person Families | 0 (0.0%) | $0 |
| Total | 49 (100.0%) | $104,625 |
Family Income by Number of Earners in Yorktown
| Number of Earners | # Families | Median Income |
| No Earners | 10 (20.4%) | $0 |
| 1 Earner | 18 (36.7%) | $0 |
| 2 Earners | 21 (42.9%) | $0 |
| 3+ Earners | 0 (0.0%) | $0 |
| Total | 49 (100.0%) | $104,625 |
Household Income in Yorktown
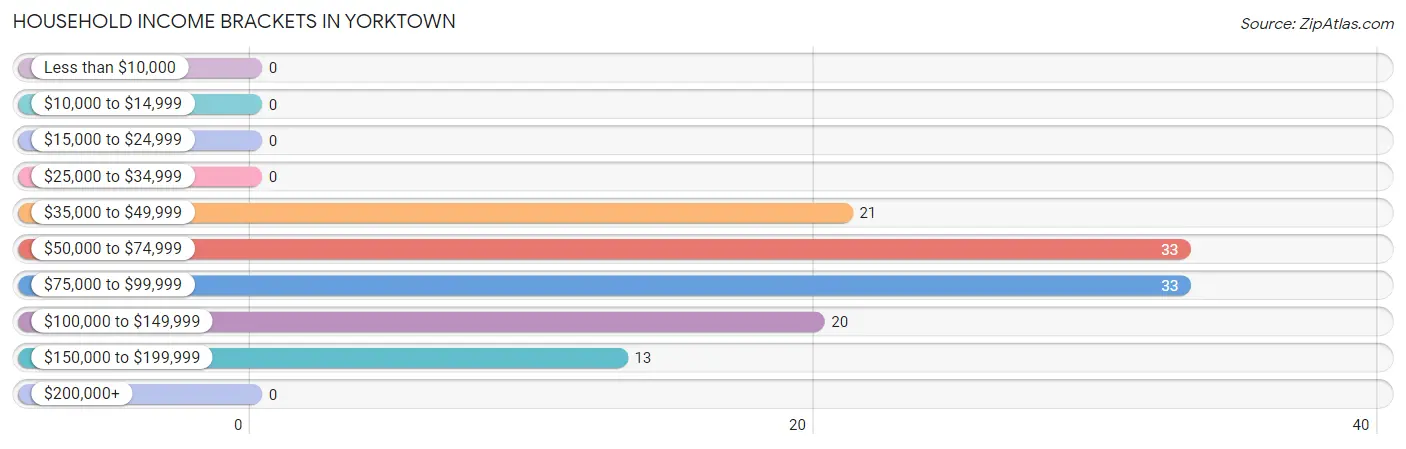
Household Income Brackets in Yorktown
With 33 households falling in the category, the $50,000 to $74,999 income range is the most frequent in Yorktown, accounting for 27.5% of all households.
| Income Bracket | # Households | % Households |
| Less than $10,000 | 0 | 0.0% |
| $10,000 to $14,999 | 0 | 0.0% |
| $15,000 to $24,999 | 0 | 0.0% |
| $25,000 to $34,999 | 0 | 0.0% |
| $35,000 to $49,999 | 21 | 17.5% |
| $50,000 to $74,999 | 33 | 27.5% |
| $75,000 to $99,999 | 33 | 27.5% |
| $100,000 to $149,999 | 20 | 16.7% |
| $150,000 to $199,999 | 13 | 10.8% |
| $200,000+ | 0 | 0.0% |
Household Income by Householder Age in Yorktown
The median household income in Yorktown is $78,750, with the highest median household income of $95,577 found in the 45 to 64 years age bracket for the primary householder. A total of 46 households (38.3%) fall into this category.
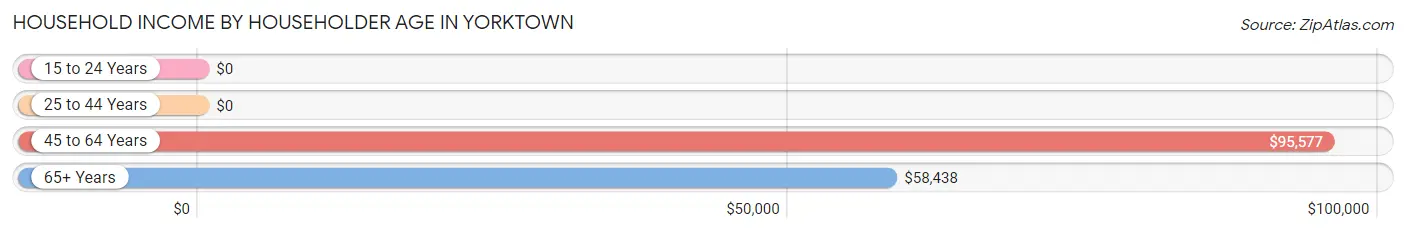
| Income Bracket | # Households | Median Income |
| 15 to 24 Years | 0 (0.0%) | $0 |
| 25 to 44 Years | 0 (0.0%) | $0 |
| 45 to 64 Years | 46 (38.3%) | $95,577 |
| 65+ Years | 74 (61.7%) | $58,438 |
| Total | 120 (100.0%) | $78,750 |
Poverty in Yorktown
Income Below Poverty by Sex and Age in Yorktown
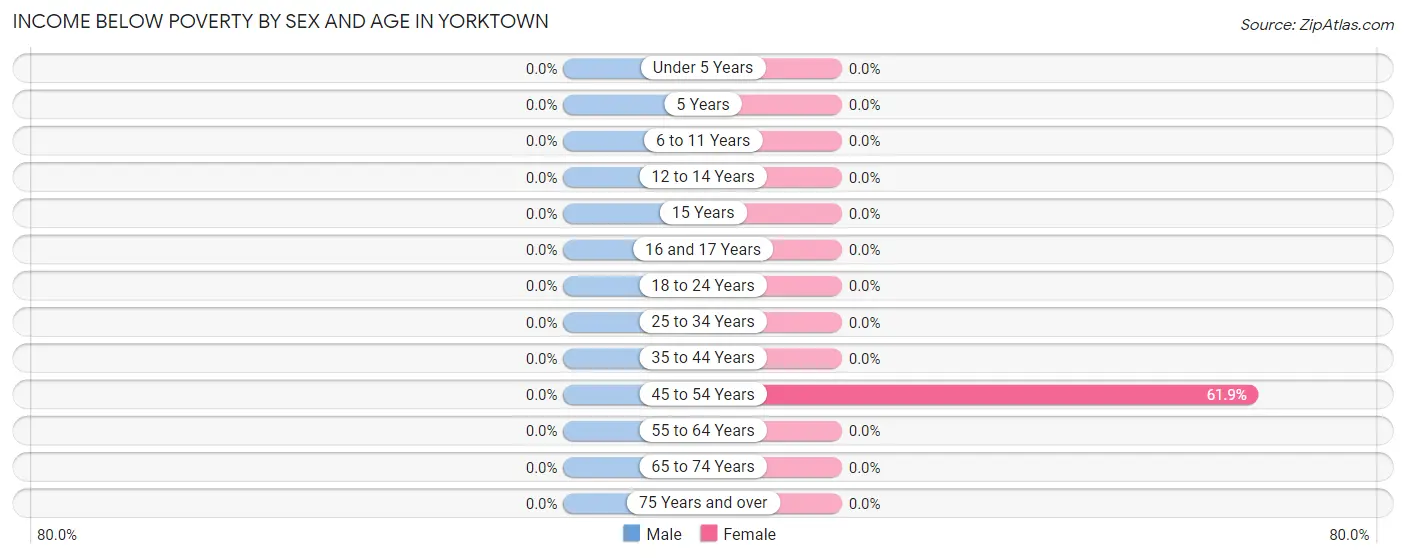
| Age Bracket | Male | Female |
| Under 5 Years | 0 (0.0%) | 0 (0.0%) |
| 5 Years | 0 (0.0%) | 0 (0.0%) |
| 6 to 11 Years | 0 (0.0%) | 0 (0.0%) |
| 12 to 14 Years | 0 (0.0%) | 0 (0.0%) |
| 15 Years | 0 (0.0%) | 0 (0.0%) |
| 16 and 17 Years | 0 (0.0%) | 0 (0.0%) |
| 18 to 24 Years | 0 (0.0%) | 0 (0.0%) |
| 25 to 34 Years | 0 (0.0%) | 0 (0.0%) |
| 35 to 44 Years | 0 (0.0%) | 0 (0.0%) |
| 45 to 54 Years | 0 (0.0%) | 13 (61.9%) |
| 55 to 64 Years | 0 (0.0%) | 0 (0.0%) |
| 65 to 74 Years | 0 (0.0%) | 0 (0.0%) |
| 75 Years and over | 0 (0.0%) | 0 (0.0%) |
| Total | 0 (0.0%) | 13 (14.3%) |
Income Above Poverty by Sex and Age in Yorktown
According to the poverty statistics in Yorktown, males aged 25 to 34 years and females aged 12 to 14 years are the age groups that are most secure financially, with 100.0% of males and 100.0% of females in these age groups living above the poverty line.
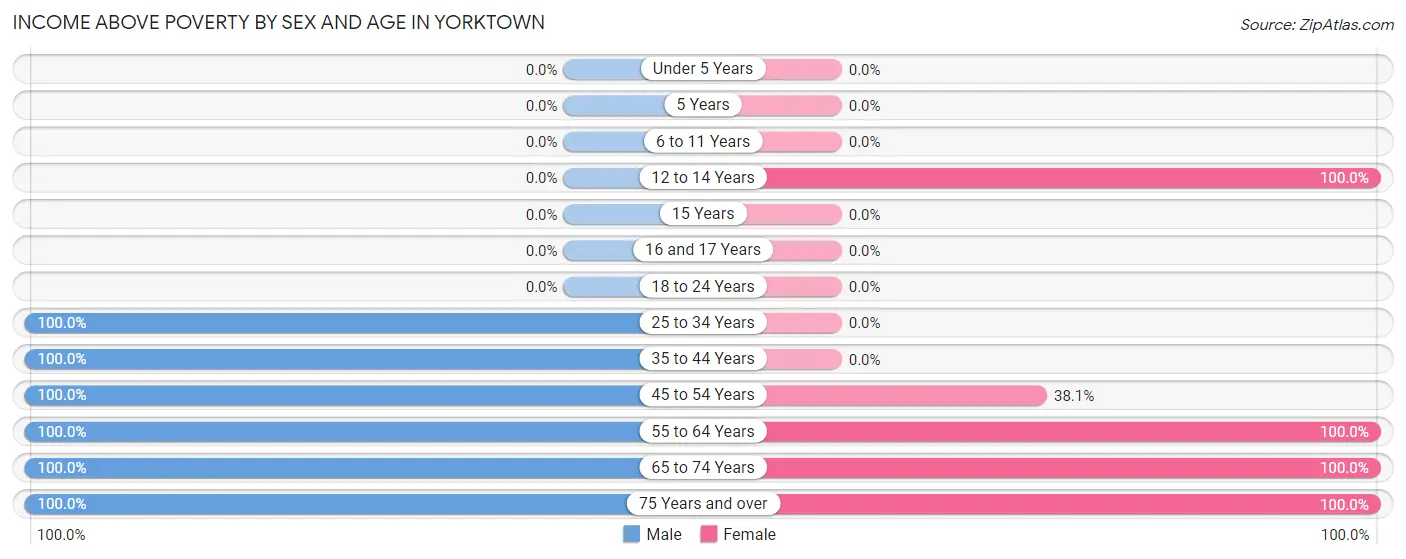
| Age Bracket | Male | Female |
| Under 5 Years | 0 (0.0%) | 0 (0.0%) |
| 5 Years | 0 (0.0%) | 0 (0.0%) |
| 6 to 11 Years | 0 (0.0%) | 0 (0.0%) |
| 12 to 14 Years | 0 (0.0%) | 10 (100.0%) |
| 15 Years | 0 (0.0%) | 0 (0.0%) |
| 16 and 17 Years | 0 (0.0%) | 0 (0.0%) |
| 18 to 24 Years | 0 (0.0%) | 0 (0.0%) |
| 25 to 34 Years | 23 (100.0%) | 0 (0.0%) |
| 35 to 44 Years | 9 (100.0%) | 0 (0.0%) |
| 45 to 54 Years | 12 (100.0%) | 8 (38.1%) |
| 55 to 64 Years | 30 (100.0%) | 21 (100.0%) |
| 65 to 74 Years | 33 (100.0%) | 20 (100.0%) |
| 75 Years and over | 19 (100.0%) | 19 (100.0%) |
| Total | 126 (100.0%) | 78 (85.7%) |
Income Below Poverty Among Married-Couple Families in Yorktown
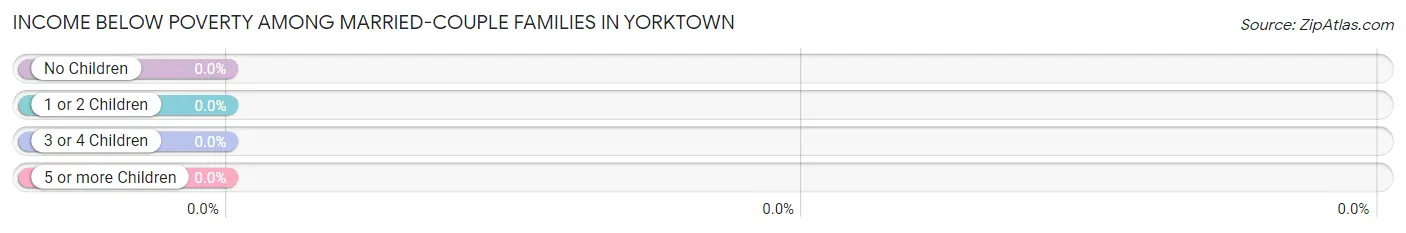
| Children | Above Poverty | Below Poverty |
| No Children | 41 (100.0%) | 0 (0.0%) |
| 1 or 2 Children | 8 (100.0%) | 0 (0.0%) |
| 3 or 4 Children | 0 (0.0%) | 0 (0.0%) |
| 5 or more Children | 0 (0.0%) | 0 (0.0%) |
| Total | 49 (100.0%) | 0 (0.0%) |
Income Below Poverty Among Single-Parent Households in Yorktown
| Children | Single Father | Single Mother |
| No Children | 0 (0.0%) | 0 (0.0%) |
| 1 or 2 Children | 0 (0.0%) | 0 (0.0%) |
| 3 or 4 Children | 0 (0.0%) | 0 (0.0%) |
| 5 or more Children | 0 (0.0%) | 0 (0.0%) |
| Total | 0 (0.0%) | 0 (0.0%) |
Income Below Poverty Among Married-Couple vs Single-Parent Households in Yorktown
| Children | Married-Couple Families | Single-Parent Households |
| No Children | 0 (0.0%) | 0 (0.0%) |
| 1 or 2 Children | 0 (0.0%) | 0 (0.0%) |
| 3 or 4 Children | 0 (0.0%) | 0 (0.0%) |
| 5 or more Children | 0 (0.0%) | 0 (0.0%) |
| Total | 0 (0.0%) | 0 (0.0%) |
Race in Yorktown
The most populous races in Yorktown are , and White / Caucasian (217 | 100.0%).
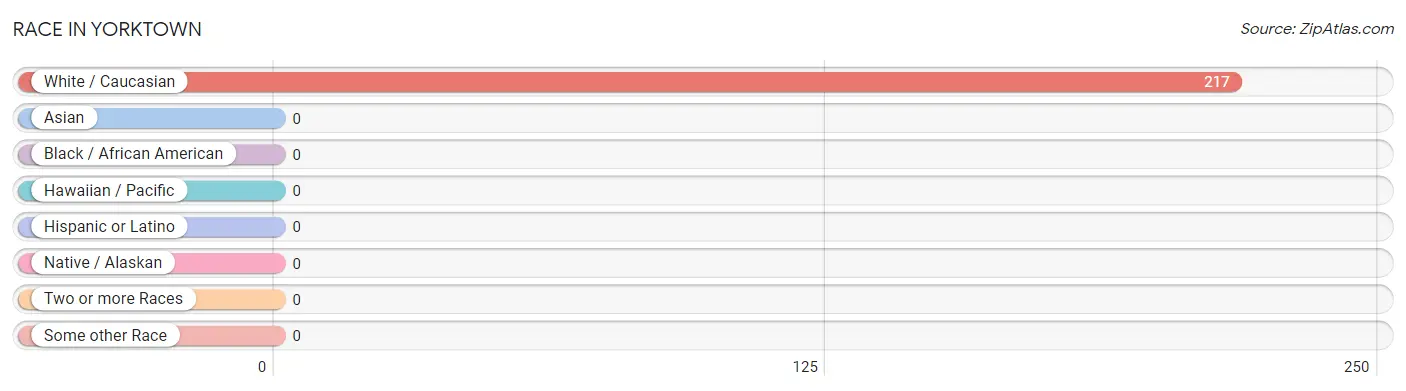
| Race | # Population | % Population |
| Asian | 0 | 0.0% |
| Black / African American | 0 | 0.0% |
| Hawaiian / Pacific | 0 | 0.0% |
| Hispanic or Latino | 0 | 0.0% |
| Native / Alaskan | 0 | 0.0% |
| White / Caucasian | 217 | 100.0% |
| Two or more Races | 0 | 0.0% |
| Some other Race | 0 | 0.0% |
| Total | 217 | 100.0% |
Ancestry in Yorktown
The most populous ancestries reported in Yorktown are English (67 | 30.9%), American (63 | 29.0%), French (40 | 18.4%), German (35 | 16.1%), and Irish (26 | 12.0%), together accounting for 106.5% of all Yorktown residents.
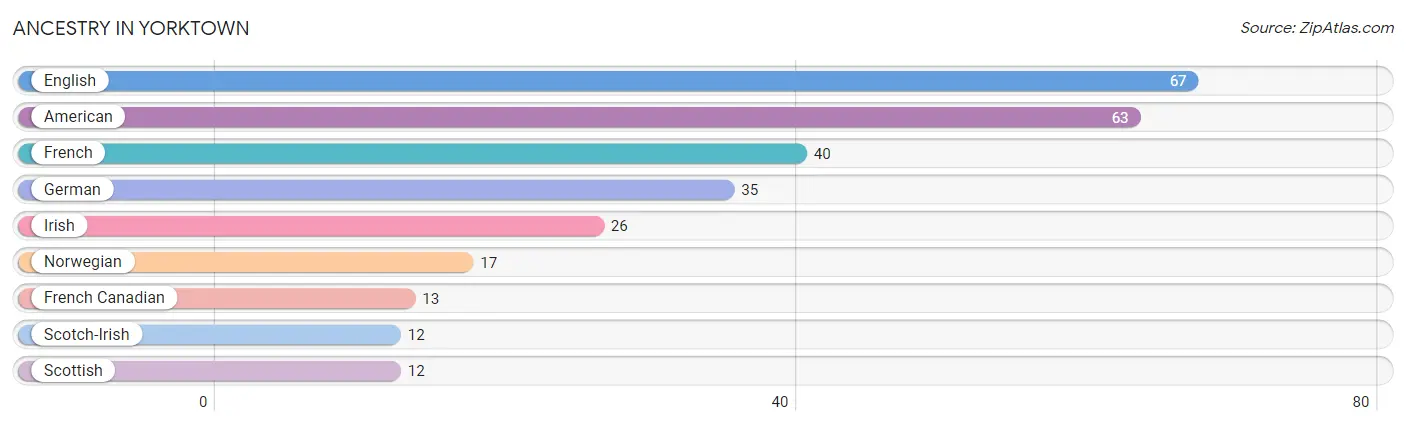
| Ancestry | # Population | % Population |
| American | 63 | 29.0% |
| English | 67 | 30.9% |
| French | 40 | 18.4% |
| French Canadian | 13 | 6.0% |
| German | 35 | 16.1% |
| Irish | 26 | 12.0% |
| Norwegian | 17 | 7.8% |
| Scotch-Irish | 12 | 5.5% |
| Scottish | 12 | 5.5% | View All 9 Rows |
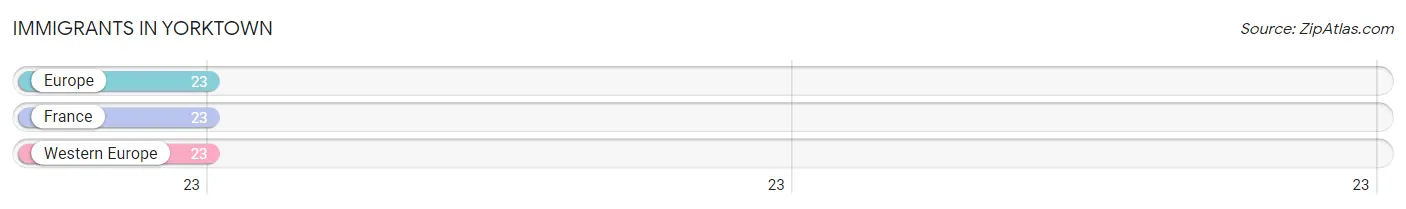
Immigrants in Yorktown
The most numerous immigrant groups reported in Yorktown came from Europe (23 | 10.6%), France (23 | 10.6%), and Western Europe (23 | 10.6%), together accounting for 31.8% of all Yorktown residents.
| Immigration Origin | # Population | % Population |
| Europe | 23 | 10.6% |
| France | 23 | 10.6% |
| Western Europe | 23 | 10.6% | View All 3 Rows |
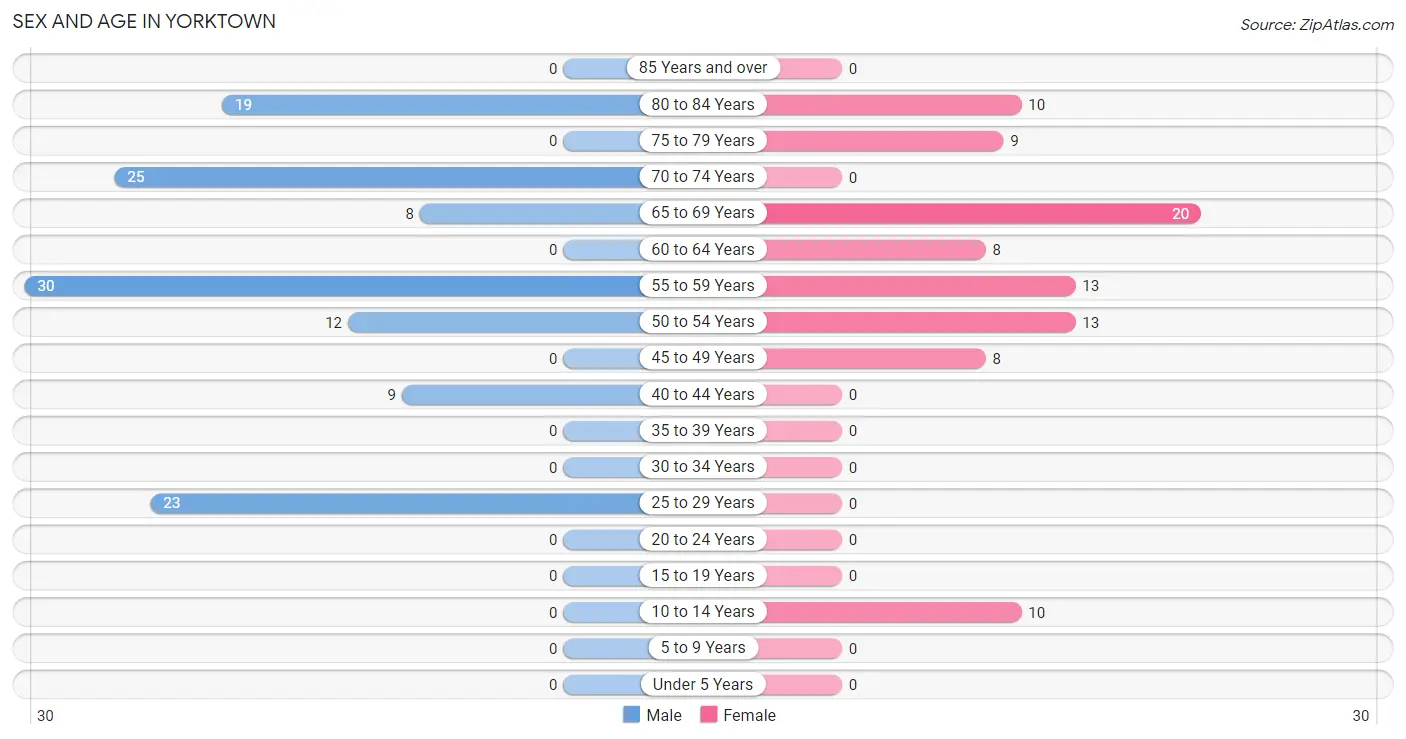
Sex and Age in Yorktown
Sex and Age in Yorktown
The most populous age groups in Yorktown are 55 to 59 Years (30 | 23.8%) for men and 65 to 69 Years (20 | 22.0%) for women.
| Age Bracket | Male | Female |
| Under 5 Years | 0 (0.0%) | 0 (0.0%) |
| 5 to 9 Years | 0 (0.0%) | 0 (0.0%) |
| 10 to 14 Years | 0 (0.0%) | 10 (11.0%) |
| 15 to 19 Years | 0 (0.0%) | 0 (0.0%) |
| 20 to 24 Years | 0 (0.0%) | 0 (0.0%) |
| 25 to 29 Years | 23 (18.2%) | 0 (0.0%) |
| 30 to 34 Years | 0 (0.0%) | 0 (0.0%) |
| 35 to 39 Years | 0 (0.0%) | 0 (0.0%) |
| 40 to 44 Years | 9 (7.1%) | 0 (0.0%) |
| 45 to 49 Years | 0 (0.0%) | 8 (8.8%) |
| 50 to 54 Years | 12 (9.5%) | 13 (14.3%) |
| 55 to 59 Years | 30 (23.8%) | 13 (14.3%) |
| 60 to 64 Years | 0 (0.0%) | 8 (8.8%) |
| 65 to 69 Years | 8 (6.4%) | 20 (22.0%) |
| 70 to 74 Years | 25 (19.8%) | 0 (0.0%) |
| 75 to 79 Years | 0 (0.0%) | 9 (9.9%) |
| 80 to 84 Years | 19 (15.1%) | 10 (11.0%) |
| 85 Years and over | 0 (0.0%) | 0 (0.0%) |
| Total | 126 (100.0%) | 91 (100.0%) |
Families and Households in Yorktown
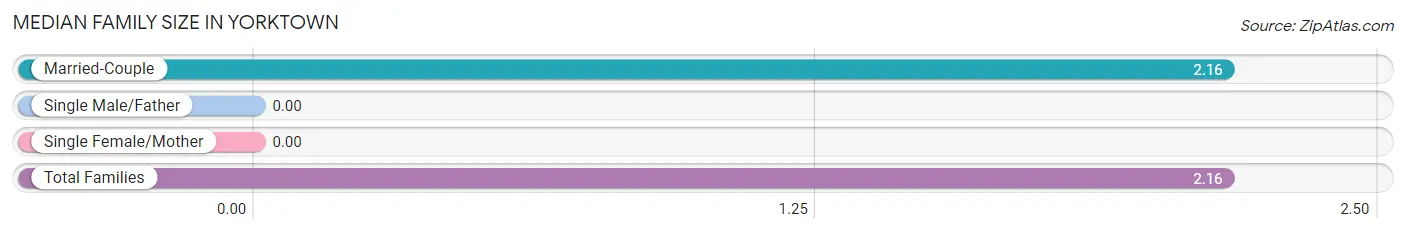
Median Family Size in Yorktown
| Family Type | # Families | Family Size |
| Married-Couple | 49 (100.0%) | 2.16 |
| Single Male/Father | 0 (0.0%) | - |
| Single Female/Mother | 0 (0.0%) | - |
| Total Families | 49 (100.0%) | 2.16 |
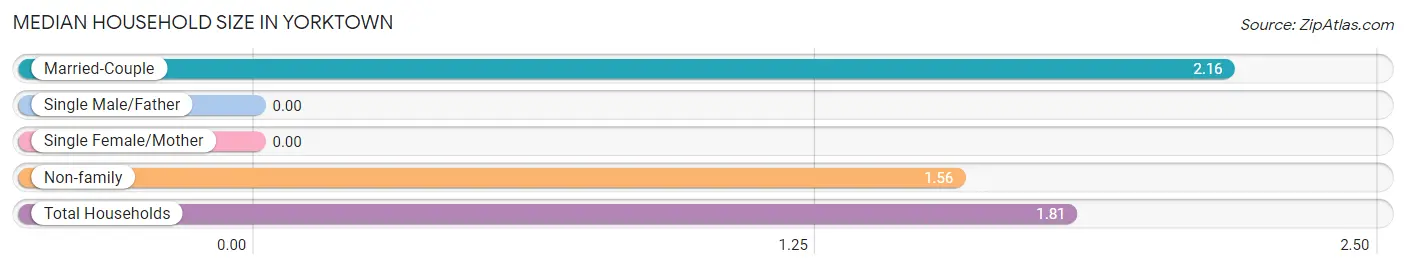
Median Household Size in Yorktown
| Household Type | # Households | Household Size |
| Married-Couple | 49 (40.8%) | 2.16 |
| Single Male/Father | 0 (0.0%) | - |
| Single Female/Mother | 0 (0.0%) | - |
| Non-family | 71 (59.2%) | 1.56 |
| Total Households | 120 (100.0%) | 1.81 |
Household Size by Marriage Status in Yorktown
Out of a total of 120 households in Yorktown, 49 (40.8%) are family households, while 71 (59.2%) are nonfamily households. The most numerous type of family households are 2-person households, comprising 41, and the most common type of nonfamily households are 1-person households, comprising 45.
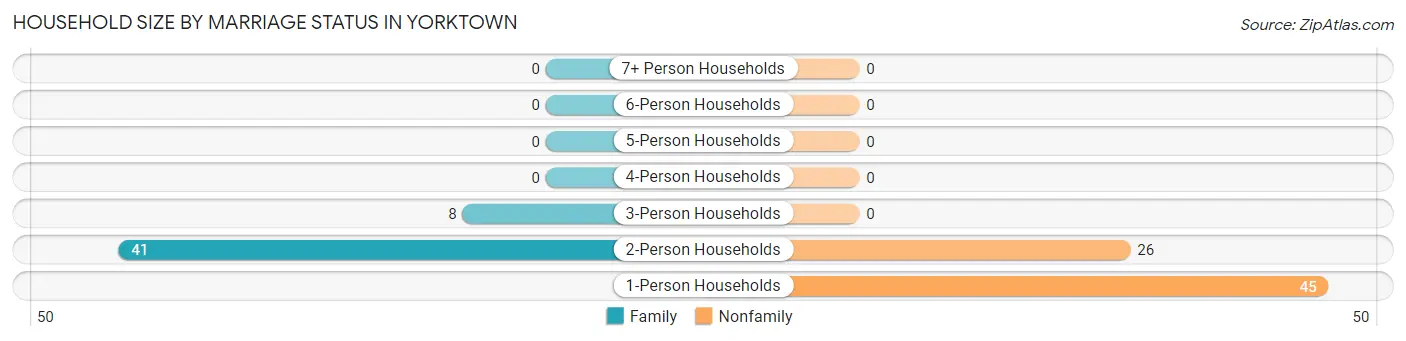
| Household Size | Family Households | Nonfamily Households |
| 1-Person Households | - | 45 (37.5%) |
| 2-Person Households | 41 (34.2%) | 26 (21.7%) |
| 3-Person Households | 8 (6.7%) | 0 (0.0%) |
| 4-Person Households | 0 (0.0%) | 0 (0.0%) |
| 5-Person Households | 0 (0.0%) | 0 (0.0%) |
| 6-Person Households | 0 (0.0%) | 0 (0.0%) |
| 7+ Person Households | 0 (0.0%) | 0 (0.0%) |
| Total | 49 (40.8%) | 71 (59.2%) |
Female Fertility in Yorktown
Fertility by Age in Yorktown
| Age Bracket | Women with Births | Births / 1,000 Women |
| 15 to 19 years | 0 (0.0%) | 0.0 |
| 20 to 34 years | 0 (0.0%) | 0.0 |
| 35 to 50 years | 0 (0.0%) | 0.0 |
| Total | 0 (0.0%) | 0.0 |
Fertility by Age by Marriage Status in Yorktown
| Age Bracket | Married | Unmarried |
| 15 to 19 years | 0 (0.0%) | 0 (0.0%) |
| 20 to 34 years | 0 (0.0%) | 0 (0.0%) |
| 35 to 50 years | 0 (0.0%) | 0 (0.0%) |
| Total | 0 (0.0%) | 0 (0.0%) |
Fertility by Education in Yorktown
| Educational Attainment | Women with Births | Births / 1,000 Women |
| Less than High School | 0 (0.0%) | 0.0 |
| High School Diploma | 0 (0.0%) | 0.0 |
| College or Associate's Degree | 0 (0.0%) | 0.0 |
| Bachelor's Degree | 0 (0.0%) | 0.0 |
| Graduate Degree | 0 (0.0%) | 0.0 |
| Total | 0 (0.0%) | 0.0 |
Fertility by Education by Marriage Status in Yorktown
| Educational Attainment | Married | Unmarried |
| Less than High School | 0 (0.0%) | 0 (0.0%) |
| High School Diploma | 0 (0.0%) | 0 (0.0%) |
| College or Associate's Degree | 0 (0.0%) | 0 (0.0%) |
| Bachelor's Degree | 0 (0.0%) | 0 (0.0%) |
| Graduate Degree | 0 (0.0%) | 0 (0.0%) |
| Total | 0 (0.0%) | 0 (0.0%) |
Employment Characteristics in Yorktown
Employment by Class of Employer in Yorktown
Among the 151 employed individuals in Yorktown, private company employees (55 | 36.4%), not-for-profit organizations (33 | 21.8%), and self-employed (not incorporated) (25 | 16.6%) make up the most common classes of employment.
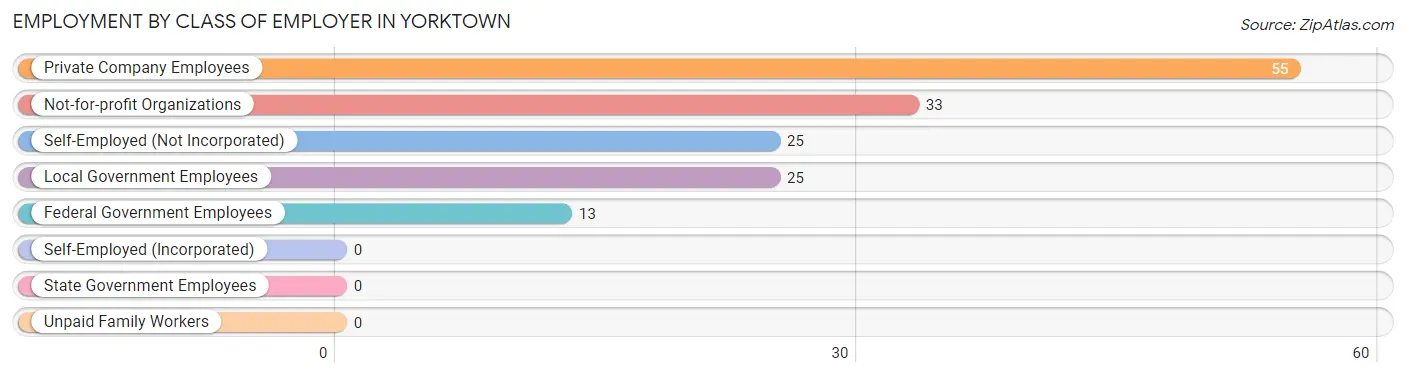
| Employer Class | # Employees | % Employees |
| Private Company Employees | 55 | 36.4% |
| Self-Employed (Incorporated) | 0 | 0.0% |
| Self-Employed (Not Incorporated) | 25 | 16.6% |
| Not-for-profit Organizations | 33 | 21.8% |
| Local Government Employees | 25 | 16.6% |
| State Government Employees | 0 | 0.0% |
| Federal Government Employees | 13 | 8.6% |
| Unpaid Family Workers | 0 | 0.0% |
| Total | 151 | 100.0% |
Employment Status by Age in Yorktown
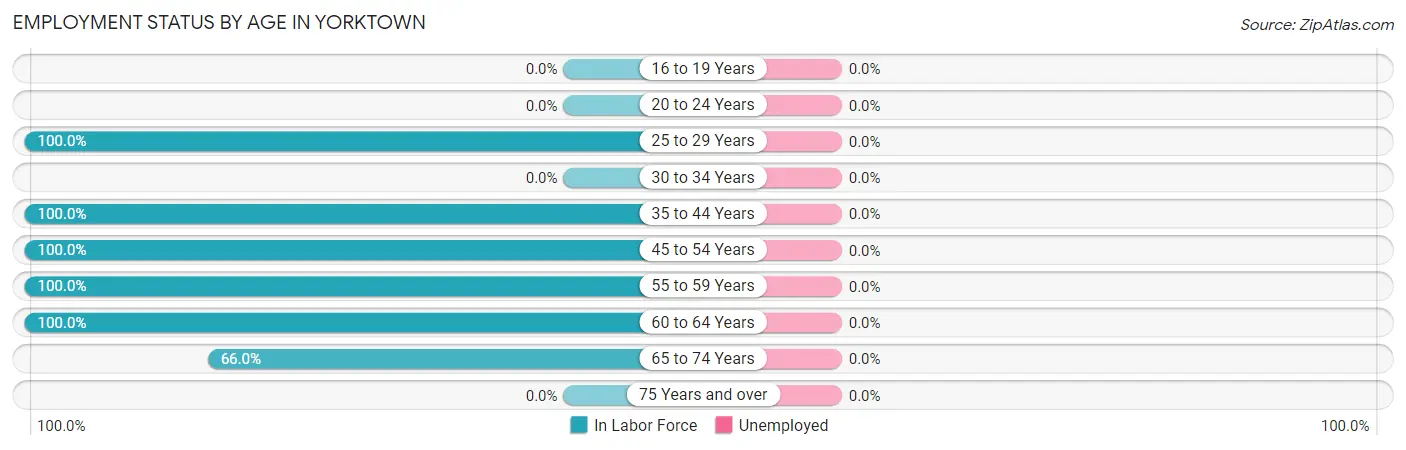
| Age Bracket | In Labor Force | Unemployed |
| 16 to 19 Years | 0 (0.0%) | 0 (0.0%) |
| 20 to 24 Years | 0 (0.0%) | 0 (0.0%) |
| 25 to 29 Years | 23 (100.0%) | 0 (0.0%) |
| 30 to 34 Years | 0 (0.0%) | 0 (0.0%) |
| 35 to 44 Years | 9 (100.0%) | 0 (0.0%) |
| 45 to 54 Years | 33 (100.0%) | 0 (0.0%) |
| 55 to 59 Years | 43 (100.0%) | 0 (0.0%) |
| 60 to 64 Years | 8 (100.0%) | 0 (0.0%) |
| 65 to 74 Years | 35 (66.0%) | 0 (0.0%) |
| 75 Years and over | 0 (0.0%) | 0 (0.0%) |
| Total | 151 (72.9%) | 0 (0.0%) |
Employment Status by Educational Attainment in Yorktown
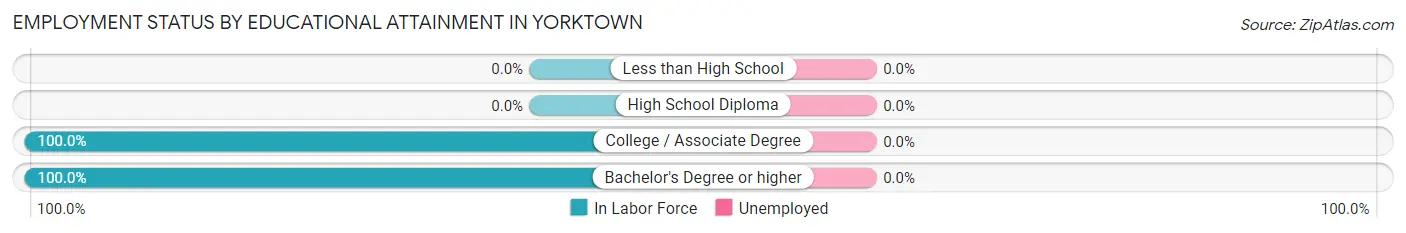
| Educational Attainment | In Labor Force | Unemployed |
| Less than High School | 0 (0.0%) | 0 (0.0%) |
| High School Diploma | 0 (0.0%) | 0 (0.0%) |
| College / Associate Degree | 17 (100.0%) | 0 (0.0%) |
| Bachelor's Degree or higher | 99 (100.0%) | 0 (0.0%) |
| Total | 116 (100.0%) | 0 (0.0%) |
Employment Occupations by Sex in Yorktown
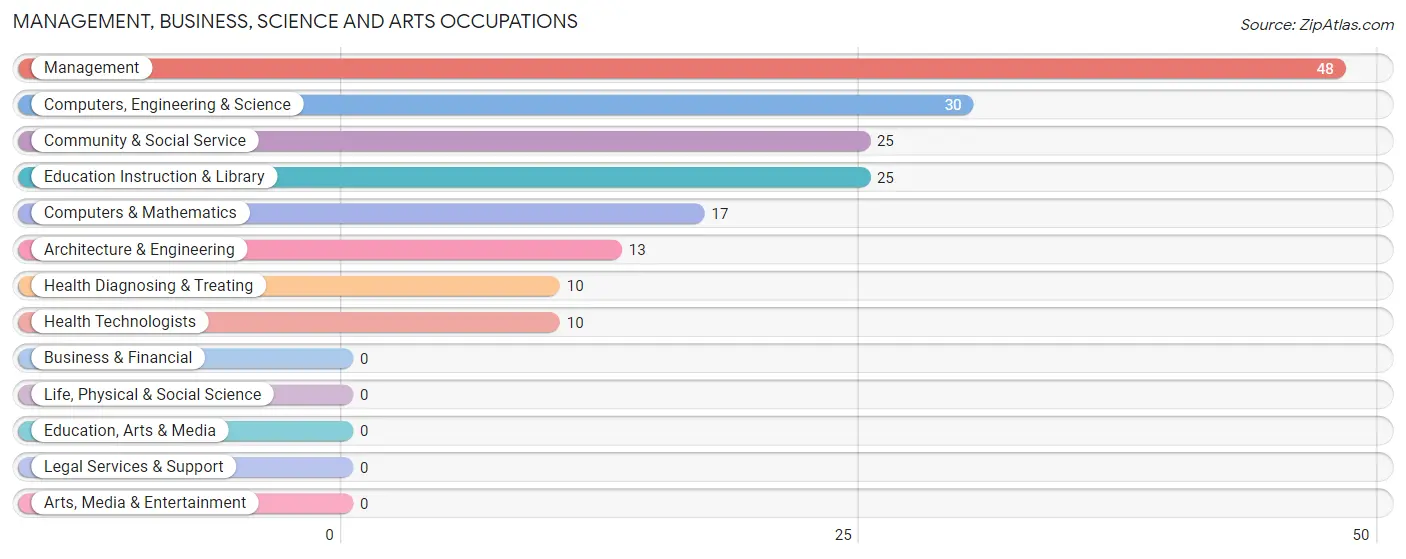
Management, Business, Science and Arts Occupations
The most common Management, Business, Science and Arts occupations in Yorktown are Management (48 | 31.8%), Computers, Engineering & Science (30 | 19.9%), Community & Social Service (25 | 16.6%), Education Instruction & Library (25 | 16.6%), and Computers & Mathematics (17 | 11.3%).
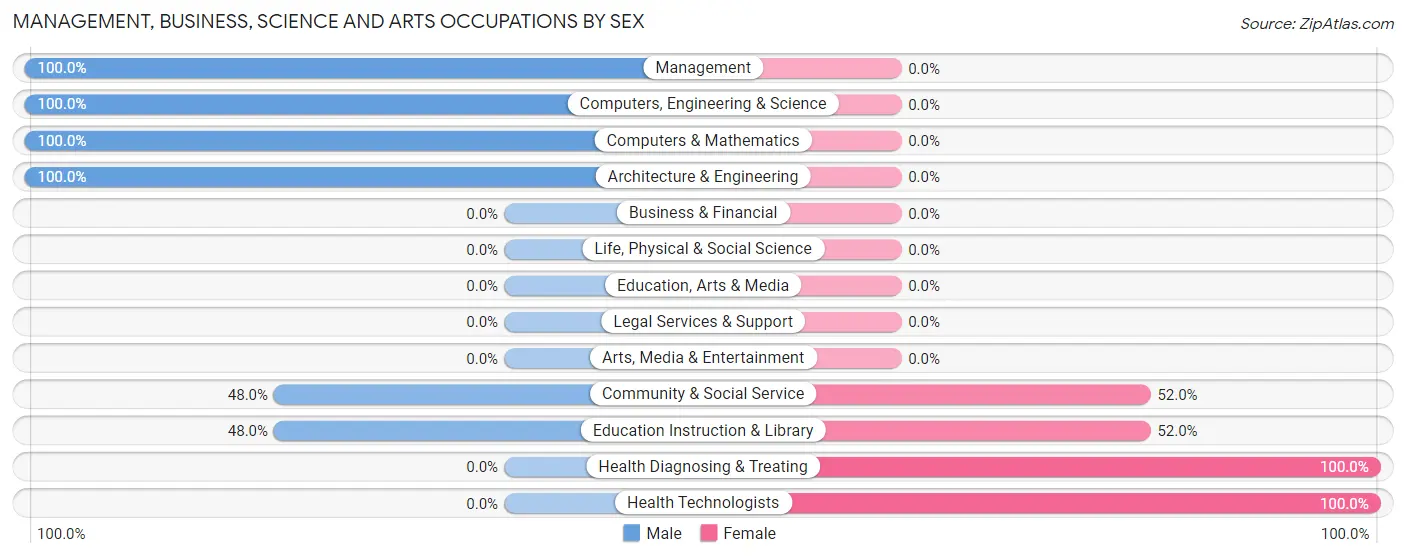
Management, Business, Science and Arts Occupations by Sex
Within the Management, Business, Science and Arts occupations in Yorktown, the most male-oriented occupations are Management (100.0%), Computers, Engineering & Science (100.0%), and Computers & Mathematics (100.0%), while the most female-oriented occupations are Health Diagnosing & Treating (100.0%), Health Technologists (100.0%), and Community & Social Service (52.0%).
| Occupation | Male | Female |
| Management | 48 (100.0%) | 0 (0.0%) |
| Business & Financial | 0 (0.0%) | 0 (0.0%) |
| Computers, Engineering & Science | 30 (100.0%) | 0 (0.0%) |
| Computers & Mathematics | 17 (100.0%) | 0 (0.0%) |
| Architecture & Engineering | 13 (100.0%) | 0 (0.0%) |
| Life, Physical & Social Science | 0 (0.0%) | 0 (0.0%) |
| Community & Social Service | 12 (48.0%) | 13 (52.0%) |
| Education, Arts & Media | 0 (0.0%) | 0 (0.0%) |
| Legal Services & Support | 0 (0.0%) | 0 (0.0%) |
| Education Instruction & Library | 12 (48.0%) | 13 (52.0%) |
| Arts, Media & Entertainment | 0 (0.0%) | 0 (0.0%) |
| Health Diagnosing & Treating | 0 (0.0%) | 10 (100.0%) |
| Health Technologists | 0 (0.0%) | 10 (100.0%) |
| Total (Category) | 90 (79.6%) | 23 (20.3%) |
| Total (Overall) | 99 (65.6%) | 52 (34.4%) |
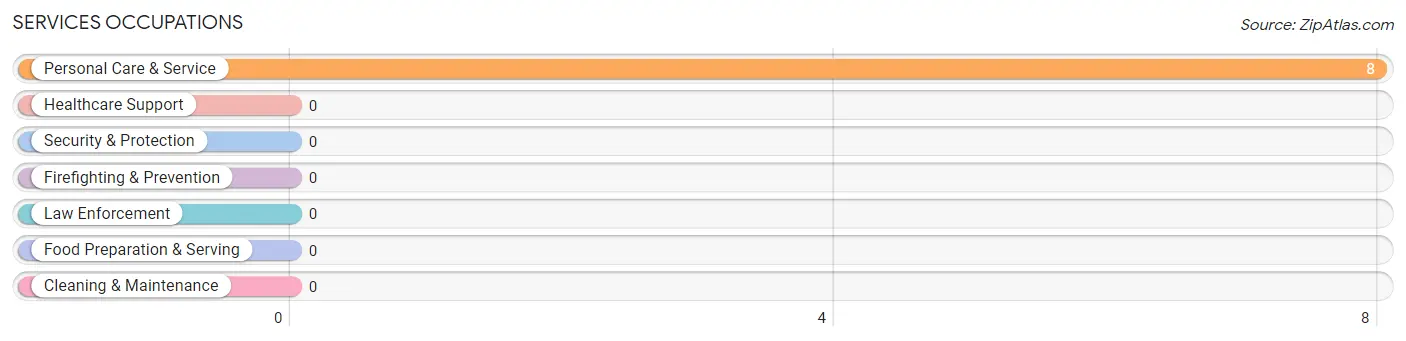
Services Occupations
The most common Services occupations in Yorktown are , and Personal Care & Service (8 | 5.3%).
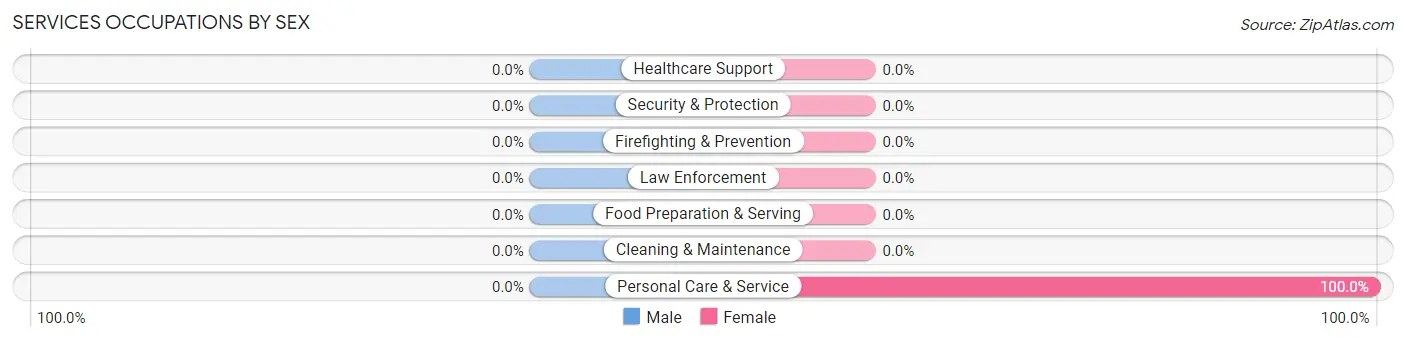
Services Occupations by Sex
| Occupation | Male | Female |
| Healthcare Support | 0 (0.0%) | 0 (0.0%) |
| Security & Protection | 0 (0.0%) | 0 (0.0%) |
| Firefighting & Prevention | 0 (0.0%) | 0 (0.0%) |
| Law Enforcement | 0 (0.0%) | 0 (0.0%) |
| Food Preparation & Serving | 0 (0.0%) | 0 (0.0%) |
| Cleaning & Maintenance | 0 (0.0%) | 0 (0.0%) |
| Personal Care & Service | 0 (0.0%) | 8 (100.0%) |
| Total (Category) | 0 (0.0%) | 8 (100.0%) |
| Total (Overall) | 99 (65.6%) | 52 (34.4%) |
Sales and Office Occupations
The most common Sales and Office occupations in Yorktown are Sales & Related (13 | 8.6%), and Office & Administration (8 | 5.3%).
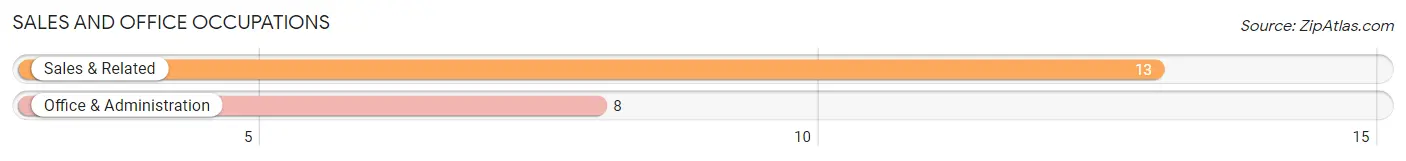
Sales and Office Occupations by Sex
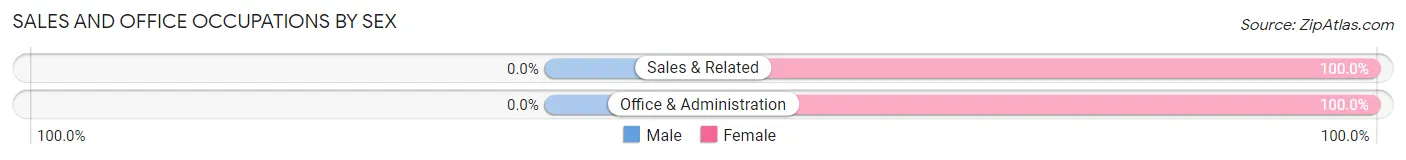
| Occupation | Male | Female |
| Sales & Related | 0 (0.0%) | 13 (100.0%) |
| Office & Administration | 0 (0.0%) | 8 (100.0%) |
| Total (Category) | 0 (0.0%) | 21 (100.0%) |
| Total (Overall) | 99 (65.6%) | 52 (34.4%) |
Natural Resources, Construction and Maintenance Occupations
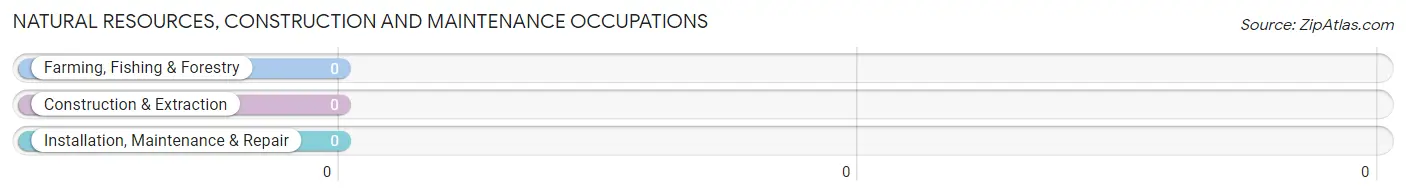
Natural Resources, Construction and Maintenance Occupations by Sex
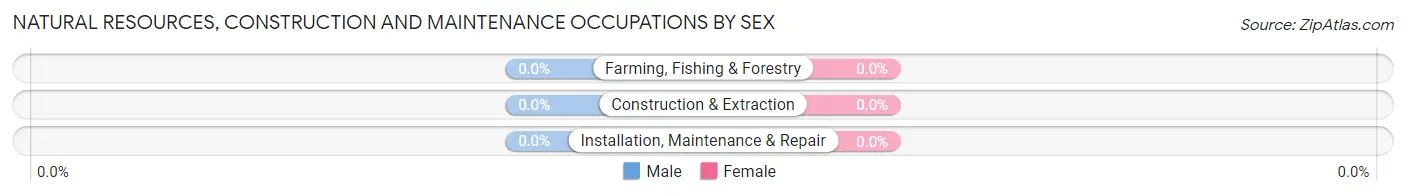
| Occupation | Male | Female |
| Farming, Fishing & Forestry | 0 (0.0%) | 0 (0.0%) |
| Construction & Extraction | 0 (0.0%) | 0 (0.0%) |
| Installation, Maintenance & Repair | 0 (0.0%) | 0 (0.0%) |
| Total (Category) | 0 (0.0%) | 0 (0.0%) |
| Total (Overall) | 99 (65.6%) | 52 (34.4%) |
Production, Transportation and Moving Occupations
The most common Production, Transportation and Moving occupations in Yorktown are , and Transportation (9 | 6.0%).
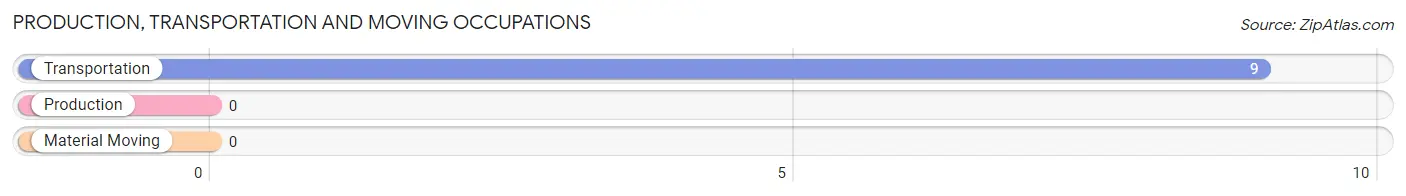
Production, Transportation and Moving Occupations by Sex
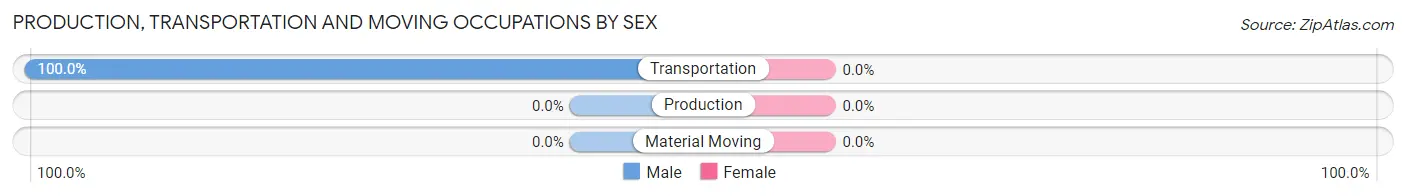
| Occupation | Male | Female |
| Production | 0 (0.0%) | 0 (0.0%) |
| Transportation | 9 (100.0%) | 0 (0.0%) |
| Material Moving | 0 (0.0%) | 0 (0.0%) |
| Total (Category) | 9 (100.0%) | 0 (0.0%) |
| Total (Overall) | 99 (65.6%) | 52 (34.4%) |
Employment Industries by Sex in Yorktown
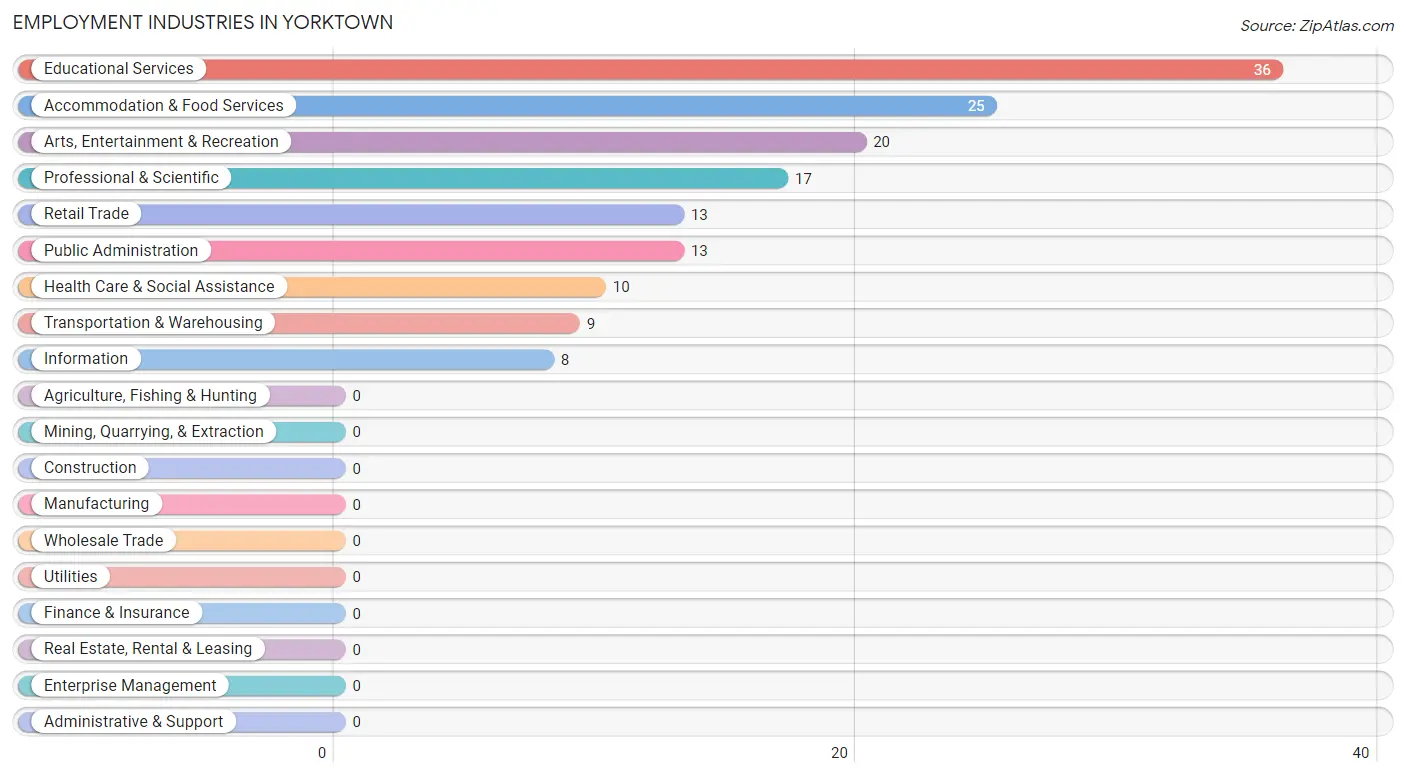
Employment Industries in Yorktown
The major employment industries in Yorktown include Educational Services (36 | 23.8%), Accommodation & Food Services (25 | 16.6%), Arts, Entertainment & Recreation (20 | 13.3%), Professional & Scientific (17 | 11.3%), and Retail Trade (13 | 8.6%).
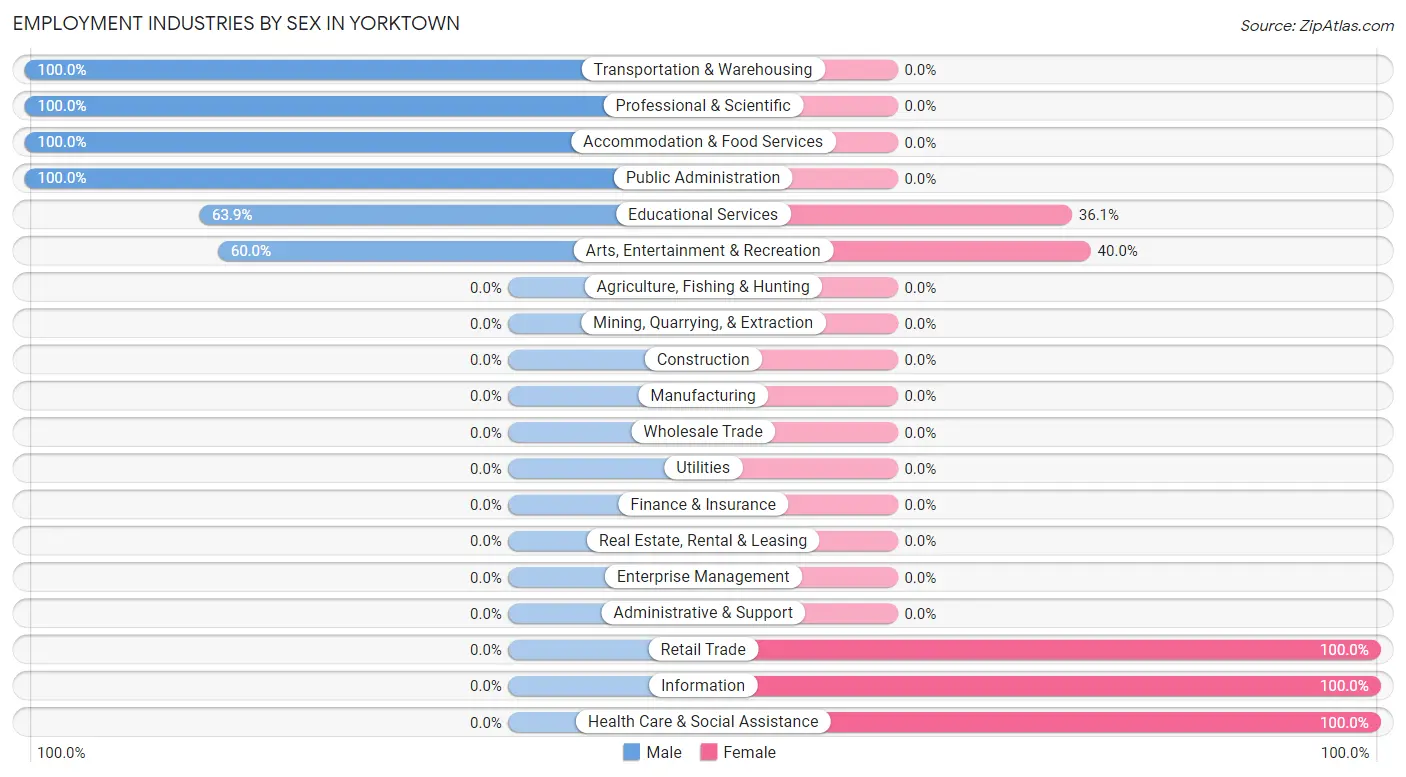
Employment Industries by Sex in Yorktown
The Yorktown industries that see more men than women are Transportation & Warehousing (100.0%), Professional & Scientific (100.0%), and Accommodation & Food Services (100.0%), whereas the industries that tend to have a higher number of women are Retail Trade (100.0%), Information (100.0%), and Health Care & Social Assistance (100.0%).
| Industry | Male | Female |
| Agriculture, Fishing & Hunting | 0 (0.0%) | 0 (0.0%) |
| Mining, Quarrying, & Extraction | 0 (0.0%) | 0 (0.0%) |
| Construction | 0 (0.0%) | 0 (0.0%) |
| Manufacturing | 0 (0.0%) | 0 (0.0%) |
| Wholesale Trade | 0 (0.0%) | 0 (0.0%) |
| Retail Trade | 0 (0.0%) | 13 (100.0%) |
| Transportation & Warehousing | 9 (100.0%) | 0 (0.0%) |
| Utilities | 0 (0.0%) | 0 (0.0%) |
| Information | 0 (0.0%) | 8 (100.0%) |
| Finance & Insurance | 0 (0.0%) | 0 (0.0%) |
| Real Estate, Rental & Leasing | 0 (0.0%) | 0 (0.0%) |
| Professional & Scientific | 17 (100.0%) | 0 (0.0%) |
| Enterprise Management | 0 (0.0%) | 0 (0.0%) |
| Administrative & Support | 0 (0.0%) | 0 (0.0%) |
| Educational Services | 23 (63.9%) | 13 (36.1%) |
| Health Care & Social Assistance | 0 (0.0%) | 10 (100.0%) |
| Arts, Entertainment & Recreation | 12 (60.0%) | 8 (40.0%) |
| Accommodation & Food Services | 25 (100.0%) | 0 (0.0%) |
| Public Administration | 13 (100.0%) | 0 (0.0%) |
| Total | 99 (65.6%) | 52 (34.4%) |
Education in Yorktown
School Enrollment in Yorktown
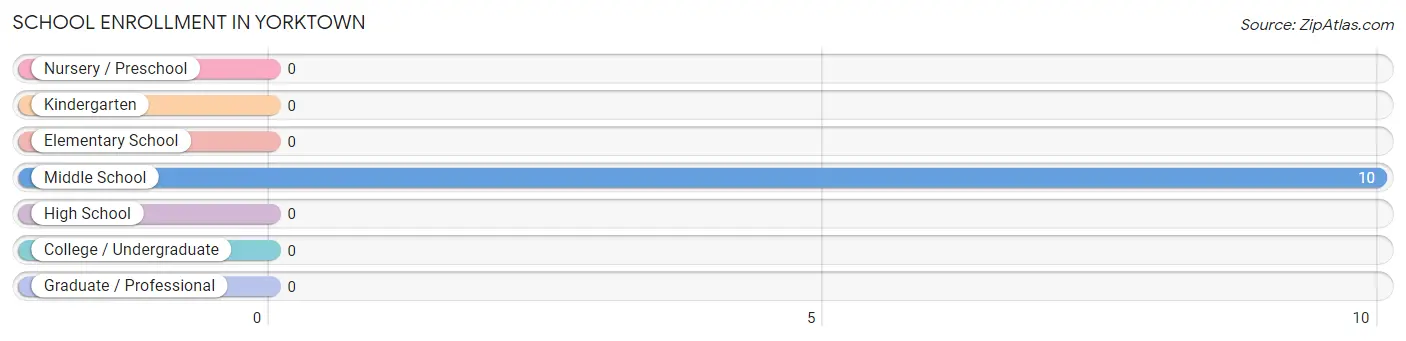
| School Level | # Students | % Students |
| Nursery / Preschool | 0 | 0.0% |
| Kindergarten | 0 | 0.0% |
| Elementary School | 0 | 0.0% |
| Middle School | 10 | 100.0% |
| High School | 0 | 0.0% |
| College / Undergraduate | 0 | 0.0% |
| Graduate / Professional | 0 | 0.0% |
| Total | 10 | 100.0% |
School Enrollment by Age by Funding Source in Yorktown
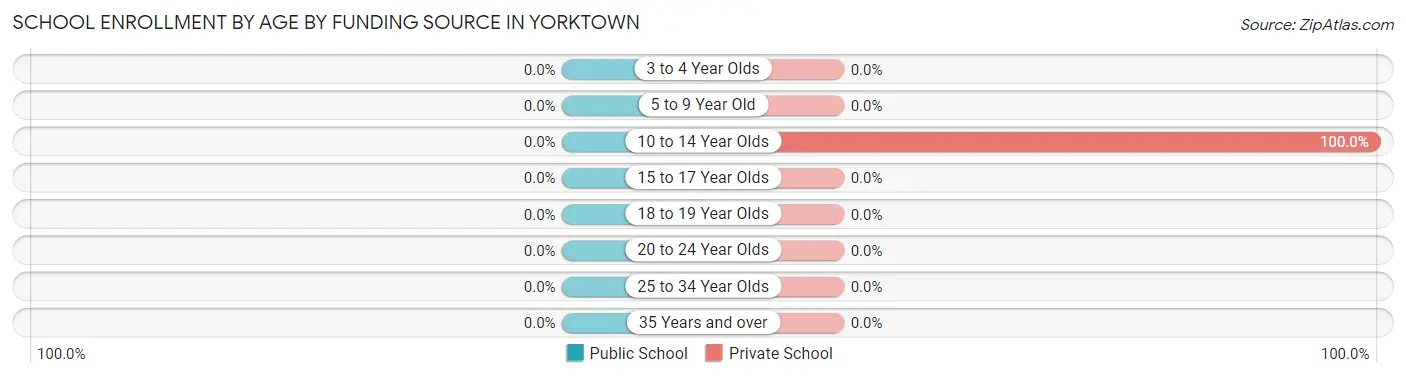
| Age Bracket | Public School | Private School |
| 3 to 4 Year Olds | 0 (0.0%) | 0 (0.0%) |
| 5 to 9 Year Old | 0 (0.0%) | 0 (0.0%) |
| 10 to 14 Year Olds | 0 (0.0%) | 10 (100.0%) |
| 15 to 17 Year Olds | 0 (0.0%) | 0 (0.0%) |
| 18 to 19 Year Olds | 0 (0.0%) | 0 (0.0%) |
| 20 to 24 Year Olds | 0 (0.0%) | 0 (0.0%) |
| 25 to 34 Year Olds | 0 (0.0%) | 0 (0.0%) |
| 35 Years and over | 0 (0.0%) | 0 (0.0%) |
| Total | 0 (0.0%) | 10 (100.0%) |
Educational Attainment by Field of Study in Yorktown
Liberal arts & history (47 | 19.4%), education (40 | 16.5%), social sciences (35 | 14.5%), bio, nature & agricultural (31 | 12.8%), and communications (17 | 7.0%) are the most common fields of study among 242 individuals in Yorktown who have obtained a bachelor's degree or higher.
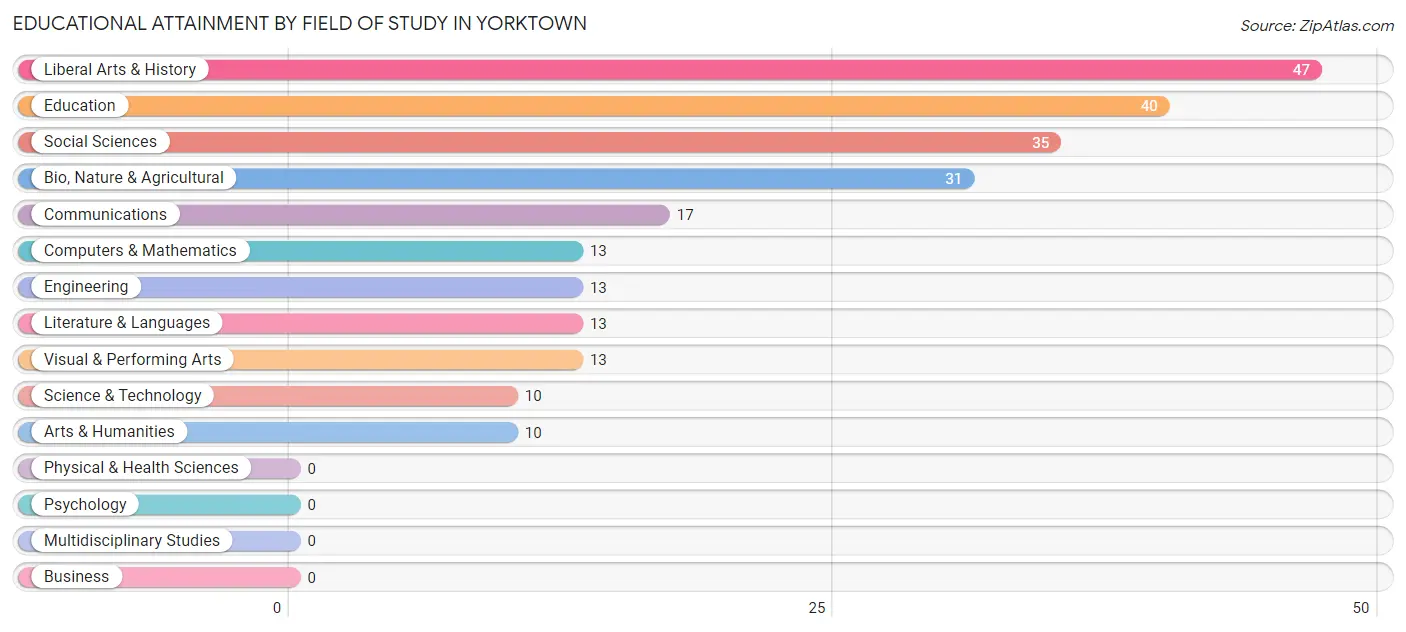
| Field of Study | # Graduates | % Graduates |
| Computers & Mathematics | 13 | 5.4% |
| Bio, Nature & Agricultural | 31 | 12.8% |
| Physical & Health Sciences | 0 | 0.0% |
| Psychology | 0 | 0.0% |
| Social Sciences | 35 | 14.5% |
| Engineering | 13 | 5.4% |
| Multidisciplinary Studies | 0 | 0.0% |
| Science & Technology | 10 | 4.1% |
| Business | 0 | 0.0% |
| Education | 40 | 16.5% |
| Literature & Languages | 13 | 5.4% |
| Liberal Arts & History | 47 | 19.4% |
| Visual & Performing Arts | 13 | 5.4% |
| Communications | 17 | 7.0% |
| Arts & Humanities | 10 | 4.1% |
| Total | 242 | 100.0% |
Transportation & Commute in Yorktown
Vehicle Availability by Sex in Yorktown
The most prevalent vehicle ownership categories in Yorktown are males with 2 vehicles (75, accounting for 75.8%) and females with 2 vehicles (34, making up 144.2%).
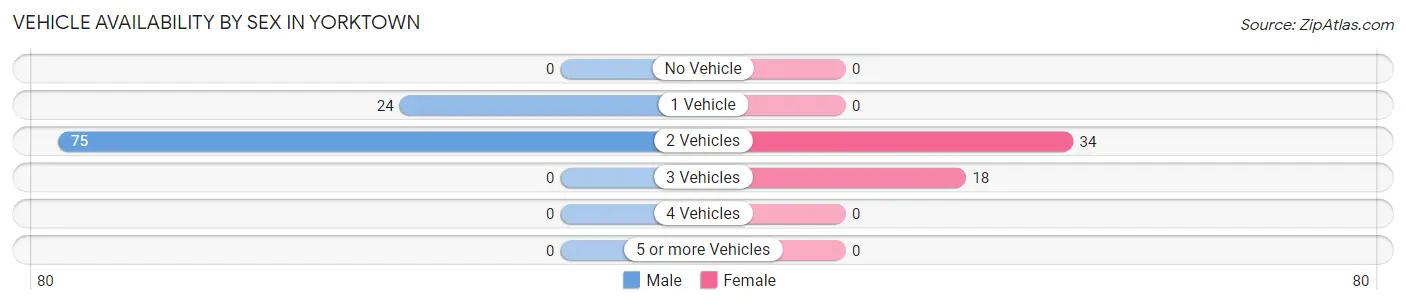
| Vehicles Available | Male | Female |
| No Vehicle | 0 (0.0%) | 0 (0.0%) |
| 1 Vehicle | 24 (24.2%) | 0 (0.0%) |
| 2 Vehicles | 75 (75.8%) | 34 (65.4%) |
| 3 Vehicles | 0 (0.0%) | 18 (34.6%) |
| 4 Vehicles | 0 (0.0%) | 0 (0.0%) |
| 5 or more Vehicles | 0 (0.0%) | 0 (0.0%) |
| Total | 99 (100.0%) | 52 (100.0%) |
Commute Time in Yorktown
The most frequently occuring commute durations in Yorktown are 15 to 19 minutes (43 commuters, 55.1%), 30 to 34 minutes (13 commuters, 16.7%), and 35 to 39 minutes (13 commuters, 16.7%).
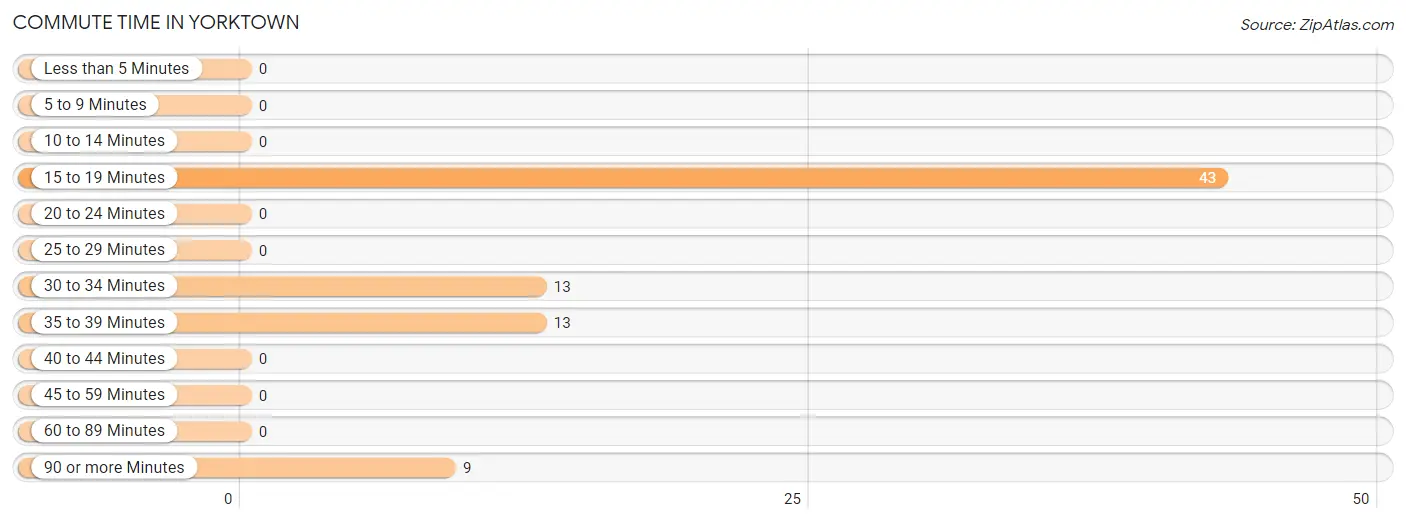
| Commute Time | # Commuters | % Commuters |
| Less than 5 Minutes | 0 | 0.0% |
| 5 to 9 Minutes | 0 | 0.0% |
| 10 to 14 Minutes | 0 | 0.0% |
| 15 to 19 Minutes | 43 | 55.1% |
| 20 to 24 Minutes | 0 | 0.0% |
| 25 to 29 Minutes | 0 | 0.0% |
| 30 to 34 Minutes | 13 | 16.7% |
| 35 to 39 Minutes | 13 | 16.7% |
| 40 to 44 Minutes | 0 | 0.0% |
| 45 to 59 Minutes | 0 | 0.0% |
| 60 to 89 Minutes | 0 | 0.0% |
| 90 or more Minutes | 9 | 11.5% |
Commute Time by Sex in Yorktown
The most common commute times in Yorktown are 30 to 34 minutes (13 commuters, 38.2%) for males and 15 to 19 minutes (31 commuters, 70.5%) for females.
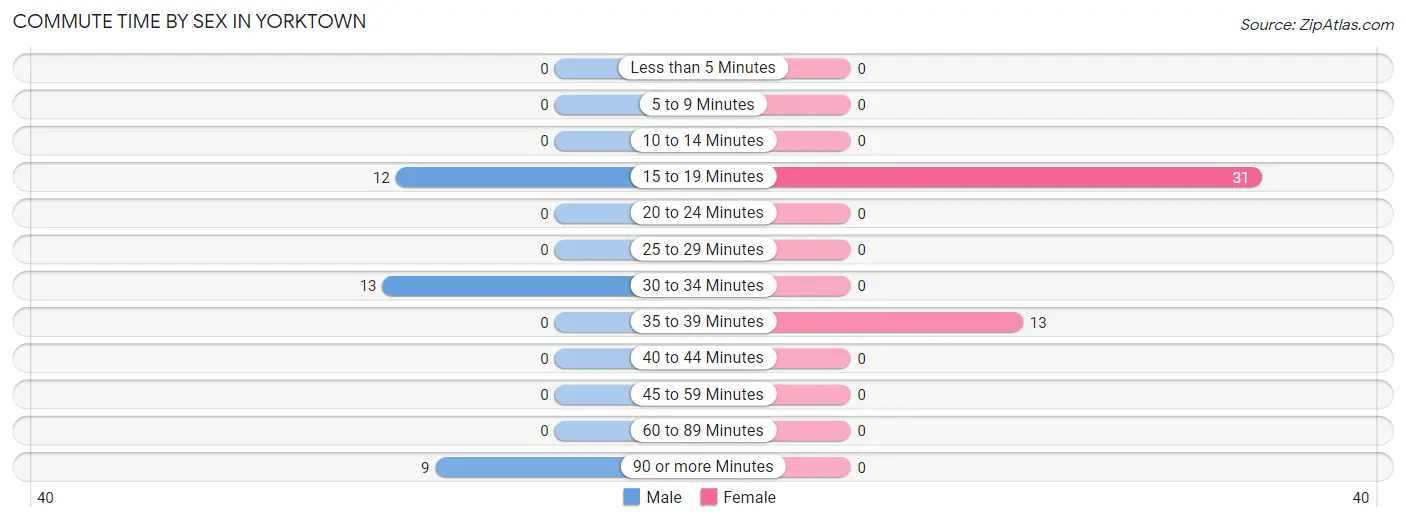
| Commute Time | Male | Female |
| Less than 5 Minutes | 0 (0.0%) | 0 (0.0%) |
| 5 to 9 Minutes | 0 (0.0%) | 0 (0.0%) |
| 10 to 14 Minutes | 0 (0.0%) | 0 (0.0%) |
| 15 to 19 Minutes | 12 (35.3%) | 31 (70.5%) |
| 20 to 24 Minutes | 0 (0.0%) | 0 (0.0%) |
| 25 to 29 Minutes | 0 (0.0%) | 0 (0.0%) |
| 30 to 34 Minutes | 13 (38.2%) | 0 (0.0%) |
| 35 to 39 Minutes | 0 (0.0%) | 13 (29.5%) |
| 40 to 44 Minutes | 0 (0.0%) | 0 (0.0%) |
| 45 to 59 Minutes | 0 (0.0%) | 0 (0.0%) |
| 60 to 89 Minutes | 0 (0.0%) | 0 (0.0%) |
| 90 or more Minutes | 9 (26.5%) | 0 (0.0%) |
Time of Departure to Work by Sex in Yorktown
The most frequent times of departure to work in Yorktown are 7:30 AM to 7:59 AM (13, 38.2%) for males and 6:00 AM to 6:29 AM (13, 29.5%) for females.
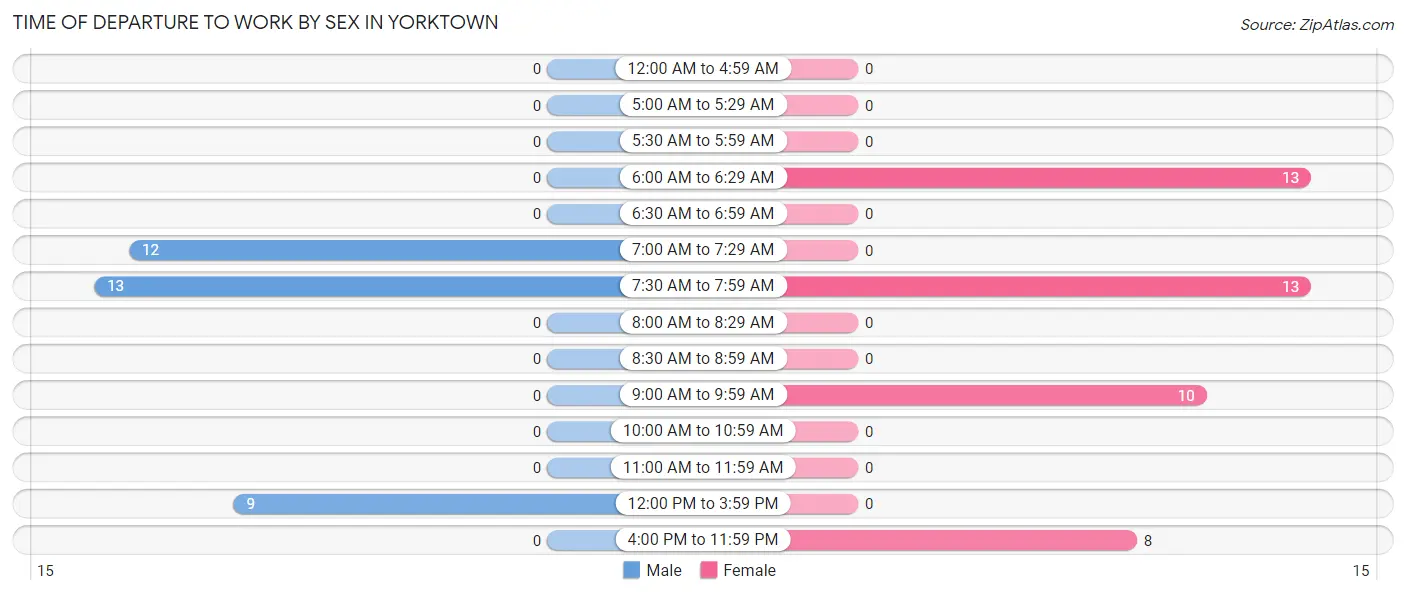
| Time of Departure | Male | Female |
| 12:00 AM to 4:59 AM | 0 (0.0%) | 0 (0.0%) |
| 5:00 AM to 5:29 AM | 0 (0.0%) | 0 (0.0%) |
| 5:30 AM to 5:59 AM | 0 (0.0%) | 0 (0.0%) |
| 6:00 AM to 6:29 AM | 0 (0.0%) | 13 (29.5%) |
| 6:30 AM to 6:59 AM | 0 (0.0%) | 0 (0.0%) |
| 7:00 AM to 7:29 AM | 12 (35.3%) | 0 (0.0%) |
| 7:30 AM to 7:59 AM | 13 (38.2%) | 13 (29.5%) |
| 8:00 AM to 8:29 AM | 0 (0.0%) | 0 (0.0%) |
| 8:30 AM to 8:59 AM | 0 (0.0%) | 0 (0.0%) |
| 9:00 AM to 9:59 AM | 0 (0.0%) | 10 (22.7%) |
| 10:00 AM to 10:59 AM | 0 (0.0%) | 0 (0.0%) |
| 11:00 AM to 11:59 AM | 0 (0.0%) | 0 (0.0%) |
| 12:00 PM to 3:59 PM | 9 (26.5%) | 0 (0.0%) |
| 4:00 PM to 11:59 PM | 0 (0.0%) | 8 (18.2%) |
| Total | 34 (100.0%) | 44 (100.0%) |
Housing Occupancy in Yorktown
Occupancy by Ownership in Yorktown
Of the total 120 dwellings in Yorktown, owner-occupied units account for 86 (71.7%), while renter-occupied units make up 34 (28.3%).
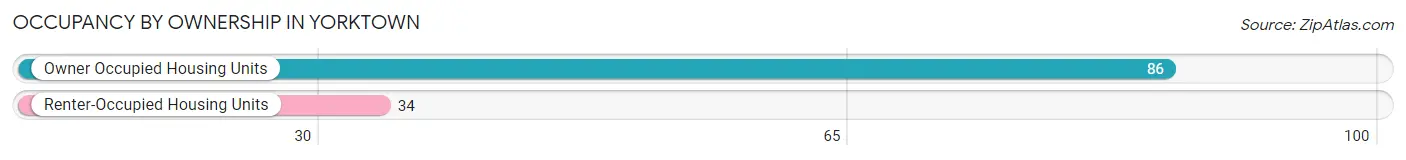
| Occupancy | # Housing Units | % Housing Units |
| Owner Occupied Housing Units | 86 | 71.7% |
| Renter-Occupied Housing Units | 34 | 28.3% |
| Total Occupied Housing Units | 120 | 100.0% |
Occupancy by Household Size in Yorktown
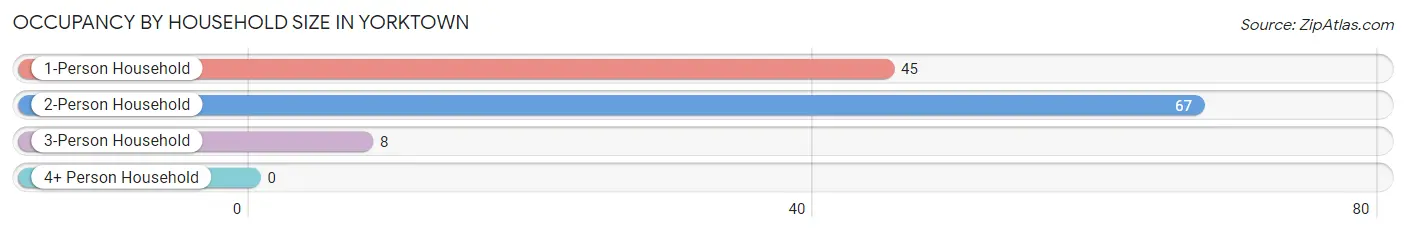
| Household Size | # Housing Units | % Housing Units |
| 1-Person Household | 45 | 37.5% |
| 2-Person Household | 67 | 55.8% |
| 3-Person Household | 8 | 6.7% |
| 4+ Person Household | 0 | 0.0% |
| Total Housing Units | 120 | 100.0% |
Occupancy by Ownership by Household Size in Yorktown
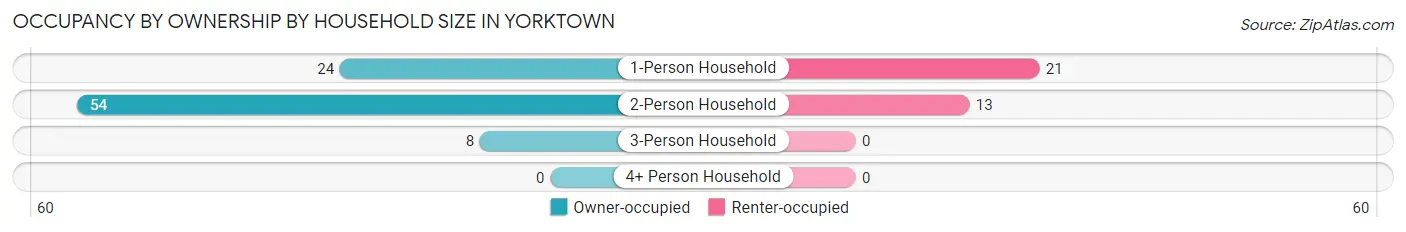
| Household Size | Owner-occupied | Renter-occupied |
| 1-Person Household | 24 (53.3%) | 21 (46.7%) |
| 2-Person Household | 54 (80.6%) | 13 (19.4%) |
| 3-Person Household | 8 (100.0%) | 0 (0.0%) |
| 4+ Person Household | 0 (0.0%) | 0 (0.0%) |
| Total Housing Units | 86 (71.7%) | 34 (28.3%) |
Occupancy by Educational Attainment in Yorktown
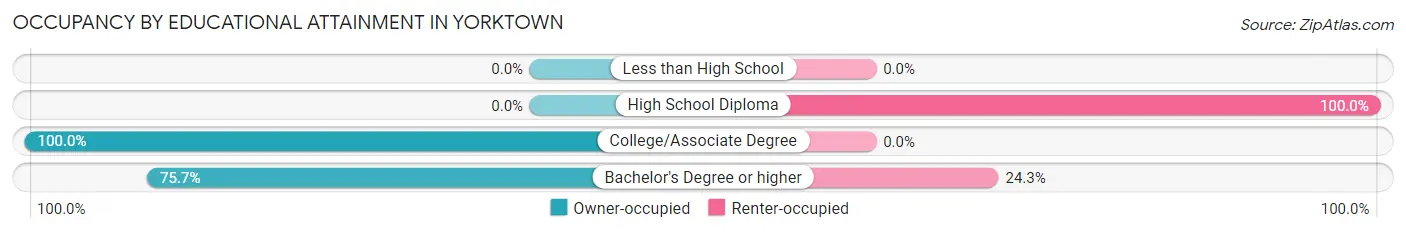
| Household Size | Owner-occupied | Renter-occupied |
| Less than High School | 0 (0.0%) | 0 (0.0%) |
| High School Diploma | 0 (0.0%) | 9 (100.0%) |
| College/Associate Degree | 8 (100.0%) | 0 (0.0%) |
| Bachelor's Degree or higher | 78 (75.7%) | 25 (24.3%) |
Occupancy by Age of Householder in Yorktown
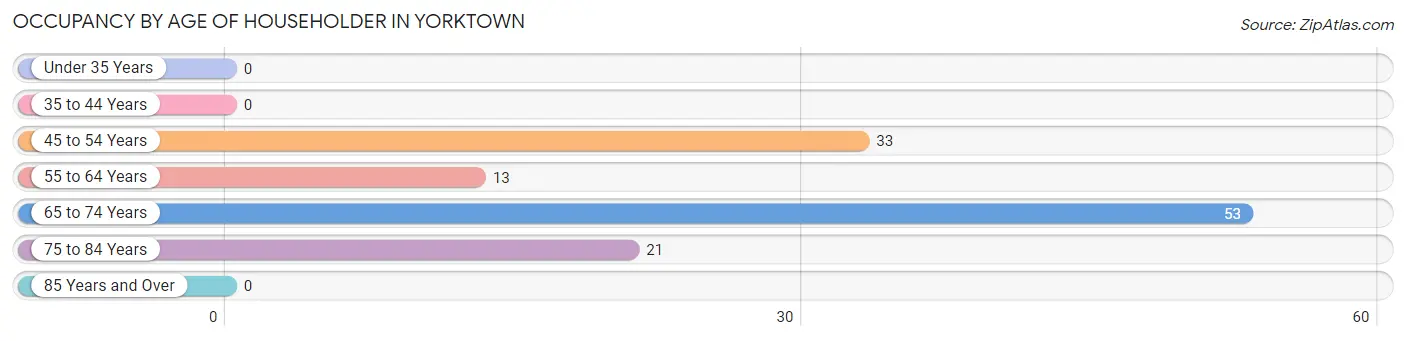
| Age Bracket | # Households | % Households |
| Under 35 Years | 0 | 0.0% |
| 35 to 44 Years | 0 | 0.0% |
| 45 to 54 Years | 33 | 27.5% |
| 55 to 64 Years | 13 | 10.8% |
| 65 to 74 Years | 53 | 44.2% |
| 75 to 84 Years | 21 | 17.5% |
| 85 Years and Over | 0 | 0.0% |
| Total | 120 | 100.0% |
Housing Finances in Yorktown
Median Income by Occupancy in Yorktown
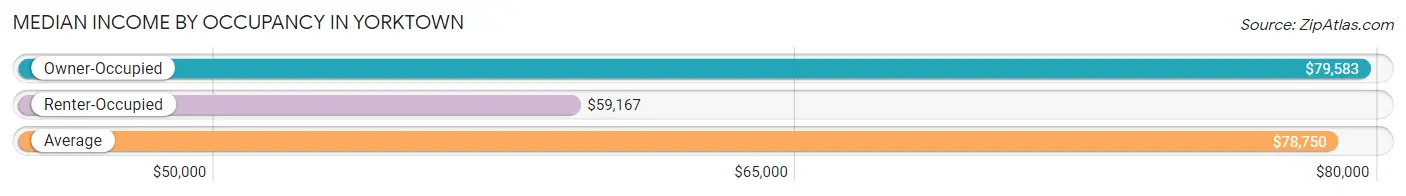
| Occupancy Type | # Households | Median Income |
| Owner-Occupied | 86 (71.7%) | $79,583 |
| Renter-Occupied | 34 (28.3%) | $59,167 |
| Average | 120 (100.0%) | $78,750 |
Occupancy by Householder Income Bracket in Yorktown
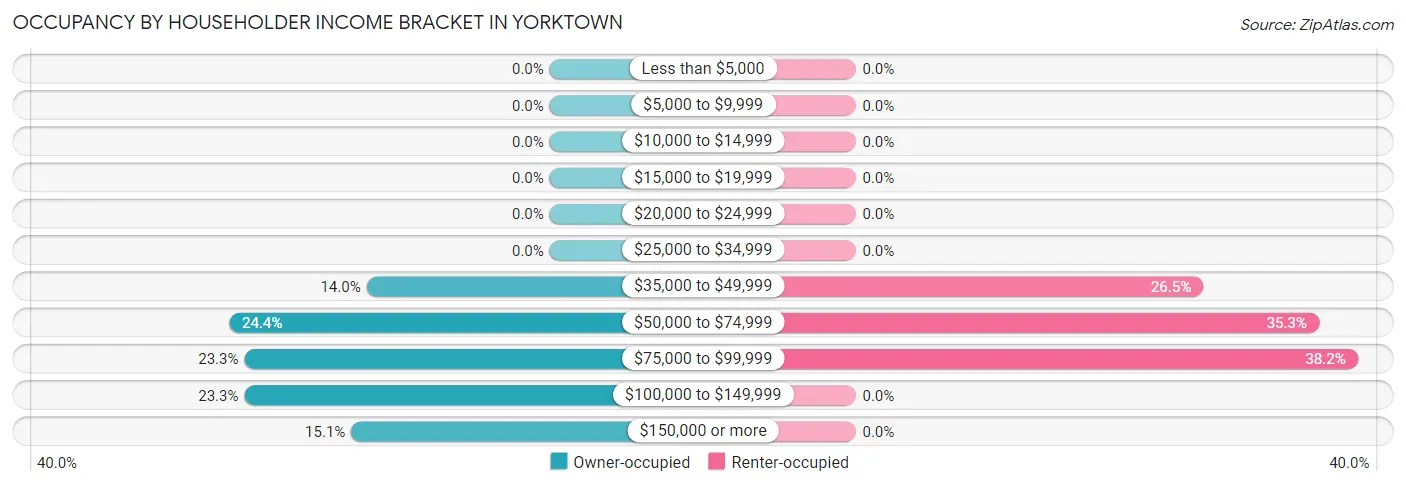
| Income Bracket | Owner-occupied | Renter-occupied |
| Less than $5,000 | 0 (0.0%) | 0 (0.0%) |
| $5,000 to $9,999 | 0 (0.0%) | 0 (0.0%) |
| $10,000 to $14,999 | 0 (0.0%) | 0 (0.0%) |
| $15,000 to $19,999 | 0 (0.0%) | 0 (0.0%) |
| $20,000 to $24,999 | 0 (0.0%) | 0 (0.0%) |
| $25,000 to $34,999 | 0 (0.0%) | 0 (0.0%) |
| $35,000 to $49,999 | 12 (14.0%) | 9 (26.5%) |
| $50,000 to $74,999 | 21 (24.4%) | 12 (35.3%) |
| $75,000 to $99,999 | 20 (23.3%) | 13 (38.2%) |
| $100,000 to $149,999 | 20 (23.3%) | 0 (0.0%) |
| $150,000 or more | 13 (15.1%) | 0 (0.0%) |
| Total | 86 (100.0%) | 34 (100.0%) |
Monthly Housing Cost Tiers in Yorktown
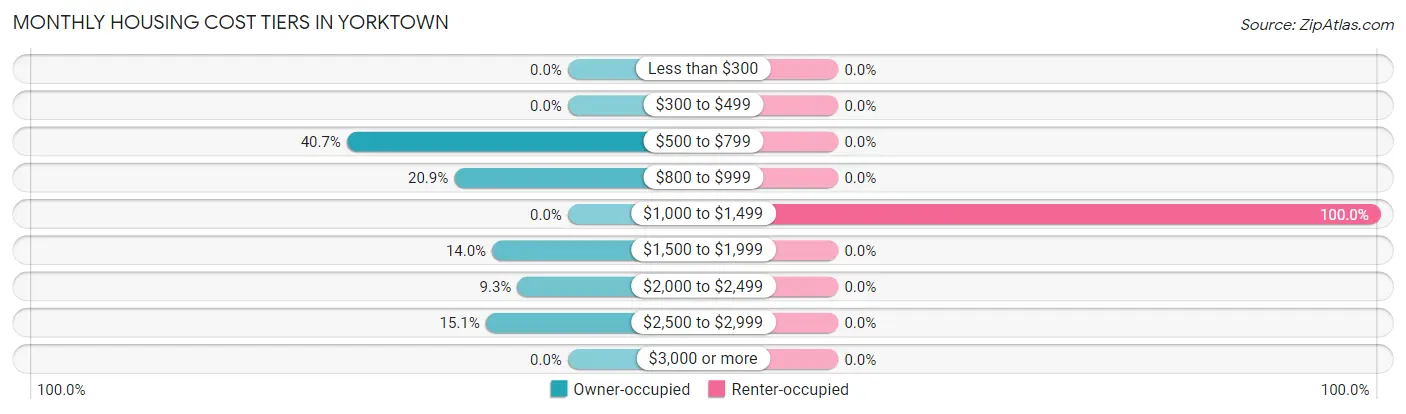
| Monthly Cost | Owner-occupied | Renter-occupied |
| Less than $300 | 0 (0.0%) | 0 (0.0%) |
| $300 to $499 | 0 (0.0%) | 0 (0.0%) |
| $500 to $799 | 35 (40.7%) | 0 (0.0%) |
| $800 to $999 | 18 (20.9%) | 0 (0.0%) |
| $1,000 to $1,499 | 0 (0.0%) | 34 (100.0%) |
| $1,500 to $1,999 | 12 (14.0%) | 0 (0.0%) |
| $2,000 to $2,499 | 8 (9.3%) | 0 (0.0%) |
| $2,500 to $2,999 | 13 (15.1%) | 0 (0.0%) |
| $3,000 or more | 0 (0.0%) | 0 (0.0%) |
| Total | 86 (100.0%) | 34 (100.0%) |
Physical Housing Characteristics in Yorktown
Housing Structures in Yorktown
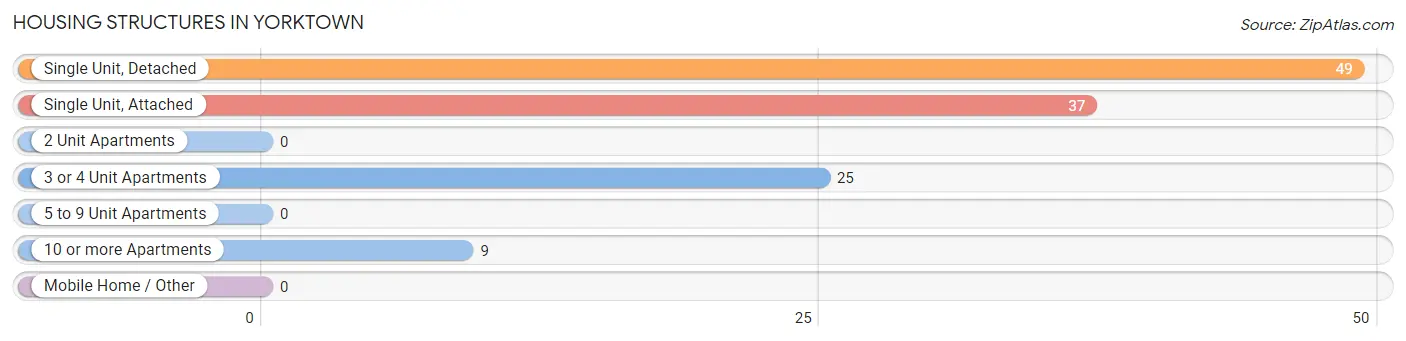
| Structure Type | # Housing Units | % Housing Units |
| Single Unit, Detached | 49 | 40.8% |
| Single Unit, Attached | 37 | 30.8% |
| 2 Unit Apartments | 0 | 0.0% |
| 3 or 4 Unit Apartments | 25 | 20.8% |
| 5 to 9 Unit Apartments | 0 | 0.0% |
| 10 or more Apartments | 9 | 7.5% |
| Mobile Home / Other | 0 | 0.0% |
| Total | 120 | 100.0% |
Housing Structures by Occupancy in Yorktown
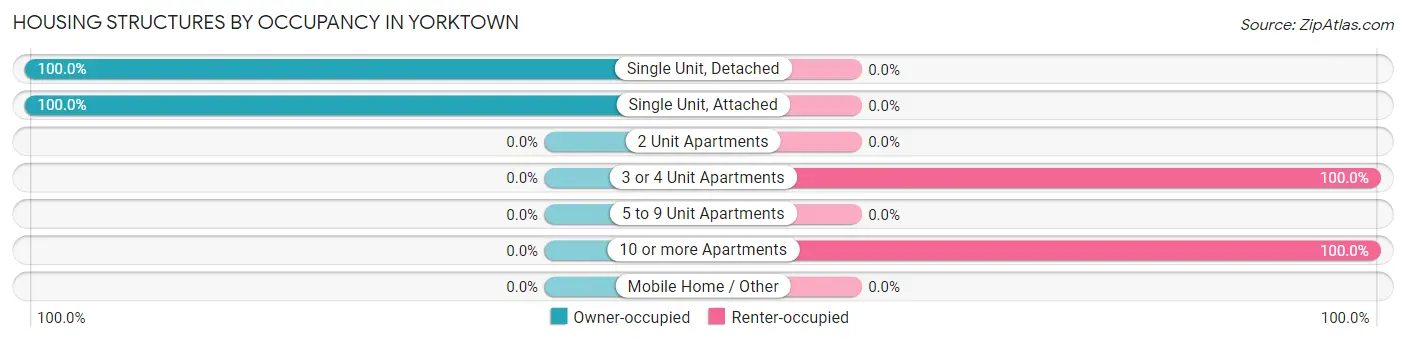
| Structure Type | Owner-occupied | Renter-occupied |
| Single Unit, Detached | 49 (100.0%) | 0 (0.0%) |
| Single Unit, Attached | 37 (100.0%) | 0 (0.0%) |
| 2 Unit Apartments | 0 (0.0%) | 0 (0.0%) |
| 3 or 4 Unit Apartments | 0 (0.0%) | 25 (100.0%) |
| 5 to 9 Unit Apartments | 0 (0.0%) | 0 (0.0%) |
| 10 or more Apartments | 0 (0.0%) | 9 (100.0%) |
| Mobile Home / Other | 0 (0.0%) | 0 (0.0%) |
| Total | 86 (71.7%) | 34 (28.3%) |
Housing Structures by Number of Rooms in Yorktown
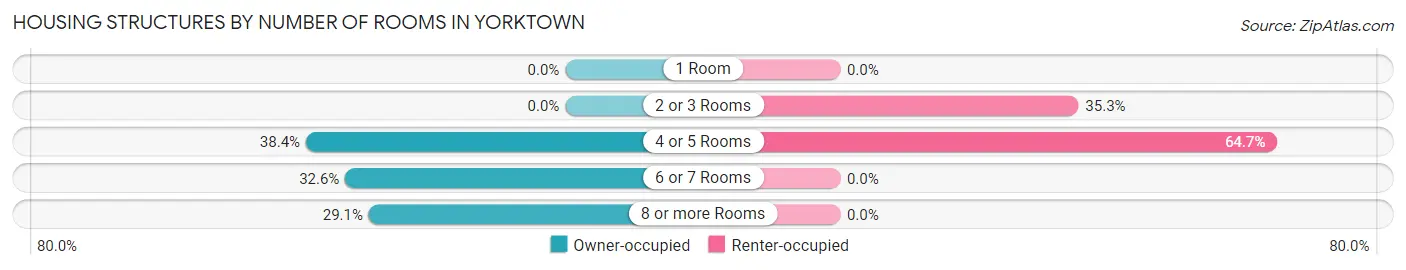
| Number of Rooms | Owner-occupied | Renter-occupied |
| 1 Room | 0 (0.0%) | 0 (0.0%) |
| 2 or 3 Rooms | 0 (0.0%) | 12 (35.3%) |
| 4 or 5 Rooms | 33 (38.4%) | 22 (64.7%) |
| 6 or 7 Rooms | 28 (32.6%) | 0 (0.0%) |
| 8 or more Rooms | 25 (29.1%) | 0 (0.0%) |
| Total | 86 (100.0%) | 34 (100.0%) |
Housing Structure by Heating Type in Yorktown
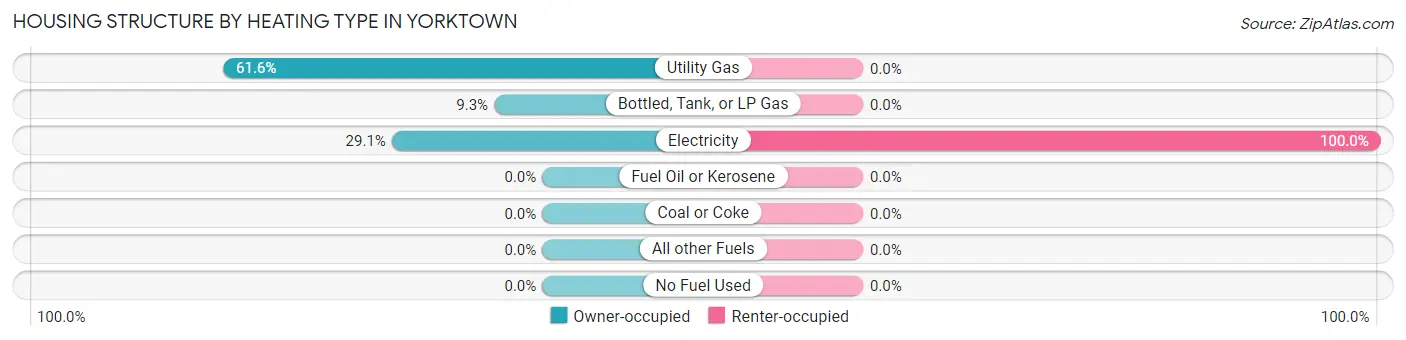
| Heating Type | Owner-occupied | Renter-occupied |
| Utility Gas | 53 (61.6%) | 0 (0.0%) |
| Bottled, Tank, or LP Gas | 8 (9.3%) | 0 (0.0%) |
| Electricity | 25 (29.1%) | 34 (100.0%) |
| Fuel Oil or Kerosene | 0 (0.0%) | 0 (0.0%) |
| Coal or Coke | 0 (0.0%) | 0 (0.0%) |
| All other Fuels | 0 (0.0%) | 0 (0.0%) |
| No Fuel Used | 0 (0.0%) | 0 (0.0%) |
| Total | 86 (100.0%) | 34 (100.0%) |
Household Vehicle Usage in Yorktown
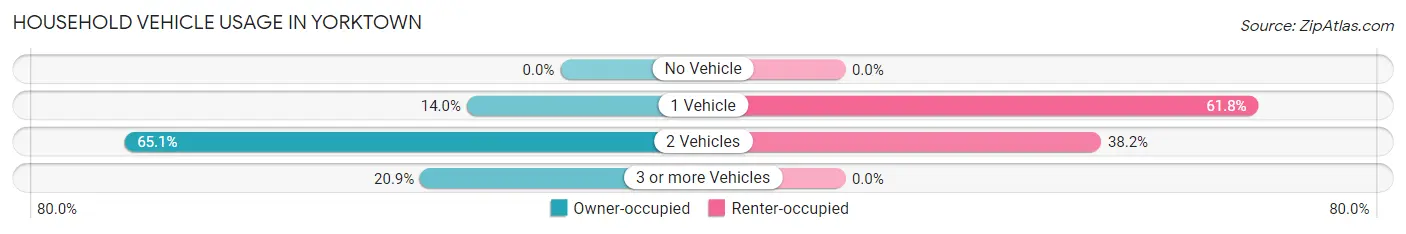
| Vehicles per Household | Owner-occupied | Renter-occupied |
| No Vehicle | 0 (0.0%) | 0 (0.0%) |
| 1 Vehicle | 12 (14.0%) | 21 (61.8%) |
| 2 Vehicles | 56 (65.1%) | 13 (38.2%) |
| 3 or more Vehicles | 18 (20.9%) | 0 (0.0%) |
| Total | 86 (100.0%) | 34 (100.0%) |
Real Estate & Mortgages in Yorktown
Real Estate and Mortgage Overview in Yorktown
| Characteristic | Without Mortgage | With Mortgage |
| Housing Units | 43 | 43 |
| Median Property Value | $535,000 | $535,000 |
| Median Household Income | $54,327 | $13 |
| Monthly Housing Costs | $673 | $0 |
| Real Estate Taxes | $2,614 | $0 |
Property Value by Mortgage Status in Yorktown
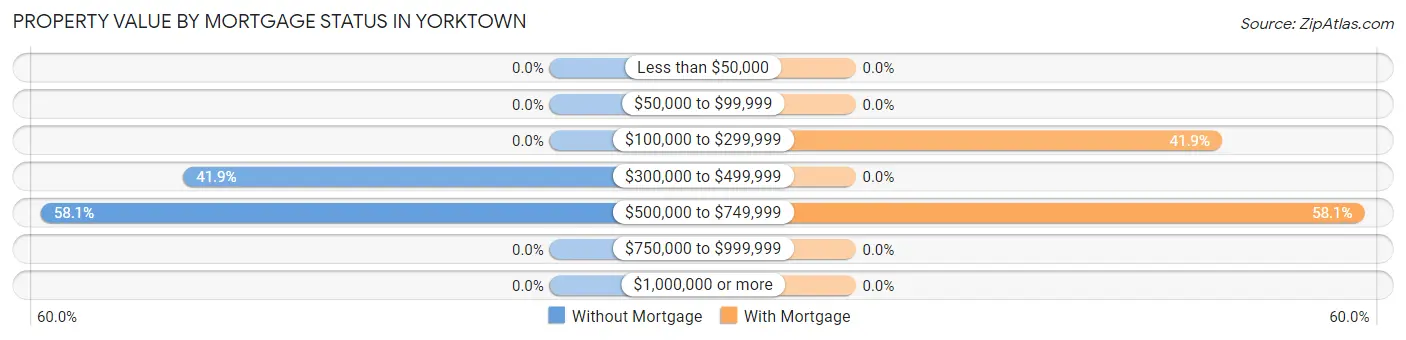
| Property Value | Without Mortgage | With Mortgage |
| Less than $50,000 | 0 (0.0%) | 0 (0.0%) |
| $50,000 to $99,999 | 0 (0.0%) | 0 (0.0%) |
| $100,000 to $299,999 | 0 (0.0%) | 18 (41.9%) |
| $300,000 to $499,999 | 18 (41.9%) | 0 (0.0%) |
| $500,000 to $749,999 | 25 (58.1%) | 25 (58.1%) |
| $750,000 to $999,999 | 0 (0.0%) | 0 (0.0%) |
| $1,000,000 or more | 0 (0.0%) | 0 (0.0%) |
| Total | 43 (100.0%) | 43 (100.0%) |
Household Income by Mortgage Status in Yorktown
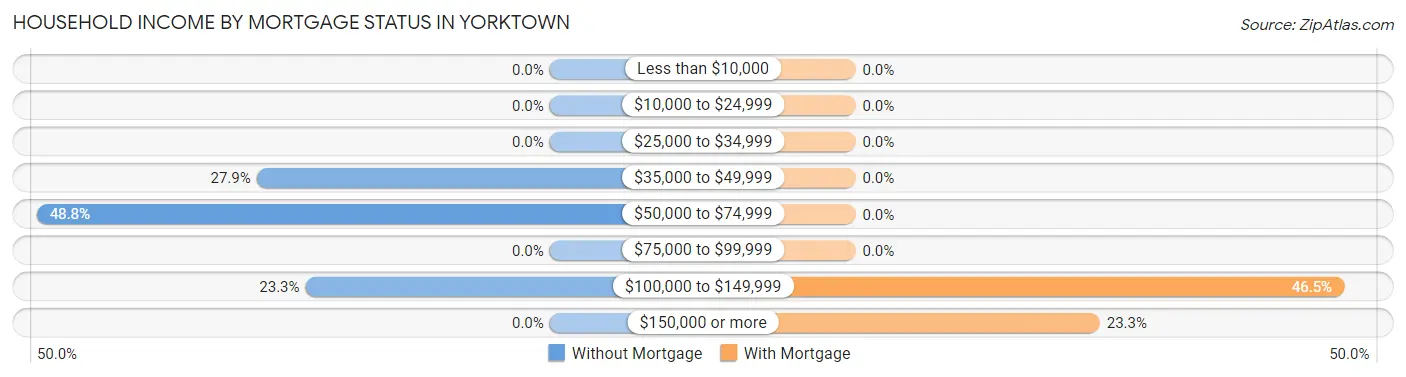
| Household Income | Without Mortgage | With Mortgage |
| Less than $10,000 | 0 (0.0%) | 0 (0.0%) |
| $10,000 to $24,999 | 0 (0.0%) | 0 (0.0%) |
| $25,000 to $34,999 | 0 (0.0%) | 0 (0.0%) |
| $35,000 to $49,999 | 12 (27.9%) | 0 (0.0%) |
| $50,000 to $74,999 | 21 (48.8%) | 0 (0.0%) |
| $75,000 to $99,999 | 0 (0.0%) | 0 (0.0%) |
| $100,000 to $149,999 | 10 (23.3%) | 20 (46.5%) |
| $150,000 or more | 0 (0.0%) | 10 (23.3%) |
| Total | 43 (100.0%) | 43 (100.0%) |
Property Value to Household Income Ratio in Yorktown
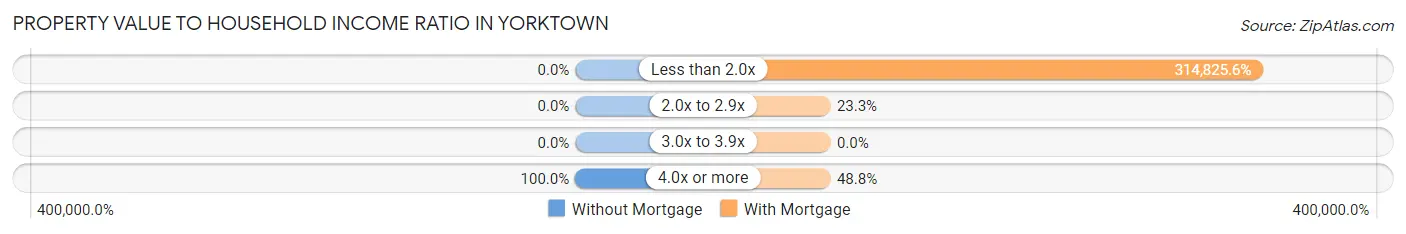
| Value-to-Income Ratio | Without Mortgage | With Mortgage |
| Less than 2.0x | 0 (0.0%) | 135,375 (314,825.6%) |
| 2.0x to 2.9x | 0 (0.0%) | 10 (23.3%) |
| 3.0x to 3.9x | 0 (0.0%) | 0 (0.0%) |
| 4.0x or more | 43 (100.0%) | 21 (48.8%) |
| Total | 43 (100.0%) | 43 (100.0%) |
Real Estate Taxes by Mortgage Status in Yorktown
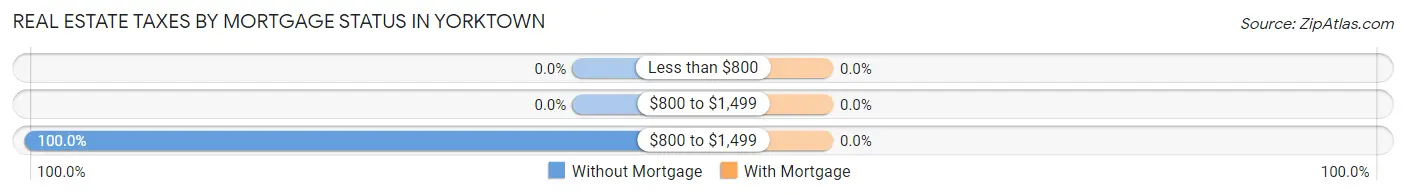
| Property Taxes | Without Mortgage | With Mortgage |
| Less than $800 | 0 (0.0%) | 0 (0.0%) |
| $800 to $1,499 | 0 (0.0%) | 0 (0.0%) |
| $800 to $1,499 | 43 (100.0%) | 0 (0.0%) |
| Total | 43 (100.0%) | 43 (100.0%) |
Health & Disability in Yorktown
Health Insurance Coverage by Age in Yorktown
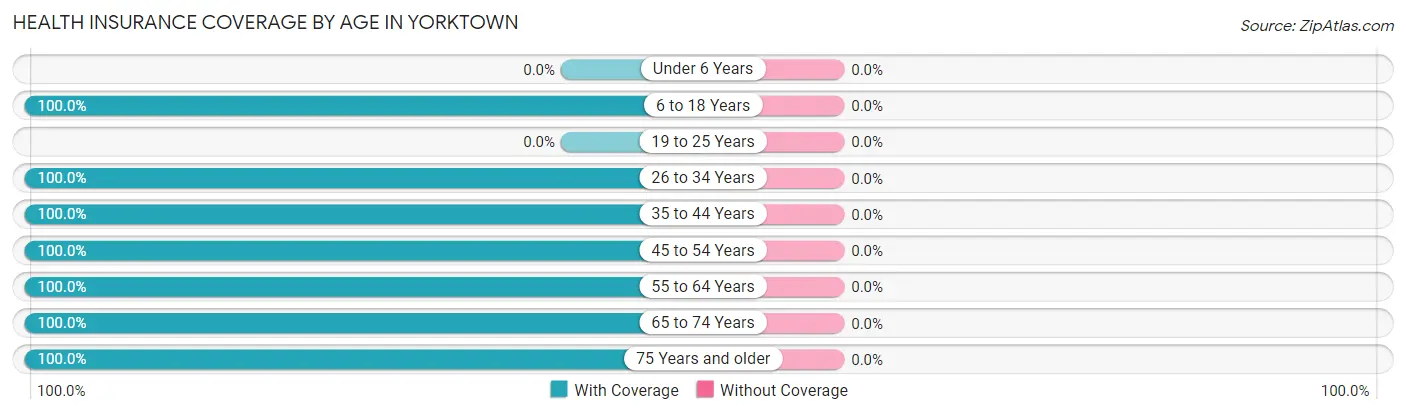
| Age Bracket | With Coverage | Without Coverage |
| Under 6 Years | 0 (0.0%) | 0 (0.0%) |
| 6 to 18 Years | 10 (100.0%) | 0 (0.0%) |
| 19 to 25 Years | 0 (0.0%) | 0 (0.0%) |
| 26 to 34 Years | 23 (100.0%) | 0 (0.0%) |
| 35 to 44 Years | 9 (100.0%) | 0 (0.0%) |
| 45 to 54 Years | 33 (100.0%) | 0 (0.0%) |
| 55 to 64 Years | 51 (100.0%) | 0 (0.0%) |
| 65 to 74 Years | 53 (100.0%) | 0 (0.0%) |
| 75 Years and older | 38 (100.0%) | 0 (0.0%) |
| Total | 217 (100.0%) | 0 (0.0%) |
Health Insurance Coverage by Citizenship Status in Yorktown
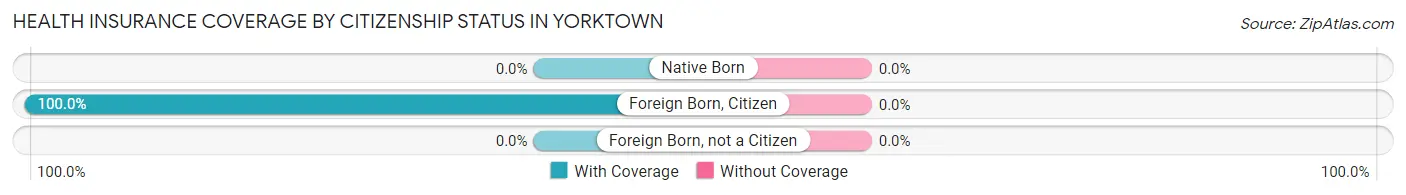
| Citizenship Status | With Coverage | Without Coverage |
| Native Born | 0 (0.0%) | 0 (0.0%) |
| Foreign Born, Citizen | 10 (100.0%) | 0 (0.0%) |
| Foreign Born, not a Citizen | 0 (0.0%) | 0 (0.0%) |
Health Insurance Coverage by Household Income in Yorktown
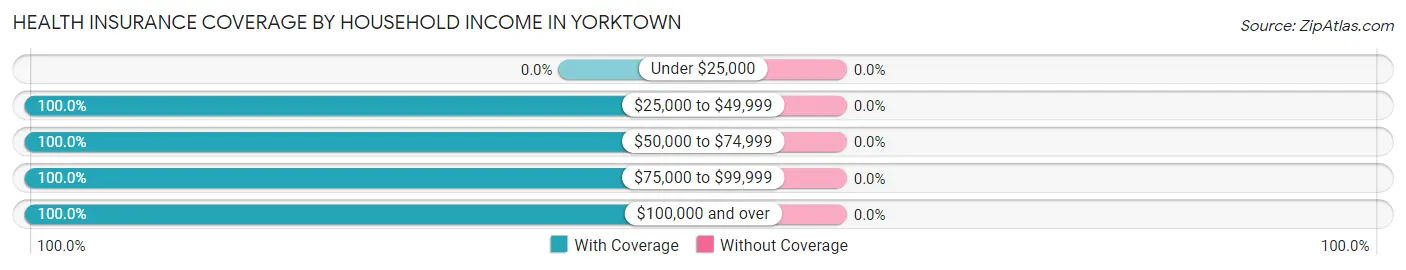
| Household Income | With Coverage | Without Coverage |
| Under $25,000 | 0 (0.0%) | 0 (0.0%) |
| $25,000 to $49,999 | 21 (100.0%) | 0 (0.0%) |
| $50,000 to $74,999 | 64 (100.0%) | 0 (0.0%) |
| $75,000 to $99,999 | 69 (100.0%) | 0 (0.0%) |
| $100,000 and over | 63 (100.0%) | 0 (0.0%) |
Public vs Private Health Insurance Coverage by Age in Yorktown
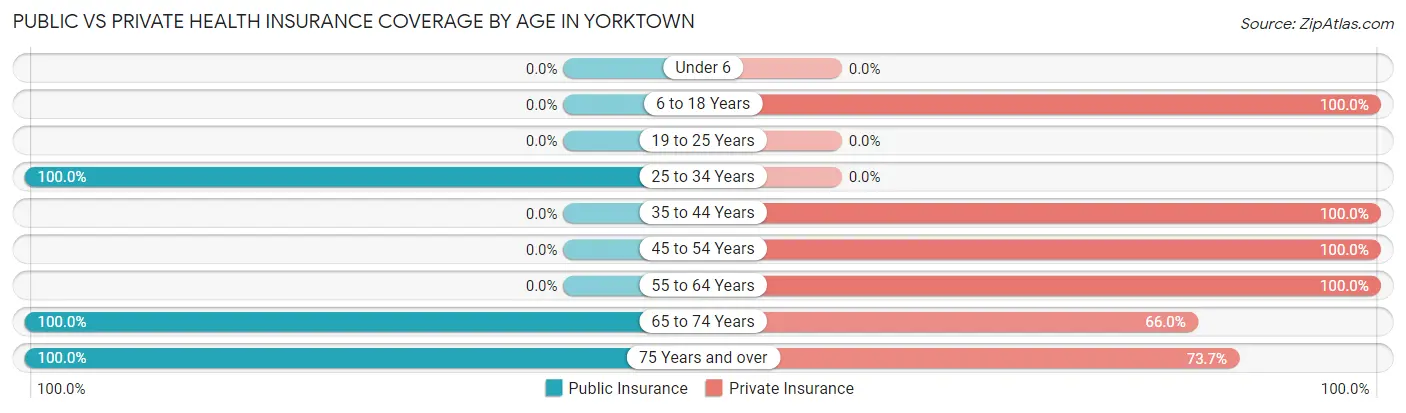
| Age Bracket | Public Insurance | Private Insurance |
| Under 6 | 0 (0.0%) | 0 (0.0%) |
| 6 to 18 Years | 0 (0.0%) | 10 (100.0%) |
| 19 to 25 Years | 0 (0.0%) | 0 (0.0%) |
| 25 to 34 Years | 23 (100.0%) | 0 (0.0%) |
| 35 to 44 Years | 0 (0.0%) | 9 (100.0%) |
| 45 to 54 Years | 0 (0.0%) | 33 (100.0%) |
| 55 to 64 Years | 0 (0.0%) | 51 (100.0%) |
| 65 to 74 Years | 53 (100.0%) | 35 (66.0%) |
| 75 Years and over | 38 (100.0%) | 28 (73.7%) |
| Total | 114 (52.5%) | 166 (76.5%) |
Disability Status by Sex by Age in Yorktown
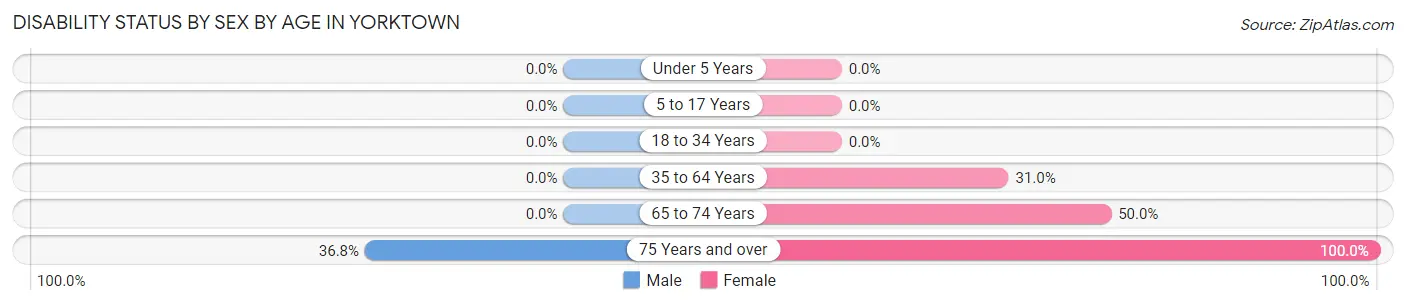
| Age Bracket | Male | Female |
| Under 5 Years | 0 (0.0%) | 0 (0.0%) |
| 5 to 17 Years | 0 (0.0%) | 0 (0.0%) |
| 18 to 34 Years | 0 (0.0%) | 0 (0.0%) |
| 35 to 64 Years | 0 (0.0%) | 13 (30.9%) |
| 65 to 74 Years | 0 (0.0%) | 10 (50.0%) |
| 75 Years and over | 7 (36.8%) | 19 (100.0%) |
Disability Class by Sex by Age in Yorktown
Disability Class: Hearing Difficulty
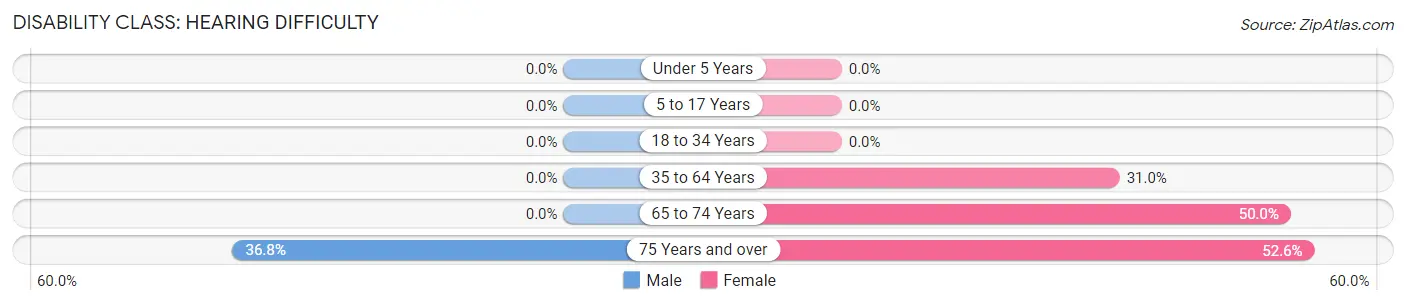
| Age Bracket | Male | Female |
| Under 5 Years | 0 (0.0%) | 0 (0.0%) |
| 5 to 17 Years | 0 (0.0%) | 0 (0.0%) |
| 18 to 34 Years | 0 (0.0%) | 0 (0.0%) |
| 35 to 64 Years | 0 (0.0%) | 13 (30.9%) |
| 65 to 74 Years | 0 (0.0%) | 10 (50.0%) |
| 75 Years and over | 7 (36.8%) | 10 (52.6%) |
Disability Class: Vision Difficulty
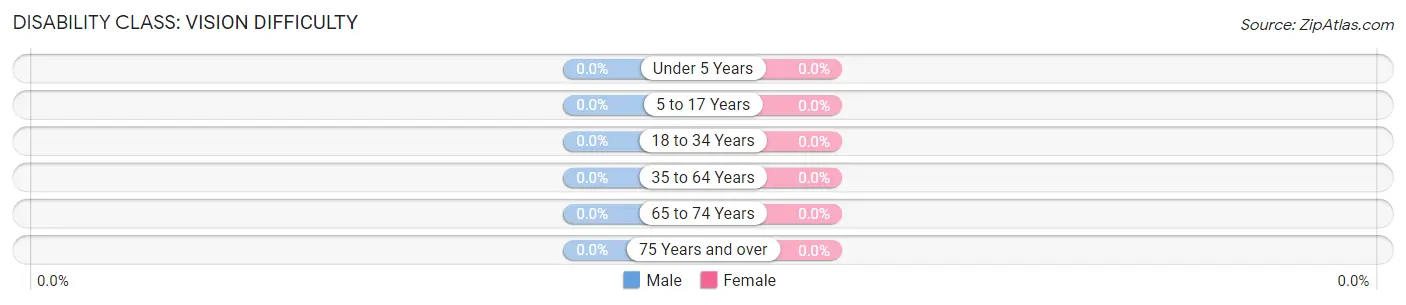
| Age Bracket | Male | Female |
| Under 5 Years | 0 (0.0%) | 0 (0.0%) |
| 5 to 17 Years | 0 (0.0%) | 0 (0.0%) |
| 18 to 34 Years | 0 (0.0%) | 0 (0.0%) |
| 35 to 64 Years | 0 (0.0%) | 0 (0.0%) |
| 65 to 74 Years | 0 (0.0%) | 0 (0.0%) |
| 75 Years and over | 0 (0.0%) | 0 (0.0%) |
Disability Class: Cognitive Difficulty
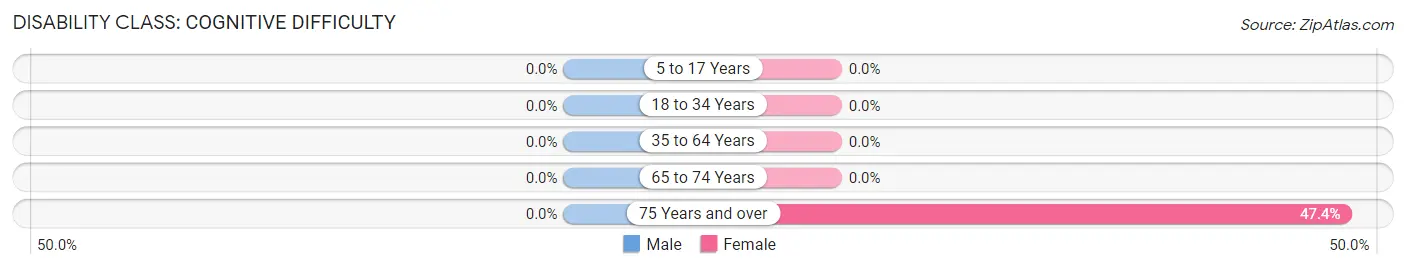
| Age Bracket | Male | Female |
| 5 to 17 Years | 0 (0.0%) | 0 (0.0%) |
| 18 to 34 Years | 0 (0.0%) | 0 (0.0%) |
| 35 to 64 Years | 0 (0.0%) | 0 (0.0%) |
| 65 to 74 Years | 0 (0.0%) | 0 (0.0%) |
| 75 Years and over | 0 (0.0%) | 9 (47.4%) |
Disability Class: Ambulatory Difficulty
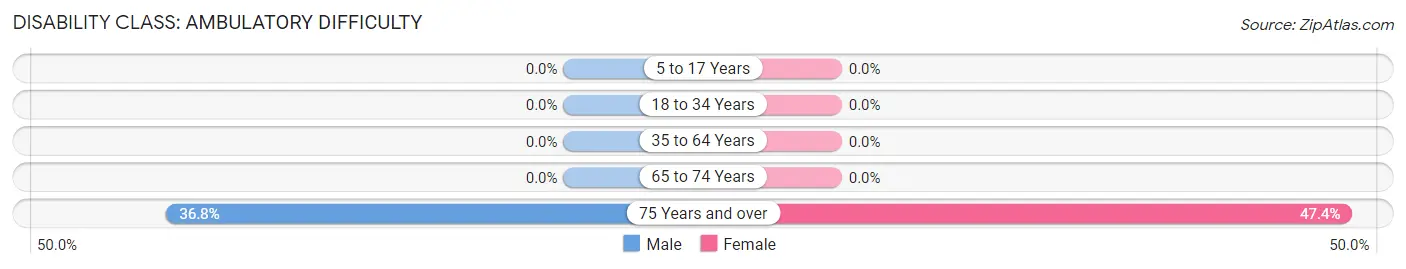
| Age Bracket | Male | Female |
| 5 to 17 Years | 0 (0.0%) | 0 (0.0%) |
| 18 to 34 Years | 0 (0.0%) | 0 (0.0%) |
| 35 to 64 Years | 0 (0.0%) | 0 (0.0%) |
| 65 to 74 Years | 0 (0.0%) | 0 (0.0%) |
| 75 Years and over | 7 (36.8%) | 9 (47.4%) |
Disability Class: Self-Care Difficulty
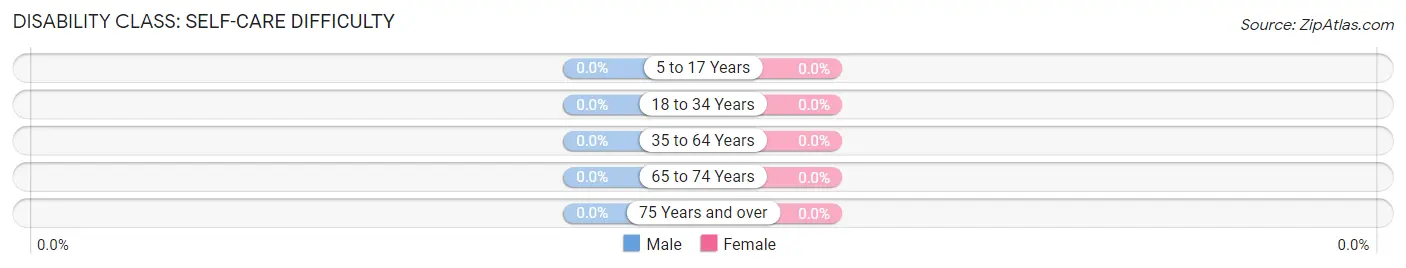
| Age Bracket | Male | Female |
| 5 to 17 Years | 0 (0.0%) | 0 (0.0%) |
| 18 to 34 Years | 0 (0.0%) | 0 (0.0%) |
| 35 to 64 Years | 0 (0.0%) | 0 (0.0%) |
| 65 to 74 Years | 0 (0.0%) | 0 (0.0%) |
| 75 Years and over | 0 (0.0%) | 0 (0.0%) |
Technology Access in Yorktown
Computing Device Access in Yorktown
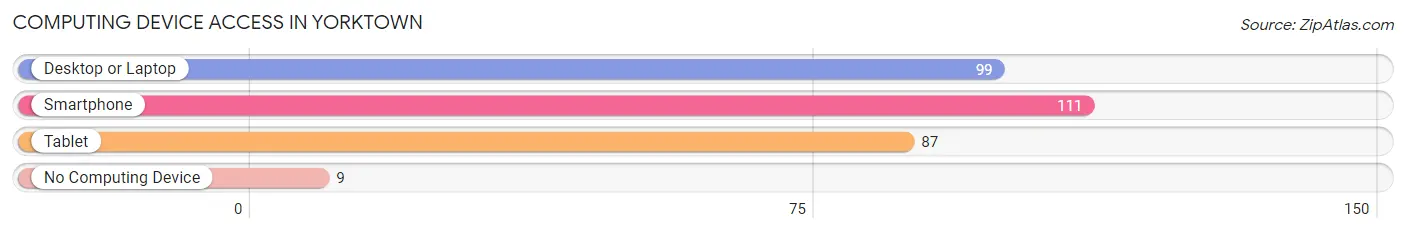
| Device Type | # Households | % Households |
| Desktop or Laptop | 99 | 82.5% |
| Smartphone | 111 | 92.5% |
| Tablet | 87 | 72.5% |
| No Computing Device | 9 | 7.5% |
| Total | 120 | 100.0% |
Internet Access in Yorktown
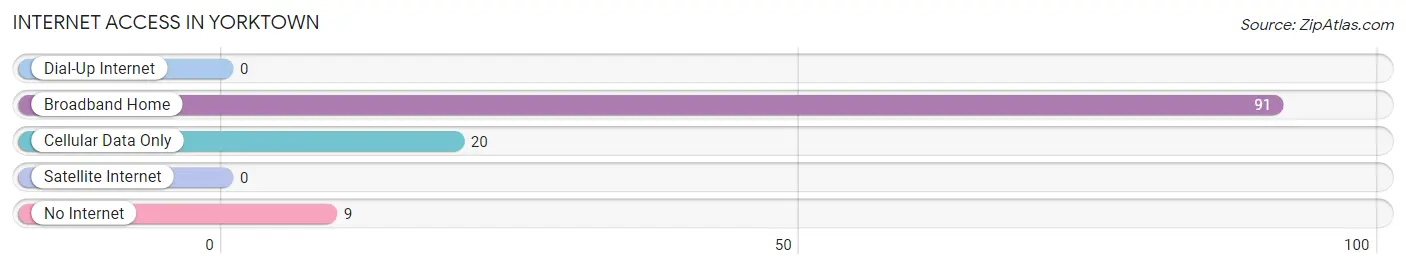
| Internet Type | # Households | % Households |
| Dial-Up Internet | 0 | 0.0% |
| Broadband Home | 91 | 75.8% |
| Cellular Data Only | 20 | 16.7% |
| Satellite Internet | 0 | 0.0% |
| No Internet | 9 | 7.5% |
| Total | 120 | 100.0% |
Yorktown Summary
Yorktown, Virginia is a small town located in the Hampton Roads region of the state. It is situated on the York River, which is part of the Chesapeake Bay watershed. The town is best known for its role in the American Revolutionary War, when it was the site of the decisive battle that ended the war. Today, Yorktown is a popular tourist destination, with many historical sites and attractions.
Geography
Yorktown is located in the southeastern corner of Virginia, in York County. It is situated on the York River, which is part of the Chesapeake Bay watershed. The town is bordered by the James River to the south and the York-Hampton Roads Bridge-Tunnel to the east. The town is located approximately 20 miles from the state capital of Richmond and about 60 miles from Washington, D.C.
The town is situated on a peninsula, with the York River to the north and the James River to the south. The terrain is mostly flat, with some rolling hills. The climate is humid subtropical, with hot, humid summers and mild winters.
History
Yorktown was founded in 1691 by English settlers. It was named after the Duke of York, who later became King James II of England. The town was an important port during the colonial era, and it was the site of the decisive battle of the American Revolutionary War in 1781. The British forces were defeated by the combined forces of the Continental Army and the French Navy.
The town was incorporated in 1782 and has remained an important port ever since. It was the site of the Yorktown Naval Weapons Station, which was decommissioned in 2005. Today, the town is a popular tourist destination, with many historical sites and attractions.
Economy
The economy of Yorktown is largely based on tourism. The town is home to several historical sites, including the Yorktown Battlefield, the Yorktown Victory Monument, and the Yorktown National Cemetery. The town is also home to the Yorktown Naval Weapons Station, which is now a museum.
The town is also home to several businesses, including restaurants, retail stores, and hotels. The town is also home to a number of marinas, which provide access to the York River and the Chesapeake Bay.
Demographics
As of the 2010 census, the population of Yorktown was 2,209. The racial makeup of the town was 94.3% White, 2.2% African American, 0.3% Native American, 0.7% Asian, 0.1% Pacific Islander, 0.7% from other races, and 1.7% from two or more races. Hispanic or Latino of any race were 2.2% of the population.
The median household income in Yorktown was $50,945, and the median family income was $60,917. The per capita income was $25,945. About 5.3% of families and 7.2% of the population were below the poverty line, including 8.3% of those under age 18 and 5.2% of those age 65 or over.
Conclusion
Yorktown, Virginia is a small town located in the Hampton Roads region of the state. It is best known for its role in the American Revolutionary War, when it was the site of the decisive battle that ended the war. Today, Yorktown is a popular tourist destination, with many historical sites and attractions. The economy of the town is largely based on tourism, and the population is mostly white. Yorktown is a great place to visit for its historical significance and its natural beauty.
Common Questions
What is Per Capita Income in Yorktown?
Per Capita income in Yorktown is $48,696.
What is the Median Family Income in Yorktown?
Median Family Income in Yorktown is $104,625.
What is the Median Household income in Yorktown?
Median Household Income in Yorktown is $78,750.
What is Inequality or Gini Index in Yorktown?
Inequality or Gini Index in Yorktown is 0.25.
What is the Total Population of Yorktown?
Total Population of Yorktown is 217.
What is the Total Male Population of Yorktown?
Total Male Population of Yorktown is 126.
What is the Total Female Population of Yorktown?
Total Female Population of Yorktown is 91.
What is the Ratio of Males per 100 Females in Yorktown?
There are 138.46 Males per 100 Females in Yorktown.
What is the Ratio of Females per 100 Males in Yorktown?
There are 72.22 Females per 100 Males in Yorktown.
What is the Median Population Age in Yorktown?
Median Population Age in Yorktown is 59.3 Years.
What is the Average Family Size in Yorktown
Average Family Size in Yorktown is 2.2 People.
What is the Average Household Size in Yorktown
Average Household Size in Yorktown is 1.8 People.
How Large is the Labor Force in Yorktown?
There are 151 People in the Labor Forcein in Yorktown.
What is the Percentage of People in the Labor Force in Yorktown?
72.9% of People are in the Labor Force in Yorktown.