Calistoga, CA Map & Demographics
Calistoga Map
Calistoga Overview
$61,823
PER CAPITA INCOME
$106,582
AVG FAMILY INCOME
$96,667
AVG HOUSEHOLD INCOME
7.8%
WAGE / INCOME GAP [ % ]
92.2¢/ $1
WAGE / INCOME GAP [ $ ]
0.57
INEQUALITY / GINI INDEX
5,191
TOTAL POPULATION
2,825
MALE POPULATION
2,366
FEMALE POPULATION
119.40
MALES / 100 FEMALES
83.75
FEMALES / 100 MALES
49.2
MEDIAN AGE
3.1
AVG FAMILY SIZE
2.4
AVG HOUSEHOLD SIZE
2,731
LABOR FORCE [ PEOPLE ]
59.6%
PERCENT IN LABOR FORCE
0.6%
UNEMPLOYMENT RATE
Calistoga Zip Codes
Calistoga Area Codes
Income in Calistoga
Income Overview in Calistoga
Per Capita Income in Calistoga is $61,823, while median incomes of families and households are $106,582 and $96,667 respectively.
| Characteristic | Number | Measure |
| Per Capita Income | 5,191 | $61,823 |
| Median Family Income | 1,215 | $106,582 |
| Mean Family Income | 1,215 | $217,205 |
| Median Household Income | 2,116 | $96,667 |
| Mean Household Income | 2,116 | $156,769 |
| Income Deficit | 1,215 | $0 |
| Wage / Income Gap (%) | 5,191 | 7.83% |
| Wage / Income Gap ($) | 5,191 | 92.17¢ per $1 |
| Gini / Inequality Index | 5,191 | 0.57 |
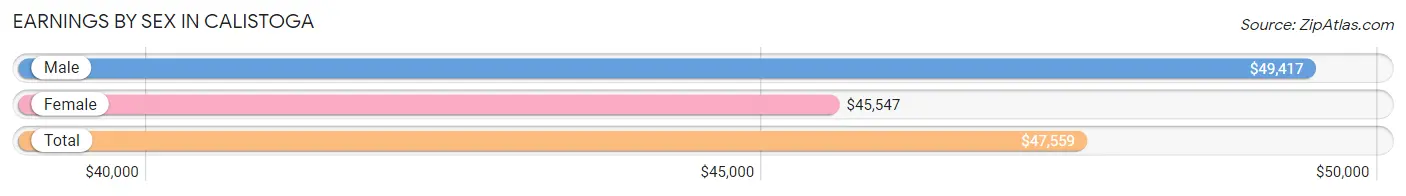
Earnings by Sex in Calistoga
Average Earnings in Calistoga are $47,559, $49,417 for men and $45,547 for women, a difference of 7.8%.
| Sex | Number | Average Earnings |
| Male | 1,518 (52.7%) | $49,417 |
| Female | 1,364 (47.3%) | $45,547 |
| Total | 2,882 (100.0%) | $47,559 |
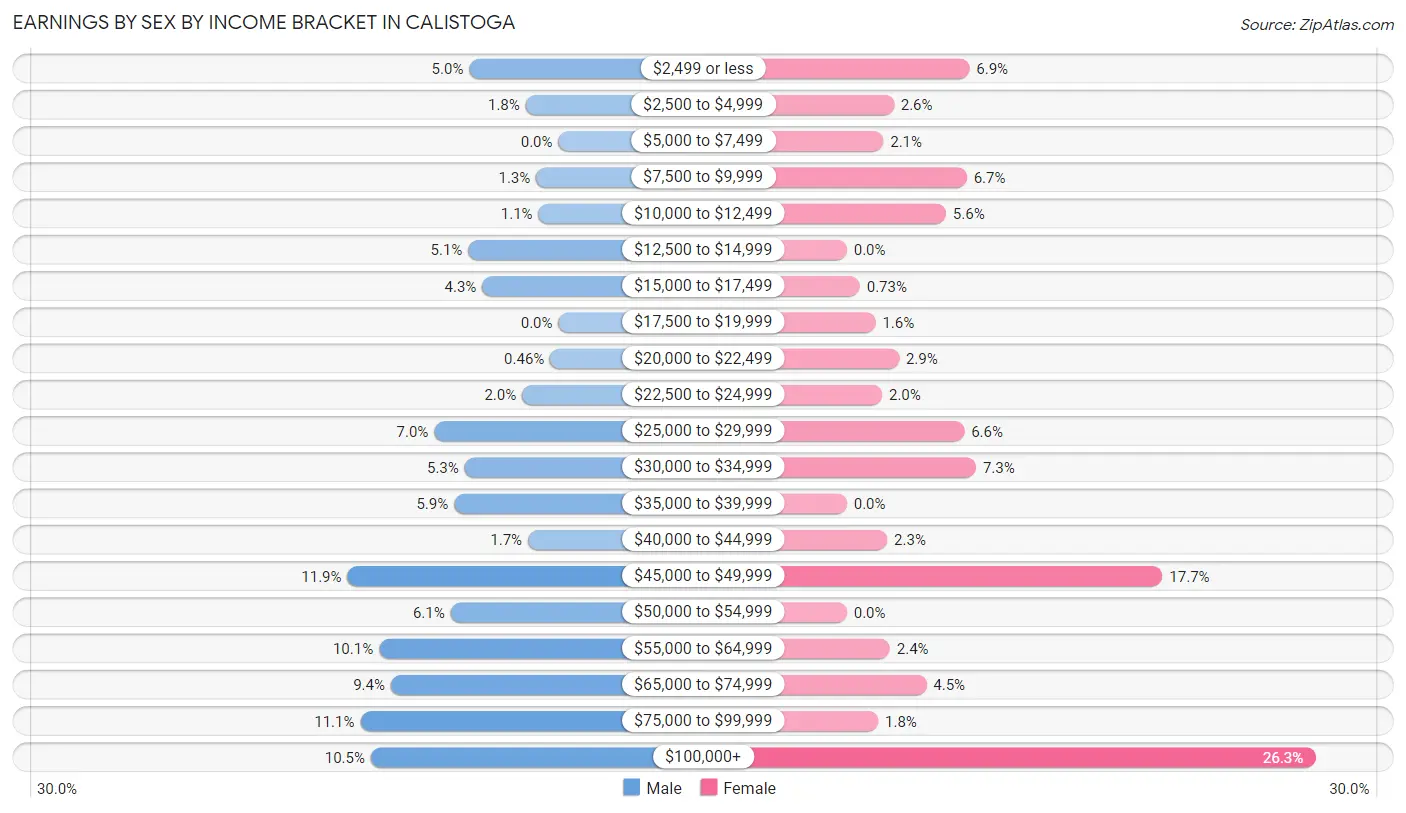
Earnings by Sex by Income Bracket in Calistoga
The most common earnings brackets in Calistoga are $45,000 to $49,999 for men (180 | 11.9%) and $100,000+ for women (359 | 26.3%).
| Income | Male | Female |
| $2,499 or less | 76 (5.0%) | 94 (6.9%) |
| $2,500 to $4,999 | 28 (1.8%) | 36 (2.6%) |
| $5,000 to $7,499 | 0 (0.0%) | 28 (2.1%) |
| $7,500 to $9,999 | 19 (1.3%) | 92 (6.7%) |
| $10,000 to $12,499 | 17 (1.1%) | 76 (5.6%) |
| $12,500 to $14,999 | 77 (5.1%) | 0 (0.0%) |
| $15,000 to $17,499 | 65 (4.3%) | 10 (0.7%) |
| $17,500 to $19,999 | 0 (0.0%) | 22 (1.6%) |
| $20,000 to $22,499 | 7 (0.5%) | 40 (2.9%) |
| $22,500 to $24,999 | 31 (2.0%) | 27 (2.0%) |
| $25,000 to $29,999 | 106 (7.0%) | 90 (6.6%) |
| $30,000 to $34,999 | 80 (5.3%) | 99 (7.3%) |
| $35,000 to $39,999 | 89 (5.9%) | 0 (0.0%) |
| $40,000 to $44,999 | 26 (1.7%) | 31 (2.3%) |
| $45,000 to $49,999 | 180 (11.9%) | 242 (17.7%) |
| $50,000 to $54,999 | 92 (6.1%) | 0 (0.0%) |
| $55,000 to $64,999 | 153 (10.1%) | 33 (2.4%) |
| $65,000 to $74,999 | 143 (9.4%) | 61 (4.5%) |
| $75,000 to $99,999 | 169 (11.1%) | 24 (1.8%) |
| $100,000+ | 160 (10.5%) | 359 (26.3%) |
| Total | 1,518 (100.0%) | 1,364 (100.0%) |
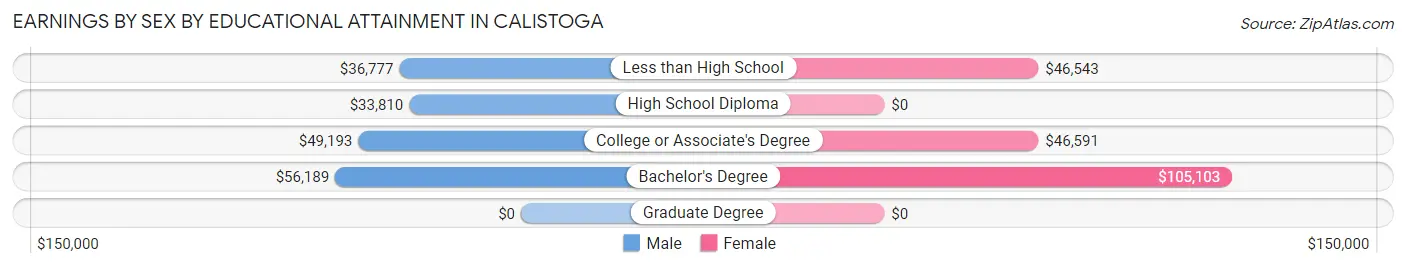
Earnings by Sex by Educational Attainment in Calistoga
Average earnings in Calistoga are $49,321 for men and $46,154 for women, a difference of 6.4%. Men with an educational attainment of bachelor's degree enjoy the highest average annual earnings of $56,189, while those with high school diploma education earn the least with $33,810. Women with an educational attainment of bachelor's degree earn the most with the average annual earnings of $105,103, while those with less than high school education have the smallest earnings of $46,543.
| Educational Attainment | Male Income | Female Income |
| Less than High School | $36,777 | $46,543 |
| High School Diploma | $33,810 | $0 |
| College or Associate's Degree | $49,193 | $46,591 |
| Bachelor's Degree | $56,189 | $105,103 |
| Graduate Degree | - | - |
| Total | $49,321 | $46,154 |
Family Income in Calistoga
Family Income Brackets in Calistoga
According to the Calistoga family income data, there are 399 families falling into the $100,000 to $149,999 income range, which is the most common income bracket and makes up 32.8% of all families. Conversely, the less than $10,000 income bracket is the least frequent group with only 11 families (0.9%) belonging to this category.
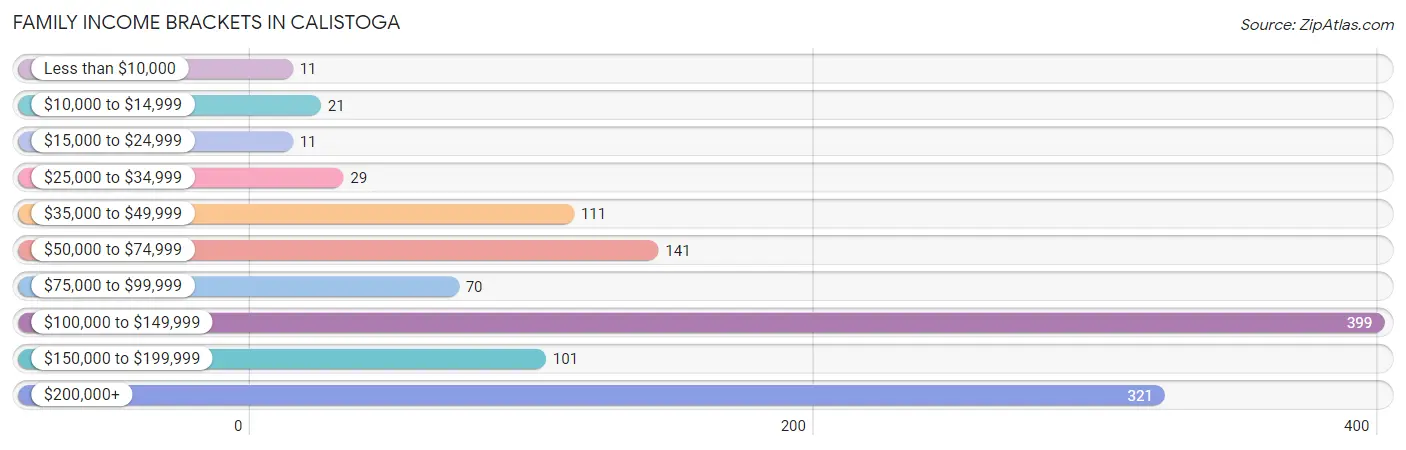
| Income Bracket | # Families | % Families |
| Less than $10,000 | 11 | 0.9% |
| $10,000 to $14,999 | 21 | 1.7% |
| $15,000 to $24,999 | 11 | 0.9% |
| $25,000 to $34,999 | 29 | 2.4% |
| $35,000 to $49,999 | 111 | 9.1% |
| $50,000 to $74,999 | 141 | 11.6% |
| $75,000 to $99,999 | 70 | 5.8% |
| $100,000 to $149,999 | 399 | 32.8% |
| $150,000 to $199,999 | 101 | 8.3% |
| $200,000+ | 321 | 26.4% |
Family Income by Famaliy Size in Calistoga
4-person families (242 | 19.9%) account for the highest median family income in Calistoga with $166,324 per family, while 2-person families (607 | 50.0%) have the highest median income of $57,738 per family member.
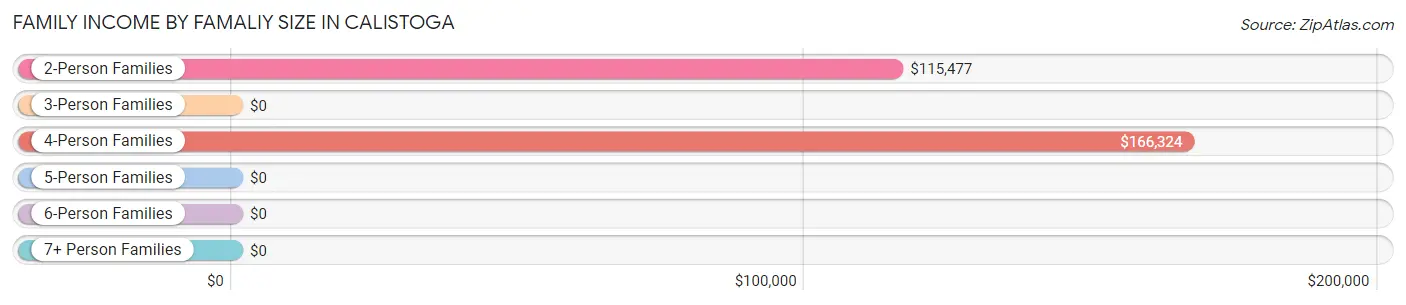
| Income Bracket | # Families | Median Income |
| 2-Person Families | 607 (50.0%) | $115,477 |
| 3-Person Families | 287 (23.6%) | $0 |
| 4-Person Families | 242 (19.9%) | $166,324 |
| 5-Person Families | 10 (0.8%) | $0 |
| 6-Person Families | 0 (0.0%) | $0 |
| 7+ Person Families | 69 (5.7%) | $0 |
| Total | 1,215 (100.0%) | $106,582 |
Family Income by Number of Earners in Calistoga
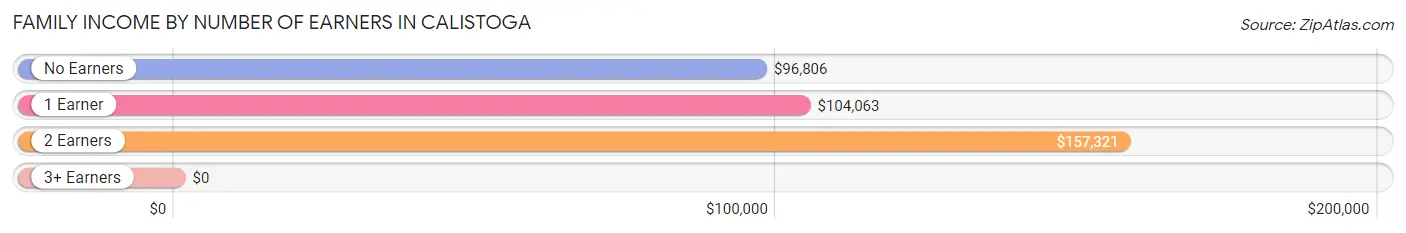
| Number of Earners | # Families | Median Income |
| No Earners | 191 (15.7%) | $96,806 |
| 1 Earner | 417 (34.3%) | $104,063 |
| 2 Earners | 534 (44.0%) | $157,321 |
| 3+ Earners | 73 (6.0%) | $0 |
| Total | 1,215 (100.0%) | $106,582 |
Household Income in Calistoga
Household Income Brackets in Calistoga
With 508 households falling in the category, the $100,000 to $149,999 income range is the most frequent in Calistoga, accounting for 24.0% of all households. In contrast, only 42 households (2.0%) fall into the $15,000 to $24,999 income bracket, making it the least populous group.
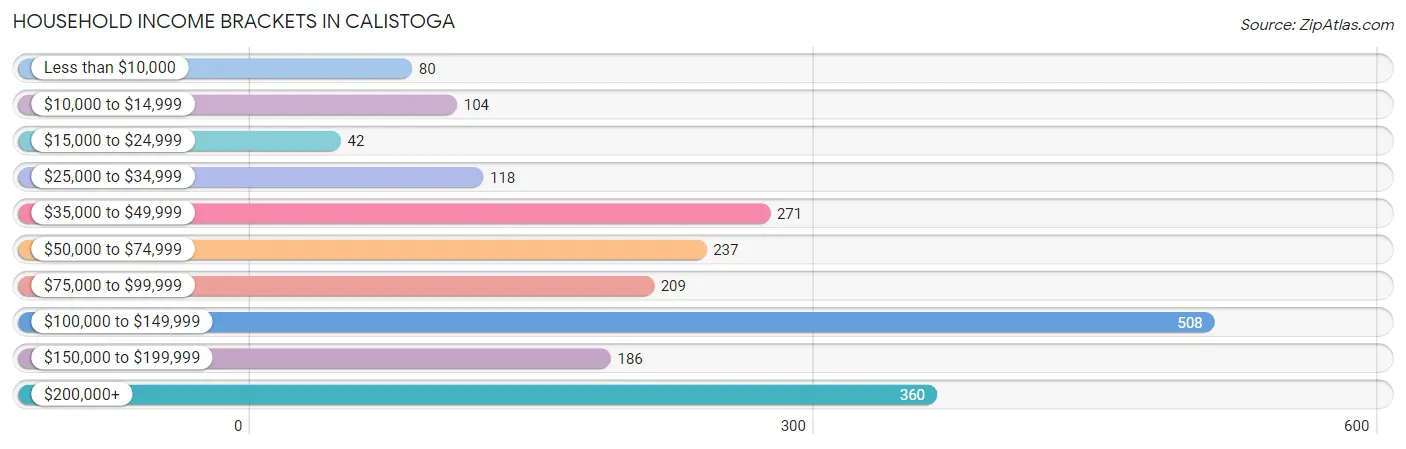
| Income Bracket | # Households | % Households |
| Less than $10,000 | 80 | 3.8% |
| $10,000 to $14,999 | 104 | 4.9% |
| $15,000 to $24,999 | 42 | 2.0% |
| $25,000 to $34,999 | 118 | 5.6% |
| $35,000 to $49,999 | 271 | 12.8% |
| $50,000 to $74,999 | 237 | 11.2% |
| $75,000 to $99,999 | 209 | 9.9% |
| $100,000 to $149,999 | 508 | 24.0% |
| $150,000 to $199,999 | 186 | 8.8% |
| $200,000+ | 360 | 17.0% |
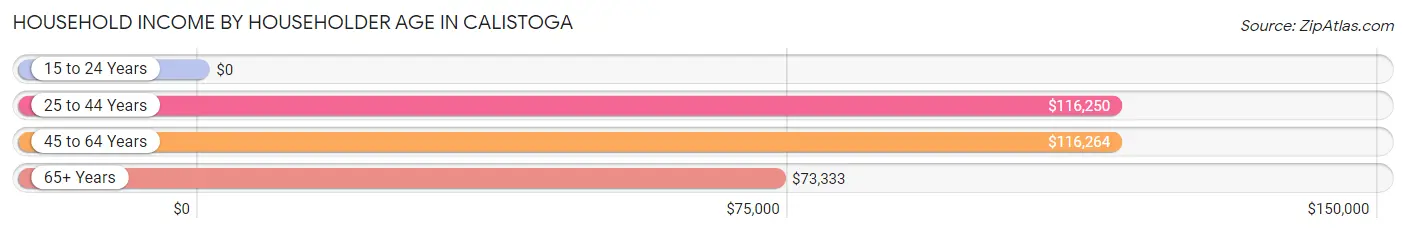
Household Income by Householder Age in Calistoga
The median household income in Calistoga is $96,667, with the highest median household income of $116,264 found in the 45 to 64 years age bracket for the primary householder. A total of 763 households (36.1%) fall into this category. Meanwhile, the 15 to 24 years age bracket for the primary householder has the lowest median household income of $0, with 146 households (6.9%) in this group.
| Income Bracket | # Households | Median Income |
| 15 to 24 Years | 146 (6.9%) | $0 |
| 25 to 44 Years | 361 (17.1%) | $116,250 |
| 45 to 64 Years | 763 (36.1%) | $116,264 |
| 65+ Years | 846 (40.0%) | $73,333 |
| Total | 2,116 (100.0%) | $96,667 |
Poverty in Calistoga
Income Below Poverty by Sex and Age in Calistoga
With 3.8% poverty level for males and 7.3% for females among the residents of Calistoga, 75 year old and over males and 55 to 64 year old females are the most vulnerable to poverty, with 58 males (15.0%) and 76 females (27.7%) in their respective age groups living below the poverty level.
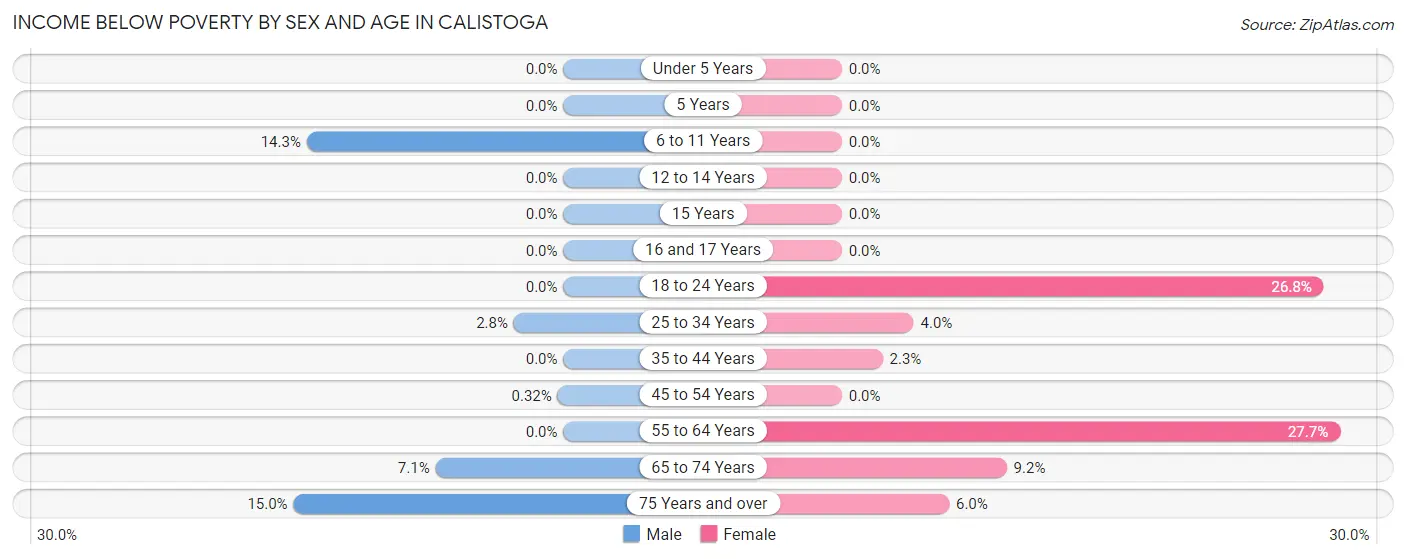
| Age Bracket | Male | Female |
| Under 5 Years | 0 (0.0%) | 0 (0.0%) |
| 5 Years | 0 (0.0%) | 0 (0.0%) |
| 6 to 11 Years | 12 (14.3%) | 0 (0.0%) |
| 12 to 14 Years | 0 (0.0%) | 0 (0.0%) |
| 15 Years | 0 (0.0%) | 0 (0.0%) |
| 16 and 17 Years | 0 (0.0%) | 0 (0.0%) |
| 18 to 24 Years | 0 (0.0%) | 22 (26.8%) |
| 25 to 34 Years | 13 (2.8%) | 9 (4.0%) |
| 35 to 44 Years | 0 (0.0%) | 7 (2.3%) |
| 45 to 54 Years | 2 (0.3%) | 0 (0.0%) |
| 55 to 64 Years | 0 (0.0%) | 76 (27.7%) |
| 65 to 74 Years | 21 (7.1%) | 45 (9.2%) |
| 75 Years and over | 58 (15.0%) | 12 (6.0%) |
| Total | 106 (3.8%) | 171 (7.3%) |
Income Above Poverty by Sex and Age in Calistoga
According to the poverty statistics in Calistoga, males aged under 5 years and females aged under 5 years are the age groups that are most secure financially, with 100.0% of males and 100.0% of females in these age groups living above the poverty line.
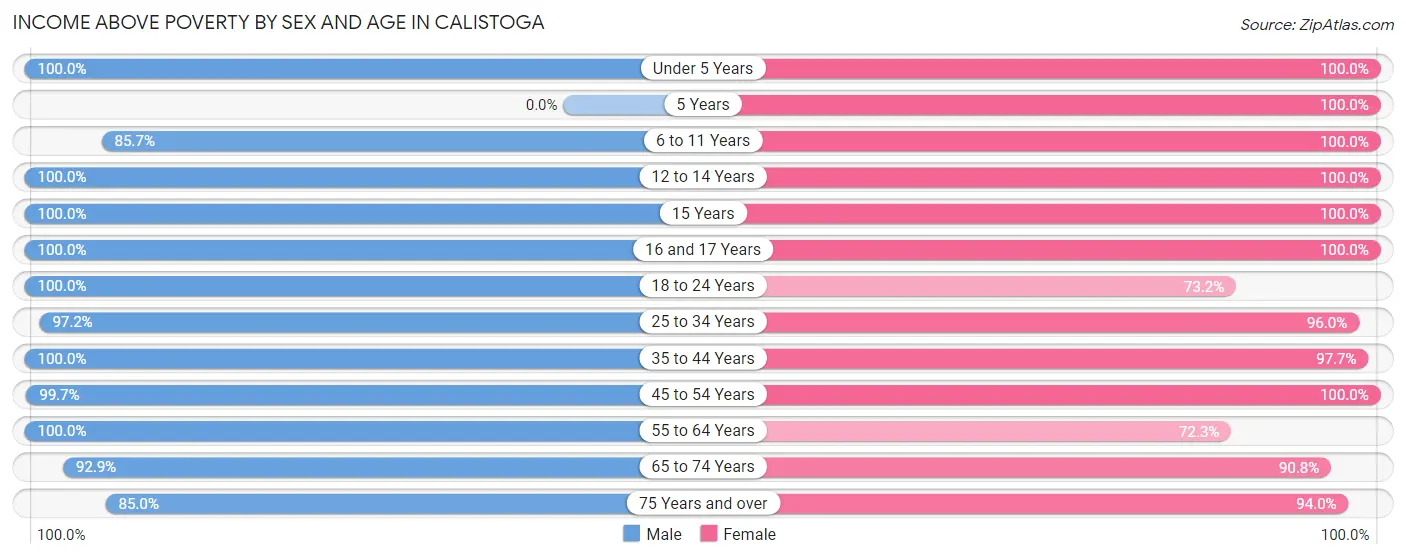
| Age Bracket | Male | Female |
| Under 5 Years | 157 (100.0%) | 125 (100.0%) |
| 5 Years | 0 (0.0%) | 14 (100.0%) |
| 6 to 11 Years | 72 (85.7%) | 87 (100.0%) |
| 12 to 14 Years | 34 (100.0%) | 22 (100.0%) |
| 15 Years | 62 (100.0%) | 12 (100.0%) |
| 16 and 17 Years | 44 (100.0%) | 71 (100.0%) |
| 18 to 24 Years | 210 (100.0%) | 60 (73.2%) |
| 25 to 34 Years | 458 (97.2%) | 216 (96.0%) |
| 35 to 44 Years | 209 (100.0%) | 302 (97.7%) |
| 45 to 54 Years | 628 (99.7%) | 431 (100.0%) |
| 55 to 64 Years | 223 (100.0%) | 198 (72.3%) |
| 65 to 74 Years | 274 (92.9%) | 445 (90.8%) |
| 75 Years and over | 328 (85.0%) | 189 (94.0%) |
| Total | 2,699 (96.2%) | 2,172 (92.7%) |
Income Below Poverty Among Married-Couple Families in Calistoga
The poverty statistics for married-couple families in Calistoga show that 2.1% or 21 of the total 979 families live below the poverty line. Families with no children have the highest poverty rate of 3.3%, comprising of 21 families. On the other hand, families with 1 or 2 children have the lowest poverty rate of 0.0%, which includes 0 families.
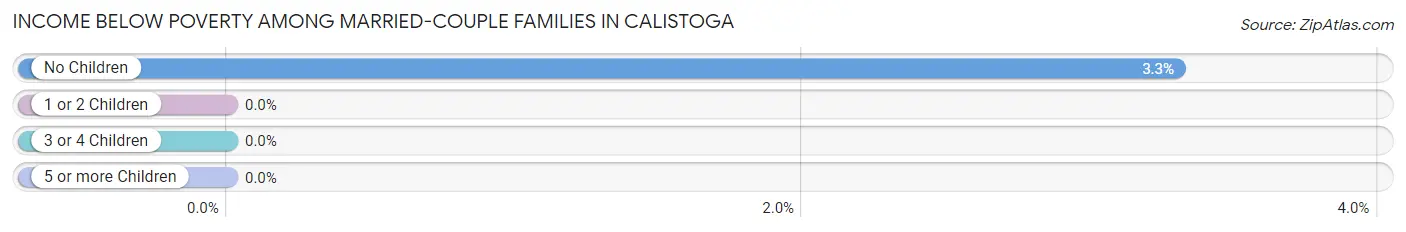
| Children | Above Poverty | Below Poverty |
| No Children | 615 (96.7%) | 21 (3.3%) |
| 1 or 2 Children | 339 (100.0%) | 0 (0.0%) |
| 3 or 4 Children | 4 (100.0%) | 0 (0.0%) |
| 5 or more Children | 0 (0.0%) | 0 (0.0%) |
| Total | 958 (97.9%) | 21 (2.1%) |
Income Below Poverty Among Single-Parent Households in Calistoga
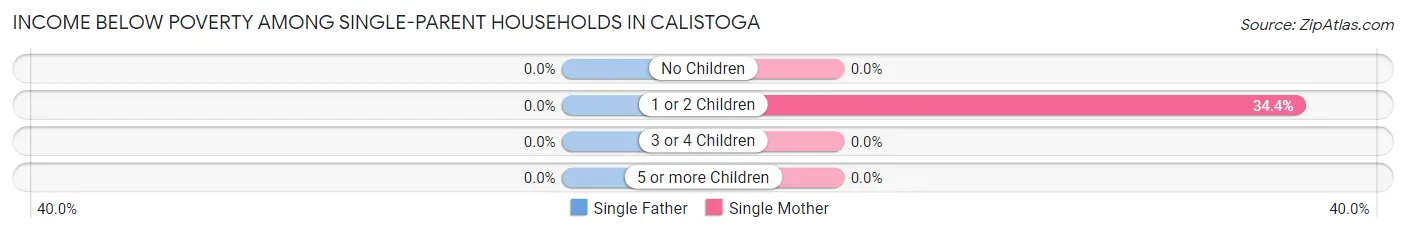
| Children | Single Father | Single Mother |
| No Children | 0 (0.0%) | 0 (0.0%) |
| 1 or 2 Children | 0 (0.0%) | 11 (34.4%) |
| 3 or 4 Children | 0 (0.0%) | 0 (0.0%) |
| 5 or more Children | 0 (0.0%) | 0 (0.0%) |
| Total | 0 (0.0%) | 11 (9.5%) |
Income Below Poverty Among Married-Couple vs Single-Parent Households in Calistoga
The poverty data for Calistoga shows that 21 of the married-couple family households (2.1%) and 11 of the single-parent households (4.7%) are living below the poverty level. Within the married-couple family households, those with no children have the highest poverty rate, with 21 households (3.3%) falling below the poverty line. Among the single-parent households, those with 1 or 2 children have the highest poverty rate, with 11 household (10.3%) living below poverty.
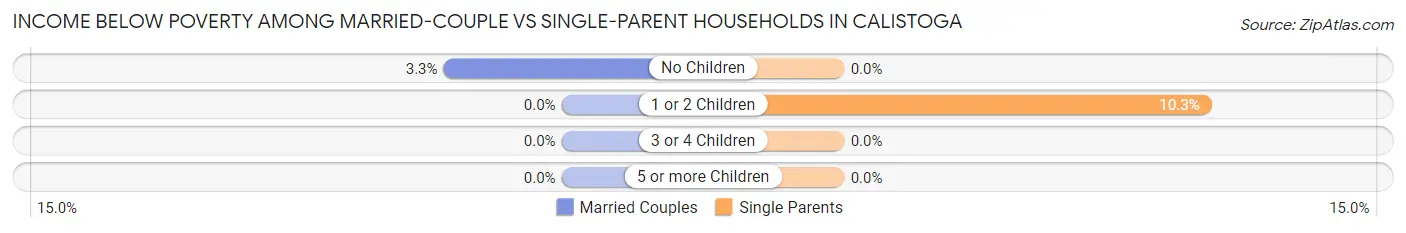
| Children | Married-Couple Families | Single-Parent Households |
| No Children | 21 (3.3%) | 0 (0.0%) |
| 1 or 2 Children | 0 (0.0%) | 11 (10.3%) |
| 3 or 4 Children | 0 (0.0%) | 0 (0.0%) |
| 5 or more Children | 0 (0.0%) | 0 (0.0%) |
| Total | 21 (2.1%) | 11 (4.7%) |
Race in Calistoga
The most populous races in Calistoga are White / Caucasian (3,418 | 65.8%), Hispanic or Latino (2,036 | 39.2%), and Two or more Races (816 | 15.7%).
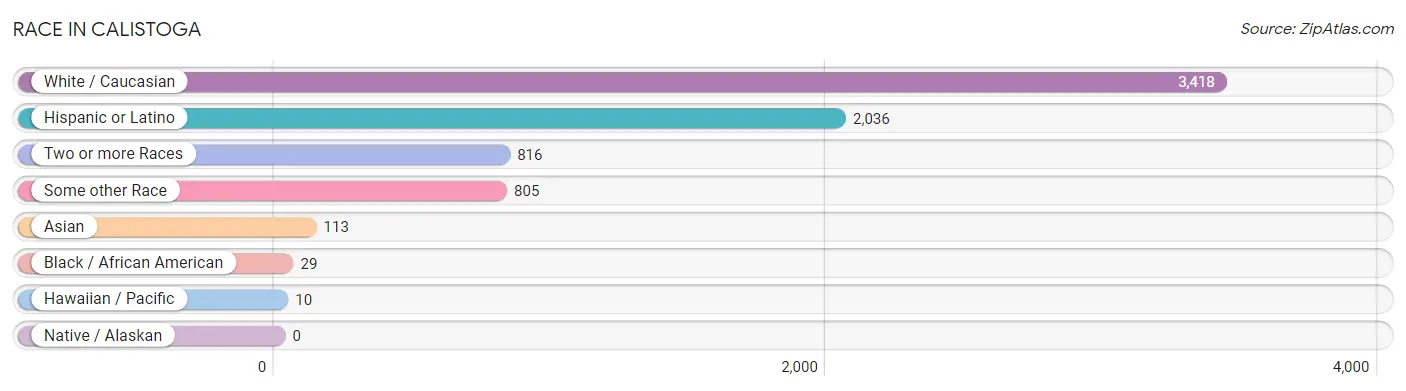
| Race | # Population | % Population |
| Asian | 113 | 2.2% |
| Black / African American | 29 | 0.6% |
| Hawaiian / Pacific | 10 | 0.2% |
| Hispanic or Latino | 2,036 | 39.2% |
| Native / Alaskan | 0 | 0.0% |
| White / Caucasian | 3,418 | 65.8% |
| Two or more Races | 816 | 15.7% |
| Some other Race | 805 | 15.5% |
| Total | 5,191 | 100.0% |
Ancestry in Calistoga
The most populous ancestries reported in Calistoga are Mexican (1,852 | 35.7%), English (1,052 | 20.3%), German (619 | 11.9%), Irish (383 | 7.4%), and French (258 | 5.0%), together accounting for 80.2% of all Calistoga residents.
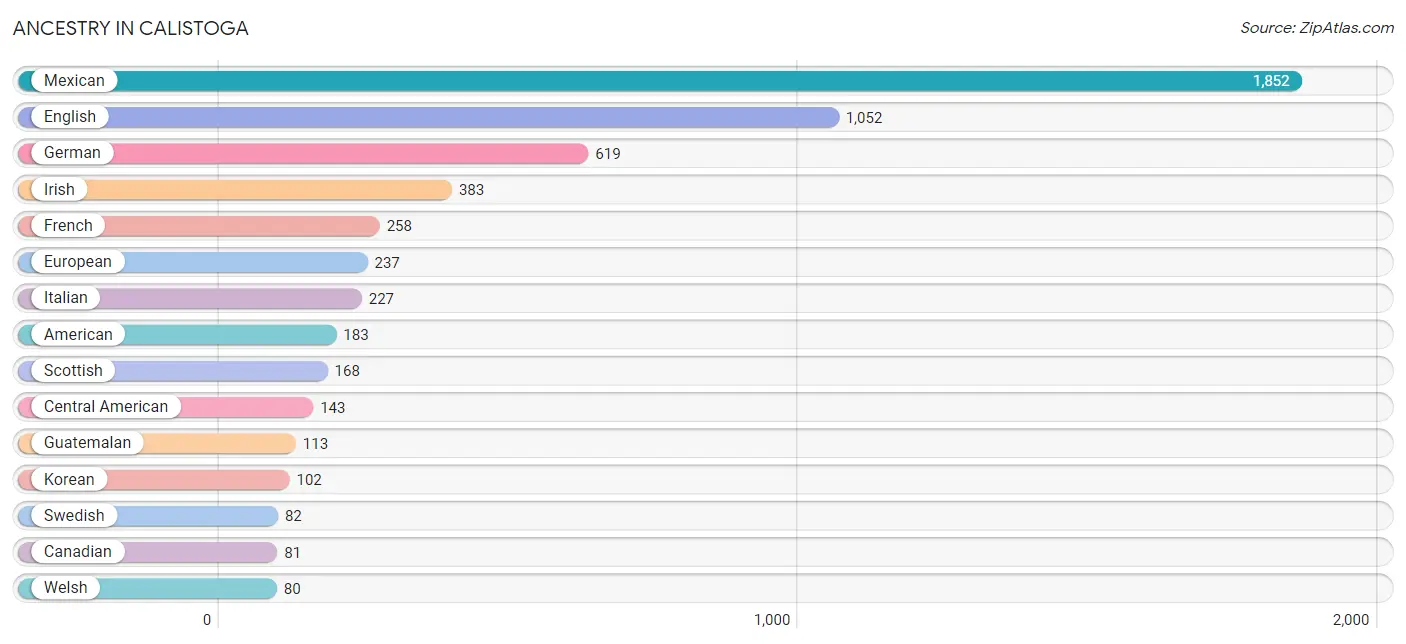
| Ancestry | # Population | % Population |
| American | 183 | 3.5% |
| Argentinean | 22 | 0.4% |
| Armenian | 18 | 0.4% |
| Basque | 9 | 0.2% |
| Belgian | 26 | 0.5% |
| Bhutanese | 11 | 0.2% |
| British | 40 | 0.8% |
| Canadian | 81 | 1.6% |
| Central American | 143 | 2.8% |
| Colombian | 17 | 0.3% |
| Czech | 60 | 1.2% |
| Danish | 19 | 0.4% |
| Dutch | 45 | 0.9% |
| English | 1,052 | 20.3% |
| European | 237 | 4.6% |
| Finnish | 12 | 0.2% |
| French | 258 | 5.0% |
| French Canadian | 11 | 0.2% |
| German | 619 | 11.9% |
| Greek | 16 | 0.3% |
| Guatemalan | 113 | 2.2% |
| Irish | 383 | 7.4% |
| Italian | 227 | 4.4% |
| Korean | 102 | 2.0% |
| Mexican | 1,852 | 35.7% |
| Norwegian | 61 | 1.2% |
| Polish | 52 | 1.0% |
| Portuguese | 46 | 0.9% |
| Romanian | 10 | 0.2% |
| Russian | 45 | 0.9% |
| Salvadoran | 30 | 0.6% |
| Scandinavian | 9 | 0.2% |
| Scottish | 168 | 3.2% |
| South American | 39 | 0.7% |
| Swedish | 82 | 1.6% |
| Ukrainian | 29 | 0.6% |
| Welsh | 80 | 1.5% |
| Yugoslavian | 7 | 0.1% | View All 38 Rows |
Immigrants in Calistoga
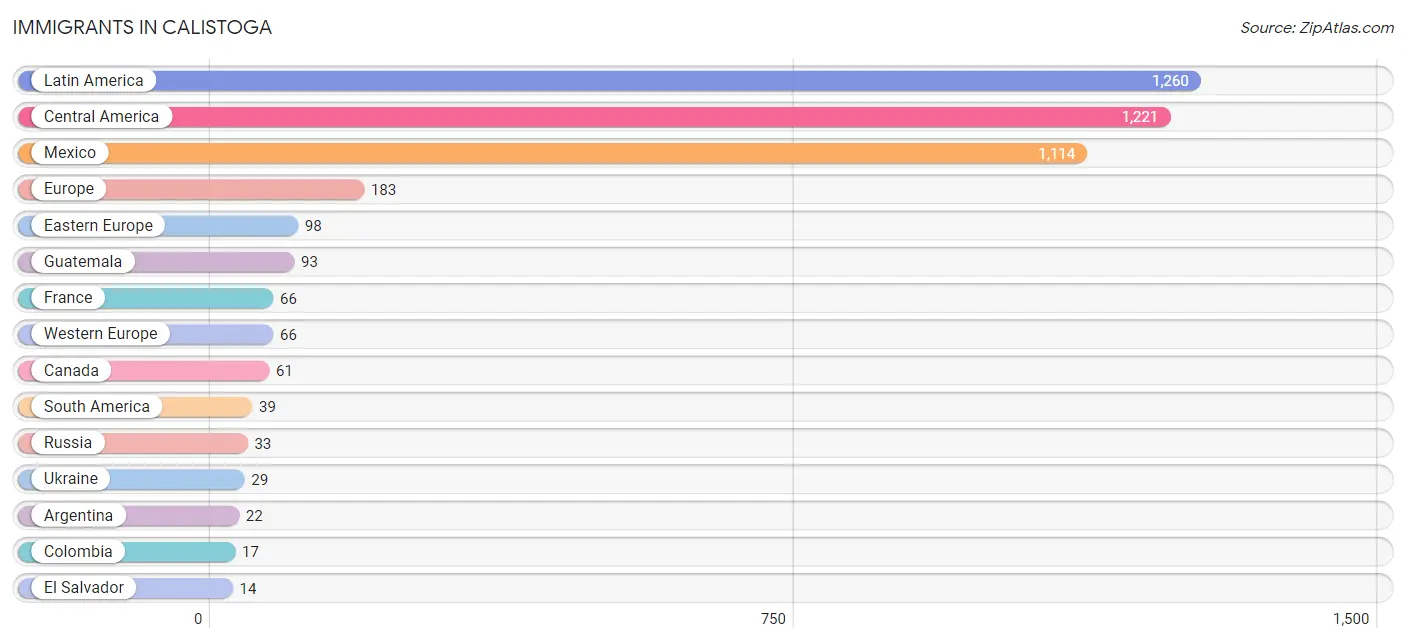
The most numerous immigrant groups reported in Calistoga came from Latin America (1,260 | 24.3%), Central America (1,221 | 23.5%), Mexico (1,114 | 21.5%), Europe (183 | 3.5%), and Eastern Europe (98 | 1.9%), together accounting for 74.7% of all Calistoga residents.
| Immigration Origin | # Population | % Population |
| Argentina | 22 | 0.4% |
| Asia | 12 | 0.2% |
| Canada | 61 | 1.2% |
| Central America | 1,221 | 23.5% |
| Colombia | 17 | 0.3% |
| Eastern Europe | 98 | 1.9% |
| El Salvador | 14 | 0.3% |
| Europe | 183 | 3.5% |
| Fiji | 10 | 0.2% |
| France | 66 | 1.3% |
| Guatemala | 93 | 1.8% |
| Italy | 7 | 0.1% |
| Latin America | 1,260 | 24.3% |
| Mexico | 1,114 | 21.5% |
| Moldova | 10 | 0.2% |
| Northern Europe | 12 | 0.2% |
| Oceania | 10 | 0.2% |
| Philippines | 12 | 0.2% |
| Russia | 33 | 0.6% |
| South America | 39 | 0.7% |
| South Eastern Asia | 12 | 0.2% |
| Southern Europe | 7 | 0.1% |
| Ukraine | 29 | 0.6% |
| Western Europe | 66 | 1.3% | View All 24 Rows |
Sex and Age in Calistoga
Sex and Age in Calistoga
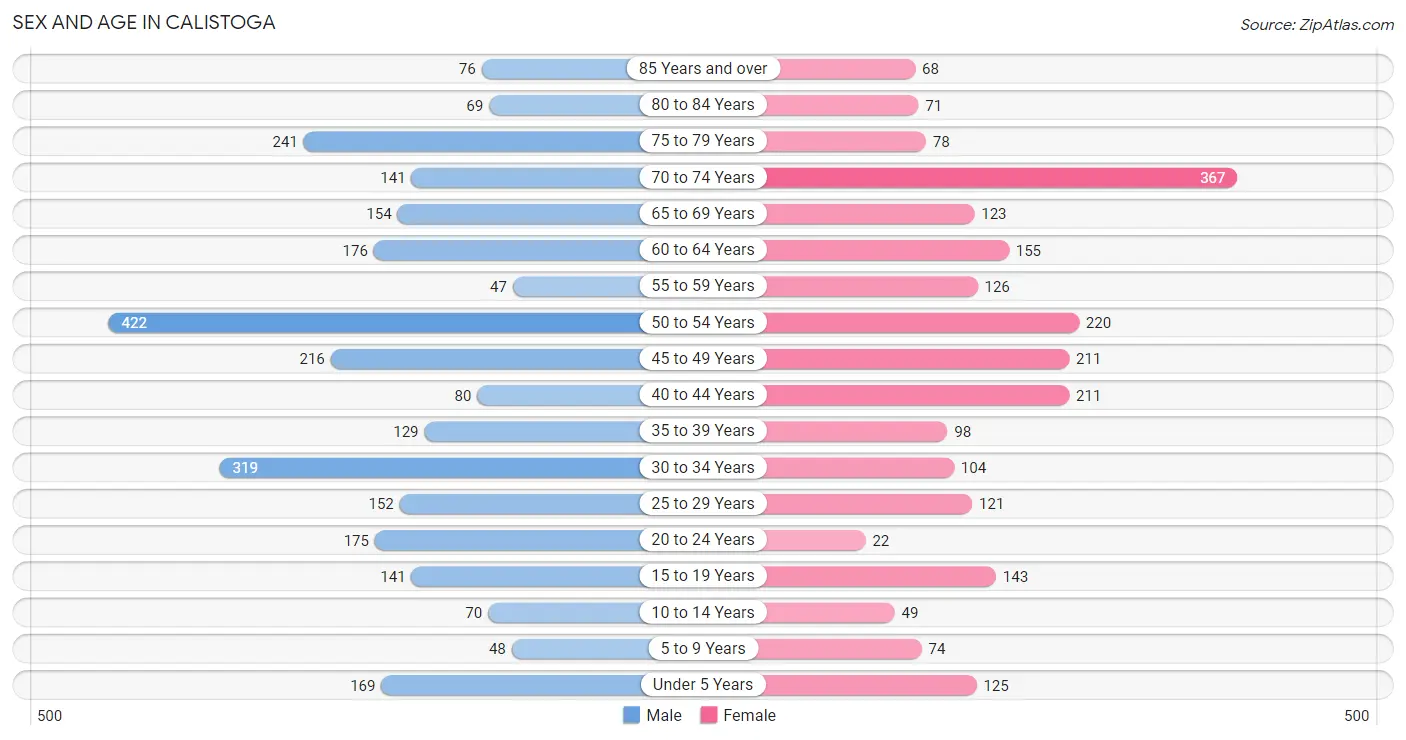
The most populous age groups in Calistoga are 50 to 54 Years (422 | 14.9%) for men and 70 to 74 Years (367 | 15.5%) for women.
| Age Bracket | Male | Female |
| Under 5 Years | 169 (6.0%) | 125 (5.3%) |
| 5 to 9 Years | 48 (1.7%) | 74 (3.1%) |
| 10 to 14 Years | 70 (2.5%) | 49 (2.1%) |
| 15 to 19 Years | 141 (5.0%) | 143 (6.0%) |
| 20 to 24 Years | 175 (6.2%) | 22 (0.9%) |
| 25 to 29 Years | 152 (5.4%) | 121 (5.1%) |
| 30 to 34 Years | 319 (11.3%) | 104 (4.4%) |
| 35 to 39 Years | 129 (4.6%) | 98 (4.1%) |
| 40 to 44 Years | 80 (2.8%) | 211 (8.9%) |
| 45 to 49 Years | 216 (7.6%) | 211 (8.9%) |
| 50 to 54 Years | 422 (14.9%) | 220 (9.3%) |
| 55 to 59 Years | 47 (1.7%) | 126 (5.3%) |
| 60 to 64 Years | 176 (6.2%) | 155 (6.6%) |
| 65 to 69 Years | 154 (5.4%) | 123 (5.2%) |
| 70 to 74 Years | 141 (5.0%) | 367 (15.5%) |
| 75 to 79 Years | 241 (8.5%) | 78 (3.3%) |
| 80 to 84 Years | 69 (2.4%) | 71 (3.0%) |
| 85 Years and over | 76 (2.7%) | 68 (2.9%) |
| Total | 2,825 (100.0%) | 2,366 (100.0%) |
Families and Households in Calistoga
Median Family Size in Calistoga
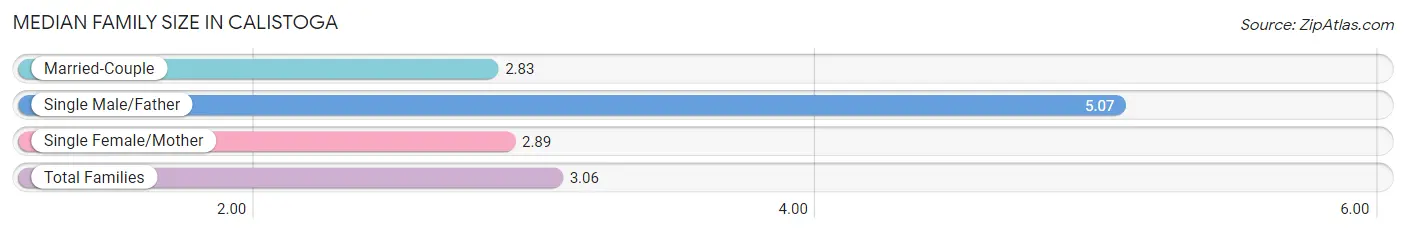
The median family size in Calistoga is 3.06 persons per family, with single male/father families (120 | 9.9%) accounting for the largest median family size of 5.07 persons per family. On the other hand, married-couple families (979 | 80.6%) represent the smallest median family size with 2.83 persons per family.
| Family Type | # Families | Family Size |
| Married-Couple | 979 (80.6%) | 2.83 |
| Single Male/Father | 120 (9.9%) | 5.07 |
| Single Female/Mother | 116 (9.6%) | 2.89 |
| Total Families | 1,215 (100.0%) | 3.06 |
Median Household Size in Calistoga
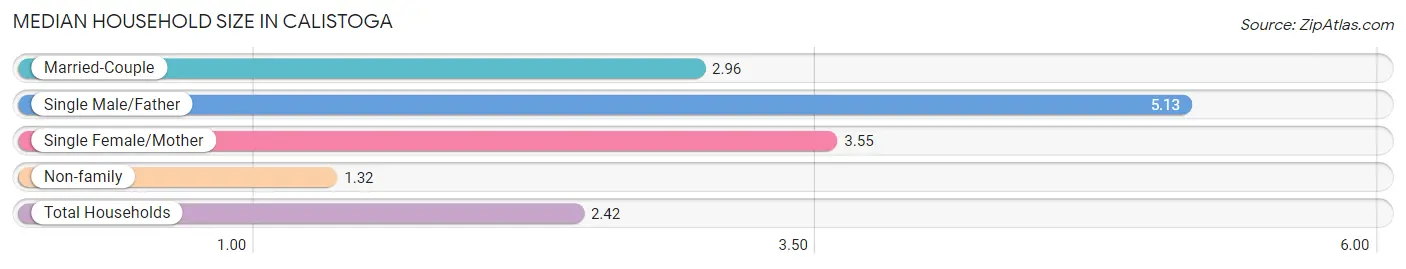
The median household size in Calistoga is 2.42 persons per household, with single male/father households (120 | 5.7%) accounting for the largest median household size of 5.13 persons per household. non-family households (901 | 42.6%) represent the smallest median household size with 1.32 persons per household.
| Household Type | # Households | Household Size |
| Married-Couple | 979 (46.3%) | 2.96 |
| Single Male/Father | 120 (5.7%) | 5.13 |
| Single Female/Mother | 116 (5.5%) | 3.55 |
| Non-family | 901 (42.6%) | 1.32 |
| Total Households | 2,116 (100.0%) | 2.42 |
Household Size by Marriage Status in Calistoga
Out of a total of 2,116 households in Calistoga, 1,215 (57.4%) are family households, while 901 (42.6%) are nonfamily households. The most numerous type of family households are 2-person households, comprising 526, and the most common type of nonfamily households are 1-person households, comprising 759.
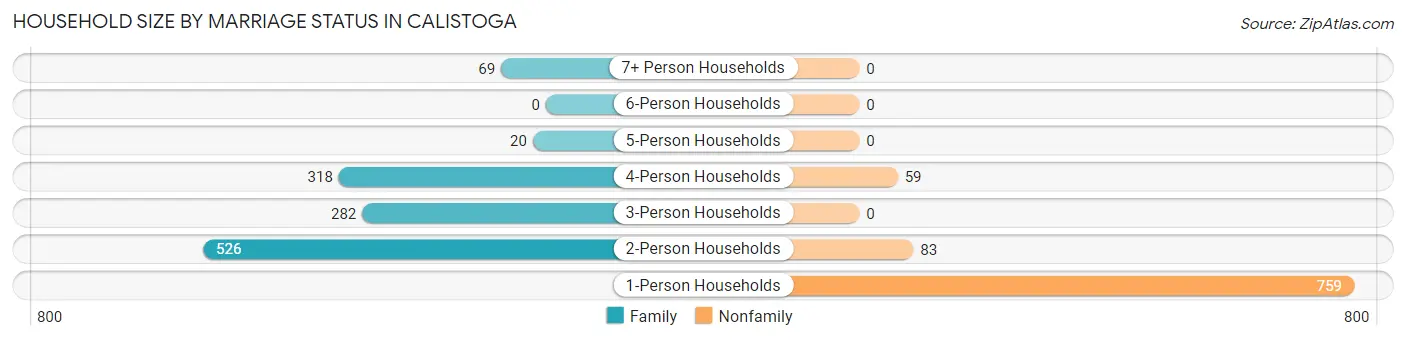
| Household Size | Family Households | Nonfamily Households |
| 1-Person Households | - | 759 (35.9%) |
| 2-Person Households | 526 (24.9%) | 83 (3.9%) |
| 3-Person Households | 282 (13.3%) | 0 (0.0%) |
| 4-Person Households | 318 (15.0%) | 59 (2.8%) |
| 5-Person Households | 20 (0.9%) | 0 (0.0%) |
| 6-Person Households | 0 (0.0%) | 0 (0.0%) |
| 7+ Person Households | 69 (3.3%) | 0 (0.0%) |
| Total | 1,215 (57.4%) | 901 (42.6%) |
Female Fertility in Calistoga
Fertility by Age in Calistoga
Average fertility rate in Calistoga is 34.0 births per 1,000 women. Women in the age bracket of 20 to 34 years have the highest fertility rate with 126.0 births per 1,000 women. Women in the age bracket of 20 to 34 years acount for 100.0% of all women with births.
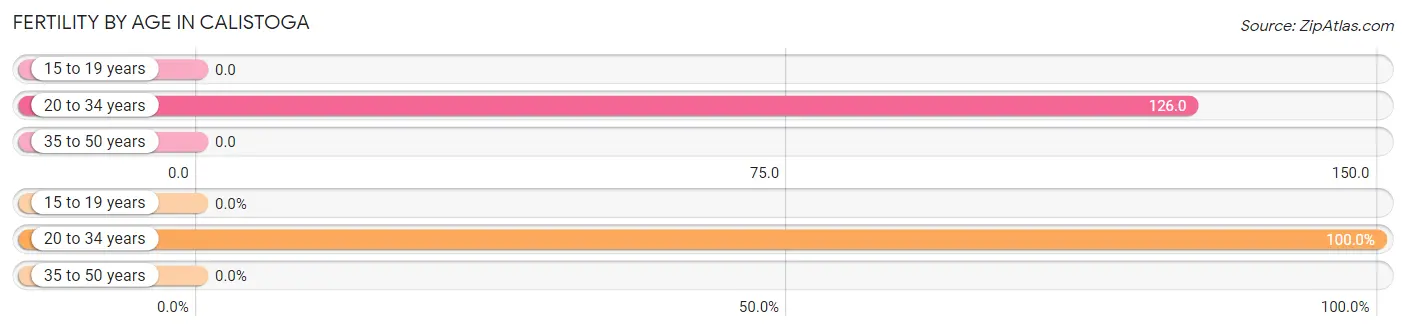
| Age Bracket | Women with Births | Births / 1,000 Women |
| 15 to 19 years | 0 (0.0%) | 0.0 |
| 20 to 34 years | 31 (100.0%) | 126.0 |
| 35 to 50 years | 0 (0.0%) | 0.0 |
| Total | 31 (100.0%) | 34.0 |
Fertility by Age by Marriage Status in Calistoga
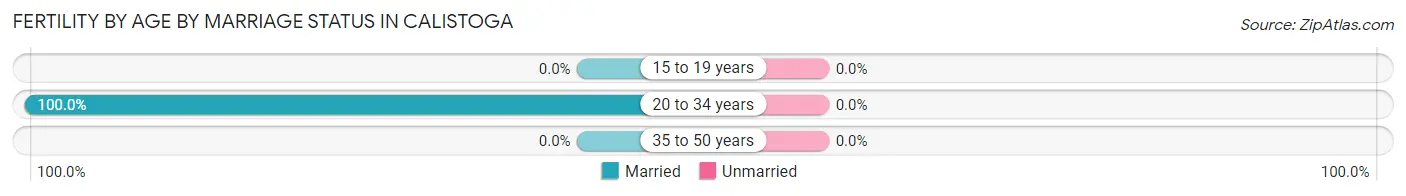
| Age Bracket | Married | Unmarried |
| 15 to 19 years | 0 (0.0%) | 0 (0.0%) |
| 20 to 34 years | 31 (100.0%) | 0 (0.0%) |
| 35 to 50 years | 0 (0.0%) | 0 (0.0%) |
| Total | 31 (100.0%) | 0 (0.0%) |
Fertility by Education in Calistoga
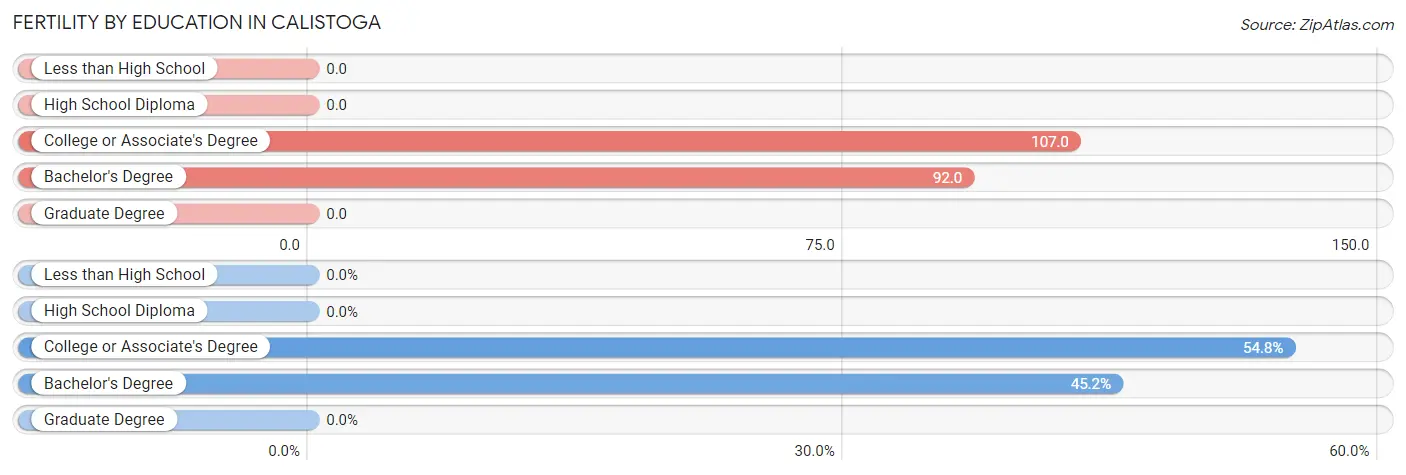
| Educational Attainment | Women with Births | Births / 1,000 Women |
| Less than High School | 0 (0.0%) | 0.0 |
| High School Diploma | 0 (0.0%) | 0.0 |
| College or Associate's Degree | 17 (54.8%) | 107.0 |
| Bachelor's Degree | 14 (45.2%) | 92.0 |
| Graduate Degree | 0 (0.0%) | 0.0 |
| Total | 31 (100.0%) | 34.0 |
Fertility by Education by Marriage Status in Calistoga
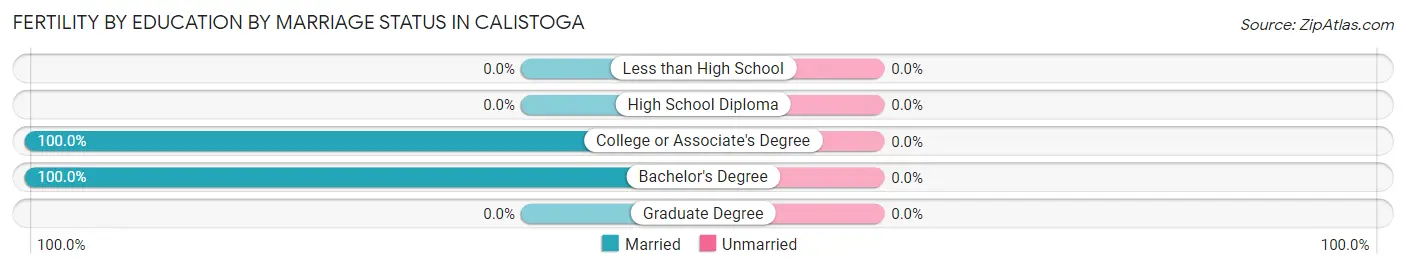
| Educational Attainment | Married | Unmarried |
| Less than High School | 0 (0.0%) | 0 (0.0%) |
| High School Diploma | 0 (0.0%) | 0 (0.0%) |
| College or Associate's Degree | 17 (100.0%) | 0 (0.0%) |
| Bachelor's Degree | 14 (100.0%) | 0 (0.0%) |
| Graduate Degree | 0 (0.0%) | 0 (0.0%) |
| Total | 31 (100.0%) | 0 (0.0%) |
Employment Characteristics in Calistoga
Employment by Class of Employer in Calistoga
Among the 2,656 employed individuals in Calistoga, private company employees (1,768 | 66.6%), self-employed (not incorporated) (247 | 9.3%), and local government employees (237 | 8.9%) make up the most common classes of employment.
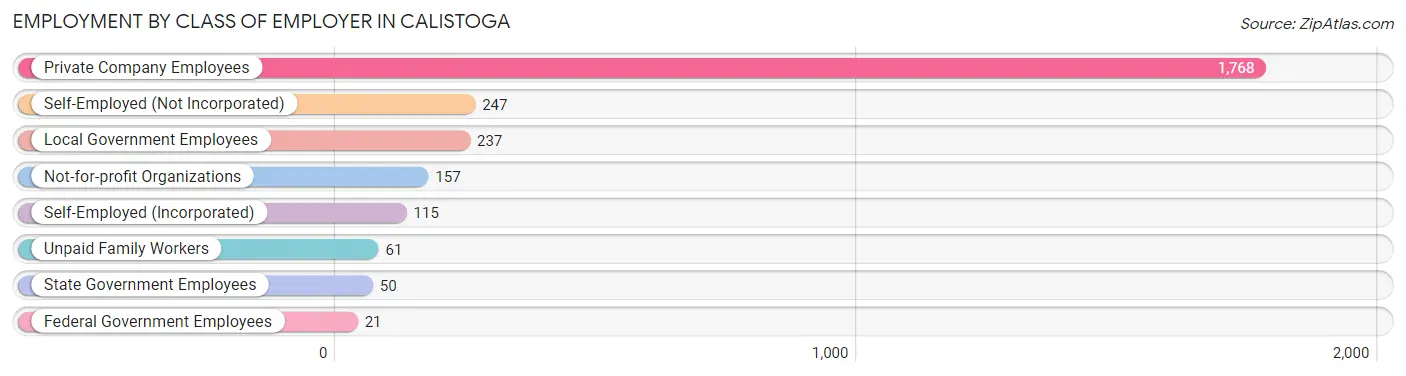
| Employer Class | # Employees | % Employees |
| Private Company Employees | 1,768 | 66.6% |
| Self-Employed (Incorporated) | 115 | 4.3% |
| Self-Employed (Not Incorporated) | 247 | 9.3% |
| Not-for-profit Organizations | 157 | 5.9% |
| Local Government Employees | 237 | 8.9% |
| State Government Employees | 50 | 1.9% |
| Federal Government Employees | 21 | 0.8% |
| Unpaid Family Workers | 61 | 2.3% |
| Total | 2,656 | 100.0% |
Employment Status by Age in Calistoga
According to the labor force statistics for Calistoga, out of the total population over 16 years of age (4,582), 59.6% or 2,731 individuals are in the labor force, with 0.6% or 16 of them unemployed. The age group with the highest labor force participation rate is 30 to 34 years, with 97.9% or 414 individuals in the labor force. Within the labor force, the 30 to 34 years age range has the highest percentage of unemployed individuals, with 3.9% or 16 of them being unemployed.
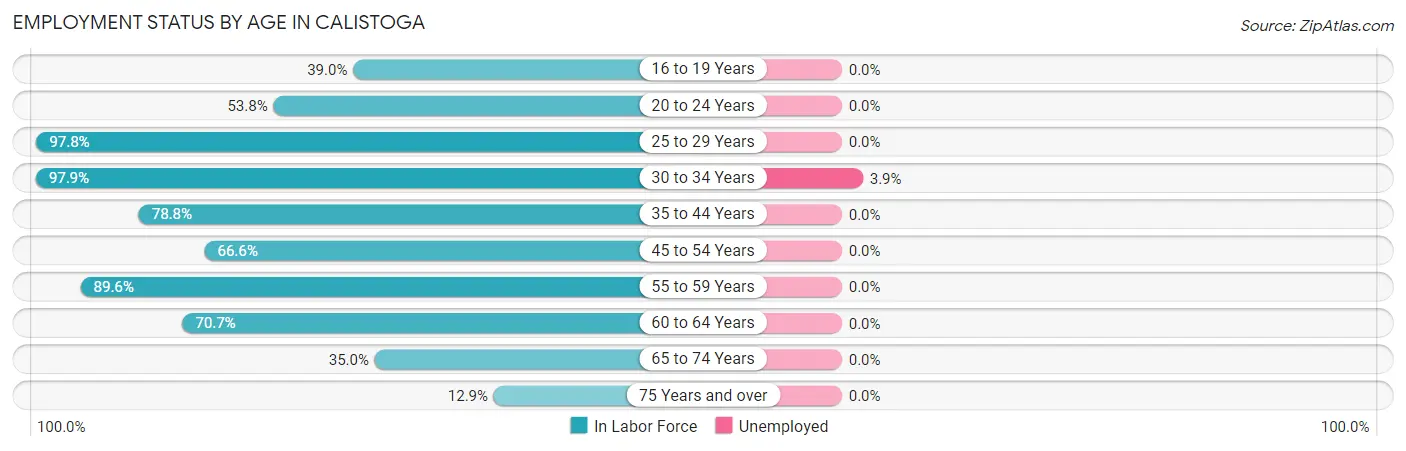
| Age Bracket | In Labor Force | Unemployed |
| 16 to 19 Years | 82 (39.0%) | 0 (0.0%) |
| 20 to 24 Years | 106 (53.8%) | 0 (0.0%) |
| 25 to 29 Years | 267 (97.8%) | 0 (0.0%) |
| 30 to 34 Years | 414 (97.9%) | 16 (3.9%) |
| 35 to 44 Years | 408 (78.8%) | 0 (0.0%) |
| 45 to 54 Years | 712 (66.6%) | 0 (0.0%) |
| 55 to 59 Years | 155 (89.6%) | 0 (0.0%) |
| 60 to 64 Years | 234 (70.7%) | 0 (0.0%) |
| 65 to 74 Years | 275 (35.0%) | 0 (0.0%) |
| 75 Years and over | 78 (12.9%) | 0 (0.0%) |
| Total | 2,731 (59.6%) | 16 (0.6%) |
Employment Status by Educational Attainment in Calistoga
According to labor force statistics for Calistoga, 78.6% of individuals (2,191) out of the total population between 25 and 64 years of age (2,787) are in the labor force, with 0.7% or 15 of them being unemployed. The group with the highest labor force participation rate are those with the educational attainment of college / associate degree, with 95.9% or 730 individuals in the labor force. Within the labor force, individuals with bachelor's degree or higher education have the highest percentage of unemployment, with 2.3% or 16 of them being unemployed.
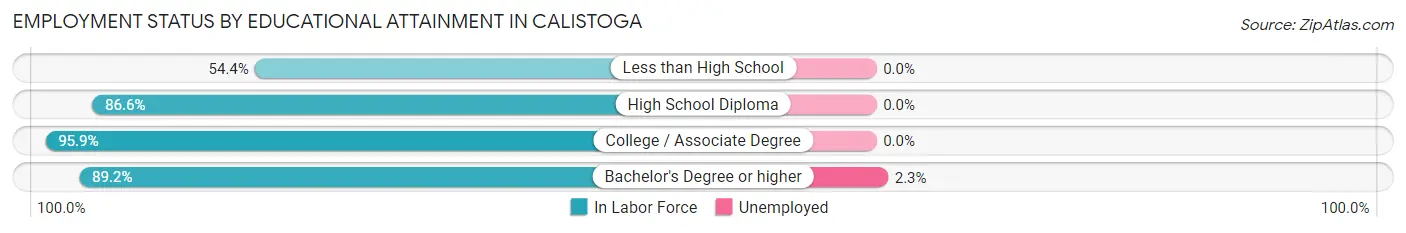
| Educational Attainment | In Labor Force | Unemployed |
| Less than High School | 530 (54.4%) | 0 (0.0%) |
| High School Diploma | 245 (86.6%) | 0 (0.0%) |
| College / Associate Degree | 730 (95.9%) | 0 (0.0%) |
| Bachelor's Degree or higher | 685 (89.2%) | 18 (2.3%) |
| Total | 2,191 (78.6%) | 20 (0.7%) |
Employment Occupations by Sex in Calistoga
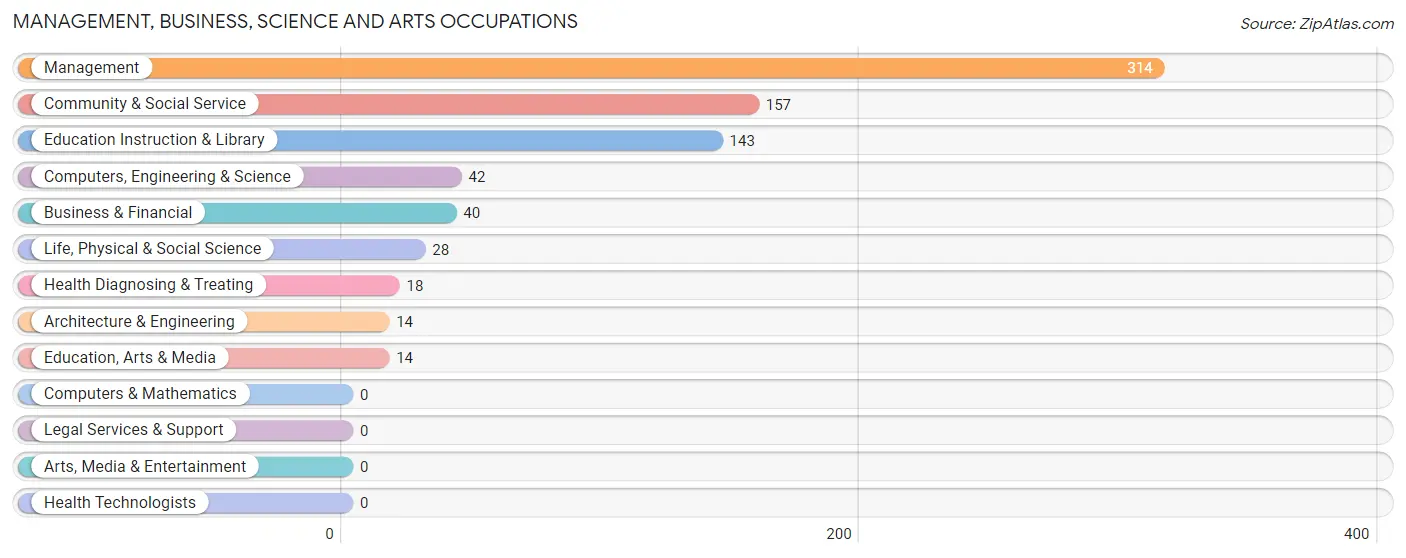
Management, Business, Science and Arts Occupations
The most common Management, Business, Science and Arts occupations in Calistoga are Management (314 | 11.6%), Community & Social Service (157 | 5.8%), Education Instruction & Library (143 | 5.3%), Computers, Engineering & Science (42 | 1.5%), and Business & Financial (40 | 1.5%).
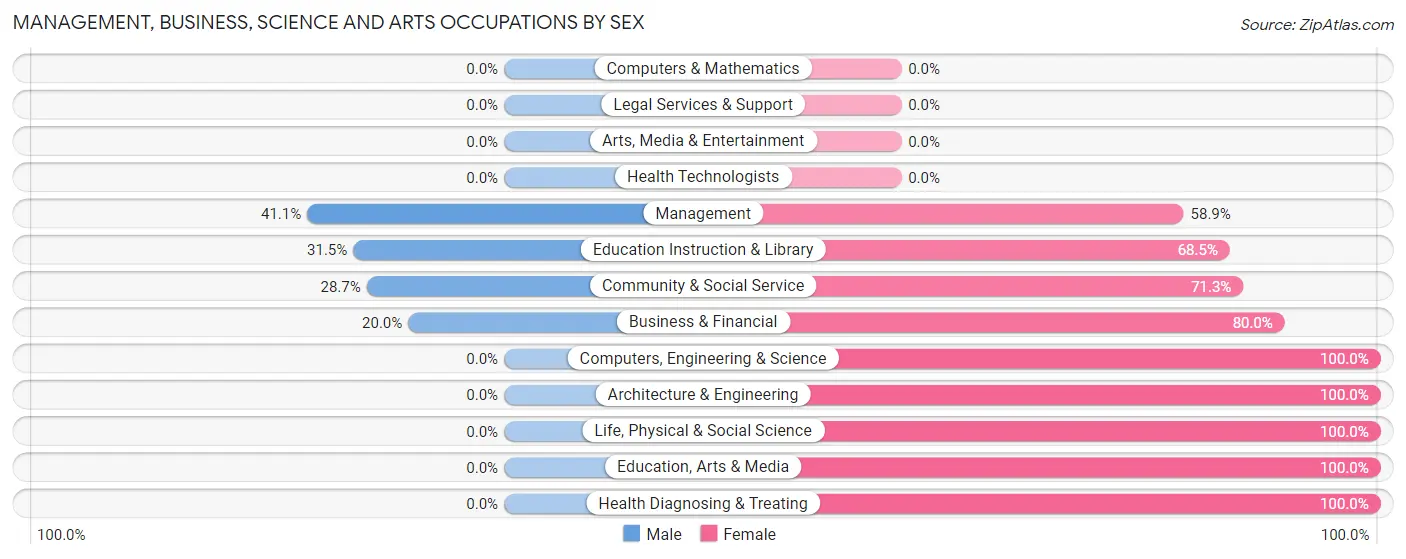
Management, Business, Science and Arts Occupations by Sex
Within the Management, Business, Science and Arts occupations in Calistoga, the most male-oriented occupations are Management (41.1%), Education Instruction & Library (31.5%), and Community & Social Service (28.7%), while the most female-oriented occupations are Computers, Engineering & Science (100.0%), Architecture & Engineering (100.0%), and Life, Physical & Social Science (100.0%).
| Occupation | Male | Female |
| Management | 129 (41.1%) | 185 (58.9%) |
| Business & Financial | 8 (20.0%) | 32 (80.0%) |
| Computers, Engineering & Science | 0 (0.0%) | 42 (100.0%) |
| Computers & Mathematics | 0 (0.0%) | 0 (0.0%) |
| Architecture & Engineering | 0 (0.0%) | 14 (100.0%) |
| Life, Physical & Social Science | 0 (0.0%) | 28 (100.0%) |
| Community & Social Service | 45 (28.7%) | 112 (71.3%) |
| Education, Arts & Media | 0 (0.0%) | 14 (100.0%) |
| Legal Services & Support | 0 (0.0%) | 0 (0.0%) |
| Education Instruction & Library | 45 (31.5%) | 98 (68.5%) |
| Arts, Media & Entertainment | 0 (0.0%) | 0 (0.0%) |
| Health Diagnosing & Treating | 0 (0.0%) | 18 (100.0%) |
| Health Technologists | 0 (0.0%) | 0 (0.0%) |
| Total (Category) | 182 (31.9%) | 389 (68.1%) |
| Total (Overall) | 1,364 (50.2%) | 1,351 (49.8%) |
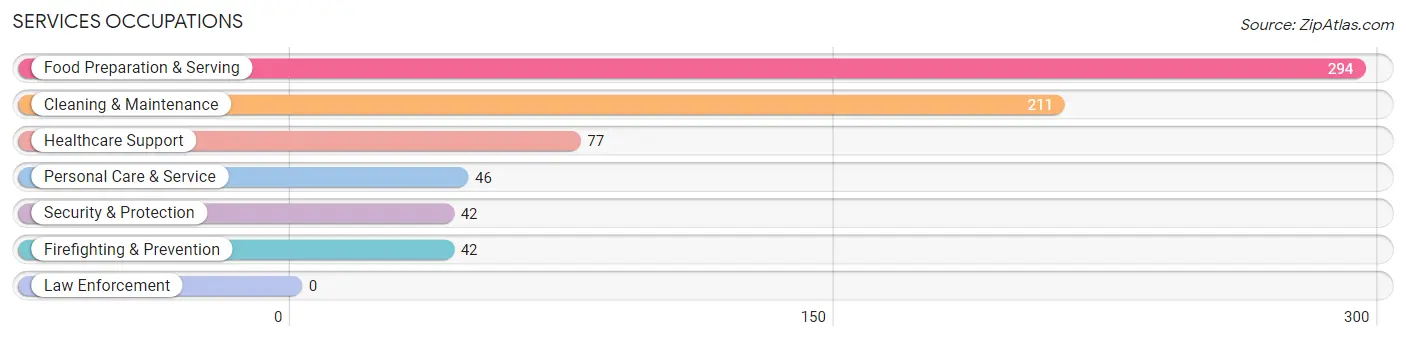
Services Occupations
The most common Services occupations in Calistoga are Food Preparation & Serving (294 | 10.8%), Cleaning & Maintenance (211 | 7.8%), Healthcare Support (77 | 2.8%), Personal Care & Service (46 | 1.7%), and Security & Protection (42 | 1.5%).
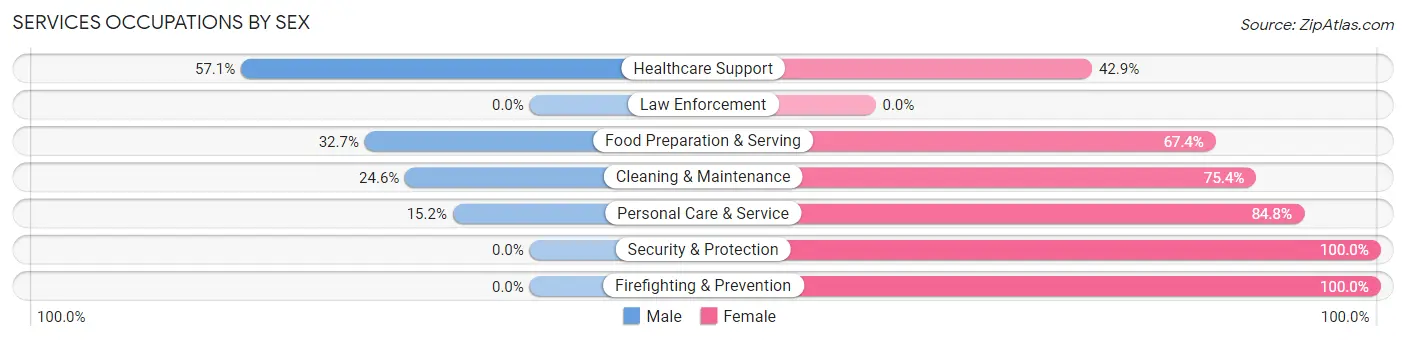
Services Occupations by Sex
Within the Services occupations in Calistoga, the most male-oriented occupations are Healthcare Support (57.1%), Food Preparation & Serving (32.7%), and Cleaning & Maintenance (24.6%), while the most female-oriented occupations are Security & Protection (100.0%), Firefighting & Prevention (100.0%), and Personal Care & Service (84.8%).
| Occupation | Male | Female |
| Healthcare Support | 44 (57.1%) | 33 (42.9%) |
| Security & Protection | 0 (0.0%) | 42 (100.0%) |
| Firefighting & Prevention | 0 (0.0%) | 42 (100.0%) |
| Law Enforcement | 0 (0.0%) | 0 (0.0%) |
| Food Preparation & Serving | 96 (32.7%) | 198 (67.3%) |
| Cleaning & Maintenance | 52 (24.6%) | 159 (75.4%) |
| Personal Care & Service | 7 (15.2%) | 39 (84.8%) |
| Total (Category) | 199 (29.7%) | 471 (70.3%) |
| Total (Overall) | 1,364 (50.2%) | 1,351 (49.8%) |
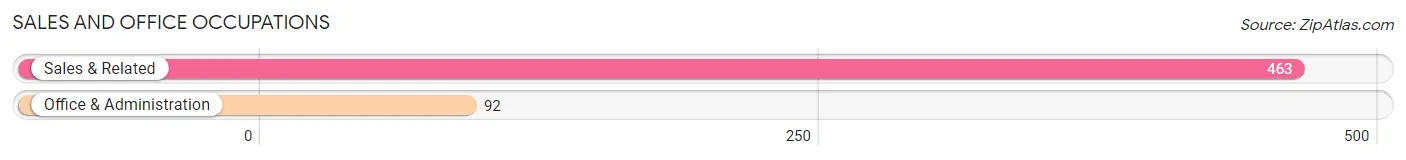
Sales and Office Occupations
The most common Sales and Office occupations in Calistoga are Sales & Related (463 | 17.1%), and Office & Administration (92 | 3.4%).
Sales and Office Occupations by Sex

| Occupation | Male | Female |
| Sales & Related | 81 (17.5%) | 382 (82.5%) |
| Office & Administration | 16 (17.4%) | 76 (82.6%) |
| Total (Category) | 97 (17.5%) | 458 (82.5%) |
| Total (Overall) | 1,364 (50.2%) | 1,351 (49.8%) |
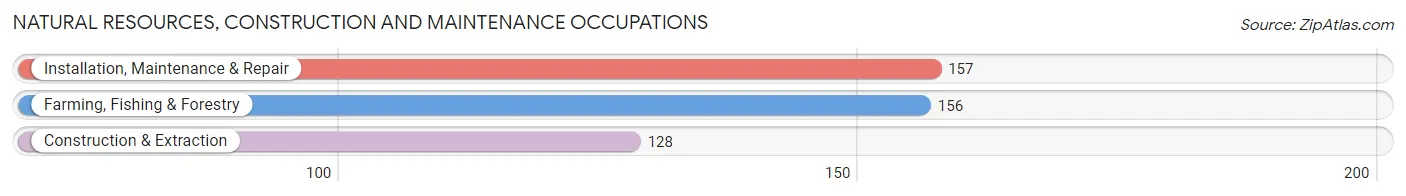
Natural Resources, Construction and Maintenance Occupations
The most common Natural Resources, Construction and Maintenance occupations in Calistoga are Installation, Maintenance & Repair (157 | 5.8%), Farming, Fishing & Forestry (156 | 5.8%), and Construction & Extraction (128 | 4.7%).
Natural Resources, Construction and Maintenance Occupations by Sex
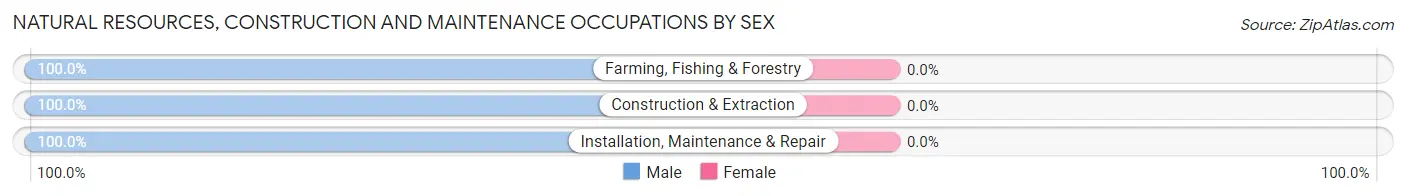
| Occupation | Male | Female |
| Farming, Fishing & Forestry | 156 (100.0%) | 0 (0.0%) |
| Construction & Extraction | 128 (100.0%) | 0 (0.0%) |
| Installation, Maintenance & Repair | 157 (100.0%) | 0 (0.0%) |
| Total (Category) | 441 (100.0%) | 0 (0.0%) |
| Total (Overall) | 1,364 (50.2%) | 1,351 (49.8%) |
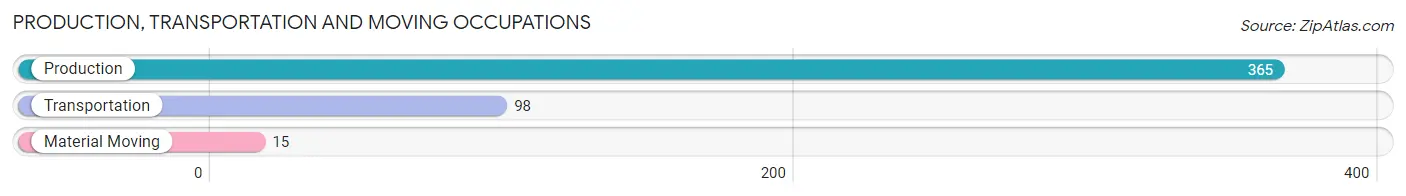
Production, Transportation and Moving Occupations
The most common Production, Transportation and Moving occupations in Calistoga are Production (365 | 13.4%), Transportation (98 | 3.6%), and Material Moving (15 | 0.5%).
Production, Transportation and Moving Occupations by Sex
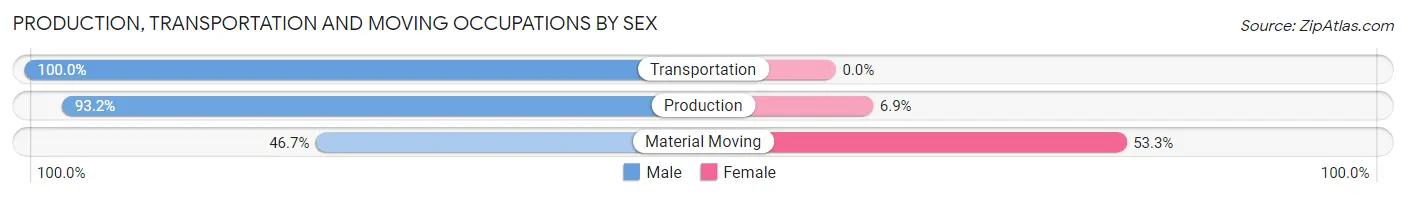
| Occupation | Male | Female |
| Production | 340 (93.1%) | 25 (6.9%) |
| Transportation | 98 (100.0%) | 0 (0.0%) |
| Material Moving | 7 (46.7%) | 8 (53.3%) |
| Total (Category) | 445 (93.1%) | 33 (6.9%) |
| Total (Overall) | 1,364 (50.2%) | 1,351 (49.8%) |
Employment Industries by Sex in Calistoga
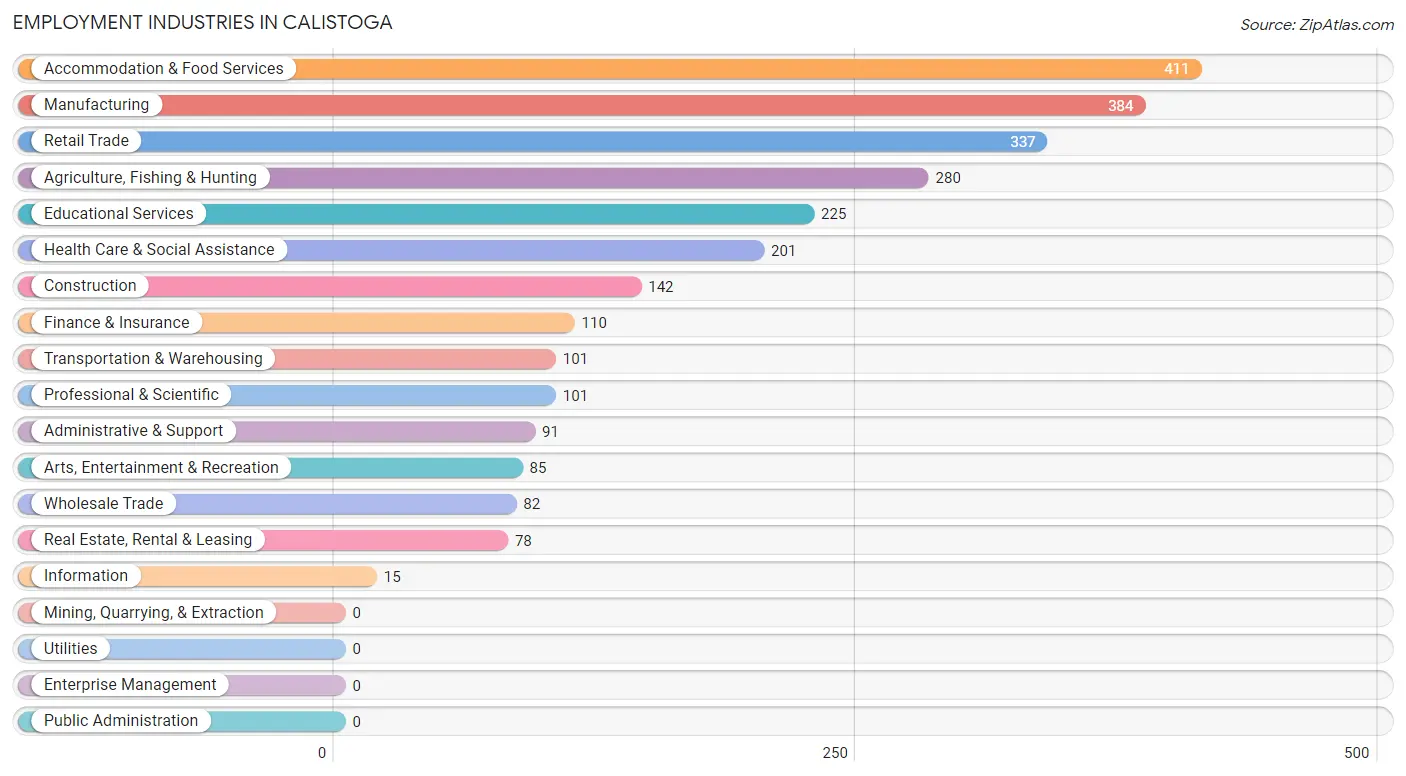
Employment Industries in Calistoga
The major employment industries in Calistoga include Accommodation & Food Services (411 | 15.1%), Manufacturing (384 | 14.1%), Retail Trade (337 | 12.4%), Agriculture, Fishing & Hunting (280 | 10.3%), and Educational Services (225 | 8.3%).
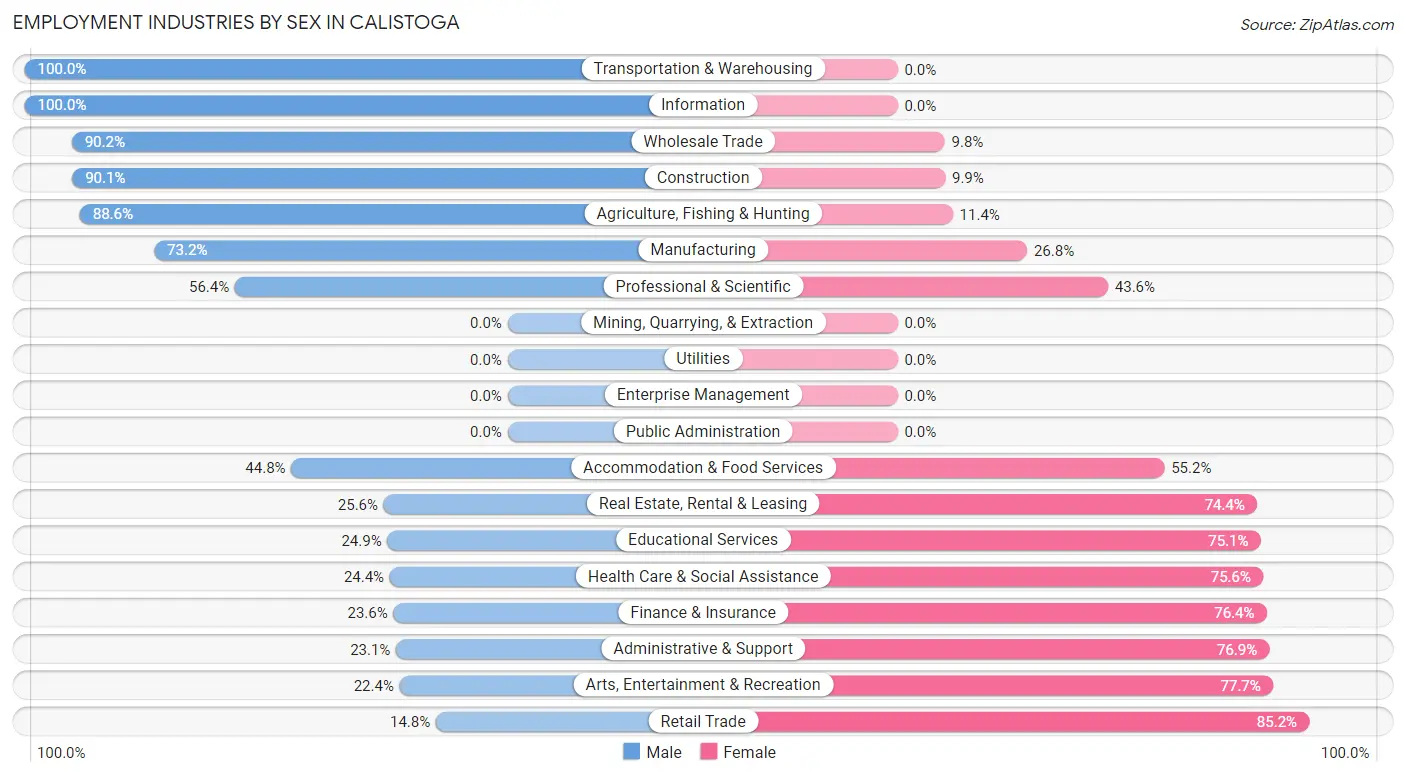
Employment Industries by Sex in Calistoga
The Calistoga industries that see more men than women are Transportation & Warehousing (100.0%), Information (100.0%), and Wholesale Trade (90.2%), whereas the industries that tend to have a higher number of women are Retail Trade (85.2%), Arts, Entertainment & Recreation (77.6%), and Administrative & Support (76.9%).
| Industry | Male | Female |
| Agriculture, Fishing & Hunting | 248 (88.6%) | 32 (11.4%) |
| Mining, Quarrying, & Extraction | 0 (0.0%) | 0 (0.0%) |
| Construction | 128 (90.1%) | 14 (9.9%) |
| Manufacturing | 281 (73.2%) | 103 (26.8%) |
| Wholesale Trade | 74 (90.2%) | 8 (9.8%) |
| Retail Trade | 50 (14.8%) | 287 (85.2%) |
| Transportation & Warehousing | 101 (100.0%) | 0 (0.0%) |
| Utilities | 0 (0.0%) | 0 (0.0%) |
| Information | 15 (100.0%) | 0 (0.0%) |
| Finance & Insurance | 26 (23.6%) | 84 (76.4%) |
| Real Estate, Rental & Leasing | 20 (25.6%) | 58 (74.4%) |
| Professional & Scientific | 57 (56.4%) | 44 (43.6%) |
| Enterprise Management | 0 (0.0%) | 0 (0.0%) |
| Administrative & Support | 21 (23.1%) | 70 (76.9%) |
| Educational Services | 56 (24.9%) | 169 (75.1%) |
| Health Care & Social Assistance | 49 (24.4%) | 152 (75.6%) |
| Arts, Entertainment & Recreation | 19 (22.4%) | 66 (77.6%) |
| Accommodation & Food Services | 184 (44.8%) | 227 (55.2%) |
| Public Administration | 0 (0.0%) | 0 (0.0%) |
| Total | 1,364 (50.2%) | 1,351 (49.8%) |
Education in Calistoga
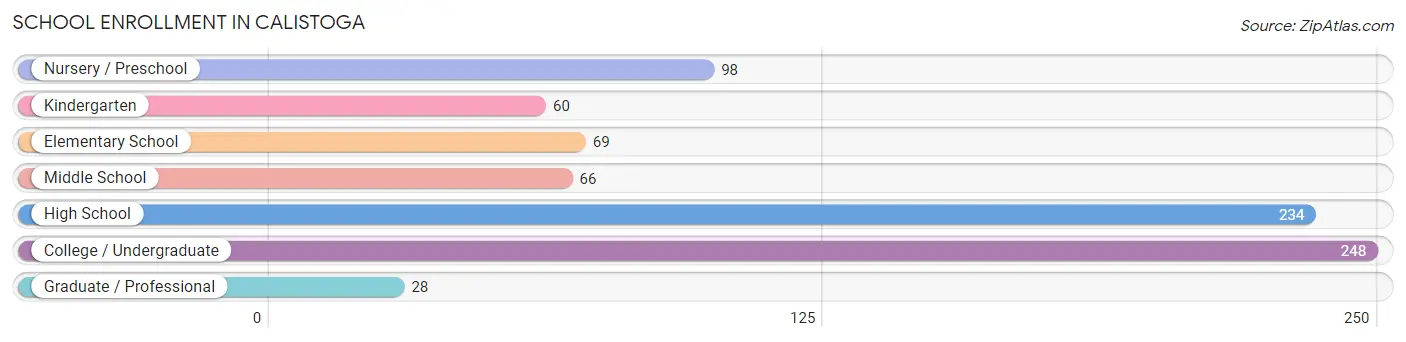
School Enrollment in Calistoga
The most common levels of schooling among the 803 students in Calistoga are college / undergraduate (248 | 30.9%), high school (234 | 29.1%), and nursery / preschool (98 | 12.2%).
| School Level | # Students | % Students |
| Nursery / Preschool | 98 | 12.2% |
| Kindergarten | 60 | 7.5% |
| Elementary School | 69 | 8.6% |
| Middle School | 66 | 8.2% |
| High School | 234 | 29.1% |
| College / Undergraduate | 248 | 30.9% |
| Graduate / Professional | 28 | 3.5% |
| Total | 803 | 100.0% |
School Enrollment by Age by Funding Source in Calistoga
Out of a total of 803 students who are enrolled in schools in Calistoga, 88 (11.0%) attend a private institution, while the remaining 715 (89.0%) are enrolled in public schools. The age group of 3 to 4 year olds has the highest likelihood of being enrolled in private schools, with 58 (64.4% in the age bracket) enrolled. Conversely, the age group of 5 to 9 year old has the lowest likelihood of being enrolled in a private school, with 122 (100.0% in the age bracket) attending a public institution.
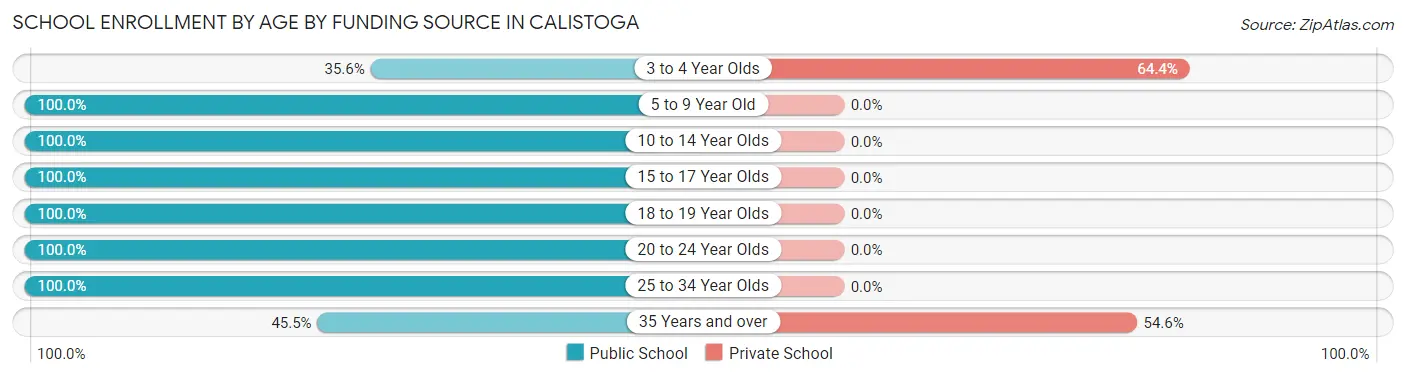
| Age Bracket | Public School | Private School |
| 3 to 4 Year Olds | 32 (35.6%) | 58 (64.4%) |
| 5 to 9 Year Old | 122 (100.0%) | 0 (0.0%) |
| 10 to 14 Year Olds | 107 (100.0%) | 0 (0.0%) |
| 15 to 17 Year Olds | 189 (100.0%) | 0 (0.0%) |
| 18 to 19 Year Olds | 77 (100.0%) | 0 (0.0%) |
| 20 to 24 Year Olds | 80 (100.0%) | 0 (0.0%) |
| 25 to 34 Year Olds | 83 (100.0%) | 0 (0.0%) |
| 35 Years and over | 25 (45.5%) | 30 (54.5%) |
| Total | 715 (89.0%) | 88 (11.0%) |
Educational Attainment by Field of Study in Calistoga
Business (314 | 23.4%), social sciences (232 | 17.3%), arts & humanities (130 | 9.7%), education (109 | 8.1%), and literature & languages (98 | 7.3%) are the most common fields of study among 1,339 individuals in Calistoga who have obtained a bachelor's degree or higher.
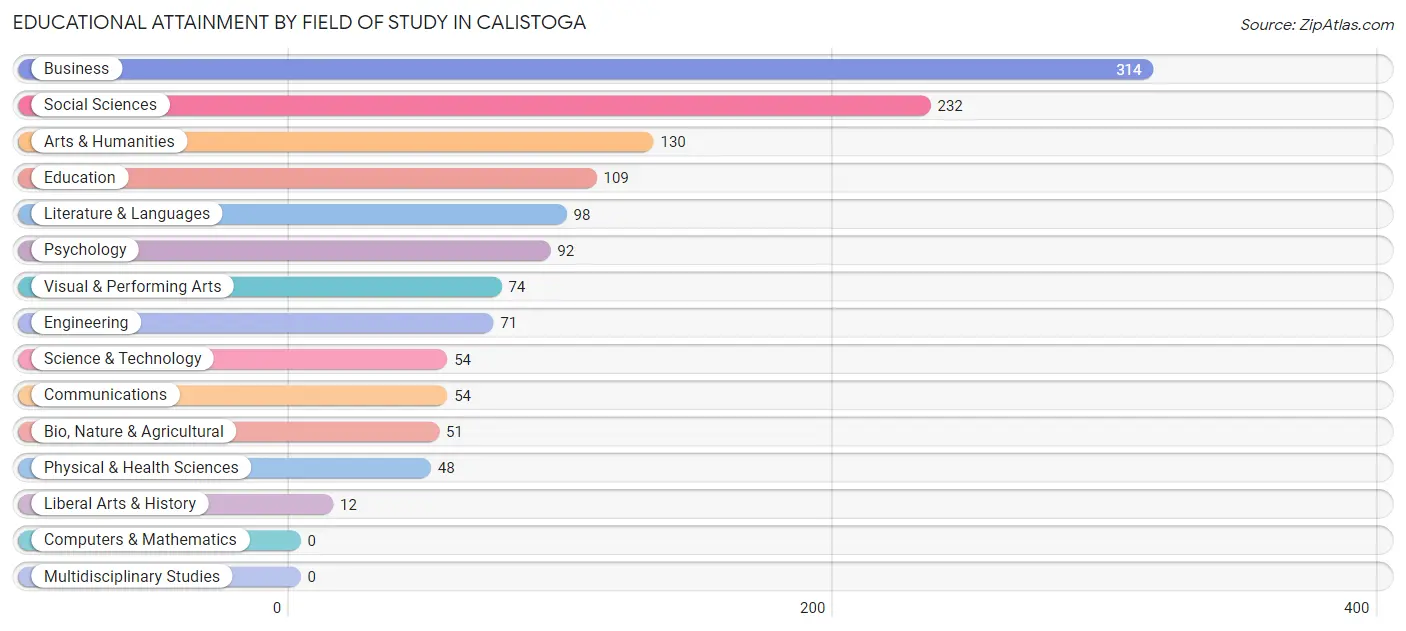
| Field of Study | # Graduates | % Graduates |
| Computers & Mathematics | 0 | 0.0% |
| Bio, Nature & Agricultural | 51 | 3.8% |
| Physical & Health Sciences | 48 | 3.6% |
| Psychology | 92 | 6.9% |
| Social Sciences | 232 | 17.3% |
| Engineering | 71 | 5.3% |
| Multidisciplinary Studies | 0 | 0.0% |
| Science & Technology | 54 | 4.0% |
| Business | 314 | 23.4% |
| Education | 109 | 8.1% |
| Literature & Languages | 98 | 7.3% |
| Liberal Arts & History | 12 | 0.9% |
| Visual & Performing Arts | 74 | 5.5% |
| Communications | 54 | 4.0% |
| Arts & Humanities | 130 | 9.7% |
| Total | 1,339 | 100.0% |
Transportation & Commute in Calistoga
Vehicle Availability by Sex in Calistoga
The most prevalent vehicle ownership categories in Calistoga are males with 3 vehicles (572, accounting for 42.4%) and females with 3 vehicles (369, making up 43.9%).
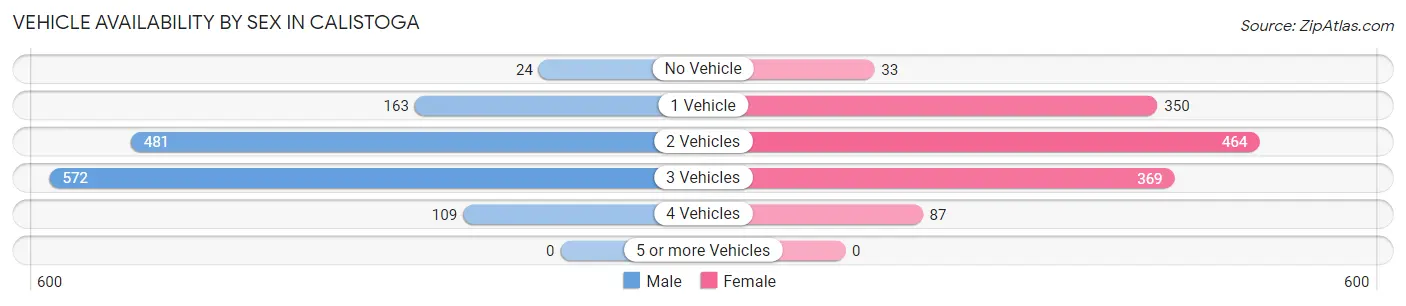
| Vehicles Available | Male | Female |
| No Vehicle | 24 (1.8%) | 33 (2.5%) |
| 1 Vehicle | 163 (12.1%) | 350 (26.9%) |
| 2 Vehicles | 481 (35.7%) | 464 (35.6%) |
| 3 Vehicles | 572 (42.4%) | 369 (28.3%) |
| 4 Vehicles | 109 (8.1%) | 87 (6.7%) |
| 5 or more Vehicles | 0 (0.0%) | 0 (0.0%) |
| Total | 1,349 (100.0%) | 1,303 (100.0%) |
Commute Time in Calistoga
The most frequently occuring commute durations in Calistoga are 30 to 34 minutes (596 commuters, 24.3%), 5 to 9 minutes (434 commuters, 17.7%), and 10 to 14 minutes (370 commuters, 15.1%).
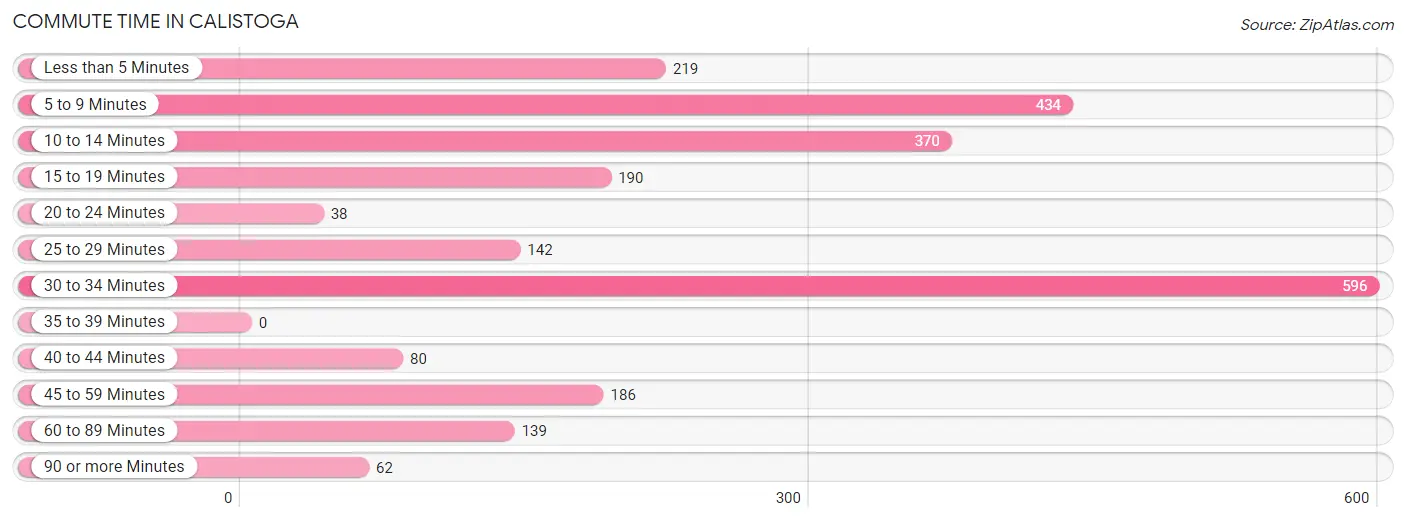
| Commute Time | # Commuters | % Commuters |
| Less than 5 Minutes | 219 | 8.9% |
| 5 to 9 Minutes | 434 | 17.7% |
| 10 to 14 Minutes | 370 | 15.1% |
| 15 to 19 Minutes | 190 | 7.7% |
| 20 to 24 Minutes | 38 | 1.5% |
| 25 to 29 Minutes | 142 | 5.8% |
| 30 to 34 Minutes | 596 | 24.3% |
| 35 to 39 Minutes | 0 | 0.0% |
| 40 to 44 Minutes | 80 | 3.3% |
| 45 to 59 Minutes | 186 | 7.6% |
| 60 to 89 Minutes | 139 | 5.7% |
| 90 or more Minutes | 62 | 2.5% |
Commute Time by Sex in Calistoga
The most common commute times in Calistoga are 30 to 34 minutes (348 commuters, 26.3%) for males and 5 to 9 minutes (276 commuters, 24.3%) for females.
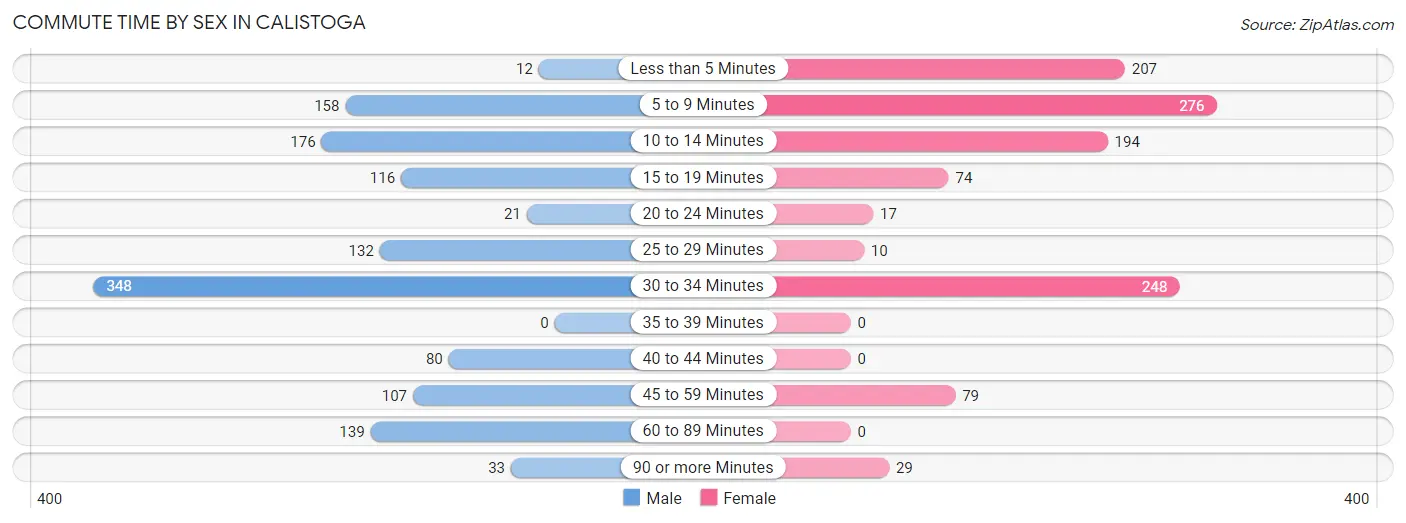
| Commute Time | Male | Female |
| Less than 5 Minutes | 12 (0.9%) | 207 (18.2%) |
| 5 to 9 Minutes | 158 (11.9%) | 276 (24.3%) |
| 10 to 14 Minutes | 176 (13.3%) | 194 (17.1%) |
| 15 to 19 Minutes | 116 (8.8%) | 74 (6.5%) |
| 20 to 24 Minutes | 21 (1.6%) | 17 (1.5%) |
| 25 to 29 Minutes | 132 (10.0%) | 10 (0.9%) |
| 30 to 34 Minutes | 348 (26.3%) | 248 (21.9%) |
| 35 to 39 Minutes | 0 (0.0%) | 0 (0.0%) |
| 40 to 44 Minutes | 80 (6.0%) | 0 (0.0%) |
| 45 to 59 Minutes | 107 (8.1%) | 79 (7.0%) |
| 60 to 89 Minutes | 139 (10.5%) | 0 (0.0%) |
| 90 or more Minutes | 33 (2.5%) | 29 (2.6%) |
Time of Departure to Work by Sex in Calistoga
The most frequent times of departure to work in Calistoga are 6:30 AM to 6:59 AM (294, 22.2%) for males and 12:00 PM to 3:59 PM (237, 20.9%) for females.
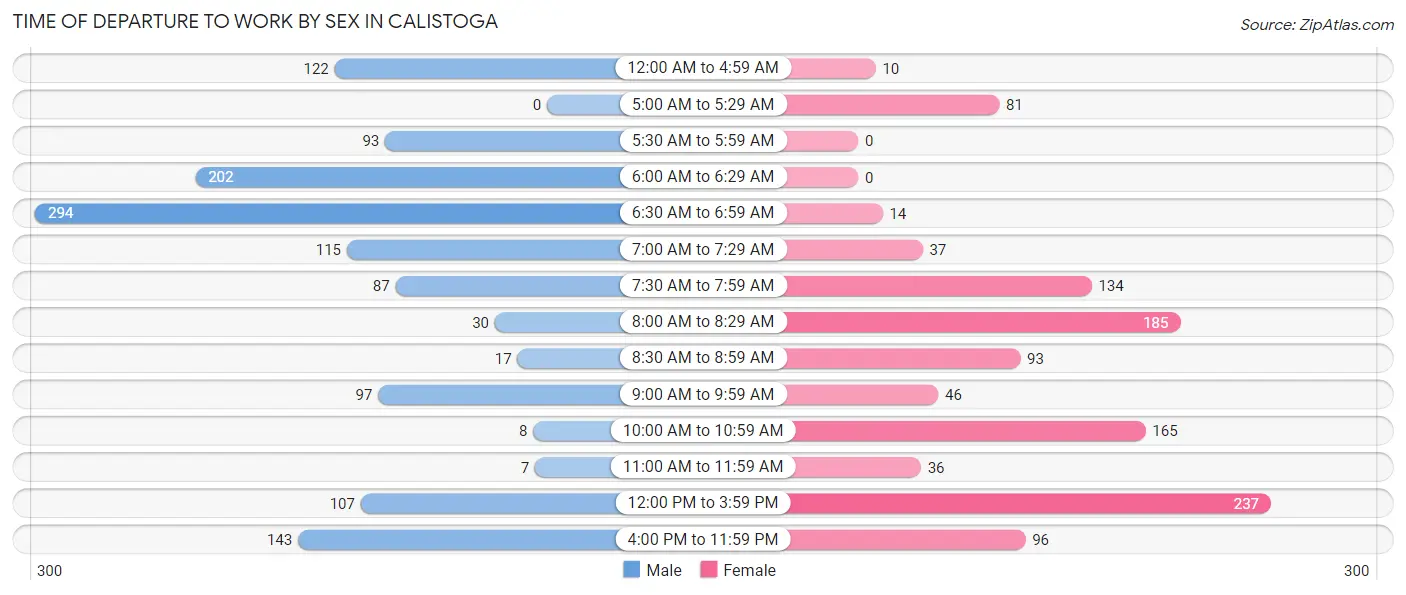
| Time of Departure | Male | Female |
| 12:00 AM to 4:59 AM | 122 (9.2%) | 10 (0.9%) |
| 5:00 AM to 5:29 AM | 0 (0.0%) | 81 (7.1%) |
| 5:30 AM to 5:59 AM | 93 (7.0%) | 0 (0.0%) |
| 6:00 AM to 6:29 AM | 202 (15.3%) | 0 (0.0%) |
| 6:30 AM to 6:59 AM | 294 (22.2%) | 14 (1.2%) |
| 7:00 AM to 7:29 AM | 115 (8.7%) | 37 (3.3%) |
| 7:30 AM to 7:59 AM | 87 (6.6%) | 134 (11.8%) |
| 8:00 AM to 8:29 AM | 30 (2.3%) | 185 (16.3%) |
| 8:30 AM to 8:59 AM | 17 (1.3%) | 93 (8.2%) |
| 9:00 AM to 9:59 AM | 97 (7.3%) | 46 (4.1%) |
| 10:00 AM to 10:59 AM | 8 (0.6%) | 165 (14.5%) |
| 11:00 AM to 11:59 AM | 7 (0.5%) | 36 (3.2%) |
| 12:00 PM to 3:59 PM | 107 (8.1%) | 237 (20.9%) |
| 4:00 PM to 11:59 PM | 143 (10.8%) | 96 (8.5%) |
| Total | 1,322 (100.0%) | 1,134 (100.0%) |
Housing Occupancy in Calistoga
Occupancy by Ownership in Calistoga
Of the total 2,116 dwellings in Calistoga, owner-occupied units account for 1,340 (63.3%), while renter-occupied units make up 776 (36.7%).
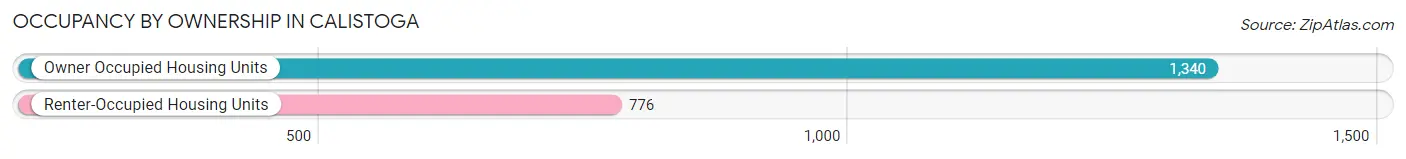
| Occupancy | # Housing Units | % Housing Units |
| Owner Occupied Housing Units | 1,340 | 63.3% |
| Renter-Occupied Housing Units | 776 | 36.7% |
| Total Occupied Housing Units | 2,116 | 100.0% |
Occupancy by Household Size in Calistoga
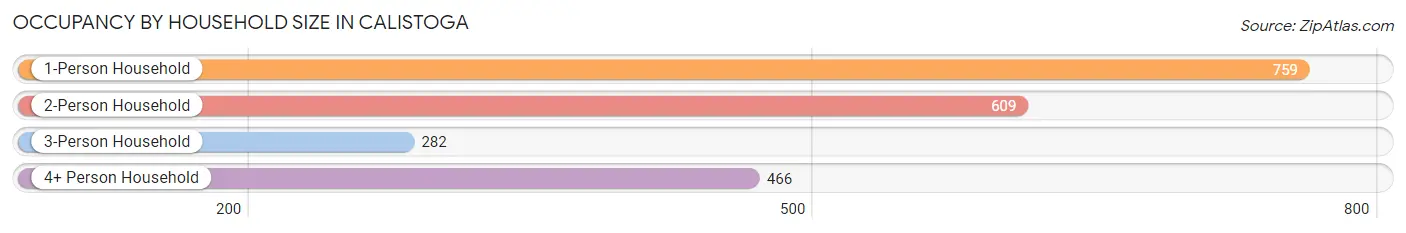
| Household Size | # Housing Units | % Housing Units |
| 1-Person Household | 759 | 35.9% |
| 2-Person Household | 609 | 28.8% |
| 3-Person Household | 282 | 13.3% |
| 4+ Person Household | 466 | 22.0% |
| Total Housing Units | 2,116 | 100.0% |
Occupancy by Ownership by Household Size in Calistoga
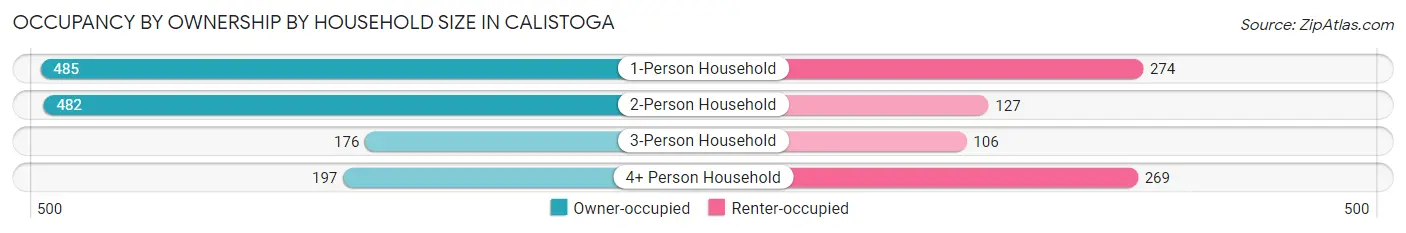
| Household Size | Owner-occupied | Renter-occupied |
| 1-Person Household | 485 (63.9%) | 274 (36.1%) |
| 2-Person Household | 482 (79.1%) | 127 (20.8%) |
| 3-Person Household | 176 (62.4%) | 106 (37.6%) |
| 4+ Person Household | 197 (42.3%) | 269 (57.7%) |
| Total Housing Units | 1,340 (63.3%) | 776 (36.7%) |
Occupancy by Educational Attainment in Calistoga
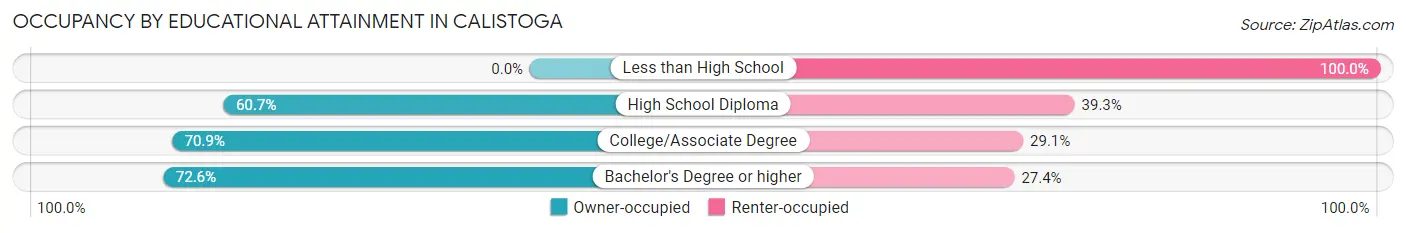
| Household Size | Owner-occupied | Renter-occupied |
| Less than High School | 0 (0.0%) | 204 (100.0%) |
| High School Diploma | 165 (60.7%) | 107 (39.3%) |
| College/Associate Degree | 635 (70.9%) | 261 (29.1%) |
| Bachelor's Degree or higher | 540 (72.6%) | 204 (27.4%) |
Occupancy by Age of Householder in Calistoga
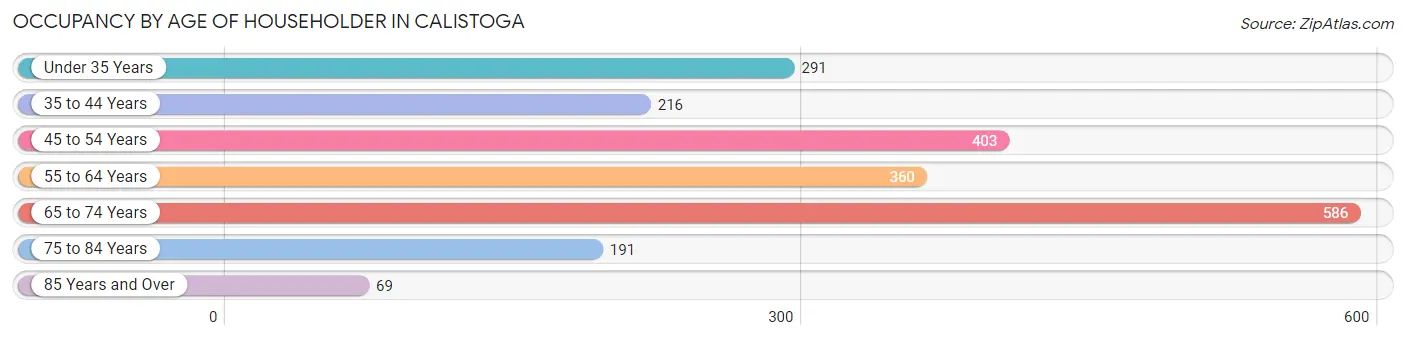
| Age Bracket | # Households | % Households |
| Under 35 Years | 291 | 13.8% |
| 35 to 44 Years | 216 | 10.2% |
| 45 to 54 Years | 403 | 19.1% |
| 55 to 64 Years | 360 | 17.0% |
| 65 to 74 Years | 586 | 27.7% |
| 75 to 84 Years | 191 | 9.0% |
| 85 Years and Over | 69 | 3.3% |
| Total | 2,116 | 100.0% |
Housing Finances in Calistoga
Median Income by Occupancy in Calistoga
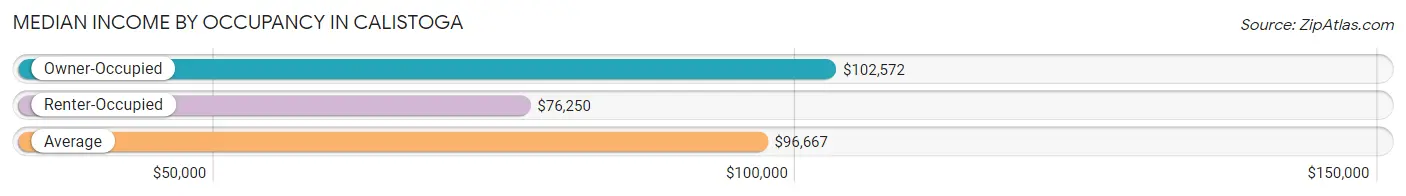
| Occupancy Type | # Households | Median Income |
| Owner-Occupied | 1,340 (63.3%) | $102,572 |
| Renter-Occupied | 776 (36.7%) | $76,250 |
| Average | 2,116 (100.0%) | $96,667 |
Occupancy by Householder Income Bracket in Calistoga
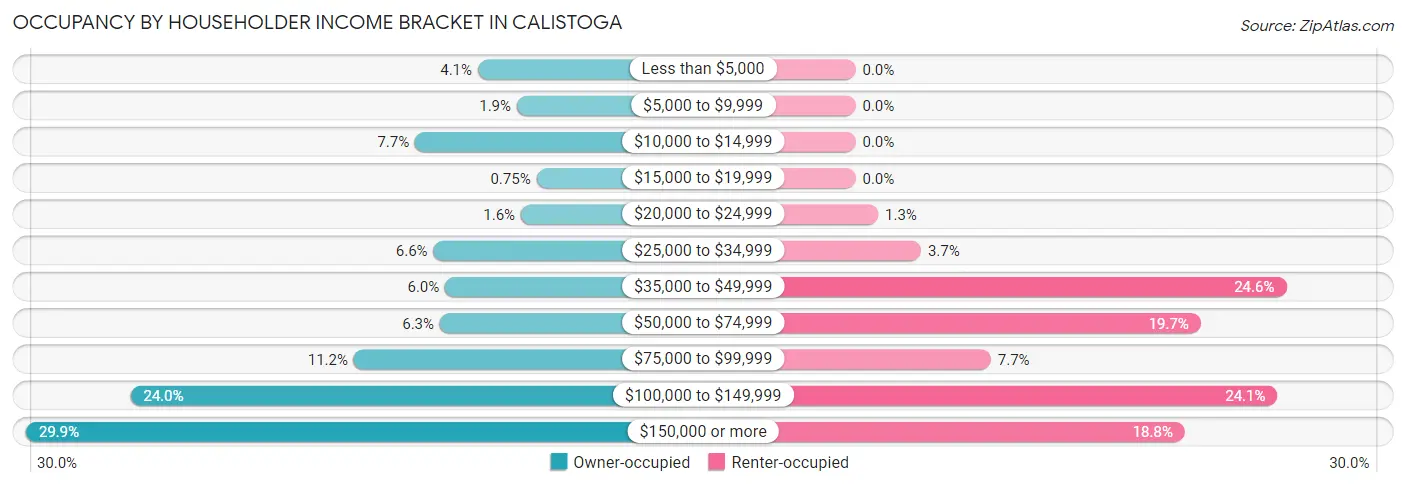
| Income Bracket | Owner-occupied | Renter-occupied |
| Less than $5,000 | 55 (4.1%) | 0 (0.0%) |
| $5,000 to $9,999 | 25 (1.9%) | 0 (0.0%) |
| $10,000 to $14,999 | 103 (7.7%) | 0 (0.0%) |
| $15,000 to $19,999 | 10 (0.7%) | 0 (0.0%) |
| $20,000 to $24,999 | 22 (1.6%) | 10 (1.3%) |
| $25,000 to $34,999 | 89 (6.6%) | 29 (3.7%) |
| $35,000 to $49,999 | 80 (6.0%) | 191 (24.6%) |
| $50,000 to $74,999 | 84 (6.3%) | 153 (19.7%) |
| $75,000 to $99,999 | 150 (11.2%) | 60 (7.7%) |
| $100,000 to $149,999 | 321 (24.0%) | 187 (24.1%) |
| $150,000 or more | 401 (29.9%) | 146 (18.8%) |
| Total | 1,340 (100.0%) | 776 (100.0%) |
Monthly Housing Cost Tiers in Calistoga
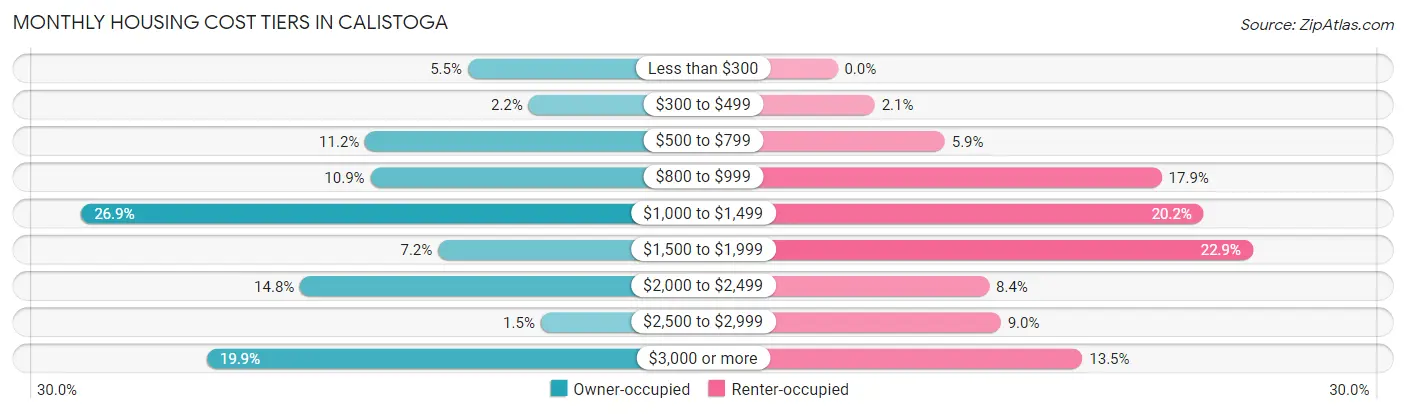
| Monthly Cost | Owner-occupied | Renter-occupied |
| Less than $300 | 74 (5.5%) | 0 (0.0%) |
| $300 to $499 | 29 (2.2%) | 16 (2.1%) |
| $500 to $799 | 150 (11.2%) | 46 (5.9%) |
| $800 to $999 | 146 (10.9%) | 139 (17.9%) |
| $1,000 to $1,499 | 360 (26.9%) | 157 (20.2%) |
| $1,500 to $1,999 | 96 (7.2%) | 178 (22.9%) |
| $2,000 to $2,499 | 198 (14.8%) | 65 (8.4%) |
| $2,500 to $2,999 | 20 (1.5%) | 70 (9.0%) |
| $3,000 or more | 267 (19.9%) | 105 (13.5%) |
| Total | 1,340 (100.0%) | 776 (100.0%) |
Physical Housing Characteristics in Calistoga
Housing Structures in Calistoga
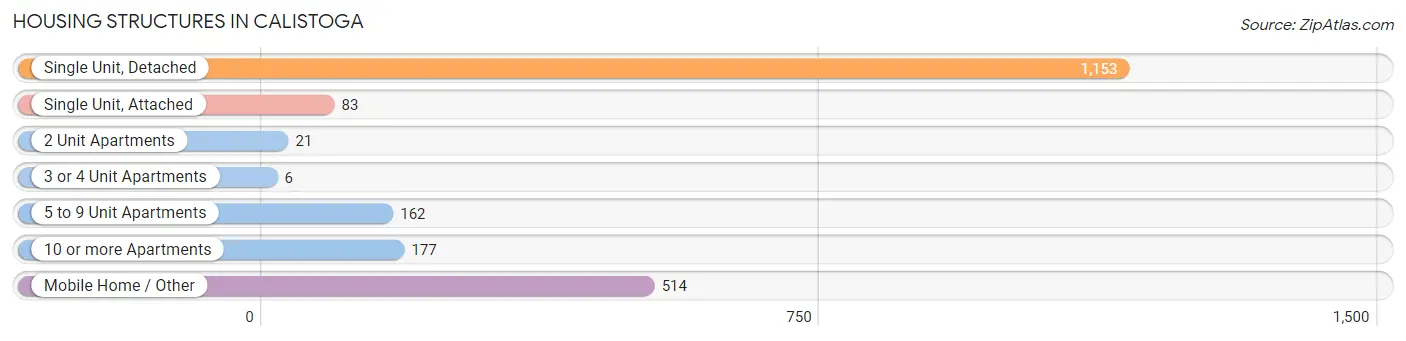
| Structure Type | # Housing Units | % Housing Units |
| Single Unit, Detached | 1,153 | 54.5% |
| Single Unit, Attached | 83 | 3.9% |
| 2 Unit Apartments | 21 | 1.0% |
| 3 or 4 Unit Apartments | 6 | 0.3% |
| 5 to 9 Unit Apartments | 162 | 7.7% |
| 10 or more Apartments | 177 | 8.4% |
| Mobile Home / Other | 514 | 24.3% |
| Total | 2,116 | 100.0% |
Housing Structures by Occupancy in Calistoga
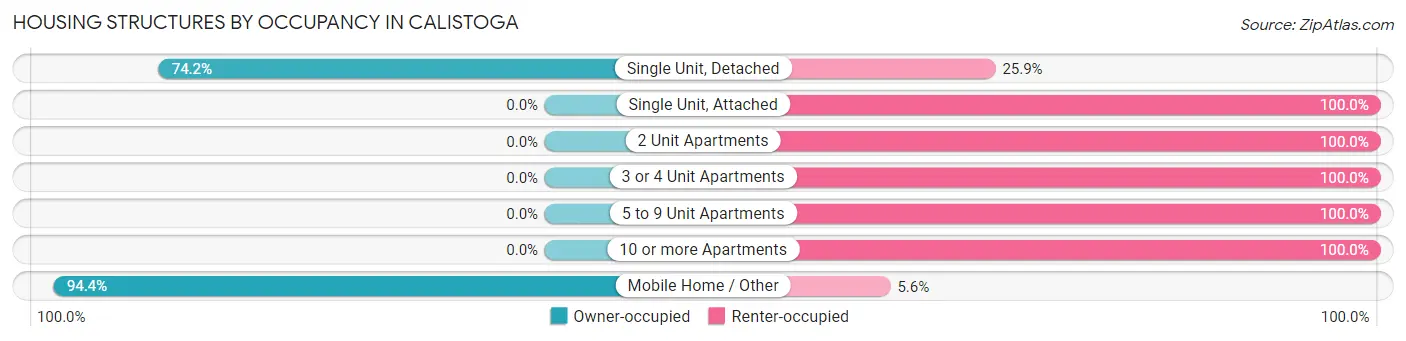
| Structure Type | Owner-occupied | Renter-occupied |
| Single Unit, Detached | 855 (74.2%) | 298 (25.9%) |
| Single Unit, Attached | 0 (0.0%) | 83 (100.0%) |
| 2 Unit Apartments | 0 (0.0%) | 21 (100.0%) |
| 3 or 4 Unit Apartments | 0 (0.0%) | 6 (100.0%) |
| 5 to 9 Unit Apartments | 0 (0.0%) | 162 (100.0%) |
| 10 or more Apartments | 0 (0.0%) | 177 (100.0%) |
| Mobile Home / Other | 485 (94.4%) | 29 (5.6%) |
| Total | 1,340 (63.3%) | 776 (36.7%) |
Housing Structures by Number of Rooms in Calistoga
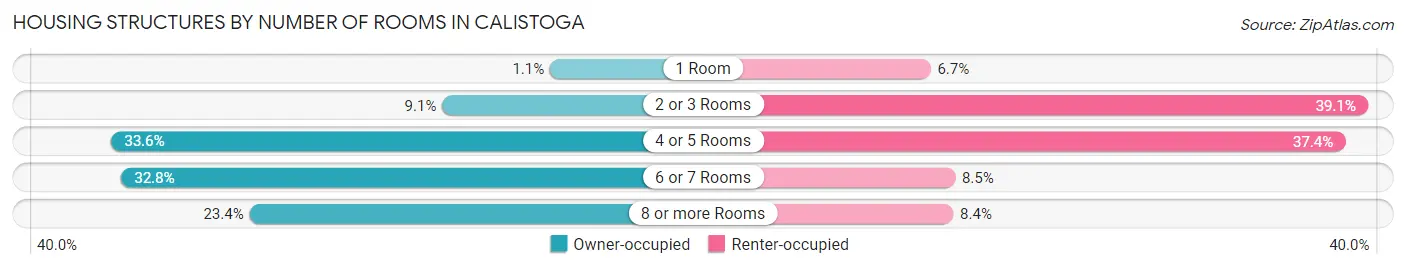
| Number of Rooms | Owner-occupied | Renter-occupied |
| 1 Room | 15 (1.1%) | 52 (6.7%) |
| 2 or 3 Rooms | 122 (9.1%) | 303 (39.1%) |
| 4 or 5 Rooms | 450 (33.6%) | 290 (37.4%) |
| 6 or 7 Rooms | 440 (32.8%) | 66 (8.5%) |
| 8 or more Rooms | 313 (23.4%) | 65 (8.4%) |
| Total | 1,340 (100.0%) | 776 (100.0%) |
Housing Structure by Heating Type in Calistoga
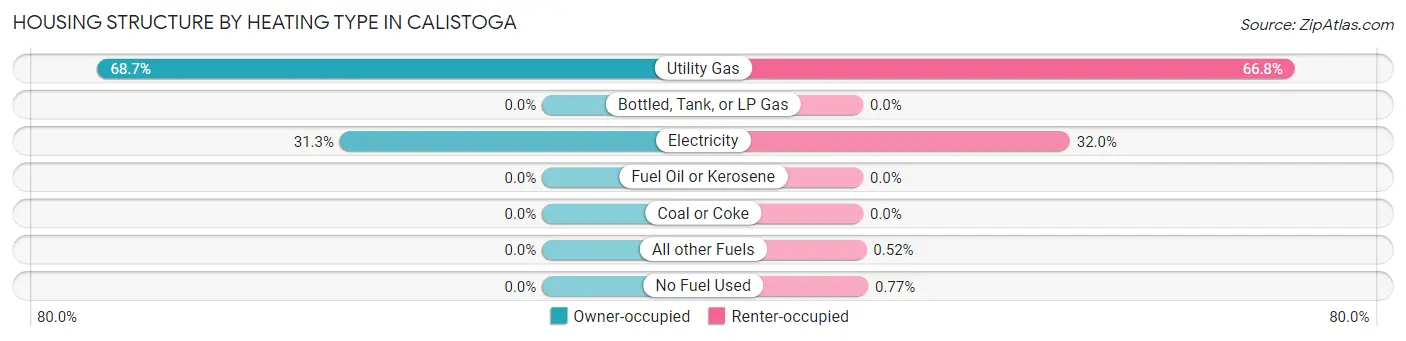
| Heating Type | Owner-occupied | Renter-occupied |
| Utility Gas | 921 (68.7%) | 518 (66.7%) |
| Bottled, Tank, or LP Gas | 0 (0.0%) | 0 (0.0%) |
| Electricity | 419 (31.3%) | 248 (32.0%) |
| Fuel Oil or Kerosene | 0 (0.0%) | 0 (0.0%) |
| Coal or Coke | 0 (0.0%) | 0 (0.0%) |
| All other Fuels | 0 (0.0%) | 4 (0.5%) |
| No Fuel Used | 0 (0.0%) | 6 (0.8%) |
| Total | 1,340 (100.0%) | 776 (100.0%) |
Household Vehicle Usage in Calistoga
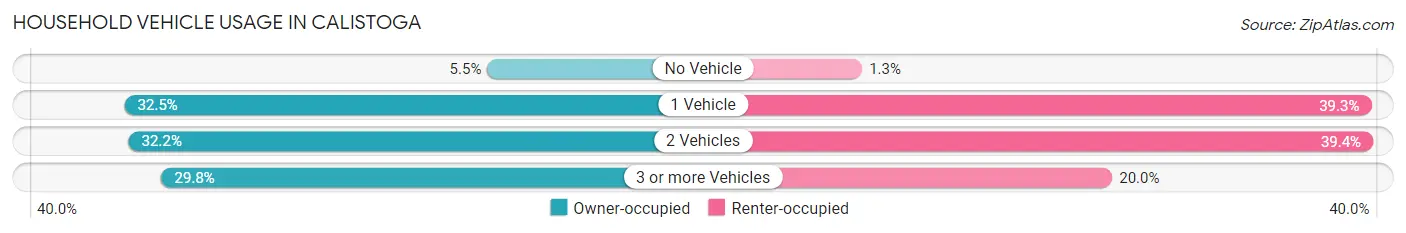
| Vehicles per Household | Owner-occupied | Renter-occupied |
| No Vehicle | 73 (5.4%) | 10 (1.3%) |
| 1 Vehicle | 436 (32.5%) | 305 (39.3%) |
| 2 Vehicles | 432 (32.2%) | 306 (39.4%) |
| 3 or more Vehicles | 399 (29.8%) | 155 (20.0%) |
| Total | 1,340 (100.0%) | 776 (100.0%) |
Real Estate & Mortgages in Calistoga
Real Estate and Mortgage Overview in Calistoga
| Characteristic | Without Mortgage | With Mortgage |
| Housing Units | 752 | 588 |
| Median Property Value | $237,900 | $874,200 |
| Median Household Income | $73,167 | $238 |
| Monthly Housing Costs | $986 | $267 |
| Real Estate Taxes | $1,624 | $49 |
Property Value by Mortgage Status in Calistoga
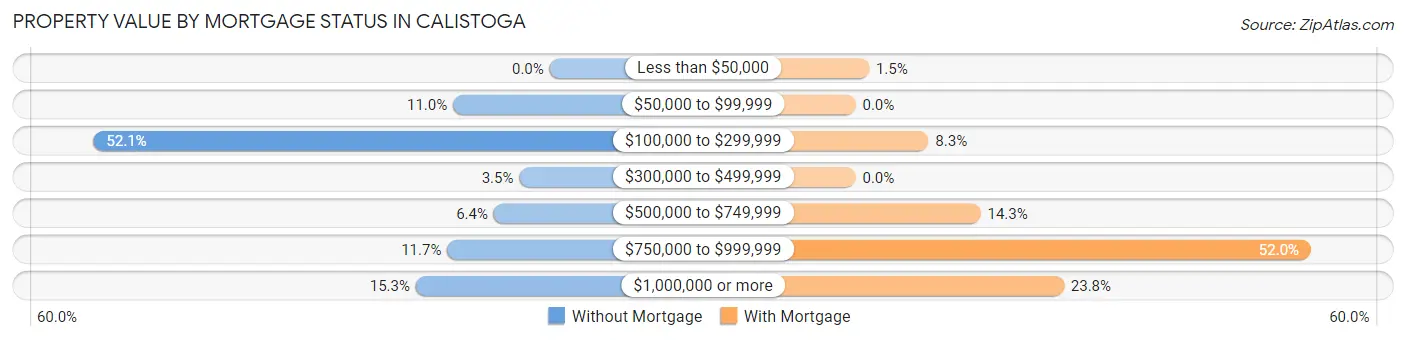
| Property Value | Without Mortgage | With Mortgage |
| Less than $50,000 | 0 (0.0%) | 9 (1.5%) |
| $50,000 to $99,999 | 83 (11.0%) | 0 (0.0%) |
| $100,000 to $299,999 | 392 (52.1%) | 49 (8.3%) |
| $300,000 to $499,999 | 26 (3.5%) | 0 (0.0%) |
| $500,000 to $749,999 | 48 (6.4%) | 84 (14.3%) |
| $750,000 to $999,999 | 88 (11.7%) | 306 (52.0%) |
| $1,000,000 or more | 115 (15.3%) | 140 (23.8%) |
| Total | 752 (100.0%) | 588 (100.0%) |
Household Income by Mortgage Status in Calistoga
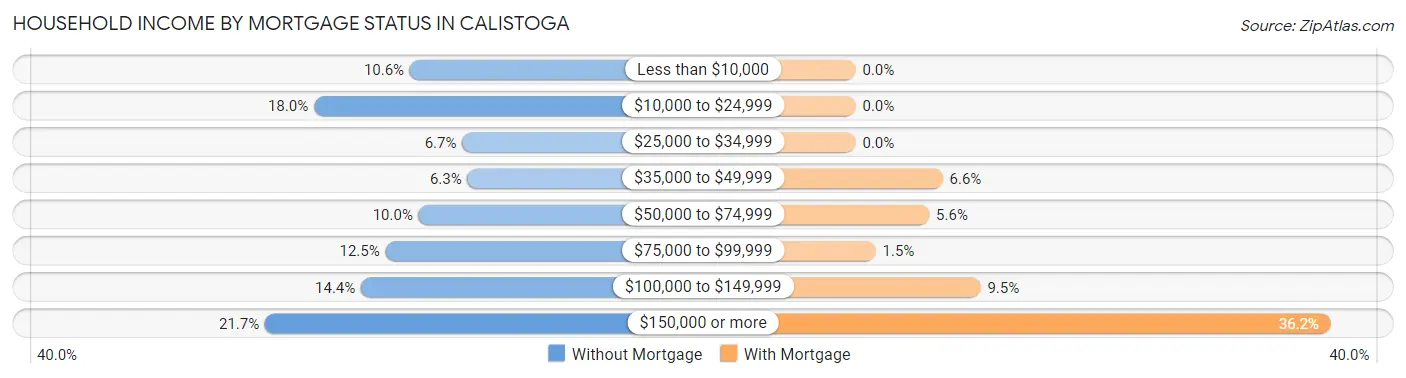
| Household Income | Without Mortgage | With Mortgage |
| Less than $10,000 | 80 (10.6%) | 0 (0.0%) |
| $10,000 to $24,999 | 135 (17.9%) | 0 (0.0%) |
| $25,000 to $34,999 | 50 (6.7%) | 0 (0.0%) |
| $35,000 to $49,999 | 47 (6.2%) | 39 (6.6%) |
| $50,000 to $74,999 | 75 (10.0%) | 33 (5.6%) |
| $75,000 to $99,999 | 94 (12.5%) | 9 (1.5%) |
| $100,000 to $149,999 | 108 (14.4%) | 56 (9.5%) |
| $150,000 or more | 163 (21.7%) | 213 (36.2%) |
| Total | 752 (100.0%) | 588 (100.0%) |
Property Value to Household Income Ratio in Calistoga
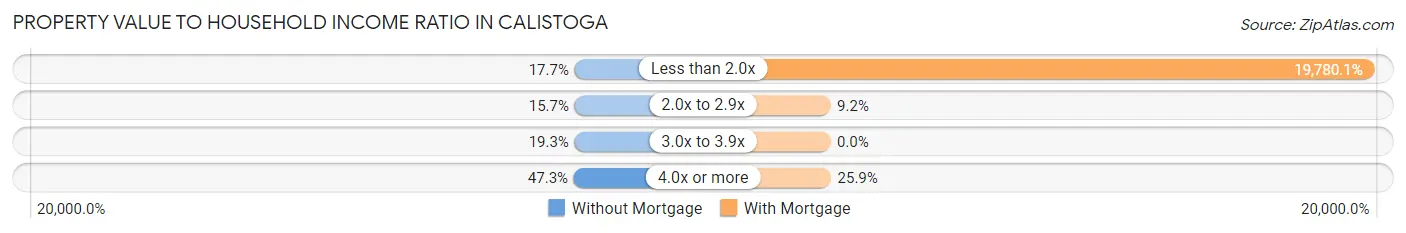
| Value-to-Income Ratio | Without Mortgage | With Mortgage |
| Less than 2.0x | 133 (17.7%) | 116,307 (19,780.1%) |
| 2.0x to 2.9x | 118 (15.7%) | 54 (9.2%) |
| 3.0x to 3.9x | 145 (19.3%) | 0 (0.0%) |
| 4.0x or more | 356 (47.3%) | 152 (25.9%) |
| Total | 752 (100.0%) | 588 (100.0%) |
Real Estate Taxes by Mortgage Status in Calistoga
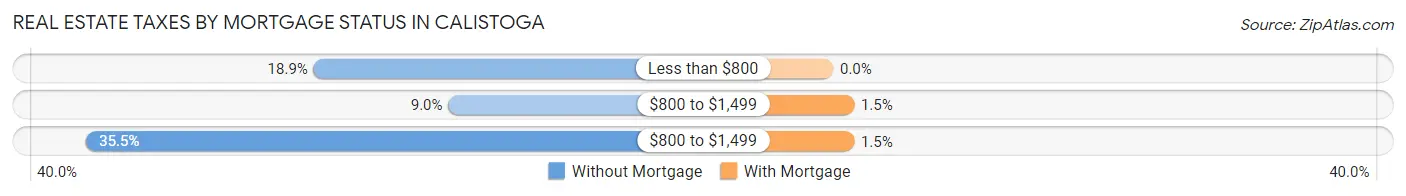
| Property Taxes | Without Mortgage | With Mortgage |
| Less than $800 | 142 (18.9%) | 0 (0.0%) |
| $800 to $1,499 | 68 (9.0%) | 9 (1.5%) |
| $800 to $1,499 | 267 (35.5%) | 9 (1.5%) |
| Total | 752 (100.0%) | 588 (100.0%) |
Health & Disability in Calistoga
Health Insurance Coverage by Age in Calistoga
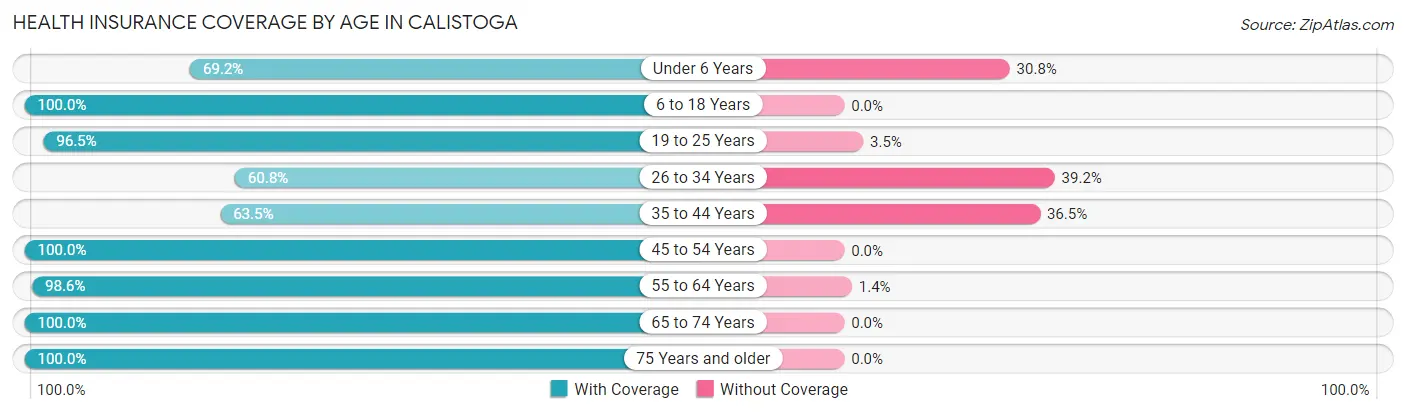
| Age Bracket | With Coverage | Without Coverage |
| Under 6 Years | 213 (69.2%) | 95 (30.8%) |
| 6 to 18 Years | 469 (100.0%) | 0 (0.0%) |
| 19 to 25 Years | 302 (96.5%) | 11 (3.5%) |
| 26 to 34 Years | 378 (60.8%) | 244 (39.2%) |
| 35 to 44 Years | 329 (63.5%) | 189 (36.5%) |
| 45 to 54 Years | 1,061 (100.0%) | 0 (0.0%) |
| 55 to 64 Years | 490 (98.6%) | 7 (1.4%) |
| 65 to 74 Years | 785 (100.0%) | 0 (0.0%) |
| 75 Years and older | 587 (100.0%) | 0 (0.0%) |
| Total | 4,614 (89.4%) | 546 (10.6%) |
Health Insurance Coverage by Citizenship Status in Calistoga
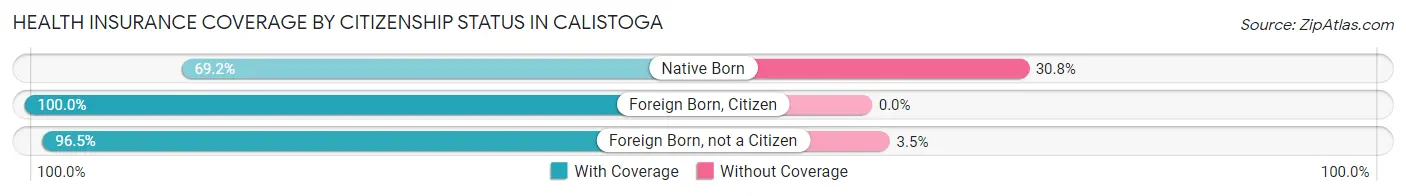
| Citizenship Status | With Coverage | Without Coverage |
| Native Born | 213 (69.2%) | 95 (30.8%) |
| Foreign Born, Citizen | 469 (100.0%) | 0 (0.0%) |
| Foreign Born, not a Citizen | 302 (96.5%) | 11 (3.5%) |
Health Insurance Coverage by Household Income in Calistoga
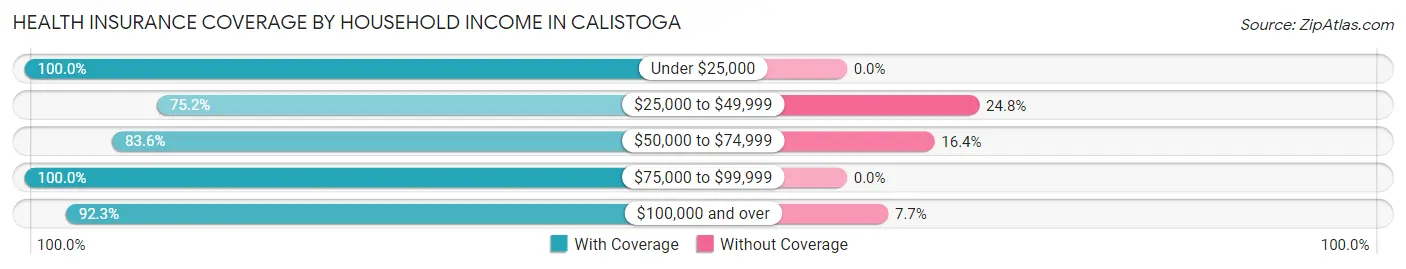
| Household Income | With Coverage | Without Coverage |
| Under $25,000 | 286 (100.0%) | 0 (0.0%) |
| $25,000 to $49,999 | 555 (75.2%) | 183 (24.8%) |
| $50,000 to $74,999 | 550 (83.6%) | 108 (16.4%) |
| $75,000 to $99,999 | 277 (100.0%) | 0 (0.0%) |
| $100,000 and over | 2,913 (92.3%) | 244 (7.7%) |
Public vs Private Health Insurance Coverage by Age in Calistoga
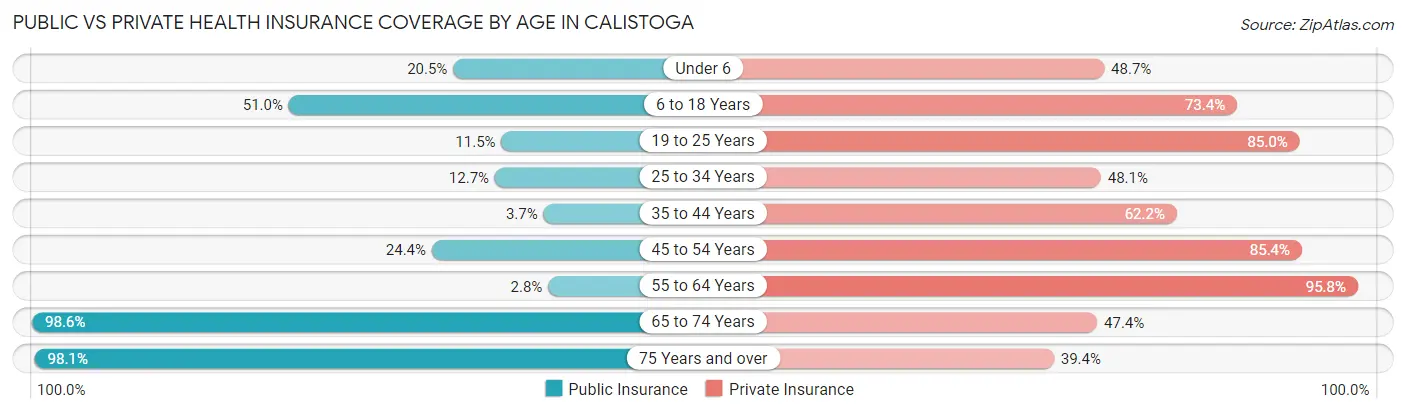
| Age Bracket | Public Insurance | Private Insurance |
| Under 6 | 63 (20.4%) | 150 (48.7%) |
| 6 to 18 Years | 239 (51.0%) | 344 (73.4%) |
| 19 to 25 Years | 36 (11.5%) | 266 (85.0%) |
| 25 to 34 Years | 79 (12.7%) | 299 (48.1%) |
| 35 to 44 Years | 19 (3.7%) | 322 (62.2%) |
| 45 to 54 Years | 259 (24.4%) | 906 (85.4%) |
| 55 to 64 Years | 14 (2.8%) | 476 (95.8%) |
| 65 to 74 Years | 774 (98.6%) | 372 (47.4%) |
| 75 Years and over | 576 (98.1%) | 231 (39.4%) |
| Total | 2,059 (39.9%) | 3,366 (65.2%) |
Disability Status by Sex by Age in Calistoga
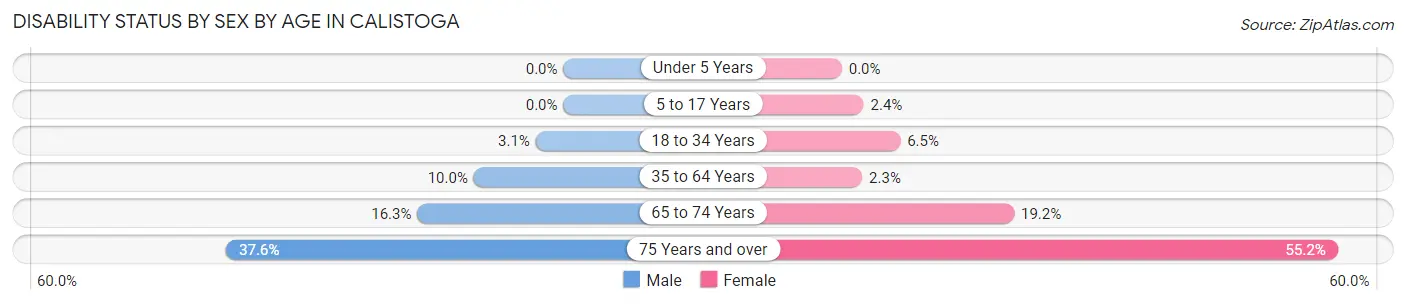
| Age Bracket | Male | Female |
| Under 5 Years | 0 (0.0%) | 0 (0.0%) |
| 5 to 17 Years | 0 (0.0%) | 5 (2.4%) |
| 18 to 34 Years | 21 (3.1%) | 20 (6.5%) |
| 35 to 64 Years | 106 (10.0%) | 23 (2.3%) |
| 65 to 74 Years | 48 (16.3%) | 94 (19.2%) |
| 75 Years and over | 145 (37.6%) | 111 (55.2%) |
Disability Class by Sex by Age in Calistoga
Disability Class: Hearing Difficulty
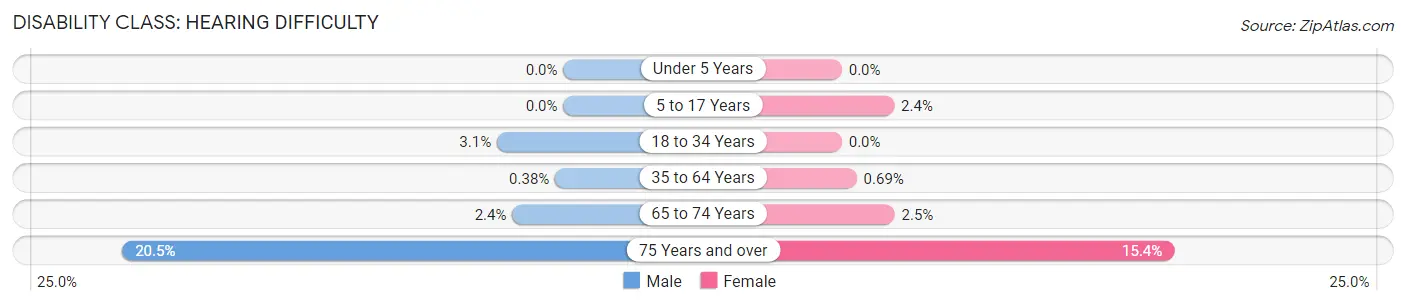
| Age Bracket | Male | Female |
| Under 5 Years | 0 (0.0%) | 0 (0.0%) |
| 5 to 17 Years | 0 (0.0%) | 5 (2.4%) |
| 18 to 34 Years | 21 (3.1%) | 0 (0.0%) |
| 35 to 64 Years | 4 (0.4%) | 7 (0.7%) |
| 65 to 74 Years | 7 (2.4%) | 12 (2.5%) |
| 75 Years and over | 79 (20.5%) | 31 (15.4%) |
Disability Class: Vision Difficulty
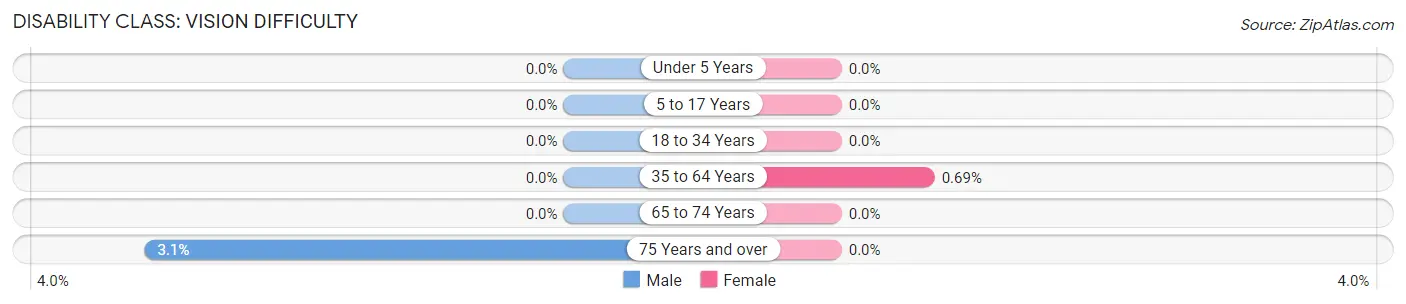
| Age Bracket | Male | Female |
| Under 5 Years | 0 (0.0%) | 0 (0.0%) |
| 5 to 17 Years | 0 (0.0%) | 0 (0.0%) |
| 18 to 34 Years | 0 (0.0%) | 0 (0.0%) |
| 35 to 64 Years | 0 (0.0%) | 7 (0.7%) |
| 65 to 74 Years | 0 (0.0%) | 0 (0.0%) |
| 75 Years and over | 12 (3.1%) | 0 (0.0%) |
Disability Class: Cognitive Difficulty
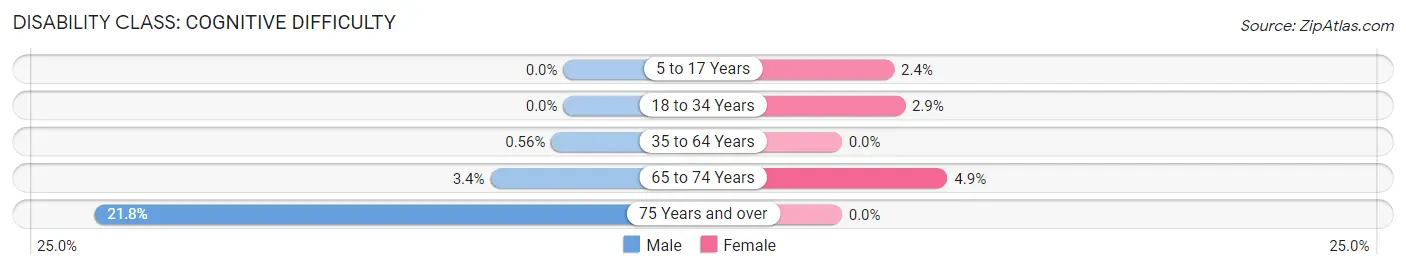
| Age Bracket | Male | Female |
| 5 to 17 Years | 0 (0.0%) | 5 (2.4%) |
| 18 to 34 Years | 0 (0.0%) | 9 (2.9%) |
| 35 to 64 Years | 6 (0.6%) | 0 (0.0%) |
| 65 to 74 Years | 10 (3.4%) | 24 (4.9%) |
| 75 Years and over | 84 (21.8%) | 0 (0.0%) |
Disability Class: Ambulatory Difficulty
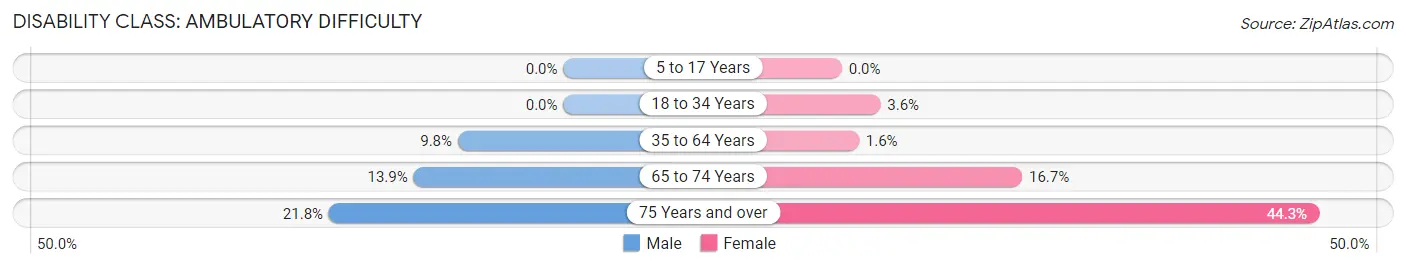
| Age Bracket | Male | Female |
| 5 to 17 Years | 0 (0.0%) | 0 (0.0%) |
| 18 to 34 Years | 0 (0.0%) | 11 (3.6%) |
| 35 to 64 Years | 104 (9.8%) | 16 (1.6%) |
| 65 to 74 Years | 41 (13.9%) | 82 (16.7%) |
| 75 Years and over | 84 (21.8%) | 89 (44.3%) |
Disability Class: Self-Care Difficulty
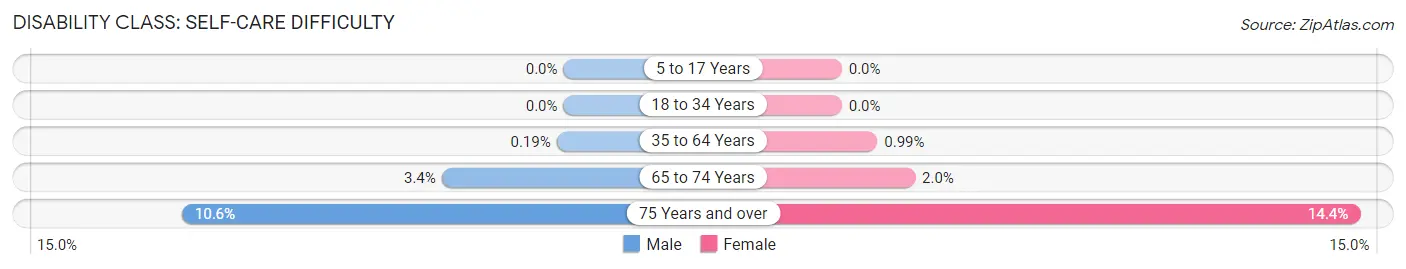
| Age Bracket | Male | Female |
| 5 to 17 Years | 0 (0.0%) | 0 (0.0%) |
| 18 to 34 Years | 0 (0.0%) | 0 (0.0%) |
| 35 to 64 Years | 2 (0.2%) | 10 (1.0%) |
| 65 to 74 Years | 10 (3.4%) | 10 (2.0%) |
| 75 Years and over | 41 (10.6%) | 29 (14.4%) |
Technology Access in Calistoga
Computing Device Access in Calistoga
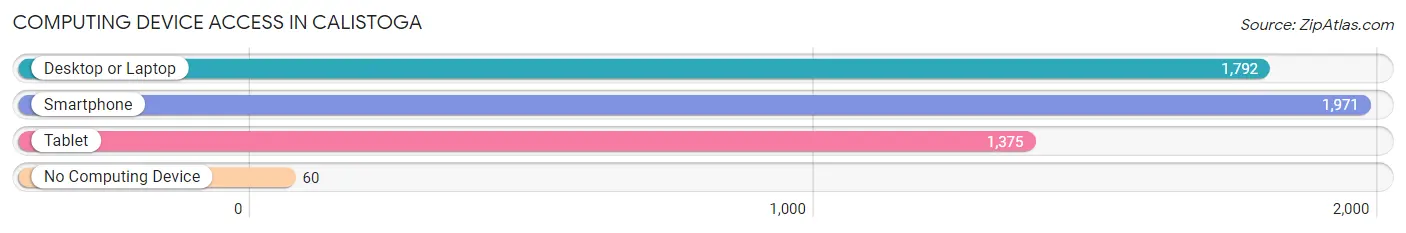
| Device Type | # Households | % Households |
| Desktop or Laptop | 1,792 | 84.7% |
| Smartphone | 1,971 | 93.1% |
| Tablet | 1,375 | 65.0% |
| No Computing Device | 60 | 2.8% |
| Total | 2,116 | 100.0% |
Internet Access in Calistoga
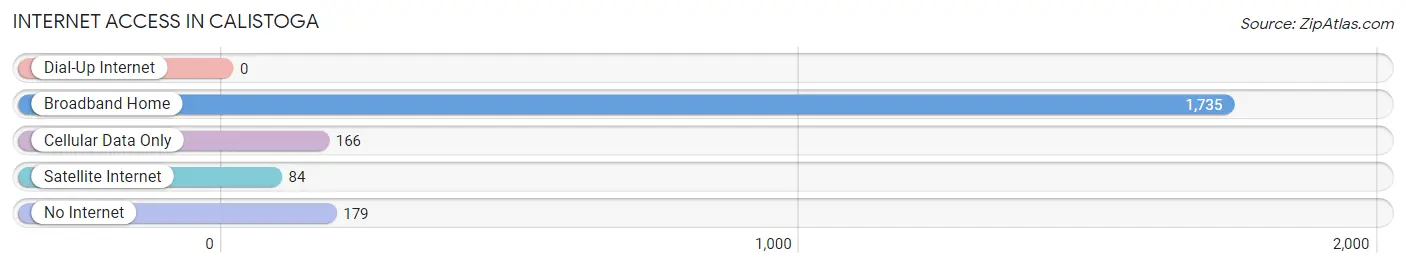
| Internet Type | # Households | % Households |
| Dial-Up Internet | 0 | 0.0% |
| Broadband Home | 1,735 | 82.0% |
| Cellular Data Only | 166 | 7.8% |
| Satellite Internet | 84 | 4.0% |
| No Internet | 179 | 8.5% |
| Total | 2,116 | 100.0% |
Calistoga Summary
Calistoga is a small city located in the northern part of Napa Valley, California. It is known for its hot springs, wineries, and its unique geothermal features. The city has a population of 5,155 as of the 2010 census, and is the smallest incorporated city in Napa County.
History
Calistoga was founded in 1859 by Samuel Brannan, a former Mormon leader. He named the city after the Greek word for “beautiful”, and it quickly became a popular destination for tourists. The city was incorporated in 1886, and the first mayor was elected in 1887.
In the late 19th century, Calistoga was a popular destination for wealthy San Franciscans looking to escape the city. The city was known for its hot springs, which were believed to have healing properties. The city was also home to several resorts, including the Calistoga Hot Springs Hotel, which opened in 1876.
Geography
Calistoga is located in the northern part of Napa Valley, in the foothills of the Mayacamas Mountains. The city is situated at the base of Mount St. Helena, which is the highest peak in the Mayacamas range. The city is surrounded by vineyards and wineries, and is known for its hot springs and geothermal features.
The city has a total area of 2.2 square miles, all of which is land. The city is located at an elevation of 830 feet above sea level.
Economy
Calistoga’s economy is largely based on tourism. The city is known for its hot springs, wineries, and geothermal features. The city is also home to several resorts, including the Calistoga Hot Springs Hotel.
The city is also home to several businesses, including restaurants, retail stores, and art galleries. The city is also home to several wineries, including the Calistoga Cellars, which produces a variety of wines.
Demographics
As of the 2010 census, Calistoga had a population of 5,155. The racial makeup of the city was 79.2% White, 0.7% African American, 0.7% Native American, 0.9% Asian, 0.1% Pacific Islander, 15.2% from other races, and 3.3% from two or more races. Hispanic or Latino of any race were 28.2% of the population.
The median income for a household in the city was $50,945, and the median income for a family was $60,945. The per capita income for the city was $27,945. About 11.2% of families and 14.2% of the population were below the poverty line, including 18.2% of those under age 18 and 8.2% of those age 65 or over.
Common Questions
What is Per Capita Income in Calistoga?
Per Capita income in Calistoga is $61,823.
What is the Median Family Income in Calistoga?
Median Family Income in Calistoga is $106,582.
What is the Median Household income in Calistoga?
Median Household Income in Calistoga is $96,667.
What is Income or Wage Gap in Calistoga?
Income or Wage Gap in Calistoga is 7.8%.
Women in Calistoga earn 92.2 cents for every dollar earned by a man.
What is Inequality or Gini Index in Calistoga?
Inequality or Gini Index in Calistoga is 0.57.
What is the Total Population of Calistoga?
Total Population of Calistoga is 5,191.
What is the Total Male Population of Calistoga?
Total Male Population of Calistoga is 2,825.
What is the Total Female Population of Calistoga?
Total Female Population of Calistoga is 2,366.
What is the Ratio of Males per 100 Females in Calistoga?
There are 119.40 Males per 100 Females in Calistoga.
What is the Ratio of Females per 100 Males in Calistoga?
There are 83.75 Females per 100 Males in Calistoga.
What is the Median Population Age in Calistoga?
Median Population Age in Calistoga is 49.2 Years.
What is the Average Family Size in Calistoga
Average Family Size in Calistoga is 3.1 People.
What is the Average Household Size in Calistoga
Average Household Size in Calistoga is 2.4 People.
How Large is the Labor Force in Calistoga?
There are 2,731 People in the Labor Forcein in Calistoga.
What is the Percentage of People in the Labor Force in Calistoga?
59.6% of People are in the Labor Force in Calistoga.
What is the Unemployment Rate in Calistoga?
Unemployment Rate in Calistoga is 0.6%.