Plano, IL Map & Demographics
Plano Map
Plano Overview
$34,136
PER CAPITA INCOME
$90,166
AVG FAMILY INCOME
$88,018
AVG HOUSEHOLD INCOME
28.9%
WAGE / INCOME GAP [ % ]
71.1¢/ $1
WAGE / INCOME GAP [ $ ]
0.34
INEQUALITY / GINI INDEX
11,113
TOTAL POPULATION
5,592
MALE POPULATION
5,521
FEMALE POPULATION
101.29
MALES / 100 FEMALES
98.73
FEMALES / 100 MALES
34.6
MEDIAN AGE
3.6
AVG FAMILY SIZE
2.9
AVG HOUSEHOLD SIZE
6,967
LABOR FORCE [ PEOPLE ]
80.0%
PERCENT IN LABOR FORCE
8.8%
UNEMPLOYMENT RATE
Plano Zip Codes
Plano Area Codes
Income in Plano
Income Overview in Plano
Per Capita Income in Plano is $34,136, while median incomes of families and households are $90,166 and $88,018 respectively.
| Characteristic | Number | Measure |
| Per Capita Income | 11,113 | $34,136 |
| Median Family Income | 2,473 | $90,166 |
| Mean Family Income | 2,473 | $103,469 |
| Median Household Income | 3,829 | $88,018 |
| Mean Household Income | 3,829 | $94,762 |
| Income Deficit | 2,473 | $0 |
| Wage / Income Gap (%) | 11,113 | 28.91% |
| Wage / Income Gap ($) | 11,113 | 71.09¢ per $1 |
| Gini / Inequality Index | 11,113 | 0.34 |
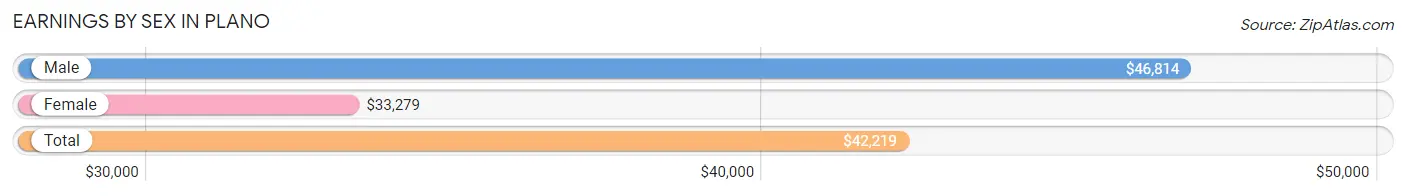
Earnings by Sex in Plano
Average Earnings in Plano are $42,219, $46,814 for men and $33,279 for women, a difference of 28.9%.
| Sex | Number | Average Earnings |
| Male | 3,699 (53.0%) | $46,814 |
| Female | 3,276 (47.0%) | $33,279 |
| Total | 6,975 (100.0%) | $42,219 |
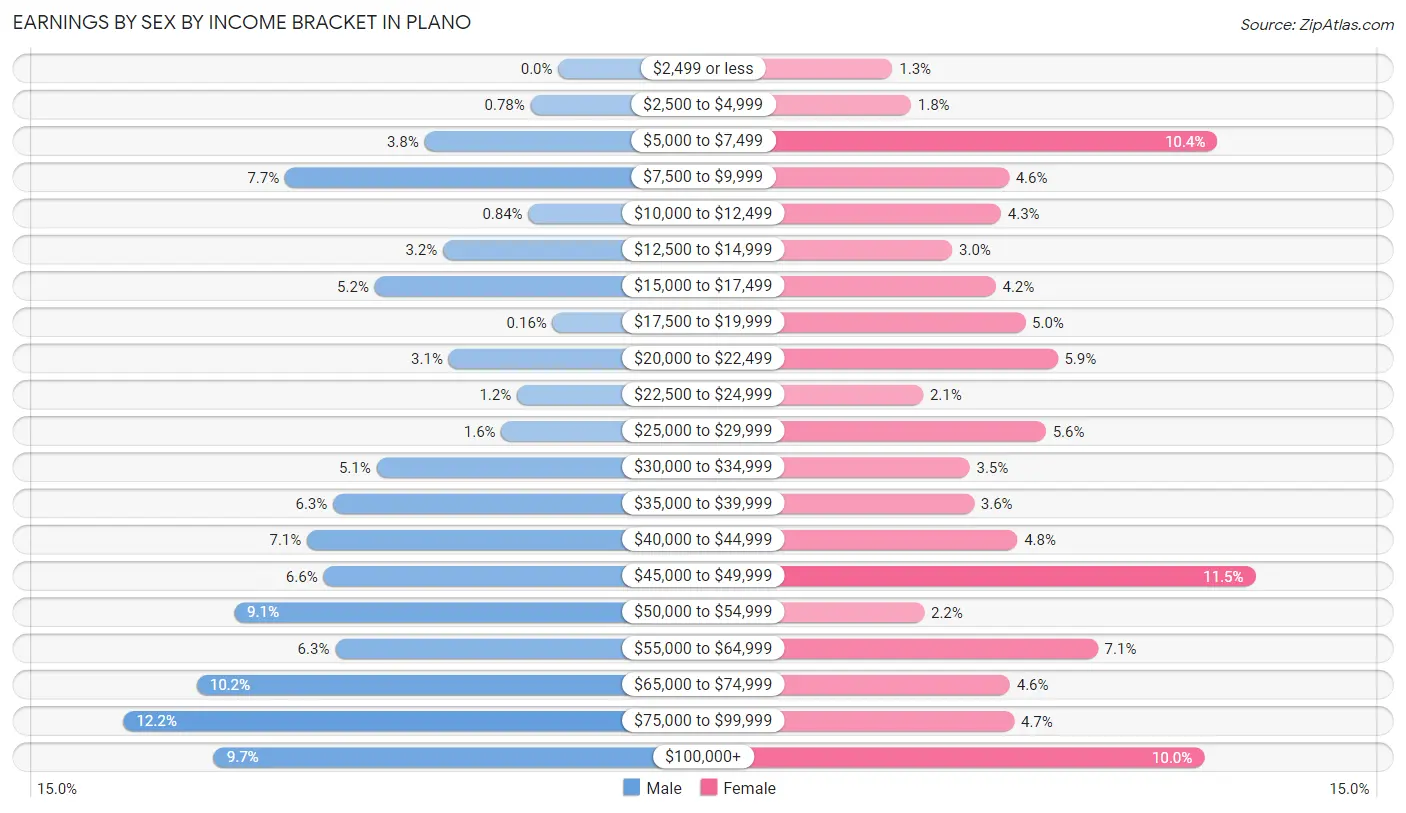
Earnings by Sex by Income Bracket in Plano
The most common earnings brackets in Plano are $75,000 to $99,999 for men (452 | 12.2%) and $45,000 to $49,999 for women (376 | 11.5%).
| Income | Male | Female |
| $2,499 or less | 0 (0.0%) | 42 (1.3%) |
| $2,500 to $4,999 | 29 (0.8%) | 59 (1.8%) |
| $5,000 to $7,499 | 139 (3.8%) | 341 (10.4%) |
| $7,500 to $9,999 | 284 (7.7%) | 149 (4.5%) |
| $10,000 to $12,499 | 31 (0.8%) | 142 (4.3%) |
| $12,500 to $14,999 | 120 (3.2%) | 97 (3.0%) |
| $15,000 to $17,499 | 191 (5.2%) | 137 (4.2%) |
| $17,500 to $19,999 | 6 (0.2%) | 164 (5.0%) |
| $20,000 to $22,499 | 114 (3.1%) | 194 (5.9%) |
| $22,500 to $24,999 | 43 (1.2%) | 70 (2.1%) |
| $25,000 to $29,999 | 59 (1.6%) | 183 (5.6%) |
| $30,000 to $34,999 | 189 (5.1%) | 113 (3.5%) |
| $35,000 to $39,999 | 234 (6.3%) | 117 (3.6%) |
| $40,000 to $44,999 | 261 (7.1%) | 157 (4.8%) |
| $45,000 to $49,999 | 244 (6.6%) | 376 (11.5%) |
| $50,000 to $54,999 | 337 (9.1%) | 71 (2.2%) |
| $55,000 to $64,999 | 232 (6.3%) | 231 (7.0%) |
| $65,000 to $74,999 | 376 (10.2%) | 150 (4.6%) |
| $75,000 to $99,999 | 452 (12.2%) | 154 (4.7%) |
| $100,000+ | 358 (9.7%) | 329 (10.0%) |
| Total | 3,699 (100.0%) | 3,276 (100.0%) |
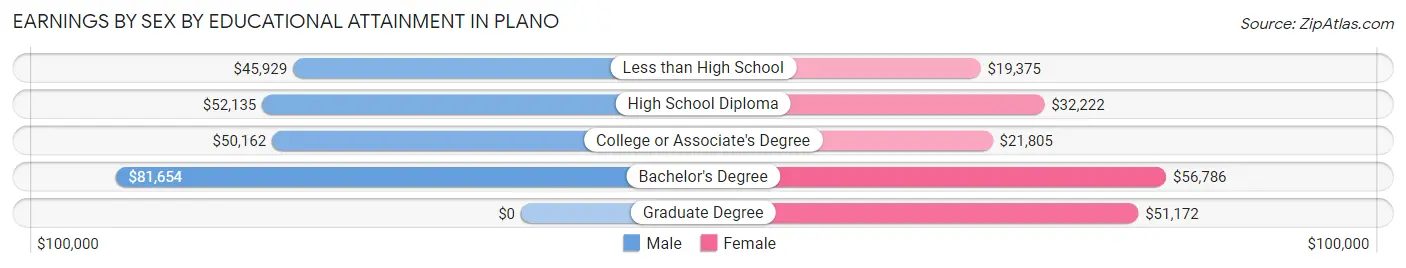
Earnings by Sex by Educational Attainment in Plano
Average earnings in Plano are $51,436 for men and $41,149 for women, a difference of 20.0%. Men with an educational attainment of bachelor's degree enjoy the highest average annual earnings of $81,654, while those with less than high school education earn the least with $45,929. Women with an educational attainment of bachelor's degree earn the most with the average annual earnings of $56,786, while those with less than high school education have the smallest earnings of $19,375.
| Educational Attainment | Male Income | Female Income |
| Less than High School | $45,929 | $19,375 |
| High School Diploma | $52,135 | $32,222 |
| College or Associate's Degree | $50,162 | $21,805 |
| Bachelor's Degree | $81,654 | $56,786 |
| Graduate Degree | - | - |
| Total | $51,436 | $41,149 |
Family Income in Plano
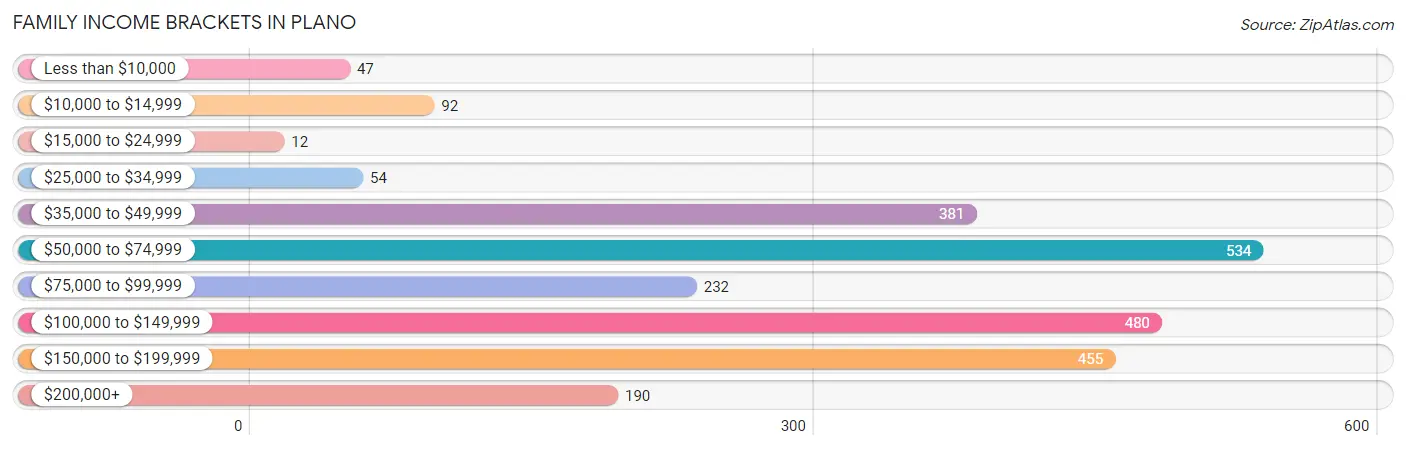
Family Income Brackets in Plano
According to the Plano family income data, there are 534 families falling into the $50,000 to $74,999 income range, which is the most common income bracket and makes up 21.6% of all families. Conversely, the $15,000 to $24,999 income bracket is the least frequent group with only 12 families (0.5%) belonging to this category.
| Income Bracket | # Families | % Families |
| Less than $10,000 | 47 | 1.9% |
| $10,000 to $14,999 | 92 | 3.7% |
| $15,000 to $24,999 | 12 | 0.5% |
| $25,000 to $34,999 | 54 | 2.2% |
| $35,000 to $49,999 | 381 | 15.4% |
| $50,000 to $74,999 | 534 | 21.6% |
| $75,000 to $99,999 | 232 | 9.4% |
| $100,000 to $149,999 | 480 | 19.4% |
| $150,000 to $199,999 | 455 | 18.4% |
| $200,000+ | 190 | 7.7% |
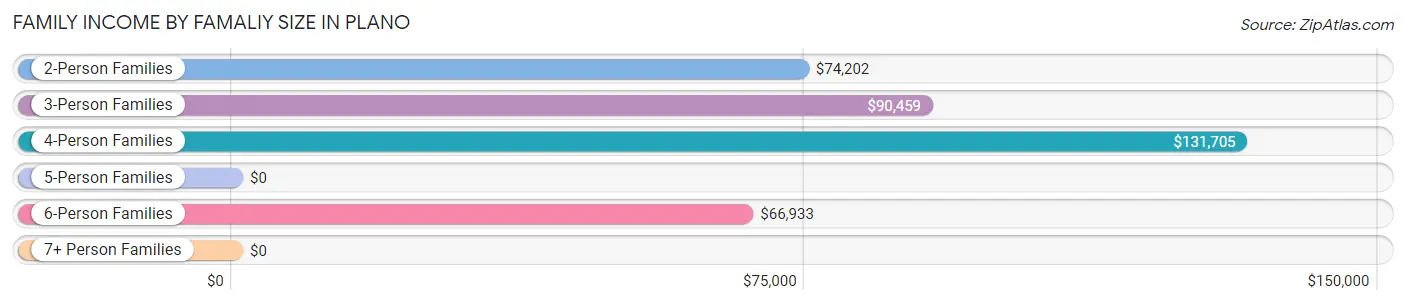
Family Income by Famaliy Size in Plano
4-person families (571 | 23.1%) account for the highest median family income in Plano with $131,705 per family, while 2-person families (812 | 32.8%) have the highest median income of $37,101 per family member.
| Income Bracket | # Families | Median Income |
| 2-Person Families | 812 (32.8%) | $74,202 |
| 3-Person Families | 726 (29.4%) | $90,459 |
| 4-Person Families | 571 (23.1%) | $131,705 |
| 5-Person Families | 18 (0.7%) | $0 |
| 6-Person Families | 218 (8.8%) | $66,933 |
| 7+ Person Families | 128 (5.2%) | $0 |
| Total | 2,473 (100.0%) | $90,166 |
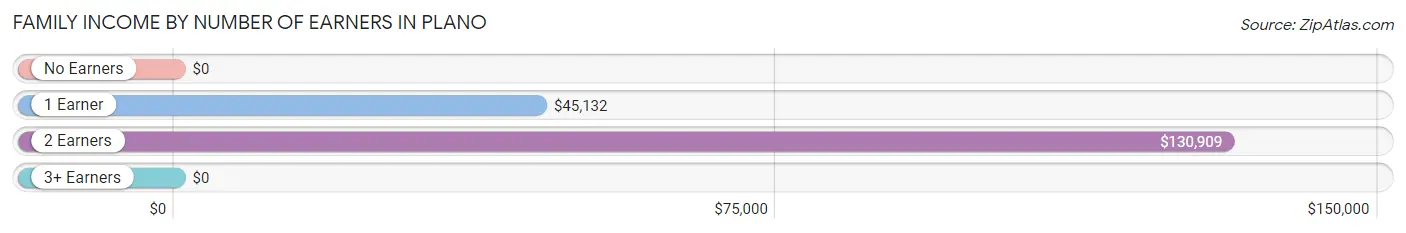
Family Income by Number of Earners in Plano
| Number of Earners | # Families | Median Income |
| No Earners | 183 (7.4%) | $0 |
| 1 Earner | 524 (21.2%) | $45,132 |
| 2 Earners | 930 (37.6%) | $130,909 |
| 3+ Earners | 836 (33.8%) | $0 |
| Total | 2,473 (100.0%) | $90,166 |
Household Income in Plano
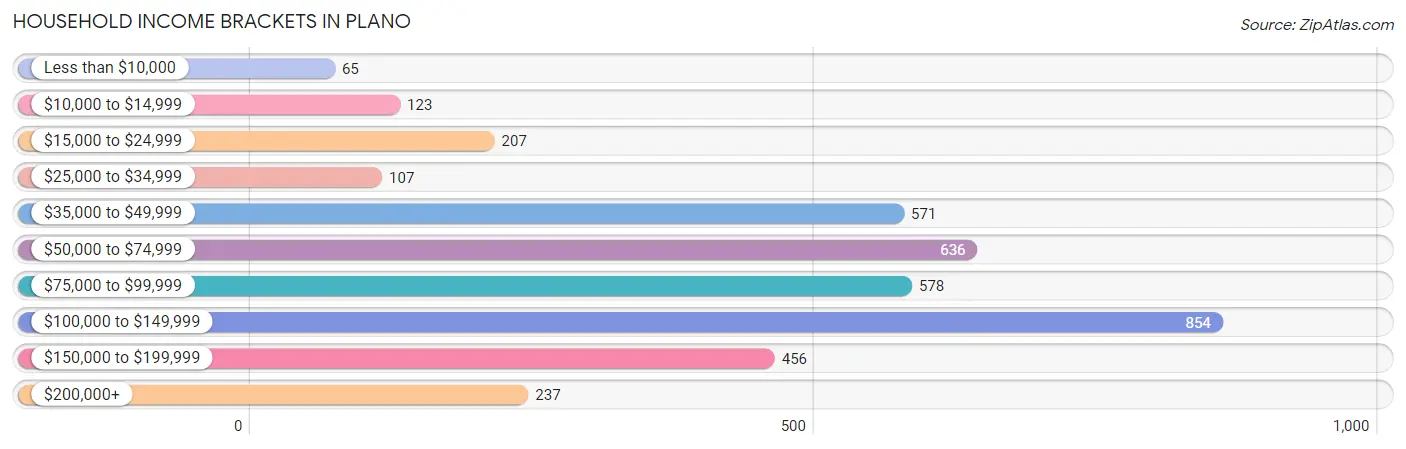
Household Income Brackets in Plano
With 854 households falling in the category, the $100,000 to $149,999 income range is the most frequent in Plano, accounting for 22.3% of all households. In contrast, only 65 households (1.7%) fall into the less than $10,000 income bracket, making it the least populous group.
| Income Bracket | # Households | % Households |
| Less than $10,000 | 65 | 1.7% |
| $10,000 to $14,999 | 123 | 3.2% |
| $15,000 to $24,999 | 207 | 5.4% |
| $25,000 to $34,999 | 107 | 2.8% |
| $35,000 to $49,999 | 571 | 14.9% |
| $50,000 to $74,999 | 636 | 16.6% |
| $75,000 to $99,999 | 578 | 15.1% |
| $100,000 to $149,999 | 854 | 22.3% |
| $150,000 to $199,999 | 456 | 11.9% |
| $200,000+ | 237 | 6.2% |
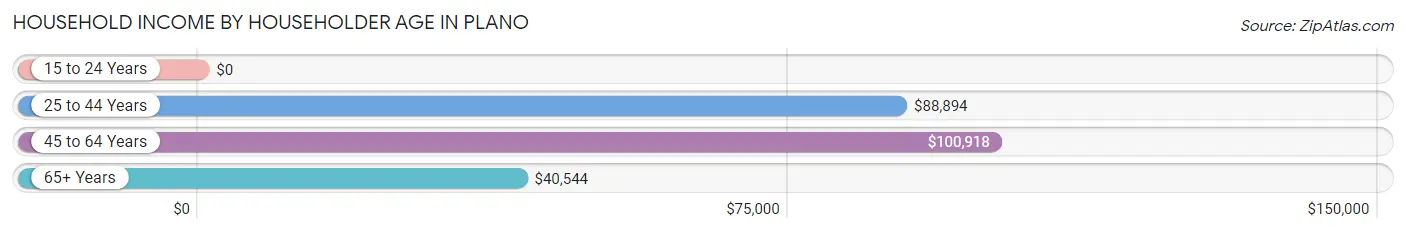
Household Income by Householder Age in Plano
The median household income in Plano is $88,018, with the highest median household income of $100,918 found in the 45 to 64 years age bracket for the primary householder. A total of 1,759 households (45.9%) fall into this category.
| Income Bracket | # Households | Median Income |
| 15 to 24 Years | 0 (0.0%) | $0 |
| 25 to 44 Years | 1,375 (35.9%) | $88,894 |
| 45 to 64 Years | 1,759 (45.9%) | $100,918 |
| 65+ Years | 695 (18.1%) | $40,544 |
| Total | 3,829 (100.0%) | $88,018 |
Poverty in Plano
Income Below Poverty by Sex and Age in Plano
With 5.6% poverty level for males and 11.7% for females among the residents of Plano, 15 year old males and 18 to 24 year old females are the most vulnerable to poverty, with 42 males (61.8%) and 154 females (39.9%) in their respective age groups living below the poverty level.
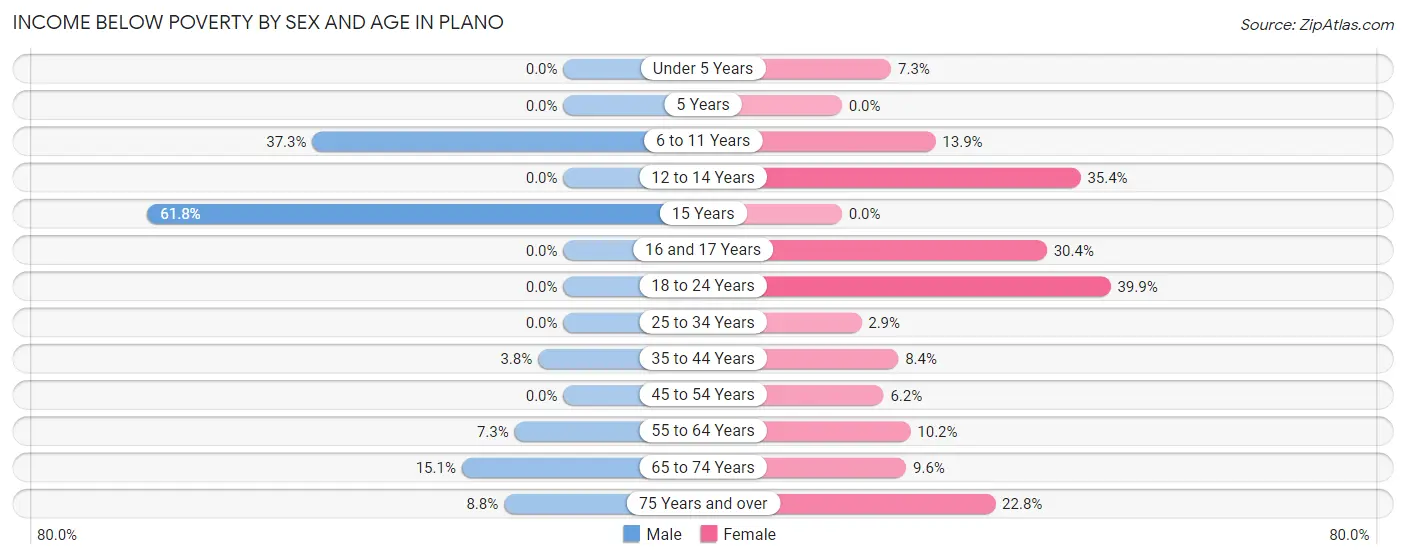
| Age Bracket | Male | Female |
| Under 5 Years | 0 (0.0%) | 36 (7.3%) |
| 5 Years | 0 (0.0%) | 0 (0.0%) |
| 6 to 11 Years | 148 (37.3%) | 82 (13.9%) |
| 12 to 14 Years | 0 (0.0%) | 56 (35.4%) |
| 15 Years | 42 (61.8%) | 0 (0.0%) |
| 16 and 17 Years | 0 (0.0%) | 42 (30.4%) |
| 18 to 24 Years | 0 (0.0%) | 154 (39.9%) |
| 25 to 34 Years | 0 (0.0%) | 24 (2.9%) |
| 35 to 44 Years | 37 (3.7%) | 68 (8.4%) |
| 45 to 54 Years | 0 (0.0%) | 53 (6.2%) |
| 55 to 64 Years | 29 (7.2%) | 72 (10.2%) |
| 65 to 74 Years | 40 (15.1%) | 36 (9.6%) |
| 75 Years and over | 19 (8.8%) | 23 (22.8%) |
| Total | 315 (5.6%) | 646 (11.7%) |
Income Above Poverty by Sex and Age in Plano
According to the poverty statistics in Plano, males aged under 5 years and females aged 5 years are the age groups that are most secure financially, with 100.0% of males and 100.0% of females in these age groups living above the poverty line.
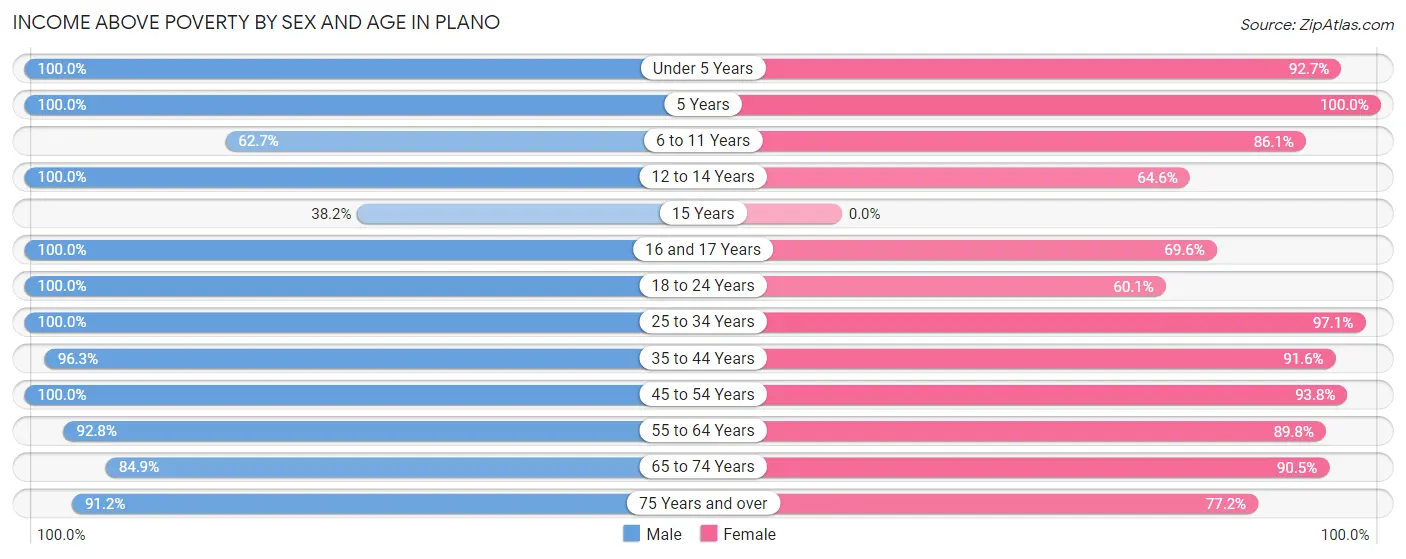
| Age Bracket | Male | Female |
| Under 5 Years | 241 (100.0%) | 456 (92.7%) |
| 5 Years | 351 (100.0%) | 75 (100.0%) |
| 6 to 11 Years | 249 (62.7%) | 508 (86.1%) |
| 12 to 14 Years | 32 (100.0%) | 102 (64.6%) |
| 15 Years | 26 (38.2%) | 0 (0.0%) |
| 16 and 17 Years | 45 (100.0%) | 96 (69.6%) |
| 18 to 24 Years | 591 (100.0%) | 232 (60.1%) |
| 25 to 34 Years | 1,213 (100.0%) | 806 (97.1%) |
| 35 to 44 Years | 950 (96.3%) | 743 (91.6%) |
| 45 to 54 Years | 786 (100.0%) | 803 (93.8%) |
| 55 to 64 Years | 371 (92.7%) | 635 (89.8%) |
| 65 to 74 Years | 225 (84.9%) | 341 (90.4%) |
| 75 Years and over | 197 (91.2%) | 78 (77.2%) |
| Total | 5,277 (94.4%) | 4,875 (88.3%) |
Income Below Poverty Among Married-Couple Families in Plano
The poverty statistics for married-couple families in Plano show that 2.3% or 32 of the total 1,398 families live below the poverty line. Families with no children have the highest poverty rate of 4.1%, comprising of 32 families. On the other hand, families with 1 or 2 children have the lowest poverty rate of 0.0%, which includes 0 families.
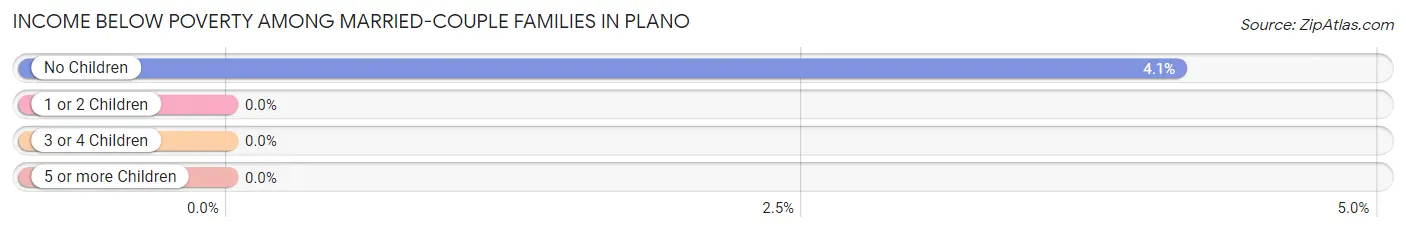
| Children | Above Poverty | Below Poverty |
| No Children | 743 (95.9%) | 32 (4.1%) |
| 1 or 2 Children | 556 (100.0%) | 0 (0.0%) |
| 3 or 4 Children | 67 (100.0%) | 0 (0.0%) |
| 5 or more Children | 0 (0.0%) | 0 (0.0%) |
| Total | 1,366 (97.7%) | 32 (2.3%) |
Income Below Poverty Among Single-Parent Households in Plano
According to the poverty data in Plano, 11.2% or 37 single-father households and 10.7% or 80 single-mother households are living below the poverty line. Among single-father households, those with 1 or 2 children have the highest poverty rate, with 37 households (21.1%) experiencing poverty. Likewise, among single-mother households, those with 3 or 4 children have the highest poverty rate, with 68 households (32.5%) falling below the poverty line.
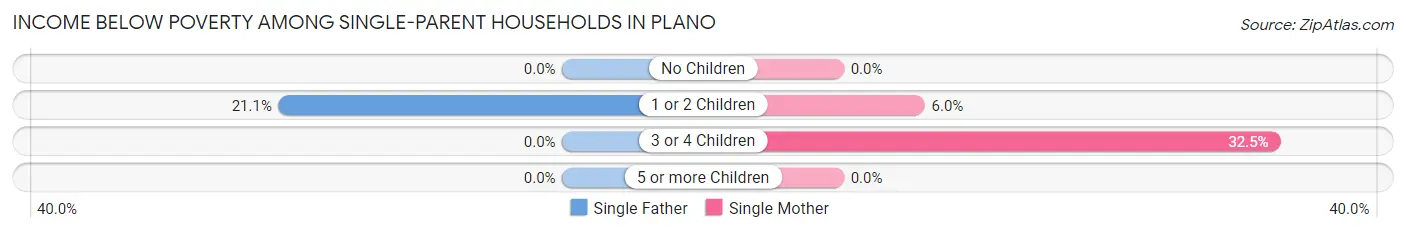
| Children | Single Father | Single Mother |
| No Children | 0 (0.0%) | 0 (0.0%) |
| 1 or 2 Children | 37 (21.1%) | 12 (6.0%) |
| 3 or 4 Children | 0 (0.0%) | 68 (32.5%) |
| 5 or more Children | 0 (0.0%) | 0 (0.0%) |
| Total | 37 (11.2%) | 80 (10.7%) |
Income Below Poverty Among Married-Couple vs Single-Parent Households in Plano
The poverty data for Plano shows that 32 of the married-couple family households (2.3%) and 117 of the single-parent households (10.9%) are living below the poverty level. Within the married-couple family households, those with no children have the highest poverty rate, with 32 households (4.1%) falling below the poverty line. Among the single-parent households, those with 3 or 4 children have the highest poverty rate, with 68 household (32.5%) living below poverty.
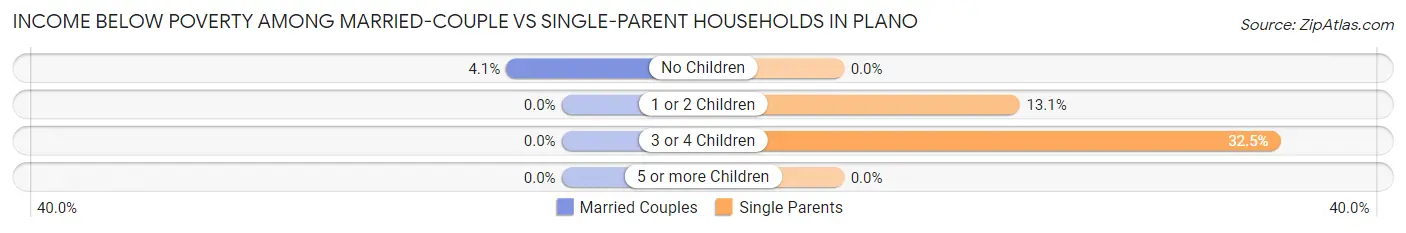
| Children | Married-Couple Families | Single-Parent Households |
| No Children | 32 (4.1%) | 0 (0.0%) |
| 1 or 2 Children | 0 (0.0%) | 49 (13.1%) |
| 3 or 4 Children | 0 (0.0%) | 68 (32.5%) |
| 5 or more Children | 0 (0.0%) | 0 (0.0%) |
| Total | 32 (2.3%) | 117 (10.9%) |
Race in Plano
The most populous races in Plano are White / Caucasian (7,805 | 70.2%), Hispanic or Latino (4,197 | 37.8%), and Some other Race (1,435 | 12.9%).
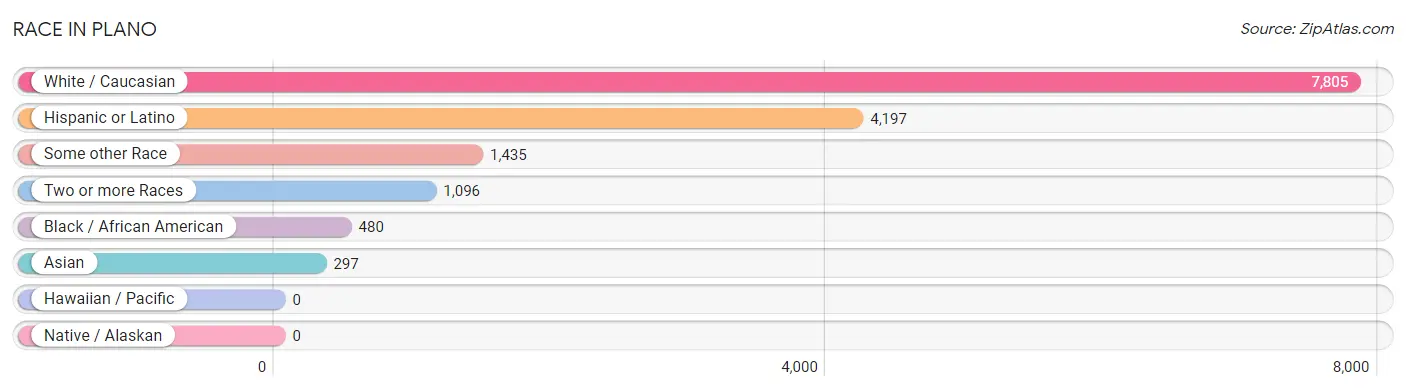
| Race | # Population | % Population |
| Asian | 297 | 2.7% |
| Black / African American | 480 | 4.3% |
| Hawaiian / Pacific | 0 | 0.0% |
| Hispanic or Latino | 4,197 | 37.8% |
| Native / Alaskan | 0 | 0.0% |
| White / Caucasian | 7,805 | 70.2% |
| Two or more Races | 1,096 | 9.9% |
| Some other Race | 1,435 | 12.9% |
| Total | 11,113 | 100.0% |
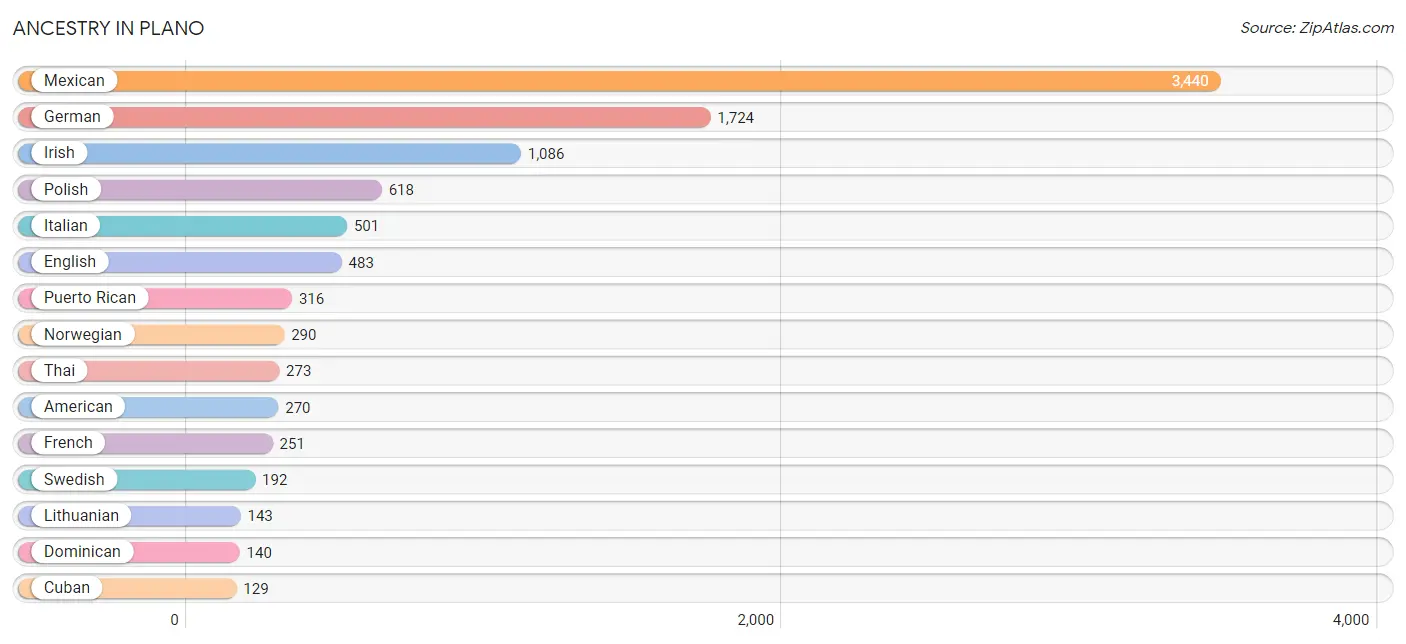
Ancestry in Plano
The most populous ancestries reported in Plano are Mexican (3,440 | 30.9%), German (1,724 | 15.5%), Irish (1,086 | 9.8%), Polish (618 | 5.6%), and Italian (501 | 4.5%), together accounting for 66.3% of all Plano residents.
| Ancestry | # Population | % Population |
| American | 270 | 2.4% |
| Argentinean | 33 | 0.3% |
| Austrian | 28 | 0.3% |
| British | 64 | 0.6% |
| Bulgarian | 40 | 0.4% |
| Burmese | 74 | 0.7% |
| Cambodian | 6 | 0.1% |
| Canadian | 14 | 0.1% |
| Cherokee | 48 | 0.4% |
| Choctaw | 40 | 0.4% |
| Cuban | 129 | 1.2% |
| Czech | 76 | 0.7% |
| Danish | 40 | 0.4% |
| Dominican | 140 | 1.3% |
| Dutch | 94 | 0.9% |
| English | 483 | 4.3% |
| European | 37 | 0.3% |
| French | 251 | 2.3% |
| French Canadian | 20 | 0.2% |
| German | 1,724 | 15.5% |
| Indian (Asian) | 48 | 0.4% |
| Irish | 1,086 | 9.8% |
| Italian | 501 | 4.5% |
| Lithuanian | 143 | 1.3% |
| Mexican | 3,440 | 30.9% |
| Norwegian | 290 | 2.6% |
| Polish | 618 | 5.6% |
| Puerto Rican | 316 | 2.8% |
| Russian | 9 | 0.1% |
| Scandinavian | 64 | 0.6% |
| Scottish | 27 | 0.2% |
| Slavic | 120 | 1.1% |
| Slovene | 51 | 0.5% |
| South American | 33 | 0.3% |
| Spanish | 120 | 1.1% |
| Swedish | 192 | 1.7% |
| Thai | 273 | 2.5% |
| Ukrainian | 19 | 0.2% | View All 38 Rows |
Immigrants in Plano
The most numerous immigrant groups reported in Plano came from Central America (938 | 8.4%), Latin America (938 | 8.4%), Mexico (938 | 8.4%), Europe (261 | 2.4%), and France (177 | 1.6%), together accounting for 29.3% of all Plano residents.
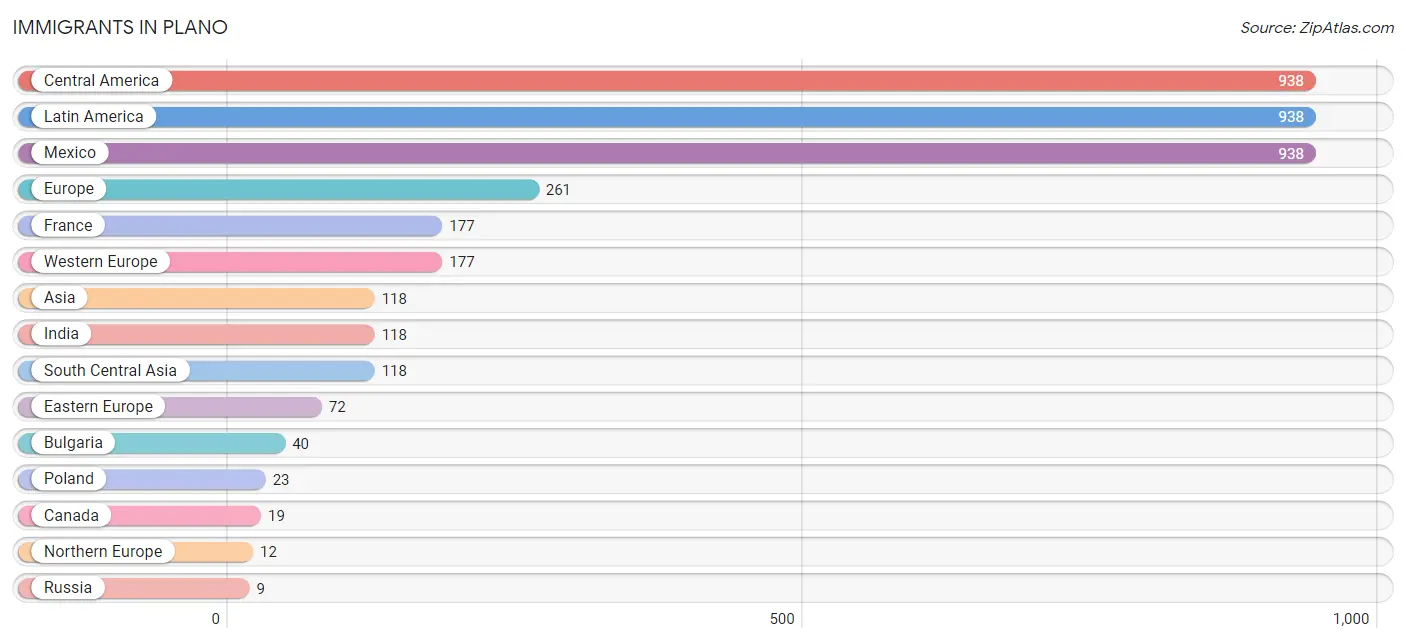
| Immigration Origin | # Population | % Population |
| Asia | 118 | 1.1% |
| Bulgaria | 40 | 0.4% |
| Canada | 19 | 0.2% |
| Central America | 938 | 8.4% |
| Eastern Europe | 72 | 0.6% |
| Europe | 261 | 2.4% |
| France | 177 | 1.6% |
| India | 118 | 1.1% |
| Latin America | 938 | 8.4% |
| Mexico | 938 | 8.4% |
| Northern Europe | 12 | 0.1% |
| Poland | 23 | 0.2% |
| Russia | 9 | 0.1% |
| South Central Asia | 118 | 1.1% |
| Western Europe | 177 | 1.6% | View All 15 Rows |
Sex and Age in Plano
Sex and Age in Plano
The most populous age groups in Plano are 30 to 34 Years (661 | 11.8%) for men and 5 to 9 Years (627 | 11.4%) for women.
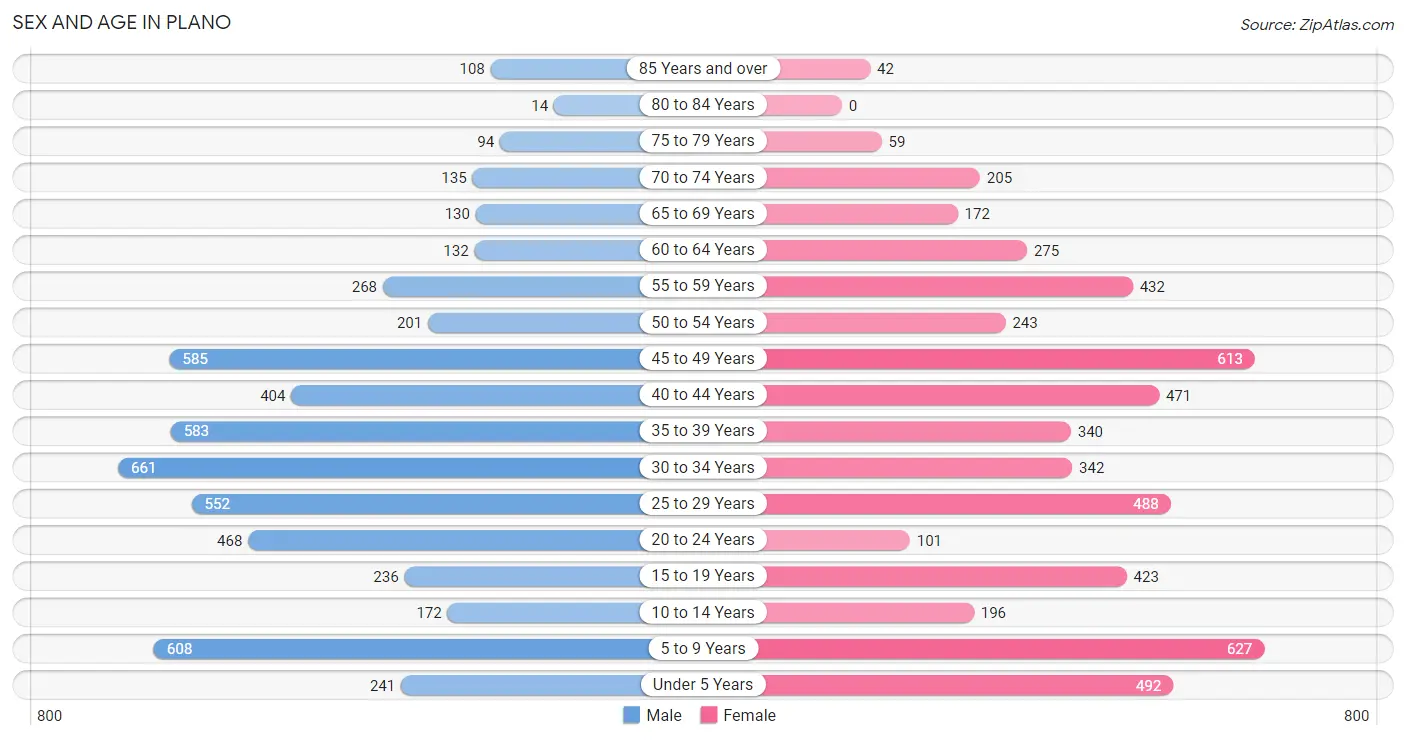
| Age Bracket | Male | Female |
| Under 5 Years | 241 (4.3%) | 492 (8.9%) |
| 5 to 9 Years | 608 (10.9%) | 627 (11.4%) |
| 10 to 14 Years | 172 (3.1%) | 196 (3.5%) |
| 15 to 19 Years | 236 (4.2%) | 423 (7.7%) |
| 20 to 24 Years | 468 (8.4%) | 101 (1.8%) |
| 25 to 29 Years | 552 (9.9%) | 488 (8.8%) |
| 30 to 34 Years | 661 (11.8%) | 342 (6.2%) |
| 35 to 39 Years | 583 (10.4%) | 340 (6.2%) |
| 40 to 44 Years | 404 (7.2%) | 471 (8.5%) |
| 45 to 49 Years | 585 (10.5%) | 613 (11.1%) |
| 50 to 54 Years | 201 (3.6%) | 243 (4.4%) |
| 55 to 59 Years | 268 (4.8%) | 432 (7.8%) |
| 60 to 64 Years | 132 (2.4%) | 275 (5.0%) |
| 65 to 69 Years | 130 (2.3%) | 172 (3.1%) |
| 70 to 74 Years | 135 (2.4%) | 205 (3.7%) |
| 75 to 79 Years | 94 (1.7%) | 59 (1.1%) |
| 80 to 84 Years | 14 (0.3%) | 0 (0.0%) |
| 85 Years and over | 108 (1.9%) | 42 (0.8%) |
| Total | 5,592 (100.0%) | 5,521 (100.0%) |
Families and Households in Plano
Median Family Size in Plano
The median family size in Plano is 3.61 persons per family, with single female/mother families (745 | 30.1%) accounting for the largest median family size of 3.75 persons per family. On the other hand, single male/father families (330 | 13.3%) represent the smallest median family size with 3.35 persons per family.
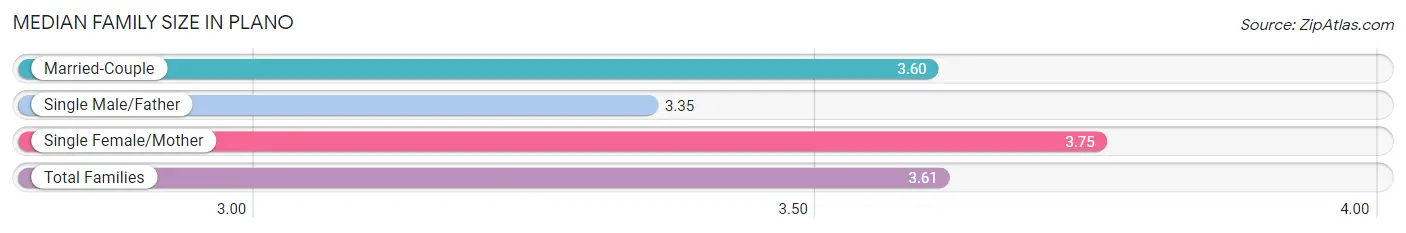
| Family Type | # Families | Family Size |
| Married-Couple | 1,398 (56.5%) | 3.60 |
| Single Male/Father | 330 (13.3%) | 3.35 |
| Single Female/Mother | 745 (30.1%) | 3.75 |
| Total Families | 2,473 (100.0%) | 3.61 |
Median Household Size in Plano
The median household size in Plano is 2.90 persons per household, with single female/mother households (745 | 19.5%) accounting for the largest median household size of 4.22 persons per household. non-family households (1,356 | 35.4%) represent the smallest median household size with 1.12 persons per household.
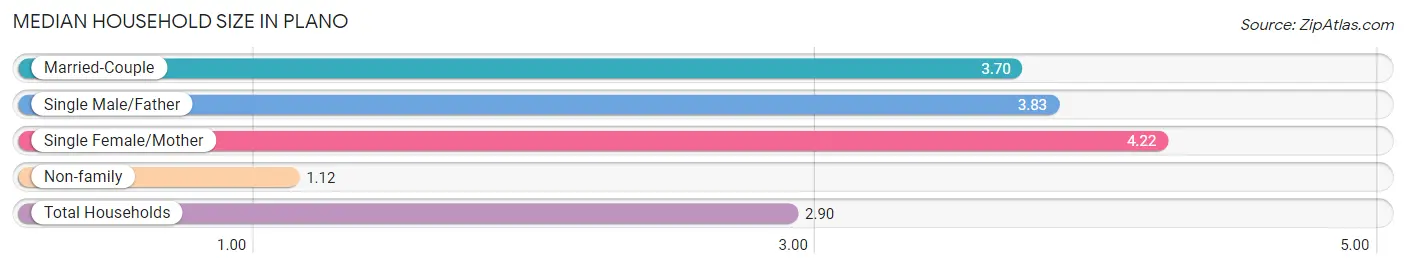
| Household Type | # Households | Household Size |
| Married-Couple | 1,398 (36.5%) | 3.70 |
| Single Male/Father | 330 (8.6%) | 3.83 |
| Single Female/Mother | 745 (19.5%) | 4.22 |
| Non-family | 1,356 (35.4%) | 1.12 |
| Total Households | 3,829 (100.0%) | 2.90 |
Household Size by Marriage Status in Plano
Out of a total of 3,829 households in Plano, 2,473 (64.6%) are family households, while 1,356 (35.4%) are nonfamily households. The most numerous type of family households are 4-person households, comprising 815, and the most common type of nonfamily households are 1-person households, comprising 1,239.
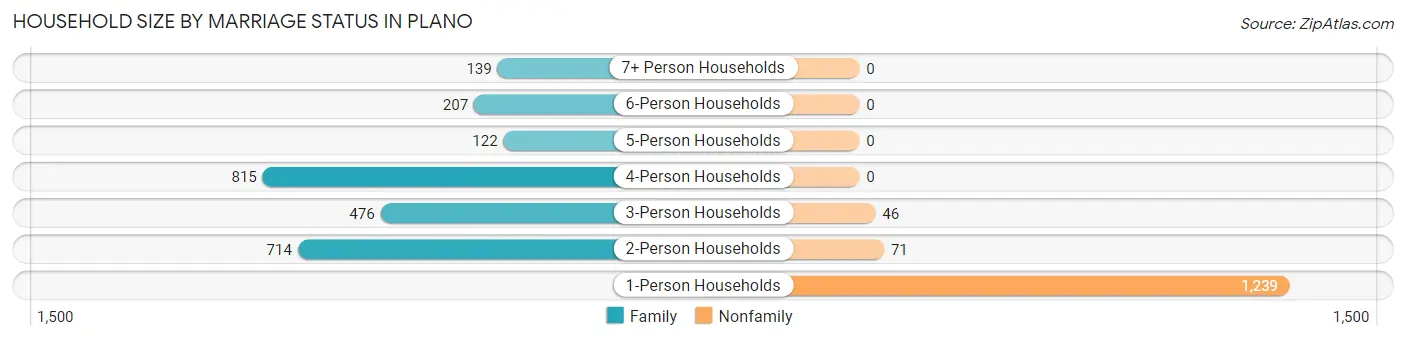
| Household Size | Family Households | Nonfamily Households |
| 1-Person Households | - | 1,239 (32.4%) |
| 2-Person Households | 714 (18.6%) | 71 (1.8%) |
| 3-Person Households | 476 (12.4%) | 46 (1.2%) |
| 4-Person Households | 815 (21.3%) | 0 (0.0%) |
| 5-Person Households | 122 (3.2%) | 0 (0.0%) |
| 6-Person Households | 207 (5.4%) | 0 (0.0%) |
| 7+ Person Households | 139 (3.6%) | 0 (0.0%) |
| Total | 2,473 (64.6%) | 1,356 (35.4%) |
Female Fertility in Plano
Fertility by Age in Plano
Average fertility rate in Plano is 64.0 births per 1,000 women. Women in the age bracket of 20 to 34 years have the highest fertility rate with 190.0 births per 1,000 women. Women in the age bracket of 20 to 34 years acount for 100.0% of all women with births.
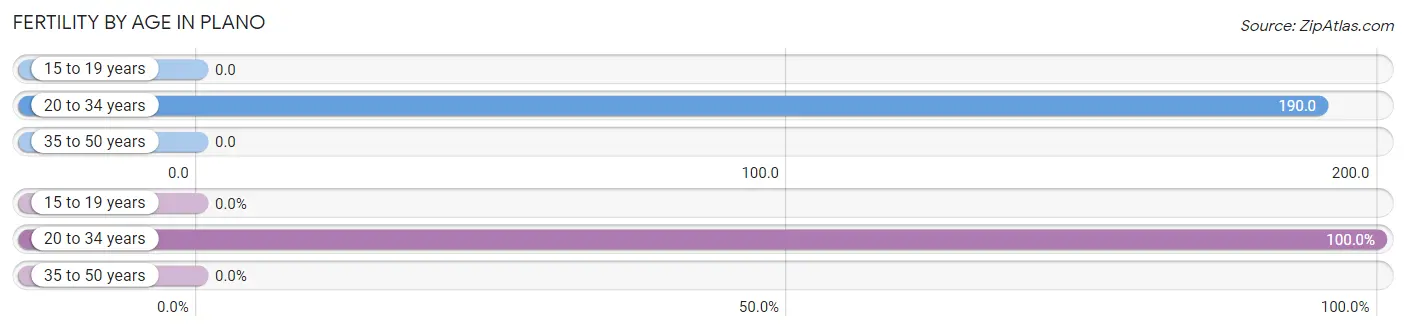
| Age Bracket | Women with Births | Births / 1,000 Women |
| 15 to 19 years | 0 (0.0%) | 0.0 |
| 20 to 34 years | 177 (100.0%) | 190.0 |
| 35 to 50 years | 0 (0.0%) | 0.0 |
| Total | 177 (100.0%) | 64.0 |
Fertility by Age by Marriage Status in Plano
93.2% of women with births (177) in Plano are married. The highest percentage of unmarried women with births falls into 20 to 34 years age bracket with 6.8% of them unmarried at the time of birth, while the lowest percentage of unmarried women with births belong to 20 to 34 years age bracket with 6.8% of them unmarried.
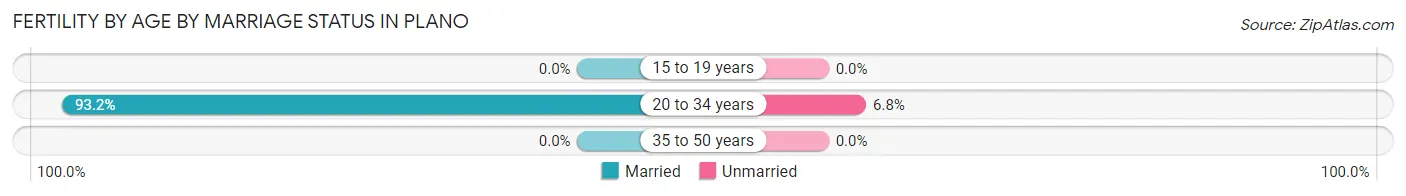
| Age Bracket | Married | Unmarried |
| 15 to 19 years | 0 (0.0%) | 0 (0.0%) |
| 20 to 34 years | 165 (93.2%) | 12 (6.8%) |
| 35 to 50 years | 0 (0.0%) | 0 (0.0%) |
| Total | 165 (93.2%) | 12 (6.8%) |
Fertility by Education in Plano
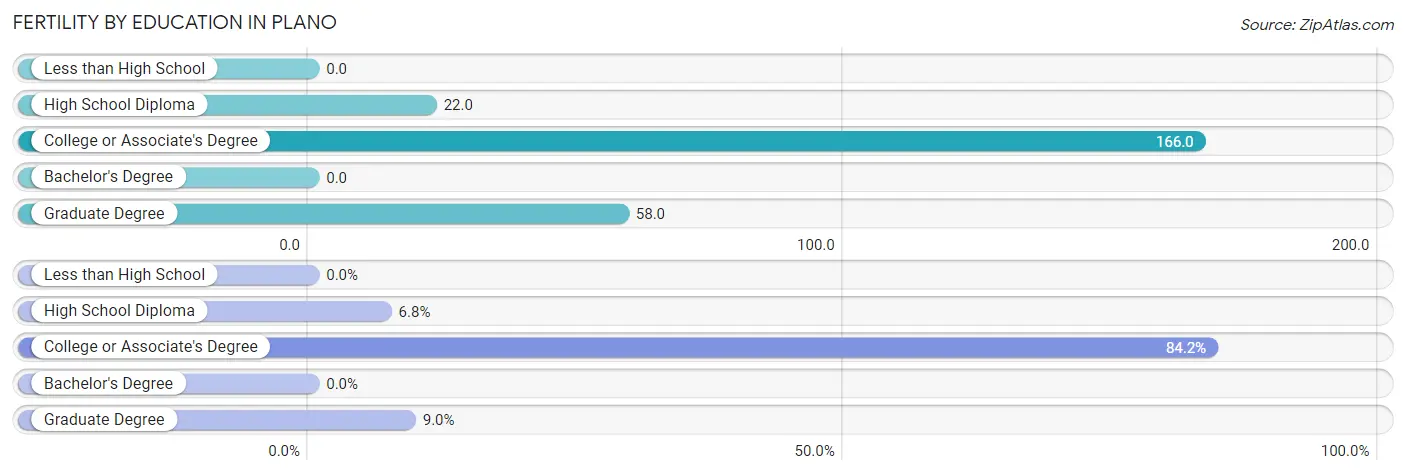
| Educational Attainment | Women with Births | Births / 1,000 Women |
| Less than High School | 0 (0.0%) | 0.0 |
| High School Diploma | 12 (6.8%) | 22.0 |
| College or Associate's Degree | 149 (84.2%) | 166.0 |
| Bachelor's Degree | 0 (0.0%) | 0.0 |
| Graduate Degree | 16 (9.0%) | 58.0 |
| Total | 177 (100.0%) | 64.0 |
Fertility by Education by Marriage Status in Plano
6.8% of women with births in Plano are unmarried. Women with the educational attainment of college or associate's degree are most likely to be married with 100.0% of them married at childbirth, while women with the educational attainment of high school diploma are least likely to be married with 100.0% of them unmarried at childbirth.
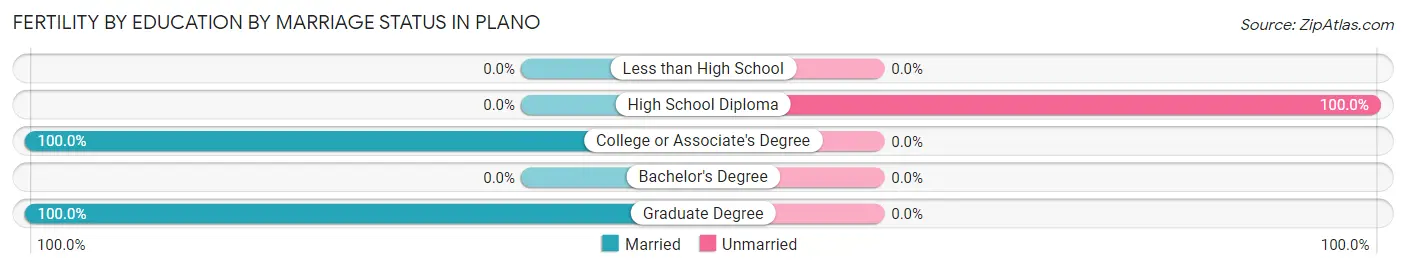
| Educational Attainment | Married | Unmarried |
| Less than High School | 0 (0.0%) | 0 (0.0%) |
| High School Diploma | 0 (0.0%) | 12 (100.0%) |
| College or Associate's Degree | 149 (100.0%) | 0 (0.0%) |
| Bachelor's Degree | 0 (0.0%) | 0 (0.0%) |
| Graduate Degree | 16 (100.0%) | 0 (0.0%) |
| Total | 165 (93.2%) | 12 (6.8%) |
Employment Characteristics in Plano
Employment by Class of Employer in Plano
Among the 6,201 employed individuals in Plano, private company employees (5,038 | 81.2%), local government employees (440 | 7.1%), and self-employed (not incorporated) (282 | 4.5%) make up the most common classes of employment.
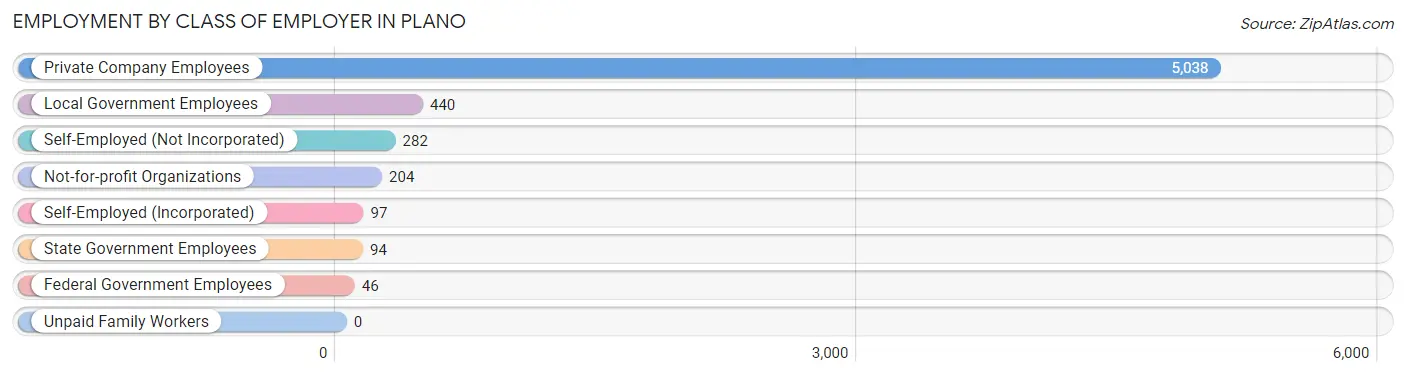
| Employer Class | # Employees | % Employees |
| Private Company Employees | 5,038 | 81.2% |
| Self-Employed (Incorporated) | 97 | 1.6% |
| Self-Employed (Not Incorporated) | 282 | 4.5% |
| Not-for-profit Organizations | 204 | 3.3% |
| Local Government Employees | 440 | 7.1% |
| State Government Employees | 94 | 1.5% |
| Federal Government Employees | 46 | 0.7% |
| Unpaid Family Workers | 0 | 0.0% |
| Total | 6,201 | 100.0% |
Employment Status by Age in Plano
According to the labor force statistics for Plano, out of the total population over 16 years of age (8,709), 80.0% or 6,967 individuals are in the labor force, with 8.8% or 613 of them unemployed. The age group with the highest labor force participation rate is 35 to 44 years, with 100.0% or 1,798 individuals in the labor force. Within the labor force, the 16 to 19 years age range has the highest percentage of unemployed individuals, with 67.8% or 331 of them being unemployed.
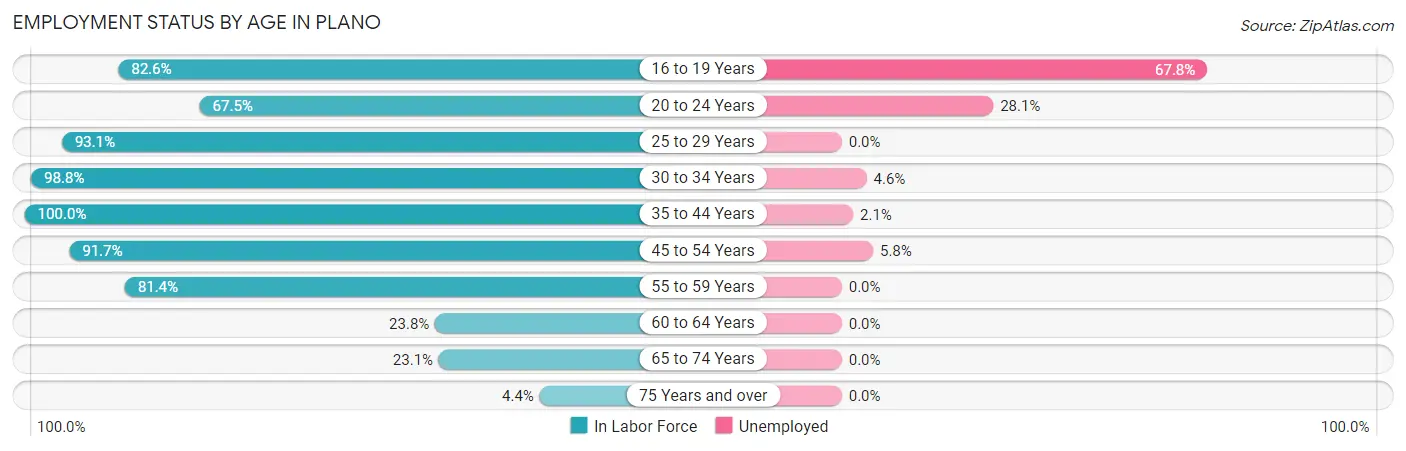
| Age Bracket | In Labor Force | Unemployed |
| 16 to 19 Years | 488 (82.6%) | 331 (67.8%) |
| 20 to 24 Years | 384 (67.5%) | 108 (28.1%) |
| 25 to 29 Years | 968 (93.1%) | 0 (0.0%) |
| 30 to 34 Years | 991 (98.8%) | 46 (4.6%) |
| 35 to 44 Years | 1,798 (100.0%) | 38 (2.1%) |
| 45 to 54 Years | 1,506 (91.7%) | 87 (5.8%) |
| 55 to 59 Years | 570 (81.4%) | 0 (0.0%) |
| 60 to 64 Years | 97 (23.8%) | 0 (0.0%) |
| 65 to 74 Years | 148 (23.1%) | 0 (0.0%) |
| 75 Years and over | 14 (4.4%) | 0 (0.0%) |
| Total | 6,967 (80.0%) | 613 (8.8%) |
Employment Status by Educational Attainment in Plano
According to labor force statistics for Plano, 90.0% of individuals (5,931) out of the total population between 25 and 64 years of age (6,590) are in the labor force, with 2.9% or 172 of them being unemployed. The group with the highest labor force participation rate are those with the educational attainment of less than high school, with 97.2% or 655 individuals in the labor force. Within the labor force, individuals with bachelor's degree or higher education have the highest percentage of unemployment, with 5.3% or 90 of them being unemployed.
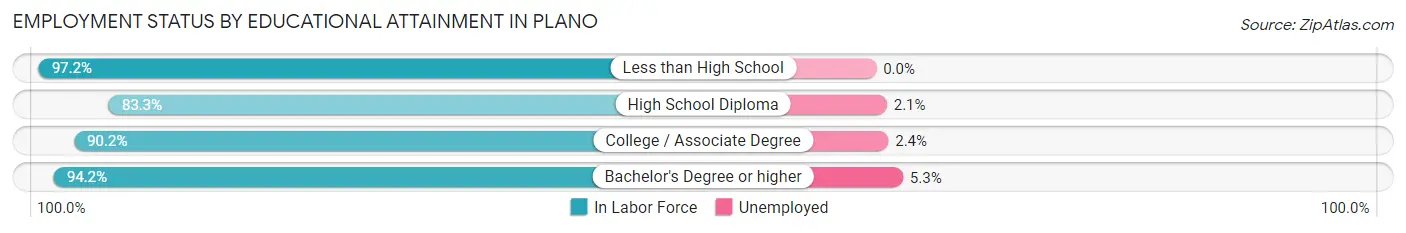
| Educational Attainment | In Labor Force | Unemployed |
| Less than High School | 655 (97.2%) | 0 (0.0%) |
| High School Diploma | 1,624 (83.3%) | 41 (2.1%) |
| College / Associate Degree | 1,951 (90.2%) | 52 (2.4%) |
| Bachelor's Degree or higher | 1,699 (94.2%) | 96 (5.3%) |
| Total | 5,931 (90.0%) | 191 (2.9%) |
Employment Occupations by Sex in Plano
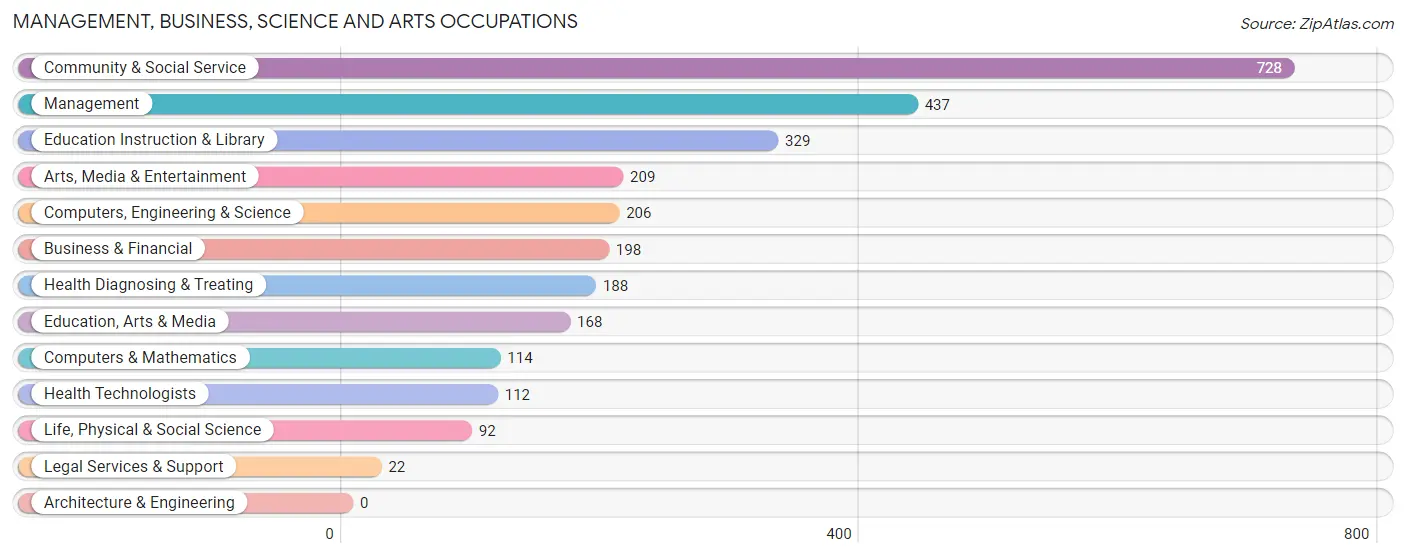
Management, Business, Science and Arts Occupations
The most common Management, Business, Science and Arts occupations in Plano are Community & Social Service (728 | 11.5%), Management (437 | 6.9%), Education Instruction & Library (329 | 5.2%), Arts, Media & Entertainment (209 | 3.3%), and Computers, Engineering & Science (206 | 3.3%).
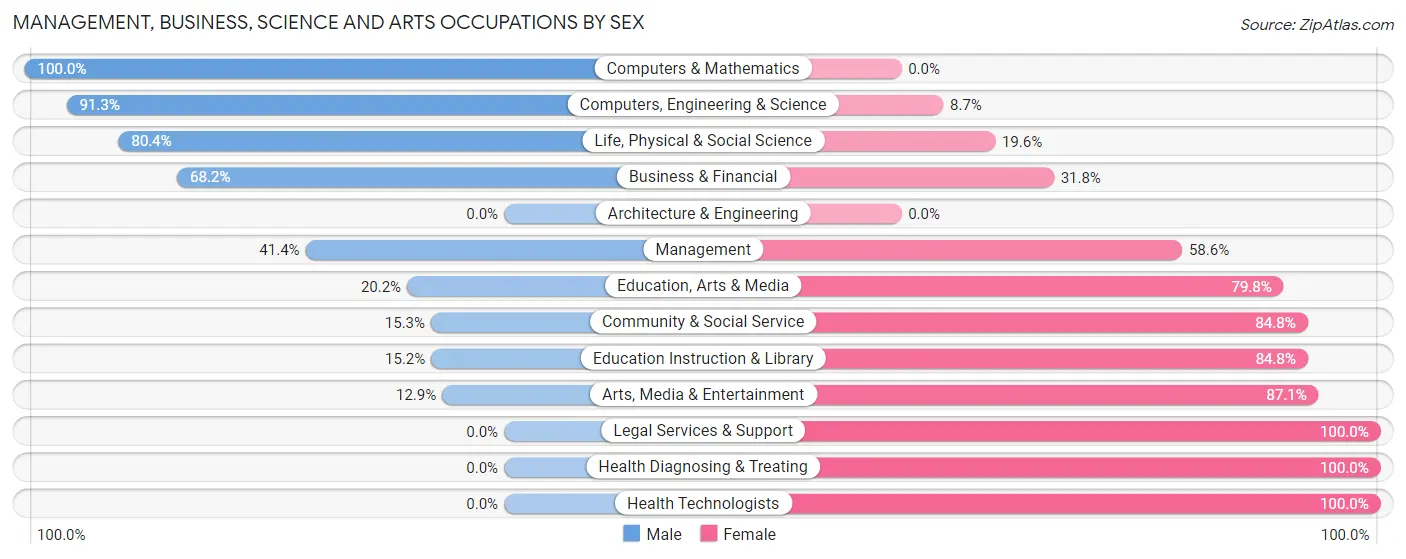
Management, Business, Science and Arts Occupations by Sex
Within the Management, Business, Science and Arts occupations in Plano, the most male-oriented occupations are Computers & Mathematics (100.0%), Computers, Engineering & Science (91.3%), and Life, Physical & Social Science (80.4%), while the most female-oriented occupations are Legal Services & Support (100.0%), Health Diagnosing & Treating (100.0%), and Health Technologists (100.0%).
| Occupation | Male | Female |
| Management | 181 (41.4%) | 256 (58.6%) |
| Business & Financial | 135 (68.2%) | 63 (31.8%) |
| Computers, Engineering & Science | 188 (91.3%) | 18 (8.7%) |
| Computers & Mathematics | 114 (100.0%) | 0 (0.0%) |
| Architecture & Engineering | 0 (0.0%) | 0 (0.0%) |
| Life, Physical & Social Science | 74 (80.4%) | 18 (19.6%) |
| Community & Social Service | 111 (15.2%) | 617 (84.8%) |
| Education, Arts & Media | 34 (20.2%) | 134 (79.8%) |
| Legal Services & Support | 0 (0.0%) | 22 (100.0%) |
| Education Instruction & Library | 50 (15.2%) | 279 (84.8%) |
| Arts, Media & Entertainment | 27 (12.9%) | 182 (87.1%) |
| Health Diagnosing & Treating | 0 (0.0%) | 188 (100.0%) |
| Health Technologists | 0 (0.0%) | 112 (100.0%) |
| Total (Category) | 615 (35.0%) | 1,142 (65.0%) |
| Total (Overall) | 3,305 (52.1%) | 3,039 (47.9%) |
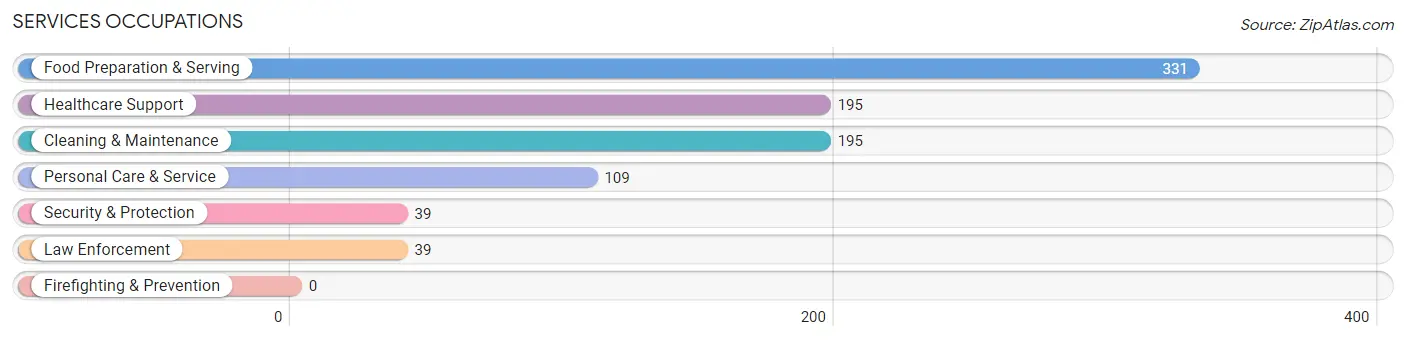
Services Occupations
The most common Services occupations in Plano are Food Preparation & Serving (331 | 5.2%), Healthcare Support (195 | 3.1%), Cleaning & Maintenance (195 | 3.1%), Personal Care & Service (109 | 1.7%), and Security & Protection (39 | 0.6%).
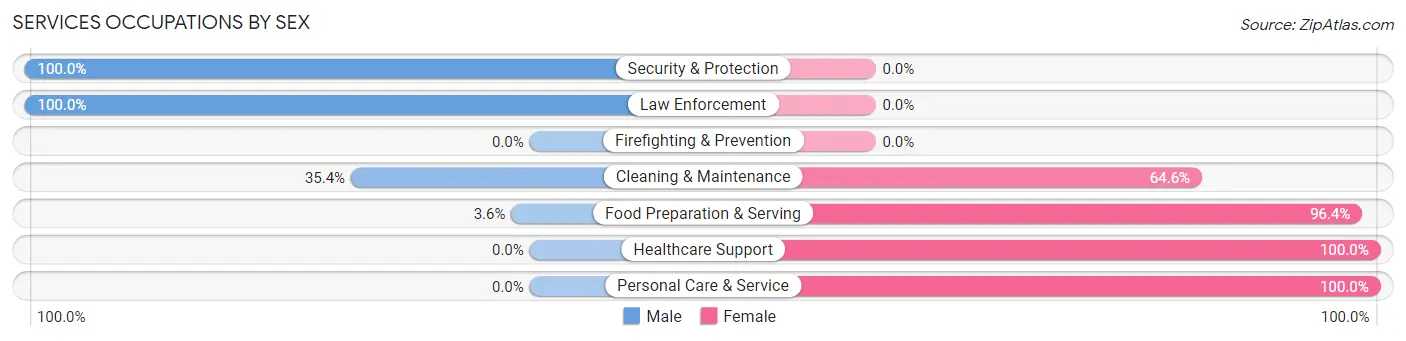
Services Occupations by Sex
Within the Services occupations in Plano, the most male-oriented occupations are Security & Protection (100.0%), Law Enforcement (100.0%), and Cleaning & Maintenance (35.4%), while the most female-oriented occupations are Healthcare Support (100.0%), Personal Care & Service (100.0%), and Food Preparation & Serving (96.4%).
| Occupation | Male | Female |
| Healthcare Support | 0 (0.0%) | 195 (100.0%) |
| Security & Protection | 39 (100.0%) | 0 (0.0%) |
| Firefighting & Prevention | 0 (0.0%) | 0 (0.0%) |
| Law Enforcement | 39 (100.0%) | 0 (0.0%) |
| Food Preparation & Serving | 12 (3.6%) | 319 (96.4%) |
| Cleaning & Maintenance | 69 (35.4%) | 126 (64.6%) |
| Personal Care & Service | 0 (0.0%) | 109 (100.0%) |
| Total (Category) | 120 (13.8%) | 749 (86.2%) |
| Total (Overall) | 3,305 (52.1%) | 3,039 (47.9%) |
Sales and Office Occupations
The most common Sales and Office occupations in Plano are Sales & Related (1,069 | 16.9%), and Office & Administration (630 | 9.9%).

Sales and Office Occupations by Sex

| Occupation | Male | Female |
| Sales & Related | 397 (37.1%) | 672 (62.9%) |
| Office & Administration | 426 (67.6%) | 204 (32.4%) |
| Total (Category) | 823 (48.4%) | 876 (51.6%) |
| Total (Overall) | 3,305 (52.1%) | 3,039 (47.9%) |
Natural Resources, Construction and Maintenance Occupations
The most common Natural Resources, Construction and Maintenance occupations in Plano are Construction & Extraction (563 | 8.9%), and Installation, Maintenance & Repair (137 | 2.2%).
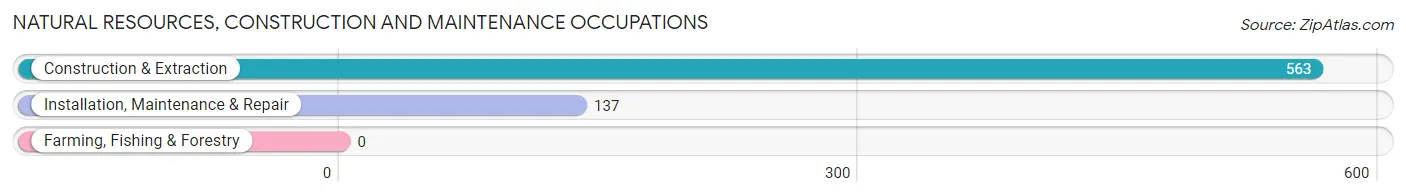
Natural Resources, Construction and Maintenance Occupations by Sex
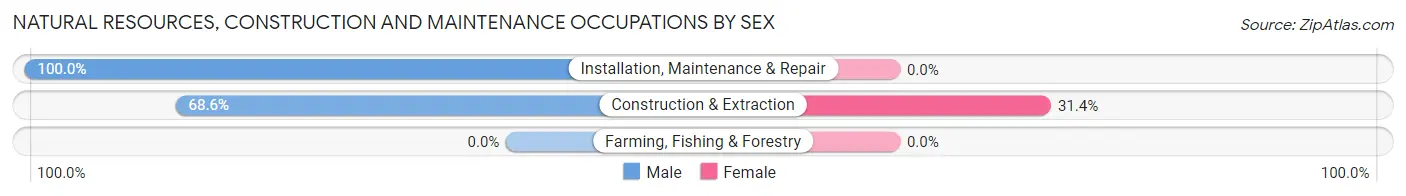
| Occupation | Male | Female |
| Farming, Fishing & Forestry | 0 (0.0%) | 0 (0.0%) |
| Construction & Extraction | 386 (68.6%) | 177 (31.4%) |
| Installation, Maintenance & Repair | 137 (100.0%) | 0 (0.0%) |
| Total (Category) | 523 (74.7%) | 177 (25.3%) |
| Total (Overall) | 3,305 (52.1%) | 3,039 (47.9%) |
Production, Transportation and Moving Occupations
The most common Production, Transportation and Moving occupations in Plano are Transportation (475 | 7.5%), Material Moving (431 | 6.8%), and Production (413 | 6.5%).
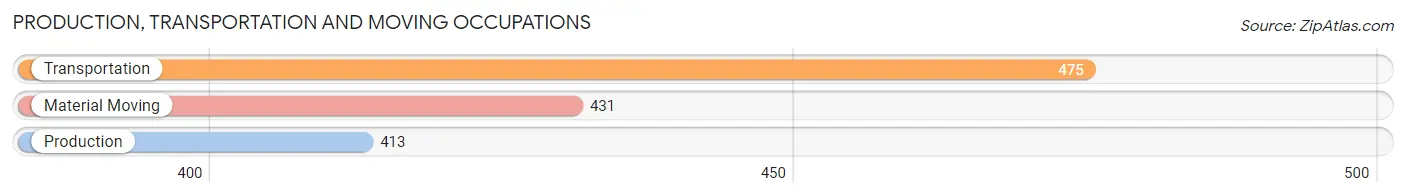
Production, Transportation and Moving Occupations by Sex
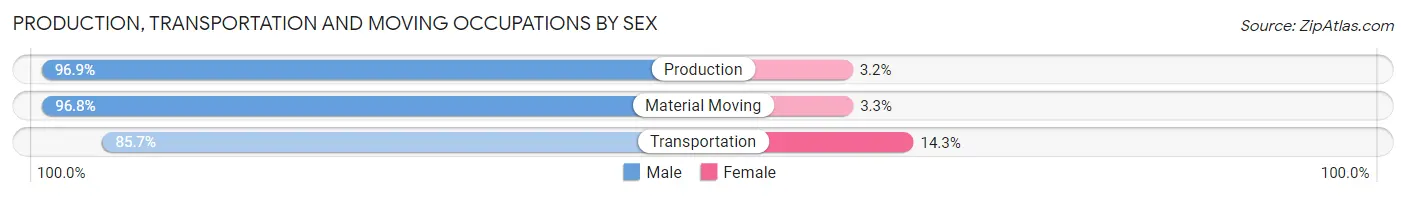
| Occupation | Male | Female |
| Production | 400 (96.9%) | 13 (3.2%) |
| Transportation | 407 (85.7%) | 68 (14.3%) |
| Material Moving | 417 (96.8%) | 14 (3.3%) |
| Total (Category) | 1,224 (92.8%) | 95 (7.2%) |
| Total (Overall) | 3,305 (52.1%) | 3,039 (47.9%) |
Employment Industries by Sex in Plano
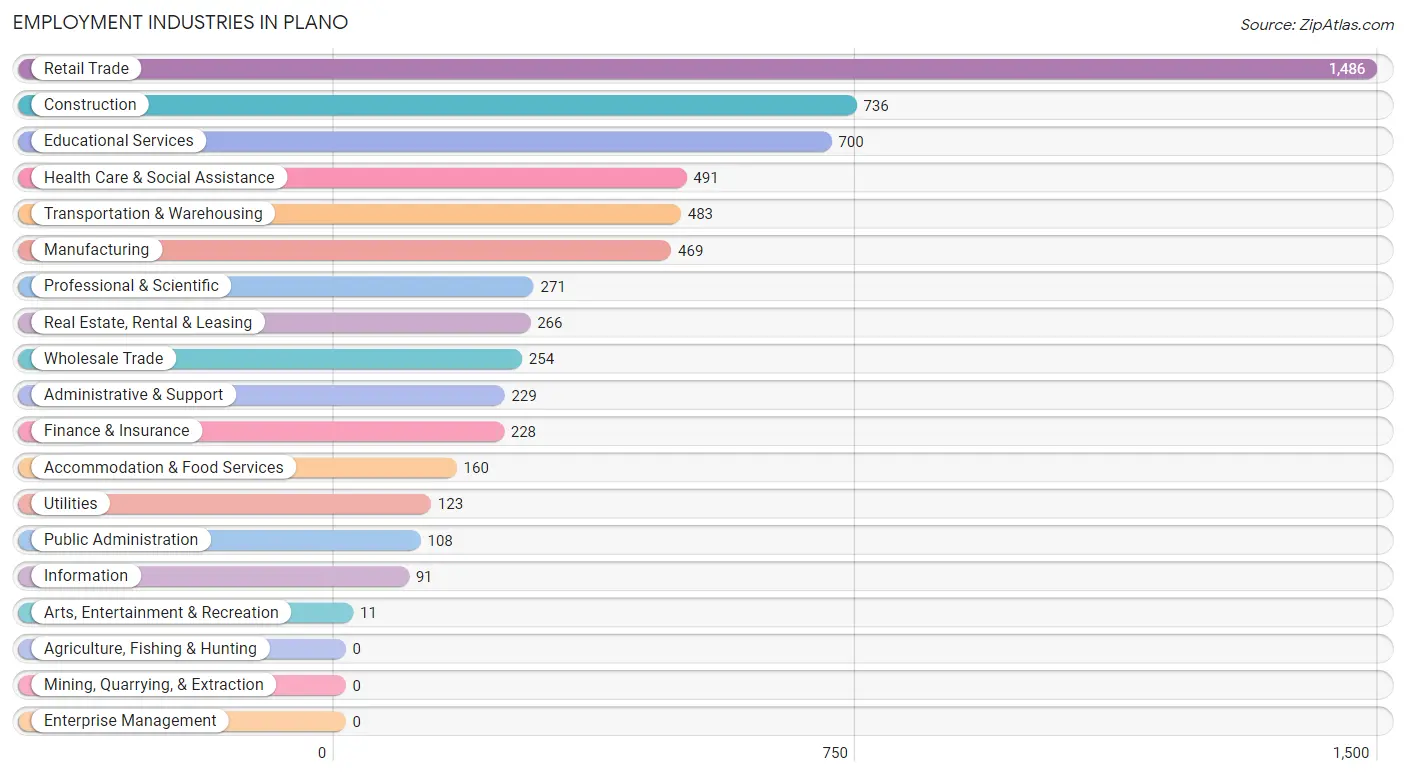
Employment Industries in Plano
The major employment industries in Plano include Retail Trade (1,486 | 23.4%), Construction (736 | 11.6%), Educational Services (700 | 11.0%), Health Care & Social Assistance (491 | 7.7%), and Transportation & Warehousing (483 | 7.6%).
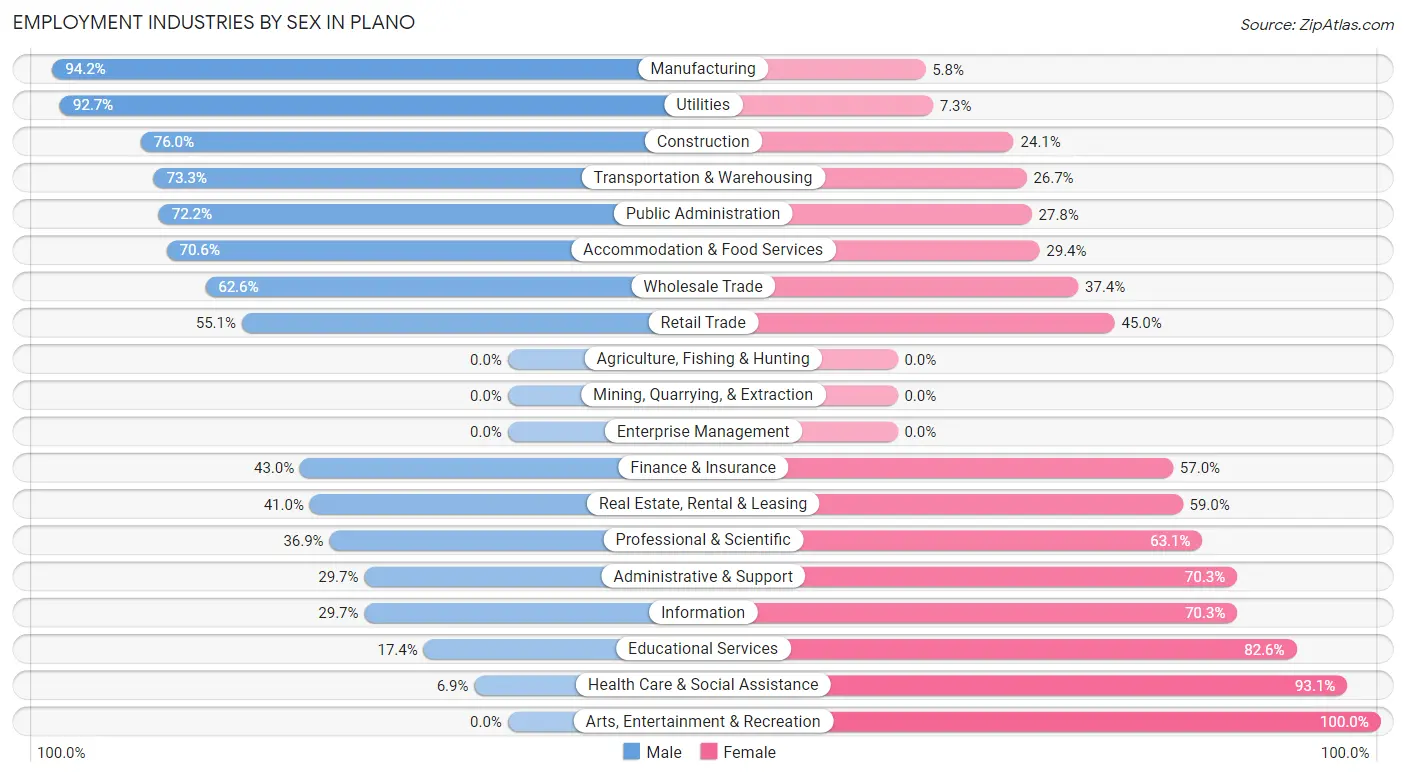
Employment Industries by Sex in Plano
The Plano industries that see more men than women are Manufacturing (94.2%), Utilities (92.7%), and Construction (75.9%), whereas the industries that tend to have a higher number of women are Arts, Entertainment & Recreation (100.0%), Health Care & Social Assistance (93.1%), and Educational Services (82.6%).
| Industry | Male | Female |
| Agriculture, Fishing & Hunting | 0 (0.0%) | 0 (0.0%) |
| Mining, Quarrying, & Extraction | 0 (0.0%) | 0 (0.0%) |
| Construction | 559 (75.9%) | 177 (24.0%) |
| Manufacturing | 442 (94.2%) | 27 (5.8%) |
| Wholesale Trade | 159 (62.6%) | 95 (37.4%) |
| Retail Trade | 818 (55.0%) | 668 (45.0%) |
| Transportation & Warehousing | 354 (73.3%) | 129 (26.7%) |
| Utilities | 114 (92.7%) | 9 (7.3%) |
| Information | 27 (29.7%) | 64 (70.3%) |
| Finance & Insurance | 98 (43.0%) | 130 (57.0%) |
| Real Estate, Rental & Leasing | 109 (41.0%) | 157 (59.0%) |
| Professional & Scientific | 100 (36.9%) | 171 (63.1%) |
| Enterprise Management | 0 (0.0%) | 0 (0.0%) |
| Administrative & Support | 68 (29.7%) | 161 (70.3%) |
| Educational Services | 122 (17.4%) | 578 (82.6%) |
| Health Care & Social Assistance | 34 (6.9%) | 457 (93.1%) |
| Arts, Entertainment & Recreation | 0 (0.0%) | 11 (100.0%) |
| Accommodation & Food Services | 113 (70.6%) | 47 (29.4%) |
| Public Administration | 78 (72.2%) | 30 (27.8%) |
| Total | 3,305 (52.1%) | 3,039 (47.9%) |
Education in Plano
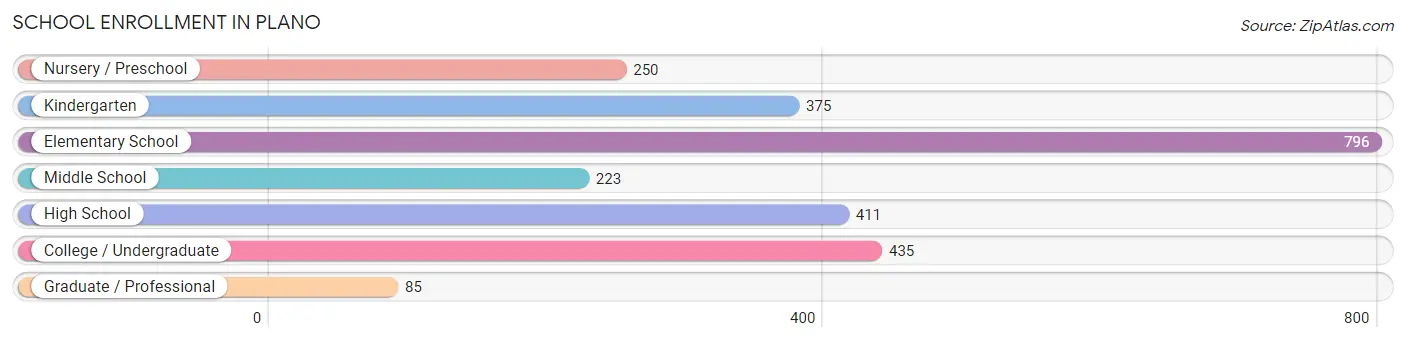
School Enrollment in Plano
The most common levels of schooling among the 2,575 students in Plano are elementary school (796 | 30.9%), college / undergraduate (435 | 16.9%), and high school (411 | 16.0%).
| School Level | # Students | % Students |
| Nursery / Preschool | 250 | 9.7% |
| Kindergarten | 375 | 14.6% |
| Elementary School | 796 | 30.9% |
| Middle School | 223 | 8.7% |
| High School | 411 | 16.0% |
| College / Undergraduate | 435 | 16.9% |
| Graduate / Professional | 85 | 3.3% |
| Total | 2,575 | 100.0% |
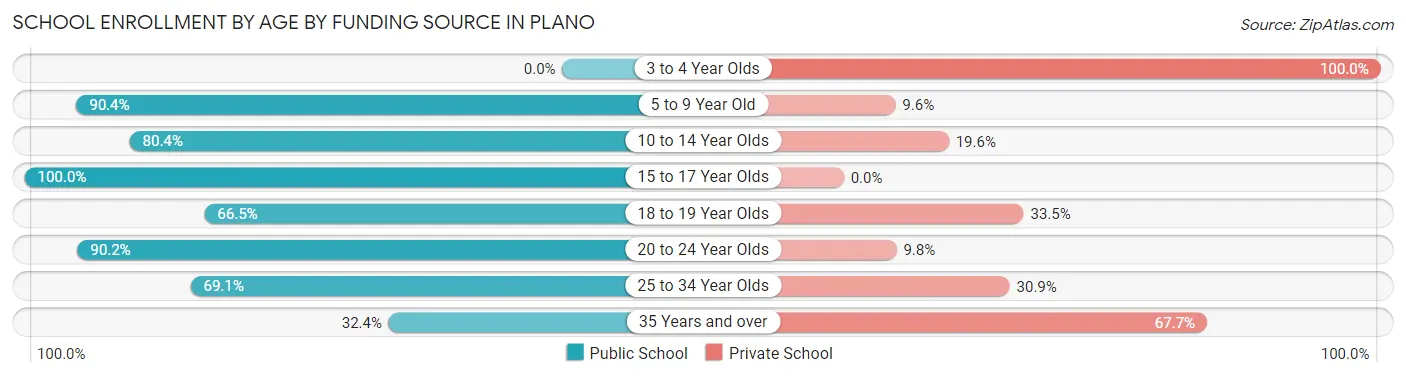
School Enrollment by Age by Funding Source in Plano
Out of a total of 2,575 students who are enrolled in schools in Plano, 510 (19.8%) attend a private institution, while the remaining 2,065 (80.2%) are enrolled in public schools. The age group of 3 to 4 year olds has the highest likelihood of being enrolled in private schools, with 104 (100.0% in the age bracket) enrolled. Conversely, the age group of 15 to 17 year olds has the lowest likelihood of being enrolled in a private school, with 235 (100.0% in the age bracket) attending a public institution.
| Age Bracket | Public School | Private School |
| 3 to 4 Year Olds | 0 (0.0%) | 104 (100.0%) |
| 5 to 9 Year Old | 1,106 (90.4%) | 118 (9.6%) |
| 10 to 14 Year Olds | 296 (80.4%) | 72 (19.6%) |
| 15 to 17 Year Olds | 235 (100.0%) | 0 (0.0%) |
| 18 to 19 Year Olds | 133 (66.5%) | 67 (33.5%) |
| 20 to 24 Year Olds | 110 (90.2%) | 12 (9.8%) |
| 25 to 34 Year Olds | 152 (69.1%) | 68 (30.9%) |
| 35 Years and over | 33 (32.4%) | 69 (67.6%) |
| Total | 2,065 (80.2%) | 510 (19.8%) |
Educational Attainment by Field of Study in Plano
Business (448 | 23.4%), education (338 | 17.6%), engineering (281 | 14.7%), psychology (150 | 7.8%), and social sciences (130 | 6.8%) are the most common fields of study among 1,917 individuals in Plano who have obtained a bachelor's degree or higher.
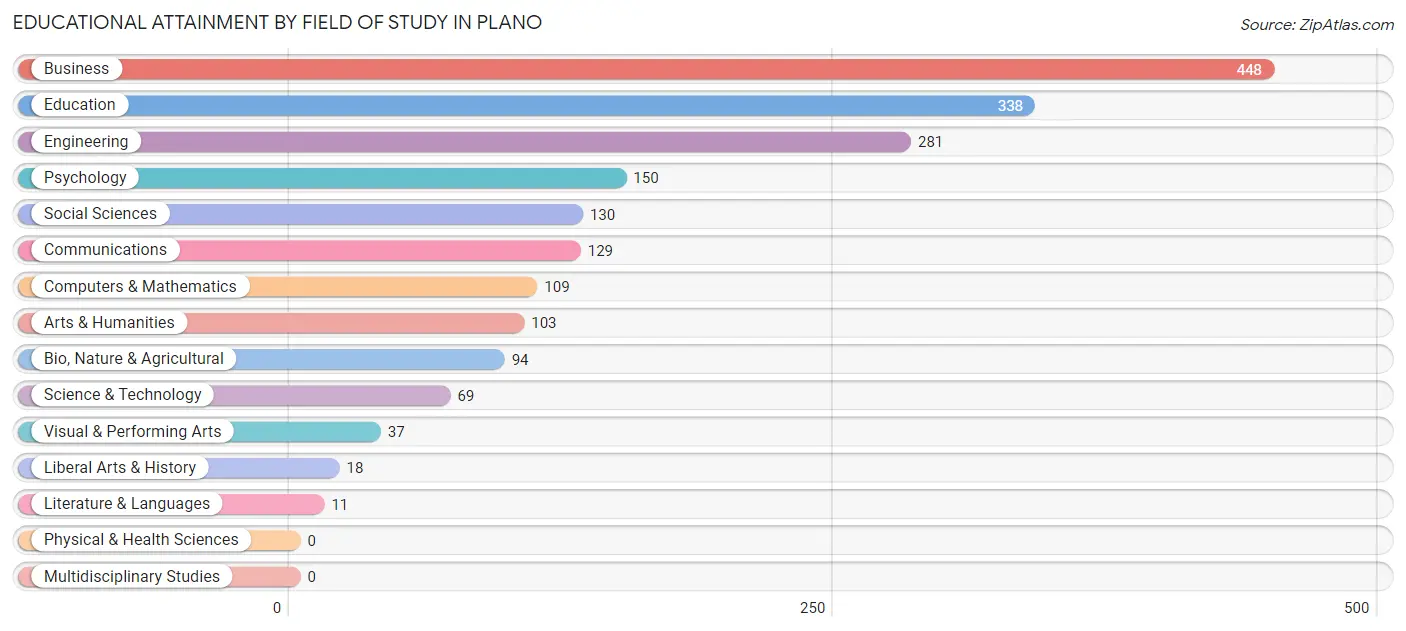
| Field of Study | # Graduates | % Graduates |
| Computers & Mathematics | 109 | 5.7% |
| Bio, Nature & Agricultural | 94 | 4.9% |
| Physical & Health Sciences | 0 | 0.0% |
| Psychology | 150 | 7.8% |
| Social Sciences | 130 | 6.8% |
| Engineering | 281 | 14.7% |
| Multidisciplinary Studies | 0 | 0.0% |
| Science & Technology | 69 | 3.6% |
| Business | 448 | 23.4% |
| Education | 338 | 17.6% |
| Literature & Languages | 11 | 0.6% |
| Liberal Arts & History | 18 | 0.9% |
| Visual & Performing Arts | 37 | 1.9% |
| Communications | 129 | 6.7% |
| Arts & Humanities | 103 | 5.4% |
| Total | 1,917 | 100.0% |
Transportation & Commute in Plano
Vehicle Availability by Sex in Plano
The most prevalent vehicle ownership categories in Plano are males with 2 vehicles (1,308, accounting for 40.9%) and females with 2 vehicles (1,186, making up 43.6%).
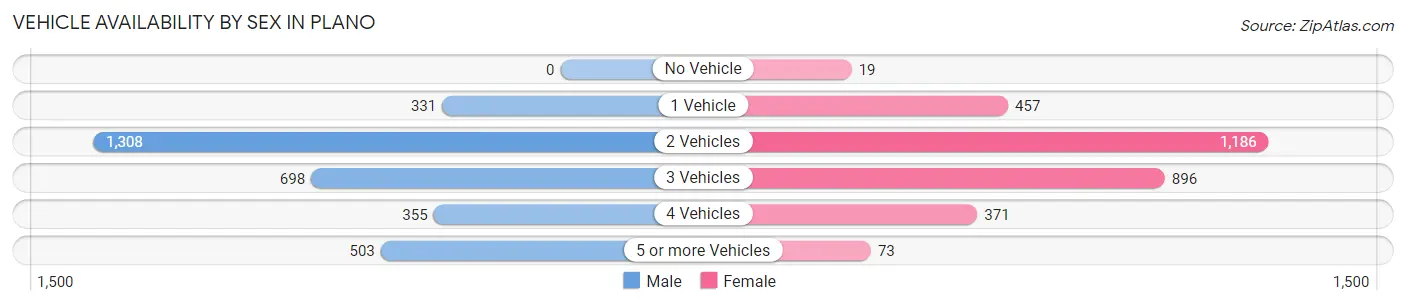
| Vehicles Available | Male | Female |
| No Vehicle | 0 (0.0%) | 19 (0.6%) |
| 1 Vehicle | 331 (10.4%) | 457 (15.2%) |
| 2 Vehicles | 1,308 (40.9%) | 1,186 (39.5%) |
| 3 Vehicles | 698 (21.8%) | 896 (29.8%) |
| 4 Vehicles | 355 (11.1%) | 371 (12.4%) |
| 5 or more Vehicles | 503 (15.7%) | 73 (2.4%) |
| Total | 3,195 (100.0%) | 3,002 (100.0%) |
Commute Time in Plano
The most frequently occuring commute durations in Plano are 10 to 14 minutes (1,043 commuters, 17.7%), 5 to 9 minutes (866 commuters, 14.7%), and 45 to 59 minutes (726 commuters, 12.3%).
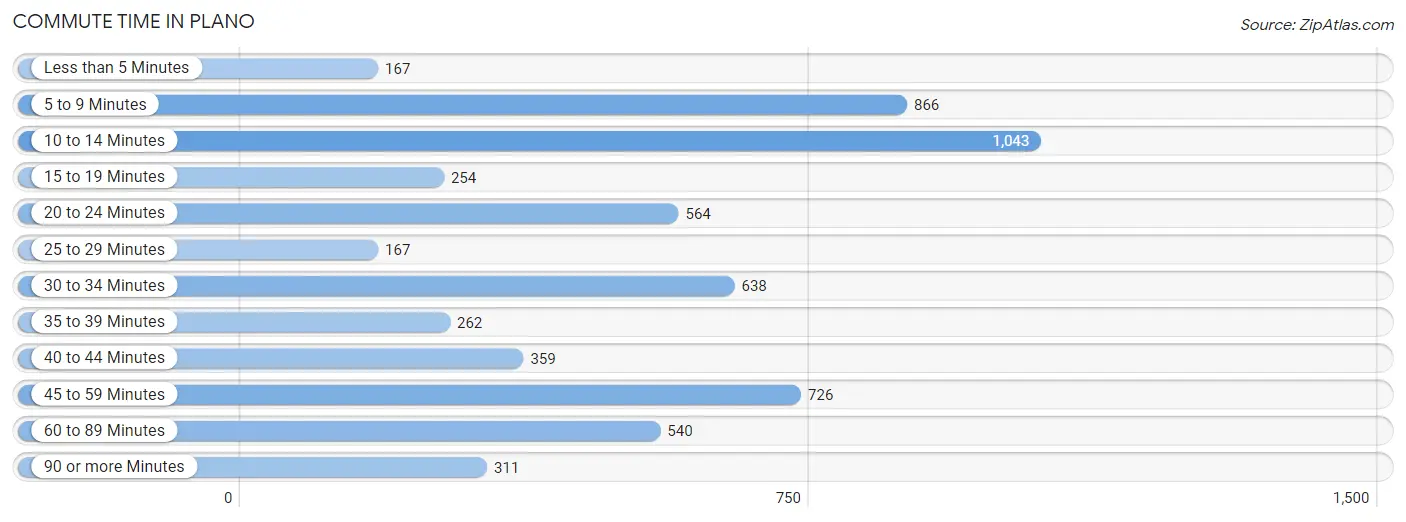
| Commute Time | # Commuters | % Commuters |
| Less than 5 Minutes | 167 | 2.8% |
| 5 to 9 Minutes | 866 | 14.7% |
| 10 to 14 Minutes | 1,043 | 17.7% |
| 15 to 19 Minutes | 254 | 4.3% |
| 20 to 24 Minutes | 564 | 9.6% |
| 25 to 29 Minutes | 167 | 2.8% |
| 30 to 34 Minutes | 638 | 10.8% |
| 35 to 39 Minutes | 262 | 4.4% |
| 40 to 44 Minutes | 359 | 6.1% |
| 45 to 59 Minutes | 726 | 12.3% |
| 60 to 89 Minutes | 540 | 9.2% |
| 90 or more Minutes | 311 | 5.3% |
Commute Time by Sex in Plano
The most common commute times in Plano are 5 to 9 minutes (470 commuters, 14.8%) for males and 10 to 14 minutes (697 commuters, 25.5%) for females.
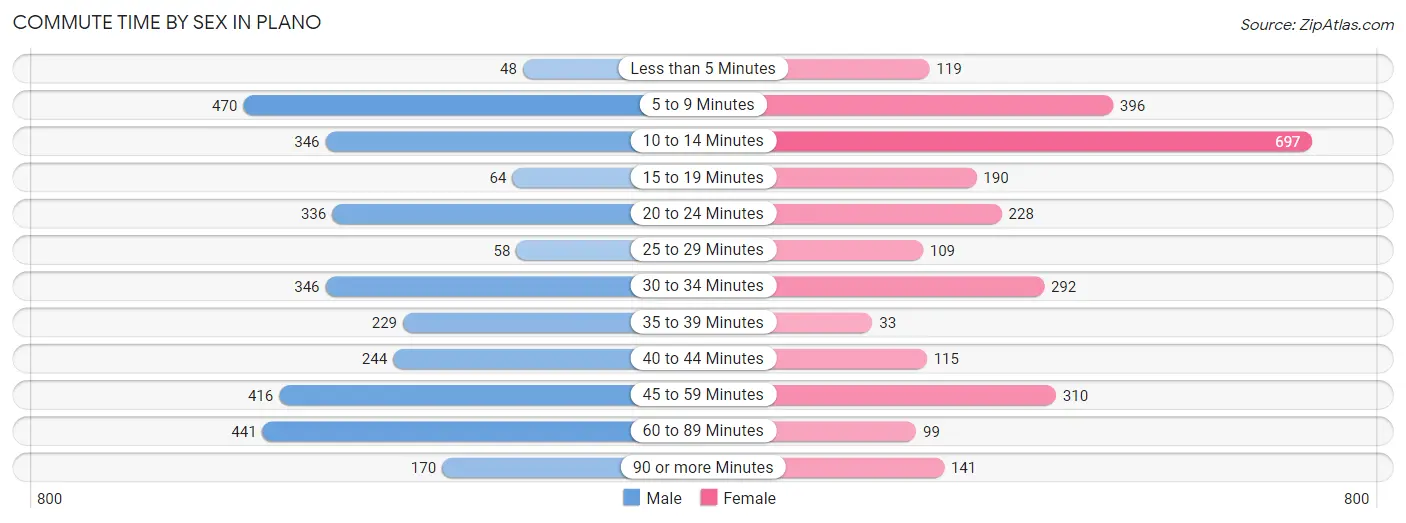
| Commute Time | Male | Female |
| Less than 5 Minutes | 48 (1.5%) | 119 (4.4%) |
| 5 to 9 Minutes | 470 (14.8%) | 396 (14.5%) |
| 10 to 14 Minutes | 346 (10.9%) | 697 (25.5%) |
| 15 to 19 Minutes | 64 (2.0%) | 190 (7.0%) |
| 20 to 24 Minutes | 336 (10.6%) | 228 (8.4%) |
| 25 to 29 Minutes | 58 (1.8%) | 109 (4.0%) |
| 30 to 34 Minutes | 346 (10.9%) | 292 (10.7%) |
| 35 to 39 Minutes | 229 (7.2%) | 33 (1.2%) |
| 40 to 44 Minutes | 244 (7.7%) | 115 (4.2%) |
| 45 to 59 Minutes | 416 (13.1%) | 310 (11.4%) |
| 60 to 89 Minutes | 441 (13.9%) | 99 (3.6%) |
| 90 or more Minutes | 170 (5.4%) | 141 (5.2%) |
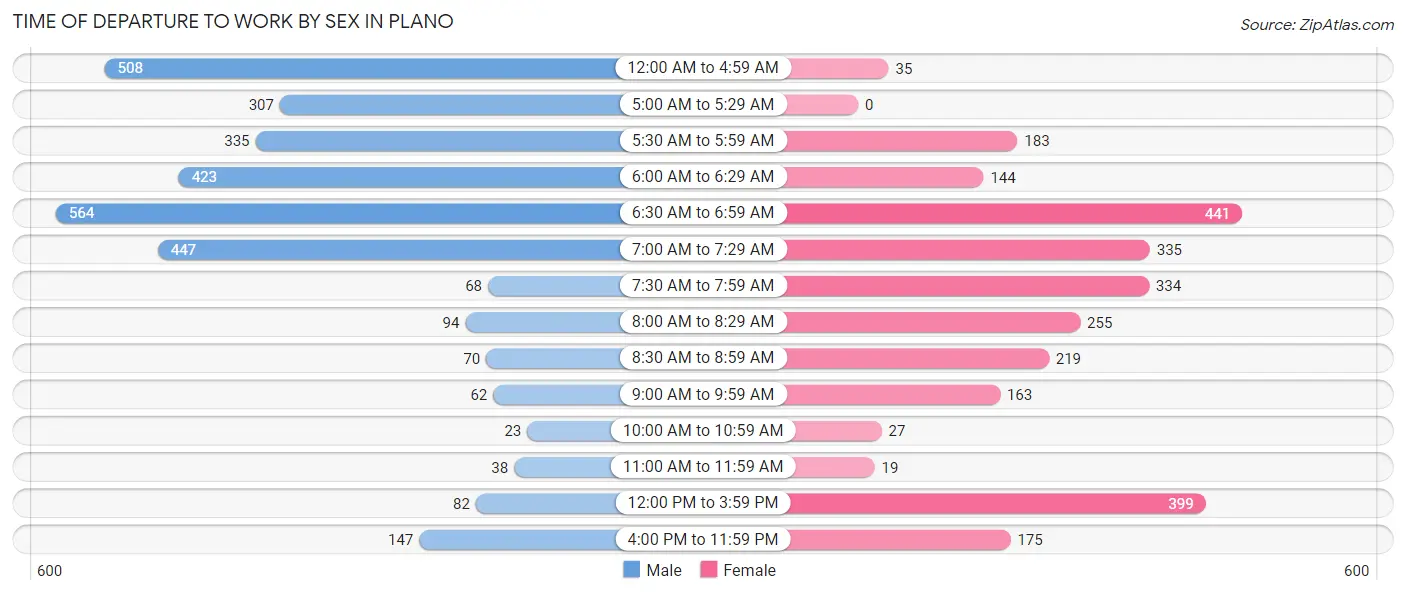
Time of Departure to Work by Sex in Plano
The most frequent times of departure to work in Plano are 6:30 AM to 6:59 AM (564, 17.8%) for males and 6:30 AM to 6:59 AM (441, 16.2%) for females.
| Time of Departure | Male | Female |
| 12:00 AM to 4:59 AM | 508 (16.0%) | 35 (1.3%) |
| 5:00 AM to 5:29 AM | 307 (9.7%) | 0 (0.0%) |
| 5:30 AM to 5:59 AM | 335 (10.6%) | 183 (6.7%) |
| 6:00 AM to 6:29 AM | 423 (13.4%) | 144 (5.3%) |
| 6:30 AM to 6:59 AM | 564 (17.8%) | 441 (16.2%) |
| 7:00 AM to 7:29 AM | 447 (14.1%) | 335 (12.3%) |
| 7:30 AM to 7:59 AM | 68 (2.1%) | 334 (12.2%) |
| 8:00 AM to 8:29 AM | 94 (3.0%) | 255 (9.3%) |
| 8:30 AM to 8:59 AM | 70 (2.2%) | 219 (8.0%) |
| 9:00 AM to 9:59 AM | 62 (2.0%) | 163 (6.0%) |
| 10:00 AM to 10:59 AM | 23 (0.7%) | 27 (1.0%) |
| 11:00 AM to 11:59 AM | 38 (1.2%) | 19 (0.7%) |
| 12:00 PM to 3:59 PM | 82 (2.6%) | 399 (14.6%) |
| 4:00 PM to 11:59 PM | 147 (4.6%) | 175 (6.4%) |
| Total | 3,168 (100.0%) | 2,729 (100.0%) |
Housing Occupancy in Plano
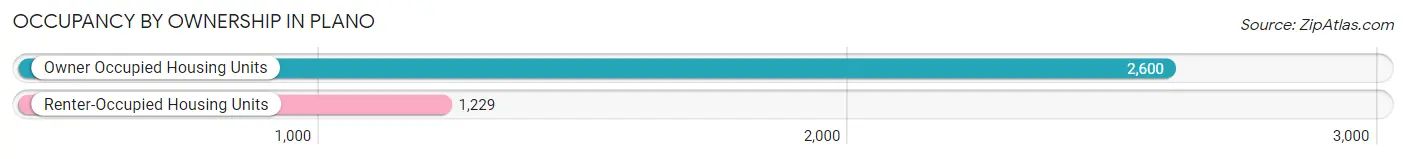
Occupancy by Ownership in Plano
Of the total 3,829 dwellings in Plano, owner-occupied units account for 2,600 (67.9%), while renter-occupied units make up 1,229 (32.1%).
| Occupancy | # Housing Units | % Housing Units |
| Owner Occupied Housing Units | 2,600 | 67.9% |
| Renter-Occupied Housing Units | 1,229 | 32.1% |
| Total Occupied Housing Units | 3,829 | 100.0% |
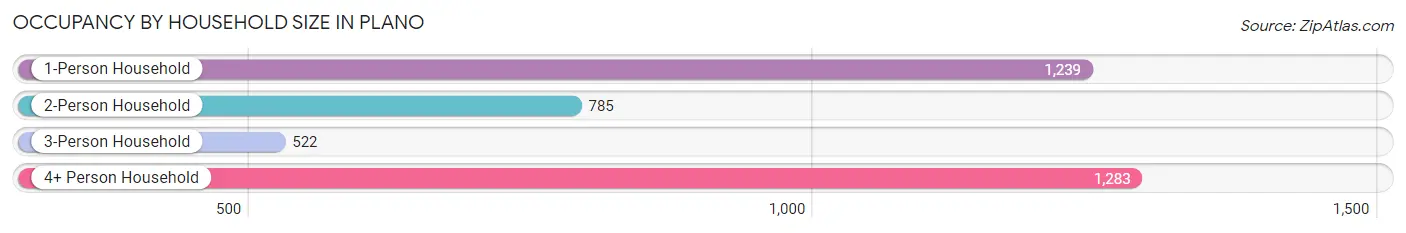
Occupancy by Household Size in Plano
| Household Size | # Housing Units | % Housing Units |
| 1-Person Household | 1,239 | 32.4% |
| 2-Person Household | 785 | 20.5% |
| 3-Person Household | 522 | 13.6% |
| 4+ Person Household | 1,283 | 33.5% |
| Total Housing Units | 3,829 | 100.0% |
Occupancy by Ownership by Household Size in Plano
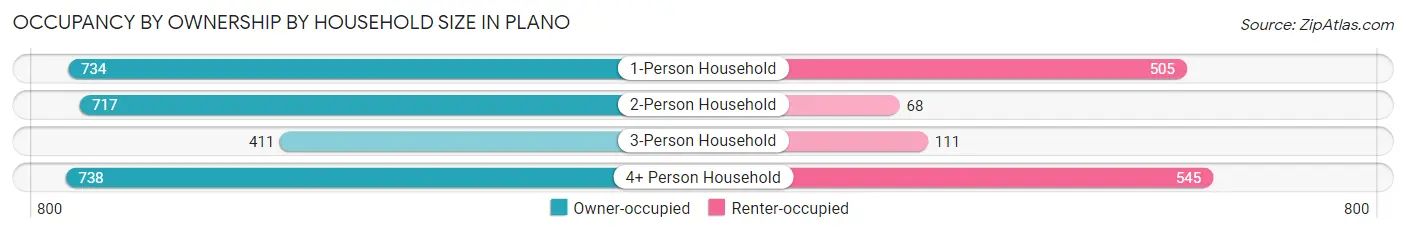
| Household Size | Owner-occupied | Renter-occupied |
| 1-Person Household | 734 (59.2%) | 505 (40.8%) |
| 2-Person Household | 717 (91.3%) | 68 (8.7%) |
| 3-Person Household | 411 (78.7%) | 111 (21.3%) |
| 4+ Person Household | 738 (57.5%) | 545 (42.5%) |
| Total Housing Units | 2,600 (67.9%) | 1,229 (32.1%) |
Occupancy by Educational Attainment in Plano
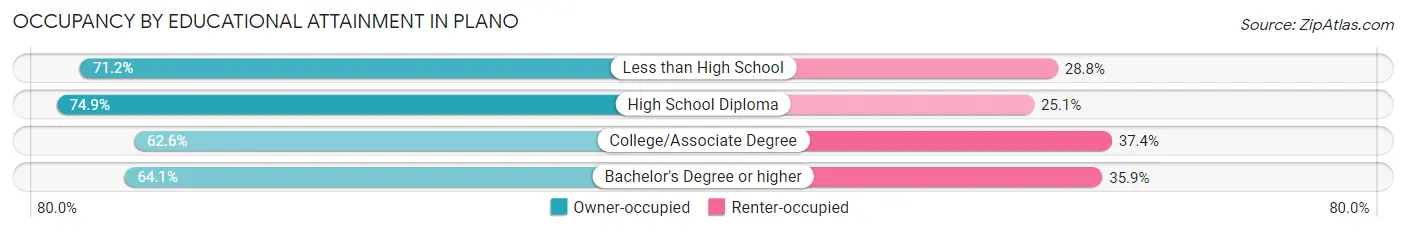
| Household Size | Owner-occupied | Renter-occupied |
| Less than High School | 252 (71.2%) | 102 (28.8%) |
| High School Diploma | 945 (74.9%) | 316 (25.1%) |
| College/Associate Degree | 704 (62.6%) | 420 (37.4%) |
| Bachelor's Degree or higher | 699 (64.1%) | 391 (35.9%) |
Occupancy by Age of Householder in Plano
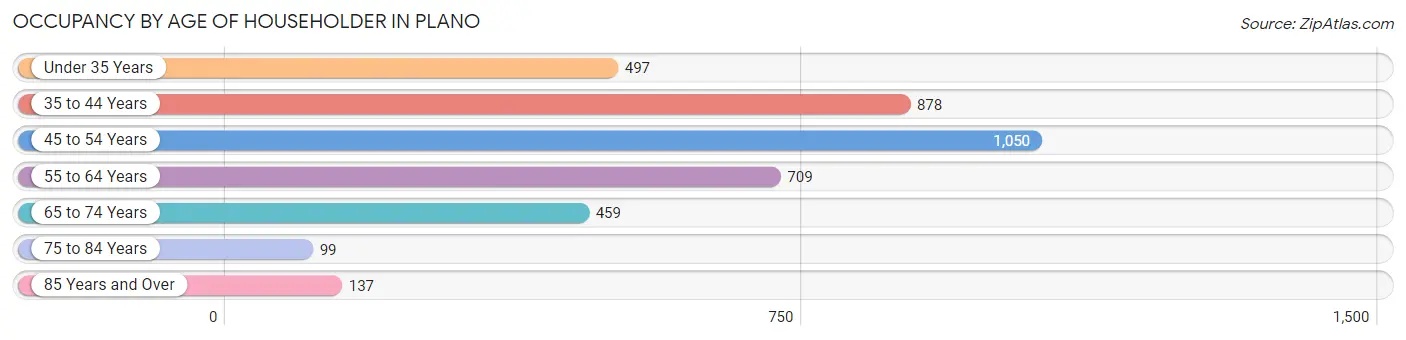
| Age Bracket | # Households | % Households |
| Under 35 Years | 497 | 13.0% |
| 35 to 44 Years | 878 | 22.9% |
| 45 to 54 Years | 1,050 | 27.4% |
| 55 to 64 Years | 709 | 18.5% |
| 65 to 74 Years | 459 | 12.0% |
| 75 to 84 Years | 99 | 2.6% |
| 85 Years and Over | 137 | 3.6% |
| Total | 3,829 | 100.0% |
Housing Finances in Plano
Median Income by Occupancy in Plano
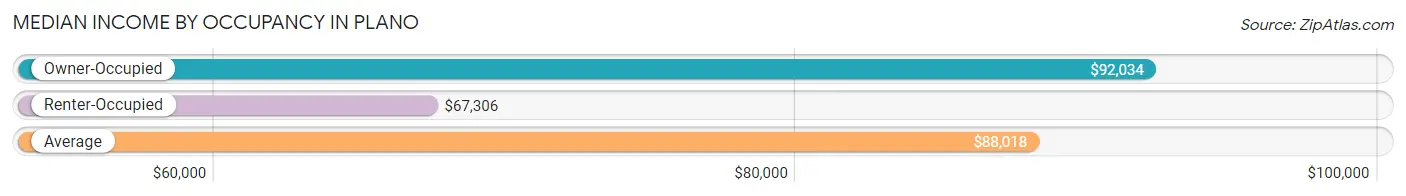
| Occupancy Type | # Households | Median Income |
| Owner-Occupied | 2,600 (67.9%) | $92,034 |
| Renter-Occupied | 1,229 (32.1%) | $67,306 |
| Average | 3,829 (100.0%) | $88,018 |
Occupancy by Householder Income Bracket in Plano
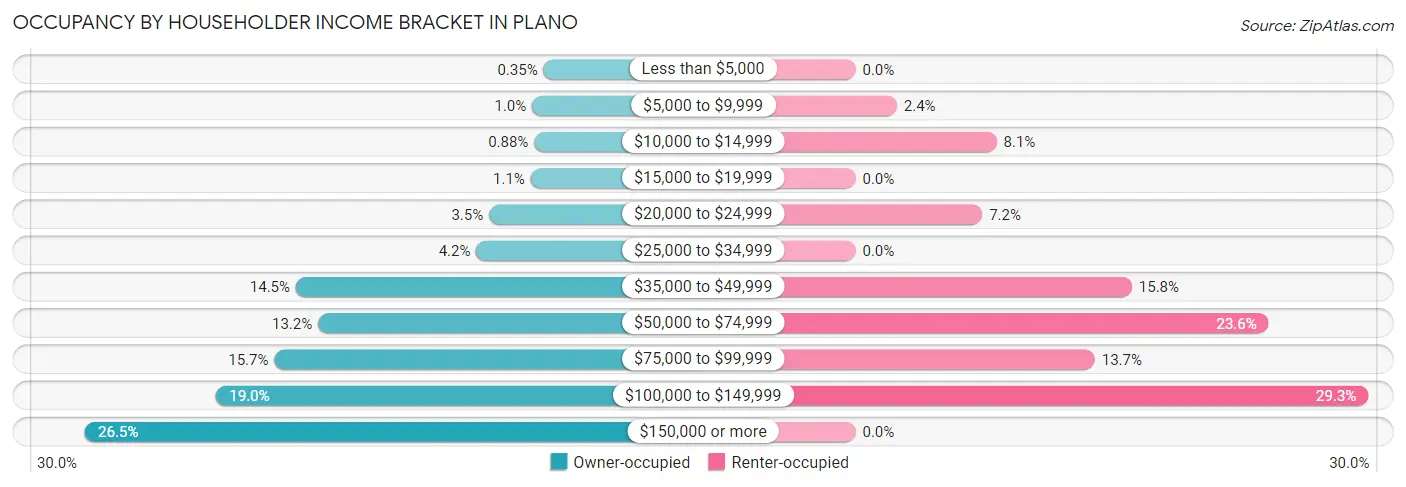
| Income Bracket | Owner-occupied | Renter-occupied |
| Less than $5,000 | 9 (0.4%) | 0 (0.0%) |
| $5,000 to $9,999 | 26 (1.0%) | 29 (2.4%) |
| $10,000 to $14,999 | 23 (0.9%) | 99 (8.1%) |
| $15,000 to $19,999 | 28 (1.1%) | 0 (0.0%) |
| $20,000 to $24,999 | 90 (3.5%) | 89 (7.2%) |
| $25,000 to $34,999 | 109 (4.2%) | 0 (0.0%) |
| $35,000 to $49,999 | 377 (14.5%) | 194 (15.8%) |
| $50,000 to $74,999 | 344 (13.2%) | 290 (23.6%) |
| $75,000 to $99,999 | 409 (15.7%) | 168 (13.7%) |
| $100,000 to $149,999 | 495 (19.0%) | 360 (29.3%) |
| $150,000 or more | 690 (26.5%) | 0 (0.0%) |
| Total | 2,600 (100.0%) | 1,229 (100.0%) |
Monthly Housing Cost Tiers in Plano
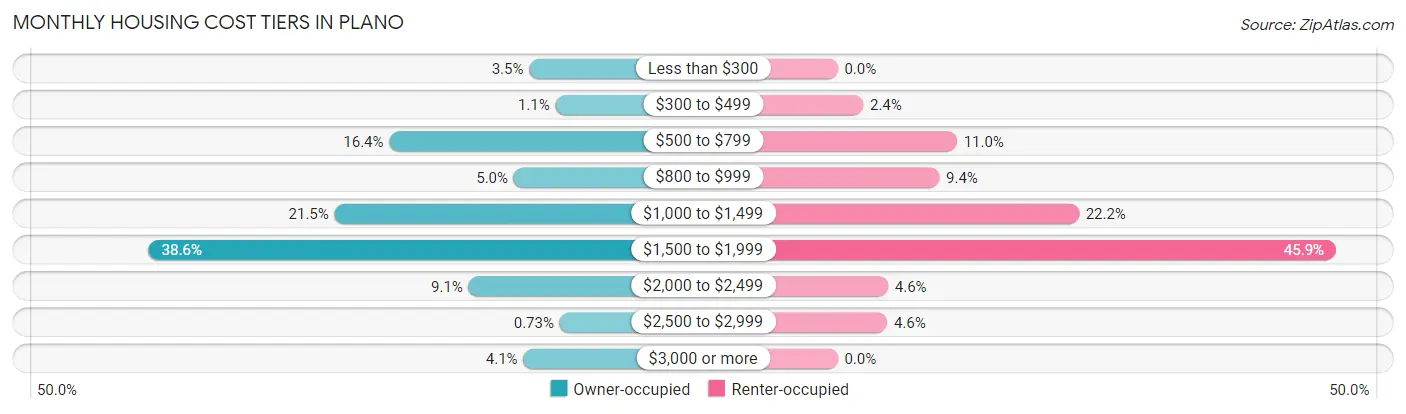
| Monthly Cost | Owner-occupied | Renter-occupied |
| Less than $300 | 92 (3.5%) | 0 (0.0%) |
| $300 to $499 | 29 (1.1%) | 29 (2.4%) |
| $500 to $799 | 427 (16.4%) | 135 (11.0%) |
| $800 to $999 | 129 (5.0%) | 115 (9.4%) |
| $1,000 to $1,499 | 558 (21.5%) | 273 (22.2%) |
| $1,500 to $1,999 | 1,003 (38.6%) | 564 (45.9%) |
| $2,000 to $2,499 | 237 (9.1%) | 57 (4.6%) |
| $2,500 to $2,999 | 19 (0.7%) | 56 (4.6%) |
| $3,000 or more | 106 (4.1%) | 0 (0.0%) |
| Total | 2,600 (100.0%) | 1,229 (100.0%) |
Physical Housing Characteristics in Plano
Housing Structures in Plano
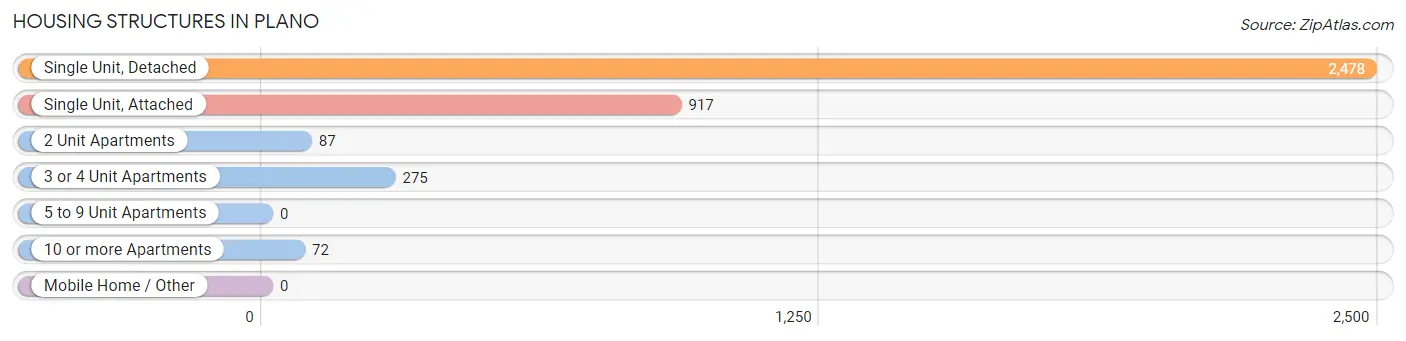
| Structure Type | # Housing Units | % Housing Units |
| Single Unit, Detached | 2,478 | 64.7% |
| Single Unit, Attached | 917 | 23.9% |
| 2 Unit Apartments | 87 | 2.3% |
| 3 or 4 Unit Apartments | 275 | 7.2% |
| 5 to 9 Unit Apartments | 0 | 0.0% |
| 10 or more Apartments | 72 | 1.9% |
| Mobile Home / Other | 0 | 0.0% |
| Total | 3,829 | 100.0% |
Housing Structures by Occupancy in Plano
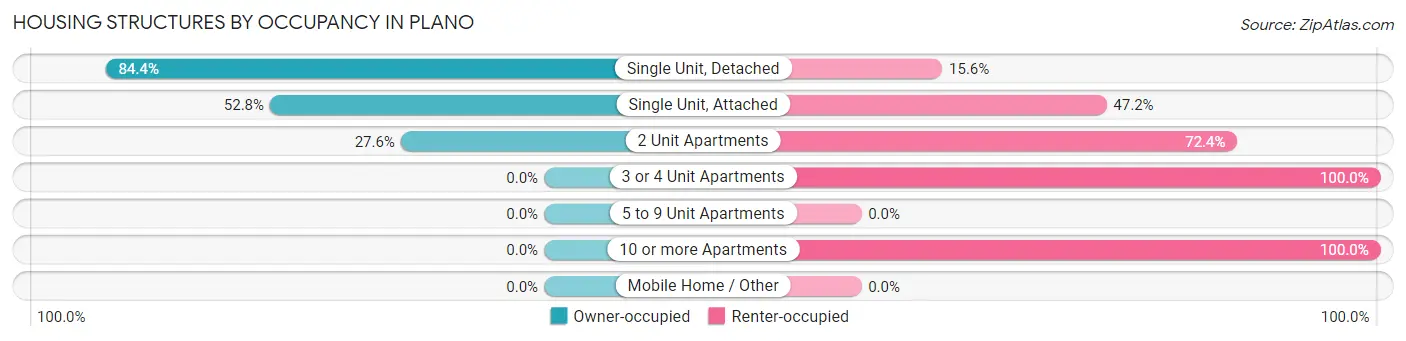
| Structure Type | Owner-occupied | Renter-occupied |
| Single Unit, Detached | 2,092 (84.4%) | 386 (15.6%) |
| Single Unit, Attached | 484 (52.8%) | 433 (47.2%) |
| 2 Unit Apartments | 24 (27.6%) | 63 (72.4%) |
| 3 or 4 Unit Apartments | 0 (0.0%) | 275 (100.0%) |
| 5 to 9 Unit Apartments | 0 (0.0%) | 0 (0.0%) |
| 10 or more Apartments | 0 (0.0%) | 72 (100.0%) |
| Mobile Home / Other | 0 (0.0%) | 0 (0.0%) |
| Total | 2,600 (67.9%) | 1,229 (32.1%) |
Housing Structures by Number of Rooms in Plano
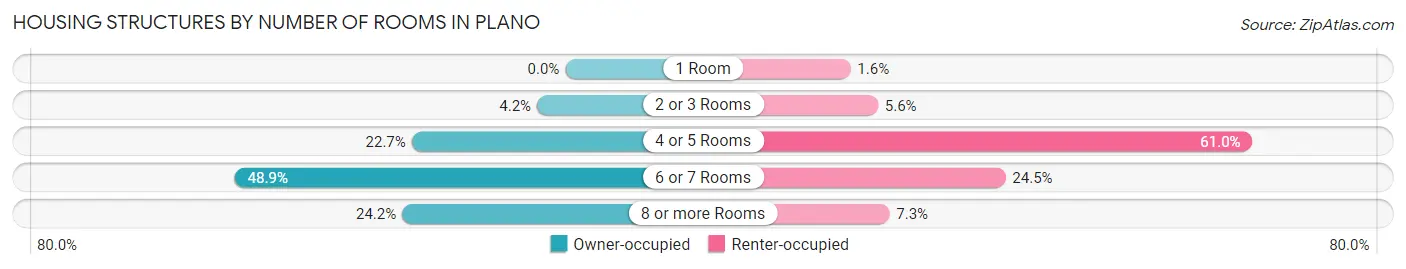
| Number of Rooms | Owner-occupied | Renter-occupied |
| 1 Room | 0 (0.0%) | 19 (1.5%) |
| 2 or 3 Rooms | 109 (4.2%) | 69 (5.6%) |
| 4 or 5 Rooms | 591 (22.7%) | 750 (61.0%) |
| 6 or 7 Rooms | 1,272 (48.9%) | 301 (24.5%) |
| 8 or more Rooms | 628 (24.1%) | 90 (7.3%) |
| Total | 2,600 (100.0%) | 1,229 (100.0%) |
Housing Structure by Heating Type in Plano
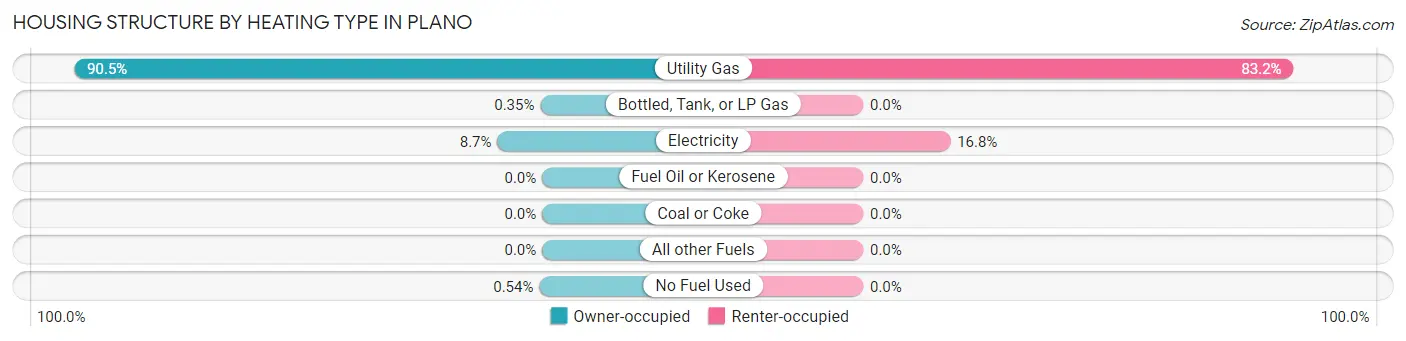
| Heating Type | Owner-occupied | Renter-occupied |
| Utility Gas | 2,352 (90.5%) | 1,022 (83.2%) |
| Bottled, Tank, or LP Gas | 9 (0.4%) | 0 (0.0%) |
| Electricity | 225 (8.6%) | 207 (16.8%) |
| Fuel Oil or Kerosene | 0 (0.0%) | 0 (0.0%) |
| Coal or Coke | 0 (0.0%) | 0 (0.0%) |
| All other Fuels | 0 (0.0%) | 0 (0.0%) |
| No Fuel Used | 14 (0.5%) | 0 (0.0%) |
| Total | 2,600 (100.0%) | 1,229 (100.0%) |
Household Vehicle Usage in Plano
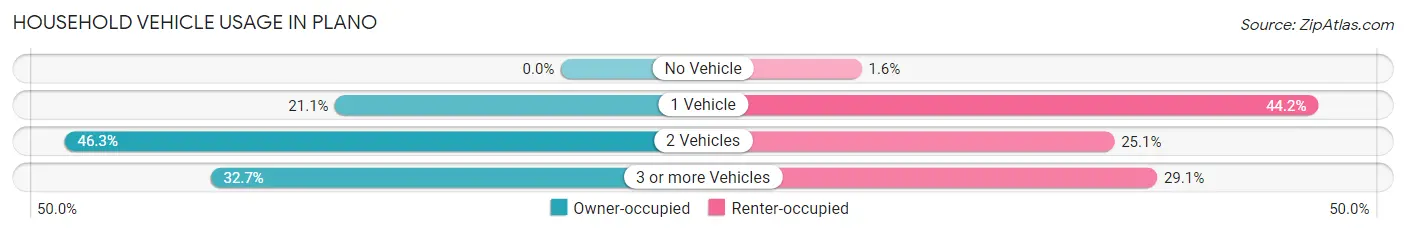
| Vehicles per Household | Owner-occupied | Renter-occupied |
| No Vehicle | 0 (0.0%) | 19 (1.5%) |
| 1 Vehicle | 548 (21.1%) | 543 (44.2%) |
| 2 Vehicles | 1,203 (46.3%) | 309 (25.1%) |
| 3 or more Vehicles | 849 (32.7%) | 358 (29.1%) |
| Total | 2,600 (100.0%) | 1,229 (100.0%) |
Real Estate & Mortgages in Plano
Real Estate and Mortgage Overview in Plano
| Characteristic | Without Mortgage | With Mortgage |
| Housing Units | 805 | 1,795 |
| Median Property Value | $199,900 | $203,700 |
| Median Household Income | $58,686 | $466 |
| Monthly Housing Costs | $665 | $106 |
| Real Estate Taxes | $3,918 | $0 |
Property Value by Mortgage Status in Plano
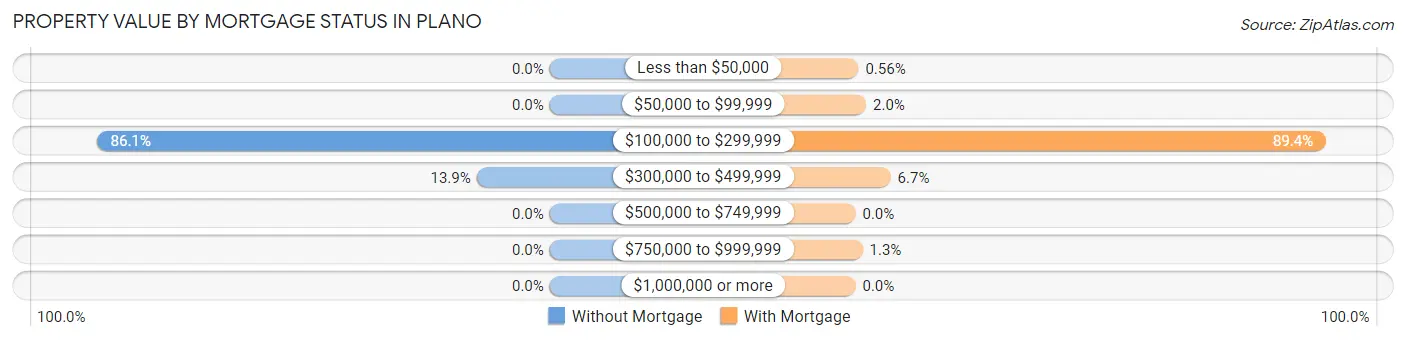
| Property Value | Without Mortgage | With Mortgage |
| Less than $50,000 | 0 (0.0%) | 10 (0.6%) |
| $50,000 to $99,999 | 0 (0.0%) | 36 (2.0%) |
| $100,000 to $299,999 | 693 (86.1%) | 1,605 (89.4%) |
| $300,000 to $499,999 | 112 (13.9%) | 120 (6.7%) |
| $500,000 to $749,999 | 0 (0.0%) | 0 (0.0%) |
| $750,000 to $999,999 | 0 (0.0%) | 24 (1.3%) |
| $1,000,000 or more | 0 (0.0%) | 0 (0.0%) |
| Total | 805 (100.0%) | 1,795 (100.0%) |
Household Income by Mortgage Status in Plano
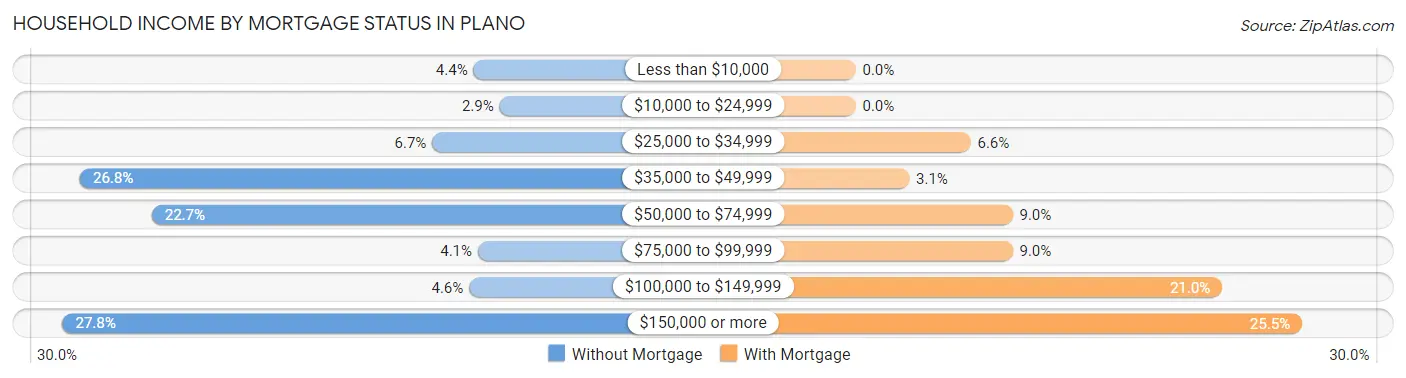
| Household Income | Without Mortgage | With Mortgage |
| Less than $10,000 | 35 (4.3%) | 0 (0.0%) |
| $10,000 to $24,999 | 23 (2.9%) | 0 (0.0%) |
| $25,000 to $34,999 | 54 (6.7%) | 118 (6.6%) |
| $35,000 to $49,999 | 216 (26.8%) | 55 (3.1%) |
| $50,000 to $74,999 | 183 (22.7%) | 161 (9.0%) |
| $75,000 to $99,999 | 33 (4.1%) | 161 (9.0%) |
| $100,000 to $149,999 | 37 (4.6%) | 376 (20.9%) |
| $150,000 or more | 224 (27.8%) | 458 (25.5%) |
| Total | 805 (100.0%) | 1,795 (100.0%) |
Property Value to Household Income Ratio in Plano
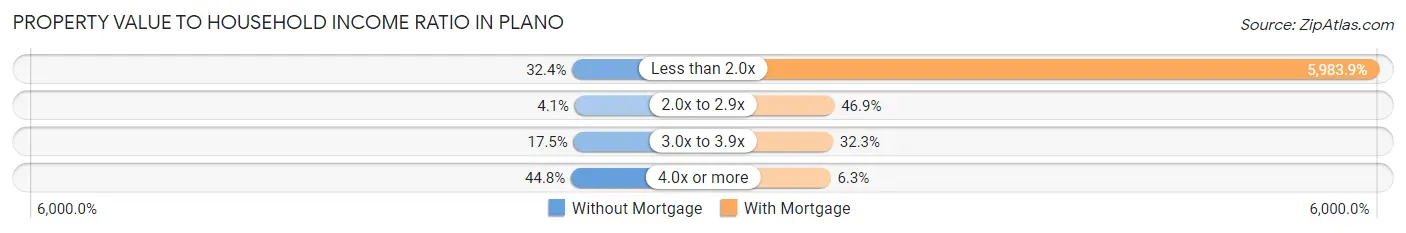
| Value-to-Income Ratio | Without Mortgage | With Mortgage |
| Less than 2.0x | 261 (32.4%) | 107,411 (5,983.9%) |
| 2.0x to 2.9x | 33 (4.1%) | 842 (46.9%) |
| 3.0x to 3.9x | 141 (17.5%) | 579 (32.3%) |
| 4.0x or more | 361 (44.8%) | 113 (6.3%) |
| Total | 805 (100.0%) | 1,795 (100.0%) |
Real Estate Taxes by Mortgage Status in Plano

| Property Taxes | Without Mortgage | With Mortgage |
| Less than $800 | 0 (0.0%) | 0 (0.0%) |
| $800 to $1,499 | 0 (0.0%) | 10 (0.6%) |
| $800 to $1,499 | 805 (100.0%) | 0 (0.0%) |
| Total | 805 (100.0%) | 1,795 (100.0%) |
Health & Disability in Plano
Health Insurance Coverage by Age in Plano
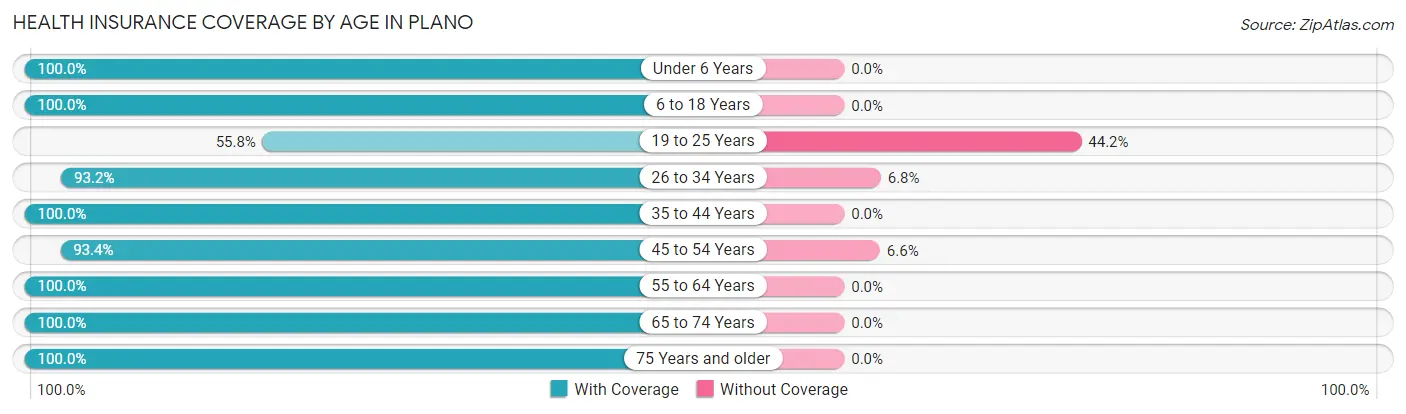
| Age Bracket | With Coverage | Without Coverage |
| Under 6 Years | 1,159 (100.0%) | 0 (0.0%) |
| 6 to 18 Years | 1,688 (100.0%) | 0 (0.0%) |
| 19 to 25 Years | 400 (55.8%) | 317 (44.2%) |
| 26 to 34 Years | 1,904 (93.2%) | 139 (6.8%) |
| 35 to 44 Years | 1,787 (100.0%) | 0 (0.0%) |
| 45 to 54 Years | 1,533 (93.4%) | 109 (6.6%) |
| 55 to 64 Years | 1,107 (100.0%) | 0 (0.0%) |
| 65 to 74 Years | 642 (100.0%) | 0 (0.0%) |
| 75 Years and older | 317 (100.0%) | 0 (0.0%) |
| Total | 10,537 (94.9%) | 565 (5.1%) |
Health Insurance Coverage by Citizenship Status in Plano

| Citizenship Status | With Coverage | Without Coverage |
| Native Born | 1,159 (100.0%) | 0 (0.0%) |
| Foreign Born, Citizen | 1,688 (100.0%) | 0 (0.0%) |
| Foreign Born, not a Citizen | 400 (55.8%) | 317 (44.2%) |
Health Insurance Coverage by Household Income in Plano
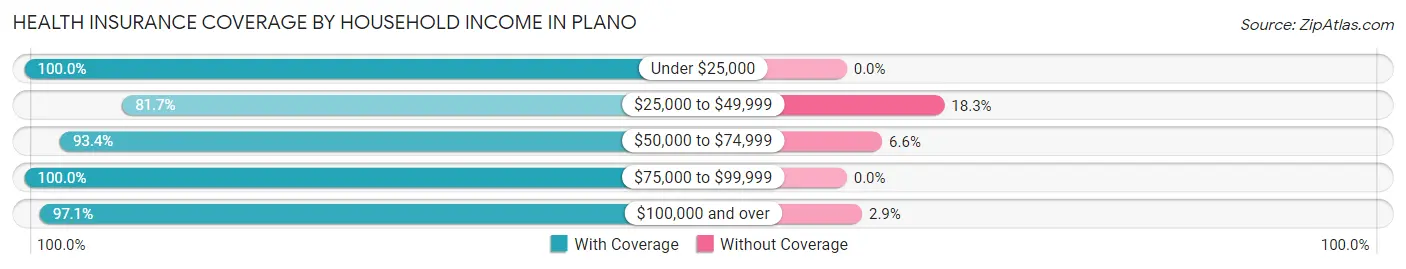
| Household Income | With Coverage | Without Coverage |
| Under $25,000 | 754 (100.0%) | 0 (0.0%) |
| $25,000 to $49,999 | 1,233 (81.7%) | 276 (18.3%) |
| $50,000 to $74,999 | 1,902 (93.4%) | 135 (6.6%) |
| $75,000 to $99,999 | 1,418 (100.0%) | 0 (0.0%) |
| $100,000 and over | 5,226 (97.1%) | 154 (2.9%) |
Public vs Private Health Insurance Coverage by Age in Plano
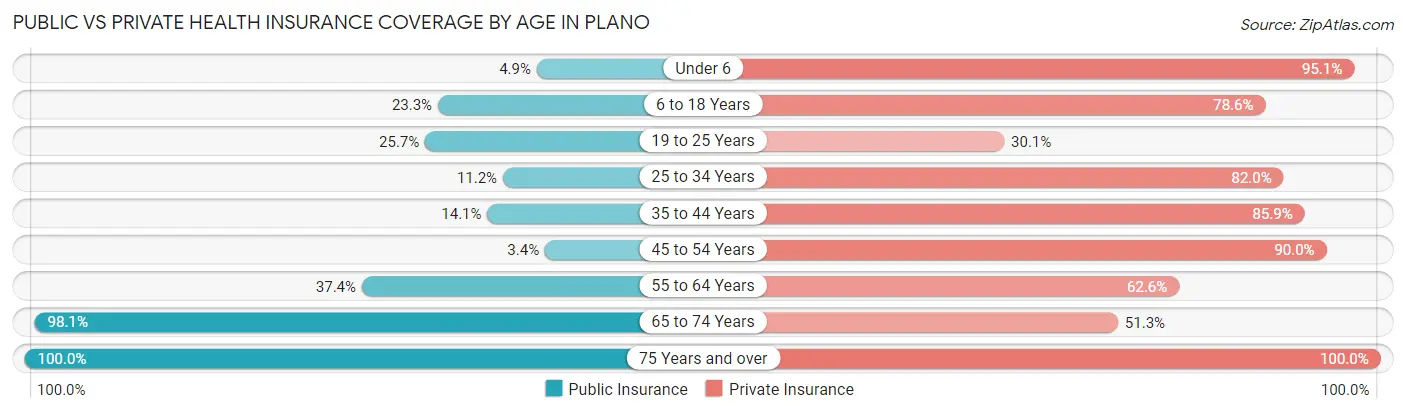
| Age Bracket | Public Insurance | Private Insurance |
| Under 6 | 57 (4.9%) | 1,102 (95.1%) |
| 6 to 18 Years | 393 (23.3%) | 1,327 (78.6%) |
| 19 to 25 Years | 184 (25.7%) | 216 (30.1%) |
| 25 to 34 Years | 229 (11.2%) | 1,675 (82.0%) |
| 35 to 44 Years | 252 (14.1%) | 1,535 (85.9%) |
| 45 to 54 Years | 56 (3.4%) | 1,477 (89.9%) |
| 55 to 64 Years | 414 (37.4%) | 693 (62.6%) |
| 65 to 74 Years | 630 (98.1%) | 329 (51.2%) |
| 75 Years and over | 317 (100.0%) | 317 (100.0%) |
| Total | 2,532 (22.8%) | 8,671 (78.1%) |
Disability Status by Sex by Age in Plano
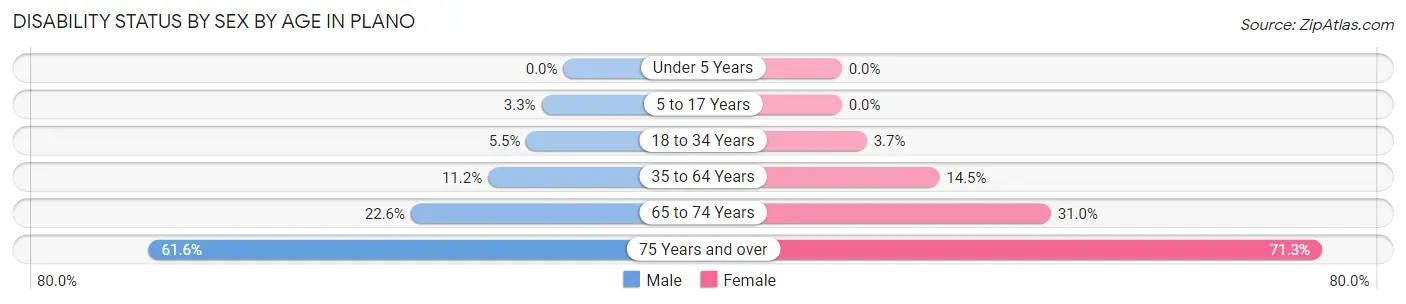
| Age Bracket | Male | Female |
| Under 5 Years | 0 (0.0%) | 0 (0.0%) |
| 5 to 17 Years | 29 (3.3%) | 0 (0.0%) |
| 18 to 34 Years | 99 (5.5%) | 45 (3.7%) |
| 35 to 64 Years | 242 (11.2%) | 344 (14.5%) |
| 65 to 74 Years | 60 (22.6%) | 117 (31.0%) |
| 75 Years and over | 133 (61.6%) | 72 (71.3%) |
Disability Class by Sex by Age in Plano
Disability Class: Hearing Difficulty
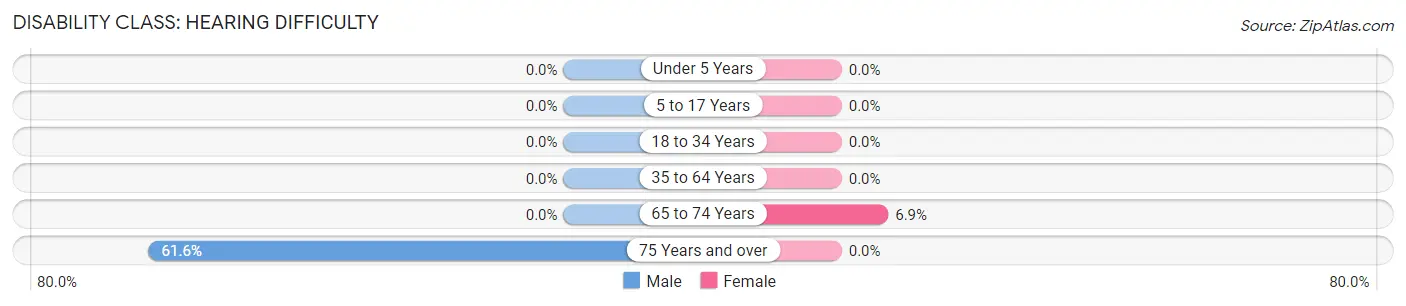
| Age Bracket | Male | Female |
| Under 5 Years | 0 (0.0%) | 0 (0.0%) |
| 5 to 17 Years | 0 (0.0%) | 0 (0.0%) |
| 18 to 34 Years | 0 (0.0%) | 0 (0.0%) |
| 35 to 64 Years | 0 (0.0%) | 0 (0.0%) |
| 65 to 74 Years | 0 (0.0%) | 26 (6.9%) |
| 75 Years and over | 133 (61.6%) | 0 (0.0%) |
Disability Class: Vision Difficulty
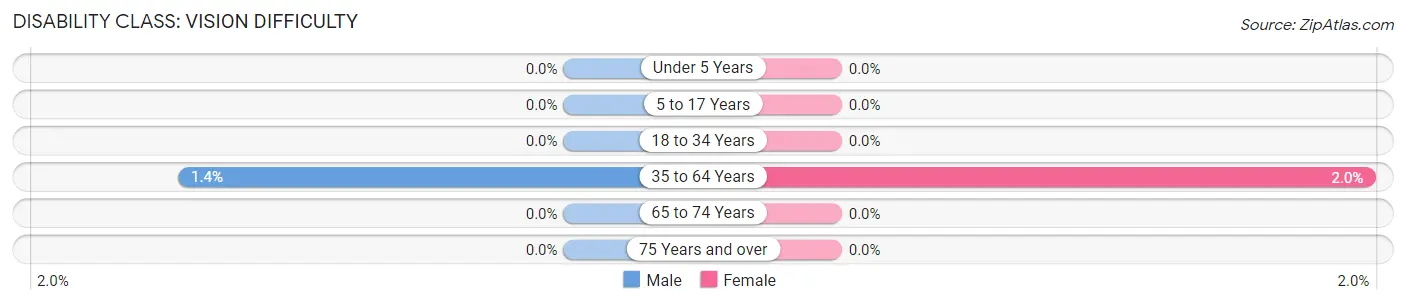
| Age Bracket | Male | Female |
| Under 5 Years | 0 (0.0%) | 0 (0.0%) |
| 5 to 17 Years | 0 (0.0%) | 0 (0.0%) |
| 18 to 34 Years | 0 (0.0%) | 0 (0.0%) |
| 35 to 64 Years | 31 (1.4%) | 47 (2.0%) |
| 65 to 74 Years | 0 (0.0%) | 0 (0.0%) |
| 75 Years and over | 0 (0.0%) | 0 (0.0%) |
Disability Class: Cognitive Difficulty
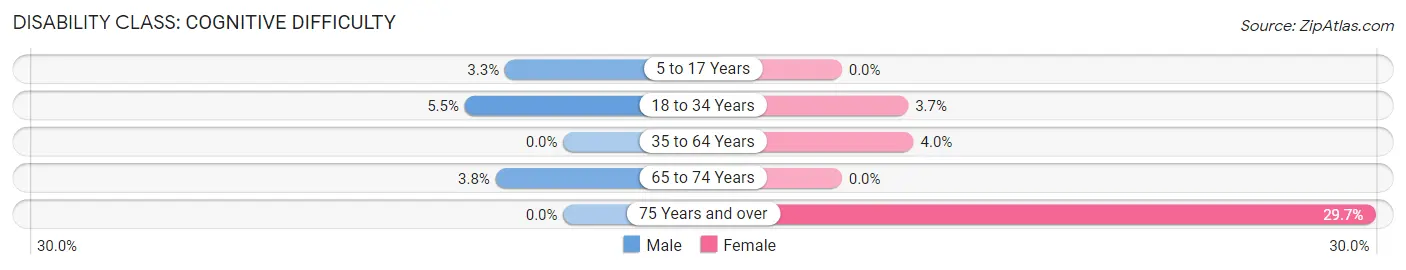
| Age Bracket | Male | Female |
| 5 to 17 Years | 29 (3.3%) | 0 (0.0%) |
| 18 to 34 Years | 99 (5.5%) | 45 (3.7%) |
| 35 to 64 Years | 0 (0.0%) | 95 (4.0%) |
| 65 to 74 Years | 10 (3.8%) | 0 (0.0%) |
| 75 Years and over | 0 (0.0%) | 30 (29.7%) |
Disability Class: Ambulatory Difficulty
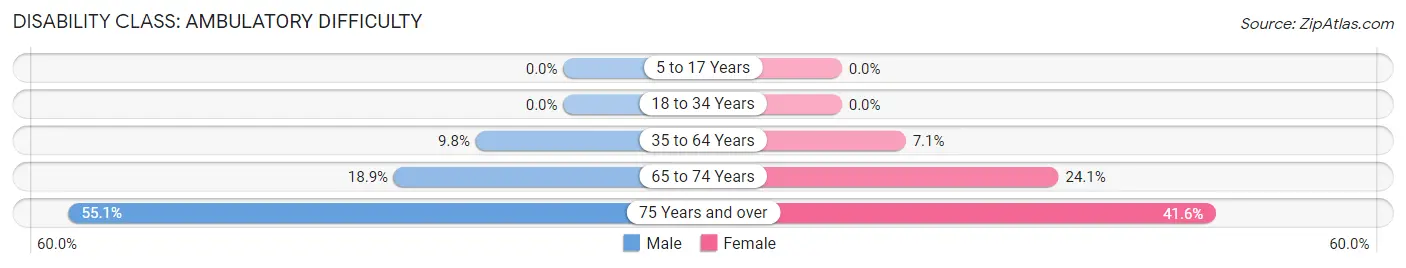
| Age Bracket | Male | Female |
| 5 to 17 Years | 0 (0.0%) | 0 (0.0%) |
| 18 to 34 Years | 0 (0.0%) | 0 (0.0%) |
| 35 to 64 Years | 211 (9.8%) | 169 (7.1%) |
| 65 to 74 Years | 50 (18.9%) | 91 (24.1%) |
| 75 Years and over | 119 (55.1%) | 42 (41.6%) |
Disability Class: Self-Care Difficulty
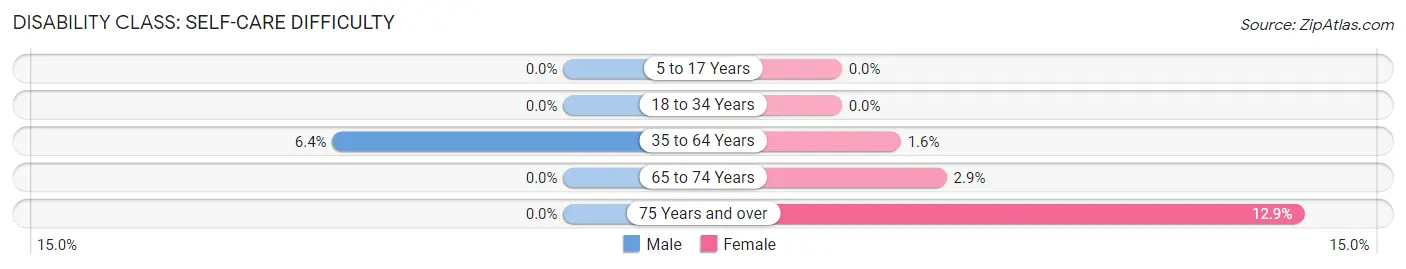
| Age Bracket | Male | Female |
| 5 to 17 Years | 0 (0.0%) | 0 (0.0%) |
| 18 to 34 Years | 0 (0.0%) | 0 (0.0%) |
| 35 to 64 Years | 139 (6.4%) | 39 (1.6%) |
| 65 to 74 Years | 0 (0.0%) | 11 (2.9%) |
| 75 Years and over | 0 (0.0%) | 13 (12.9%) |
Technology Access in Plano
Computing Device Access in Plano
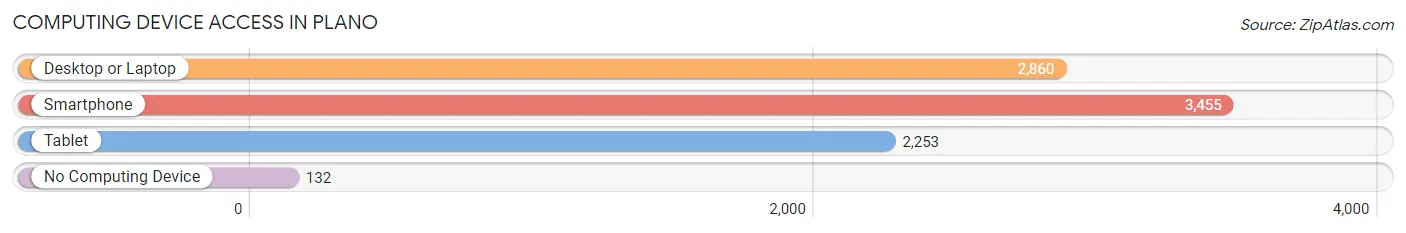
| Device Type | # Households | % Households |
| Desktop or Laptop | 2,860 | 74.7% |
| Smartphone | 3,455 | 90.2% |
| Tablet | 2,253 | 58.8% |
| No Computing Device | 132 | 3.5% |
| Total | 3,829 | 100.0% |
Internet Access in Plano
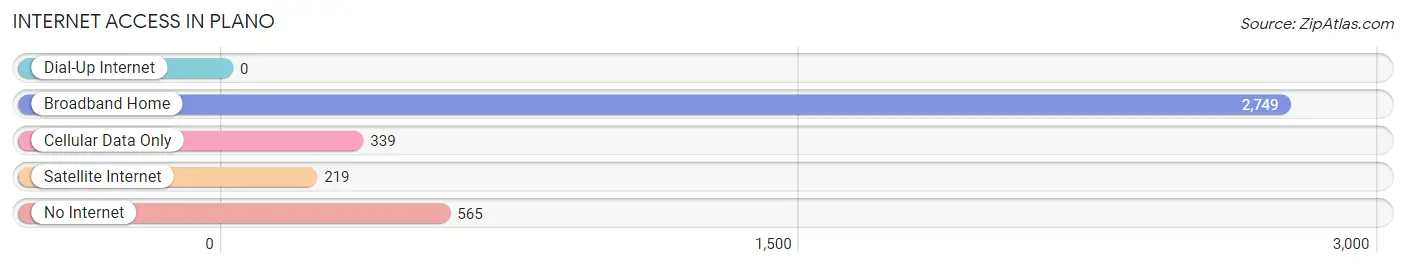
| Internet Type | # Households | % Households |
| Dial-Up Internet | 0 | 0.0% |
| Broadband Home | 2,749 | 71.8% |
| Cellular Data Only | 339 | 8.8% |
| Satellite Internet | 219 | 5.7% |
| No Internet | 565 | 14.8% |
| Total | 3,829 | 100.0% |
Plano Summary
Plano, Illinois is a small city located in Kendall County, approximately 50 miles southwest of Chicago. It is part of the Chicago metropolitan area and is home to a population of 10,856 people as of the 2010 census. The city is known for its historic downtown area, which is home to a variety of shops, restaurants, and other businesses.
History
Plano was first settled in 1834 by a group of settlers from New York. The town was originally called Channahon, but was later changed to Plano in 1854. The name Plano is derived from the Latin word for “flat”, which was chosen to describe the flat terrain of the area.
The city was officially incorporated in 1869 and quickly grew in population and industry. The first railroad line was built in 1871, connecting Plano to Chicago. This allowed for the transportation of goods and people, and helped to spur the growth of the city.
In the late 19th century, Plano was home to a variety of industries, including a brickyard, a flour mill, a sawmill, and a furniture factory. The city also had a thriving agricultural industry, with many farmers growing corn, wheat, and other crops.
Geography
Plano is located in the northern part of Kendall County, approximately 50 miles southwest of Chicago. The city is situated on the Fox River, which flows through the city and provides a variety of recreational opportunities.
The city has a total area of 4.2 square miles, of which 4.1 square miles is land and 0.1 square miles is water. The terrain is mostly flat, with some rolling hills in the northern part of the city.
Economy
Plano’s economy is largely based on agriculture and manufacturing. The city is home to a variety of agricultural businesses, including farms, nurseries, and greenhouses. The city also has a number of manufacturing businesses, including a plastics factory, a metal fabrication plant, and a printing company.
The city is also home to a variety of retail businesses, including restaurants, grocery stores, and clothing stores. The city also has a number of professional services, such as law firms, accounting firms, and medical offices.
Demographics
As of the 2010 census, Plano had a population of 10,856 people. The racial makeup of the city was 87.3% White, 5.3% African American, 0.4% Native American, 0.7% Asian, 0.1% Pacific Islander, 4.2% from other races, and 2.0% from two or more races. Hispanic or Latino of any race were 8.7% of the population.
The median household income in Plano was $50,945, and the median family income was $60,945. The per capita income for the city was $24,945. About 8.3% of families and 10.2% of the population were below the poverty line, including 14.2% of those under age 18 and 6.2% of those age 65 or over.
Conclusion
Plano, Illinois is a small city located in Kendall County, approximately 50 miles southwest of Chicago. It is part of the Chicago metropolitan area and is home to a population of 10,856 people as of the 2010 census. The city is known for its historic downtown area, which is home to a variety of shops, restaurants, and other businesses. Plano’s economy is largely based on agriculture and manufacturing, and the city is home to a variety of retail businesses, professional services, and other businesses. The racial makeup of the city is mostly White, with a small percentage of African American, Native American, Asian, and Pacific Islander residents. The median household income in Plano is $50,945, and the per capita income is $24,945.
Common Questions
What is Per Capita Income in Plano?
Per Capita income in Plano is $34,136.
What is the Median Family Income in Plano?
Median Family Income in Plano is $90,166.
What is the Median Household income in Plano?
Median Household Income in Plano is $88,018.
What is Income or Wage Gap in Plano?
Income or Wage Gap in Plano is 28.9%.
Women in Plano earn 71.1 cents for every dollar earned by a man.
What is Inequality or Gini Index in Plano?
Inequality or Gini Index in Plano is 0.34.
What is the Total Population of Plano?
Total Population of Plano is 11,113.
What is the Total Male Population of Plano?
Total Male Population of Plano is 5,592.
What is the Total Female Population of Plano?
Total Female Population of Plano is 5,521.
What is the Ratio of Males per 100 Females in Plano?
There are 101.29 Males per 100 Females in Plano.
What is the Ratio of Females per 100 Males in Plano?
There are 98.73 Females per 100 Males in Plano.
What is the Median Population Age in Plano?
Median Population Age in Plano is 34.6 Years.
What is the Average Family Size in Plano
Average Family Size in Plano is 3.6 People.
What is the Average Household Size in Plano
Average Household Size in Plano is 2.9 People.
How Large is the Labor Force in Plano?
There are 6,967 People in the Labor Forcein in Plano.
What is the Percentage of People in the Labor Force in Plano?
80.0% of People are in the Labor Force in Plano.
What is the Unemployment Rate in Plano?
Unemployment Rate in Plano is 8.8%.