Indialantic, FL Map & Demographics
Indialantic Map
Indialantic Overview
$62,657
PER CAPITA INCOME
$103,333
AVG FAMILY INCOME
$74,237
AVG HOUSEHOLD INCOME
24.3%
WAGE / INCOME GAP [ % ]
75.7¢/ $1
WAGE / INCOME GAP [ $ ]
$5,909
FAMILY INCOME DEFICIT
0.52
INEQUALITY / GINI INDEX
3,016
TOTAL POPULATION
1,639
MALE POPULATION
1,377
FEMALE POPULATION
119.03
MALES / 100 FEMALES
84.01
FEMALES / 100 MALES
51.7
MEDIAN AGE
2.7
AVG FAMILY SIZE
2.1
AVG HOUSEHOLD SIZE
1,474
LABOR FORCE [ PEOPLE ]
57.1%
PERCENT IN LABOR FORCE
5.8%
UNEMPLOYMENT RATE
Indialantic Zip Codes
Indialantic Area Codes
Income in Indialantic
Income Overview in Indialantic
Per Capita Income in Indialantic is $62,657, while median incomes of families and households are $103,333 and $74,237 respectively.
| Characteristic | Number | Measure |
| Per Capita Income | 3,016 | $62,657 |
| Median Family Income | 818 | $103,333 |
| Mean Family Income | 818 | $155,429 |
| Median Household Income | 1,460 | $74,237 |
| Mean Household Income | 1,460 | $127,099 |
| Income Deficit | 818 | $5,909 |
| Wage / Income Gap (%) | 3,016 | 24.28% |
| Wage / Income Gap ($) | 3,016 | 75.72¢ per $1 |
| Gini / Inequality Index | 3,016 | 0.52 |
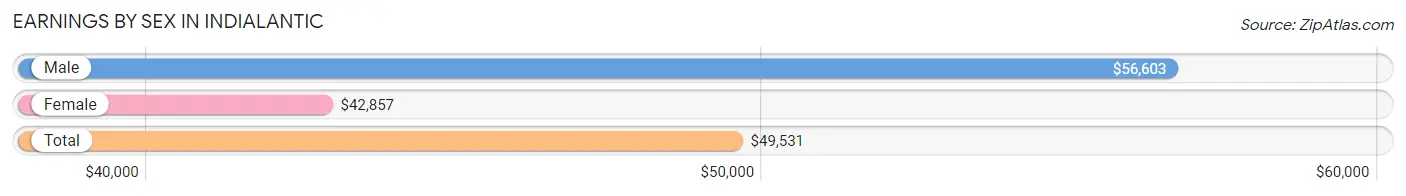
Earnings by Sex in Indialantic
Average Earnings in Indialantic are $49,531, $56,603 for men and $42,857 for women, a difference of 24.3%.
| Sex | Number | Average Earnings |
| Male | 934 (62.2%) | $56,603 |
| Female | 568 (37.8%) | $42,857 |
| Total | 1,502 (100.0%) | $49,531 |
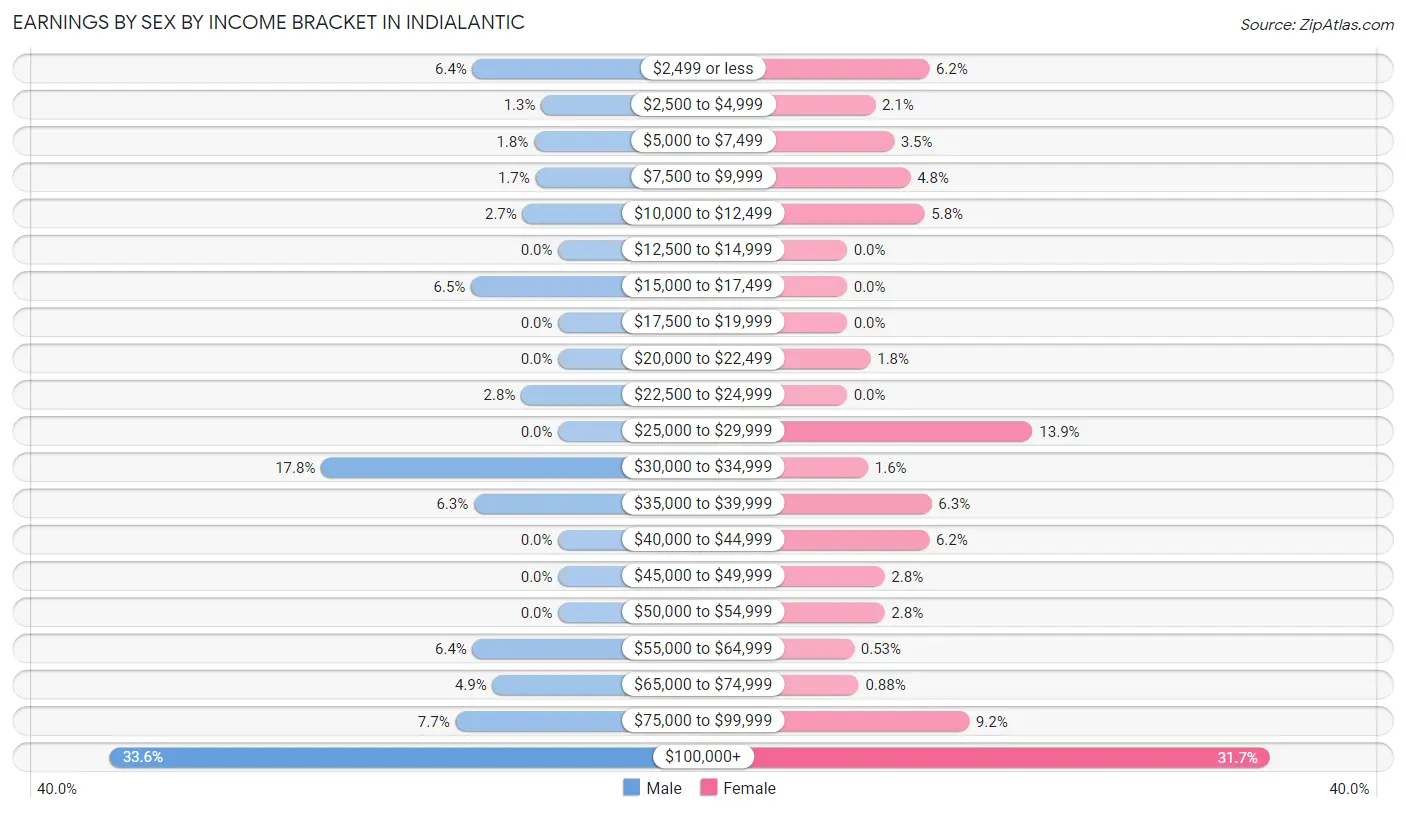
Earnings by Sex by Income Bracket in Indialantic
The most common earnings brackets in Indialantic are $100,000+ for men (314 | 33.6%) and $100,000+ for women (180 | 31.7%).
| Income | Male | Female |
| $2,499 or less | 60 (6.4%) | 35 (6.2%) |
| $2,500 to $4,999 | 12 (1.3%) | 12 (2.1%) |
| $5,000 to $7,499 | 17 (1.8%) | 20 (3.5%) |
| $7,500 to $9,999 | 16 (1.7%) | 27 (4.8%) |
| $10,000 to $12,499 | 25 (2.7%) | 33 (5.8%) |
| $12,500 to $14,999 | 0 (0.0%) | 0 (0.0%) |
| $15,000 to $17,499 | 61 (6.5%) | 0 (0.0%) |
| $17,500 to $19,999 | 0 (0.0%) | 0 (0.0%) |
| $20,000 to $22,499 | 0 (0.0%) | 10 (1.8%) |
| $22,500 to $24,999 | 26 (2.8%) | 0 (0.0%) |
| $25,000 to $29,999 | 0 (0.0%) | 79 (13.9%) |
| $30,000 to $34,999 | 166 (17.8%) | 9 (1.6%) |
| $35,000 to $39,999 | 59 (6.3%) | 36 (6.3%) |
| $40,000 to $44,999 | 0 (0.0%) | 35 (6.2%) |
| $45,000 to $49,999 | 0 (0.0%) | 16 (2.8%) |
| $50,000 to $54,999 | 0 (0.0%) | 16 (2.8%) |
| $55,000 to $64,999 | 60 (6.4%) | 3 (0.5%) |
| $65,000 to $74,999 | 46 (4.9%) | 5 (0.9%) |
| $75,000 to $99,999 | 72 (7.7%) | 52 (9.1%) |
| $100,000+ | 314 (33.6%) | 180 (31.7%) |
| Total | 934 (100.0%) | 568 (100.0%) |
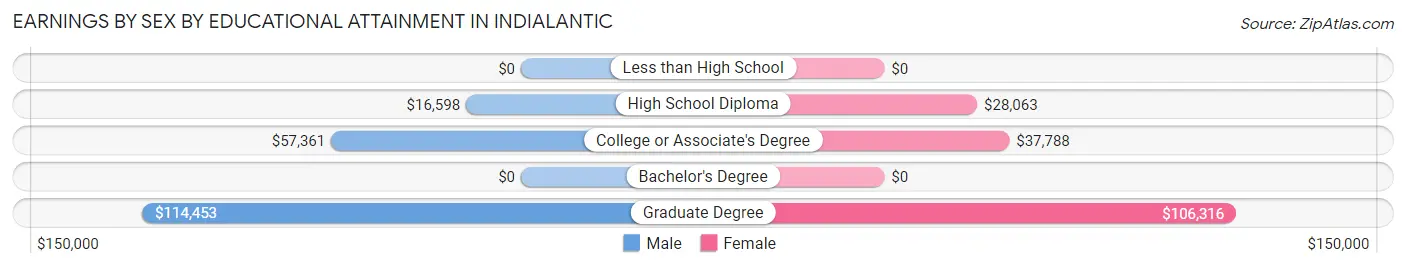
Earnings by Sex by Educational Attainment in Indialantic
Average earnings in Indialantic are $63,611 for men and $47,969 for women, a difference of 24.6%. Men with an educational attainment of graduate degree enjoy the highest average annual earnings of $114,453, while those with high school diploma education earn the least with $16,598. Women with an educational attainment of graduate degree earn the most with the average annual earnings of $106,316, while those with high school diploma education have the smallest earnings of $28,063.
| Educational Attainment | Male Income | Female Income |
| Less than High School | - | - |
| High School Diploma | $16,598 | $28,063 |
| College or Associate's Degree | $57,361 | $37,788 |
| Bachelor's Degree | - | - |
| Graduate Degree | $114,453 | $106,316 |
| Total | $63,611 | $47,969 |
Family Income in Indialantic
Family Income Brackets in Indialantic
According to the Indialantic family income data, there are 209 families falling into the $200,000+ income range, which is the most common income bracket and makes up 25.6% of all families.
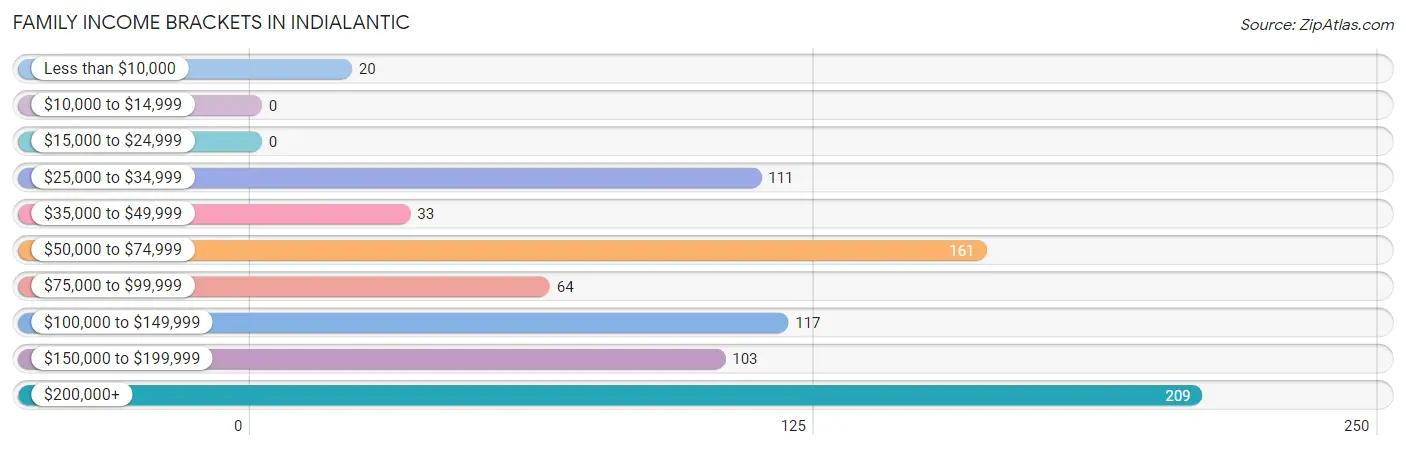
| Income Bracket | # Families | % Families |
| Less than $10,000 | 20 | 2.4% |
| $10,000 to $14,999 | 0 | 0.0% |
| $15,000 to $24,999 | 0 | 0.0% |
| $25,000 to $34,999 | 111 | 13.6% |
| $35,000 to $49,999 | 33 | 4.0% |
| $50,000 to $74,999 | 161 | 19.7% |
| $75,000 to $99,999 | 64 | 7.8% |
| $100,000 to $149,999 | 117 | 14.3% |
| $150,000 to $199,999 | 103 | 12.6% |
| $200,000+ | 209 | 25.6% |
Family Income by Famaliy Size in Indialantic
3-person families (74 | 9.0%) account for the highest median family income in Indialantic with $217,083 per family, while 3-person families (74 | 9.0%) have the highest median income of $72,361 per family member.
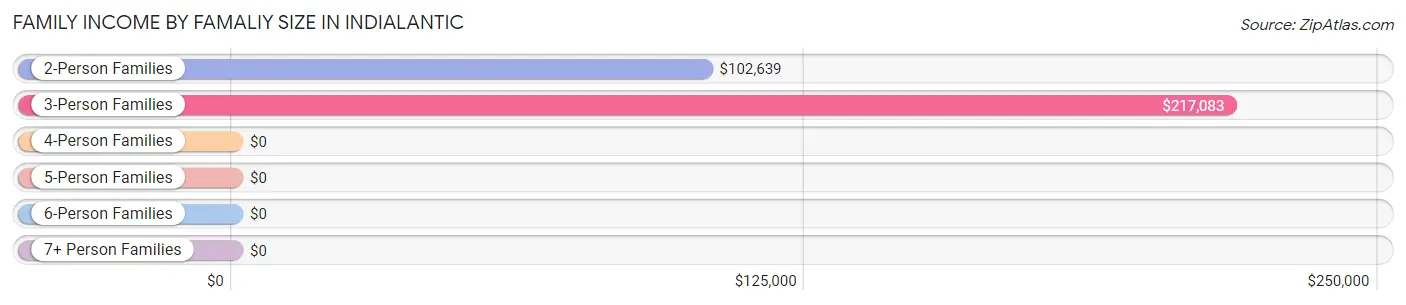
| Income Bracket | # Families | Median Income |
| 2-Person Families | 567 (69.3%) | $102,639 |
| 3-Person Families | 74 (9.0%) | $217,083 |
| 4-Person Families | 142 (17.4%) | $0 |
| 5-Person Families | 35 (4.3%) | $0 |
| 6-Person Families | 0 (0.0%) | $0 |
| 7+ Person Families | 0 (0.0%) | $0 |
| Total | 818 (100.0%) | $103,333 |
Family Income by Number of Earners in Indialantic
The median family income in Indialantic is $103,333, with families comprising 2 earners (303) having the highest median family income of $214,659, while families with no earners (297) have the lowest median family income of $74,432, accounting for 37.0% and 36.3% of families, respectively.
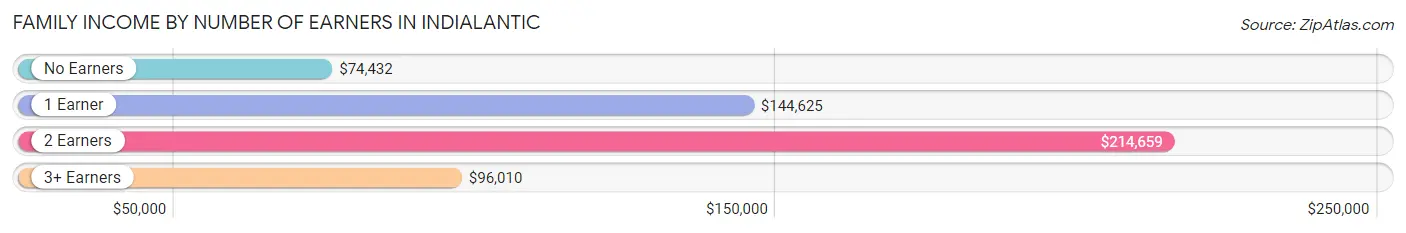
| Number of Earners | # Families | Median Income |
| No Earners | 297 (36.3%) | $74,432 |
| 1 Earner | 165 (20.2%) | $144,625 |
| 2 Earners | 303 (37.0%) | $214,659 |
| 3+ Earners | 53 (6.5%) | $96,010 |
| Total | 818 (100.0%) | $103,333 |
Household Income in Indialantic
Household Income Brackets in Indialantic
With 299 households falling in the category, the $200,000+ income range is the most frequent in Indialantic, accounting for 20.5% of all households. In contrast, only 10 households (0.7%) fall into the $10,000 to $14,999 income bracket, making it the least populous group.
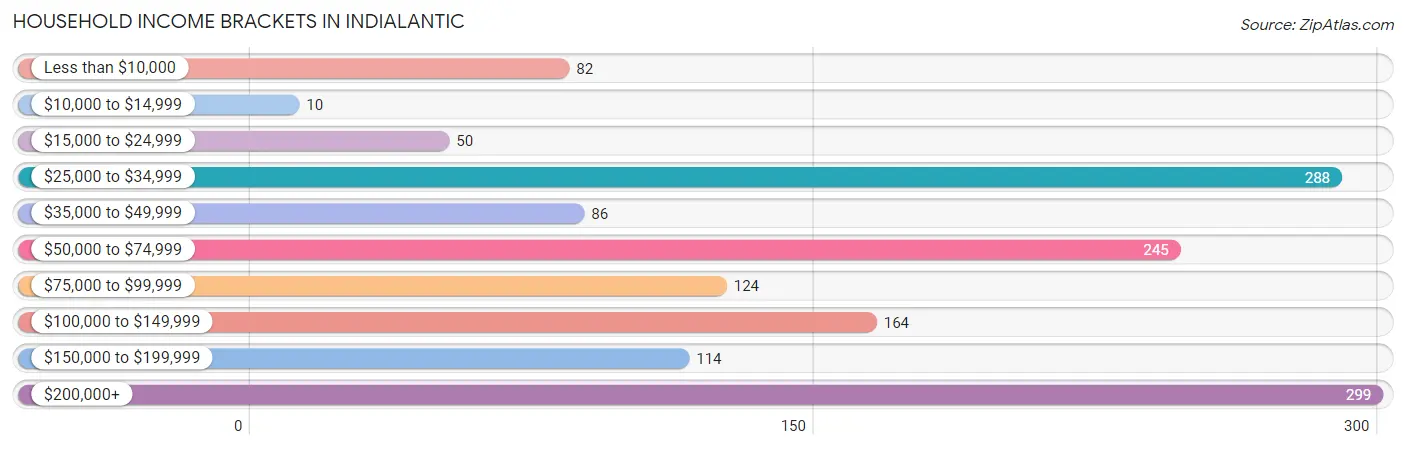
| Income Bracket | # Households | % Households |
| Less than $10,000 | 82 | 5.6% |
| $10,000 to $14,999 | 10 | 0.7% |
| $15,000 to $24,999 | 50 | 3.4% |
| $25,000 to $34,999 | 288 | 19.7% |
| $35,000 to $49,999 | 86 | 5.9% |
| $50,000 to $74,999 | 245 | 16.8% |
| $75,000 to $99,999 | 124 | 8.5% |
| $100,000 to $149,999 | 164 | 11.2% |
| $150,000 to $199,999 | 114 | 7.8% |
| $200,000+ | 299 | 20.5% |
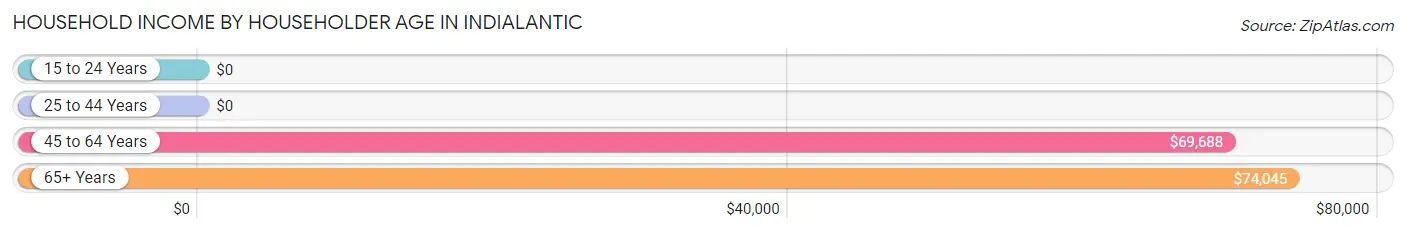
Household Income by Householder Age in Indialantic
The median household income in Indialantic is $74,237, with the highest median household income of $74,045 found in the 65+ years age bracket for the primary householder. A total of 485 households (33.2%) fall into this category.
| Income Bracket | # Households | Median Income |
| 15 to 24 Years | 0 (0.0%) | $0 |
| 25 to 44 Years | 271 (18.6%) | $0 |
| 45 to 64 Years | 704 (48.2%) | $69,688 |
| 65+ Years | 485 (33.2%) | $74,045 |
| Total | 1,460 (100.0%) | $74,237 |
Poverty in Indialantic
Income Below Poverty by Sex and Age in Indialantic
With 19.7% poverty level for males and 10.7% for females among the residents of Indialantic, 18 to 24 year old males and 35 to 44 year old females are the most vulnerable to poverty, with 18 males (100.0%) and 72 females (39.3%) in their respective age groups living below the poverty level.
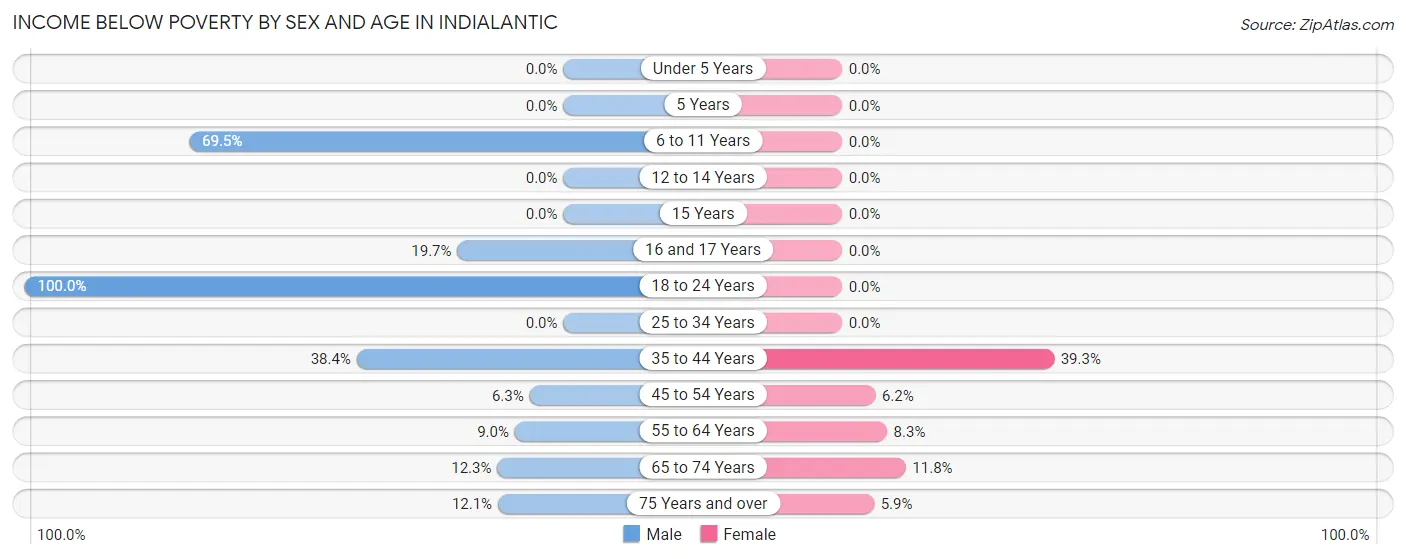
| Age Bracket | Male | Female |
| Under 5 Years | 0 (0.0%) | 0 (0.0%) |
| 5 Years | 0 (0.0%) | 0 (0.0%) |
| 6 to 11 Years | 116 (69.5%) | 0 (0.0%) |
| 12 to 14 Years | 0 (0.0%) | 0 (0.0%) |
| 15 Years | 0 (0.0%) | 0 (0.0%) |
| 16 and 17 Years | 12 (19.7%) | 0 (0.0%) |
| 18 to 24 Years | 18 (100.0%) | 0 (0.0%) |
| 25 to 34 Years | 0 (0.0%) | 0 (0.0%) |
| 35 to 44 Years | 84 (38.4%) | 72 (39.3%) |
| 45 to 54 Years | 23 (6.3%) | 12 (6.1%) |
| 55 to 64 Years | 21 (9.0%) | 20 (8.3%) |
| 65 to 74 Years | 32 (12.3%) | 34 (11.8%) |
| 75 Years and over | 17 (12.1%) | 10 (5.9%) |
| Total | 323 (19.7%) | 148 (10.7%) |
Income Above Poverty by Sex and Age in Indialantic
According to the poverty statistics in Indialantic, males aged under 5 years and females aged under 5 years are the age groups that are most secure financially, with 100.0% of males and 100.0% of females in these age groups living above the poverty line.
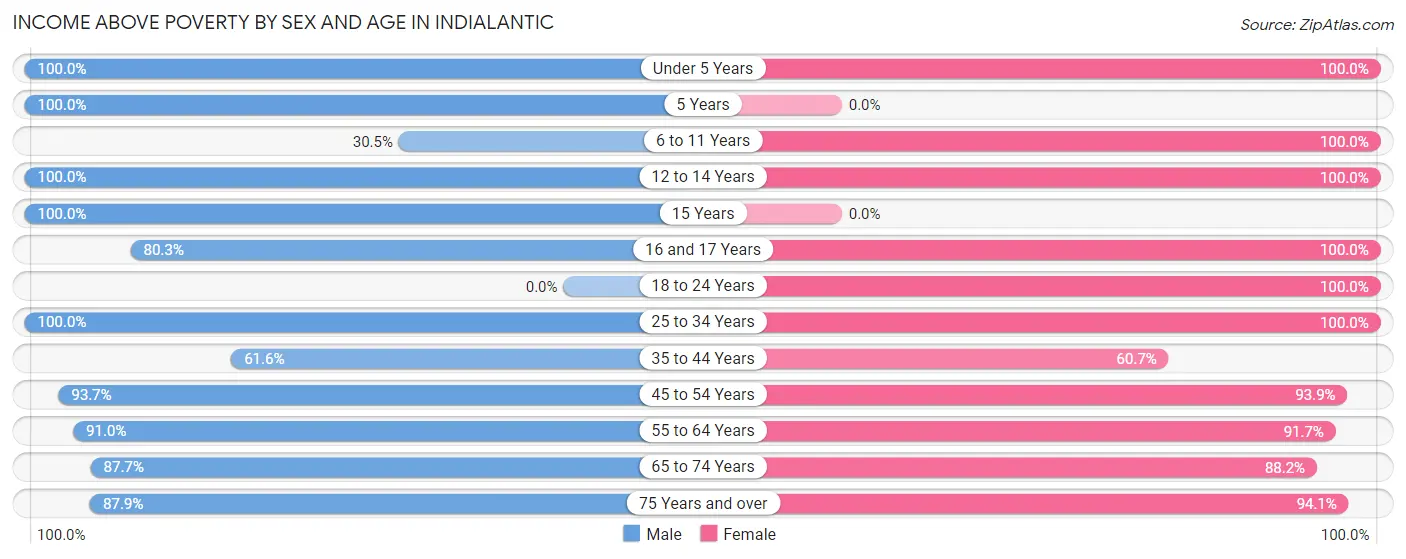
| Age Bracket | Male | Female |
| Under 5 Years | 35 (100.0%) | 57 (100.0%) |
| 5 Years | 9 (100.0%) | 0 (0.0%) |
| 6 to 11 Years | 51 (30.5%) | 68 (100.0%) |
| 12 to 14 Years | 15 (100.0%) | 40 (100.0%) |
| 15 Years | 44 (100.0%) | 0 (0.0%) |
| 16 and 17 Years | 49 (80.3%) | 17 (100.0%) |
| 18 to 24 Years | 0 (0.0%) | 84 (100.0%) |
| 25 to 34 Years | 70 (100.0%) | 36 (100.0%) |
| 35 to 44 Years | 135 (61.6%) | 111 (60.7%) |
| 45 to 54 Years | 344 (93.7%) | 183 (93.9%) |
| 55 to 64 Years | 212 (91.0%) | 220 (91.7%) |
| 65 to 74 Years | 229 (87.7%) | 254 (88.2%) |
| 75 Years and over | 123 (87.9%) | 159 (94.1%) |
| Total | 1,316 (80.3%) | 1,229 (89.2%) |
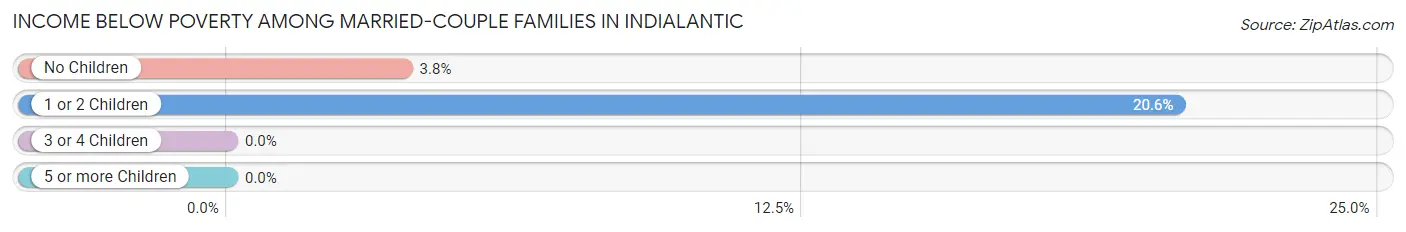
Income Below Poverty Among Married-Couple Families in Indialantic
The poverty statistics for married-couple families in Indialantic show that 8.8% or 67 of the total 762 families live below the poverty line. Families with 1 or 2 children have the highest poverty rate of 20.6%, comprising of 47 families. On the other hand, families with 3 or 4 children have the lowest poverty rate of 0.0%, which includes 0 families.
| Children | Above Poverty | Below Poverty |
| No Children | 506 (96.2%) | 20 (3.8%) |
| 1 or 2 Children | 181 (79.4%) | 47 (20.6%) |
| 3 or 4 Children | 8 (100.0%) | 0 (0.0%) |
| 5 or more Children | 0 (0.0%) | 0 (0.0%) |
| Total | 695 (91.2%) | 67 (8.8%) |
Income Below Poverty Among Single-Parent Households in Indialantic
| Children | Single Father | Single Mother |
| No Children | 0 (0.0%) | 0 (0.0%) |
| 1 or 2 Children | 0 (0.0%) | 0 (0.0%) |
| 3 or 4 Children | 0 (0.0%) | 0 (0.0%) |
| 5 or more Children | 0 (0.0%) | 0 (0.0%) |
| Total | 0 (0.0%) | 0 (0.0%) |
Income Below Poverty Among Married-Couple vs Single-Parent Households in Indialantic
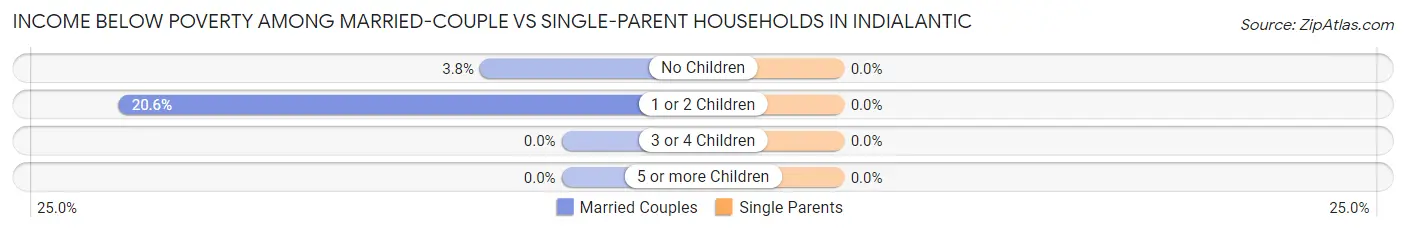
| Children | Married-Couple Families | Single-Parent Households |
| No Children | 20 (3.8%) | 0 (0.0%) |
| 1 or 2 Children | 47 (20.6%) | 0 (0.0%) |
| 3 or 4 Children | 0 (0.0%) | 0 (0.0%) |
| 5 or more Children | 0 (0.0%) | 0 (0.0%) |
| Total | 67 (8.8%) | 0 (0.0%) |
Race in Indialantic
The most populous races in Indialantic are White / Caucasian (2,773 | 91.9%), Two or more Races (206 | 6.8%), and Hispanic or Latino (102 | 3.4%).
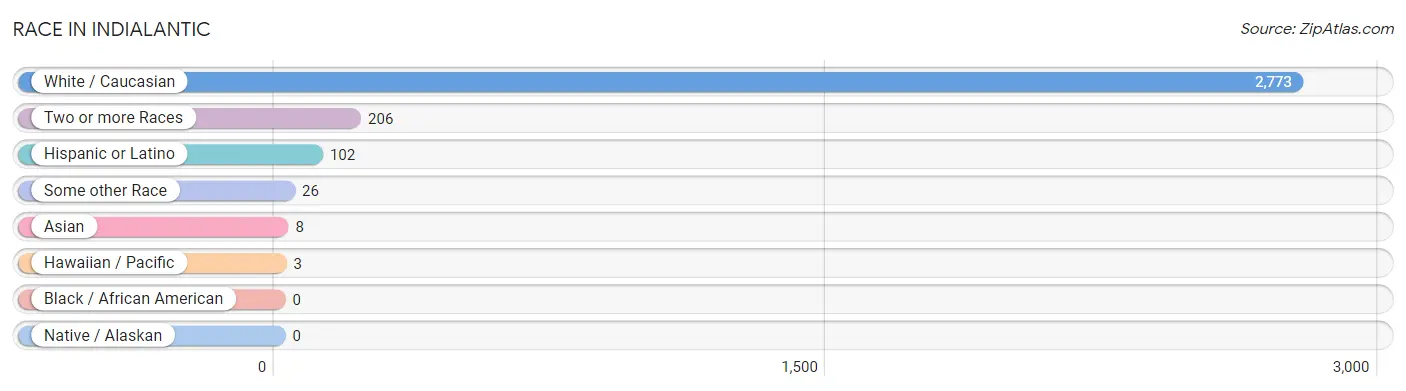
| Race | # Population | % Population |
| Asian | 8 | 0.3% |
| Black / African American | 0 | 0.0% |
| Hawaiian / Pacific | 3 | 0.1% |
| Hispanic or Latino | 102 | 3.4% |
| Native / Alaskan | 0 | 0.0% |
| White / Caucasian | 2,773 | 91.9% |
| Two or more Races | 206 | 6.8% |
| Some other Race | 26 | 0.9% |
| Total | 3,016 | 100.0% |
Ancestry in Indialantic
The most populous ancestries reported in Indialantic are English (567 | 18.8%), American (402 | 13.3%), German (395 | 13.1%), Italian (213 | 7.1%), and Irish (171 | 5.7%), together accounting for 58.0% of all Indialantic residents.
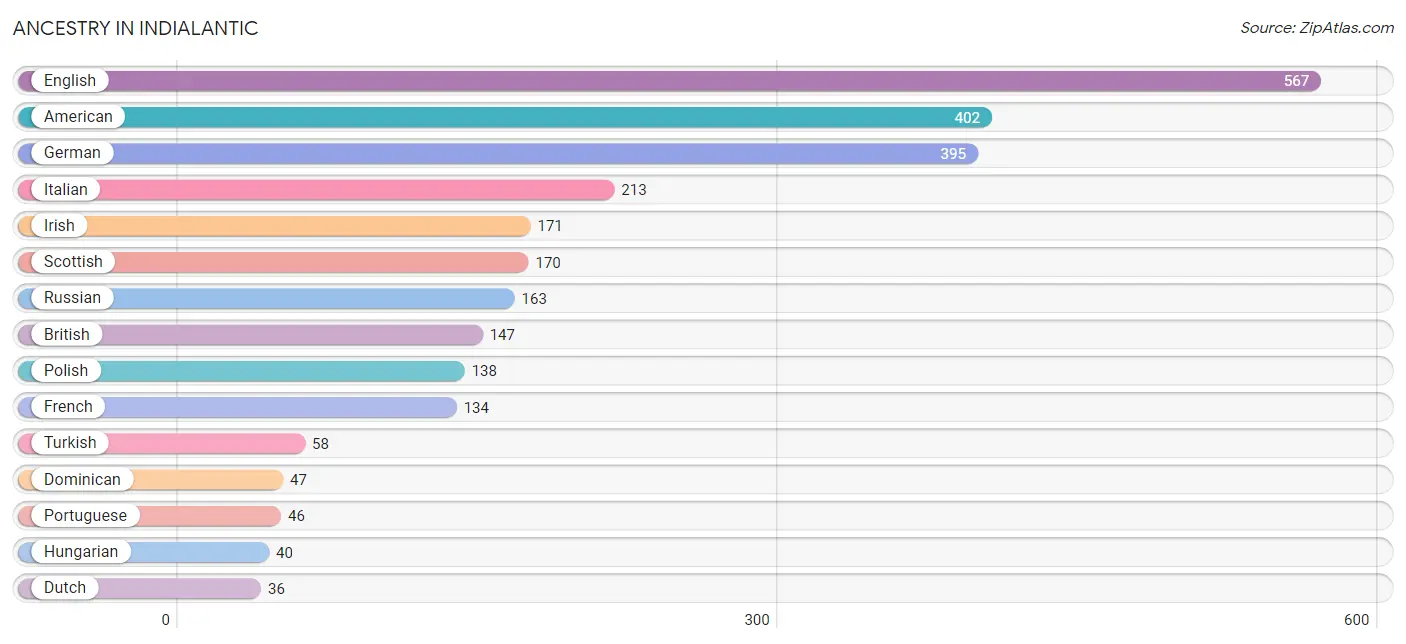
| Ancestry | # Population | % Population |
| American | 402 | 13.3% |
| Arab | 6 | 0.2% |
| Austrian | 28 | 0.9% |
| Brazilian | 16 | 0.5% |
| British | 147 | 4.9% |
| Croatian | 10 | 0.3% |
| Cuban | 8 | 0.3% |
| Danish | 30 | 1.0% |
| Dominican | 47 | 1.6% |
| Dutch | 36 | 1.2% |
| English | 567 | 18.8% |
| Finnish | 31 | 1.0% |
| French | 134 | 4.4% |
| German | 395 | 13.1% |
| Greek | 21 | 0.7% |
| Hungarian | 40 | 1.3% |
| Irish | 171 | 5.7% |
| Italian | 213 | 7.1% |
| Lithuanian | 3 | 0.1% |
| Mexican | 30 | 1.0% |
| Native Hawaiian | 3 | 0.1% |
| Norwegian | 26 | 0.9% |
| Peruvian | 17 | 0.6% |
| Polish | 138 | 4.6% |
| Portuguese | 46 | 1.5% |
| Russian | 163 | 5.4% |
| Scotch-Irish | 10 | 0.3% |
| Scottish | 170 | 5.6% |
| South American | 17 | 0.6% |
| Sri Lankan | 8 | 0.3% |
| Swedish | 30 | 1.0% |
| Syrian | 6 | 0.2% |
| Turkish | 58 | 1.9% |
| Ukrainian | 23 | 0.8% | View All 34 Rows |
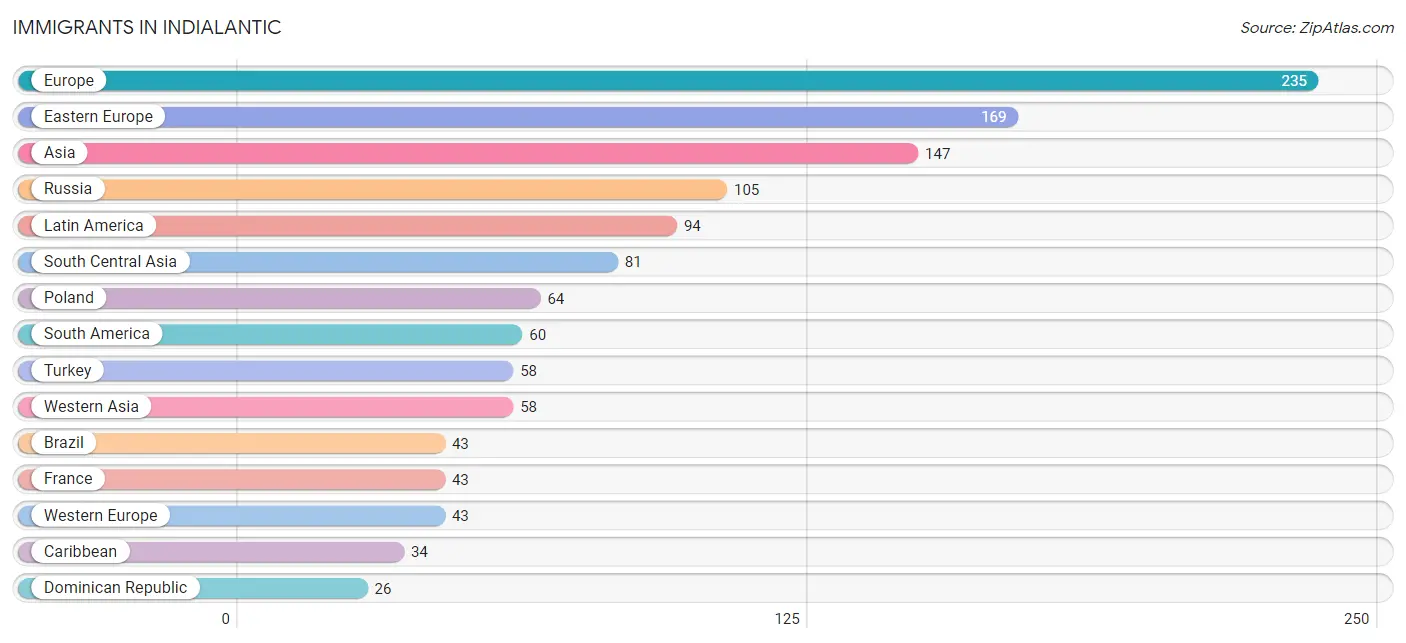
Immigrants in Indialantic
The most numerous immigrant groups reported in Indialantic came from Europe (235 | 7.8%), Eastern Europe (169 | 5.6%), Asia (147 | 4.9%), Russia (105 | 3.5%), and Latin America (94 | 3.1%), together accounting for 24.9% of all Indialantic residents.
| Immigration Origin | # Population | % Population |
| Asia | 147 | 4.9% |
| Brazil | 43 | 1.4% |
| Caribbean | 34 | 1.1% |
| Cuba | 8 | 0.3% |
| Dominican Republic | 26 | 0.9% |
| Eastern Europe | 169 | 5.6% |
| Europe | 235 | 7.8% |
| France | 43 | 1.4% |
| Latin America | 94 | 3.1% |
| Northern Europe | 23 | 0.8% |
| Peru | 17 | 0.6% |
| Poland | 64 | 2.1% |
| Russia | 105 | 3.5% |
| South America | 60 | 2.0% |
| South Central Asia | 81 | 2.7% |
| South Eastern Asia | 8 | 0.3% |
| Sweden | 16 | 0.5% |
| Turkey | 58 | 1.9% |
| Vietnam | 8 | 0.3% |
| Western Asia | 58 | 1.9% |
| Western Europe | 43 | 1.4% | View All 21 Rows |
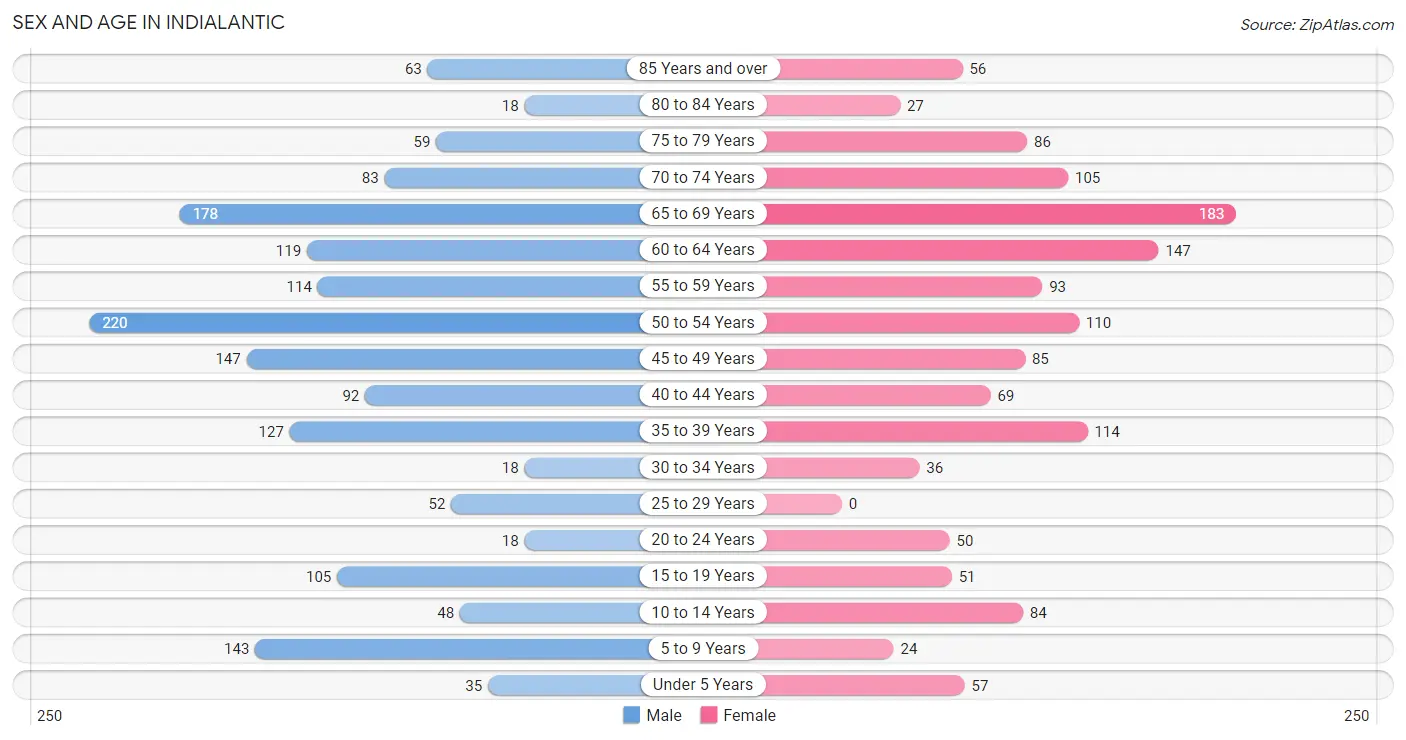
Sex and Age in Indialantic
Sex and Age in Indialantic
The most populous age groups in Indialantic are 50 to 54 Years (220 | 13.4%) for men and 65 to 69 Years (183 | 13.3%) for women.
| Age Bracket | Male | Female |
| Under 5 Years | 35 (2.1%) | 57 (4.1%) |
| 5 to 9 Years | 143 (8.7%) | 24 (1.7%) |
| 10 to 14 Years | 48 (2.9%) | 84 (6.1%) |
| 15 to 19 Years | 105 (6.4%) | 51 (3.7%) |
| 20 to 24 Years | 18 (1.1%) | 50 (3.6%) |
| 25 to 29 Years | 52 (3.2%) | 0 (0.0%) |
| 30 to 34 Years | 18 (1.1%) | 36 (2.6%) |
| 35 to 39 Years | 127 (7.7%) | 114 (8.3%) |
| 40 to 44 Years | 92 (5.6%) | 69 (5.0%) |
| 45 to 49 Years | 147 (9.0%) | 85 (6.2%) |
| 50 to 54 Years | 220 (13.4%) | 110 (8.0%) |
| 55 to 59 Years | 114 (7.0%) | 93 (6.8%) |
| 60 to 64 Years | 119 (7.3%) | 147 (10.7%) |
| 65 to 69 Years | 178 (10.9%) | 183 (13.3%) |
| 70 to 74 Years | 83 (5.1%) | 105 (7.6%) |
| 75 to 79 Years | 59 (3.6%) | 86 (6.2%) |
| 80 to 84 Years | 18 (1.1%) | 27 (2.0%) |
| 85 Years and over | 63 (3.8%) | 56 (4.1%) |
| Total | 1,639 (100.0%) | 1,377 (100.0%) |
Families and Households in Indialantic
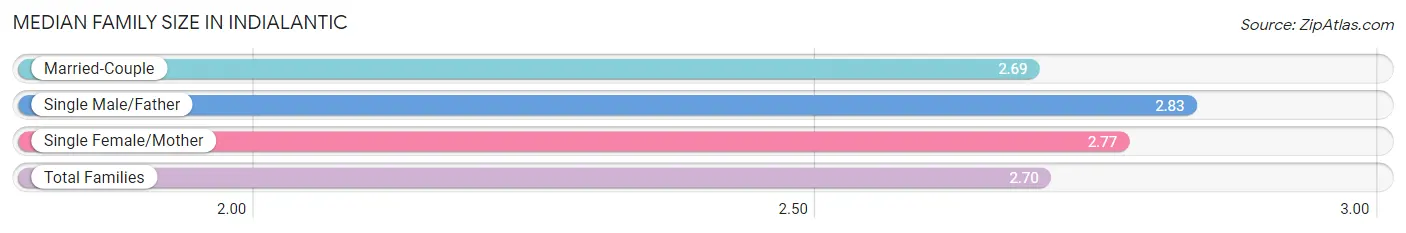
Median Family Size in Indialantic
The median family size in Indialantic is 2.70 persons per family, with single male/father families (30 | 3.7%) accounting for the largest median family size of 2.83 persons per family. On the other hand, married-couple families (762 | 93.1%) represent the smallest median family size with 2.69 persons per family.
| Family Type | # Families | Family Size |
| Married-Couple | 762 (93.1%) | 2.69 |
| Single Male/Father | 30 (3.7%) | 2.83 |
| Single Female/Mother | 26 (3.2%) | 2.77 |
| Total Families | 818 (100.0%) | 2.70 |
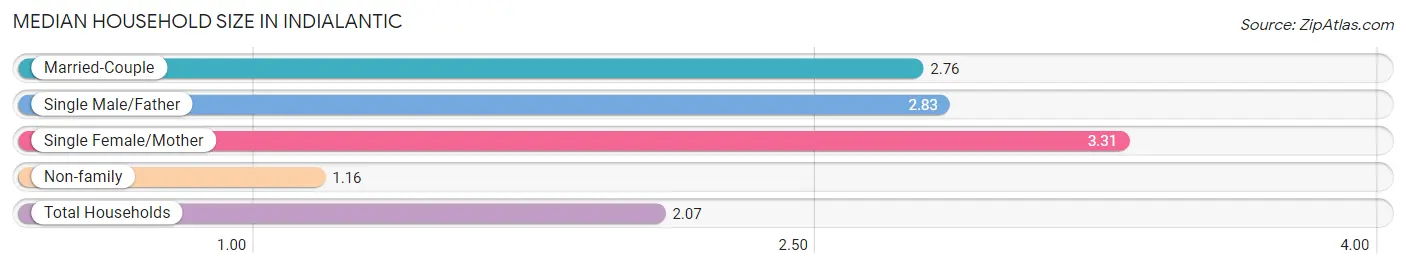
Median Household Size in Indialantic
The median household size in Indialantic is 2.07 persons per household, with single female/mother households (26 | 1.8%) accounting for the largest median household size of 3.31 persons per household. non-family households (642 | 44.0%) represent the smallest median household size with 1.16 persons per household.
| Household Type | # Households | Household Size |
| Married-Couple | 762 (52.2%) | 2.76 |
| Single Male/Father | 30 (2.1%) | 2.83 |
| Single Female/Mother | 26 (1.8%) | 3.31 |
| Non-family | 642 (44.0%) | 1.16 |
| Total Households | 1,460 (100.0%) | 2.07 |
Household Size by Marriage Status in Indialantic
Out of a total of 1,460 households in Indialantic, 818 (56.0%) are family households, while 642 (44.0%) are nonfamily households. The most numerous type of family households are 2-person households, comprising 556, and the most common type of nonfamily households are 1-person households, comprising 572.
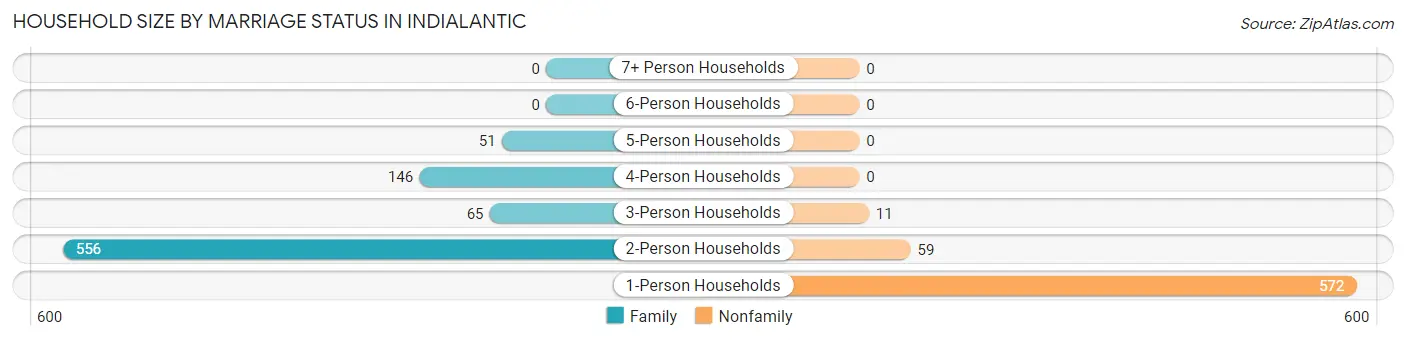
| Household Size | Family Households | Nonfamily Households |
| 1-Person Households | - | 572 (39.2%) |
| 2-Person Households | 556 (38.1%) | 59 (4.0%) |
| 3-Person Households | 65 (4.4%) | 11 (0.7%) |
| 4-Person Households | 146 (10.0%) | 0 (0.0%) |
| 5-Person Households | 51 (3.5%) | 0 (0.0%) |
| 6-Person Households | 0 (0.0%) | 0 (0.0%) |
| 7+ Person Households | 0 (0.0%) | 0 (0.0%) |
| Total | 818 (56.0%) | 642 (44.0%) |
Female Fertility in Indialantic
Fertility by Age in Indialantic
Average fertility rate in Indialantic is 20.0 births per 1,000 women. Women in the age bracket of 35 to 50 years have the highest fertility rate with 30.0 births per 1,000 women. Women in the age bracket of 35 to 50 years acount for 100.0% of all women with births.
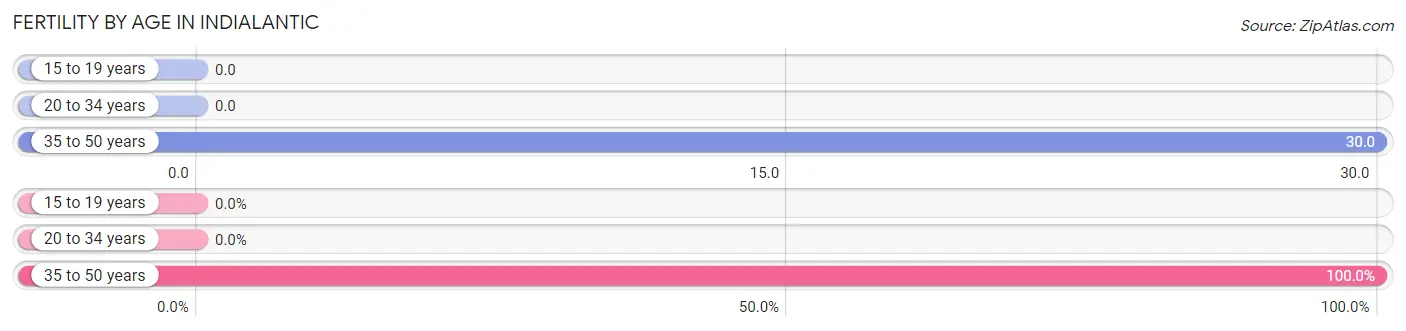
| Age Bracket | Women with Births | Births / 1,000 Women |
| 15 to 19 years | 0 (0.0%) | 0.0 |
| 20 to 34 years | 0 (0.0%) | 0.0 |
| 35 to 50 years | 9 (100.0%) | 30.0 |
| Total | 9 (100.0%) | 20.0 |
Fertility by Age by Marriage Status in Indialantic
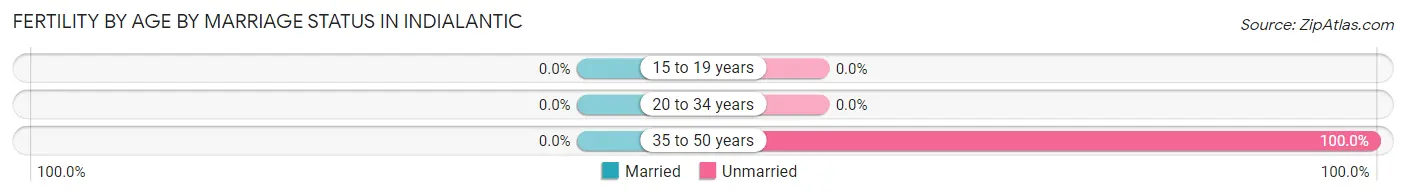
| Age Bracket | Married | Unmarried |
| 15 to 19 years | 0 (0.0%) | 0 (0.0%) |
| 20 to 34 years | 0 (0.0%) | 0 (0.0%) |
| 35 to 50 years | 0 (0.0%) | 9 (100.0%) |
| Total | 0 (0.0%) | 9 (100.0%) |
Fertility by Education in Indialantic
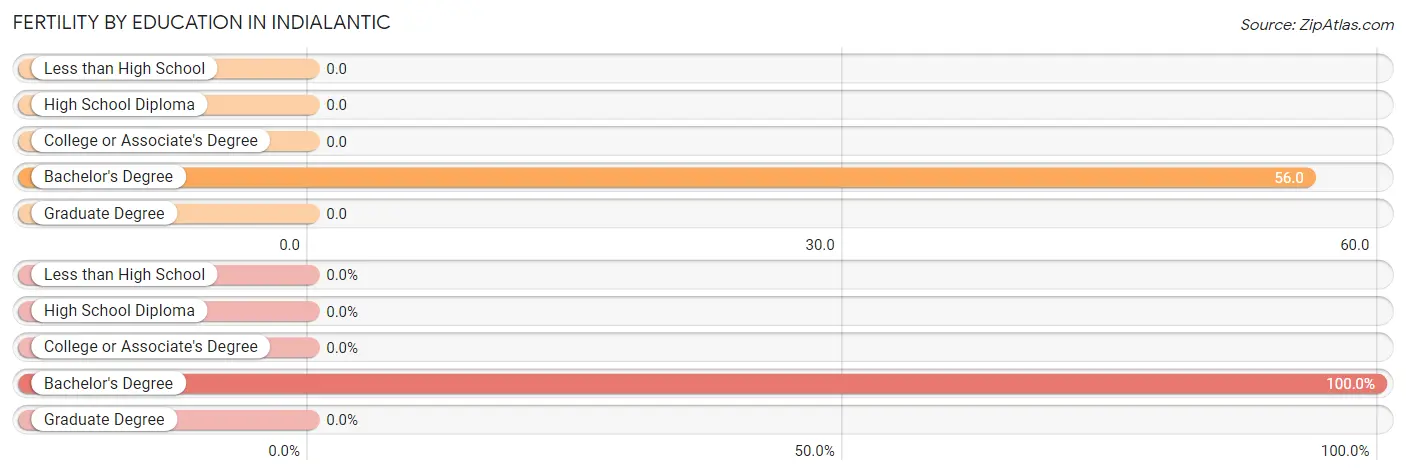
| Educational Attainment | Women with Births | Births / 1,000 Women |
| Less than High School | 0 (0.0%) | 0.0 |
| High School Diploma | 0 (0.0%) | 0.0 |
| College or Associate's Degree | 0 (0.0%) | 0.0 |
| Bachelor's Degree | 9 (100.0%) | 56.0 |
| Graduate Degree | 0 (0.0%) | 0.0 |
| Total | 9 (100.0%) | 20.0 |
Fertility by Education by Marriage Status in Indialantic
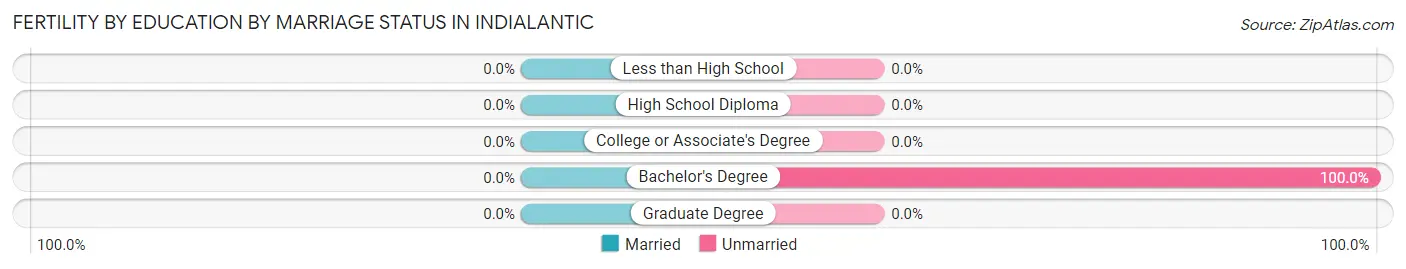
| Educational Attainment | Married | Unmarried |
| Less than High School | 0 (0.0%) | 0 (0.0%) |
| High School Diploma | 0 (0.0%) | 0 (0.0%) |
| College or Associate's Degree | 0 (0.0%) | 0 (0.0%) |
| Bachelor's Degree | 0 (0.0%) | 9 (100.0%) |
| Graduate Degree | 0 (0.0%) | 0 (0.0%) |
| Total | 0 (0.0%) | 9 (100.0%) |
Employment Characteristics in Indialantic
Employment by Class of Employer in Indialantic
Among the 1,373 employed individuals in Indialantic, private company employees (975 | 71.0%), self-employed (incorporated) (215 | 15.7%), and not-for-profit organizations (66 | 4.8%) make up the most common classes of employment.
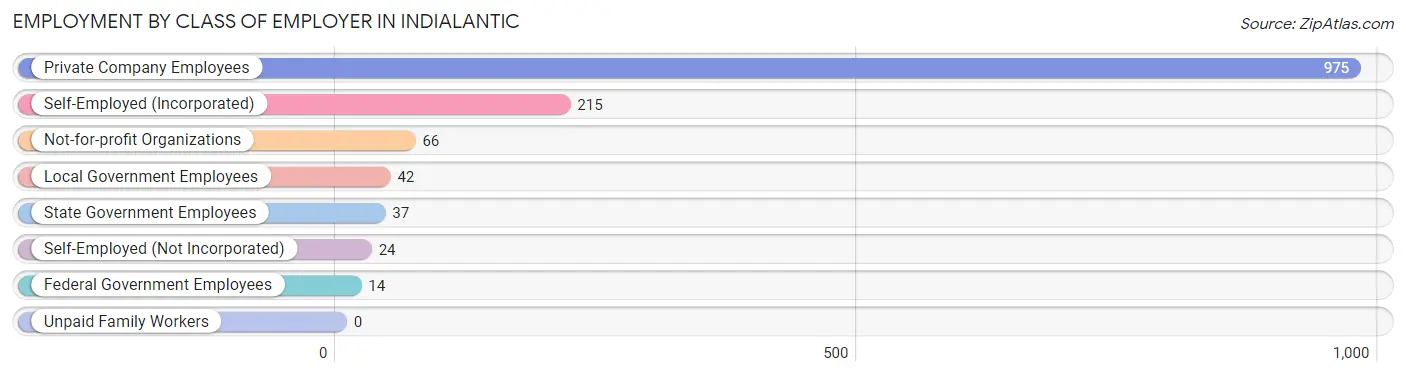
| Employer Class | # Employees | % Employees |
| Private Company Employees | 975 | 71.0% |
| Self-Employed (Incorporated) | 215 | 15.7% |
| Self-Employed (Not Incorporated) | 24 | 1.8% |
| Not-for-profit Organizations | 66 | 4.8% |
| Local Government Employees | 42 | 3.1% |
| State Government Employees | 37 | 2.7% |
| Federal Government Employees | 14 | 1.0% |
| Unpaid Family Workers | 0 | 0.0% |
| Total | 1,373 | 100.0% |
Employment Status by Age in Indialantic
According to the labor force statistics for Indialantic, out of the total population over 16 years of age (2,581), 57.1% or 1,474 individuals are in the labor force, with 5.8% or 85 of them unemployed. The age group with the highest labor force participation rate is 25 to 29 years, with 100.0% or 52 individuals in the labor force. Within the labor force, the 35 to 44 years age range has the highest percentage of unemployed individuals, with 17.9% or 59 of them being unemployed.
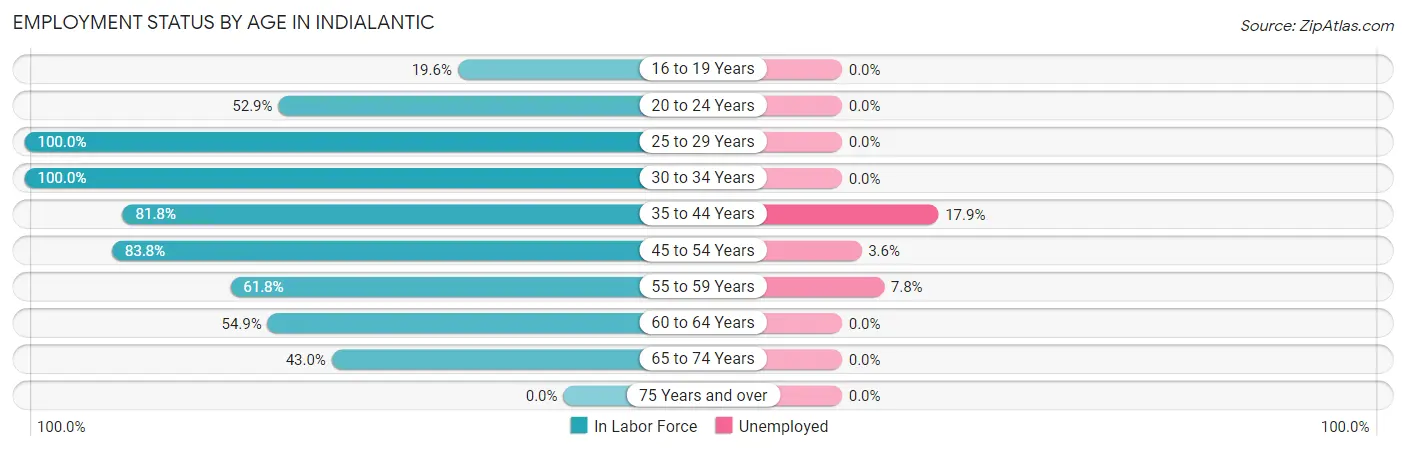
| Age Bracket | In Labor Force | Unemployed |
| 16 to 19 Years | 22 (19.6%) | 0 (0.0%) |
| 20 to 24 Years | 36 (52.9%) | 0 (0.0%) |
| 25 to 29 Years | 52 (100.0%) | 0 (0.0%) |
| 30 to 34 Years | 54 (100.0%) | 0 (0.0%) |
| 35 to 44 Years | 329 (81.8%) | 59 (17.9%) |
| 45 to 54 Years | 471 (83.8%) | 17 (3.6%) |
| 55 to 59 Years | 128 (61.8%) | 10 (7.8%) |
| 60 to 64 Years | 146 (54.9%) | 0 (0.0%) |
| 65 to 74 Years | 236 (43.0%) | 0 (0.0%) |
| 75 Years and over | 0 (0.0%) | 0 (0.0%) |
| Total | 1,474 (57.1%) | 85 (5.8%) |
Employment Status by Educational Attainment in Indialantic
According to labor force statistics for Indialantic, 76.5% of individuals (1,180) out of the total population between 25 and 64 years of age (1,543) are in the labor force, with 7.3% or 86 of them being unemployed. The group with the highest labor force participation rate are those with the educational attainment of bachelor's degree or higher, with 80.1% or 815 individuals in the labor force. Within the labor force, individuals with bachelor's degree or higher education have the highest percentage of unemployment, with 8.5% or 69 of them being unemployed.
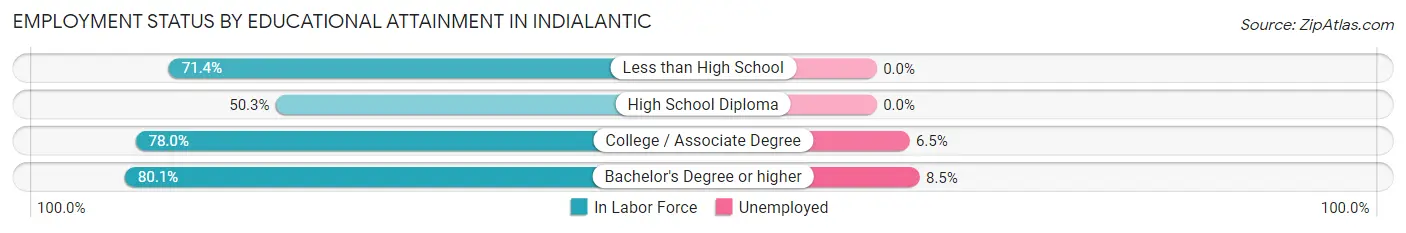
| Educational Attainment | In Labor Force | Unemployed |
| Less than High School | 25 (71.4%) | 0 (0.0%) |
| High School Diploma | 78 (50.3%) | 0 (0.0%) |
| College / Associate Degree | 262 (78.0%) | 22 (6.5%) |
| Bachelor's Degree or higher | 815 (80.1%) | 86 (8.5%) |
| Total | 1,180 (76.5%) | 113 (7.3%) |
Employment Occupations by Sex in Indialantic
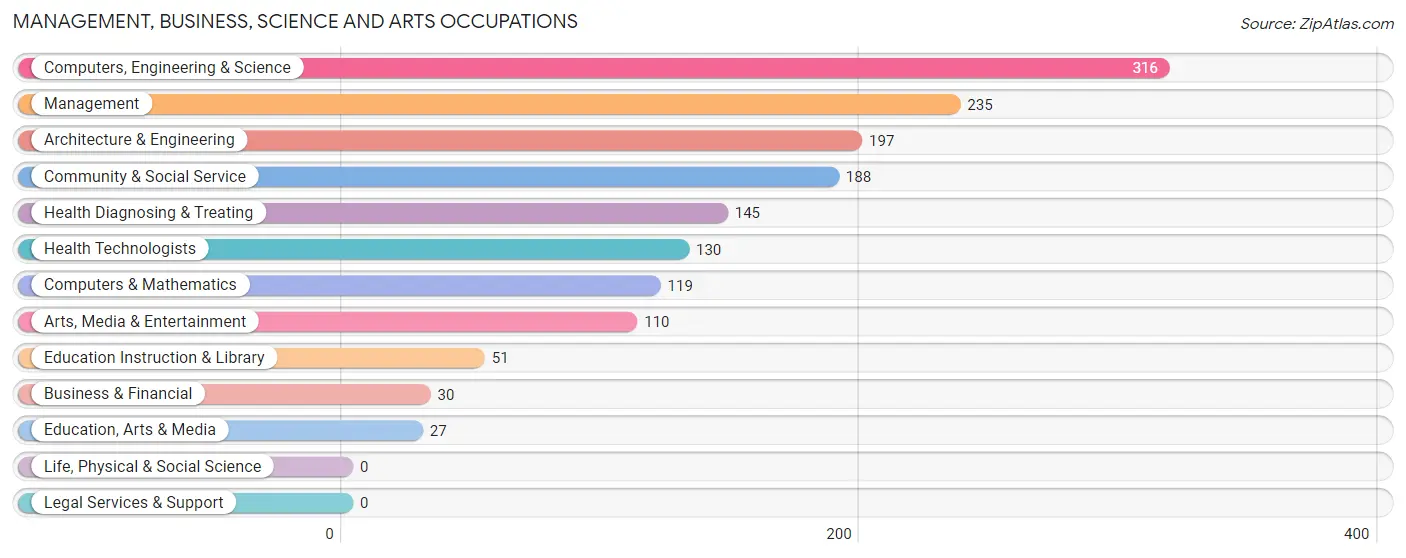
Management, Business, Science and Arts Occupations
The most common Management, Business, Science and Arts occupations in Indialantic are Computers, Engineering & Science (316 | 22.8%), Management (235 | 16.9%), Architecture & Engineering (197 | 14.2%), Community & Social Service (188 | 13.5%), and Health Diagnosing & Treating (145 | 10.4%).
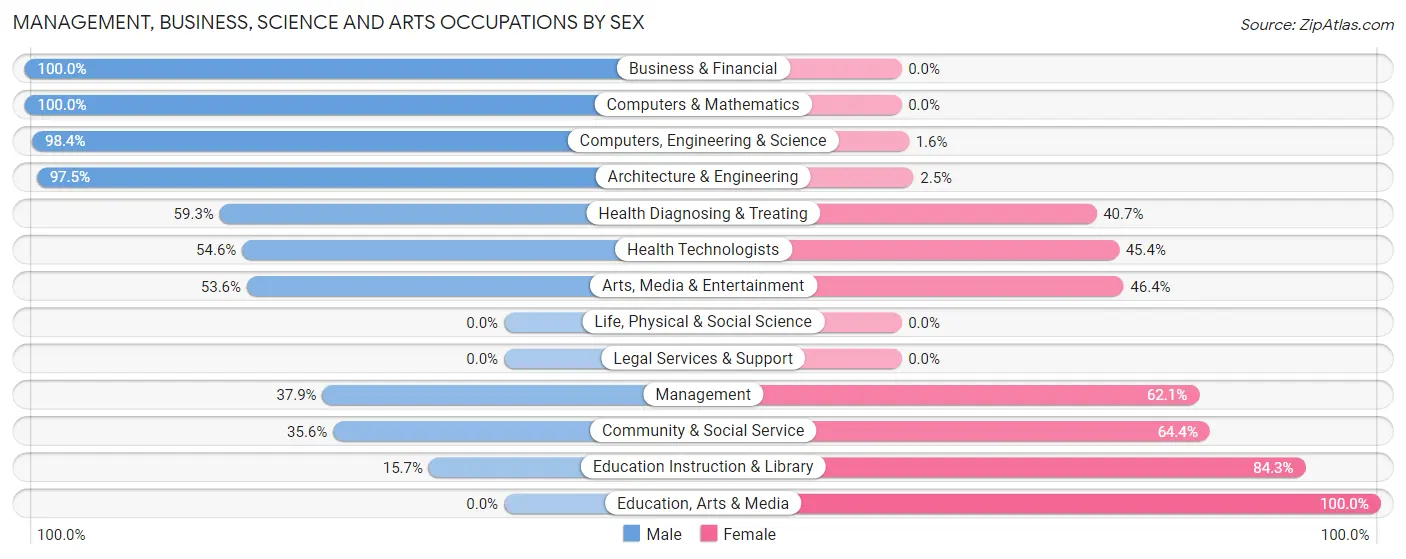
Management, Business, Science and Arts Occupations by Sex
Within the Management, Business, Science and Arts occupations in Indialantic, the most male-oriented occupations are Business & Financial (100.0%), Computers & Mathematics (100.0%), and Computers, Engineering & Science (98.4%), while the most female-oriented occupations are Education, Arts & Media (100.0%), Education Instruction & Library (84.3%), and Community & Social Service (64.4%).
| Occupation | Male | Female |
| Management | 89 (37.9%) | 146 (62.1%) |
| Business & Financial | 30 (100.0%) | 0 (0.0%) |
| Computers, Engineering & Science | 311 (98.4%) | 5 (1.6%) |
| Computers & Mathematics | 119 (100.0%) | 0 (0.0%) |
| Architecture & Engineering | 192 (97.5%) | 5 (2.5%) |
| Life, Physical & Social Science | 0 (0.0%) | 0 (0.0%) |
| Community & Social Service | 67 (35.6%) | 121 (64.4%) |
| Education, Arts & Media | 0 (0.0%) | 27 (100.0%) |
| Legal Services & Support | 0 (0.0%) | 0 (0.0%) |
| Education Instruction & Library | 8 (15.7%) | 43 (84.3%) |
| Arts, Media & Entertainment | 59 (53.6%) | 51 (46.4%) |
| Health Diagnosing & Treating | 86 (59.3%) | 59 (40.7%) |
| Health Technologists | 71 (54.6%) | 59 (45.4%) |
| Total (Category) | 583 (63.8%) | 331 (36.2%) |
| Total (Overall) | 855 (61.6%) | 533 (38.4%) |
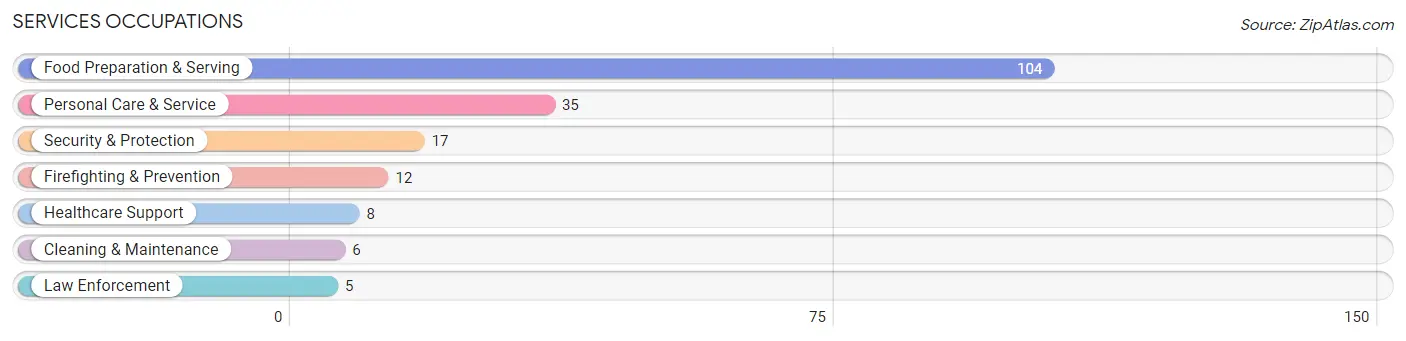
Services Occupations
The most common Services occupations in Indialantic are Food Preparation & Serving (104 | 7.5%), Personal Care & Service (35 | 2.5%), Security & Protection (17 | 1.2%), Firefighting & Prevention (12 | 0.9%), and Healthcare Support (8 | 0.6%).
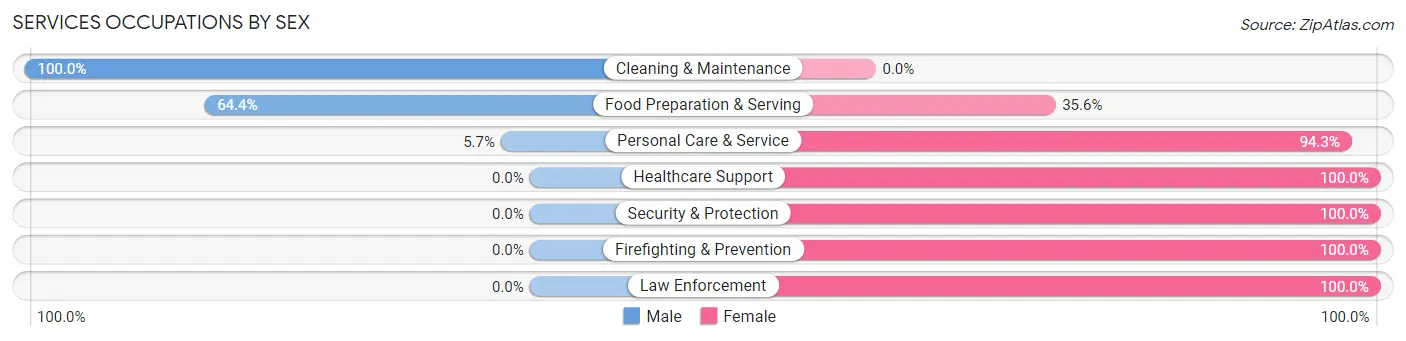
Services Occupations by Sex
Within the Services occupations in Indialantic, the most male-oriented occupations are Cleaning & Maintenance (100.0%), Food Preparation & Serving (64.4%), and Personal Care & Service (5.7%), while the most female-oriented occupations are Healthcare Support (100.0%), Security & Protection (100.0%), and Firefighting & Prevention (100.0%).
| Occupation | Male | Female |
| Healthcare Support | 0 (0.0%) | 8 (100.0%) |
| Security & Protection | 0 (0.0%) | 17 (100.0%) |
| Firefighting & Prevention | 0 (0.0%) | 12 (100.0%) |
| Law Enforcement | 0 (0.0%) | 5 (100.0%) |
| Food Preparation & Serving | 67 (64.4%) | 37 (35.6%) |
| Cleaning & Maintenance | 6 (100.0%) | 0 (0.0%) |
| Personal Care & Service | 2 (5.7%) | 33 (94.3%) |
| Total (Category) | 75 (44.1%) | 95 (55.9%) |
| Total (Overall) | 855 (61.6%) | 533 (38.4%) |
Sales and Office Occupations
The most common Sales and Office occupations in Indialantic are Sales & Related (100 | 7.2%), and Office & Administration (25 | 1.8%).
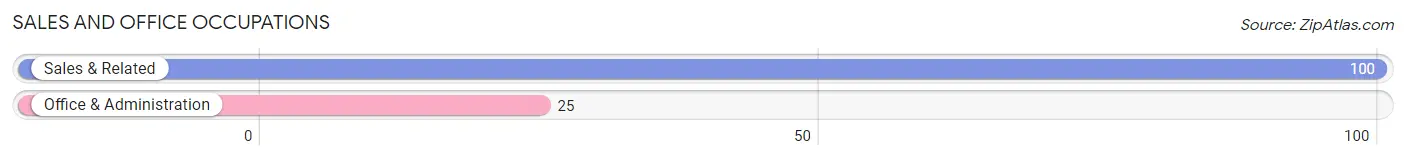
Sales and Office Occupations by Sex
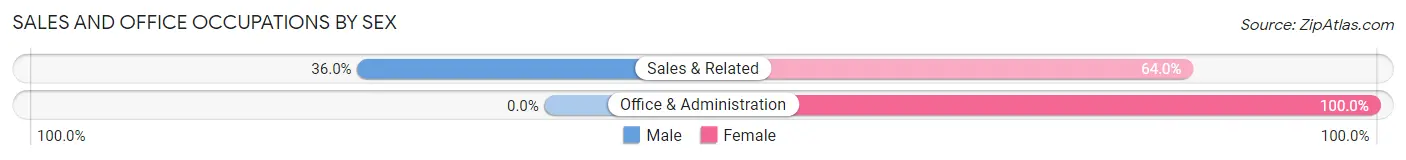
| Occupation | Male | Female |
| Sales & Related | 36 (36.0%) | 64 (64.0%) |
| Office & Administration | 0 (0.0%) | 25 (100.0%) |
| Total (Category) | 36 (28.8%) | 89 (71.2%) |
| Total (Overall) | 855 (61.6%) | 533 (38.4%) |
Natural Resources, Construction and Maintenance Occupations
The most common Natural Resources, Construction and Maintenance occupations in Indialantic are , and Construction & Extraction (49 | 3.5%).
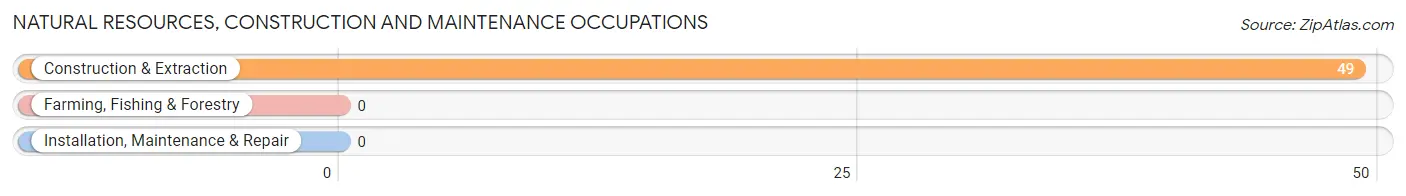
Natural Resources, Construction and Maintenance Occupations by Sex
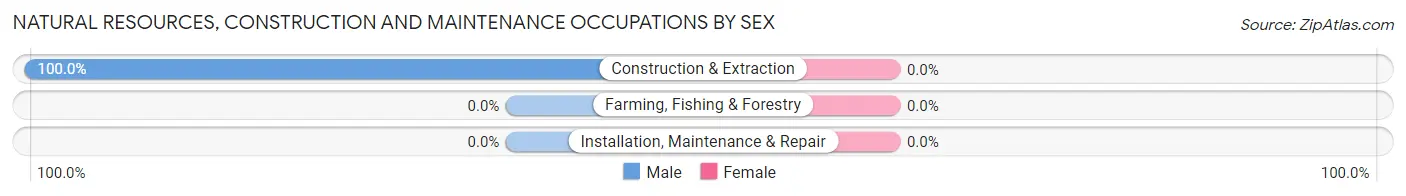
| Occupation | Male | Female |
| Farming, Fishing & Forestry | 0 (0.0%) | 0 (0.0%) |
| Construction & Extraction | 49 (100.0%) | 0 (0.0%) |
| Installation, Maintenance & Repair | 0 (0.0%) | 0 (0.0%) |
| Total (Category) | 49 (100.0%) | 0 (0.0%) |
| Total (Overall) | 855 (61.6%) | 533 (38.4%) |
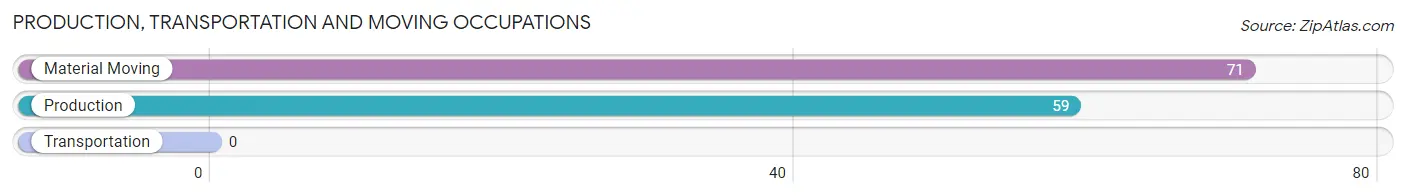
Production, Transportation and Moving Occupations
The most common Production, Transportation and Moving occupations in Indialantic are Material Moving (71 | 5.1%), and Production (59 | 4.3%).
Production, Transportation and Moving Occupations by Sex
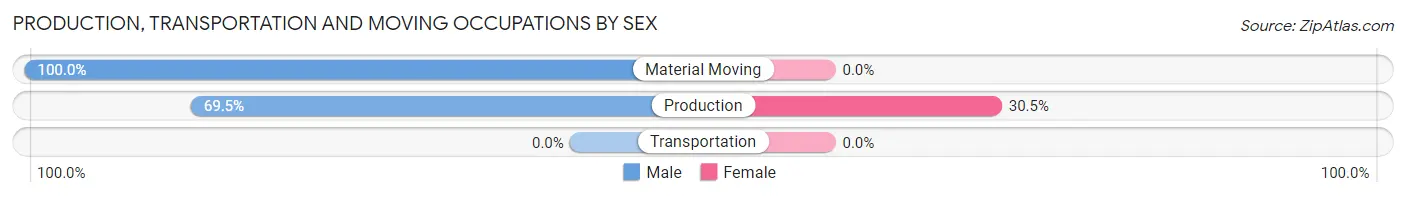
| Occupation | Male | Female |
| Production | 41 (69.5%) | 18 (30.5%) |
| Transportation | 0 (0.0%) | 0 (0.0%) |
| Material Moving | 71 (100.0%) | 0 (0.0%) |
| Total (Category) | 112 (86.2%) | 18 (13.9%) |
| Total (Overall) | 855 (61.6%) | 533 (38.4%) |
Employment Industries by Sex in Indialantic
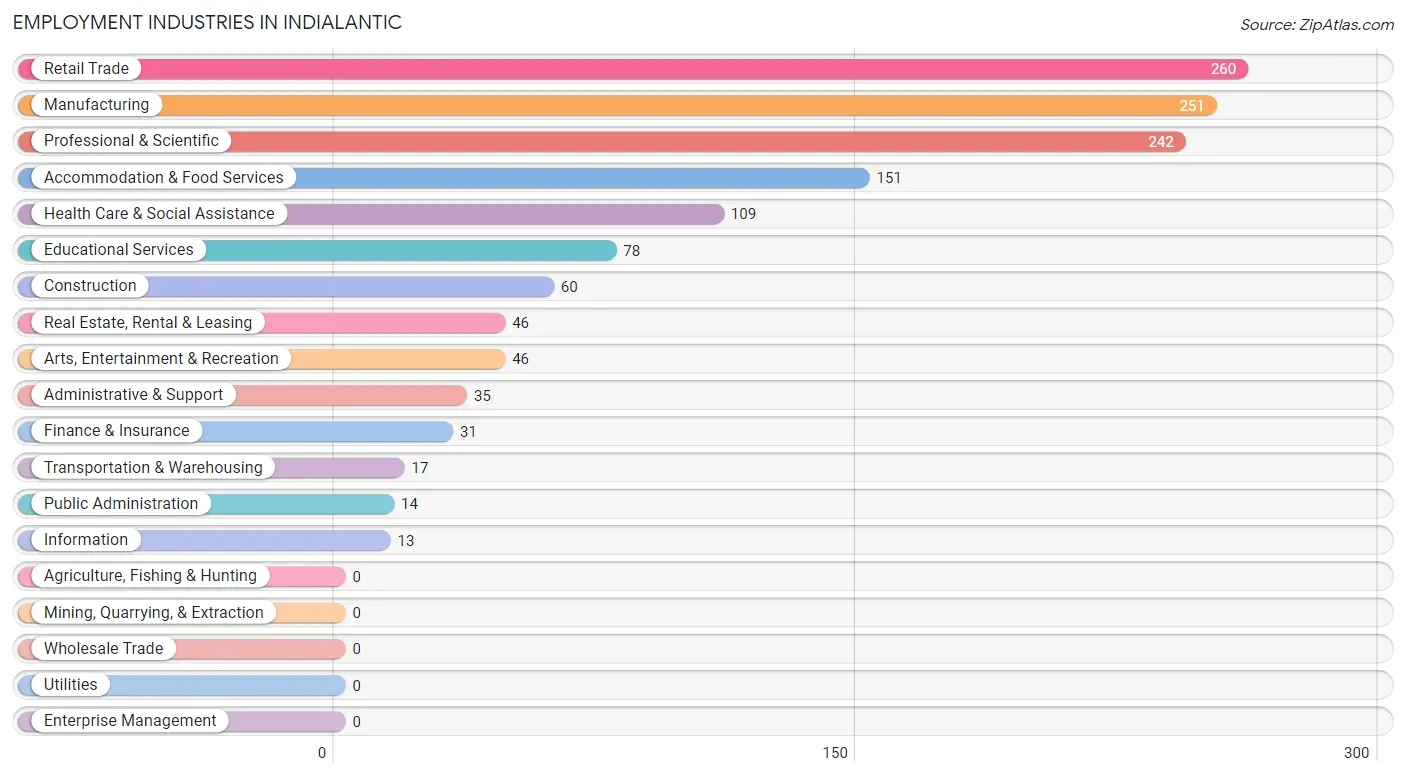
Employment Industries in Indialantic
The major employment industries in Indialantic include Retail Trade (260 | 18.7%), Manufacturing (251 | 18.1%), Professional & Scientific (242 | 17.4%), Accommodation & Food Services (151 | 10.9%), and Health Care & Social Assistance (109 | 7.9%).
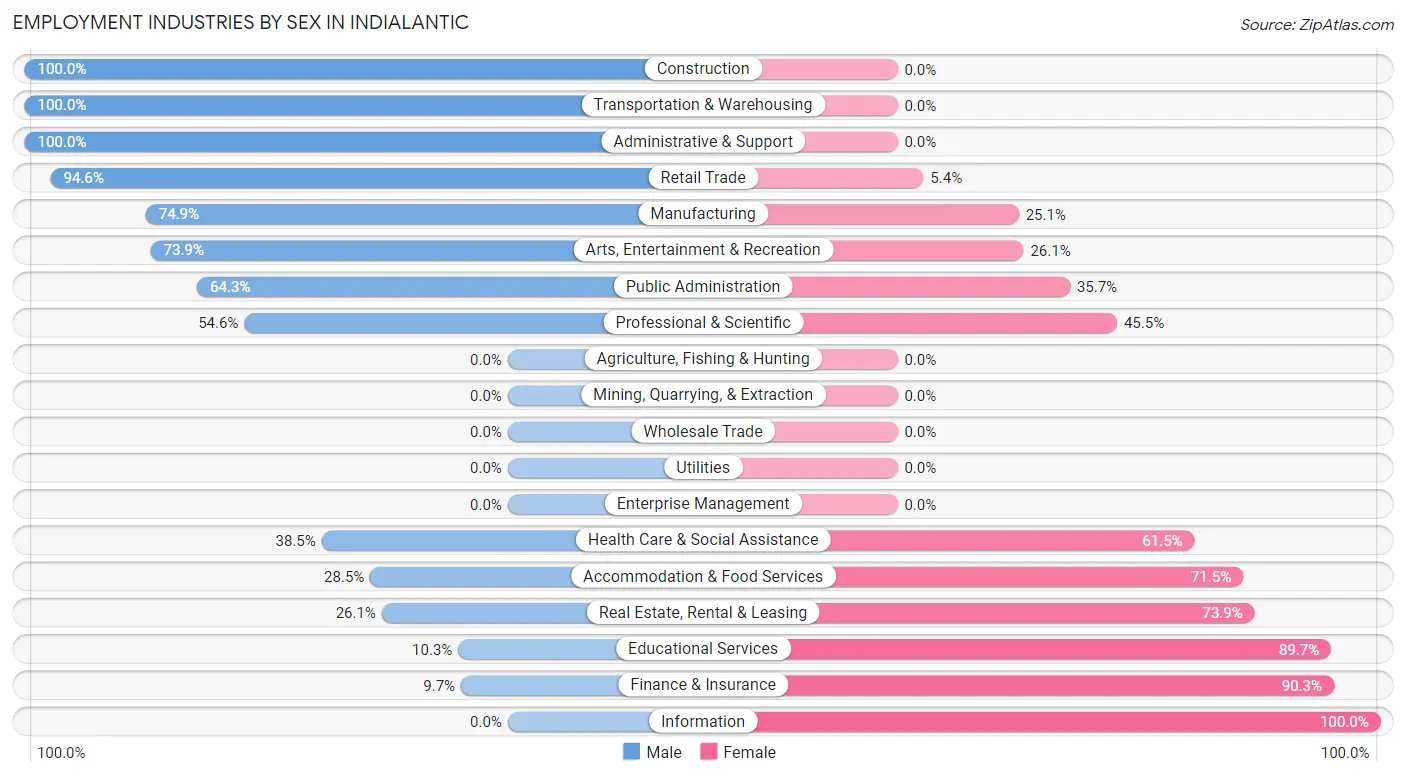
Employment Industries by Sex in Indialantic
The Indialantic industries that see more men than women are Construction (100.0%), Transportation & Warehousing (100.0%), and Administrative & Support (100.0%), whereas the industries that tend to have a higher number of women are Information (100.0%), Finance & Insurance (90.3%), and Educational Services (89.7%).
| Industry | Male | Female |
| Agriculture, Fishing & Hunting | 0 (0.0%) | 0 (0.0%) |
| Mining, Quarrying, & Extraction | 0 (0.0%) | 0 (0.0%) |
| Construction | 60 (100.0%) | 0 (0.0%) |
| Manufacturing | 188 (74.9%) | 63 (25.1%) |
| Wholesale Trade | 0 (0.0%) | 0 (0.0%) |
| Retail Trade | 246 (94.6%) | 14 (5.4%) |
| Transportation & Warehousing | 17 (100.0%) | 0 (0.0%) |
| Utilities | 0 (0.0%) | 0 (0.0%) |
| Information | 0 (0.0%) | 13 (100.0%) |
| Finance & Insurance | 3 (9.7%) | 28 (90.3%) |
| Real Estate, Rental & Leasing | 12 (26.1%) | 34 (73.9%) |
| Professional & Scientific | 132 (54.5%) | 110 (45.5%) |
| Enterprise Management | 0 (0.0%) | 0 (0.0%) |
| Administrative & Support | 35 (100.0%) | 0 (0.0%) |
| Educational Services | 8 (10.3%) | 70 (89.7%) |
| Health Care & Social Assistance | 42 (38.5%) | 67 (61.5%) |
| Arts, Entertainment & Recreation | 34 (73.9%) | 12 (26.1%) |
| Accommodation & Food Services | 43 (28.5%) | 108 (71.5%) |
| Public Administration | 9 (64.3%) | 5 (35.7%) |
| Total | 855 (61.6%) | 533 (38.4%) |
Education in Indialantic
School Enrollment in Indialantic
The most common levels of schooling among the 548 students in Indialantic are elementary school (186 | 33.9%), high school (148 | 27.0%), and college / undergraduate (79 | 14.4%).
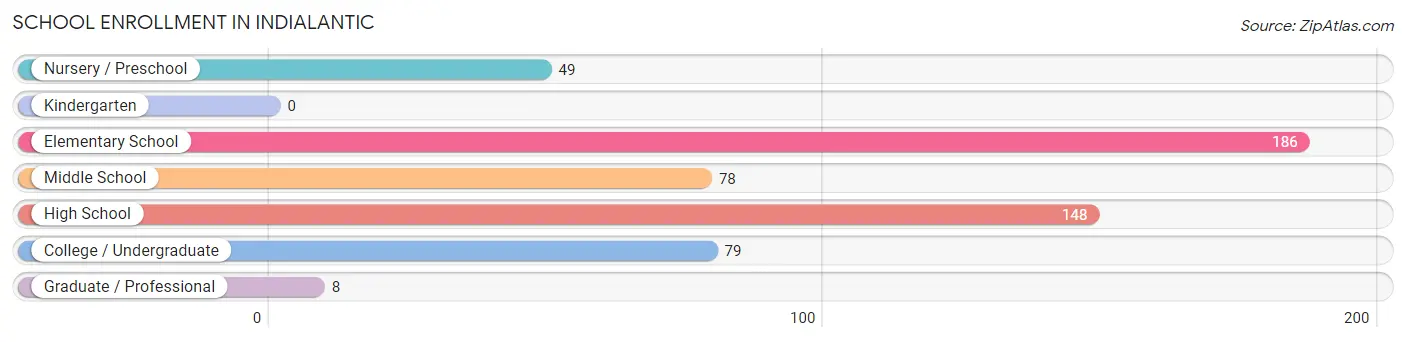
| School Level | # Students | % Students |
| Nursery / Preschool | 49 | 8.9% |
| Kindergarten | 0 | 0.0% |
| Elementary School | 186 | 33.9% |
| Middle School | 78 | 14.2% |
| High School | 148 | 27.0% |
| College / Undergraduate | 79 | 14.4% |
| Graduate / Professional | 8 | 1.5% |
| Total | 548 | 100.0% |
School Enrollment by Age by Funding Source in Indialantic
Out of a total of 548 students who are enrolled in schools in Indialantic, 154 (28.1%) attend a private institution, while the remaining 394 (71.9%) are enrolled in public schools. The age group of 3 to 4 year olds has the highest likelihood of being enrolled in private schools, with 49 (100.0% in the age bracket) enrolled. Conversely, the age group of 5 to 9 year old has the lowest likelihood of being enrolled in a private school, with 158 (100.0% in the age bracket) attending a public institution.
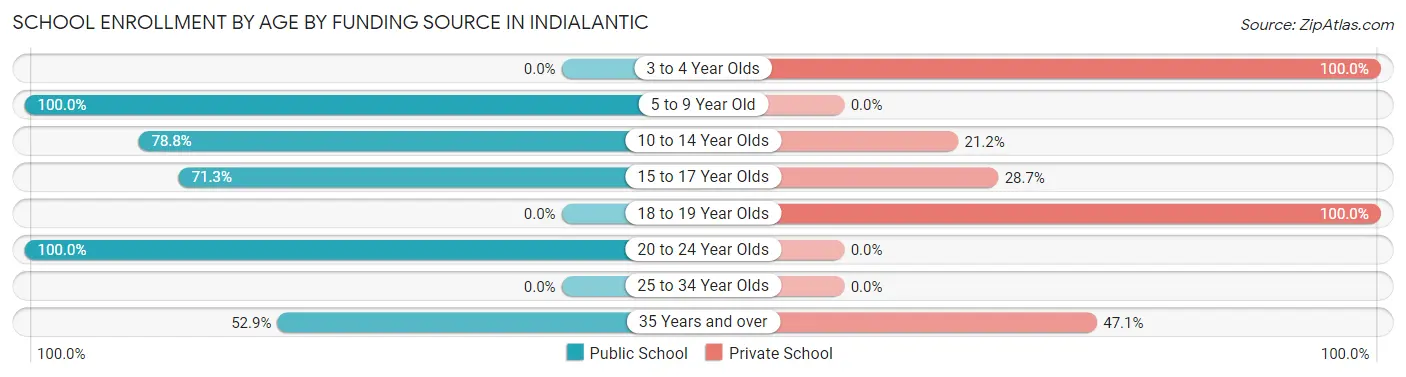
| Age Bracket | Public School | Private School |
| 3 to 4 Year Olds | 0 (0.0%) | 49 (100.0%) |
| 5 to 9 Year Old | 158 (100.0%) | 0 (0.0%) |
| 10 to 14 Year Olds | 104 (78.8%) | 28 (21.2%) |
| 15 to 17 Year Olds | 87 (71.3%) | 35 (28.7%) |
| 18 to 19 Year Olds | 0 (0.0%) | 34 (100.0%) |
| 20 to 24 Year Olds | 36 (100.0%) | 0 (0.0%) |
| 25 to 34 Year Olds | 0 (0.0%) | 0 (0.0%) |
| 35 Years and over | 9 (52.9%) | 8 (47.1%) |
| Total | 394 (71.9%) | 154 (28.1%) |
Educational Attainment by Field of Study in Indialantic
Business (226 | 15.9%), education (219 | 15.4%), engineering (204 | 14.3%), bio, nature & agricultural (170 | 11.9%), and computers & mathematics (163 | 11.5%) are the most common fields of study among 1,424 individuals in Indialantic who have obtained a bachelor's degree or higher.
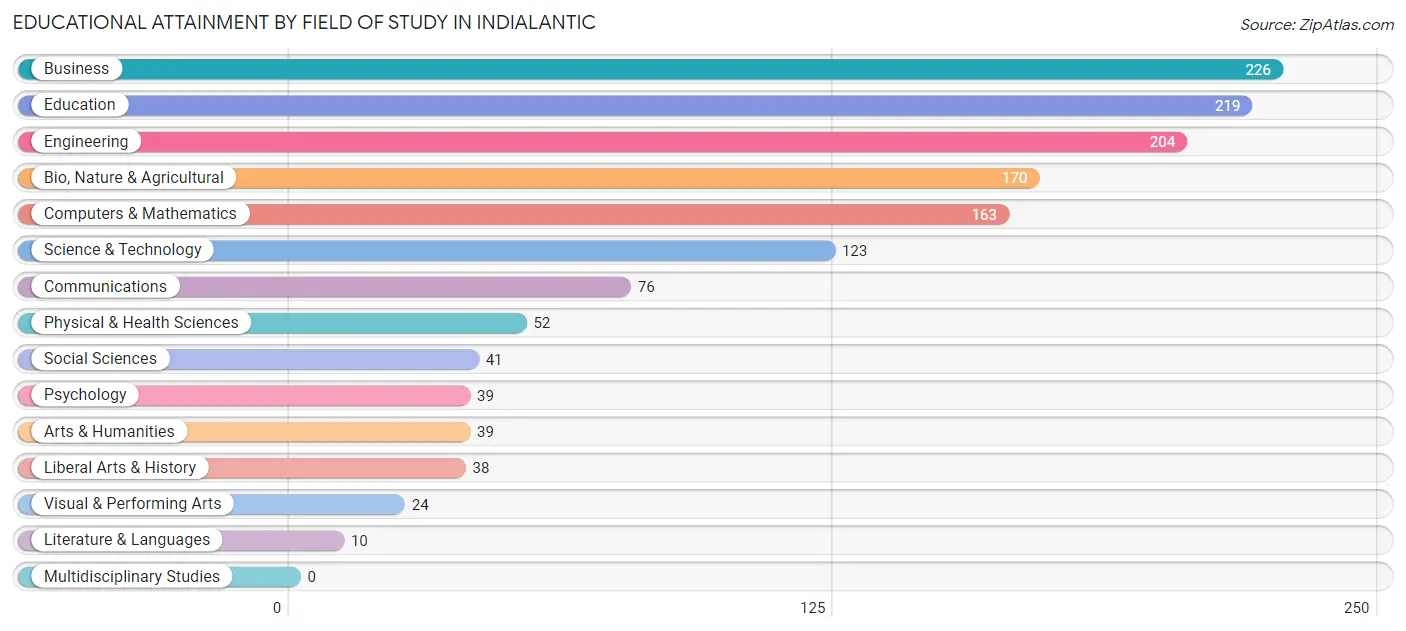
| Field of Study | # Graduates | % Graduates |
| Computers & Mathematics | 163 | 11.5% |
| Bio, Nature & Agricultural | 170 | 11.9% |
| Physical & Health Sciences | 52 | 3.6% |
| Psychology | 39 | 2.7% |
| Social Sciences | 41 | 2.9% |
| Engineering | 204 | 14.3% |
| Multidisciplinary Studies | 0 | 0.0% |
| Science & Technology | 123 | 8.6% |
| Business | 226 | 15.9% |
| Education | 219 | 15.4% |
| Literature & Languages | 10 | 0.7% |
| Liberal Arts & History | 38 | 2.7% |
| Visual & Performing Arts | 24 | 1.7% |
| Communications | 76 | 5.3% |
| Arts & Humanities | 39 | 2.7% |
| Total | 1,424 | 100.0% |
Transportation & Commute in Indialantic
Vehicle Availability by Sex in Indialantic
The most prevalent vehicle ownership categories in Indialantic are males with 2 vehicles (431, accounting for 51.0%) and females with 2 vehicles (239, making up 81.6%).
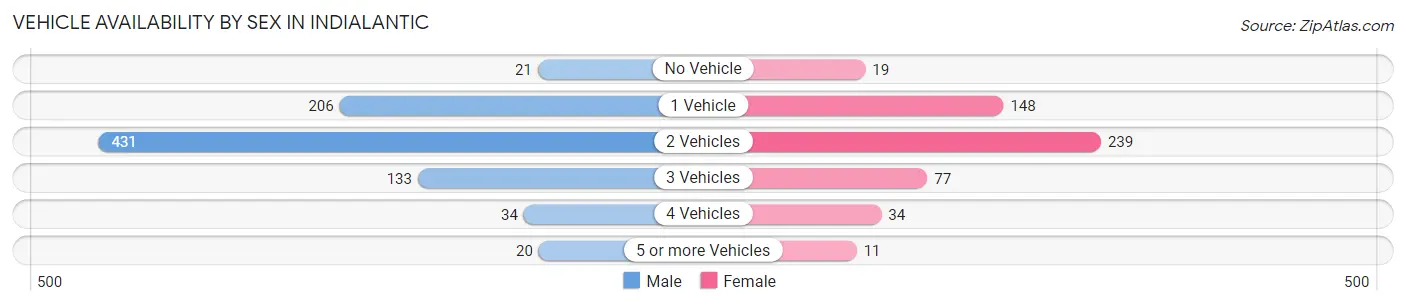
| Vehicles Available | Male | Female |
| No Vehicle | 21 (2.5%) | 19 (3.6%) |
| 1 Vehicle | 206 (24.4%) | 148 (28.0%) |
| 2 Vehicles | 431 (51.0%) | 239 (45.3%) |
| 3 Vehicles | 133 (15.7%) | 77 (14.6%) |
| 4 Vehicles | 34 (4.0%) | 34 (6.4%) |
| 5 or more Vehicles | 20 (2.4%) | 11 (2.1%) |
| Total | 845 (100.0%) | 528 (100.0%) |
Commute Time in Indialantic
The most frequently occuring commute durations in Indialantic are 20 to 24 minutes (273 commuters, 24.7%), 25 to 29 minutes (242 commuters, 21.9%), and 15 to 19 minutes (127 commuters, 11.5%).
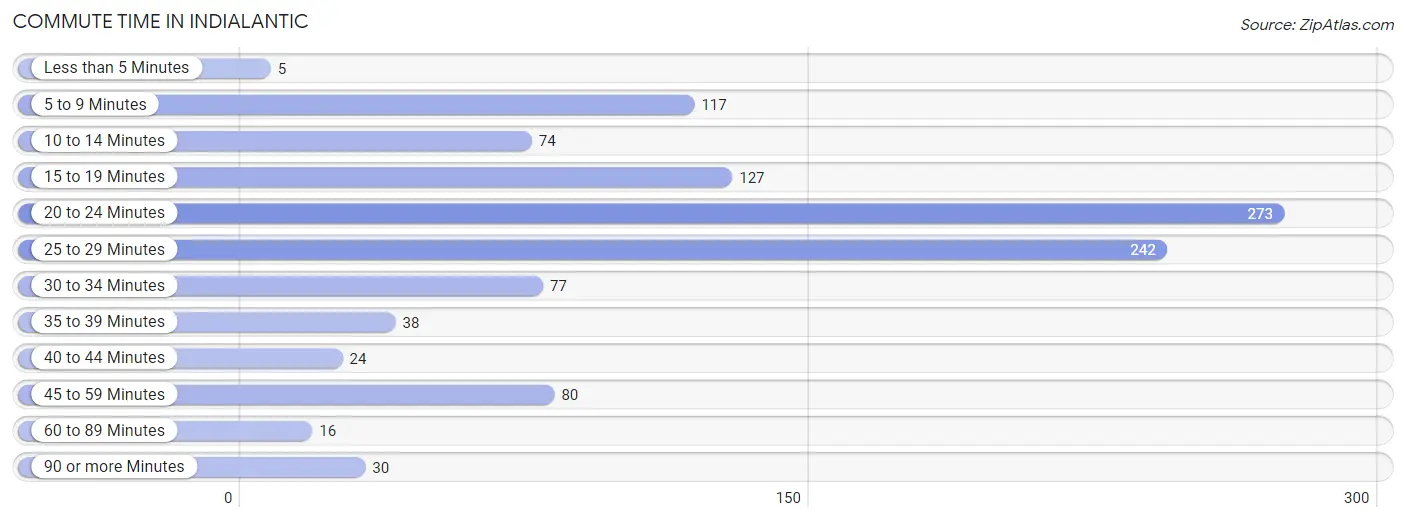
| Commute Time | # Commuters | % Commuters |
| Less than 5 Minutes | 5 | 0.4% |
| 5 to 9 Minutes | 117 | 10.6% |
| 10 to 14 Minutes | 74 | 6.7% |
| 15 to 19 Minutes | 127 | 11.5% |
| 20 to 24 Minutes | 273 | 24.7% |
| 25 to 29 Minutes | 242 | 21.9% |
| 30 to 34 Minutes | 77 | 7.0% |
| 35 to 39 Minutes | 38 | 3.5% |
| 40 to 44 Minutes | 24 | 2.2% |
| 45 to 59 Minutes | 80 | 7.2% |
| 60 to 89 Minutes | 16 | 1.5% |
| 90 or more Minutes | 30 | 2.7% |
Commute Time by Sex in Indialantic
The most common commute times in Indialantic are 25 to 29 minutes (223 commuters, 31.9%) for males and 20 to 24 minutes (163 commuters, 40.5%) for females.
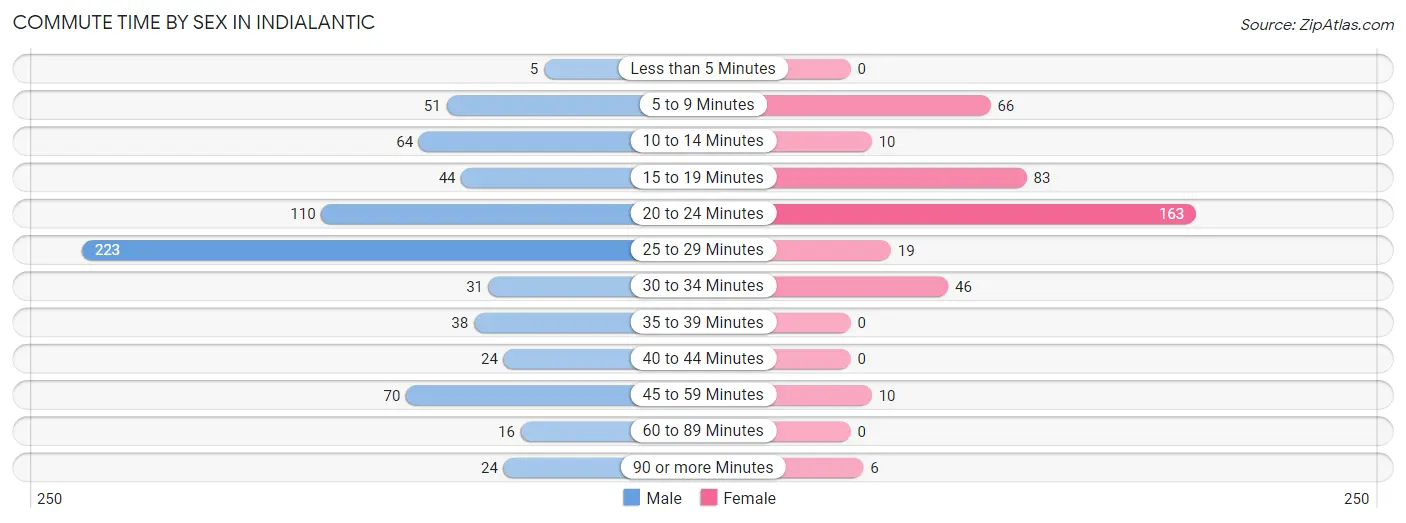
| Commute Time | Male | Female |
| Less than 5 Minutes | 5 (0.7%) | 0 (0.0%) |
| 5 to 9 Minutes | 51 (7.3%) | 66 (16.4%) |
| 10 to 14 Minutes | 64 (9.1%) | 10 (2.5%) |
| 15 to 19 Minutes | 44 (6.3%) | 83 (20.6%) |
| 20 to 24 Minutes | 110 (15.7%) | 163 (40.5%) |
| 25 to 29 Minutes | 223 (31.9%) | 19 (4.7%) |
| 30 to 34 Minutes | 31 (4.4%) | 46 (11.4%) |
| 35 to 39 Minutes | 38 (5.4%) | 0 (0.0%) |
| 40 to 44 Minutes | 24 (3.4%) | 0 (0.0%) |
| 45 to 59 Minutes | 70 (10.0%) | 10 (2.5%) |
| 60 to 89 Minutes | 16 (2.3%) | 0 (0.0%) |
| 90 or more Minutes | 24 (3.4%) | 6 (1.5%) |
Time of Departure to Work by Sex in Indialantic
The most frequent times of departure to work in Indialantic are 9:00 AM to 9:59 AM (194, 27.7%) for males and 7:00 AM to 7:29 AM (114, 28.3%) for females.
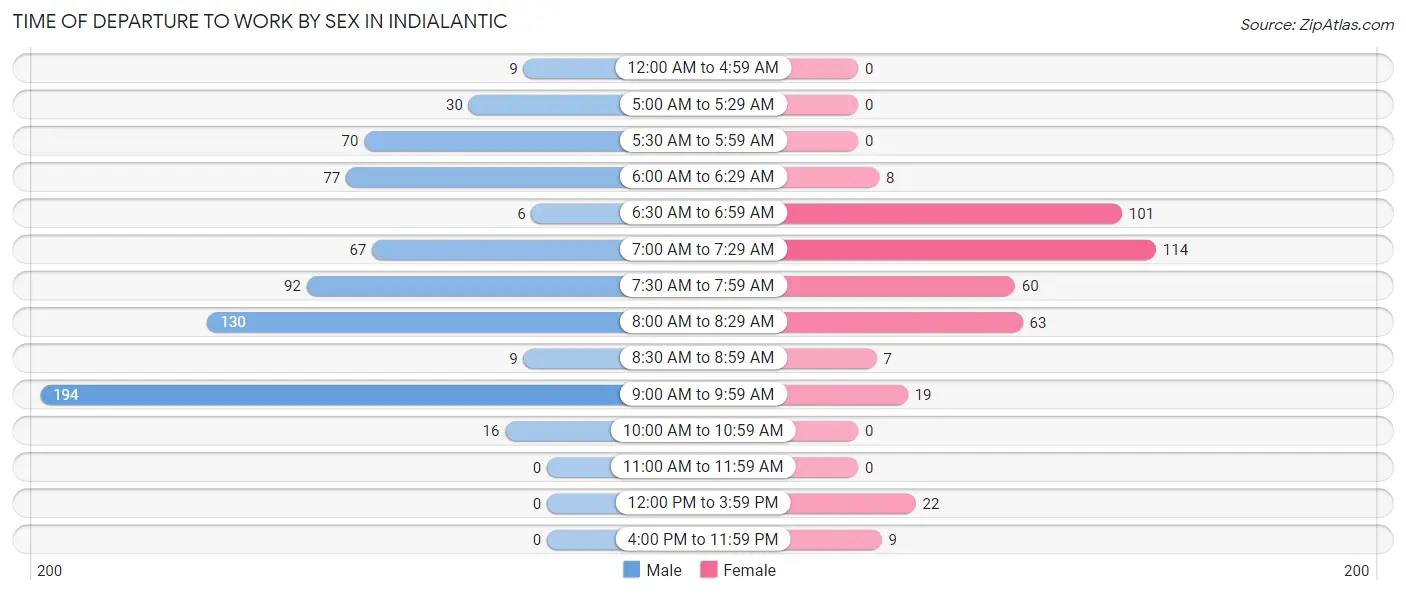
| Time of Departure | Male | Female |
| 12:00 AM to 4:59 AM | 9 (1.3%) | 0 (0.0%) |
| 5:00 AM to 5:29 AM | 30 (4.3%) | 0 (0.0%) |
| 5:30 AM to 5:59 AM | 70 (10.0%) | 0 (0.0%) |
| 6:00 AM to 6:29 AM | 77 (11.0%) | 8 (2.0%) |
| 6:30 AM to 6:59 AM | 6 (0.9%) | 101 (25.1%) |
| 7:00 AM to 7:29 AM | 67 (9.6%) | 114 (28.3%) |
| 7:30 AM to 7:59 AM | 92 (13.1%) | 60 (14.9%) |
| 8:00 AM to 8:29 AM | 130 (18.6%) | 63 (15.6%) |
| 8:30 AM to 8:59 AM | 9 (1.3%) | 7 (1.7%) |
| 9:00 AM to 9:59 AM | 194 (27.7%) | 19 (4.7%) |
| 10:00 AM to 10:59 AM | 16 (2.3%) | 0 (0.0%) |
| 11:00 AM to 11:59 AM | 0 (0.0%) | 0 (0.0%) |
| 12:00 PM to 3:59 PM | 0 (0.0%) | 22 (5.5%) |
| 4:00 PM to 11:59 PM | 0 (0.0%) | 9 (2.2%) |
| Total | 700 (100.0%) | 403 (100.0%) |
Housing Occupancy in Indialantic
Occupancy by Ownership in Indialantic
Of the total 1,460 dwellings in Indialantic, owner-occupied units account for 1,057 (72.4%), while renter-occupied units make up 403 (27.6%).
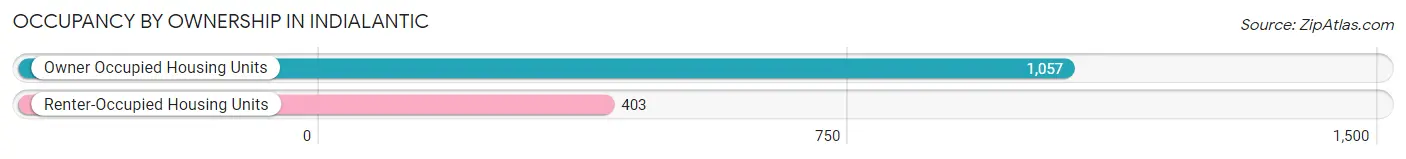
| Occupancy | # Housing Units | % Housing Units |
| Owner Occupied Housing Units | 1,057 | 72.4% |
| Renter-Occupied Housing Units | 403 | 27.6% |
| Total Occupied Housing Units | 1,460 | 100.0% |
Occupancy by Household Size in Indialantic
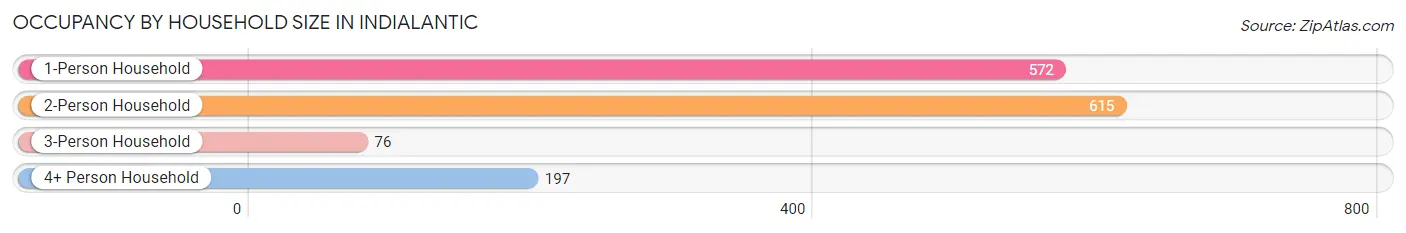
| Household Size | # Housing Units | % Housing Units |
| 1-Person Household | 572 | 39.2% |
| 2-Person Household | 615 | 42.1% |
| 3-Person Household | 76 | 5.2% |
| 4+ Person Household | 197 | 13.5% |
| Total Housing Units | 1,460 | 100.0% |
Occupancy by Ownership by Household Size in Indialantic
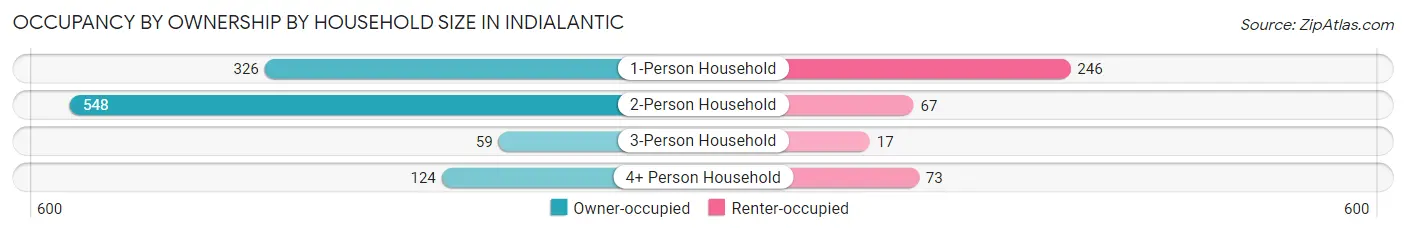
| Household Size | Owner-occupied | Renter-occupied |
| 1-Person Household | 326 (57.0%) | 246 (43.0%) |
| 2-Person Household | 548 (89.1%) | 67 (10.9%) |
| 3-Person Household | 59 (77.6%) | 17 (22.4%) |
| 4+ Person Household | 124 (62.9%) | 73 (37.1%) |
| Total Housing Units | 1,057 (72.4%) | 403 (27.6%) |
Occupancy by Educational Attainment in Indialantic
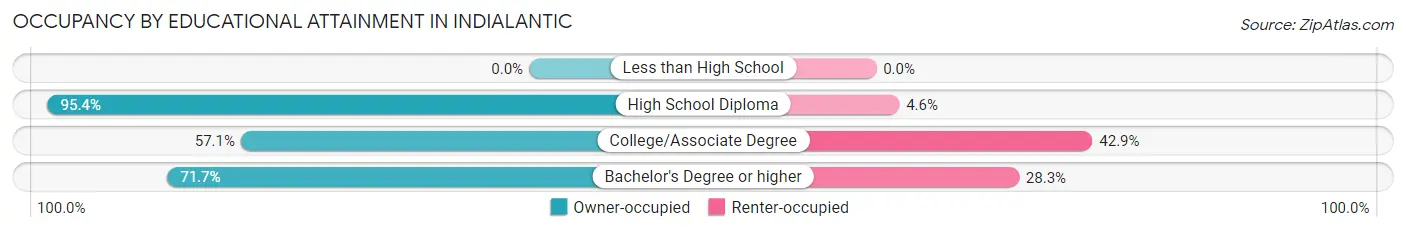
| Household Size | Owner-occupied | Renter-occupied |
| Less than High School | 0 (0.0%) | 0 (0.0%) |
| High School Diploma | 209 (95.4%) | 10 (4.6%) |
| College/Associate Degree | 164 (57.1%) | 123 (42.9%) |
| Bachelor's Degree or higher | 684 (71.7%) | 270 (28.3%) |
Occupancy by Age of Householder in Indialantic
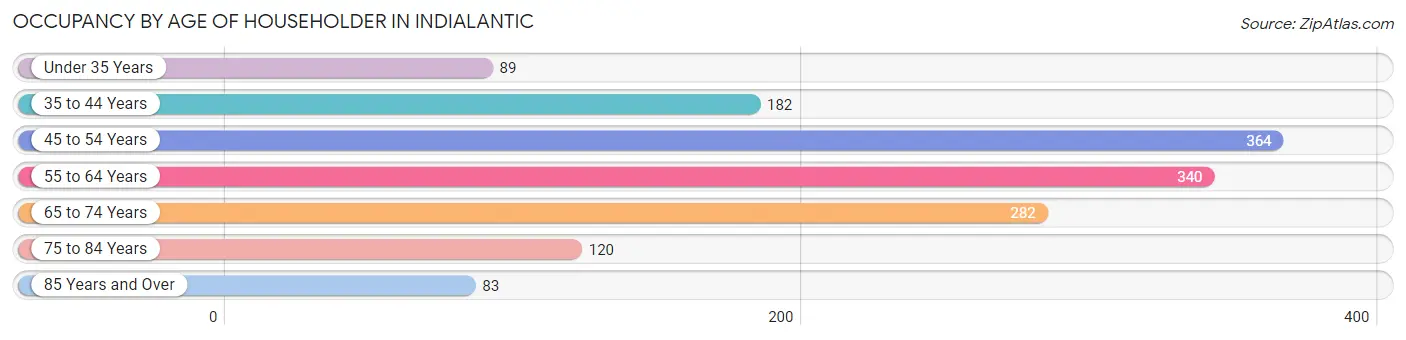
| Age Bracket | # Households | % Households |
| Under 35 Years | 89 | 6.1% |
| 35 to 44 Years | 182 | 12.5% |
| 45 to 54 Years | 364 | 24.9% |
| 55 to 64 Years | 340 | 23.3% |
| 65 to 74 Years | 282 | 19.3% |
| 75 to 84 Years | 120 | 8.2% |
| 85 Years and Over | 83 | 5.7% |
| Total | 1,460 | 100.0% |
Housing Finances in Indialantic
Median Income by Occupancy in Indialantic
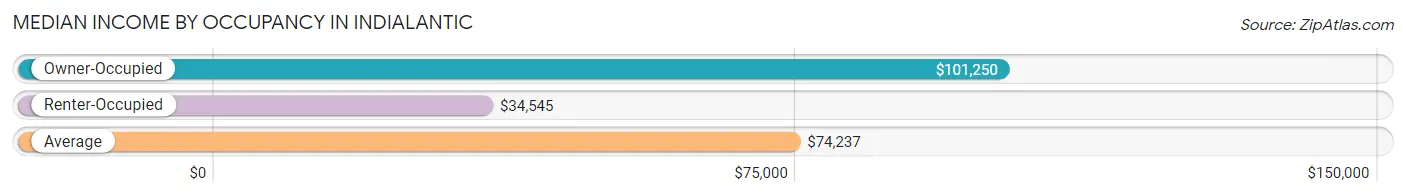
| Occupancy Type | # Households | Median Income |
| Owner-Occupied | 1,057 (72.4%) | $101,250 |
| Renter-Occupied | 403 (27.6%) | $34,545 |
| Average | 1,460 (100.0%) | $74,237 |
Occupancy by Householder Income Bracket in Indialantic
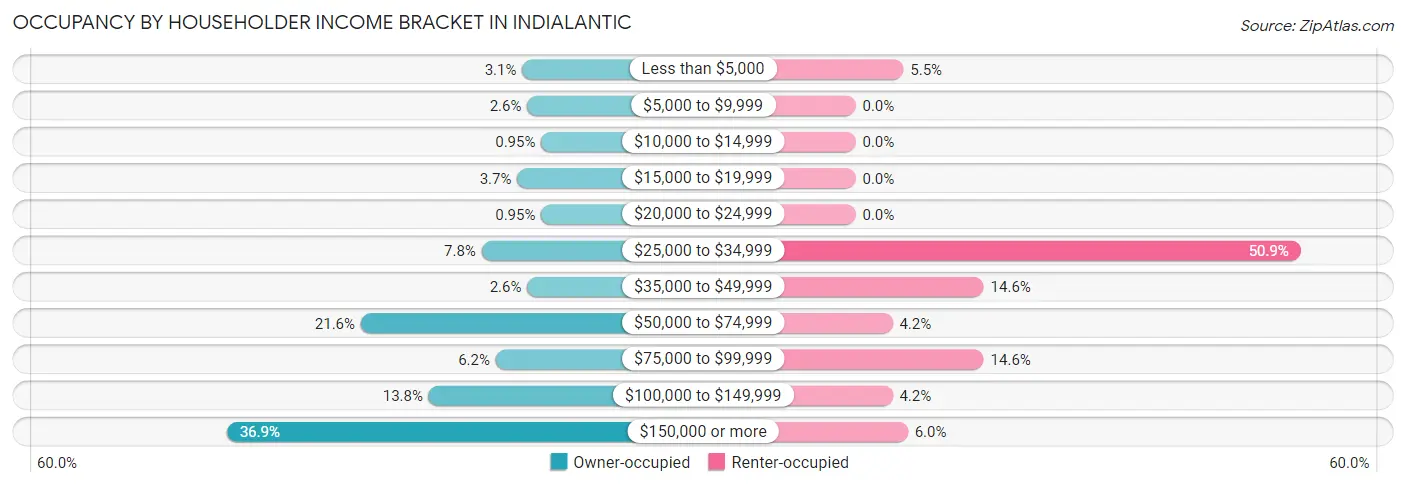
| Income Bracket | Owner-occupied | Renter-occupied |
| Less than $5,000 | 33 (3.1%) | 22 (5.5%) |
| $5,000 to $9,999 | 27 (2.5%) | 0 (0.0%) |
| $10,000 to $14,999 | 10 (0.9%) | 0 (0.0%) |
| $15,000 to $19,999 | 39 (3.7%) | 0 (0.0%) |
| $20,000 to $24,999 | 10 (0.9%) | 0 (0.0%) |
| $25,000 to $34,999 | 82 (7.8%) | 205 (50.9%) |
| $35,000 to $49,999 | 27 (2.5%) | 59 (14.6%) |
| $50,000 to $74,999 | 228 (21.6%) | 17 (4.2%) |
| $75,000 to $99,999 | 65 (6.1%) | 59 (14.6%) |
| $100,000 to $149,999 | 146 (13.8%) | 17 (4.2%) |
| $150,000 or more | 390 (36.9%) | 24 (6.0%) |
| Total | 1,057 (100.0%) | 403 (100.0%) |
Monthly Housing Cost Tiers in Indialantic
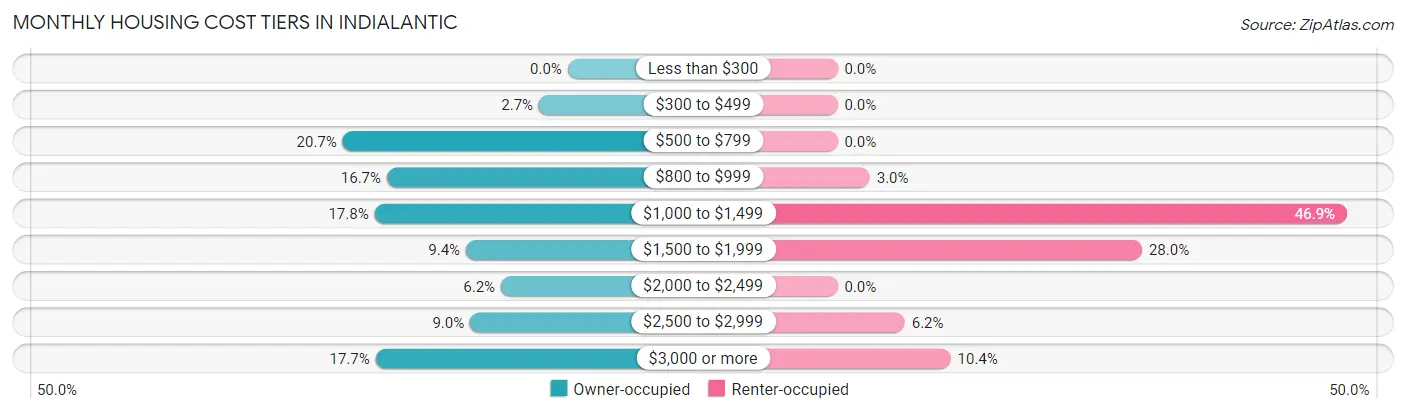
| Monthly Cost | Owner-occupied | Renter-occupied |
| Less than $300 | 0 (0.0%) | 0 (0.0%) |
| $300 to $499 | 28 (2.6%) | 0 (0.0%) |
| $500 to $799 | 219 (20.7%) | 0 (0.0%) |
| $800 to $999 | 176 (16.7%) | 12 (3.0%) |
| $1,000 to $1,499 | 188 (17.8%) | 189 (46.9%) |
| $1,500 to $1,999 | 99 (9.4%) | 113 (28.0%) |
| $2,000 to $2,499 | 65 (6.1%) | 0 (0.0%) |
| $2,500 to $2,999 | 95 (9.0%) | 25 (6.2%) |
| $3,000 or more | 187 (17.7%) | 42 (10.4%) |
| Total | 1,057 (100.0%) | 403 (100.0%) |
Physical Housing Characteristics in Indialantic
Housing Structures in Indialantic
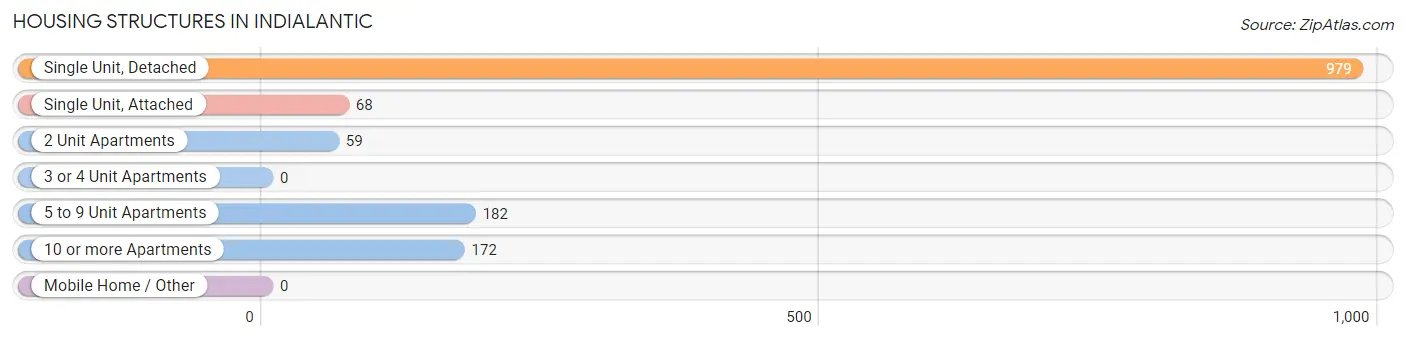
| Structure Type | # Housing Units | % Housing Units |
| Single Unit, Detached | 979 | 67.0% |
| Single Unit, Attached | 68 | 4.7% |
| 2 Unit Apartments | 59 | 4.0% |
| 3 or 4 Unit Apartments | 0 | 0.0% |
| 5 to 9 Unit Apartments | 182 | 12.5% |
| 10 or more Apartments | 172 | 11.8% |
| Mobile Home / Other | 0 | 0.0% |
| Total | 1,460 | 100.0% |
Housing Structures by Occupancy in Indialantic
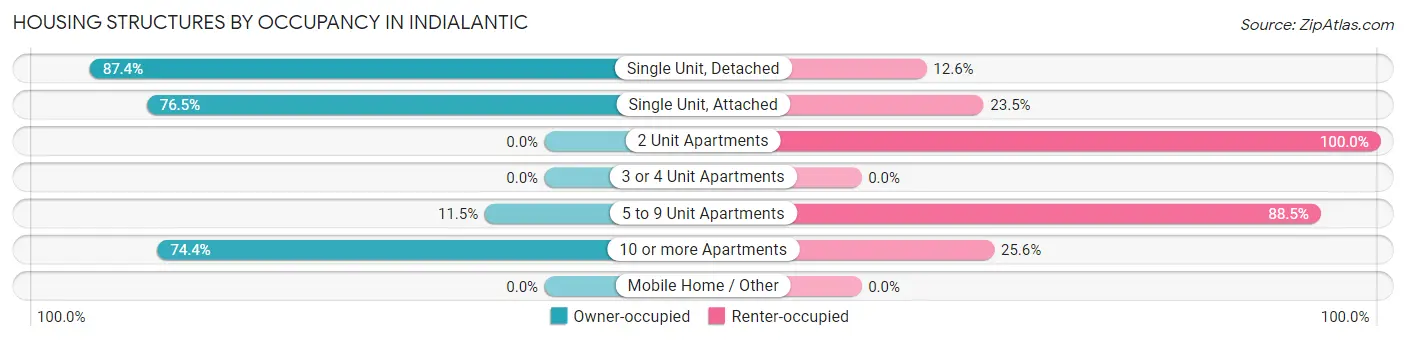
| Structure Type | Owner-occupied | Renter-occupied |
| Single Unit, Detached | 856 (87.4%) | 123 (12.6%) |
| Single Unit, Attached | 52 (76.5%) | 16 (23.5%) |
| 2 Unit Apartments | 0 (0.0%) | 59 (100.0%) |
| 3 or 4 Unit Apartments | 0 (0.0%) | 0 (0.0%) |
| 5 to 9 Unit Apartments | 21 (11.5%) | 161 (88.5%) |
| 10 or more Apartments | 128 (74.4%) | 44 (25.6%) |
| Mobile Home / Other | 0 (0.0%) | 0 (0.0%) |
| Total | 1,057 (72.4%) | 403 (27.6%) |
Housing Structures by Number of Rooms in Indialantic
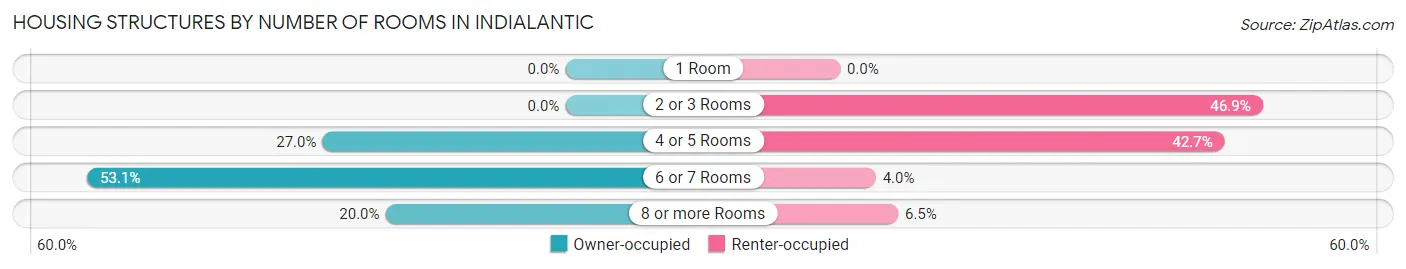
| Number of Rooms | Owner-occupied | Renter-occupied |
| 1 Room | 0 (0.0%) | 0 (0.0%) |
| 2 or 3 Rooms | 0 (0.0%) | 189 (46.9%) |
| 4 or 5 Rooms | 285 (27.0%) | 172 (42.7%) |
| 6 or 7 Rooms | 561 (53.1%) | 16 (4.0%) |
| 8 or more Rooms | 211 (20.0%) | 26 (6.5%) |
| Total | 1,057 (100.0%) | 403 (100.0%) |
Housing Structure by Heating Type in Indialantic
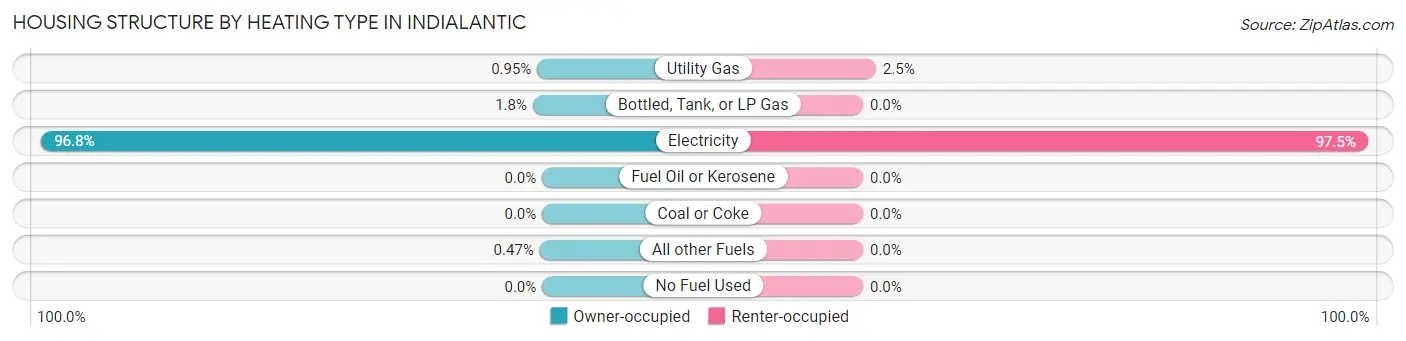
| Heating Type | Owner-occupied | Renter-occupied |
| Utility Gas | 10 (0.9%) | 10 (2.5%) |
| Bottled, Tank, or LP Gas | 19 (1.8%) | 0 (0.0%) |
| Electricity | 1,023 (96.8%) | 393 (97.5%) |
| Fuel Oil or Kerosene | 0 (0.0%) | 0 (0.0%) |
| Coal or Coke | 0 (0.0%) | 0 (0.0%) |
| All other Fuels | 5 (0.5%) | 0 (0.0%) |
| No Fuel Used | 0 (0.0%) | 0 (0.0%) |
| Total | 1,057 (100.0%) | 403 (100.0%) |
Household Vehicle Usage in Indialantic
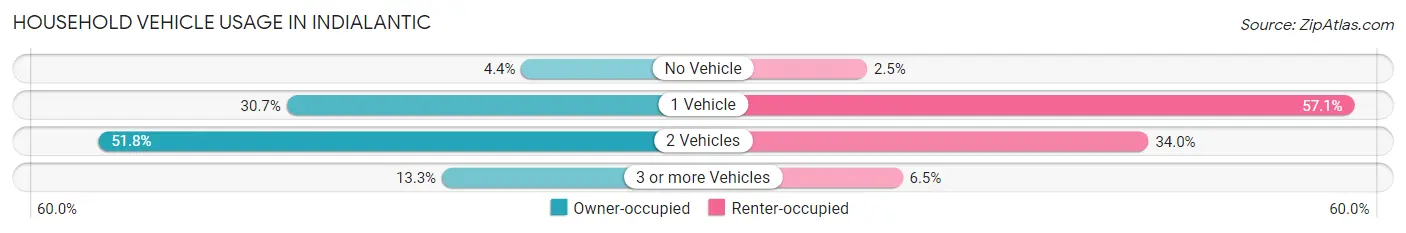
| Vehicles per Household | Owner-occupied | Renter-occupied |
| No Vehicle | 46 (4.3%) | 10 (2.5%) |
| 1 Vehicle | 324 (30.6%) | 230 (57.1%) |
| 2 Vehicles | 547 (51.7%) | 137 (34.0%) |
| 3 or more Vehicles | 140 (13.3%) | 26 (6.5%) |
| Total | 1,057 (100.0%) | 403 (100.0%) |
Real Estate & Mortgages in Indialantic
Real Estate and Mortgage Overview in Indialantic
| Characteristic | Without Mortgage | With Mortgage |
| Housing Units | 486 | 571 |
| Median Property Value | $460,600 | $609,200 |
| Median Household Income | $73,889 | $233 |
| Monthly Housing Costs | $807 | $187 |
| Real Estate Taxes | $3,345 | $0 |
Property Value by Mortgage Status in Indialantic
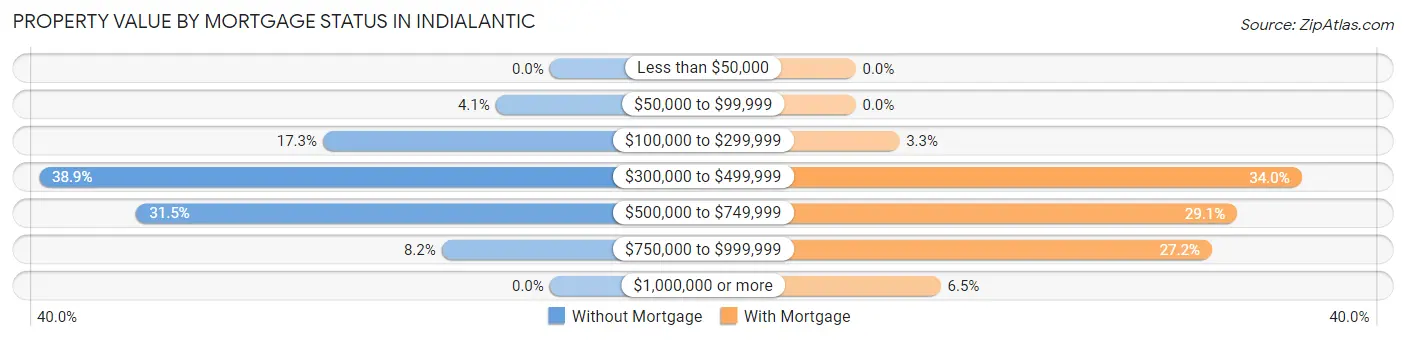
| Property Value | Without Mortgage | With Mortgage |
| Less than $50,000 | 0 (0.0%) | 0 (0.0%) |
| $50,000 to $99,999 | 20 (4.1%) | 0 (0.0%) |
| $100,000 to $299,999 | 84 (17.3%) | 19 (3.3%) |
| $300,000 to $499,999 | 189 (38.9%) | 194 (34.0%) |
| $500,000 to $749,999 | 153 (31.5%) | 166 (29.1%) |
| $750,000 to $999,999 | 40 (8.2%) | 155 (27.2%) |
| $1,000,000 or more | 0 (0.0%) | 37 (6.5%) |
| Total | 486 (100.0%) | 571 (100.0%) |
Household Income by Mortgage Status in Indialantic
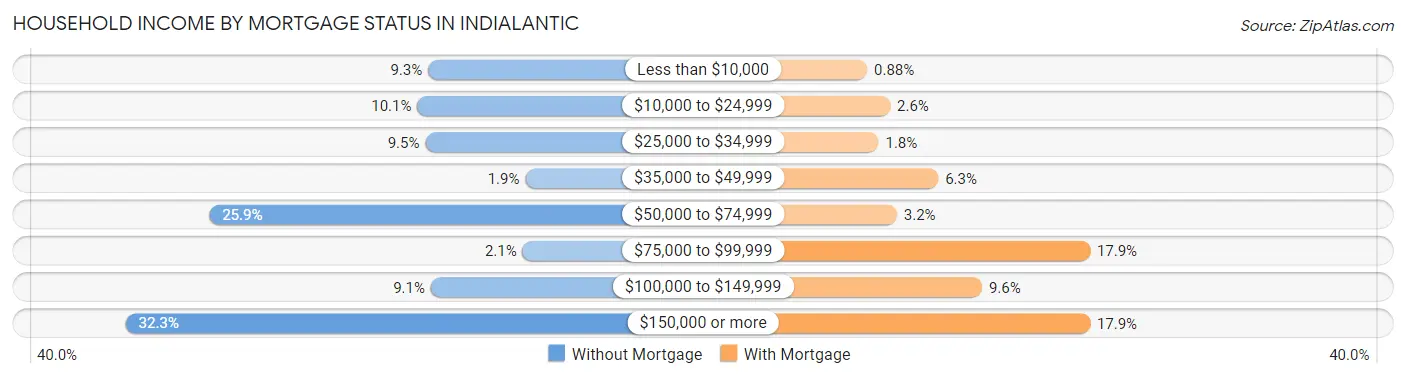
| Household Income | Without Mortgage | With Mortgage |
| Less than $10,000 | 45 (9.3%) | 5 (0.9%) |
| $10,000 to $24,999 | 49 (10.1%) | 15 (2.6%) |
| $25,000 to $34,999 | 46 (9.5%) | 10 (1.8%) |
| $35,000 to $49,999 | 9 (1.8%) | 36 (6.3%) |
| $50,000 to $74,999 | 126 (25.9%) | 18 (3.2%) |
| $75,000 to $99,999 | 10 (2.1%) | 102 (17.9%) |
| $100,000 to $149,999 | 44 (9.0%) | 55 (9.6%) |
| $150,000 or more | 157 (32.3%) | 102 (17.9%) |
| Total | 486 (100.0%) | 571 (100.0%) |
Property Value to Household Income Ratio in Indialantic
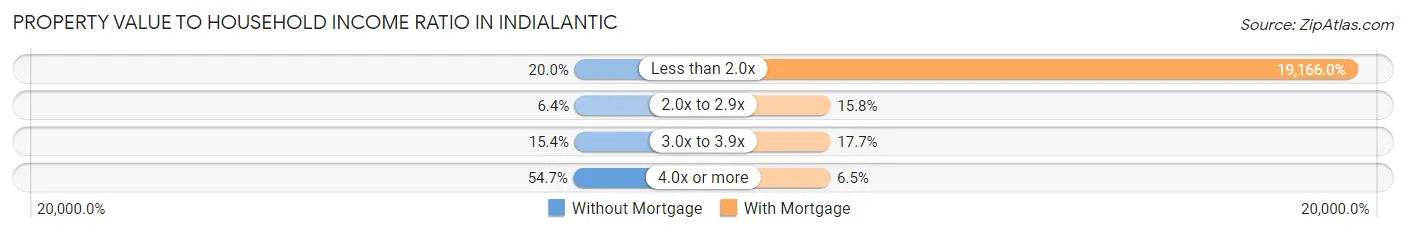
| Value-to-Income Ratio | Without Mortgage | With Mortgage |
| Less than 2.0x | 97 (20.0%) | 109,438 (19,166.0%) |
| 2.0x to 2.9x | 31 (6.4%) | 90 (15.8%) |
| 3.0x to 3.9x | 75 (15.4%) | 101 (17.7%) |
| 4.0x or more | 266 (54.7%) | 37 (6.5%) |
| Total | 486 (100.0%) | 571 (100.0%) |
Real Estate Taxes by Mortgage Status in Indialantic
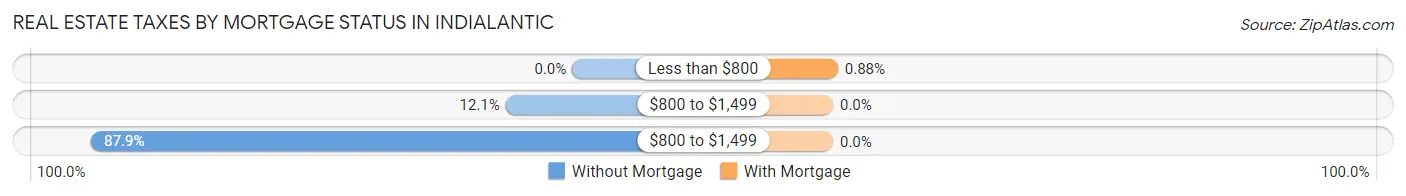
| Property Taxes | Without Mortgage | With Mortgage |
| Less than $800 | 0 (0.0%) | 5 (0.9%) |
| $800 to $1,499 | 59 (12.1%) | 0 (0.0%) |
| $800 to $1,499 | 427 (87.9%) | 0 (0.0%) |
| Total | 486 (100.0%) | 571 (100.0%) |
Health & Disability in Indialantic
Health Insurance Coverage by Age in Indialantic
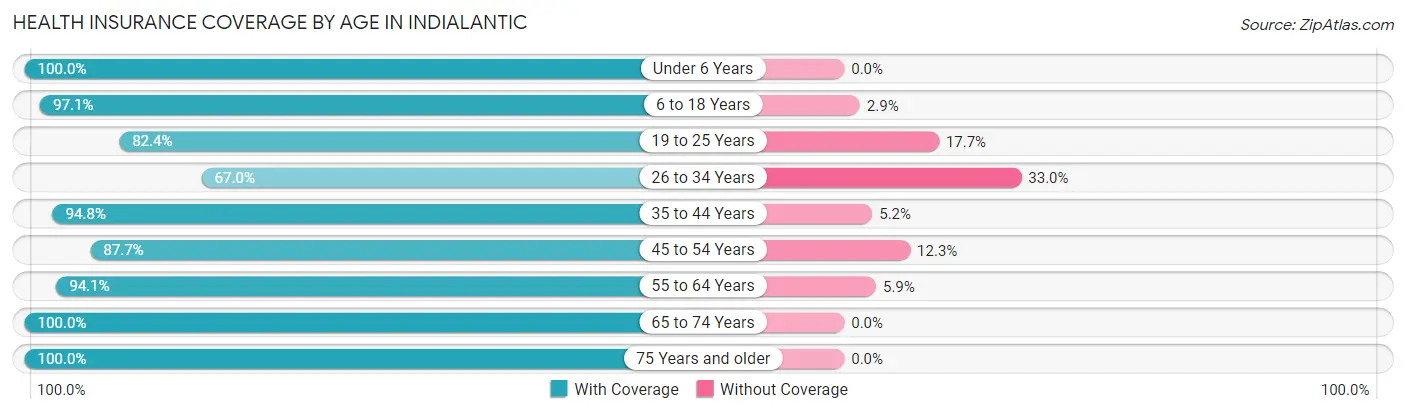
| Age Bracket | With Coverage | Without Coverage |
| Under 6 Years | 101 (100.0%) | 0 (0.0%) |
| 6 to 18 Years | 400 (97.1%) | 12 (2.9%) |
| 19 to 25 Years | 84 (82.4%) | 18 (17.6%) |
| 26 to 34 Years | 71 (67.0%) | 35 (33.0%) |
| 35 to 44 Years | 381 (94.8%) | 21 (5.2%) |
| 45 to 54 Years | 493 (87.7%) | 69 (12.3%) |
| 55 to 64 Years | 445 (94.1%) | 28 (5.9%) |
| 65 to 74 Years | 549 (100.0%) | 0 (0.0%) |
| 75 Years and older | 309 (100.0%) | 0 (0.0%) |
| Total | 2,833 (93.9%) | 183 (6.1%) |
Health Insurance Coverage by Citizenship Status in Indialantic
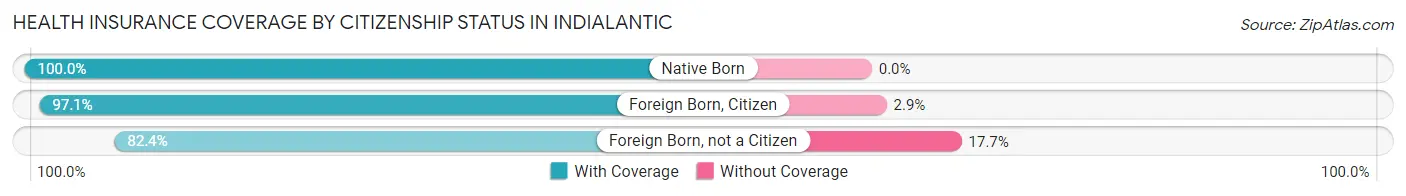
| Citizenship Status | With Coverage | Without Coverage |
| Native Born | 101 (100.0%) | 0 (0.0%) |
| Foreign Born, Citizen | 400 (97.1%) | 12 (2.9%) |
| Foreign Born, not a Citizen | 84 (82.4%) | 18 (17.6%) |
Health Insurance Coverage by Household Income in Indialantic
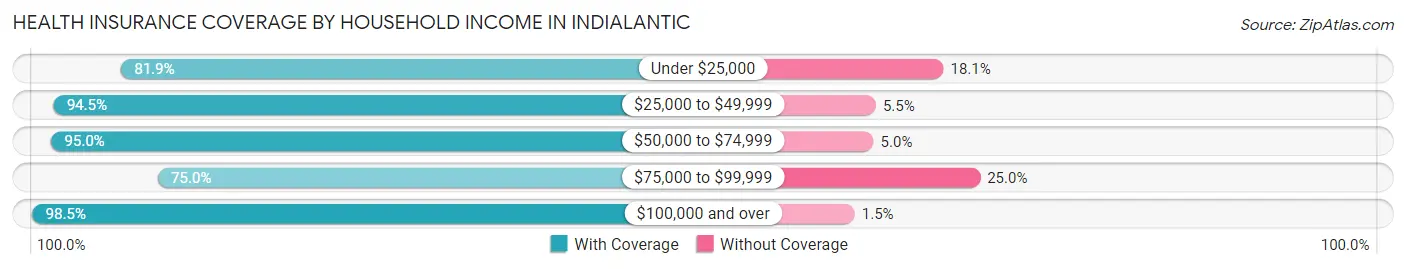
| Household Income | With Coverage | Without Coverage |
| Under $25,000 | 140 (81.9%) | 31 (18.1%) |
| $25,000 to $49,999 | 606 (94.5%) | 35 (5.5%) |
| $50,000 to $74,999 | 510 (95.0%) | 27 (5.0%) |
| $75,000 to $99,999 | 207 (75.0%) | 69 (25.0%) |
| $100,000 and over | 1,370 (98.5%) | 21 (1.5%) |
Public vs Private Health Insurance Coverage by Age in Indialantic
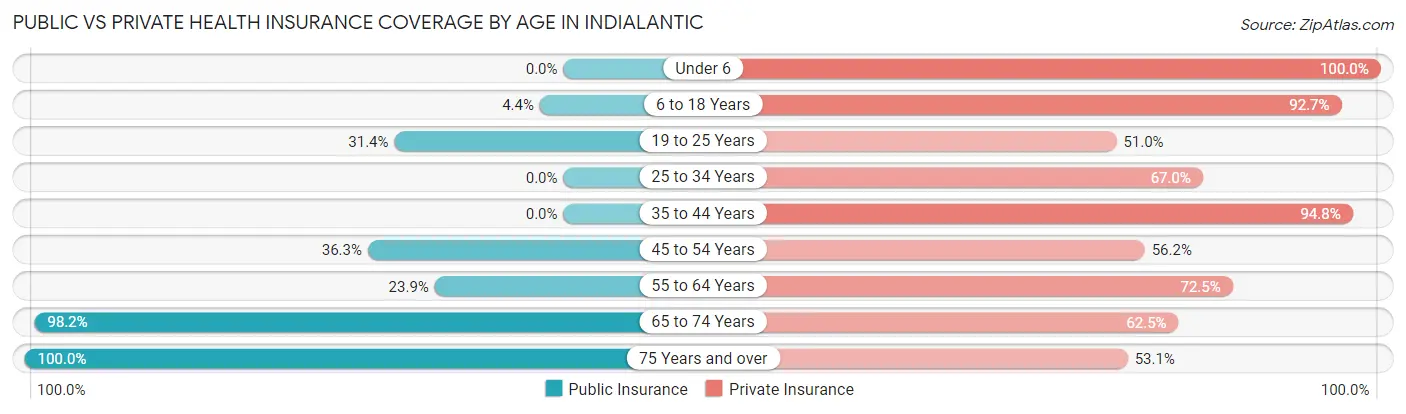
| Age Bracket | Public Insurance | Private Insurance |
| Under 6 | 0 (0.0%) | 101 (100.0%) |
| 6 to 18 Years | 18 (4.4%) | 382 (92.7%) |
| 19 to 25 Years | 32 (31.4%) | 52 (51.0%) |
| 25 to 34 Years | 0 (0.0%) | 71 (67.0%) |
| 35 to 44 Years | 0 (0.0%) | 381 (94.8%) |
| 45 to 54 Years | 204 (36.3%) | 316 (56.2%) |
| 55 to 64 Years | 113 (23.9%) | 343 (72.5%) |
| 65 to 74 Years | 539 (98.2%) | 343 (62.5%) |
| 75 Years and over | 309 (100.0%) | 164 (53.1%) |
| Total | 1,215 (40.3%) | 2,153 (71.4%) |
Disability Status by Sex by Age in Indialantic
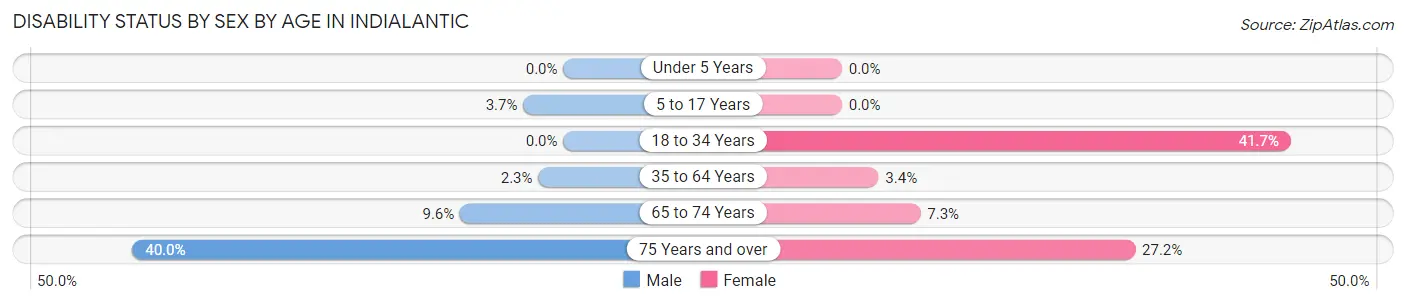
| Age Bracket | Male | Female |
| Under 5 Years | 0 (0.0%) | 0 (0.0%) |
| 5 to 17 Years | 11 (3.7%) | 0 (0.0%) |
| 18 to 34 Years | 0 (0.0%) | 50 (41.7%) |
| 35 to 64 Years | 19 (2.3%) | 21 (3.4%) |
| 65 to 74 Years | 25 (9.6%) | 21 (7.3%) |
| 75 Years and over | 56 (40.0%) | 46 (27.2%) |
Disability Class by Sex by Age in Indialantic
Disability Class: Hearing Difficulty
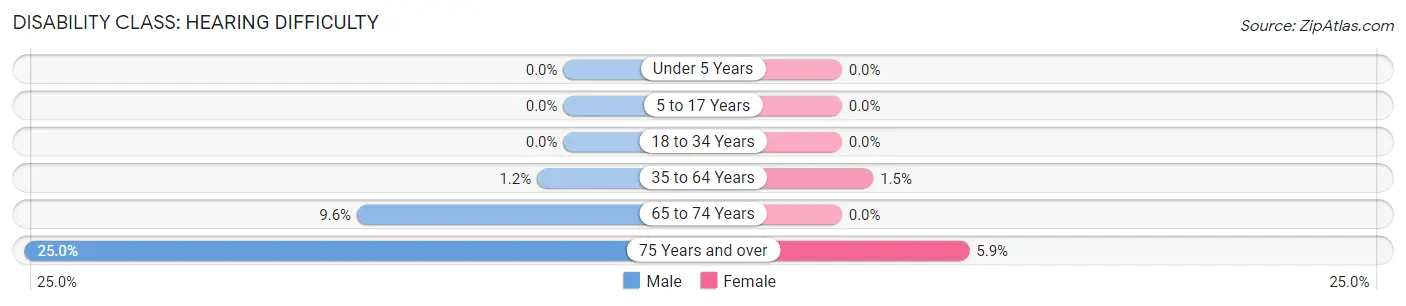
| Age Bracket | Male | Female |
| Under 5 Years | 0 (0.0%) | 0 (0.0%) |
| 5 to 17 Years | 0 (0.0%) | 0 (0.0%) |
| 18 to 34 Years | 0 (0.0%) | 0 (0.0%) |
| 35 to 64 Years | 10 (1.2%) | 9 (1.5%) |
| 65 to 74 Years | 25 (9.6%) | 0 (0.0%) |
| 75 Years and over | 35 (25.0%) | 10 (5.9%) |
Disability Class: Vision Difficulty
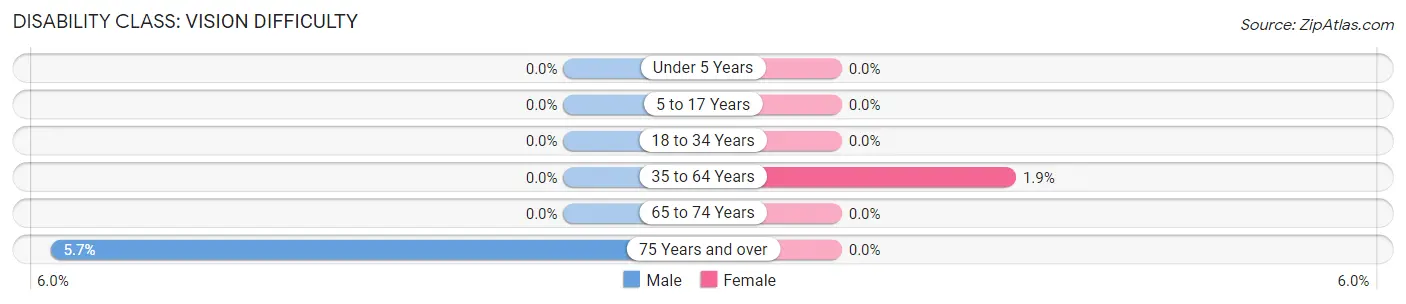
| Age Bracket | Male | Female |
| Under 5 Years | 0 (0.0%) | 0 (0.0%) |
| 5 to 17 Years | 0 (0.0%) | 0 (0.0%) |
| 18 to 34 Years | 0 (0.0%) | 0 (0.0%) |
| 35 to 64 Years | 0 (0.0%) | 12 (1.9%) |
| 65 to 74 Years | 0 (0.0%) | 0 (0.0%) |
| 75 Years and over | 8 (5.7%) | 0 (0.0%) |
Disability Class: Cognitive Difficulty
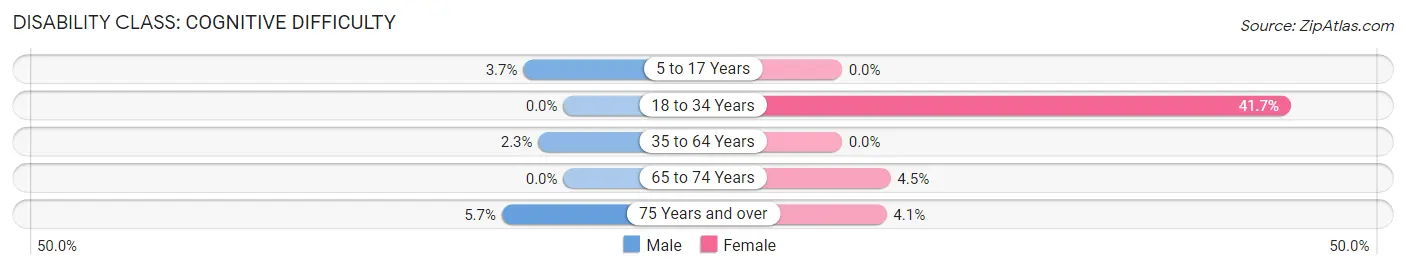
| Age Bracket | Male | Female |
| 5 to 17 Years | 11 (3.7%) | 0 (0.0%) |
| 18 to 34 Years | 0 (0.0%) | 50 (41.7%) |
| 35 to 64 Years | 19 (2.3%) | 0 (0.0%) |
| 65 to 74 Years | 0 (0.0%) | 13 (4.5%) |
| 75 Years and over | 8 (5.7%) | 7 (4.1%) |
Disability Class: Ambulatory Difficulty
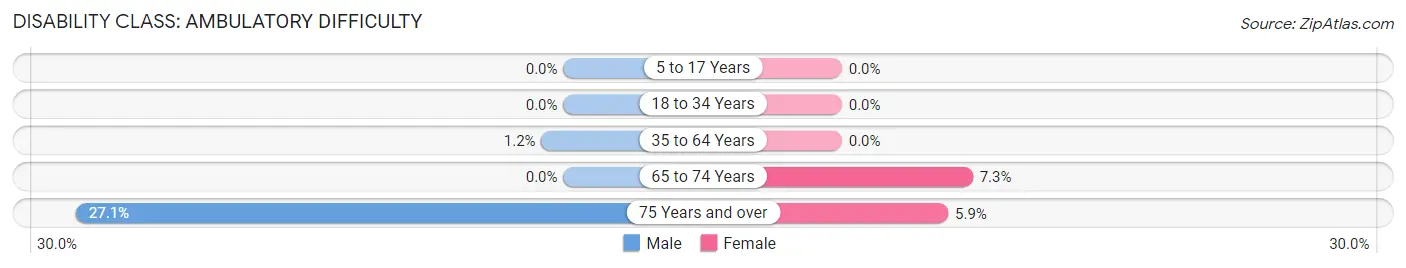
| Age Bracket | Male | Female |
| 5 to 17 Years | 0 (0.0%) | 0 (0.0%) |
| 18 to 34 Years | 0 (0.0%) | 0 (0.0%) |
| 35 to 64 Years | 10 (1.2%) | 0 (0.0%) |
| 65 to 74 Years | 0 (0.0%) | 21 (7.3%) |
| 75 Years and over | 38 (27.1%) | 10 (5.9%) |
Disability Class: Self-Care Difficulty
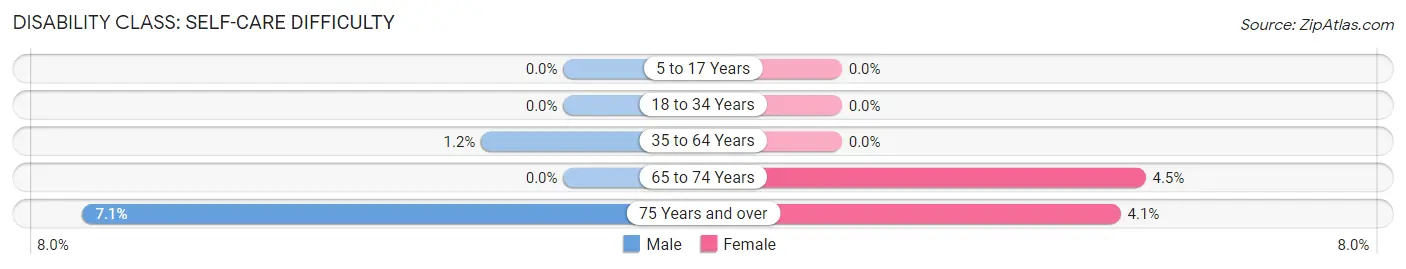
| Age Bracket | Male | Female |
| 5 to 17 Years | 0 (0.0%) | 0 (0.0%) |
| 18 to 34 Years | 0 (0.0%) | 0 (0.0%) |
| 35 to 64 Years | 10 (1.2%) | 0 (0.0%) |
| 65 to 74 Years | 0 (0.0%) | 13 (4.5%) |
| 75 Years and over | 10 (7.1%) | 7 (4.1%) |
Technology Access in Indialantic
Computing Device Access in Indialantic
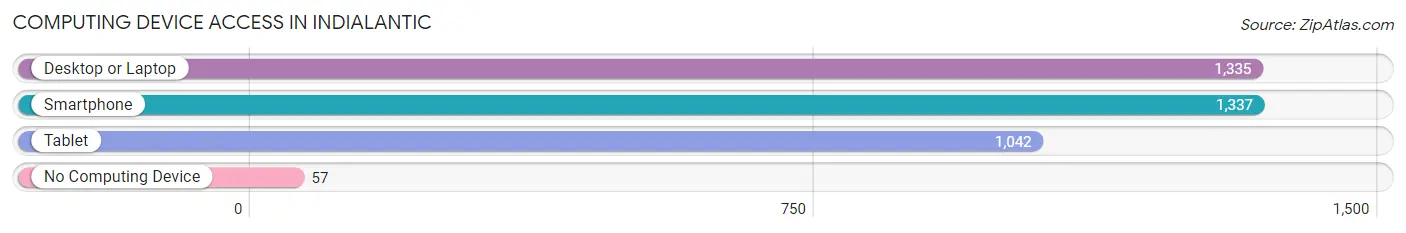
| Device Type | # Households | % Households |
| Desktop or Laptop | 1,335 | 91.4% |
| Smartphone | 1,337 | 91.6% |
| Tablet | 1,042 | 71.4% |
| No Computing Device | 57 | 3.9% |
| Total | 1,460 | 100.0% |
Internet Access in Indialantic
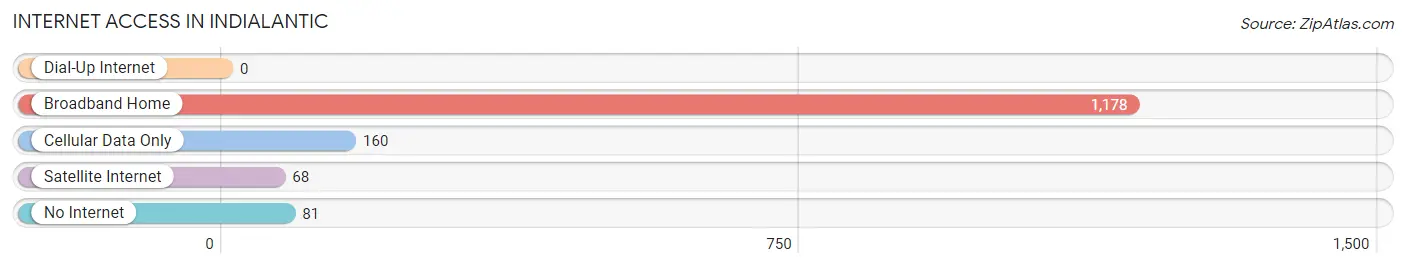
| Internet Type | # Households | % Households |
| Dial-Up Internet | 0 | 0.0% |
| Broadband Home | 1,178 | 80.7% |
| Cellular Data Only | 160 | 11.0% |
| Satellite Internet | 68 | 4.7% |
| No Internet | 81 | 5.6% |
| Total | 1,460 | 100.0% |
Indialantic Summary
Indialantic is a town located in Brevard County, Florida, United States. It is situated on a barrier island along the Atlantic Ocean, just south of Melbourne Beach and north of Melbourne. The town is part of the Palm Bay–Melbourne–Titusville Metropolitan Statistical Area. As of the 2010 census, the population of Indialantic was 2,720.
History
Indialantic was founded in 1925 by Carl D. Brodersen, a Danish immigrant who named the town after the Indian River Lagoon and the Atlantic Ocean. Brodersen purchased the land from the estate of James A. Henderson, who had purchased the land from the original homesteaders, the Sams family. Brodersen developed the town as a resort community, and it quickly became a popular destination for tourists.
In the 1950s, the town was incorporated as a municipality. The town has since grown and developed, and today it is a popular residential community.
Geography
Indialantic is located at 28°02′45″N 80°35′45″W (28.04583, -80.59583). According to the United States Census Bureau, the town has a total area of 1.2 square miles (3.1 km2), of which 0.9 square miles (2.3 km2) is land and 0.3 square miles (0.8 km2) is water.
Economy
Indialantic is a popular tourist destination, and the town's economy is largely based on tourism. The town is home to several hotels, restaurants, and other businesses that cater to tourists. Additionally, the town is home to several small businesses, including retail stores, professional services, and other businesses.
Demographics
As of the 2010 census, there were 2,720 people, 1,093 households, and 745 families residing in the town. The population density was 2,945.3 people per square mile (1,137.2/km2). There were 1,220 housing units at an average density of 1,323.3 per square mile (510.7/km2). The racial makeup of the town was 94.2% White, 1.7% African American, 0.2% Native American, 1.7% Asian, 0.1% Pacific Islander, 0.9% from other races, and 1.2% from two or more races. Hispanic or Latino of any race were 4.2% of the population.
There were 1,093 households, out of which 24.2% had children under the age of 18 living with them, 56.2% were married couples living together, 8.7% had a female householder with no husband present, and 32.2% were non-families. 25.7% of all households were made up of individuals, and 11.2% had someone living alone who was 65 years of age or older. The average household size was 2.48 and the average family size was 2.99.
In the town, the population was spread out, with 21.2% under the age of 18, 5.7% from 18 to 24, 24.2% from 25 to 44, 28.2% from 45 to 64, and 20.7% who were 65 years of age or older. The median age was 44 years. For every 100 females, there were 94.2 males. For every 100 females age 18 and over, there were 91.2 males.
The median income for a household in the town was $50,938, and the median income for a family was $60,938. Males had a median income of $41,964 versus $30,000 for females. The per capita income for the town was $27,938. About 4.2% of families and 6.2% of the population were below the poverty line, including 8.2% of those under age 18 and 4.2% of those age 65 or over.
Common Questions
What is Per Capita Income in Indialantic?
Per Capita income in Indialantic is $62,657.
What is the Median Family Income in Indialantic?
Median Family Income in Indialantic is $103,333.
What is the Median Household income in Indialantic?
Median Household Income in Indialantic is $74,237.
What is Income or Wage Gap in Indialantic?
Income or Wage Gap in Indialantic is 24.3%.
Women in Indialantic earn 75.7 cents for every dollar earned by a man.
What is Family Income Deficit in Indialantic?
Family Income Deficit in Indialantic is $5,909.
Families that are below poverty line in Indialantic earn $5,909 less on average than the poverty threshold level.
What is Inequality or Gini Index in Indialantic?
Inequality or Gini Index in Indialantic is 0.52.
What is the Total Population of Indialantic?
Total Population of Indialantic is 3,016.
What is the Total Male Population of Indialantic?
Total Male Population of Indialantic is 1,639.
What is the Total Female Population of Indialantic?
Total Female Population of Indialantic is 1,377.
What is the Ratio of Males per 100 Females in Indialantic?
There are 119.03 Males per 100 Females in Indialantic.
What is the Ratio of Females per 100 Males in Indialantic?
There are 84.01 Females per 100 Males in Indialantic.
What is the Median Population Age in Indialantic?
Median Population Age in Indialantic is 51.7 Years.
What is the Average Family Size in Indialantic
Average Family Size in Indialantic is 2.7 People.
What is the Average Household Size in Indialantic
Average Household Size in Indialantic is 2.1 People.
How Large is the Labor Force in Indialantic?
There are 1,474 People in the Labor Forcein in Indialantic.
What is the Percentage of People in the Labor Force in Indialantic?
57.1% of People are in the Labor Force in Indialantic.
What is the Unemployment Rate in Indialantic?
Unemployment Rate in Indialantic is 5.8%.