Snowmass Village, CO Map & Demographics
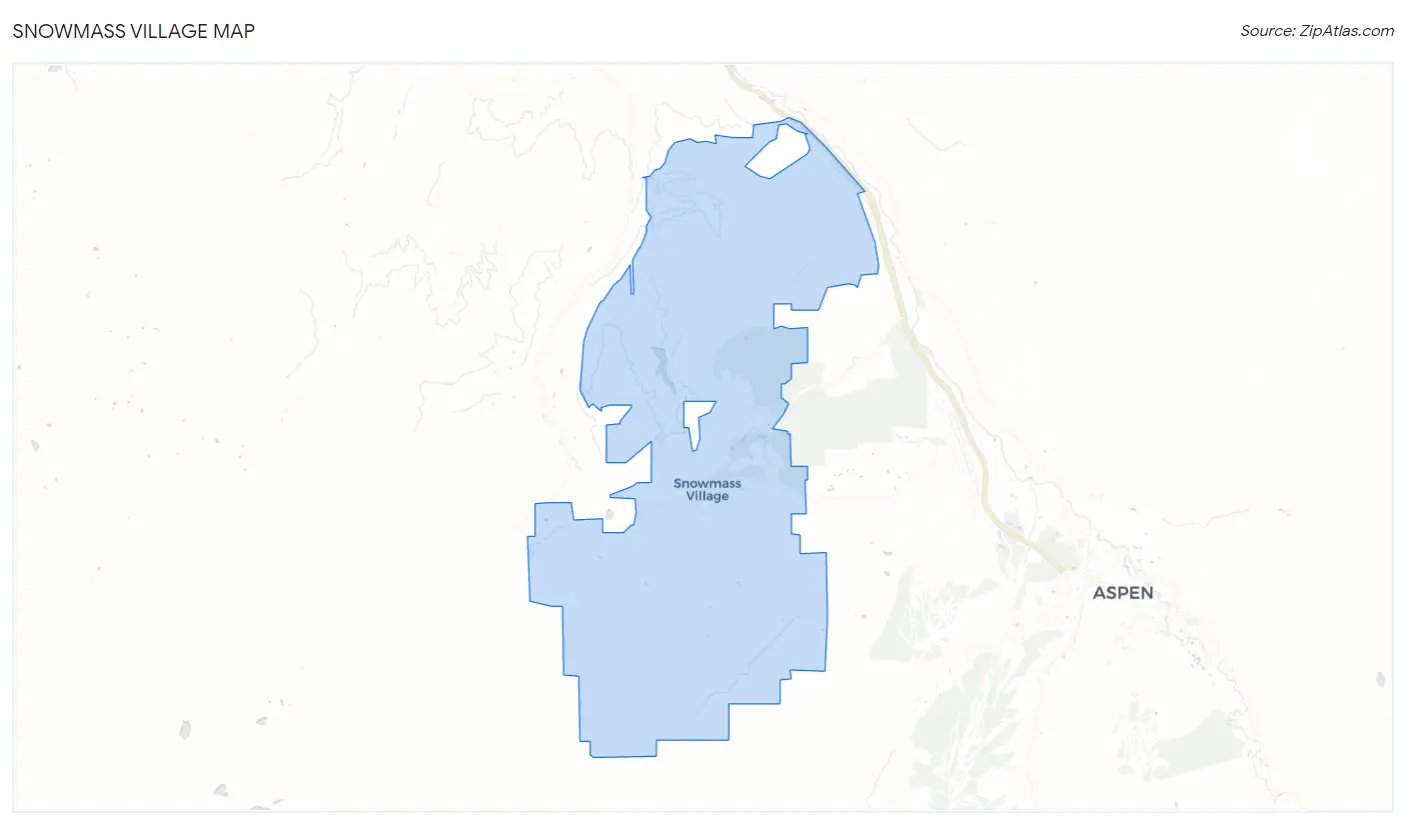
Snowmass Village Map
Snowmass Village Overview
$100,123
PER CAPITA INCOME
$195,080
AVG FAMILY INCOME
$94,761
AVG HOUSEHOLD INCOME
0.53
INEQUALITY / GINI INDEX
3,076
TOTAL POPULATION
1,443
MALE POPULATION
1,633
FEMALE POPULATION
88.36
MALES / 100 FEMALES
113.17
FEMALES / 100 MALES
58.1
MEDIAN AGE
2.9
AVG FAMILY SIZE
2.0
AVG HOUSEHOLD SIZE
1,727
LABOR FORCE [ PEOPLE ]
68.0%
PERCENT IN LABOR FORCE
Snowmass Village Zip Codes
Snowmass Village Area Codes
Income in Snowmass Village
Income Overview in Snowmass Village
Per Capita Income in Snowmass Village is $100,123, while median incomes of families and households are $195,080 and $94,761 respectively.
| Characteristic | Number | Measure |
| Per Capita Income | 3,076 | $100,123 |
| Median Family Income | 721 | $195,080 |
| Mean Family Income | 721 | $257,588 |
| Median Household Income | 1,492 | $94,761 |
| Mean Household Income | 1,492 | $169,404 |
| Income Deficit | 721 | $0 |
| Wage / Income Gap (%) | 3,076 | 0.00% |
| Wage / Income Gap ($) | 3,076 | 100.00¢ per $1 |
| Gini / Inequality Index | 3,076 | 0.53 |
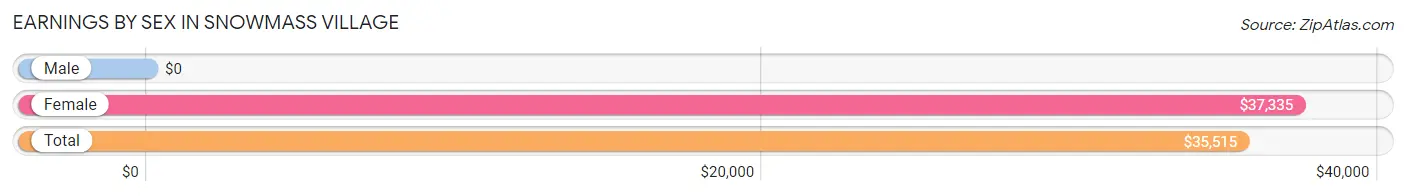
Earnings by Sex in Snowmass Village
| Sex | Number | Average Earnings |
| Male | 777 (42.2%) | $0 |
| Female | 1,063 (57.8%) | $37,335 |
| Total | 1,840 (100.0%) | $35,515 |
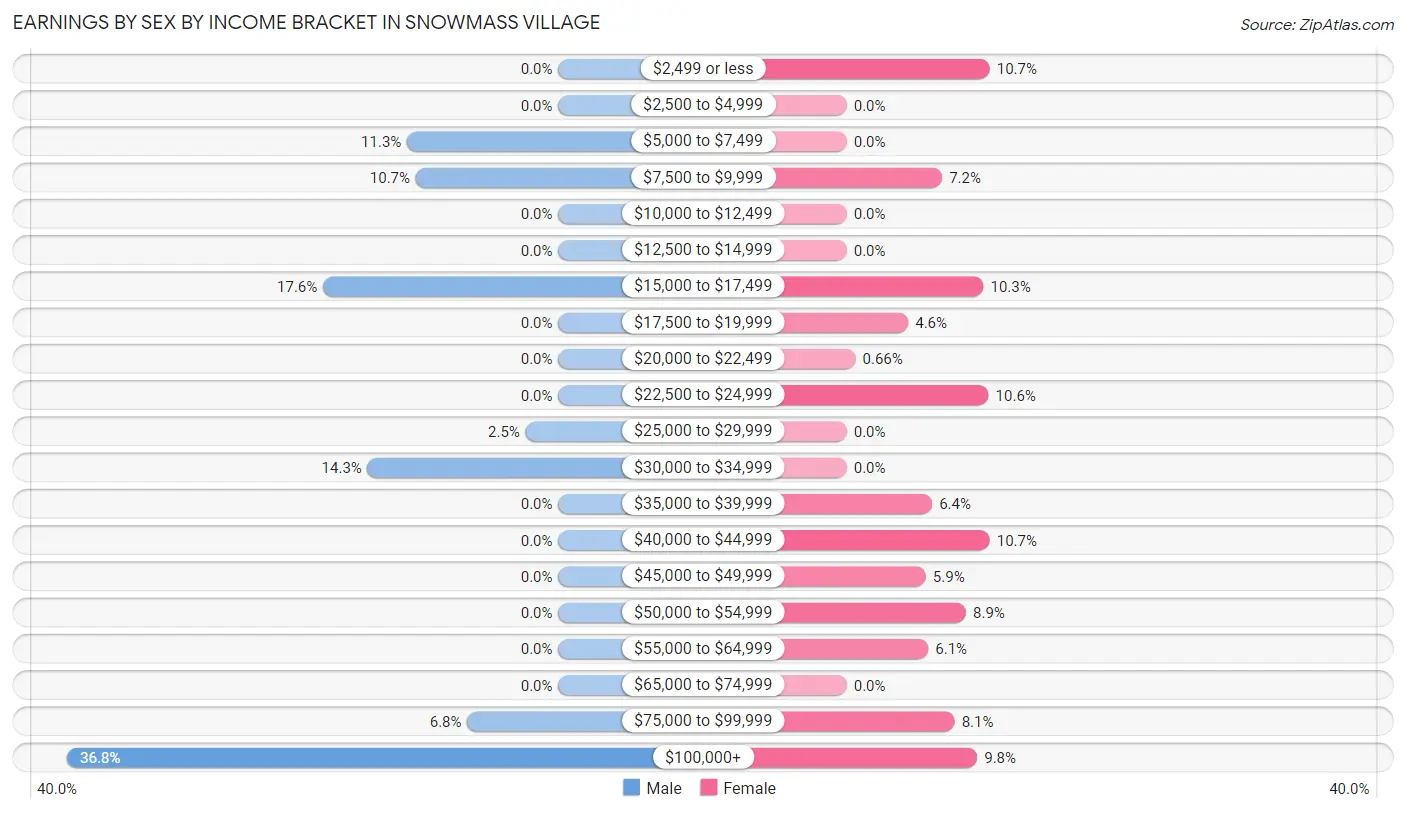
Earnings by Sex by Income Bracket in Snowmass Village
The most common earnings brackets in Snowmass Village are $100,000+ for men (286 | 36.8%) and $2,499 or less for women (114 | 10.7%).
| Income | Male | Female |
| $2,499 or less | 0 (0.0%) | 114 (10.7%) |
| $2,500 to $4,999 | 0 (0.0%) | 0 (0.0%) |
| $5,000 to $7,499 | 88 (11.3%) | 0 (0.0%) |
| $7,500 to $9,999 | 83 (10.7%) | 76 (7.1%) |
| $10,000 to $12,499 | 0 (0.0%) | 0 (0.0%) |
| $12,500 to $14,999 | 0 (0.0%) | 0 (0.0%) |
| $15,000 to $17,499 | 137 (17.6%) | 109 (10.2%) |
| $17,500 to $19,999 | 0 (0.0%) | 49 (4.6%) |
| $20,000 to $22,499 | 0 (0.0%) | 7 (0.7%) |
| $22,500 to $24,999 | 0 (0.0%) | 113 (10.6%) |
| $25,000 to $29,999 | 19 (2.5%) | 0 (0.0%) |
| $30,000 to $34,999 | 111 (14.3%) | 0 (0.0%) |
| $35,000 to $39,999 | 0 (0.0%) | 68 (6.4%) |
| $40,000 to $44,999 | 0 (0.0%) | 114 (10.7%) |
| $45,000 to $49,999 | 0 (0.0%) | 63 (5.9%) |
| $50,000 to $54,999 | 0 (0.0%) | 95 (8.9%) |
| $55,000 to $64,999 | 0 (0.0%) | 65 (6.1%) |
| $65,000 to $74,999 | 0 (0.0%) | 0 (0.0%) |
| $75,000 to $99,999 | 53 (6.8%) | 86 (8.1%) |
| $100,000+ | 286 (36.8%) | 104 (9.8%) |
| Total | 777 (100.0%) | 1,063 (100.0%) |
Earnings by Sex by Educational Attainment in Snowmass Village
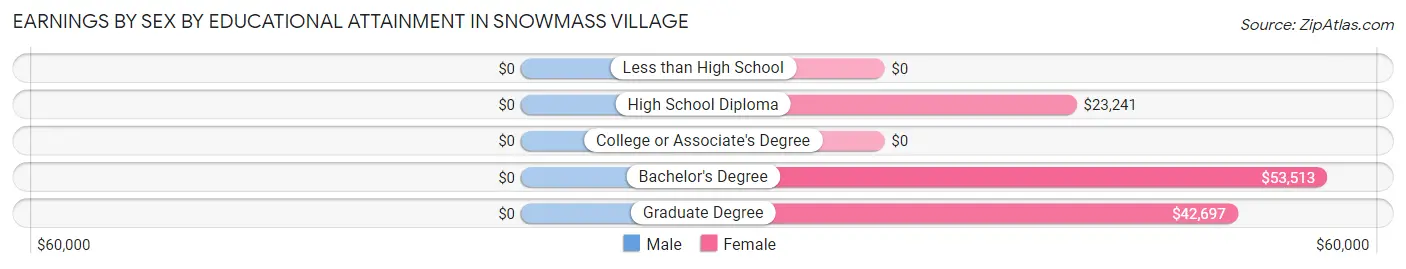
| Educational Attainment | Male Income | Female Income |
| Less than High School | - | - |
| High School Diploma | - | - |
| College or Associate's Degree | - | - |
| Bachelor's Degree | - | - |
| Graduate Degree | - | - |
| Total | - | - |
Family Income in Snowmass Village
Family Income Brackets in Snowmass Village
According to the Snowmass Village family income data, there are 254 families falling into the $200,000+ income range, which is the most common income bracket and makes up 35.2% of all families.
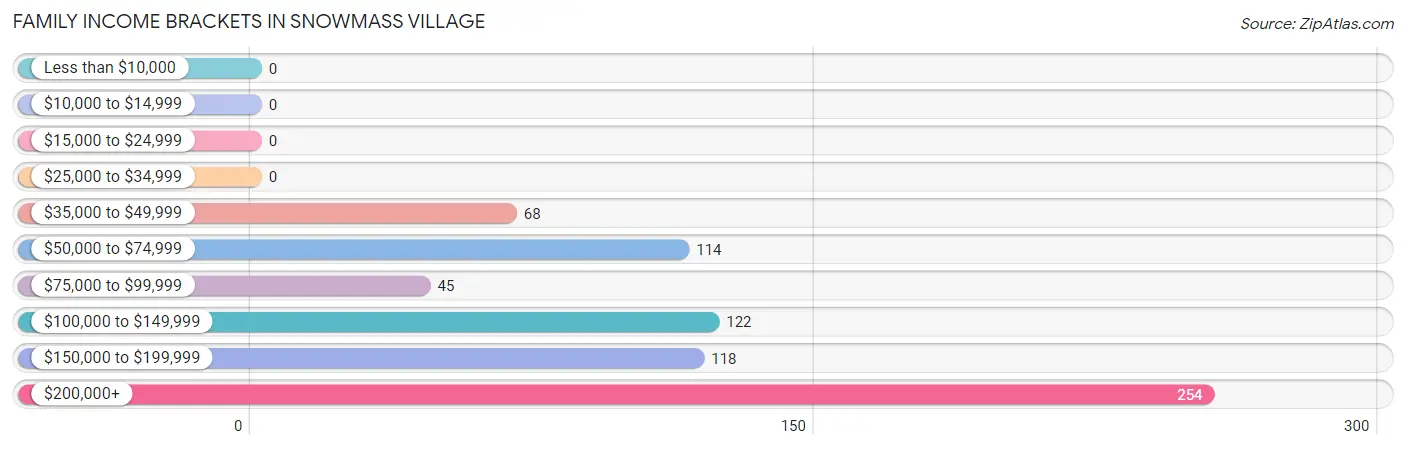
| Income Bracket | # Families | % Families |
| Less than $10,000 | 0 | 0.0% |
| $10,000 to $14,999 | 0 | 0.0% |
| $15,000 to $24,999 | 0 | 0.0% |
| $25,000 to $34,999 | 0 | 0.0% |
| $35,000 to $49,999 | 68 | 9.4% |
| $50,000 to $74,999 | 114 | 15.8% |
| $75,000 to $99,999 | 45 | 6.2% |
| $100,000 to $149,999 | 122 | 16.9% |
| $150,000 to $199,999 | 118 | 16.4% |
| $200,000+ | 254 | 35.2% |
Family Income by Famaliy Size in Snowmass Village
2-person families (472 | 65.5%) account for the highest median family income in Snowmass Village with $196,568 per family, while 2-person families (472 | 65.5%) have the highest median income of $98,284 per family member.
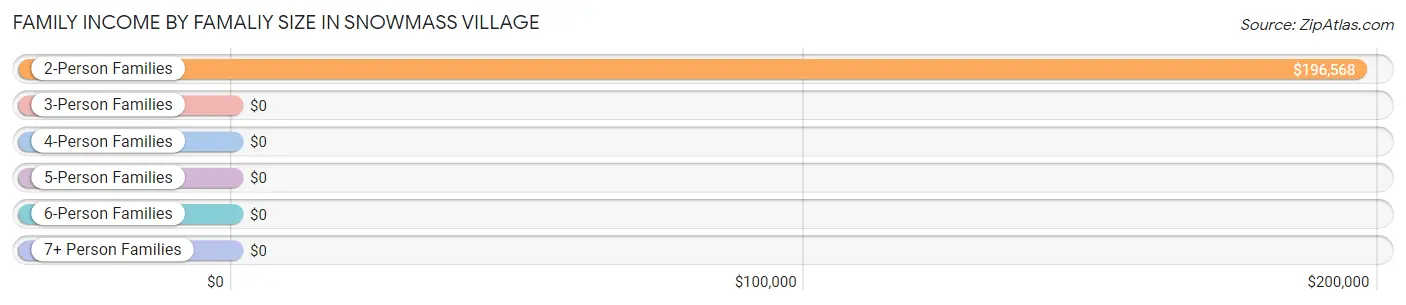
| Income Bracket | # Families | Median Income |
| 2-Person Families | 472 (65.5%) | $196,568 |
| 3-Person Families | 68 (9.4%) | $0 |
| 4-Person Families | 122 (16.9%) | $0 |
| 5-Person Families | 59 (8.2%) | $0 |
| 6-Person Families | 0 (0.0%) | $0 |
| 7+ Person Families | 0 (0.0%) | $0 |
| Total | 721 (100.0%) | $195,080 |
Family Income by Number of Earners in Snowmass Village
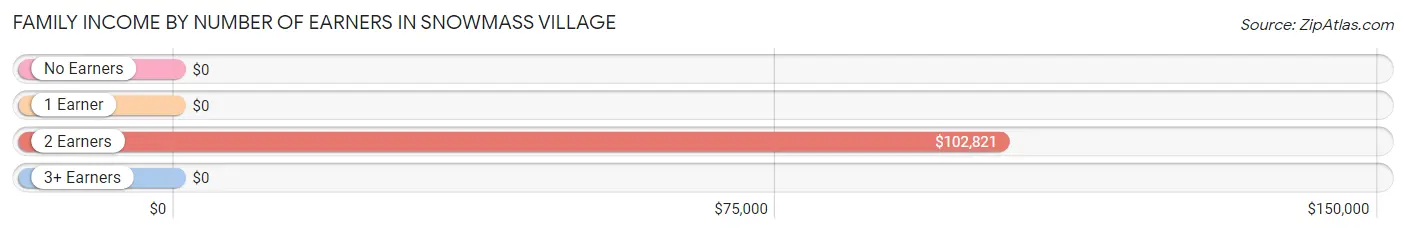
| Number of Earners | # Families | Median Income |
| No Earners | 170 (23.6%) | $0 |
| 1 Earner | 68 (9.4%) | $0 |
| 2 Earners | 483 (67.0%) | $102,821 |
| 3+ Earners | 0 (0.0%) | $0 |
| Total | 721 (100.0%) | $195,080 |
Household Income in Snowmass Village
Household Income Brackets in Snowmass Village
With 330 households falling in the category, the $200,000+ income range is the most frequent in Snowmass Village, accounting for 22.1% of all households.
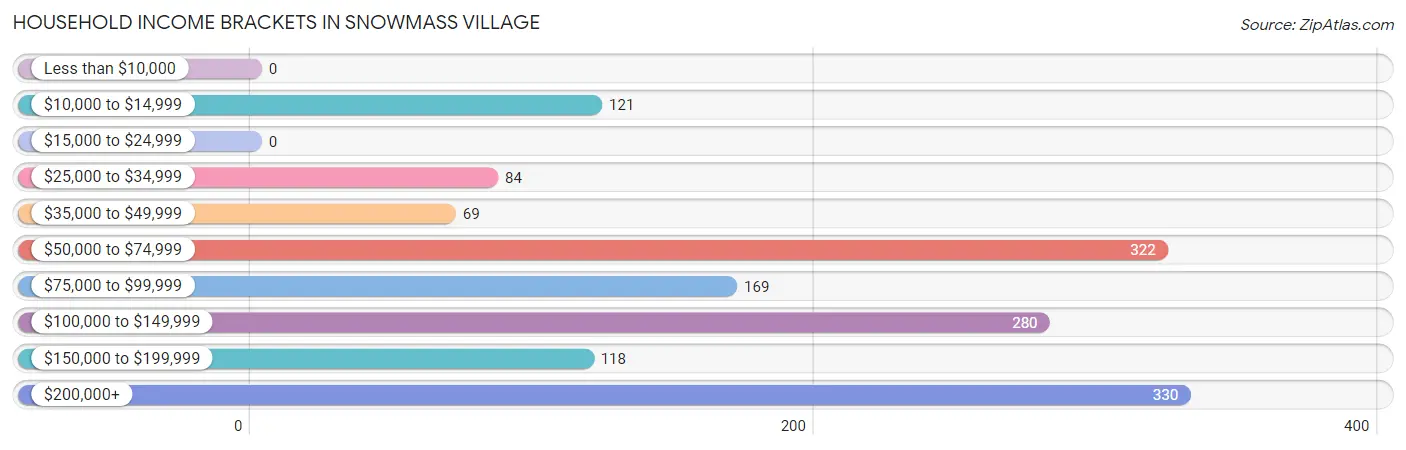
| Income Bracket | # Households | % Households |
| Less than $10,000 | 0 | 0.0% |
| $10,000 to $14,999 | 121 | 8.1% |
| $15,000 to $24,999 | 0 | 0.0% |
| $25,000 to $34,999 | 84 | 5.6% |
| $35,000 to $49,999 | 69 | 4.6% |
| $50,000 to $74,999 | 322 | 21.6% |
| $75,000 to $99,999 | 169 | 11.3% |
| $100,000 to $149,999 | 280 | 18.8% |
| $150,000 to $199,999 | 118 | 7.9% |
| $200,000+ | 330 | 22.1% |
Household Income by Householder Age in Snowmass Village
The median household income in Snowmass Village is $94,761, with the highest median household income of $137,588 found in the 45 to 64 years age bracket for the primary householder. A total of 540 households (36.2%) fall into this category.
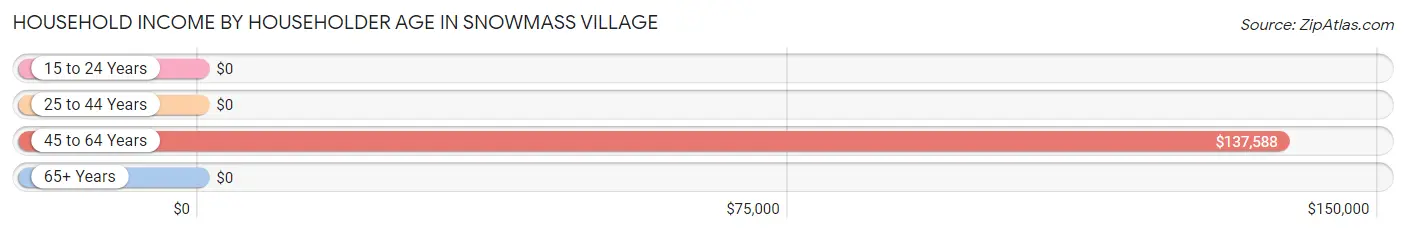
| Income Bracket | # Households | Median Income |
| 15 to 24 Years | 0 (0.0%) | $0 |
| 25 to 44 Years | 227 (15.2%) | $0 |
| 45 to 64 Years | 540 (36.2%) | $137,588 |
| 65+ Years | 725 (48.6%) | $0 |
| Total | 1,492 (100.0%) | $94,761 |
Poverty in Snowmass Village
Income Below Poverty by Sex and Age in Snowmass Village
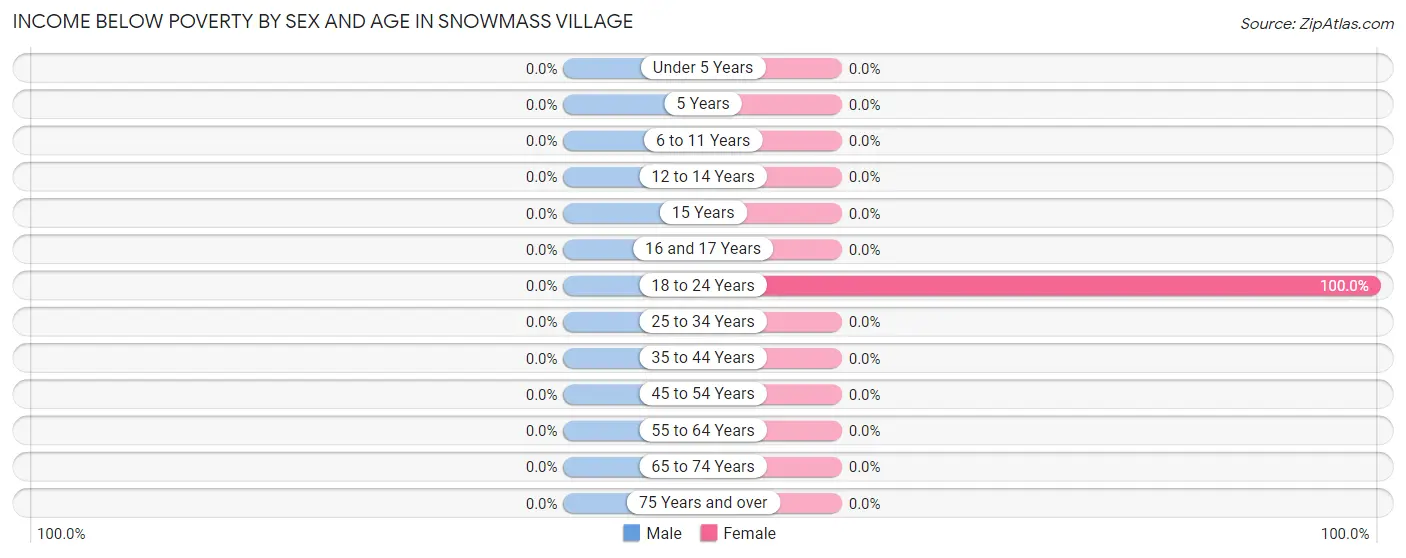
| Age Bracket | Male | Female |
| Under 5 Years | 0 (0.0%) | 0 (0.0%) |
| 5 Years | 0 (0.0%) | 0 (0.0%) |
| 6 to 11 Years | 0 (0.0%) | 0 (0.0%) |
| 12 to 14 Years | 0 (0.0%) | 0 (0.0%) |
| 15 Years | 0 (0.0%) | 0 (0.0%) |
| 16 and 17 Years | 0 (0.0%) | 0 (0.0%) |
| 18 to 24 Years | 0 (0.0%) | 17 (100.0%) |
| 25 to 34 Years | 0 (0.0%) | 0 (0.0%) |
| 35 to 44 Years | 0 (0.0%) | 0 (0.0%) |
| 45 to 54 Years | 0 (0.0%) | 0 (0.0%) |
| 55 to 64 Years | 0 (0.0%) | 0 (0.0%) |
| 65 to 74 Years | 0 (0.0%) | 0 (0.0%) |
| 75 Years and over | 0 (0.0%) | 0 (0.0%) |
| Total | 0 (0.0%) | 17 (1.0%) |
Income Above Poverty by Sex and Age in Snowmass Village
According to the poverty statistics in Snowmass Village, males aged under 5 years and females aged 6 to 11 years are the age groups that are most secure financially, with 100.0% of males and 100.0% of females in these age groups living above the poverty line.
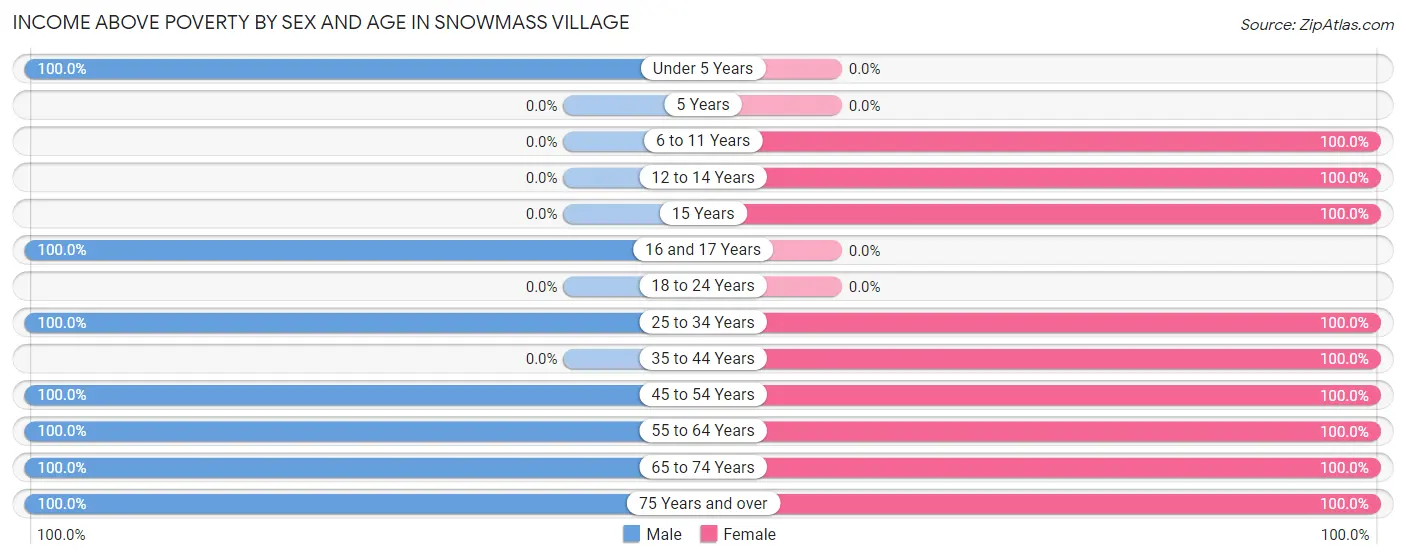
| Age Bracket | Male | Female |
| Under 5 Years | 272 (100.0%) | 0 (0.0%) |
| 5 Years | 0 (0.0%) | 0 (0.0%) |
| 6 to 11 Years | 0 (0.0%) | 61 (100.0%) |
| 12 to 14 Years | 0 (0.0%) | 116 (100.0%) |
| 15 Years | 0 (0.0%) | 88 (100.0%) |
| 16 and 17 Years | 88 (100.0%) | 0 (0.0%) |
| 18 to 24 Years | 0 (0.0%) | 0 (0.0%) |
| 25 to 34 Years | 83 (100.0%) | 227 (100.0%) |
| 35 to 44 Years | 0 (0.0%) | 109 (100.0%) |
| 45 to 54 Years | 247 (100.0%) | 134 (100.0%) |
| 55 to 64 Years | 223 (100.0%) | 395 (100.0%) |
| 65 to 74 Years | 266 (100.0%) | 322 (100.0%) |
| 75 Years and over | 264 (100.0%) | 164 (100.0%) |
| Total | 1,443 (100.0%) | 1,616 (99.0%) |
Income Below Poverty Among Married-Couple Families in Snowmass Village
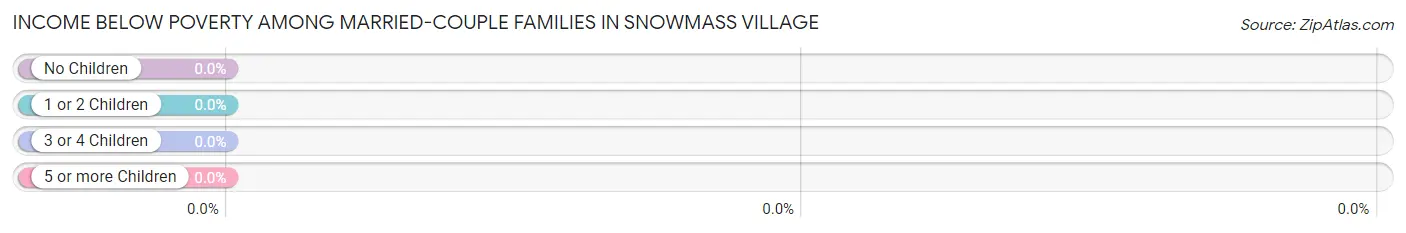
| Children | Above Poverty | Below Poverty |
| No Children | 427 (100.0%) | 0 (0.0%) |
| 1 or 2 Children | 122 (100.0%) | 0 (0.0%) |
| 3 or 4 Children | 59 (100.0%) | 0 (0.0%) |
| 5 or more Children | 0 (0.0%) | 0 (0.0%) |
| Total | 608 (100.0%) | 0 (0.0%) |
Income Below Poverty Among Single-Parent Households in Snowmass Village
| Children | Single Father | Single Mother |
| No Children | 0 (0.0%) | 0 (0.0%) |
| 1 or 2 Children | 0 (0.0%) | 0 (0.0%) |
| 3 or 4 Children | 0 (0.0%) | 0 (0.0%) |
| 5 or more Children | 0 (0.0%) | 0 (0.0%) |
| Total | 0 (0.0%) | 0 (0.0%) |
Income Below Poverty Among Married-Couple vs Single-Parent Households in Snowmass Village
| Children | Married-Couple Families | Single-Parent Households |
| No Children | 0 (0.0%) | 0 (0.0%) |
| 1 or 2 Children | 0 (0.0%) | 0 (0.0%) |
| 3 or 4 Children | 0 (0.0%) | 0 (0.0%) |
| 5 or more Children | 0 (0.0%) | 0 (0.0%) |
| Total | 0 (0.0%) | 0 (0.0%) |
Race in Snowmass Village
The most populous races in Snowmass Village are White / Caucasian (2,721 | 88.5%), Hispanic or Latino (409 | 13.3%), and Two or more Races (338 | 11.0%).
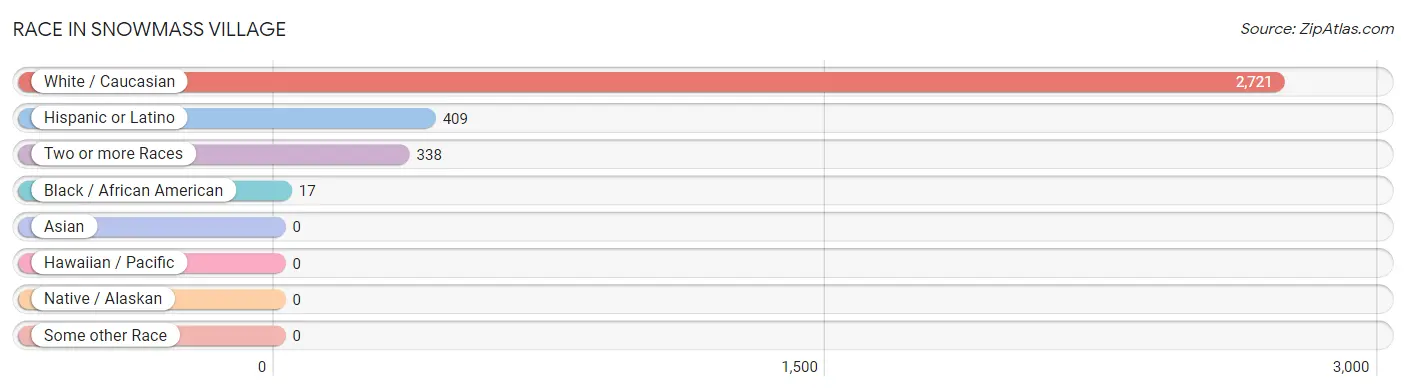
| Race | # Population | % Population |
| Asian | 0 | 0.0% |
| Black / African American | 17 | 0.5% |
| Hawaiian / Pacific | 0 | 0.0% |
| Hispanic or Latino | 409 | 13.3% |
| Native / Alaskan | 0 | 0.0% |
| White / Caucasian | 2,721 | 88.5% |
| Two or more Races | 338 | 11.0% |
| Some other Race | 0 | 0.0% |
| Total | 3,076 | 100.0% |
Ancestry in Snowmass Village
The most populous ancestries reported in Snowmass Village are German (911 | 29.6%), English (732 | 23.8%), Scottish (460 | 14.9%), Cuban (272 | 8.8%), and French (230 | 7.5%), together accounting for 84.7% of all Snowmass Village residents.
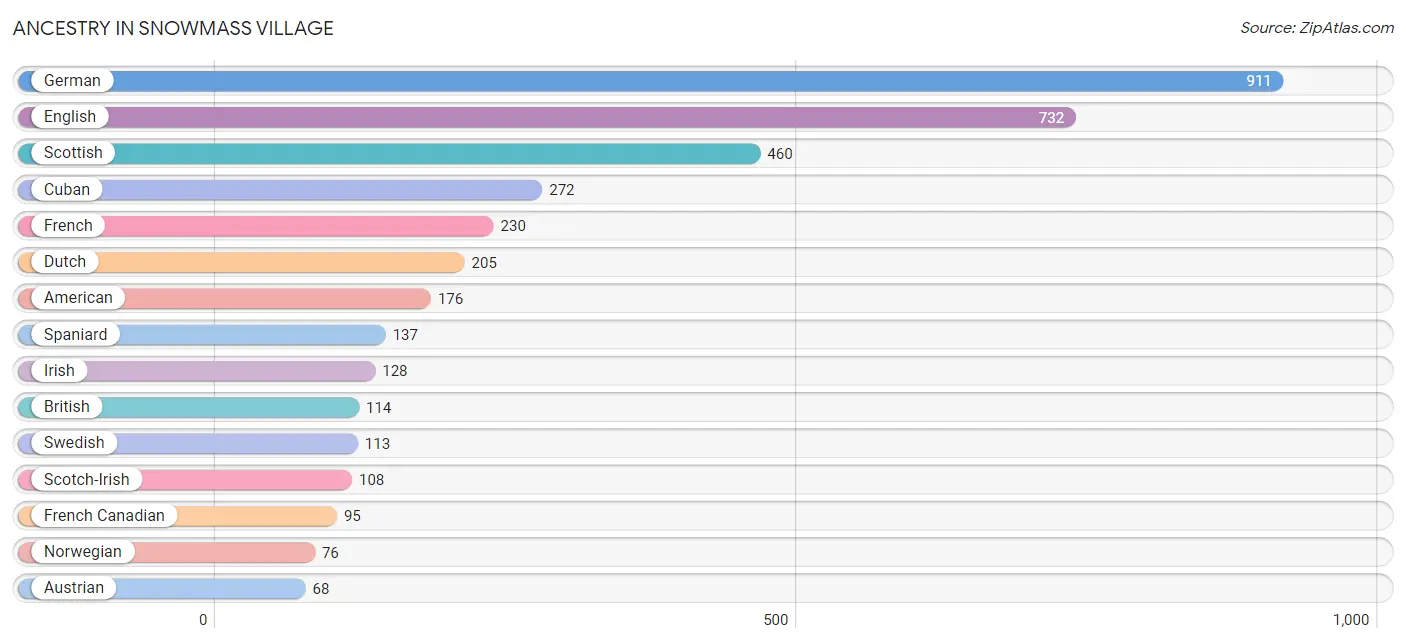
| Ancestry | # Population | % Population |
| American | 176 | 5.7% |
| Austrian | 68 | 2.2% |
| Brazilian | 65 | 2.1% |
| British | 114 | 3.7% |
| Cuban | 272 | 8.8% |
| Czech | 7 | 0.2% |
| Danish | 49 | 1.6% |
| Dutch | 205 | 6.7% |
| Eastern European | 9 | 0.3% |
| English | 732 | 23.8% |
| French | 230 | 7.5% |
| French Canadian | 95 | 3.1% |
| German | 911 | 29.6% |
| Greek | 9 | 0.3% |
| Irish | 128 | 4.2% |
| Norwegian | 76 | 2.5% |
| Scandinavian | 65 | 2.1% |
| Scotch-Irish | 108 | 3.5% |
| Scottish | 460 | 14.9% |
| Spaniard | 137 | 4.4% |
| Swedish | 113 | 3.7% | View All 21 Rows |
Immigrants in Snowmass Village
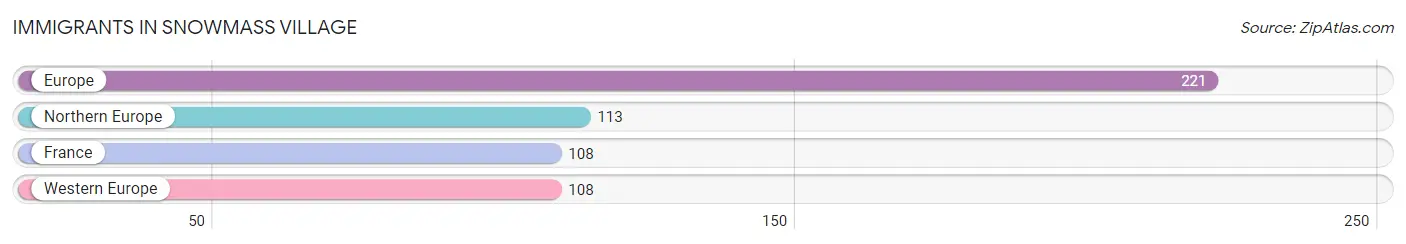
The most numerous immigrant groups reported in Snowmass Village came from Europe (221 | 7.2%), Northern Europe (113 | 3.7%), France (108 | 3.5%), and Western Europe (108 | 3.5%), together accounting for 17.9% of all Snowmass Village residents.
| Immigration Origin | # Population | % Population |
| Europe | 221 | 7.2% |
| France | 108 | 3.5% |
| Northern Europe | 113 | 3.7% |
| Western Europe | 108 | 3.5% | View All 4 Rows |
Sex and Age in Snowmass Village
Sex and Age in Snowmass Village
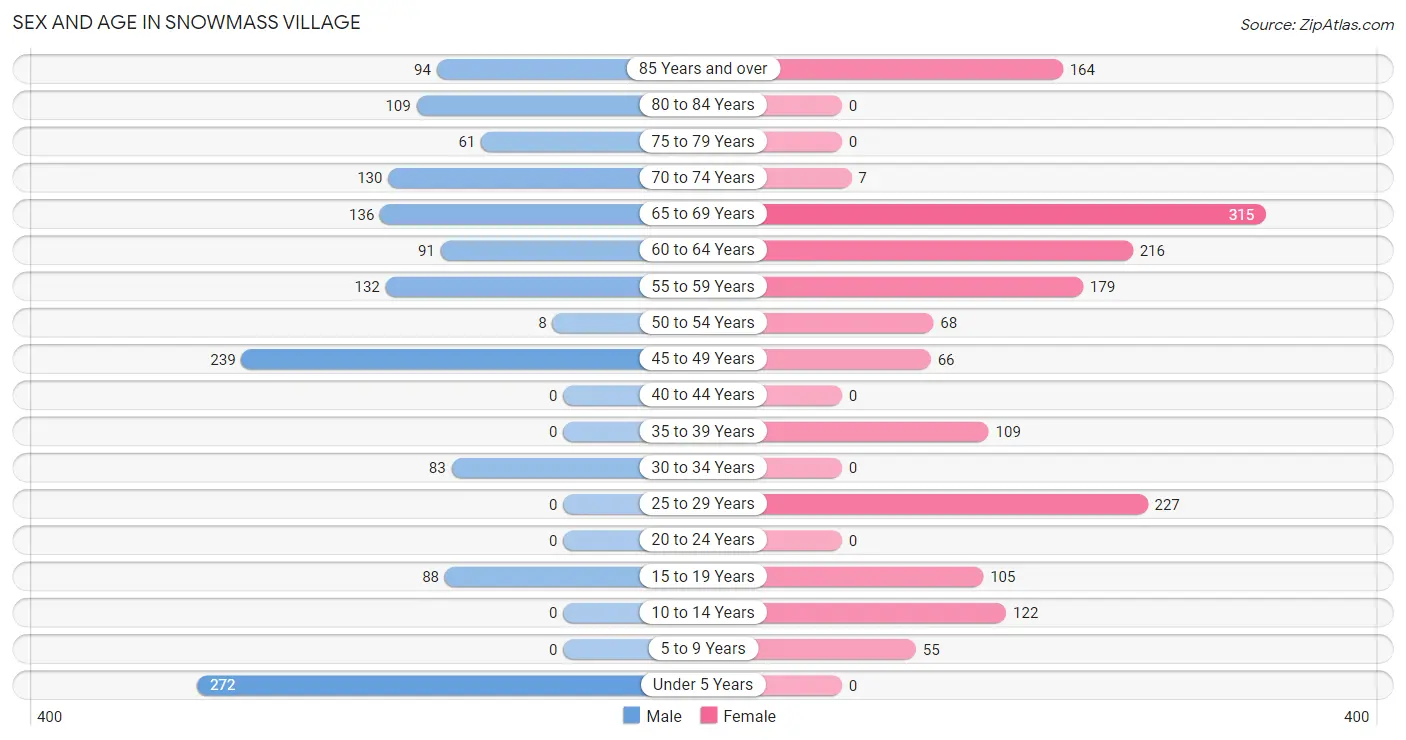
The most populous age groups in Snowmass Village are Under 5 Years (272 | 18.9%) for men and 65 to 69 Years (315 | 19.3%) for women.
| Age Bracket | Male | Female |
| Under 5 Years | 272 (18.9%) | 0 (0.0%) |
| 5 to 9 Years | 0 (0.0%) | 55 (3.4%) |
| 10 to 14 Years | 0 (0.0%) | 122 (7.5%) |
| 15 to 19 Years | 88 (6.1%) | 105 (6.4%) |
| 20 to 24 Years | 0 (0.0%) | 0 (0.0%) |
| 25 to 29 Years | 0 (0.0%) | 227 (13.9%) |
| 30 to 34 Years | 83 (5.8%) | 0 (0.0%) |
| 35 to 39 Years | 0 (0.0%) | 109 (6.7%) |
| 40 to 44 Years | 0 (0.0%) | 0 (0.0%) |
| 45 to 49 Years | 239 (16.6%) | 66 (4.0%) |
| 50 to 54 Years | 8 (0.5%) | 68 (4.2%) |
| 55 to 59 Years | 132 (9.1%) | 179 (11.0%) |
| 60 to 64 Years | 91 (6.3%) | 216 (13.2%) |
| 65 to 69 Years | 136 (9.4%) | 315 (19.3%) |
| 70 to 74 Years | 130 (9.0%) | 7 (0.4%) |
| 75 to 79 Years | 61 (4.2%) | 0 (0.0%) |
| 80 to 84 Years | 109 (7.5%) | 0 (0.0%) |
| 85 Years and over | 94 (6.5%) | 164 (10.0%) |
| Total | 1,443 (100.0%) | 1,633 (100.0%) |
Families and Households in Snowmass Village
Median Family Size in Snowmass Village
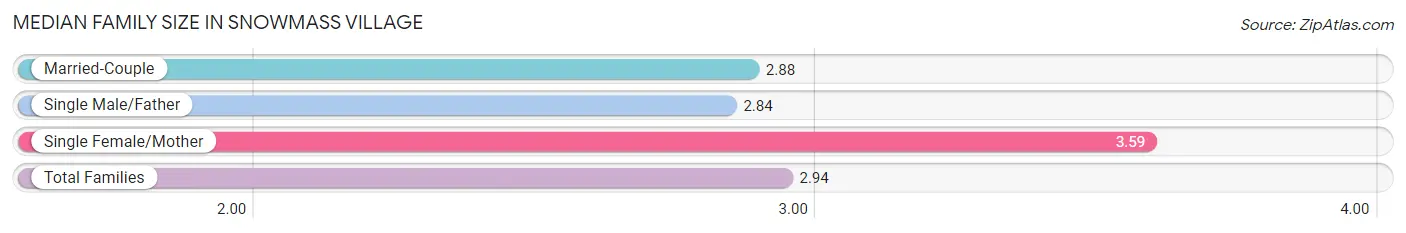
The median family size in Snowmass Village is 2.94 persons per family, with single female/mother families (68 | 9.4%) accounting for the largest median family size of 3.59 persons per family. On the other hand, single male/father families (45 | 6.2%) represent the smallest median family size with 2.84 persons per family.
| Family Type | # Families | Family Size |
| Married-Couple | 608 (84.3%) | 2.88 |
| Single Male/Father | 45 (6.2%) | 2.84 |
| Single Female/Mother | 68 (9.4%) | 3.59 |
| Total Families | 721 (100.0%) | 2.94 |
Median Household Size in Snowmass Village
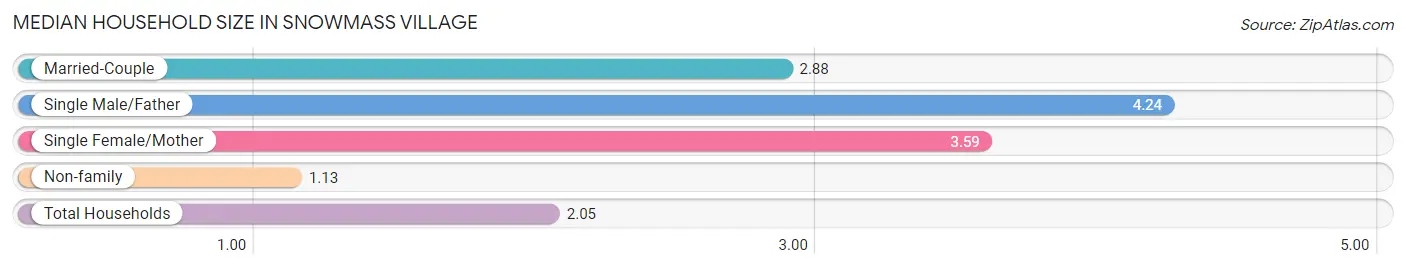
The median household size in Snowmass Village is 2.05 persons per household, with single male/father households (45 | 3.0%) accounting for the largest median household size of 4.24 persons per household. non-family households (771 | 51.7%) represent the smallest median household size with 1.13 persons per household.
| Household Type | # Households | Household Size |
| Married-Couple | 608 (40.7%) | 2.88 |
| Single Male/Father | 45 (3.0%) | 4.24 |
| Single Female/Mother | 68 (4.6%) | 3.59 |
| Non-family | 771 (51.7%) | 1.13 |
| Total Households | 1,492 (100.0%) | 2.05 |
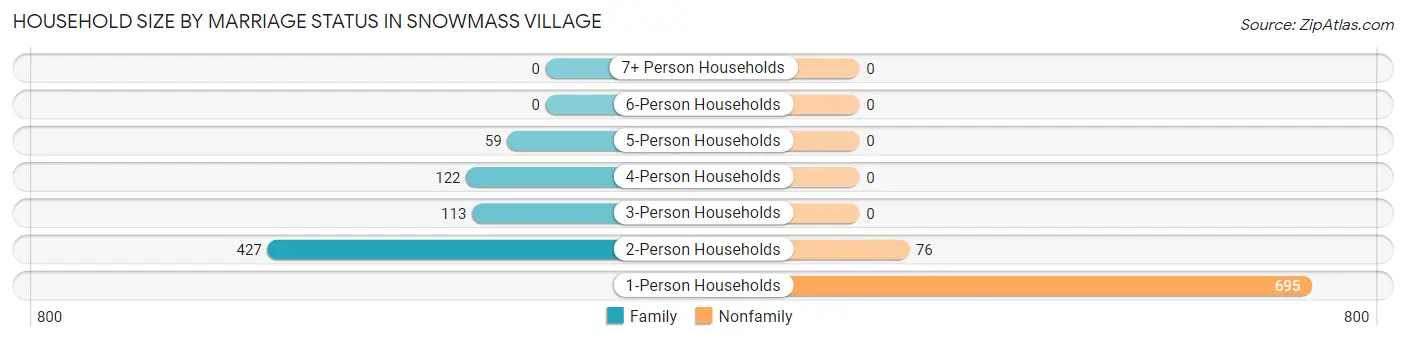
Household Size by Marriage Status in Snowmass Village
Out of a total of 1,492 households in Snowmass Village, 721 (48.3%) are family households, while 771 (51.7%) are nonfamily households. The most numerous type of family households are 2-person households, comprising 427, and the most common type of nonfamily households are 1-person households, comprising 695.
| Household Size | Family Households | Nonfamily Households |
| 1-Person Households | - | 695 (46.6%) |
| 2-Person Households | 427 (28.6%) | 76 (5.1%) |
| 3-Person Households | 113 (7.6%) | 0 (0.0%) |
| 4-Person Households | 122 (8.2%) | 0 (0.0%) |
| 5-Person Households | 59 (4.0%) | 0 (0.0%) |
| 6-Person Households | 0 (0.0%) | 0 (0.0%) |
| 7+ Person Households | 0 (0.0%) | 0 (0.0%) |
| Total | 721 (48.3%) | 771 (51.7%) |
Female Fertility in Snowmass Village
Fertility by Age in Snowmass Village
| Age Bracket | Women with Births | Births / 1,000 Women |
| 15 to 19 years | 0 (0.0%) | 0.0 |
| 20 to 34 years | 0 (0.0%) | 0.0 |
| 35 to 50 years | 0 (0.0%) | 0.0 |
| Total | 0 (0.0%) | 0.0 |
Fertility by Age by Marriage Status in Snowmass Village
| Age Bracket | Married | Unmarried |
| 15 to 19 years | 0 (0.0%) | 0 (0.0%) |
| 20 to 34 years | 0 (0.0%) | 0 (0.0%) |
| 35 to 50 years | 0 (0.0%) | 0 (0.0%) |
| Total | 0 (0.0%) | 0 (0.0%) |
Fertility by Education in Snowmass Village
| Educational Attainment | Women with Births | Births / 1,000 Women |
| Less than High School | 0 (0.0%) | 0.0 |
| High School Diploma | 0 (0.0%) | 0.0 |
| College or Associate's Degree | 0 (0.0%) | 0.0 |
| Bachelor's Degree | 0 (0.0%) | 0.0 |
| Graduate Degree | 0 (0.0%) | 0.0 |
| Total | 0 (0.0%) | 0.0 |
Fertility by Education by Marriage Status in Snowmass Village
| Educational Attainment | Married | Unmarried |
| Less than High School | 0 (0.0%) | 0 (0.0%) |
| High School Diploma | 0 (0.0%) | 0 (0.0%) |
| College or Associate's Degree | 0 (0.0%) | 0 (0.0%) |
| Bachelor's Degree | 0 (0.0%) | 0 (0.0%) |
| Graduate Degree | 0 (0.0%) | 0 (0.0%) |
| Total | 0 (0.0%) | 0 (0.0%) |
Employment Characteristics in Snowmass Village
Employment by Class of Employer in Snowmass Village
Among the 1,661 employed individuals in Snowmass Village, private company employees (840 | 50.6%), self-employed (incorporated) (353 | 21.2%), and self-employed (not incorporated) (209 | 12.6%) make up the most common classes of employment.
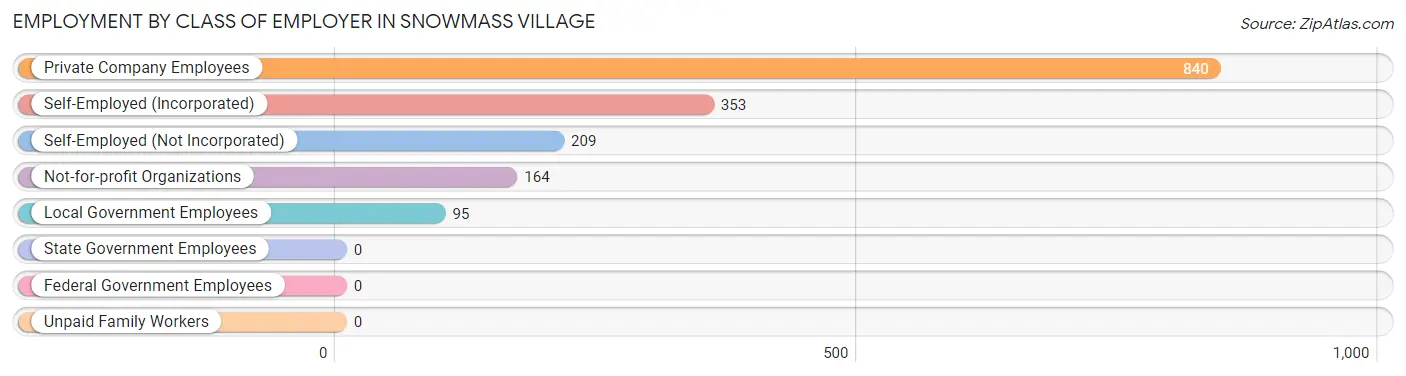
| Employer Class | # Employees | % Employees |
| Private Company Employees | 840 | 50.6% |
| Self-Employed (Incorporated) | 353 | 21.2% |
| Self-Employed (Not Incorporated) | 209 | 12.6% |
| Not-for-profit Organizations | 164 | 9.9% |
| Local Government Employees | 95 | 5.7% |
| State Government Employees | 0 | 0.0% |
| Federal Government Employees | 0 | 0.0% |
| Unpaid Family Workers | 0 | 0.0% |
| Total | 1,661 | 100.0% |
Employment Status by Age in Snowmass Village
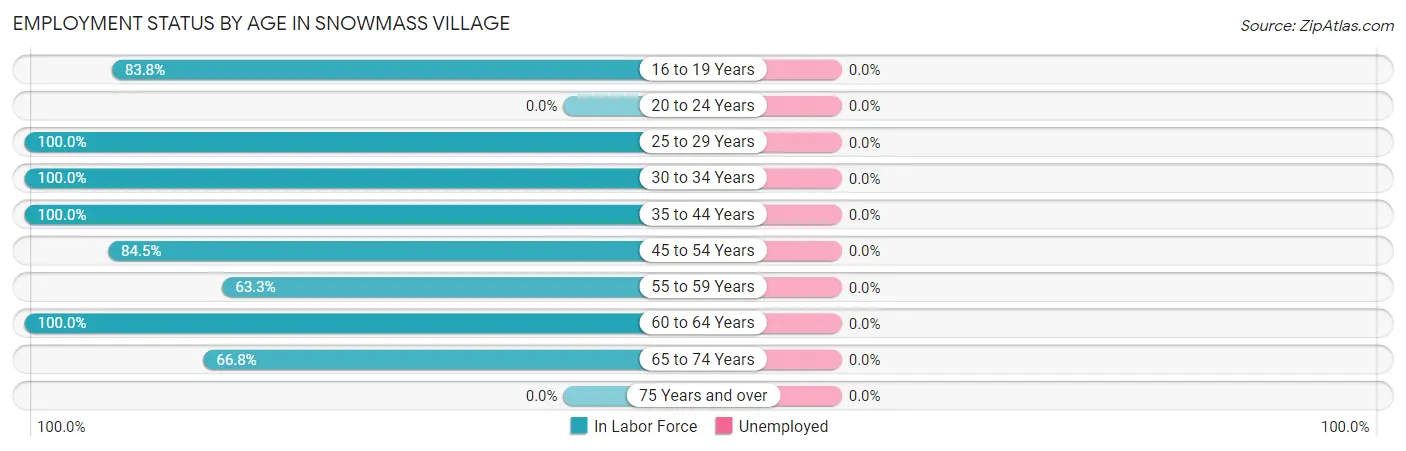
| Age Bracket | In Labor Force | Unemployed |
| 16 to 19 Years | 88 (83.8%) | 0 (0.0%) |
| 20 to 24 Years | 0 (0.0%) | 0 (0.0%) |
| 25 to 29 Years | 227 (100.0%) | 0 (0.0%) |
| 30 to 34 Years | 83 (100.0%) | 0 (0.0%) |
| 35 to 44 Years | 109 (100.0%) | 0 (0.0%) |
| 45 to 54 Years | 322 (84.5%) | 0 (0.0%) |
| 55 to 59 Years | 197 (63.3%) | 0 (0.0%) |
| 60 to 64 Years | 307 (100.0%) | 0 (0.0%) |
| 65 to 74 Years | 393 (66.8%) | 0 (0.0%) |
| 75 Years and over | 0 (0.0%) | 0 (0.0%) |
| Total | 1,727 (68.0%) | 0 (0.0%) |
Employment Status by Educational Attainment in Snowmass Village
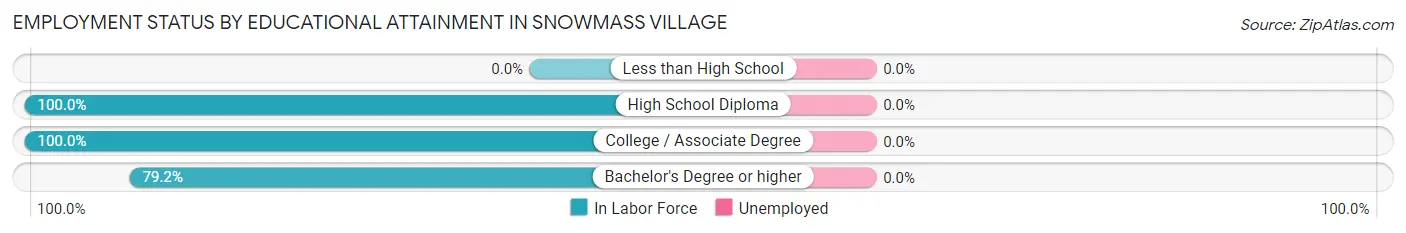
| Educational Attainment | In Labor Force | Unemployed |
| Less than High School | 0 (0.0%) | 0 (0.0%) |
| High School Diploma | 330 (100.0%) | 0 (0.0%) |
| College / Associate Degree | 255 (100.0%) | 0 (0.0%) |
| Bachelor's Degree or higher | 660 (79.2%) | 0 (0.0%) |
| Total | 1,245 (87.8%) | 0 (0.0%) |
Employment Occupations by Sex in Snowmass Village
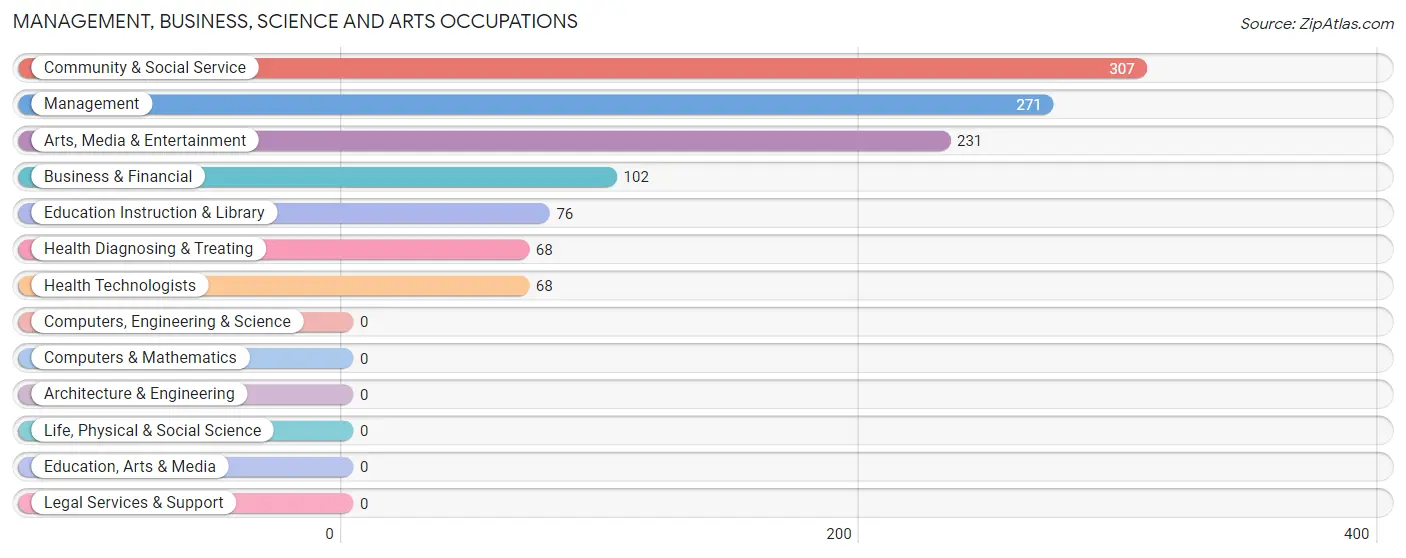
Management, Business, Science and Arts Occupations
The most common Management, Business, Science and Arts occupations in Snowmass Village are Community & Social Service (307 | 17.8%), Management (271 | 15.7%), Arts, Media & Entertainment (231 | 13.4%), Business & Financial (102 | 5.9%), and Education Instruction & Library (76 | 4.4%).
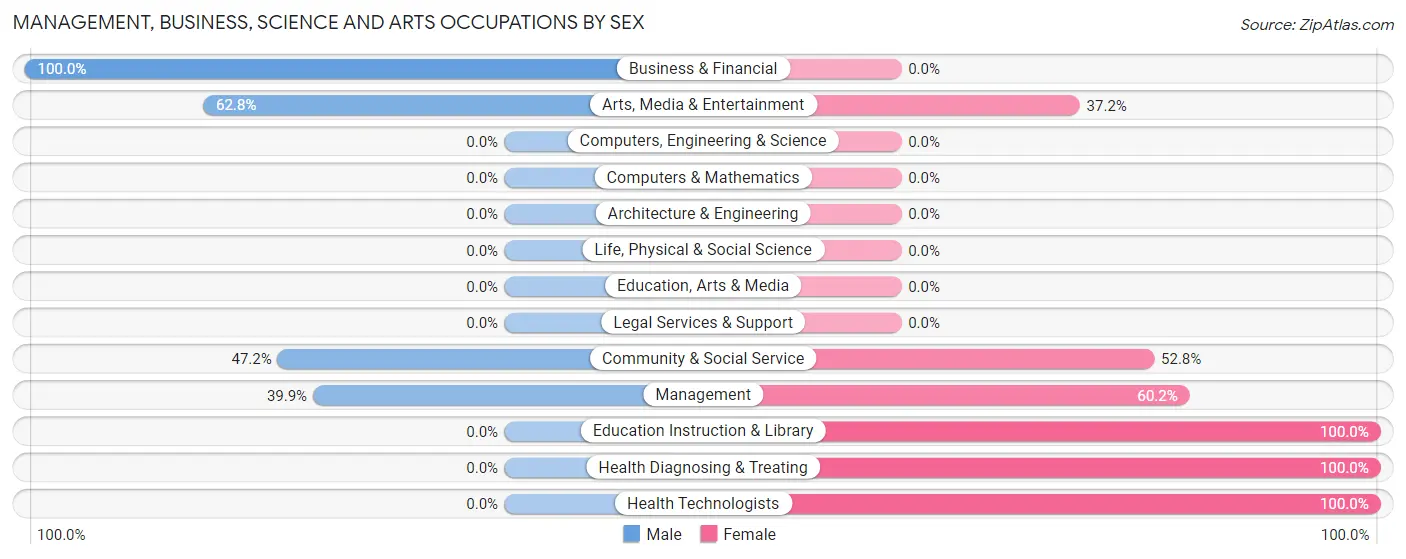
Management, Business, Science and Arts Occupations by Sex
Within the Management, Business, Science and Arts occupations in Snowmass Village, the most male-oriented occupations are Business & Financial (100.0%), Arts, Media & Entertainment (62.8%), and Community & Social Service (47.2%), while the most female-oriented occupations are Education Instruction & Library (100.0%), Health Diagnosing & Treating (100.0%), and Health Technologists (100.0%).
| Occupation | Male | Female |
| Management | 108 (39.9%) | 163 (60.2%) |
| Business & Financial | 102 (100.0%) | 0 (0.0%) |
| Computers, Engineering & Science | 0 (0.0%) | 0 (0.0%) |
| Computers & Mathematics | 0 (0.0%) | 0 (0.0%) |
| Architecture & Engineering | 0 (0.0%) | 0 (0.0%) |
| Life, Physical & Social Science | 0 (0.0%) | 0 (0.0%) |
| Community & Social Service | 145 (47.2%) | 162 (52.8%) |
| Education, Arts & Media | 0 (0.0%) | 0 (0.0%) |
| Legal Services & Support | 0 (0.0%) | 0 (0.0%) |
| Education Instruction & Library | 0 (0.0%) | 76 (100.0%) |
| Arts, Media & Entertainment | 145 (62.8%) | 86 (37.2%) |
| Health Diagnosing & Treating | 0 (0.0%) | 68 (100.0%) |
| Health Technologists | 0 (0.0%) | 68 (100.0%) |
| Total (Category) | 355 (47.5%) | 393 (52.5%) |
| Total (Overall) | 777 (45.0%) | 949 (55.0%) |
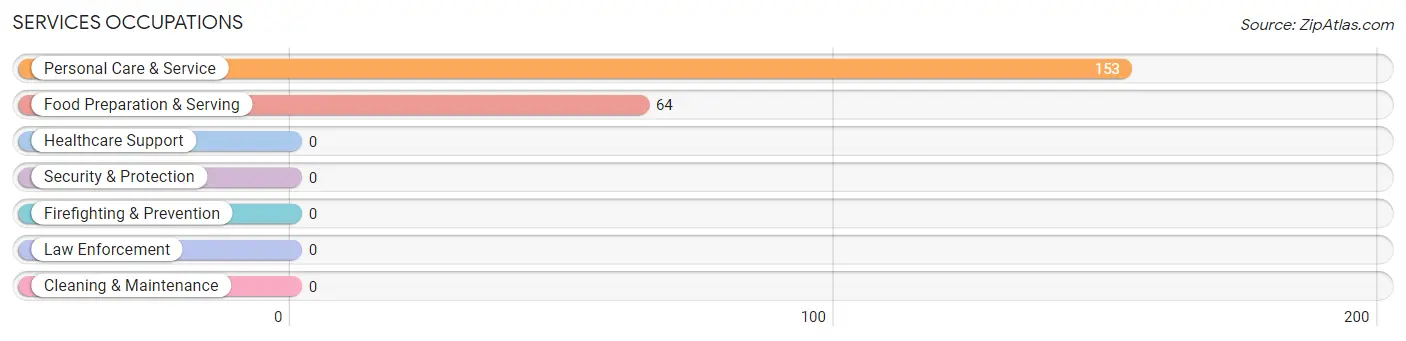
Services Occupations
The most common Services occupations in Snowmass Village are Personal Care & Service (153 | 8.9%), and Food Preparation & Serving (64 | 3.7%).
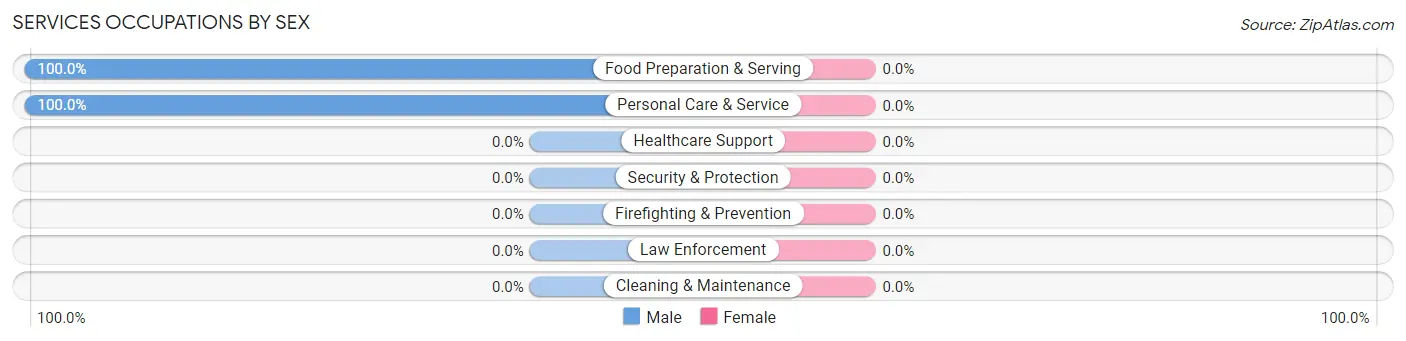
Services Occupations by Sex
| Occupation | Male | Female |
| Healthcare Support | 0 (0.0%) | 0 (0.0%) |
| Security & Protection | 0 (0.0%) | 0 (0.0%) |
| Firefighting & Prevention | 0 (0.0%) | 0 (0.0%) |
| Law Enforcement | 0 (0.0%) | 0 (0.0%) |
| Food Preparation & Serving | 64 (100.0%) | 0 (0.0%) |
| Cleaning & Maintenance | 0 (0.0%) | 0 (0.0%) |
| Personal Care & Service | 153 (100.0%) | 0 (0.0%) |
| Total (Category) | 217 (100.0%) | 0 (0.0%) |
| Total (Overall) | 777 (45.0%) | 949 (55.0%) |
Sales and Office Occupations
The most common Sales and Office occupations in Snowmass Village are Sales & Related (303 | 17.6%), and Office & Administration (128 | 7.4%).
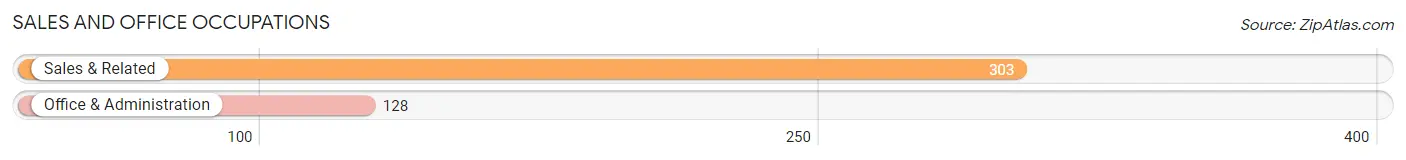
Sales and Office Occupations by Sex
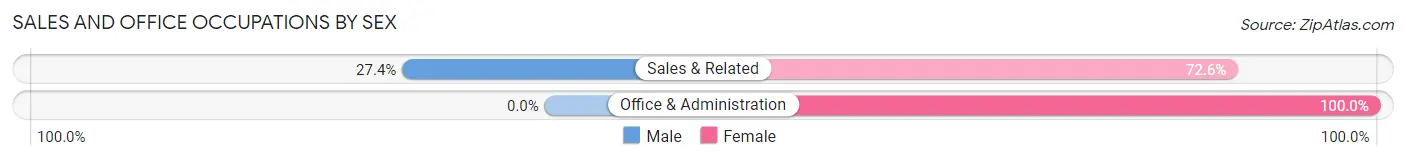
| Occupation | Male | Female |
| Sales & Related | 83 (27.4%) | 220 (72.6%) |
| Office & Administration | 0 (0.0%) | 128 (100.0%) |
| Total (Category) | 83 (19.3%) | 348 (80.7%) |
| Total (Overall) | 777 (45.0%) | 949 (55.0%) |
Natural Resources, Construction and Maintenance Occupations
The most common Natural Resources, Construction and Maintenance occupations in Snowmass Village are , and Construction & Extraction (122 | 7.1%).
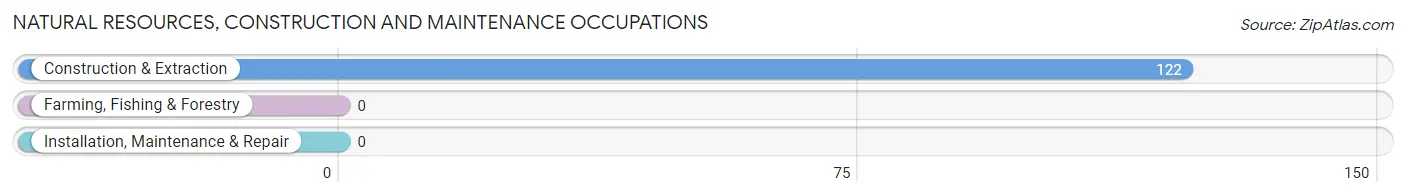
Natural Resources, Construction and Maintenance Occupations by Sex
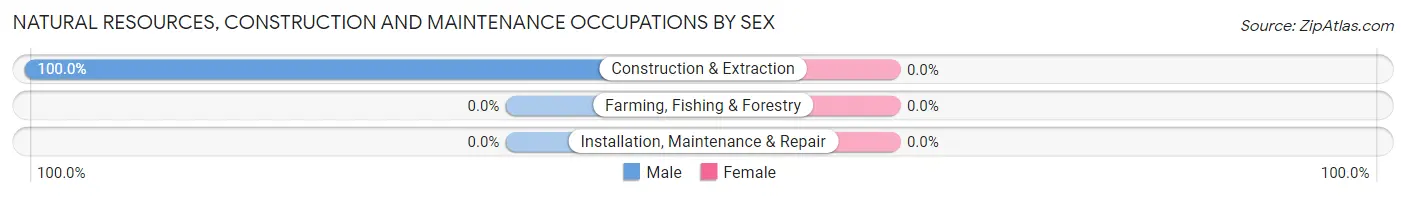
| Occupation | Male | Female |
| Farming, Fishing & Forestry | 0 (0.0%) | 0 (0.0%) |
| Construction & Extraction | 122 (100.0%) | 0 (0.0%) |
| Installation, Maintenance & Repair | 0 (0.0%) | 0 (0.0%) |
| Total (Category) | 122 (100.0%) | 0 (0.0%) |
| Total (Overall) | 777 (45.0%) | 949 (55.0%) |
Production, Transportation and Moving Occupations
The most common Production, Transportation and Moving occupations in Snowmass Village are Production (113 | 6.6%), and Transportation (95 | 5.5%).
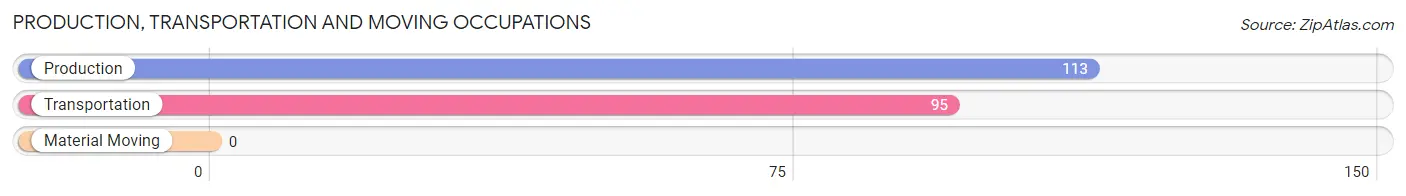
Production, Transportation and Moving Occupations by Sex
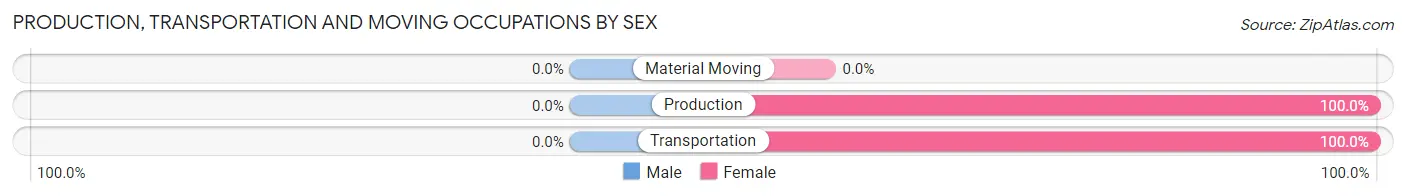
| Occupation | Male | Female |
| Production | 0 (0.0%) | 113 (100.0%) |
| Transportation | 0 (0.0%) | 95 (100.0%) |
| Material Moving | 0 (0.0%) | 0 (0.0%) |
| Total (Category) | 0 (0.0%) | 208 (100.0%) |
| Total (Overall) | 777 (45.0%) | 949 (55.0%) |
Employment Industries by Sex in Snowmass Village
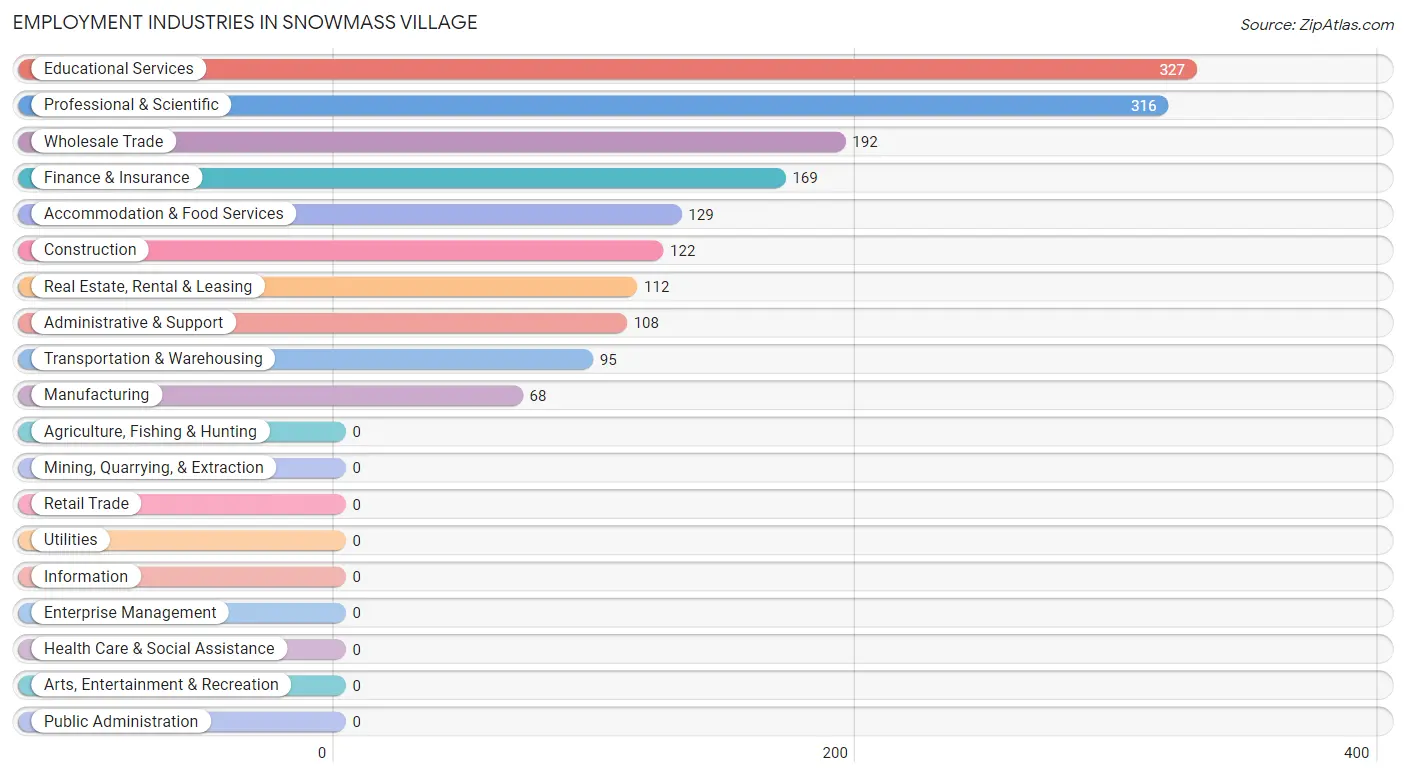
Employment Industries in Snowmass Village
The major employment industries in Snowmass Village include Educational Services (327 | 19.0%), Professional & Scientific (316 | 18.3%), Wholesale Trade (192 | 11.1%), Finance & Insurance (169 | 9.8%), and Accommodation & Food Services (129 | 7.5%).
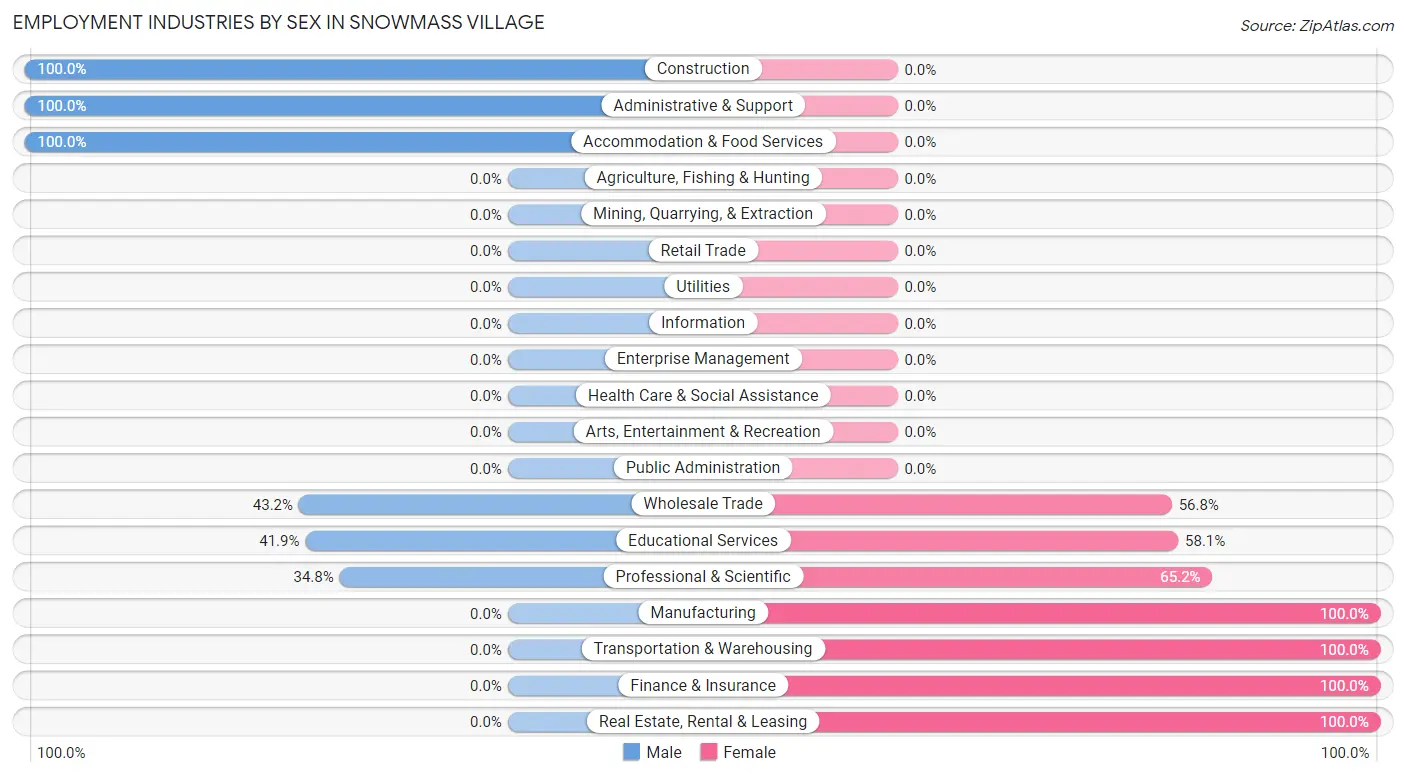
Employment Industries by Sex in Snowmass Village
The Snowmass Village industries that see more men than women are Construction (100.0%), Administrative & Support (100.0%), and Accommodation & Food Services (100.0%), whereas the industries that tend to have a higher number of women are Manufacturing (100.0%), Transportation & Warehousing (100.0%), and Finance & Insurance (100.0%).
| Industry | Male | Female |
| Agriculture, Fishing & Hunting | 0 (0.0%) | 0 (0.0%) |
| Mining, Quarrying, & Extraction | 0 (0.0%) | 0 (0.0%) |
| Construction | 122 (100.0%) | 0 (0.0%) |
| Manufacturing | 0 (0.0%) | 68 (100.0%) |
| Wholesale Trade | 83 (43.2%) | 109 (56.8%) |
| Retail Trade | 0 (0.0%) | 0 (0.0%) |
| Transportation & Warehousing | 0 (0.0%) | 95 (100.0%) |
| Utilities | 0 (0.0%) | 0 (0.0%) |
| Information | 0 (0.0%) | 0 (0.0%) |
| Finance & Insurance | 0 (0.0%) | 169 (100.0%) |
| Real Estate, Rental & Leasing | 0 (0.0%) | 112 (100.0%) |
| Professional & Scientific | 110 (34.8%) | 206 (65.2%) |
| Enterprise Management | 0 (0.0%) | 0 (0.0%) |
| Administrative & Support | 108 (100.0%) | 0 (0.0%) |
| Educational Services | 137 (41.9%) | 190 (58.1%) |
| Health Care & Social Assistance | 0 (0.0%) | 0 (0.0%) |
| Arts, Entertainment & Recreation | 0 (0.0%) | 0 (0.0%) |
| Accommodation & Food Services | 129 (100.0%) | 0 (0.0%) |
| Public Administration | 0 (0.0%) | 0 (0.0%) |
| Total | 777 (45.0%) | 949 (55.0%) |
Education in Snowmass Village
School Enrollment in Snowmass Village
The most common levels of schooling among the 489 students in Snowmass Village are high school (182 | 37.2%), nursery / preschool (136 | 27.8%), and middle school (116 | 23.7%).
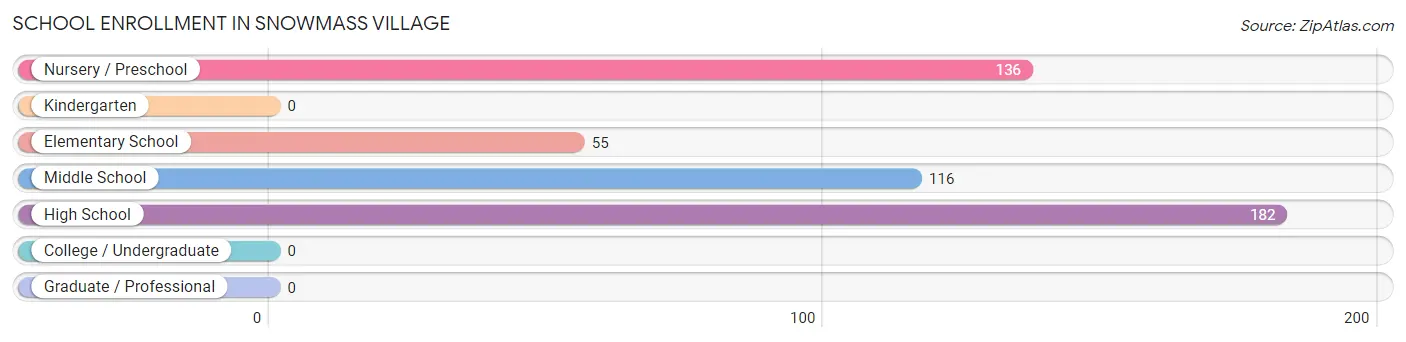
| School Level | # Students | % Students |
| Nursery / Preschool | 136 | 27.8% |
| Kindergarten | 0 | 0.0% |
| Elementary School | 55 | 11.3% |
| Middle School | 116 | 23.7% |
| High School | 182 | 37.2% |
| College / Undergraduate | 0 | 0.0% |
| Graduate / Professional | 0 | 0.0% |
| Total | 489 | 100.0% |
School Enrollment by Age by Funding Source in Snowmass Village
Out of a total of 489 students who are enrolled in schools in Snowmass Village, 165 (33.7%) attend a private institution, while the remaining 324 (66.3%) are enrolled in public schools. The age group of 5 to 9 year old has the highest likelihood of being enrolled in private schools, with 55 (100.0% in the age bracket) enrolled. Conversely, the age group of 3 to 4 year olds has the lowest likelihood of being enrolled in a private school, with 136 (100.0% in the age bracket) attending a public institution.
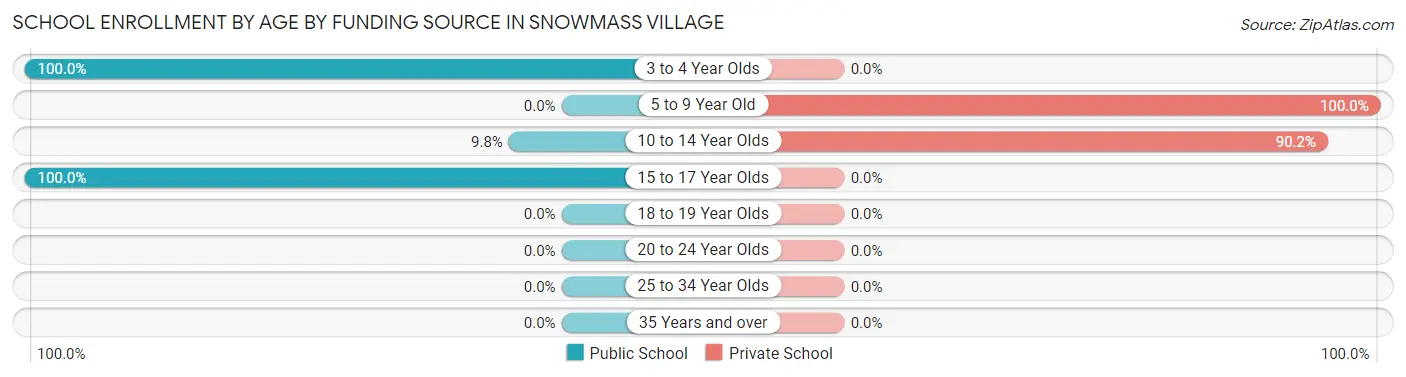
| Age Bracket | Public School | Private School |
| 3 to 4 Year Olds | 136 (100.0%) | 0 (0.0%) |
| 5 to 9 Year Old | 0 (0.0%) | 55 (100.0%) |
| 10 to 14 Year Olds | 12 (9.8%) | 110 (90.2%) |
| 15 to 17 Year Olds | 176 (100.0%) | 0 (0.0%) |
| 18 to 19 Year Olds | 0 (0.0%) | 0 (0.0%) |
| 20 to 24 Year Olds | 0 (0.0%) | 0 (0.0%) |
| 25 to 34 Year Olds | 0 (0.0%) | 0 (0.0%) |
| 35 Years and over | 0 (0.0%) | 0 (0.0%) |
| Total | 324 (66.3%) | 165 (33.7%) |
Educational Attainment by Field of Study in Snowmass Village
Bio, nature & agricultural (317 | 17.6%), business (247 | 13.7%), social sciences (231 | 12.8%), arts & humanities (223 | 12.4%), and engineering (203 | 11.3%) are the most common fields of study among 1,799 individuals in Snowmass Village who have obtained a bachelor's degree or higher.
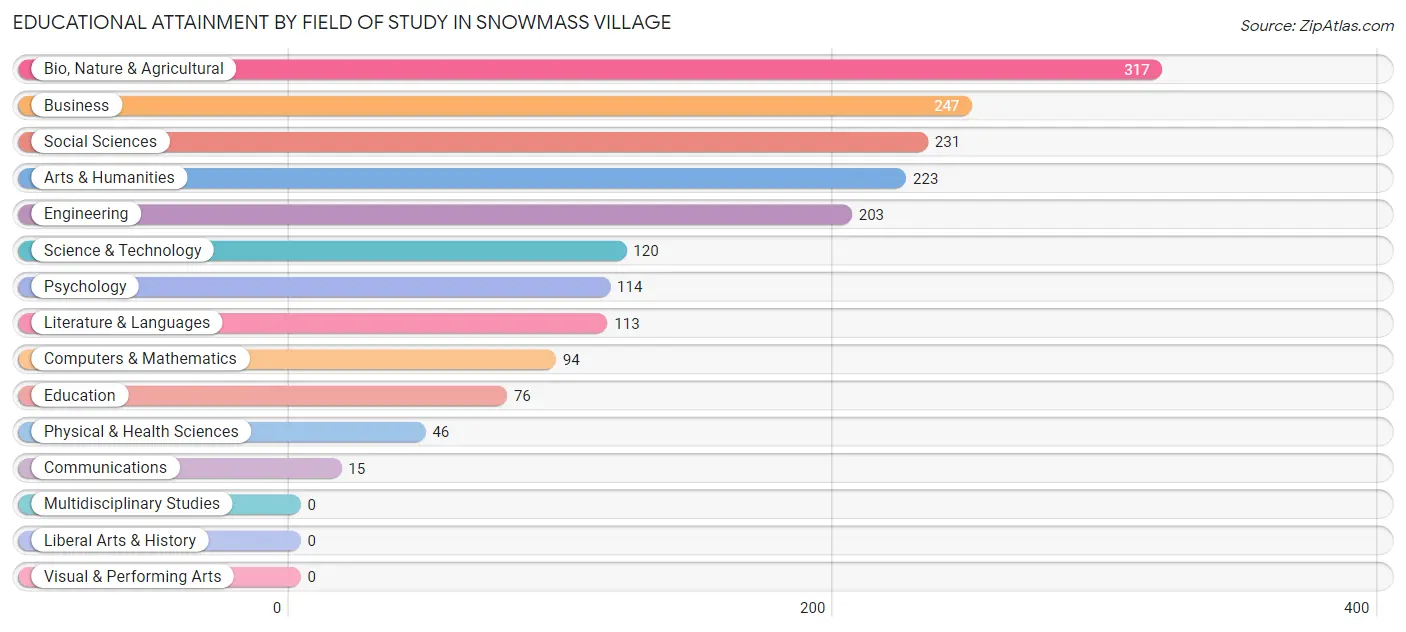
| Field of Study | # Graduates | % Graduates |
| Computers & Mathematics | 94 | 5.2% |
| Bio, Nature & Agricultural | 317 | 17.6% |
| Physical & Health Sciences | 46 | 2.6% |
| Psychology | 114 | 6.3% |
| Social Sciences | 231 | 12.8% |
| Engineering | 203 | 11.3% |
| Multidisciplinary Studies | 0 | 0.0% |
| Science & Technology | 120 | 6.7% |
| Business | 247 | 13.7% |
| Education | 76 | 4.2% |
| Literature & Languages | 113 | 6.3% |
| Liberal Arts & History | 0 | 0.0% |
| Visual & Performing Arts | 0 | 0.0% |
| Communications | 15 | 0.8% |
| Arts & Humanities | 223 | 12.4% |
| Total | 1,799 | 100.0% |
Transportation & Commute in Snowmass Village
Vehicle Availability by Sex in Snowmass Village
The most prevalent vehicle ownership categories in Snowmass Village are males with 2 vehicles (517, accounting for 72.6%) and females with 2 vehicles (798, making up 54.5%).
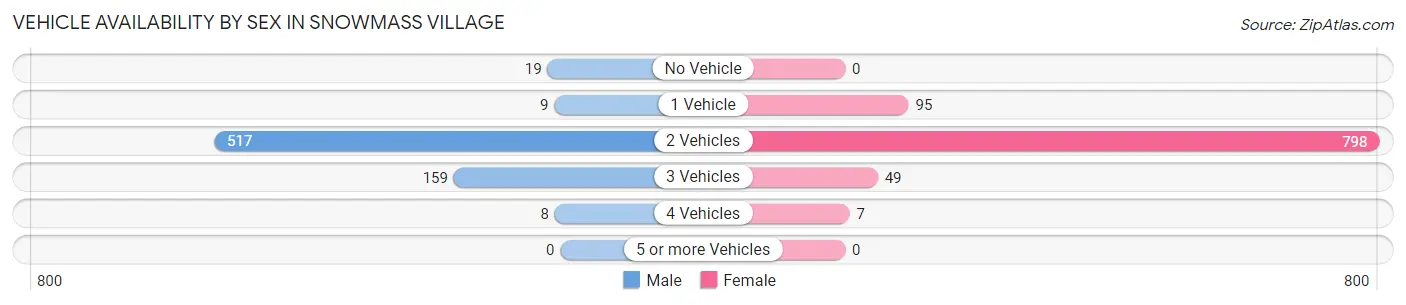
| Vehicles Available | Male | Female |
| No Vehicle | 19 (2.7%) | 0 (0.0%) |
| 1 Vehicle | 9 (1.3%) | 95 (10.0%) |
| 2 Vehicles | 517 (72.6%) | 798 (84.1%) |
| 3 Vehicles | 159 (22.3%) | 49 (5.2%) |
| 4 Vehicles | 8 (1.1%) | 7 (0.7%) |
| 5 or more Vehicles | 0 (0.0%) | 0 (0.0%) |
| Total | 712 (100.0%) | 949 (100.0%) |
Commute Time in Snowmass Village
The most frequently occuring commute durations in Snowmass Village are 10 to 14 minutes (190 commuters, 14.7%), less than 5 minutes (180 commuters, 14.0%), and 30 to 34 minutes (176 commuters, 13.7%).
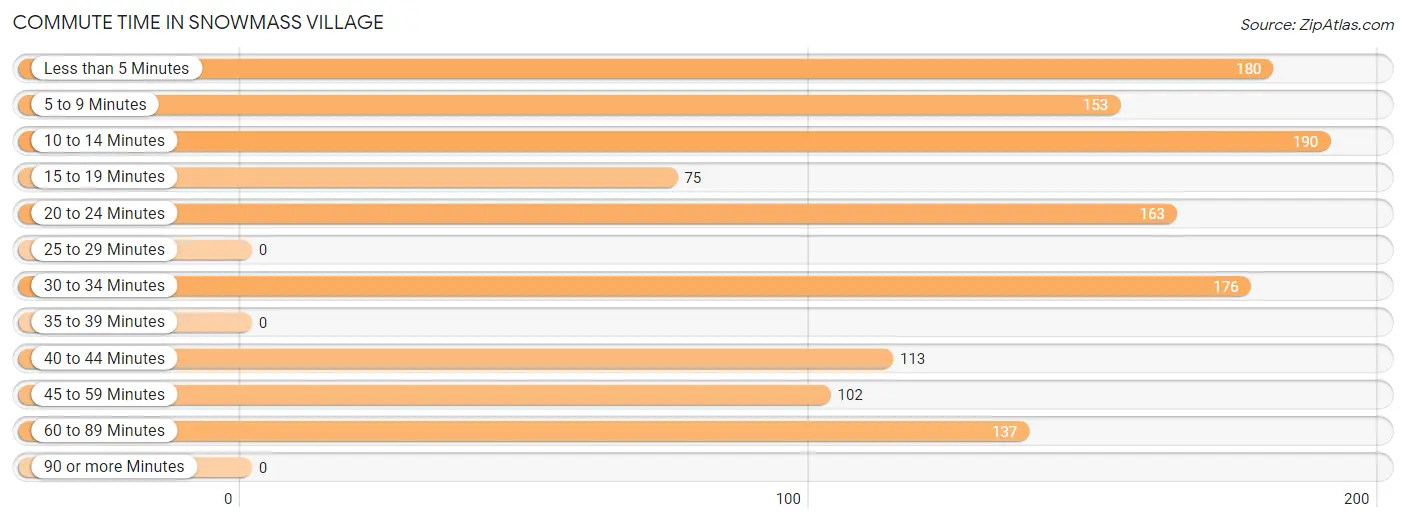
| Commute Time | # Commuters | % Commuters |
| Less than 5 Minutes | 180 | 14.0% |
| 5 to 9 Minutes | 153 | 11.9% |
| 10 to 14 Minutes | 190 | 14.7% |
| 15 to 19 Minutes | 75 | 5.8% |
| 20 to 24 Minutes | 163 | 12.7% |
| 25 to 29 Minutes | 0 | 0.0% |
| 30 to 34 Minutes | 176 | 13.7% |
| 35 to 39 Minutes | 0 | 0.0% |
| 40 to 44 Minutes | 113 | 8.8% |
| 45 to 59 Minutes | 102 | 7.9% |
| 60 to 89 Minutes | 137 | 10.6% |
| 90 or more Minutes | 0 | 0.0% |
Commute Time by Sex in Snowmass Village
The most common commute times in Snowmass Village are 60 to 89 minutes (137 commuters, 25.4%) for males and less than 5 minutes (180 commuters, 24.0%) for females.
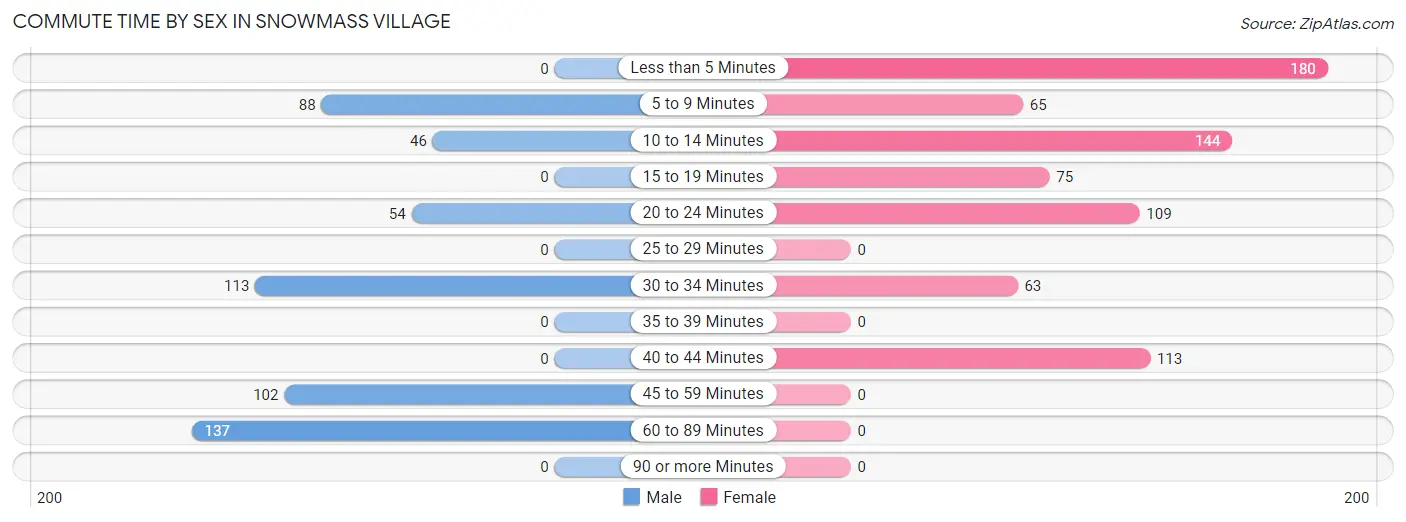
| Commute Time | Male | Female |
| Less than 5 Minutes | 0 (0.0%) | 180 (24.0%) |
| 5 to 9 Minutes | 88 (16.3%) | 65 (8.7%) |
| 10 to 14 Minutes | 46 (8.5%) | 144 (19.2%) |
| 15 to 19 Minutes | 0 (0.0%) | 75 (10.0%) |
| 20 to 24 Minutes | 54 (10.0%) | 109 (14.5%) |
| 25 to 29 Minutes | 0 (0.0%) | 0 (0.0%) |
| 30 to 34 Minutes | 113 (20.9%) | 63 (8.4%) |
| 35 to 39 Minutes | 0 (0.0%) | 0 (0.0%) |
| 40 to 44 Minutes | 0 (0.0%) | 113 (15.1%) |
| 45 to 59 Minutes | 102 (18.9%) | 0 (0.0%) |
| 60 to 89 Minutes | 137 (25.4%) | 0 (0.0%) |
| 90 or more Minutes | 0 (0.0%) | 0 (0.0%) |
Time of Departure to Work by Sex in Snowmass Village
The most frequent times of departure to work in Snowmass Village are 8:00 AM to 8:29 AM (433, 80.2%) for males and 9:00 AM to 9:59 AM (229, 30.6%) for females.
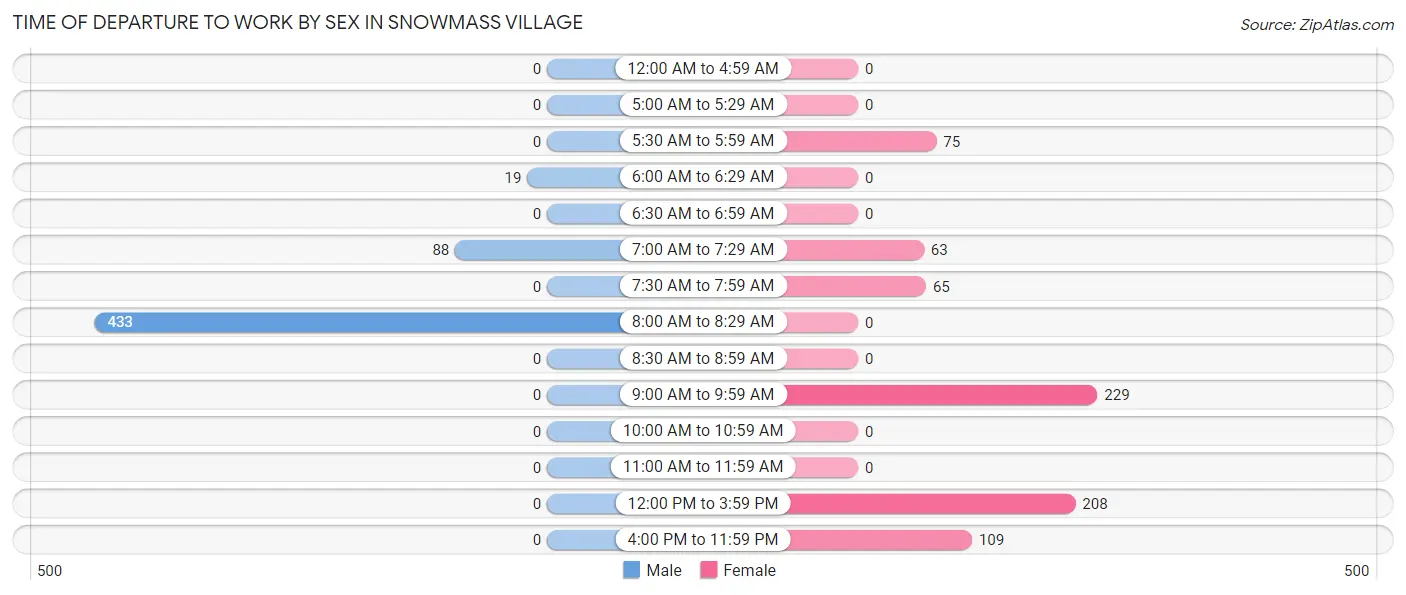
| Time of Departure | Male | Female |
| 12:00 AM to 4:59 AM | 0 (0.0%) | 0 (0.0%) |
| 5:00 AM to 5:29 AM | 0 (0.0%) | 0 (0.0%) |
| 5:30 AM to 5:59 AM | 0 (0.0%) | 75 (10.0%) |
| 6:00 AM to 6:29 AM | 19 (3.5%) | 0 (0.0%) |
| 6:30 AM to 6:59 AM | 0 (0.0%) | 0 (0.0%) |
| 7:00 AM to 7:29 AM | 88 (16.3%) | 63 (8.4%) |
| 7:30 AM to 7:59 AM | 0 (0.0%) | 65 (8.7%) |
| 8:00 AM to 8:29 AM | 433 (80.2%) | 0 (0.0%) |
| 8:30 AM to 8:59 AM | 0 (0.0%) | 0 (0.0%) |
| 9:00 AM to 9:59 AM | 0 (0.0%) | 229 (30.6%) |
| 10:00 AM to 10:59 AM | 0 (0.0%) | 0 (0.0%) |
| 11:00 AM to 11:59 AM | 0 (0.0%) | 0 (0.0%) |
| 12:00 PM to 3:59 PM | 0 (0.0%) | 208 (27.8%) |
| 4:00 PM to 11:59 PM | 0 (0.0%) | 109 (14.5%) |
| Total | 540 (100.0%) | 749 (100.0%) |
Housing Occupancy in Snowmass Village
Occupancy by Ownership in Snowmass Village
Of the total 1,492 dwellings in Snowmass Village, owner-occupied units account for 1,037 (69.5%), while renter-occupied units make up 455 (30.5%).
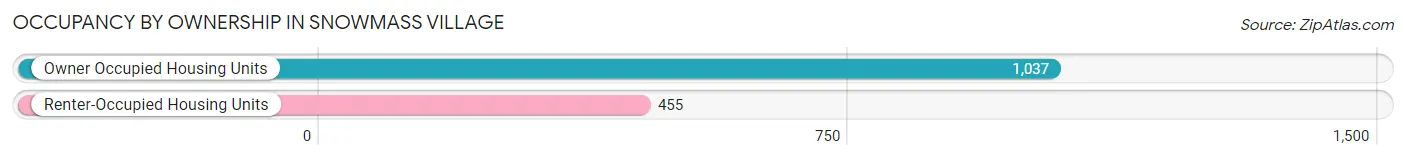
| Occupancy | # Housing Units | % Housing Units |
| Owner Occupied Housing Units | 1,037 | 69.5% |
| Renter-Occupied Housing Units | 455 | 30.5% |
| Total Occupied Housing Units | 1,492 | 100.0% |
Occupancy by Household Size in Snowmass Village
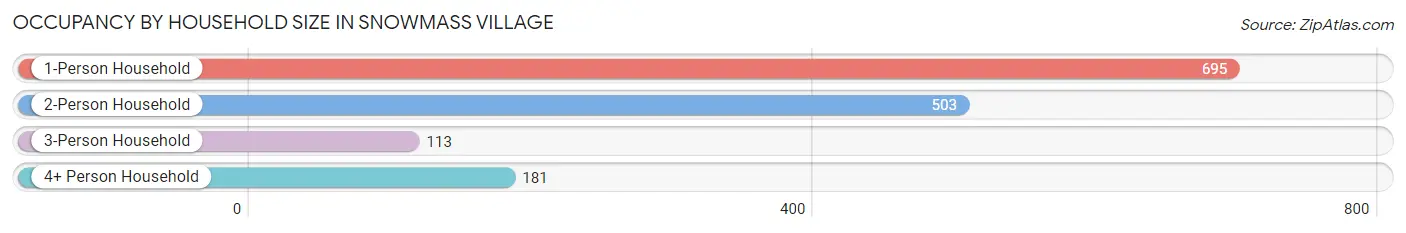
| Household Size | # Housing Units | % Housing Units |
| 1-Person Household | 695 | 46.6% |
| 2-Person Household | 503 | 33.7% |
| 3-Person Household | 113 | 7.6% |
| 4+ Person Household | 181 | 12.1% |
| Total Housing Units | 1,492 | 100.0% |
Occupancy by Ownership by Household Size in Snowmass Village
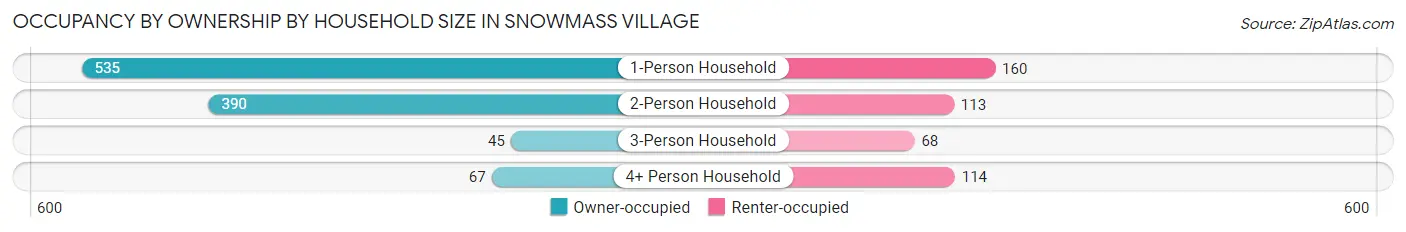
| Household Size | Owner-occupied | Renter-occupied |
| 1-Person Household | 535 (77.0%) | 160 (23.0%) |
| 2-Person Household | 390 (77.5%) | 113 (22.5%) |
| 3-Person Household | 45 (39.8%) | 68 (60.2%) |
| 4+ Person Household | 67 (37.0%) | 114 (63.0%) |
| Total Housing Units | 1,037 (69.5%) | 455 (30.5%) |
Occupancy by Educational Attainment in Snowmass Village
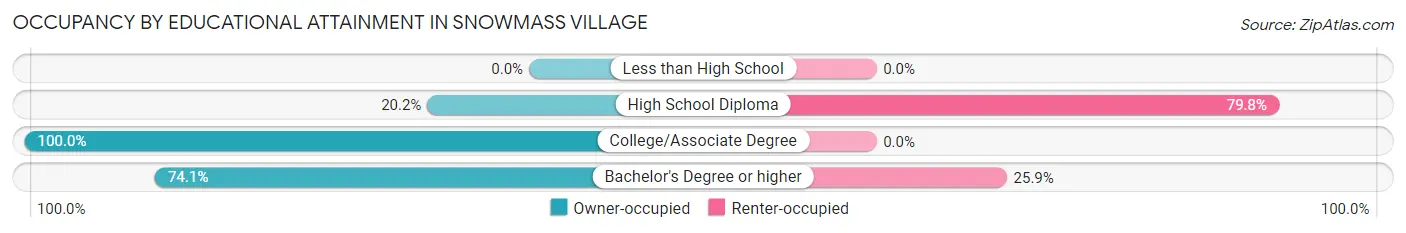
| Household Size | Owner-occupied | Renter-occupied |
| Less than High School | 0 (0.0%) | 0 (0.0%) |
| High School Diploma | 45 (20.2%) | 178 (79.8%) |
| College/Associate Degree | 198 (100.0%) | 0 (0.0%) |
| Bachelor's Degree or higher | 794 (74.1%) | 277 (25.9%) |
Occupancy by Age of Householder in Snowmass Village
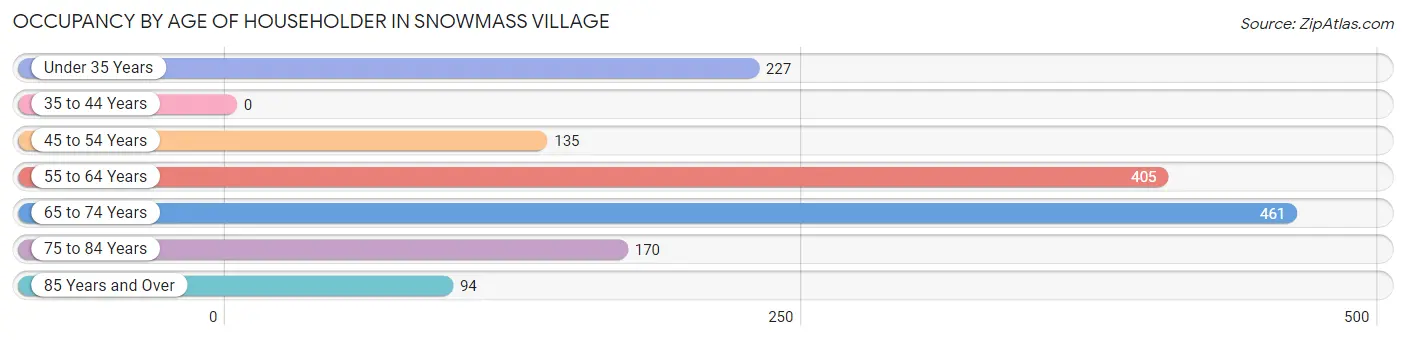
| Age Bracket | # Households | % Households |
| Under 35 Years | 227 | 15.2% |
| 35 to 44 Years | 0 | 0.0% |
| 45 to 54 Years | 135 | 9.0% |
| 55 to 64 Years | 405 | 27.1% |
| 65 to 74 Years | 461 | 30.9% |
| 75 to 84 Years | 170 | 11.4% |
| 85 Years and Over | 94 | 6.3% |
| Total | 1,492 | 100.0% |
Housing Finances in Snowmass Village
Median Income by Occupancy in Snowmass Village
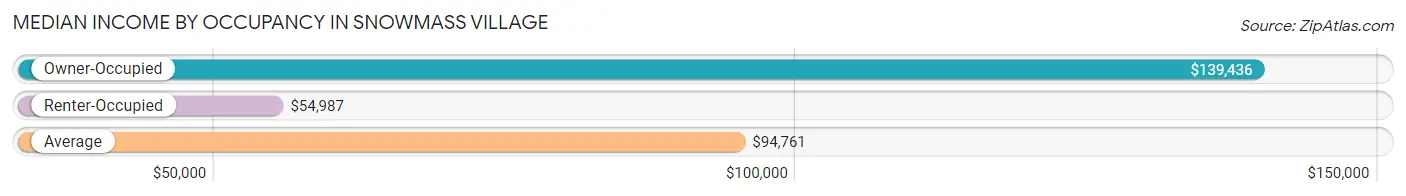
| Occupancy Type | # Households | Median Income |
| Owner-Occupied | 1,037 (69.5%) | $139,436 |
| Renter-Occupied | 455 (30.5%) | $54,987 |
| Average | 1,492 (100.0%) | $94,761 |
Occupancy by Householder Income Bracket in Snowmass Village
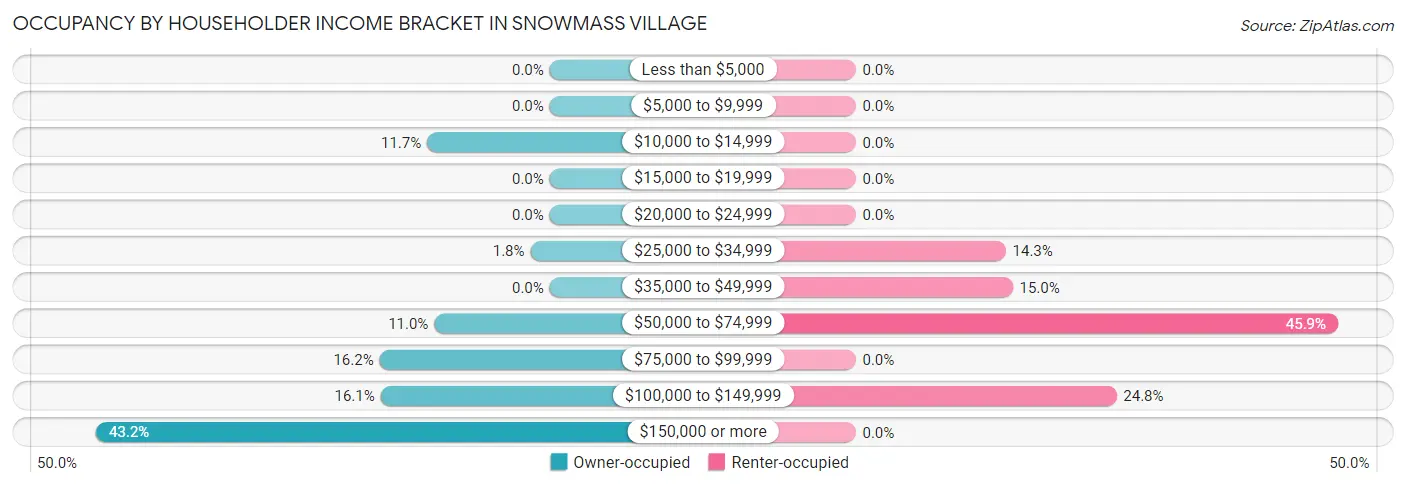
| Income Bracket | Owner-occupied | Renter-occupied |
| Less than $5,000 | 0 (0.0%) | 0 (0.0%) |
| $5,000 to $9,999 | 0 (0.0%) | 0 (0.0%) |
| $10,000 to $14,999 | 121 (11.7%) | 0 (0.0%) |
| $15,000 to $19,999 | 0 (0.0%) | 0 (0.0%) |
| $20,000 to $24,999 | 0 (0.0%) | 0 (0.0%) |
| $25,000 to $34,999 | 19 (1.8%) | 65 (14.3%) |
| $35,000 to $49,999 | 0 (0.0%) | 68 (14.9%) |
| $50,000 to $74,999 | 114 (11.0%) | 209 (45.9%) |
| $75,000 to $99,999 | 168 (16.2%) | 0 (0.0%) |
| $100,000 to $149,999 | 167 (16.1%) | 113 (24.8%) |
| $150,000 or more | 448 (43.2%) | 0 (0.0%) |
| Total | 1,037 (100.0%) | 455 (100.0%) |
Monthly Housing Cost Tiers in Snowmass Village
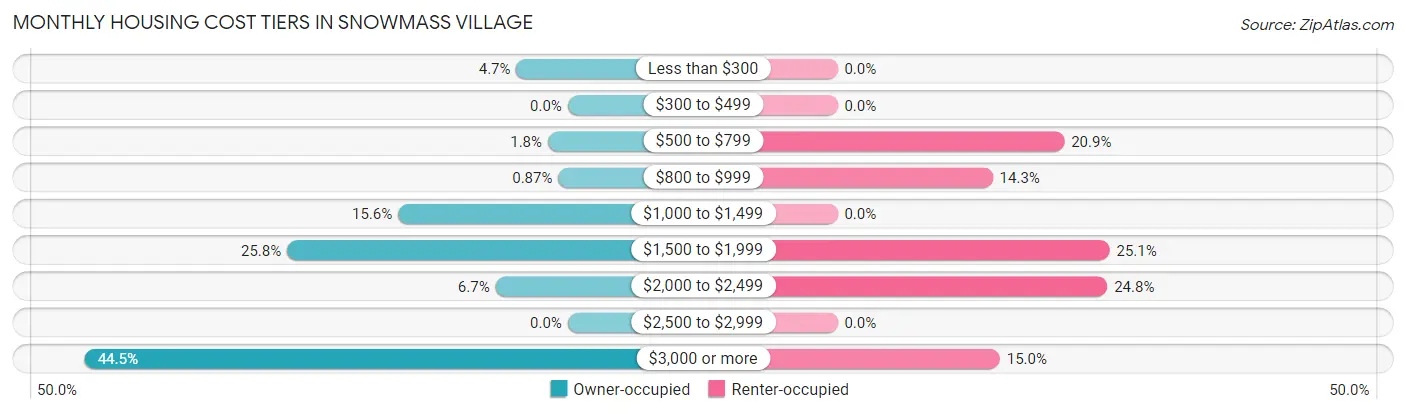
| Monthly Cost | Owner-occupied | Renter-occupied |
| Less than $300 | 49 (4.7%) | 0 (0.0%) |
| $300 to $499 | 0 (0.0%) | 0 (0.0%) |
| $500 to $799 | 19 (1.8%) | 95 (20.9%) |
| $800 to $999 | 9 (0.9%) | 65 (14.3%) |
| $1,000 to $1,499 | 162 (15.6%) | 0 (0.0%) |
| $1,500 to $1,999 | 268 (25.8%) | 114 (25.1%) |
| $2,000 to $2,499 | 69 (6.7%) | 113 (24.8%) |
| $2,500 to $2,999 | 0 (0.0%) | 0 (0.0%) |
| $3,000 or more | 461 (44.5%) | 68 (14.9%) |
| Total | 1,037 (100.0%) | 455 (100.0%) |
Physical Housing Characteristics in Snowmass Village
Housing Structures in Snowmass Village
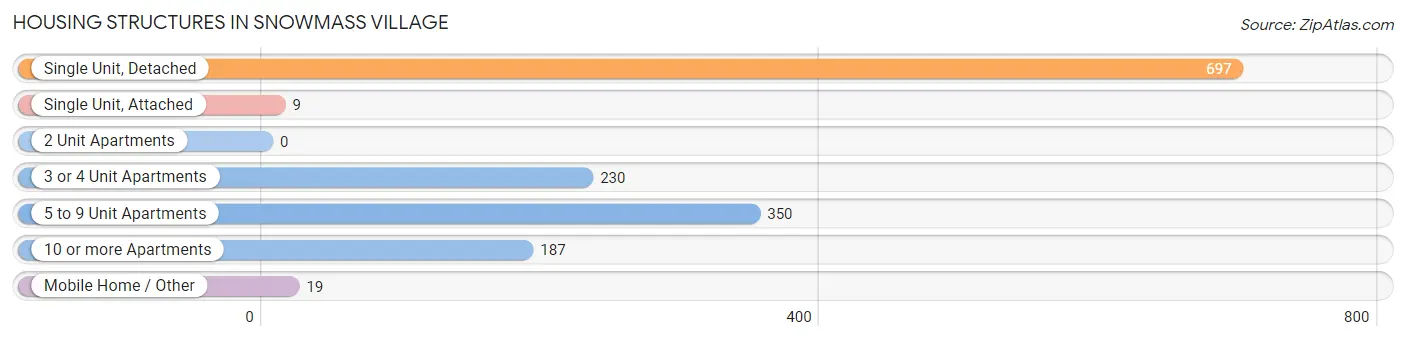
| Structure Type | # Housing Units | % Housing Units |
| Single Unit, Detached | 697 | 46.7% |
| Single Unit, Attached | 9 | 0.6% |
| 2 Unit Apartments | 0 | 0.0% |
| 3 or 4 Unit Apartments | 230 | 15.4% |
| 5 to 9 Unit Apartments | 350 | 23.5% |
| 10 or more Apartments | 187 | 12.5% |
| Mobile Home / Other | 19 | 1.3% |
| Total | 1,492 | 100.0% |
Housing Structures by Occupancy in Snowmass Village
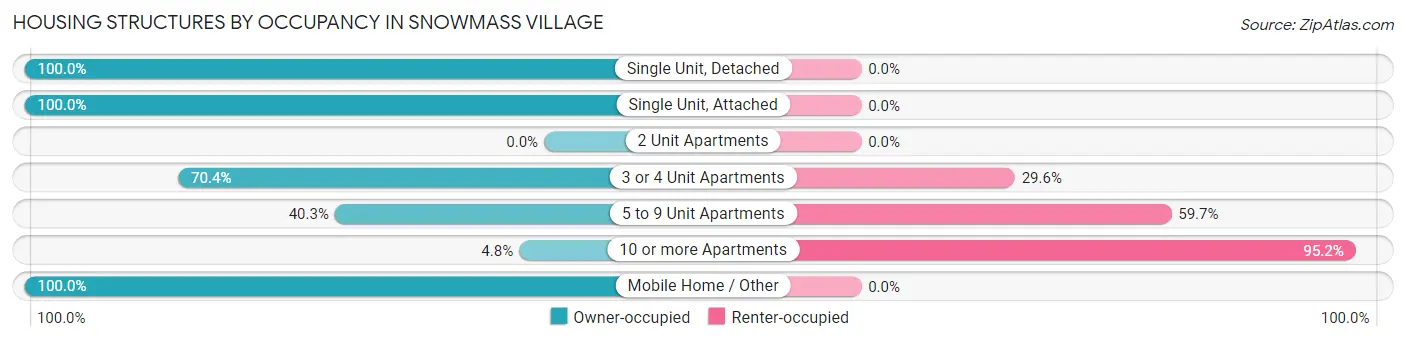
| Structure Type | Owner-occupied | Renter-occupied |
| Single Unit, Detached | 697 (100.0%) | 0 (0.0%) |
| Single Unit, Attached | 9 (100.0%) | 0 (0.0%) |
| 2 Unit Apartments | 0 (0.0%) | 0 (0.0%) |
| 3 or 4 Unit Apartments | 162 (70.4%) | 68 (29.6%) |
| 5 to 9 Unit Apartments | 141 (40.3%) | 209 (59.7%) |
| 10 or more Apartments | 9 (4.8%) | 178 (95.2%) |
| Mobile Home / Other | 19 (100.0%) | 0 (0.0%) |
| Total | 1,037 (69.5%) | 455 (30.5%) |
Housing Structures by Number of Rooms in Snowmass Village
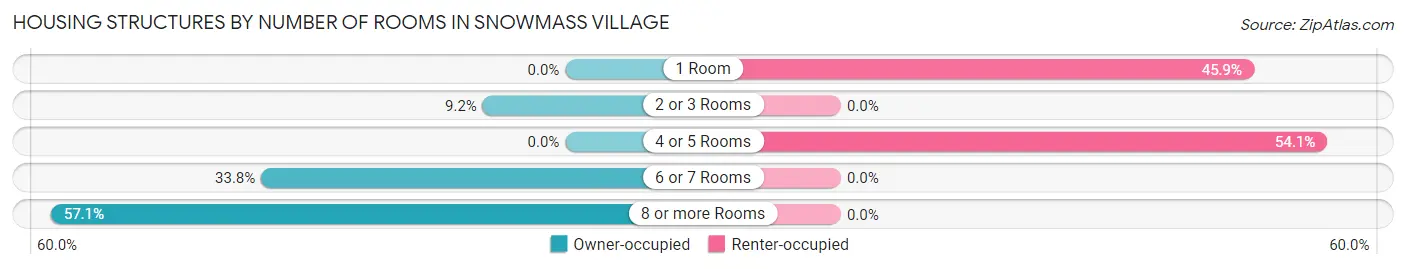
| Number of Rooms | Owner-occupied | Renter-occupied |
| 1 Room | 0 (0.0%) | 209 (45.9%) |
| 2 or 3 Rooms | 95 (9.2%) | 0 (0.0%) |
| 4 or 5 Rooms | 0 (0.0%) | 246 (54.1%) |
| 6 or 7 Rooms | 350 (33.8%) | 0 (0.0%) |
| 8 or more Rooms | 592 (57.1%) | 0 (0.0%) |
| Total | 1,037 (100.0%) | 455 (100.0%) |
Housing Structure by Heating Type in Snowmass Village
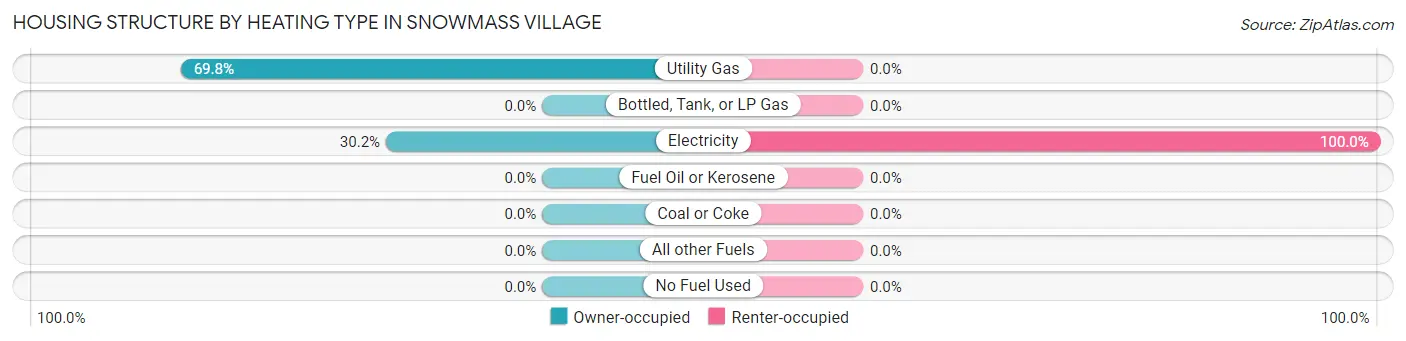
| Heating Type | Owner-occupied | Renter-occupied |
| Utility Gas | 724 (69.8%) | 0 (0.0%) |
| Bottled, Tank, or LP Gas | 0 (0.0%) | 0 (0.0%) |
| Electricity | 313 (30.2%) | 455 (100.0%) |
| Fuel Oil or Kerosene | 0 (0.0%) | 0 (0.0%) |
| Coal or Coke | 0 (0.0%) | 0 (0.0%) |
| All other Fuels | 0 (0.0%) | 0 (0.0%) |
| No Fuel Used | 0 (0.0%) | 0 (0.0%) |
| Total | 1,037 (100.0%) | 455 (100.0%) |
Household Vehicle Usage in Snowmass Village
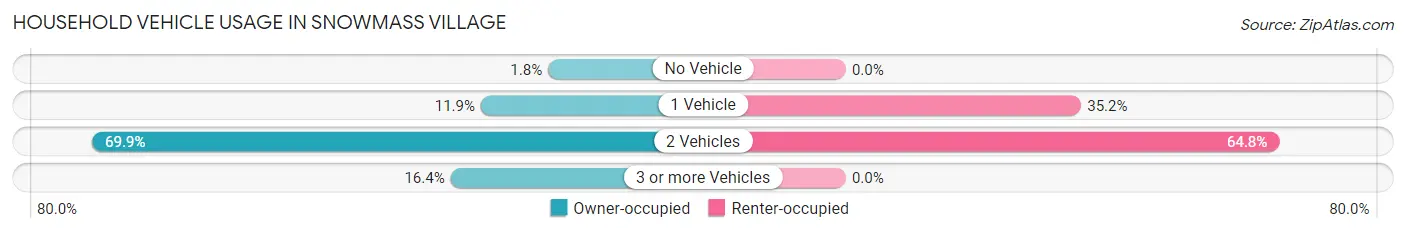
| Vehicles per Household | Owner-occupied | Renter-occupied |
| No Vehicle | 19 (1.8%) | 0 (0.0%) |
| 1 Vehicle | 123 (11.9%) | 160 (35.2%) |
| 2 Vehicles | 725 (69.9%) | 295 (64.8%) |
| 3 or more Vehicles | 170 (16.4%) | 0 (0.0%) |
| Total | 1,037 (100.0%) | 455 (100.0%) |
Real Estate & Mortgages in Snowmass Village
Real Estate and Mortgage Overview in Snowmass Village
| Characteristic | Without Mortgage | With Mortgage |
| Housing Units | 548 | 489 |
| Median Property Value | - | - |
| Median Household Income | $195,705 | $143 |
| Monthly Housing Costs | $1,501 | $340 |
| Real Estate Taxes | $10,001 | $0 |
Property Value by Mortgage Status in Snowmass Village
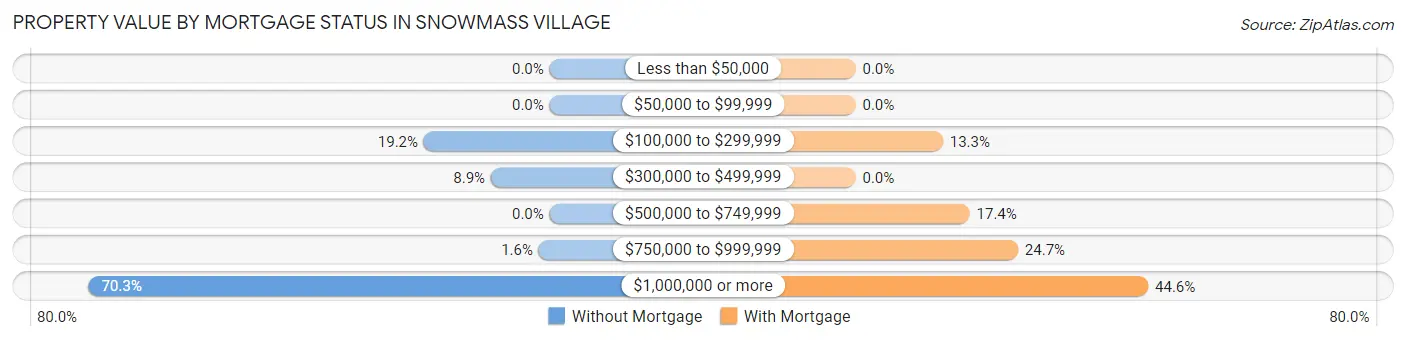
| Property Value | Without Mortgage | With Mortgage |
| Less than $50,000 | 0 (0.0%) | 0 (0.0%) |
| $50,000 to $99,999 | 0 (0.0%) | 0 (0.0%) |
| $100,000 to $299,999 | 105 (19.2%) | 65 (13.3%) |
| $300,000 to $499,999 | 49 (8.9%) | 0 (0.0%) |
| $500,000 to $749,999 | 0 (0.0%) | 85 (17.4%) |
| $750,000 to $999,999 | 9 (1.6%) | 121 (24.7%) |
| $1,000,000 or more | 385 (70.3%) | 218 (44.6%) |
| Total | 548 (100.0%) | 489 (100.0%) |
Household Income by Mortgage Status in Snowmass Village
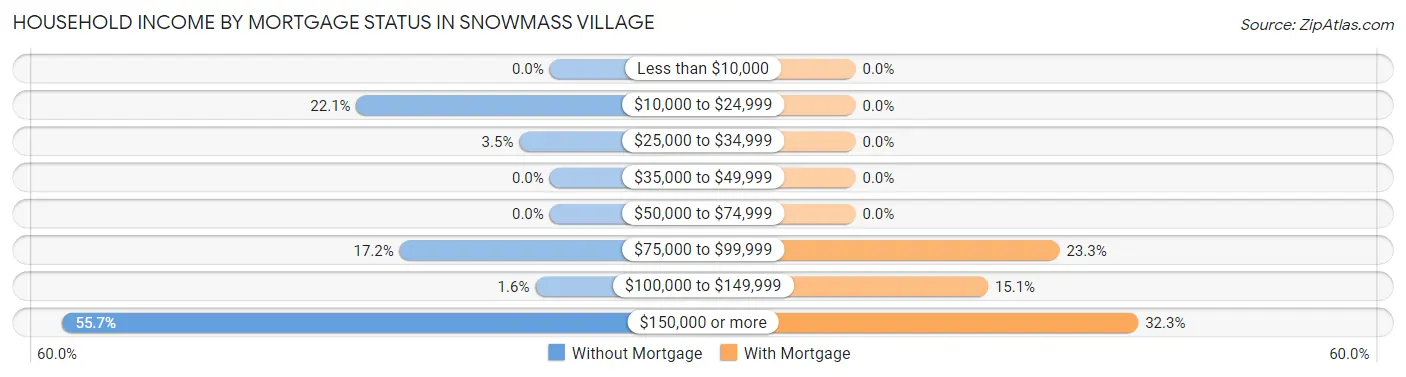
| Household Income | Without Mortgage | With Mortgage |
| Less than $10,000 | 0 (0.0%) | 0 (0.0%) |
| $10,000 to $24,999 | 121 (22.1%) | 0 (0.0%) |
| $25,000 to $34,999 | 19 (3.5%) | 0 (0.0%) |
| $35,000 to $49,999 | 0 (0.0%) | 0 (0.0%) |
| $50,000 to $74,999 | 0 (0.0%) | 0 (0.0%) |
| $75,000 to $99,999 | 94 (17.2%) | 114 (23.3%) |
| $100,000 to $149,999 | 9 (1.6%) | 74 (15.1%) |
| $150,000 or more | 305 (55.7%) | 158 (32.3%) |
| Total | 548 (100.0%) | 489 (100.0%) |
Property Value to Household Income Ratio in Snowmass Village
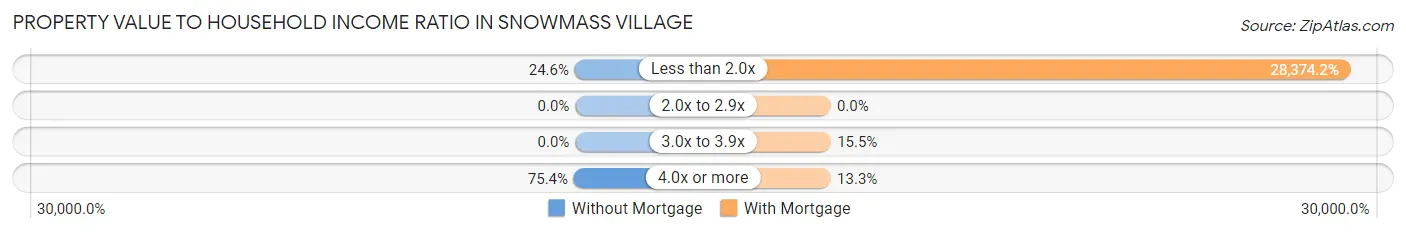
| Value-to-Income Ratio | Without Mortgage | With Mortgage |
| Less than 2.0x | 135 (24.6%) | 138,750 (28,374.2%) |
| 2.0x to 2.9x | 0 (0.0%) | 0 (0.0%) |
| 3.0x to 3.9x | 0 (0.0%) | 76 (15.5%) |
| 4.0x or more | 413 (75.4%) | 65 (13.3%) |
| Total | 548 (100.0%) | 489 (100.0%) |
Real Estate Taxes by Mortgage Status in Snowmass Village
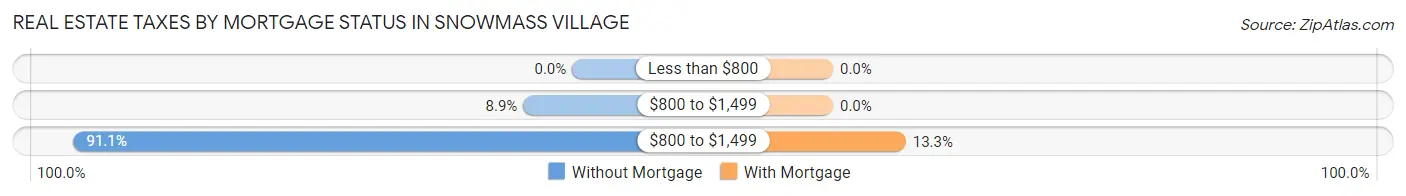
| Property Taxes | Without Mortgage | With Mortgage |
| Less than $800 | 0 (0.0%) | 0 (0.0%) |
| $800 to $1,499 | 49 (8.9%) | 0 (0.0%) |
| $800 to $1,499 | 499 (91.1%) | 65 (13.3%) |
| Total | 548 (100.0%) | 489 (100.0%) |
Health & Disability in Snowmass Village
Health Insurance Coverage by Age in Snowmass Village
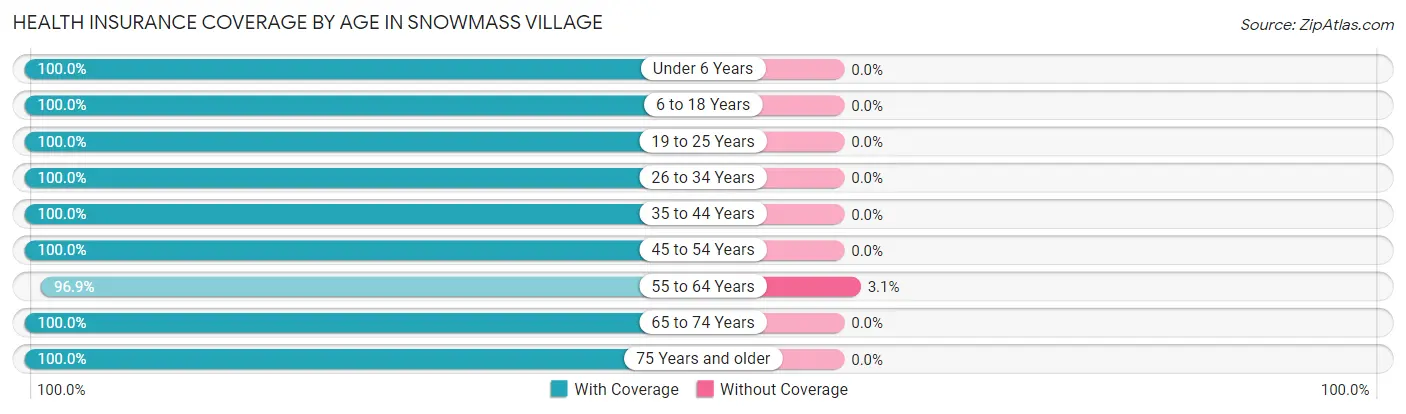
| Age Bracket | With Coverage | Without Coverage |
| Under 6 Years | 272 (100.0%) | 0 (0.0%) |
| 6 to 18 Years | 353 (100.0%) | 0 (0.0%) |
| 19 to 25 Years | 17 (100.0%) | 0 (0.0%) |
| 26 to 34 Years | 310 (100.0%) | 0 (0.0%) |
| 35 to 44 Years | 109 (100.0%) | 0 (0.0%) |
| 45 to 54 Years | 381 (100.0%) | 0 (0.0%) |
| 55 to 64 Years | 599 (96.9%) | 19 (3.1%) |
| 65 to 74 Years | 588 (100.0%) | 0 (0.0%) |
| 75 Years and older | 428 (100.0%) | 0 (0.0%) |
| Total | 3,057 (99.4%) | 19 (0.6%) |
Health Insurance Coverage by Citizenship Status in Snowmass Village
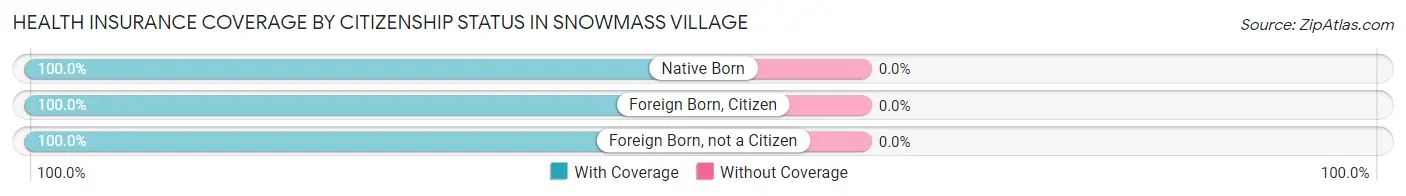
| Citizenship Status | With Coverage | Without Coverage |
| Native Born | 272 (100.0%) | 0 (0.0%) |
| Foreign Born, Citizen | 353 (100.0%) | 0 (0.0%) |
| Foreign Born, not a Citizen | 17 (100.0%) | 0 (0.0%) |
Health Insurance Coverage by Household Income in Snowmass Village
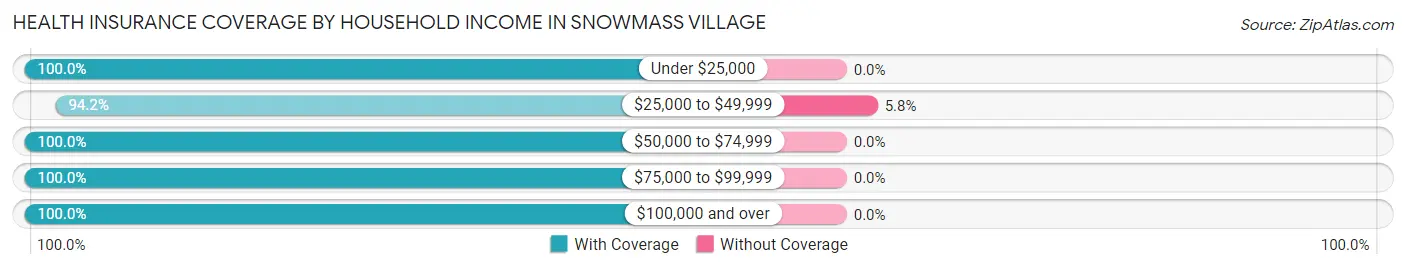
| Household Income | With Coverage | Without Coverage |
| Under $25,000 | 121 (100.0%) | 0 (0.0%) |
| $25,000 to $49,999 | 309 (94.2%) | 19 (5.8%) |
| $50,000 to $74,999 | 732 (100.0%) | 0 (0.0%) |
| $75,000 to $99,999 | 168 (100.0%) | 0 (0.0%) |
| $100,000 and over | 1,710 (100.0%) | 0 (0.0%) |
Public vs Private Health Insurance Coverage by Age in Snowmass Village
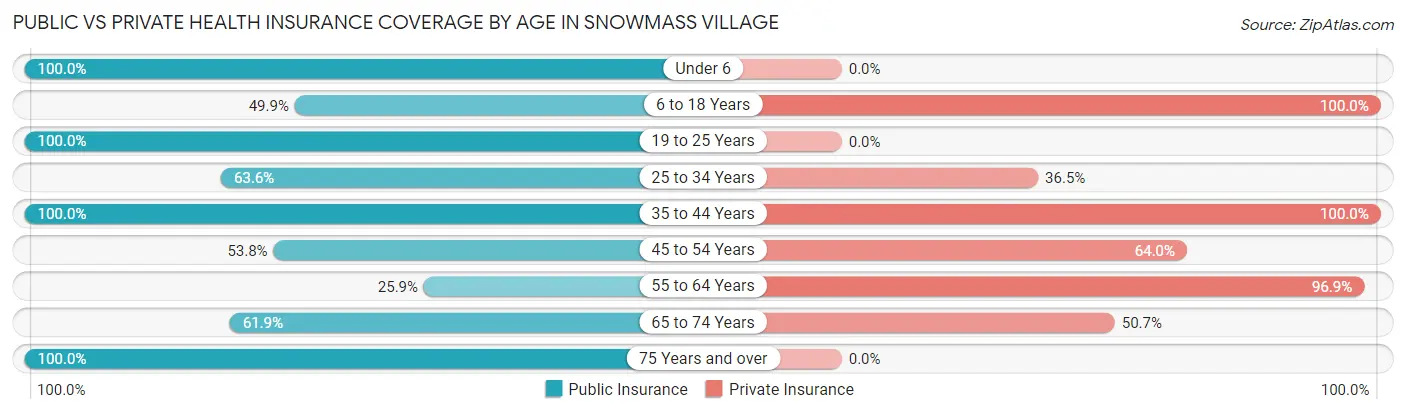
| Age Bracket | Public Insurance | Private Insurance |
| Under 6 | 272 (100.0%) | 0 (0.0%) |
| 6 to 18 Years | 176 (49.9%) | 353 (100.0%) |
| 19 to 25 Years | 17 (100.0%) | 0 (0.0%) |
| 25 to 34 Years | 197 (63.5%) | 113 (36.4%) |
| 35 to 44 Years | 109 (100.0%) | 109 (100.0%) |
| 45 to 54 Years | 205 (53.8%) | 244 (64.0%) |
| 55 to 64 Years | 160 (25.9%) | 599 (96.9%) |
| 65 to 74 Years | 364 (61.9%) | 298 (50.7%) |
| 75 Years and over | 428 (100.0%) | 0 (0.0%) |
| Total | 1,928 (62.7%) | 1,716 (55.8%) |
Disability Status by Sex by Age in Snowmass Village
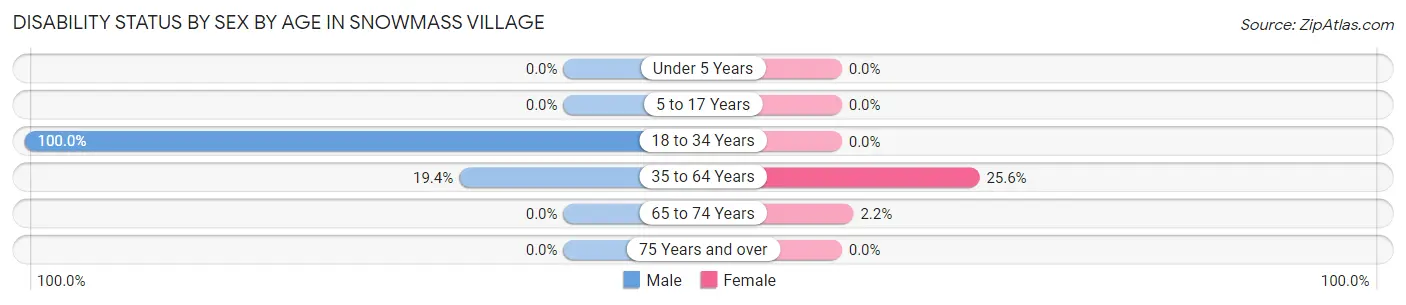
| Age Bracket | Male | Female |
| Under 5 Years | 0 (0.0%) | 0 (0.0%) |
| 5 to 17 Years | 0 (0.0%) | 0 (0.0%) |
| 18 to 34 Years | 83 (100.0%) | 0 (0.0%) |
| 35 to 64 Years | 91 (19.4%) | 163 (25.6%) |
| 65 to 74 Years | 0 (0.0%) | 7 (2.2%) |
| 75 Years and over | 0 (0.0%) | 0 (0.0%) |
Disability Class by Sex by Age in Snowmass Village
Disability Class: Hearing Difficulty
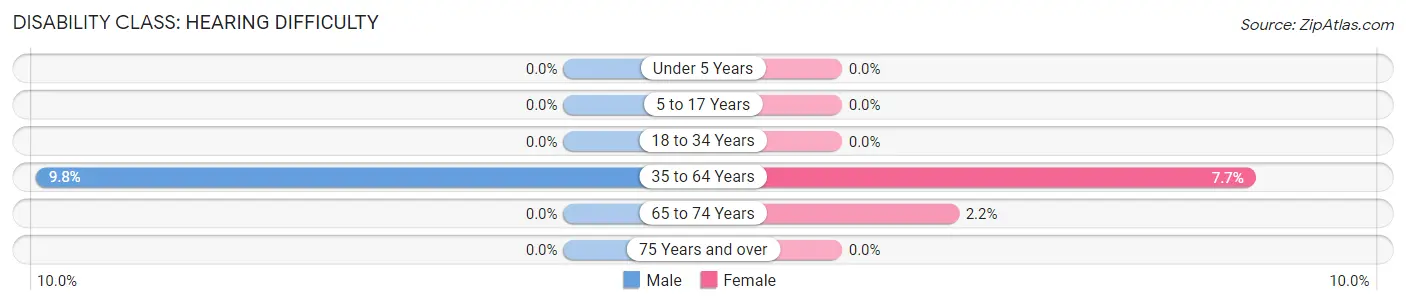
| Age Bracket | Male | Female |
| Under 5 Years | 0 (0.0%) | 0 (0.0%) |
| 5 to 17 Years | 0 (0.0%) | 0 (0.0%) |
| 18 to 34 Years | 0 (0.0%) | 0 (0.0%) |
| 35 to 64 Years | 46 (9.8%) | 49 (7.7%) |
| 65 to 74 Years | 0 (0.0%) | 7 (2.2%) |
| 75 Years and over | 0 (0.0%) | 0 (0.0%) |
Disability Class: Vision Difficulty
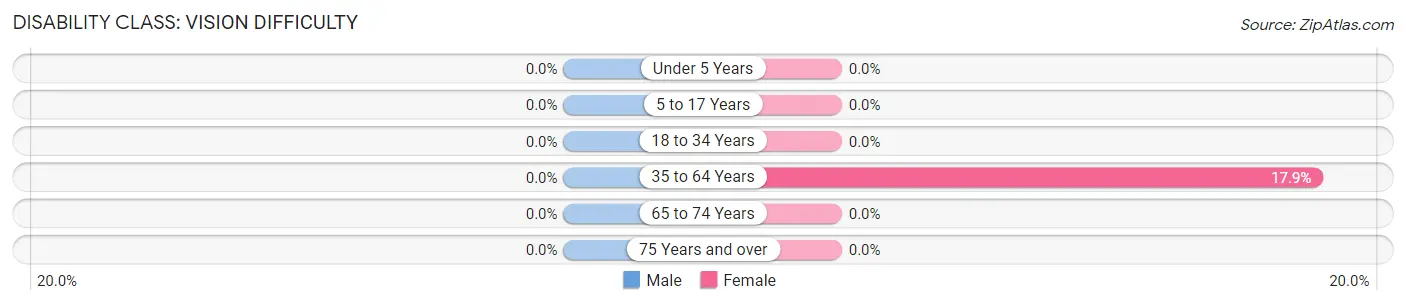
| Age Bracket | Male | Female |
| Under 5 Years | 0 (0.0%) | 0 (0.0%) |
| 5 to 17 Years | 0 (0.0%) | 0 (0.0%) |
| 18 to 34 Years | 0 (0.0%) | 0 (0.0%) |
| 35 to 64 Years | 0 (0.0%) | 114 (17.9%) |
| 65 to 74 Years | 0 (0.0%) | 0 (0.0%) |
| 75 Years and over | 0 (0.0%) | 0 (0.0%) |
Disability Class: Cognitive Difficulty
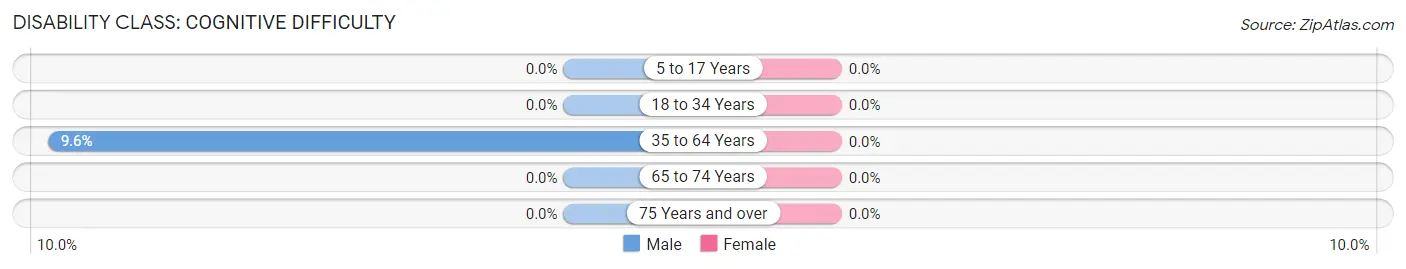
| Age Bracket | Male | Female |
| 5 to 17 Years | 0 (0.0%) | 0 (0.0%) |
| 18 to 34 Years | 0 (0.0%) | 0 (0.0%) |
| 35 to 64 Years | 45 (9.6%) | 0 (0.0%) |
| 65 to 74 Years | 0 (0.0%) | 0 (0.0%) |
| 75 Years and over | 0 (0.0%) | 0 (0.0%) |
Disability Class: Ambulatory Difficulty
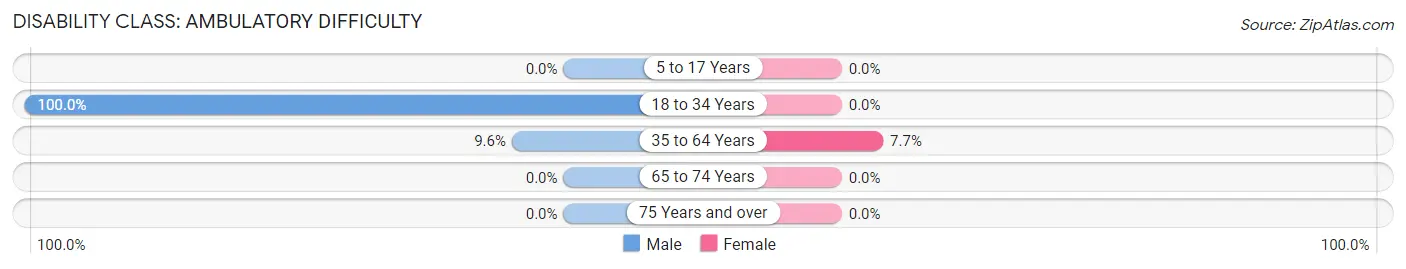
| Age Bracket | Male | Female |
| 5 to 17 Years | 0 (0.0%) | 0 (0.0%) |
| 18 to 34 Years | 83 (100.0%) | 0 (0.0%) |
| 35 to 64 Years | 45 (9.6%) | 49 (7.7%) |
| 65 to 74 Years | 0 (0.0%) | 0 (0.0%) |
| 75 Years and over | 0 (0.0%) | 0 (0.0%) |
Disability Class: Self-Care Difficulty
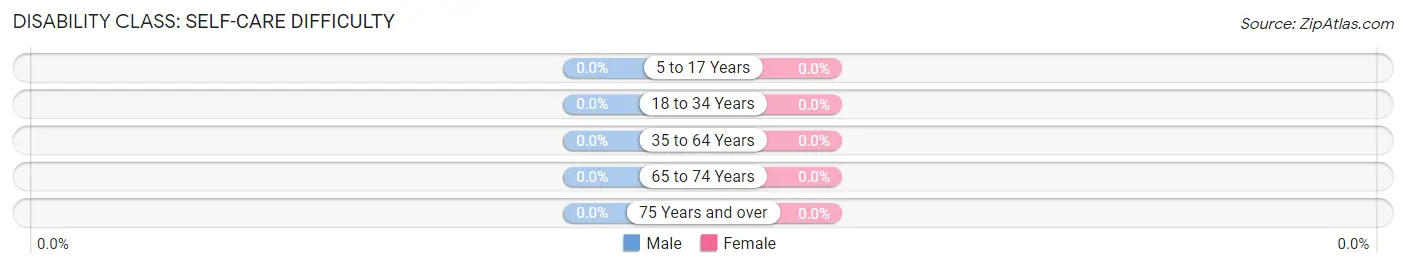
| Age Bracket | Male | Female |
| 5 to 17 Years | 0 (0.0%) | 0 (0.0%) |
| 18 to 34 Years | 0 (0.0%) | 0 (0.0%) |
| 35 to 64 Years | 0 (0.0%) | 0 (0.0%) |
| 65 to 74 Years | 0 (0.0%) | 0 (0.0%) |
| 75 Years and over | 0 (0.0%) | 0 (0.0%) |
Technology Access in Snowmass Village
Computing Device Access in Snowmass Village
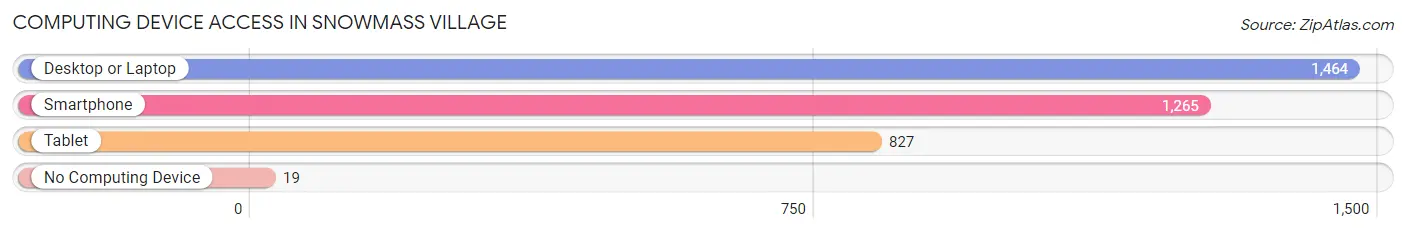
| Device Type | # Households | % Households |
| Desktop or Laptop | 1,464 | 98.1% |
| Smartphone | 1,265 | 84.8% |
| Tablet | 827 | 55.4% |
| No Computing Device | 19 | 1.3% |
| Total | 1,492 | 100.0% |
Internet Access in Snowmass Village
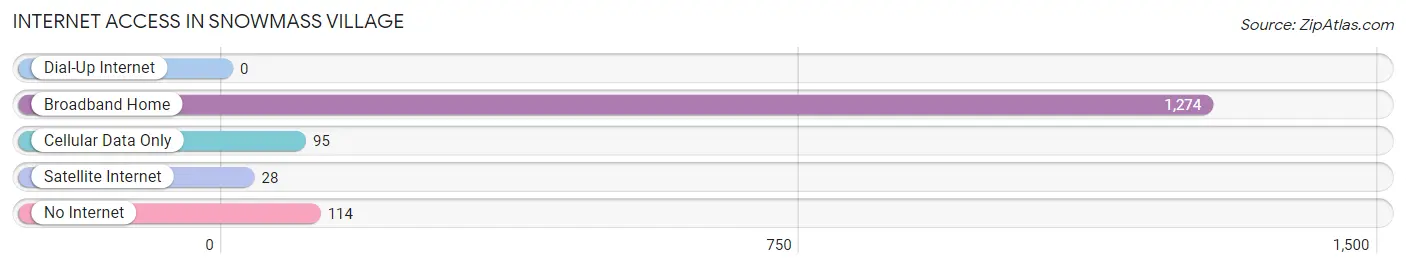
| Internet Type | # Households | % Households |
| Dial-Up Internet | 0 | 0.0% |
| Broadband Home | 1,274 | 85.4% |
| Cellular Data Only | 95 | 6.4% |
| Satellite Internet | 28 | 1.9% |
| No Internet | 114 | 7.6% |
| Total | 1,492 | 100.0% |
Snowmass Village Summary
Snowmass Village is a small town located in the Rocky Mountains of Colorado, United States. It is situated in the Roaring Fork Valley, approximately 10 miles west of Aspen and 20 miles east of Glenwood Springs. The town is located at an elevation of 8,000 feet and is surrounded by the White River National Forest.
History
Snowmass Village was founded in 1967 as a ski resort. The area was originally inhabited by the Ute Indians, who used the area for hunting and gathering. In the late 1800s, the area was settled by ranchers and miners. The first ski area in the area was opened in 1951, and the town of Snowmass Village was incorporated in 1977.
Geography
Snowmass Village is located in the Rocky Mountains of Colorado, in the Roaring Fork Valley. The town is situated at an elevation of 8,000 feet and is surrounded by the White River National Forest. The town is located approximately 10 miles west of Aspen and 20 miles east of Glenwood Springs. The town is located in a valley surrounded by mountains, including the Elk Mountains to the west, the Maroon Bells to the south, and the Flat Tops to the east.
Economy
Snowmass Village is primarily a tourist destination, with the majority of its economy based on tourism. The town is home to the Snowmass Ski Area, which is one of the largest ski resorts in the United States. The ski area attracts visitors from all over the world, and is a major source of revenue for the town. In addition to skiing, the town also offers a variety of other activities, such as snowmobiling, snowshoeing, and hiking. The town also has a variety of restaurants, shops, and lodging options.
Demographics
As of the 2010 census, the population of Snowmass Village was 2,826. The population is primarily white (93.3%), with the remaining population being made up of Hispanic (3.2%), African American (1.2%), and Asian (1.2%) residents. The median household income in the town is $90,945, and the median age is 44. The town has a high rate of homeownership, with 73.3% of residents owning their own homes.
Conclusion
Snowmass Village is a small town located in the Rocky Mountains of Colorado, United States. It is situated in the Roaring Fork Valley, approximately 10 miles west of Aspen and 20 miles east of Glenwood Springs. The town is primarily a tourist destination, with the majority of its economy based on tourism. The town is home to the Snowmass Ski Area, which is one of the largest ski resorts in the United States. As of the 2010 census, the population of Snowmass Village was 2,826. The population is primarily white, with the median household income in the town being $90,945. The town has a high rate of homeownership, with 73.3% of residents owning their own homes.
Common Questions
What is Per Capita Income in Snowmass Village?
Per Capita income in Snowmass Village is $100,123.
What is the Median Family Income in Snowmass Village?
Median Family Income in Snowmass Village is $195,080.
What is the Median Household income in Snowmass Village?
Median Household Income in Snowmass Village is $94,761.
What is Inequality or Gini Index in Snowmass Village?
Inequality or Gini Index in Snowmass Village is 0.53.
What is the Total Population of Snowmass Village?
Total Population of Snowmass Village is 3,076.
What is the Total Male Population of Snowmass Village?
Total Male Population of Snowmass Village is 1,443.
What is the Total Female Population of Snowmass Village?
Total Female Population of Snowmass Village is 1,633.
What is the Ratio of Males per 100 Females in Snowmass Village?
There are 88.36 Males per 100 Females in Snowmass Village.
What is the Ratio of Females per 100 Males in Snowmass Village?
There are 113.17 Females per 100 Males in Snowmass Village.
What is the Median Population Age in Snowmass Village?
Median Population Age in Snowmass Village is 58.1 Years.
What is the Average Family Size in Snowmass Village
Average Family Size in Snowmass Village is 2.9 People.
What is the Average Household Size in Snowmass Village
Average Household Size in Snowmass Village is 2.0 People.
How Large is the Labor Force in Snowmass Village?
There are 1,727 People in the Labor Forcein in Snowmass Village.
What is the Percentage of People in the Labor Force in Snowmass Village?
68.0% of People are in the Labor Force in Snowmass Village.