Margaretville, NY Map & Demographics
Margaretville Map
Margaretville Overview
$23,724
PER CAPITA INCOME
$73,021
AVG FAMILY INCOME
$36,750
AVG HOUSEHOLD INCOME
37.6%
WAGE / INCOME GAP [ % ]
62.4¢/ $1
WAGE / INCOME GAP [ $ ]
0.41
INEQUALITY / GINI INDEX
656
TOTAL POPULATION
347
MALE POPULATION
309
FEMALE POPULATION
112.30
MALES / 100 FEMALES
89.05
FEMALES / 100 MALES
56.1
MEDIAN AGE
3.1
AVG FAMILY SIZE
2.1
AVG HOUSEHOLD SIZE
183
LABOR FORCE [ PEOPLE ]
32.1%
PERCENT IN LABOR FORCE
Margaretville Zip Codes
Margaretville Area Codes
Income in Margaretville
Income Overview in Margaretville
Per Capita Income in Margaretville is $23,724, while median incomes of families and households are $73,021 and $36,750 respectively.
| Characteristic | Number | Measure |
| Per Capita Income | 656 | $23,724 |
| Median Family Income | 135 | $73,021 |
| Mean Family Income | 135 | $71,415 |
| Median Household Income | 272 | $36,750 |
| Mean Household Income | 272 | $52,413 |
| Income Deficit | 135 | $0 |
| Wage / Income Gap (%) | 656 | 37.57% |
| Wage / Income Gap ($) | 656 | 62.43¢ per $1 |
| Gini / Inequality Index | 656 | 0.41 |
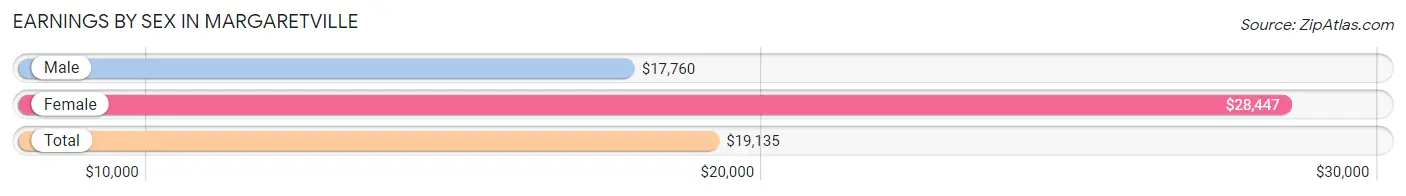
Earnings by Sex in Margaretville
Average Earnings in Margaretville are $19,135, $17,760 for men and $28,447 for women, a difference of 37.6%.
| Sex | Number | Average Earnings |
| Male | 139 (65.6%) | $17,760 |
| Female | 73 (34.4%) | $28,447 |
| Total | 212 (100.0%) | $19,135 |
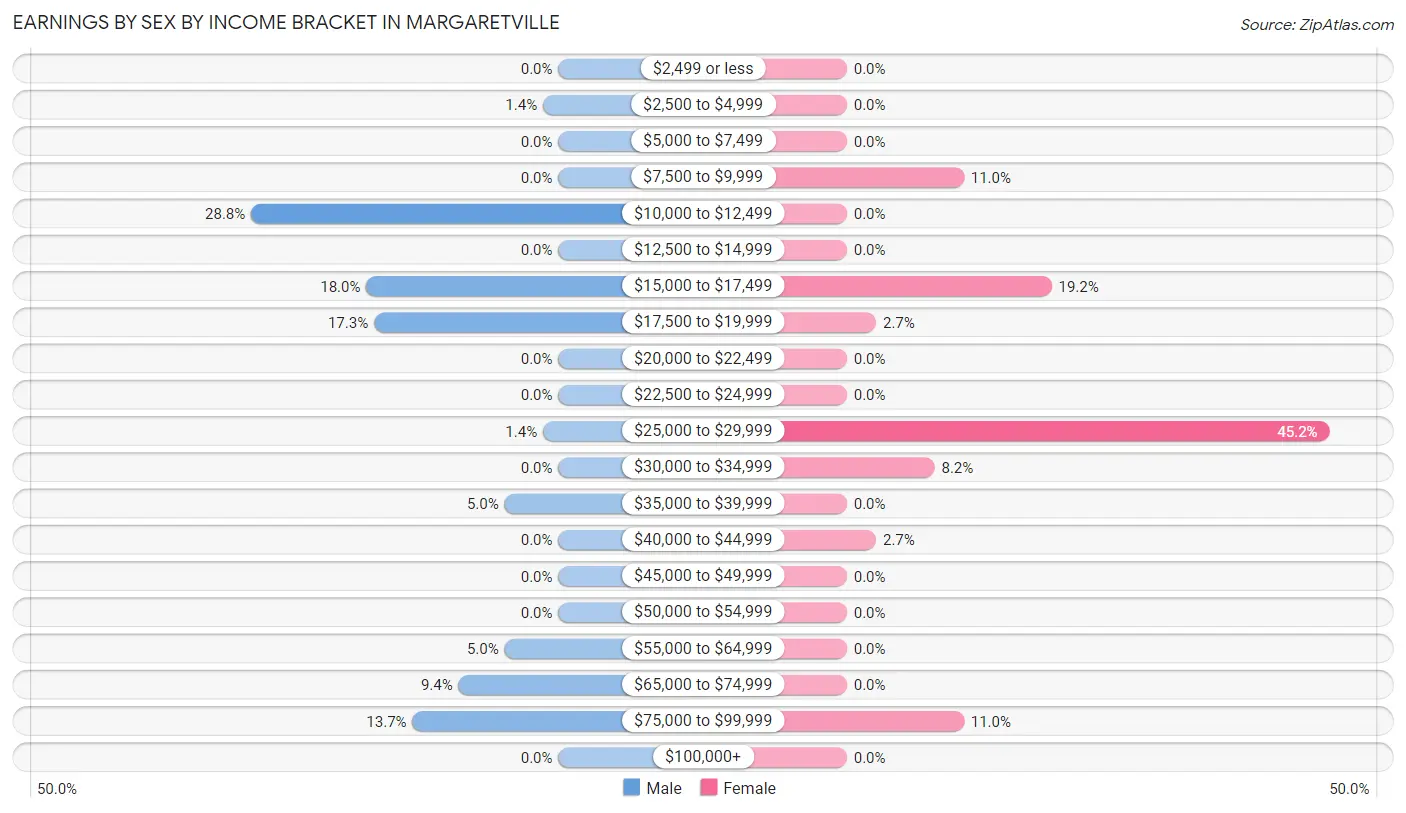
Earnings by Sex by Income Bracket in Margaretville
The most common earnings brackets in Margaretville are $10,000 to $12,499 for men (40 | 28.8%) and $25,000 to $29,999 for women (33 | 45.2%).
| Income | Male | Female |
| $2,499 or less | 0 (0.0%) | 0 (0.0%) |
| $2,500 to $4,999 | 2 (1.4%) | 0 (0.0%) |
| $5,000 to $7,499 | 0 (0.0%) | 0 (0.0%) |
| $7,500 to $9,999 | 0 (0.0%) | 8 (11.0%) |
| $10,000 to $12,499 | 40 (28.8%) | 0 (0.0%) |
| $12,500 to $14,999 | 0 (0.0%) | 0 (0.0%) |
| $15,000 to $17,499 | 25 (18.0%) | 14 (19.2%) |
| $17,500 to $19,999 | 24 (17.3%) | 2 (2.7%) |
| $20,000 to $22,499 | 0 (0.0%) | 0 (0.0%) |
| $22,500 to $24,999 | 0 (0.0%) | 0 (0.0%) |
| $25,000 to $29,999 | 2 (1.4%) | 33 (45.2%) |
| $30,000 to $34,999 | 0 (0.0%) | 6 (8.2%) |
| $35,000 to $39,999 | 7 (5.0%) | 0 (0.0%) |
| $40,000 to $44,999 | 0 (0.0%) | 2 (2.7%) |
| $45,000 to $49,999 | 0 (0.0%) | 0 (0.0%) |
| $50,000 to $54,999 | 0 (0.0%) | 0 (0.0%) |
| $55,000 to $64,999 | 7 (5.0%) | 0 (0.0%) |
| $65,000 to $74,999 | 13 (9.3%) | 0 (0.0%) |
| $75,000 to $99,999 | 19 (13.7%) | 8 (11.0%) |
| $100,000+ | 0 (0.0%) | 0 (0.0%) |
| Total | 139 (100.0%) | 73 (100.0%) |
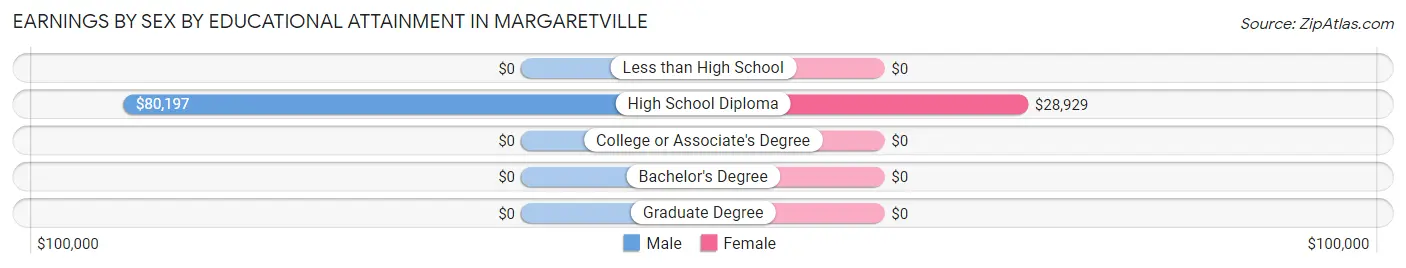
Earnings by Sex by Educational Attainment in Margaretville
| Educational Attainment | Male Income | Female Income |
| Less than High School | - | - |
| High School Diploma | $80,197 | $28,929 |
| College or Associate's Degree | - | - |
| Bachelor's Degree | - | - |
| Graduate Degree | - | - |
| Total | - | - |
Family Income in Margaretville
Family Income Brackets in Margaretville
According to the Margaretville family income data, there are 50 families falling into the $100,000 to $149,999 income range, which is the most common income bracket and makes up 37.0% of all families.
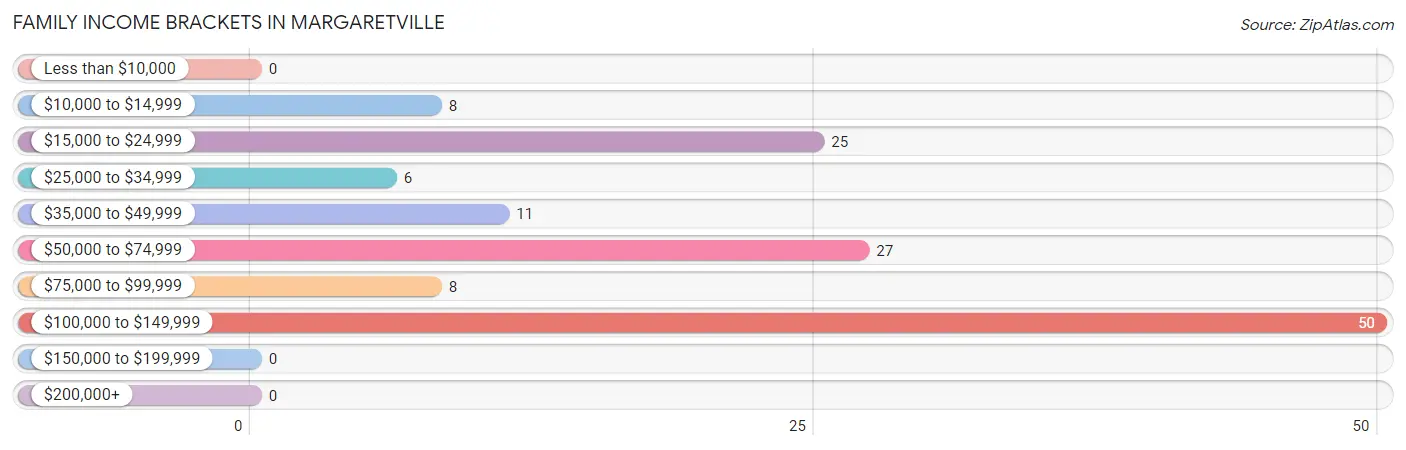
| Income Bracket | # Families | % Families |
| Less than $10,000 | 0 | 0.0% |
| $10,000 to $14,999 | 8 | 5.9% |
| $15,000 to $24,999 | 25 | 18.5% |
| $25,000 to $34,999 | 6 | 4.4% |
| $35,000 to $49,999 | 11 | 8.1% |
| $50,000 to $74,999 | 27 | 20.0% |
| $75,000 to $99,999 | 8 | 5.9% |
| $100,000 to $149,999 | 50 | 37.0% |
| $150,000 to $199,999 | 0 | 0.0% |
| $200,000+ | 0 | 0.0% |
Family Income by Famaliy Size in Margaretville
| Income Bracket | # Families | Median Income |
| 2-Person Families | 83 (61.5%) | $0 |
| 3-Person Families | 6 (4.4%) | $0 |
| 4-Person Families | 13 (9.6%) | $0 |
| 5-Person Families | 5 (3.7%) | $0 |
| 6-Person Families | 0 (0.0%) | $0 |
| 7+ Person Families | 28 (20.7%) | $0 |
| Total | 135 (100.0%) | $73,021 |
Family Income by Number of Earners in Margaretville
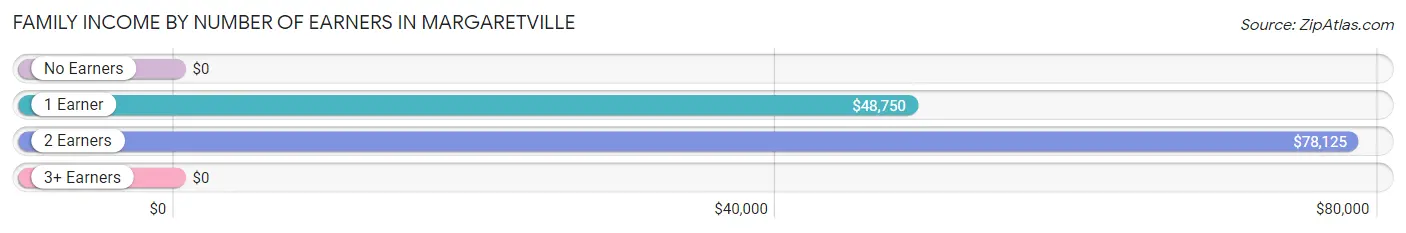
| Number of Earners | # Families | Median Income |
| No Earners | 27 (20.0%) | $0 |
| 1 Earner | 67 (49.6%) | $48,750 |
| 2 Earners | 13 (9.6%) | $78,125 |
| 3+ Earners | 28 (20.7%) | $0 |
| Total | 135 (100.0%) | $73,021 |
Household Income in Margaretville
Household Income Brackets in Margaretville
With 55 households falling in the category, the $15,000 to $24,999 income range is the most frequent in Margaretville, accounting for 20.2% of all households.
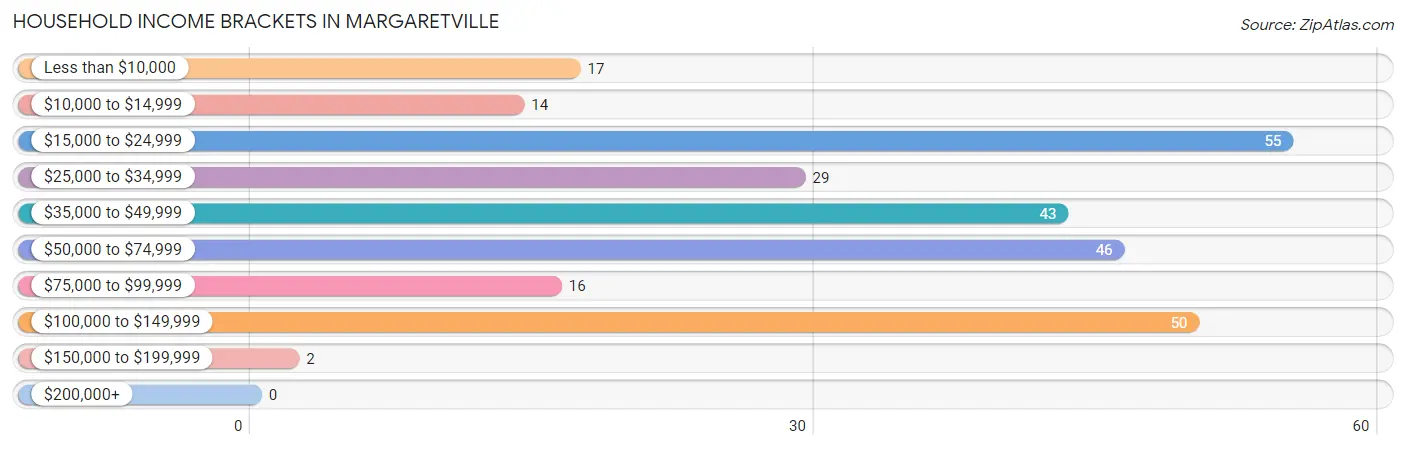
| Income Bracket | # Households | % Households |
| Less than $10,000 | 17 | 6.3% |
| $10,000 to $14,999 | 14 | 5.1% |
| $15,000 to $24,999 | 55 | 20.2% |
| $25,000 to $34,999 | 29 | 10.7% |
| $35,000 to $49,999 | 43 | 15.8% |
| $50,000 to $74,999 | 46 | 16.9% |
| $75,000 to $99,999 | 16 | 5.9% |
| $100,000 to $149,999 | 50 | 18.4% |
| $150,000 to $199,999 | 2 | 0.7% |
| $200,000+ | 0 | 0.0% |
Household Income by Householder Age in Margaretville
The median household income in Margaretville is $36,750, with the highest median household income of $51,429 found in the 45 to 64 years age bracket for the primary householder. A total of 116 households (42.6%) fall into this category.
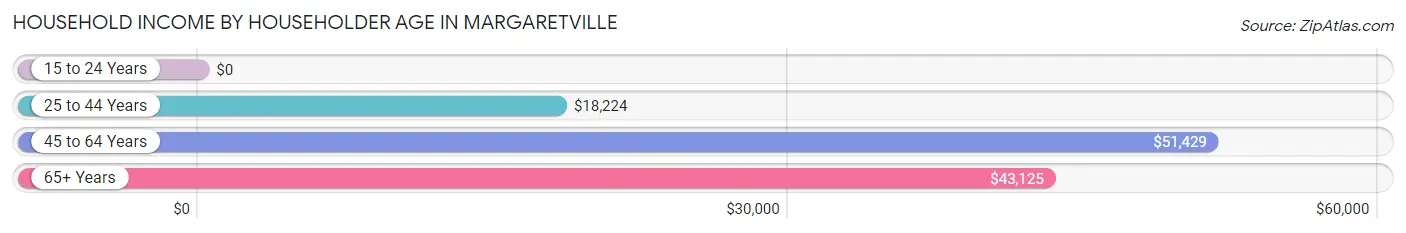
| Income Bracket | # Households | Median Income |
| 15 to 24 Years | 0 (0.0%) | $0 |
| 25 to 44 Years | 61 (22.4%) | $18,224 |
| 45 to 64 Years | 116 (42.6%) | $51,429 |
| 65+ Years | 95 (34.9%) | $43,125 |
| Total | 272 (100.0%) | $36,750 |
Poverty in Margaretville
Income Below Poverty by Sex and Age in Margaretville
With 15.1% poverty level for males and 18.6% for females among the residents of Margaretville, 35 to 44 year old males and 25 to 34 year old females are the most vulnerable to poverty, with 25 males (100.0%) and 25 females (83.3%) in their respective age groups living below the poverty level.
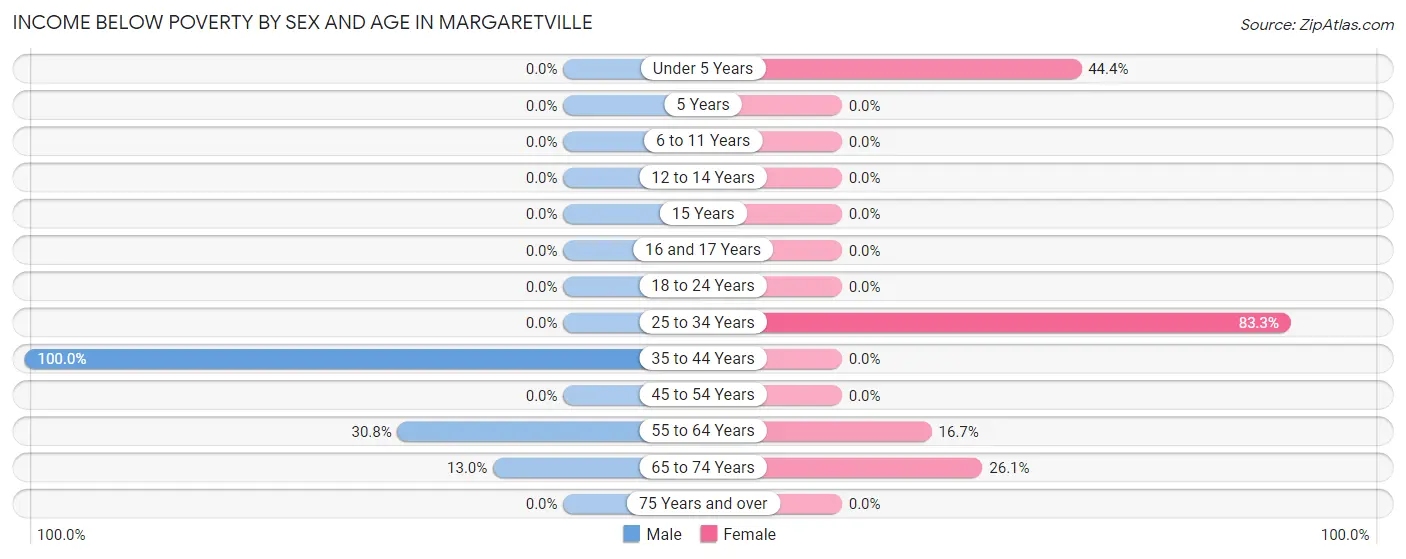
| Age Bracket | Male | Female |
| Under 5 Years | 0 (0.0%) | 8 (44.4%) |
| 5 Years | 0 (0.0%) | 0 (0.0%) |
| 6 to 11 Years | 0 (0.0%) | 0 (0.0%) |
| 12 to 14 Years | 0 (0.0%) | 0 (0.0%) |
| 15 Years | 0 (0.0%) | 0 (0.0%) |
| 16 and 17 Years | 0 (0.0%) | 0 (0.0%) |
| 18 to 24 Years | 0 (0.0%) | 0 (0.0%) |
| 25 to 34 Years | 0 (0.0%) | 25 (83.3%) |
| 35 to 44 Years | 25 (100.0%) | 0 (0.0%) |
| 45 to 54 Years | 0 (0.0%) | 0 (0.0%) |
| 55 to 64 Years | 16 (30.8%) | 8 (16.7%) |
| 65 to 74 Years | 9 (13.0%) | 6 (26.1%) |
| 75 Years and over | 0 (0.0%) | 0 (0.0%) |
| Total | 50 (15.1%) | 47 (18.6%) |
Income Above Poverty by Sex and Age in Margaretville
According to the poverty statistics in Margaretville, males aged 6 to 11 years and females aged 6 to 11 years are the age groups that are most secure financially, with 100.0% of males and 100.0% of females in these age groups living above the poverty line.
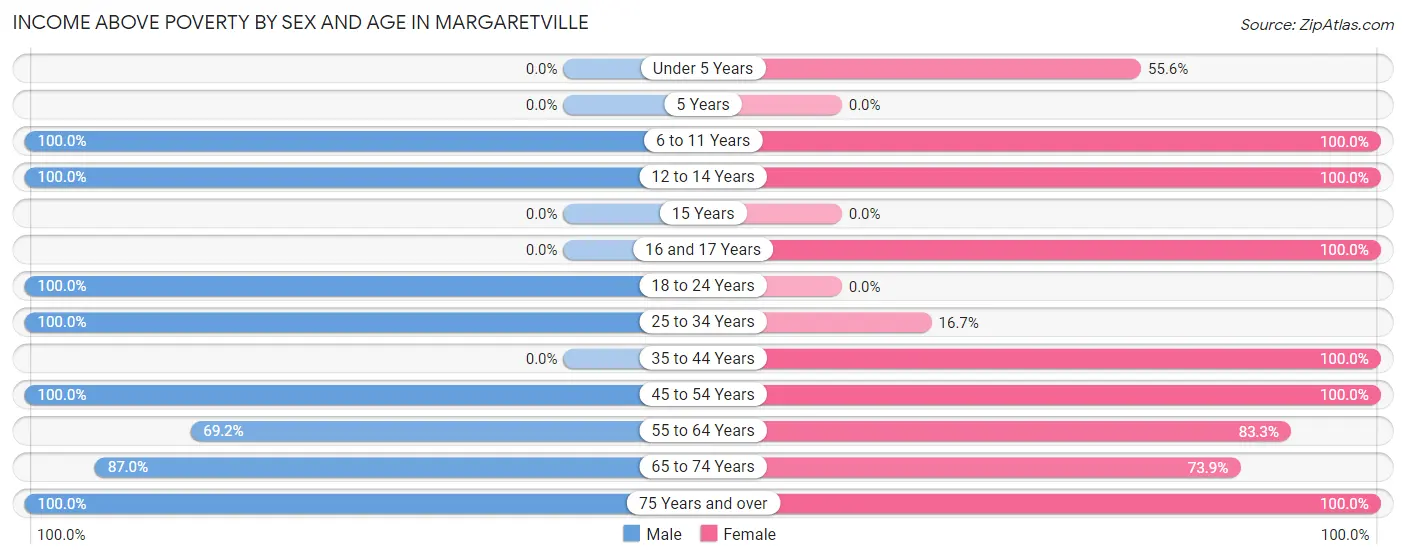
| Age Bracket | Male | Female |
| Under 5 Years | 0 (0.0%) | 10 (55.6%) |
| 5 Years | 0 (0.0%) | 0 (0.0%) |
| 6 to 11 Years | 22 (100.0%) | 12 (100.0%) |
| 12 to 14 Years | 20 (100.0%) | 13 (100.0%) |
| 15 Years | 0 (0.0%) | 0 (0.0%) |
| 16 and 17 Years | 0 (0.0%) | 8 (100.0%) |
| 18 to 24 Years | 66 (100.0%) | 0 (0.0%) |
| 25 to 34 Years | 24 (100.0%) | 5 (16.7%) |
| 35 to 44 Years | 0 (0.0%) | 12 (100.0%) |
| 45 to 54 Years | 26 (100.0%) | 50 (100.0%) |
| 55 to 64 Years | 36 (69.2%) | 40 (83.3%) |
| 65 to 74 Years | 60 (87.0%) | 17 (73.9%) |
| 75 Years and over | 27 (100.0%) | 39 (100.0%) |
| Total | 281 (84.9%) | 206 (81.4%) |
Income Below Poverty Among Married-Couple Families in Margaretville
The poverty statistics for married-couple families in Margaretville show that 8.3% or 8 of the total 97 families live below the poverty line. Families with no children have the highest poverty rate of 15.4%, comprising of 8 families. On the other hand, families with 1 or 2 children have the lowest poverty rate of 0.0%, which includes 0 families.
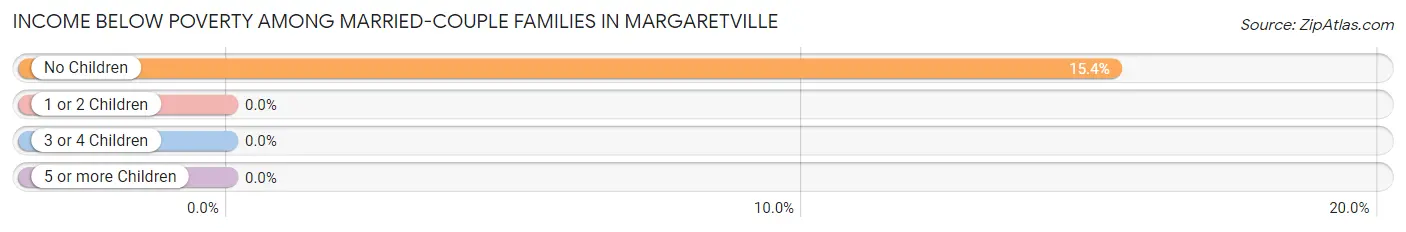
| Children | Above Poverty | Below Poverty |
| No Children | 44 (84.6%) | 8 (15.4%) |
| 1 or 2 Children | 12 (100.0%) | 0 (0.0%) |
| 3 or 4 Children | 33 (100.0%) | 0 (0.0%) |
| 5 or more Children | 0 (0.0%) | 0 (0.0%) |
| Total | 89 (91.7%) | 8 (8.3%) |
Income Below Poverty Among Single-Parent Households in Margaretville
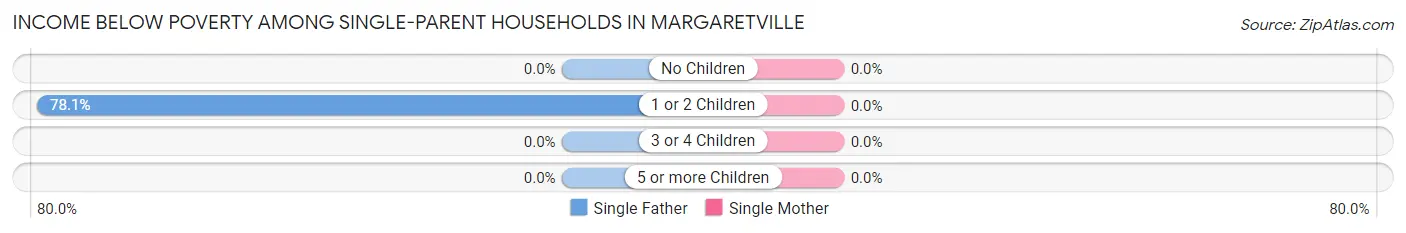
| Children | Single Father | Single Mother |
| No Children | 0 (0.0%) | 0 (0.0%) |
| 1 or 2 Children | 25 (78.1%) | 0 (0.0%) |
| 3 or 4 Children | 0 (0.0%) | 0 (0.0%) |
| 5 or more Children | 0 (0.0%) | 0 (0.0%) |
| Total | 25 (78.1%) | 0 (0.0%) |
Income Below Poverty Among Married-Couple vs Single-Parent Households in Margaretville
The poverty data for Margaretville shows that 8 of the married-couple family households (8.3%) and 25 of the single-parent households (65.8%) are living below the poverty level. Within the married-couple family households, those with no children have the highest poverty rate, with 8 households (15.4%) falling below the poverty line. Among the single-parent households, those with 1 or 2 children have the highest poverty rate, with 25 household (78.1%) living below poverty.
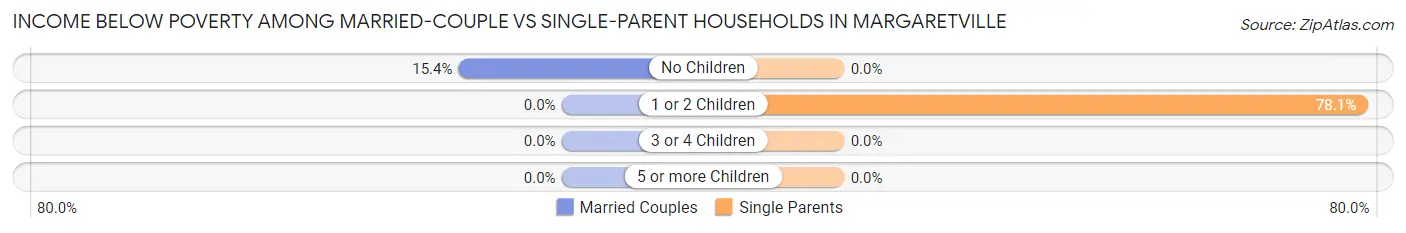
| Children | Married-Couple Families | Single-Parent Households |
| No Children | 8 (15.4%) | 0 (0.0%) |
| 1 or 2 Children | 0 (0.0%) | 25 (78.1%) |
| 3 or 4 Children | 0 (0.0%) | 0 (0.0%) |
| 5 or more Children | 0 (0.0%) | 0 (0.0%) |
| Total | 8 (8.3%) | 25 (65.8%) |
Race in Margaretville
The most populous races in Margaretville are White / Caucasian (435 | 66.3%), Hispanic or Latino (235 | 35.8%), and Two or more Races (136 | 20.7%).
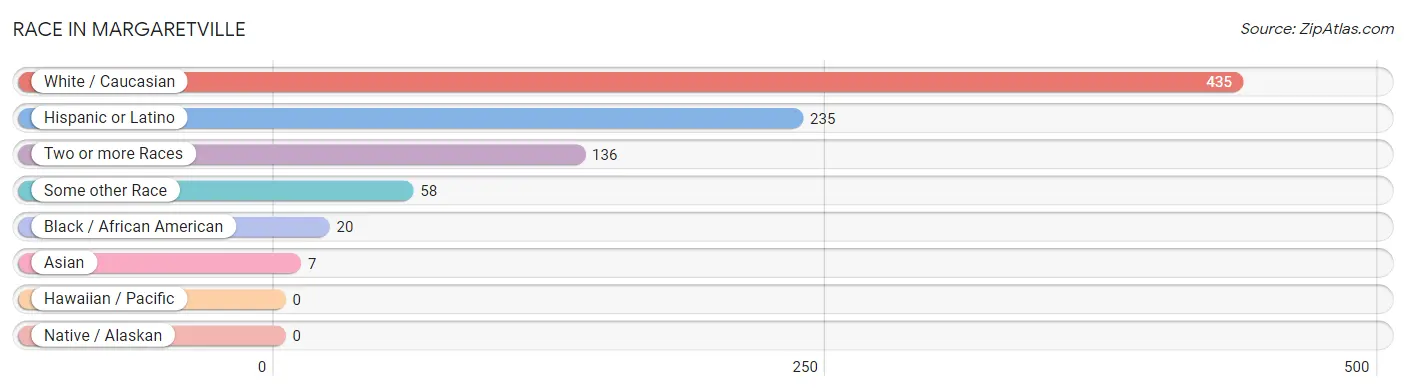
| Race | # Population | % Population |
| Asian | 7 | 1.1% |
| Black / African American | 20 | 3.0% |
| Hawaiian / Pacific | 0 | 0.0% |
| Hispanic or Latino | 235 | 35.8% |
| Native / Alaskan | 0 | 0.0% |
| White / Caucasian | 435 | 66.3% |
| Two or more Races | 136 | 20.7% |
| Some other Race | 58 | 8.8% |
| Total | 656 | 100.0% |
Ancestry in Margaretville
The most populous ancestries reported in Margaretville are German (147 | 22.4%), Spaniard (136 | 20.7%), American (122 | 18.6%), Irish (105 | 16.0%), and English (72 | 11.0%), together accounting for 88.7% of all Margaretville residents.
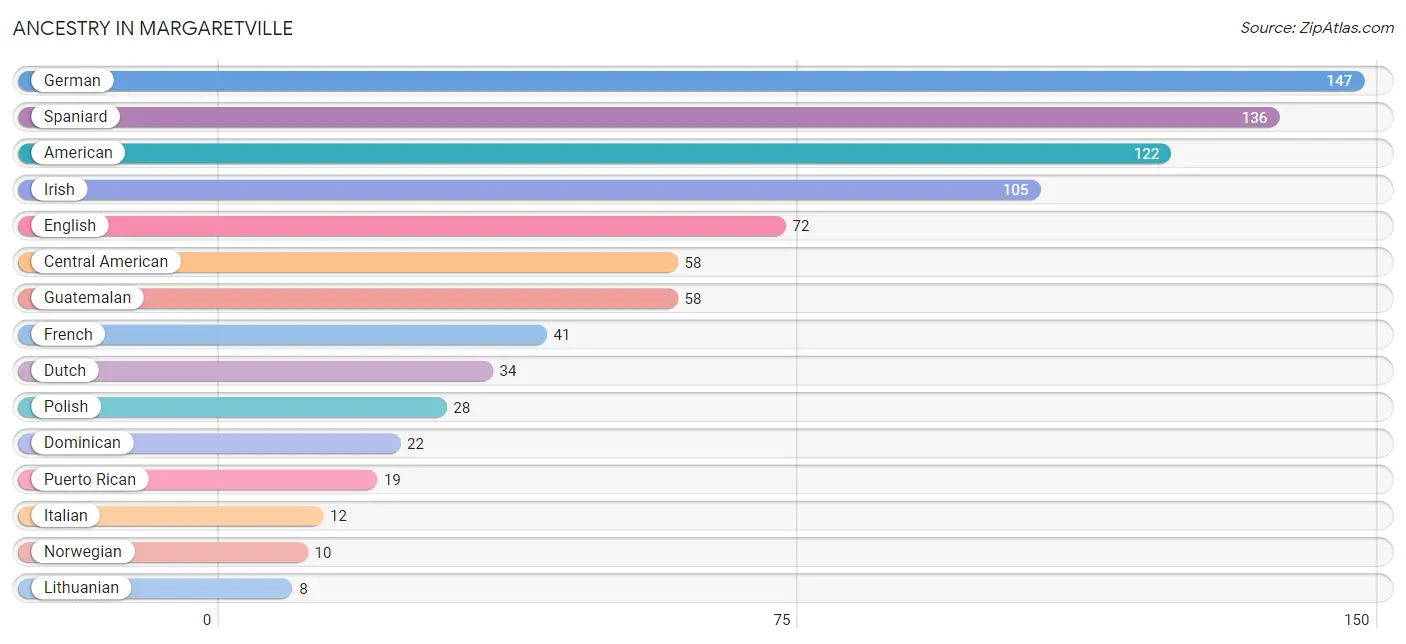
| Ancestry | # Population | % Population |
| American | 122 | 18.6% |
| Austrian | 3 | 0.5% |
| British | 6 | 0.9% |
| Burmese | 7 | 1.1% |
| Central American | 58 | 8.8% |
| Dominican | 22 | 3.4% |
| Dutch | 34 | 5.2% |
| Eastern European | 3 | 0.5% |
| English | 72 | 11.0% |
| French | 41 | 6.2% |
| French Canadian | 5 | 0.8% |
| German | 147 | 22.4% |
| Guatemalan | 58 | 8.8% |
| Irish | 105 | 16.0% |
| Italian | 12 | 1.8% |
| Lithuanian | 8 | 1.2% |
| Norwegian | 10 | 1.5% |
| Polish | 28 | 4.3% |
| Puerto Rican | 19 | 2.9% |
| Russian | 6 | 0.9% |
| Scottish | 8 | 1.2% |
| Spaniard | 136 | 20.7% |
| Swedish | 7 | 1.1% |
| Ukrainian | 8 | 1.2% | View All 24 Rows |
Immigrants in Margaretville
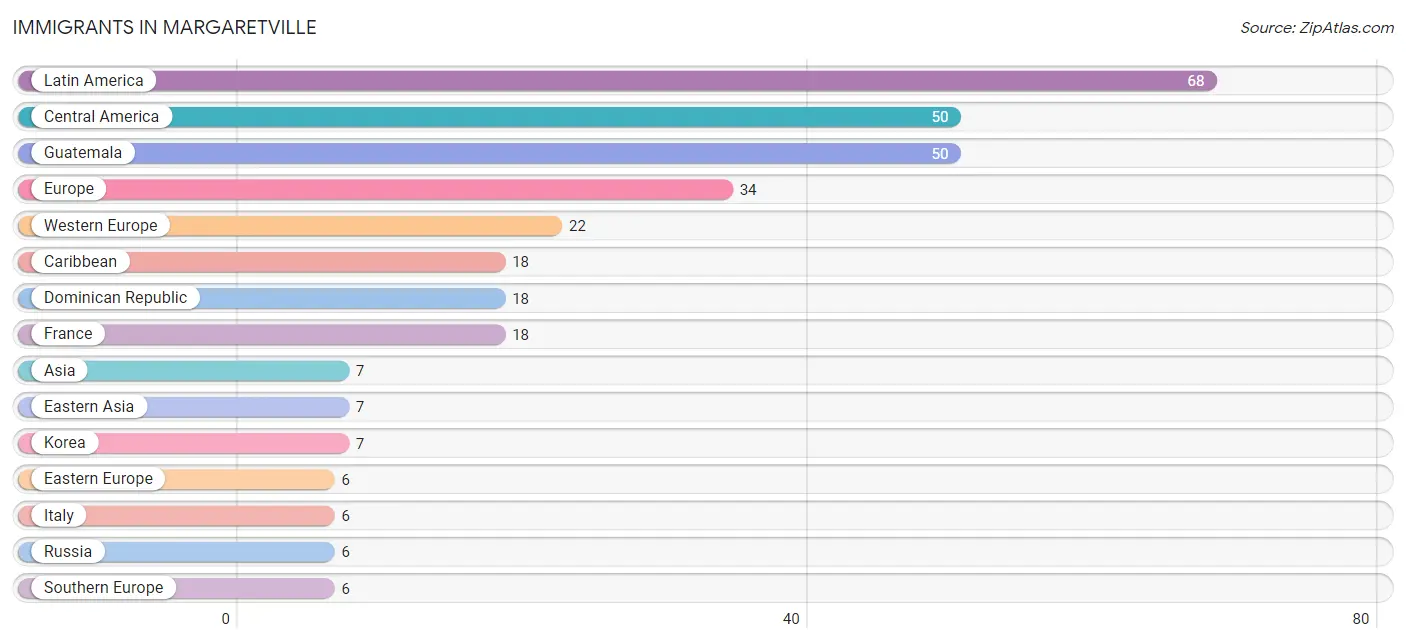
The most numerous immigrant groups reported in Margaretville came from Latin America (68 | 10.4%), Central America (50 | 7.6%), Guatemala (50 | 7.6%), Europe (34 | 5.2%), and Western Europe (22 | 3.4%), together accounting for 34.1% of all Margaretville residents.
| Immigration Origin | # Population | % Population |
| Asia | 7 | 1.1% |
| Caribbean | 18 | 2.7% |
| Central America | 50 | 7.6% |
| Dominican Republic | 18 | 2.7% |
| Eastern Asia | 7 | 1.1% |
| Eastern Europe | 6 | 0.9% |
| Europe | 34 | 5.2% |
| France | 18 | 2.7% |
| Germany | 4 | 0.6% |
| Guatemala | 50 | 7.6% |
| Italy | 6 | 0.9% |
| Korea | 7 | 1.1% |
| Latin America | 68 | 10.4% |
| Russia | 6 | 0.9% |
| Southern Europe | 6 | 0.9% |
| Western Europe | 22 | 3.4% | View All 16 Rows |
Sex and Age in Margaretville
Sex and Age in Margaretville
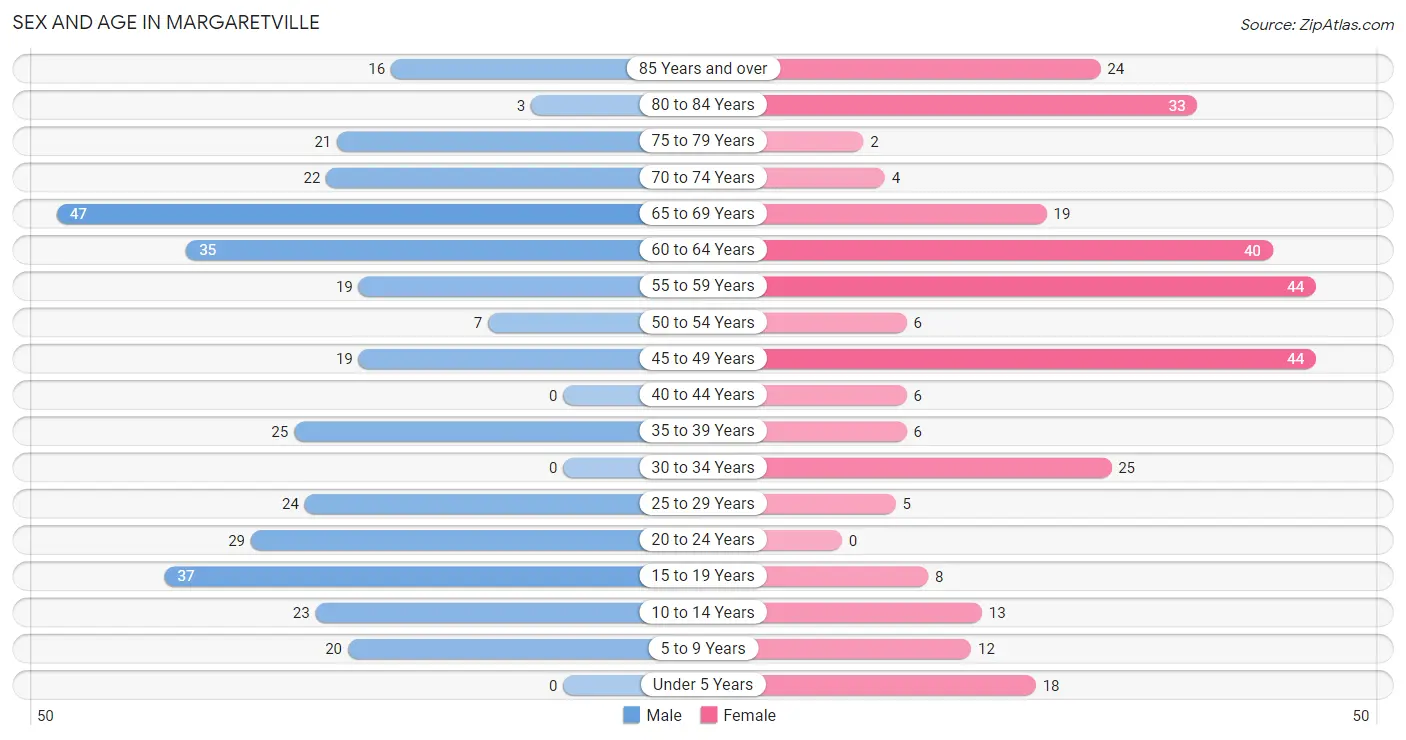
The most populous age groups in Margaretville are 65 to 69 Years (47 | 13.5%) for men and 45 to 49 Years (44 | 14.2%) for women.
| Age Bracket | Male | Female |
| Under 5 Years | 0 (0.0%) | 18 (5.8%) |
| 5 to 9 Years | 20 (5.8%) | 12 (3.9%) |
| 10 to 14 Years | 23 (6.6%) | 13 (4.2%) |
| 15 to 19 Years | 37 (10.7%) | 8 (2.6%) |
| 20 to 24 Years | 29 (8.4%) | 0 (0.0%) |
| 25 to 29 Years | 24 (6.9%) | 5 (1.6%) |
| 30 to 34 Years | 0 (0.0%) | 25 (8.1%) |
| 35 to 39 Years | 25 (7.2%) | 6 (1.9%) |
| 40 to 44 Years | 0 (0.0%) | 6 (1.9%) |
| 45 to 49 Years | 19 (5.5%) | 44 (14.2%) |
| 50 to 54 Years | 7 (2.0%) | 6 (1.9%) |
| 55 to 59 Years | 19 (5.5%) | 44 (14.2%) |
| 60 to 64 Years | 35 (10.1%) | 40 (12.9%) |
| 65 to 69 Years | 47 (13.5%) | 19 (6.1%) |
| 70 to 74 Years | 22 (6.3%) | 4 (1.3%) |
| 75 to 79 Years | 21 (6.0%) | 2 (0.6%) |
| 80 to 84 Years | 3 (0.9%) | 33 (10.7%) |
| 85 Years and over | 16 (4.6%) | 24 (7.8%) |
| Total | 347 (100.0%) | 309 (100.0%) |
Families and Households in Margaretville
Median Family Size in Margaretville
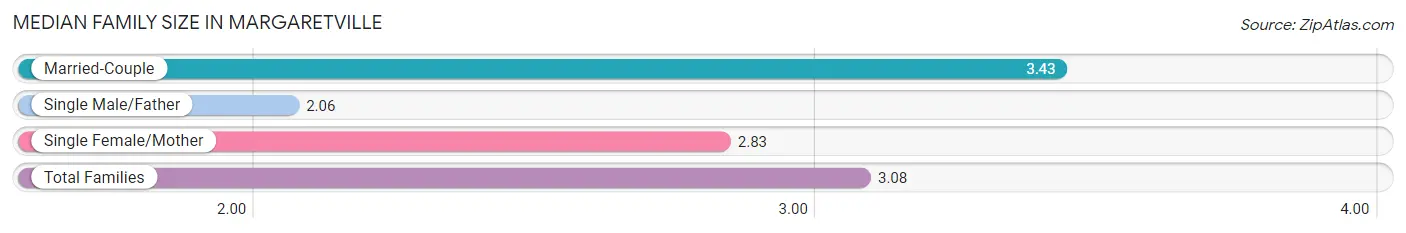
The median family size in Margaretville is 3.08 persons per family, with married-couple families (97 | 71.9%) accounting for the largest median family size of 3.43 persons per family. On the other hand, single male/father families (32 | 23.7%) represent the smallest median family size with 2.06 persons per family.
| Family Type | # Families | Family Size |
| Married-Couple | 97 (71.9%) | 3.43 |
| Single Male/Father | 32 (23.7%) | 2.06 |
| Single Female/Mother | 6 (4.4%) | 2.83 |
| Total Families | 135 (100.0%) | 3.08 |
Median Household Size in Margaretville
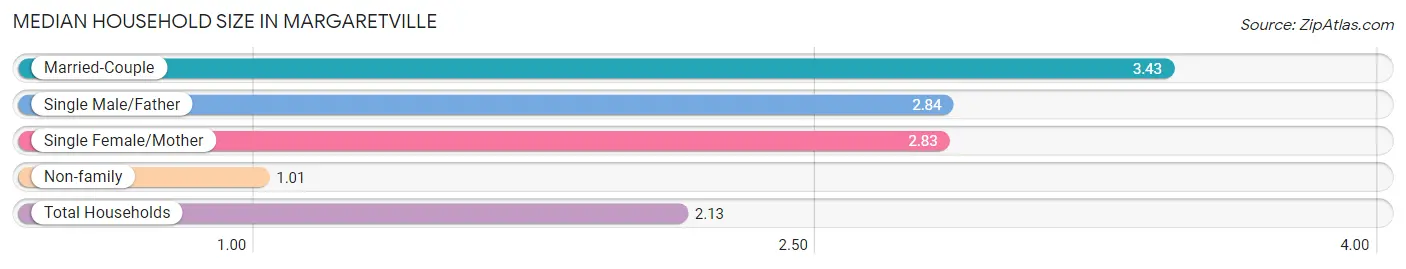
The median household size in Margaretville is 2.13 persons per household, with married-couple households (97 | 35.7%) accounting for the largest median household size of 3.43 persons per household. non-family households (137 | 50.4%) represent the smallest median household size with 1.01 persons per household.
| Household Type | # Households | Household Size |
| Married-Couple | 97 (35.7%) | 3.43 |
| Single Male/Father | 32 (11.8%) | 2.84 |
| Single Female/Mother | 6 (2.2%) | 2.83 |
| Non-family | 137 (50.4%) | 1.01 |
| Total Households | 272 (100.0%) | 2.13 |
Household Size by Marriage Status in Margaretville
Out of a total of 272 households in Margaretville, 135 (49.6%) are family households, while 137 (50.4%) are nonfamily households. The most numerous type of family households are 2-person households, comprising 58, and the most common type of nonfamily households are 1-person households, comprising 135.
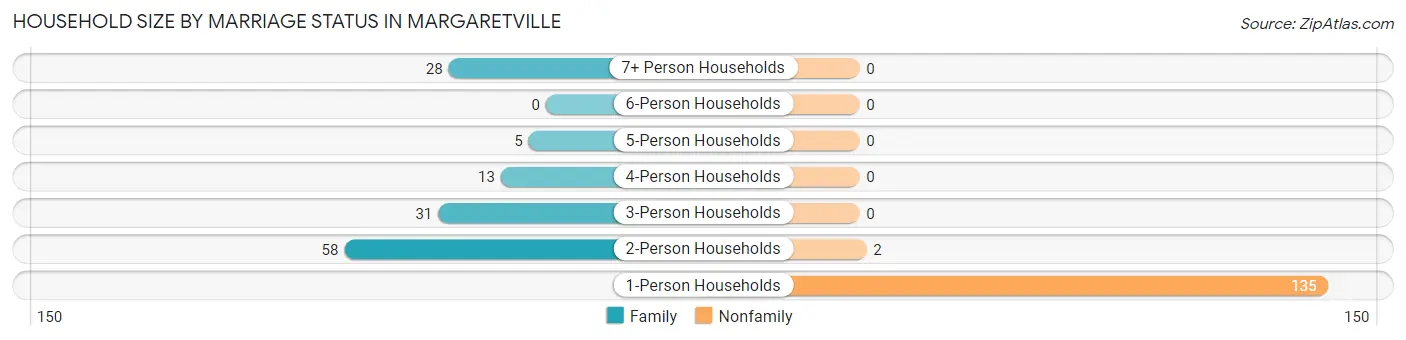
| Household Size | Family Households | Nonfamily Households |
| 1-Person Households | - | 135 (49.6%) |
| 2-Person Households | 58 (21.3%) | 2 (0.7%) |
| 3-Person Households | 31 (11.4%) | 0 (0.0%) |
| 4-Person Households | 13 (4.8%) | 0 (0.0%) |
| 5-Person Households | 5 (1.8%) | 0 (0.0%) |
| 6-Person Households | 0 (0.0%) | 0 (0.0%) |
| 7+ Person Households | 28 (10.3%) | 0 (0.0%) |
| Total | 135 (49.6%) | 137 (50.4%) |
Female Fertility in Margaretville
Fertility by Age in Margaretville
| Age Bracket | Women with Births | Births / 1,000 Women |
| 15 to 19 years | 0 (0.0%) | 0.0 |
| 20 to 34 years | 0 (0.0%) | 0.0 |
| 35 to 50 years | 0 (0.0%) | 0.0 |
| Total | 0 (0.0%) | 0.0 |
Fertility by Age by Marriage Status in Margaretville
| Age Bracket | Married | Unmarried |
| 15 to 19 years | 0 (0.0%) | 0 (0.0%) |
| 20 to 34 years | 0 (0.0%) | 0 (0.0%) |
| 35 to 50 years | 0 (0.0%) | 0 (0.0%) |
| Total | 0 (0.0%) | 0 (0.0%) |
Fertility by Education in Margaretville
| Educational Attainment | Women with Births | Births / 1,000 Women |
| Less than High School | 0 (0.0%) | 0.0 |
| High School Diploma | 0 (0.0%) | 0.0 |
| College or Associate's Degree | 0 (0.0%) | 0.0 |
| Bachelor's Degree | 0 (0.0%) | 0.0 |
| Graduate Degree | 0 (0.0%) | 0.0 |
| Total | 0 (0.0%) | 0.0 |
Fertility by Education by Marriage Status in Margaretville
| Educational Attainment | Married | Unmarried |
| Less than High School | 0 (0.0%) | 0 (0.0%) |
| High School Diploma | 0 (0.0%) | 0 (0.0%) |
| College or Associate's Degree | 0 (0.0%) | 0 (0.0%) |
| Bachelor's Degree | 0 (0.0%) | 0 (0.0%) |
| Graduate Degree | 0 (0.0%) | 0 (0.0%) |
| Total | 0 (0.0%) | 0 (0.0%) |
Employment Characteristics in Margaretville
Employment by Class of Employer in Margaretville
Among the 178 employed individuals in Margaretville, private company employees (107 | 60.1%), not-for-profit organizations (46 | 25.8%), and local government employees (17 | 9.6%) make up the most common classes of employment.
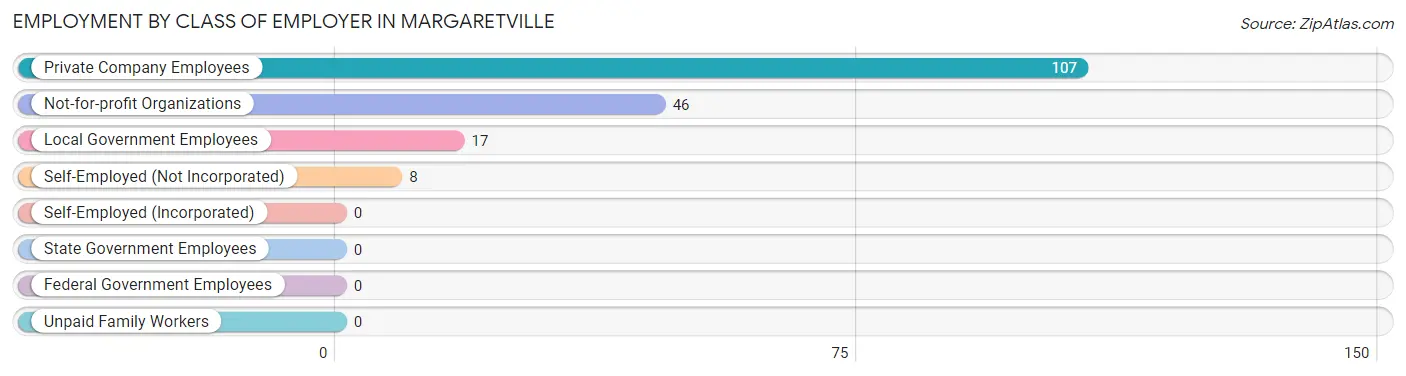
| Employer Class | # Employees | % Employees |
| Private Company Employees | 107 | 60.1% |
| Self-Employed (Incorporated) | 0 | 0.0% |
| Self-Employed (Not Incorporated) | 8 | 4.5% |
| Not-for-profit Organizations | 46 | 25.8% |
| Local Government Employees | 17 | 9.6% |
| State Government Employees | 0 | 0.0% |
| Federal Government Employees | 0 | 0.0% |
| Unpaid Family Workers | 0 | 0.0% |
| Total | 178 | 100.0% |
Employment Status by Age in Margaretville
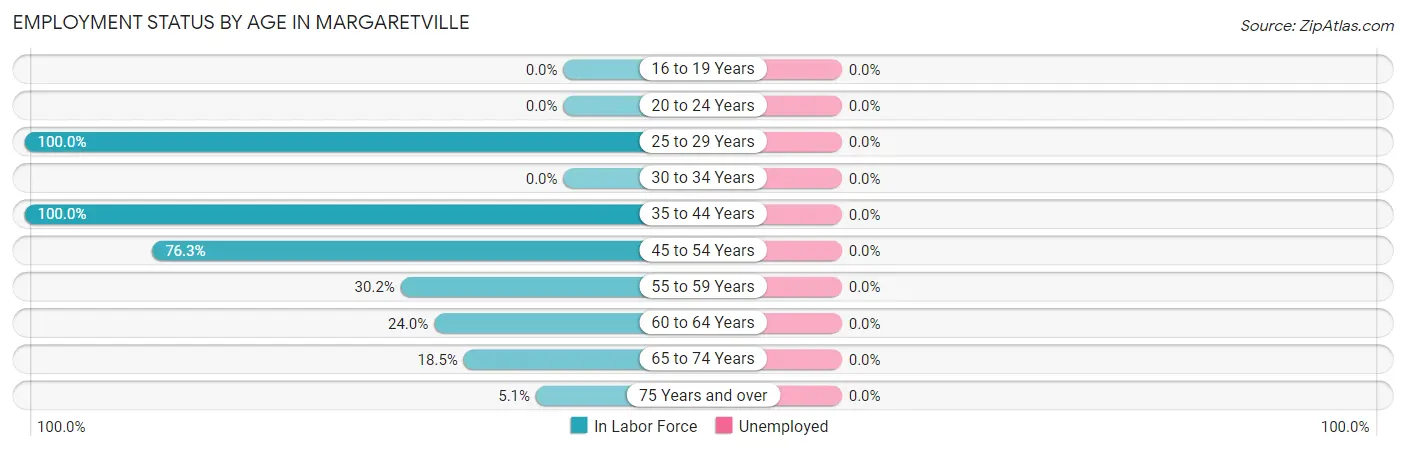
| Age Bracket | In Labor Force | Unemployed |
| 16 to 19 Years | 0 (0.0%) | 0 (0.0%) |
| 20 to 24 Years | 0 (0.0%) | 0 (0.0%) |
| 25 to 29 Years | 29 (100.0%) | 0 (0.0%) |
| 30 to 34 Years | 0 (0.0%) | 0 (0.0%) |
| 35 to 44 Years | 37 (100.0%) | 0 (0.0%) |
| 45 to 54 Years | 58 (76.3%) | 0 (0.0%) |
| 55 to 59 Years | 19 (30.2%) | 0 (0.0%) |
| 60 to 64 Years | 18 (24.0%) | 0 (0.0%) |
| 65 to 74 Years | 17 (18.5%) | 0 (0.0%) |
| 75 Years and over | 5 (5.1%) | 0 (0.0%) |
| Total | 183 (32.1%) | 0 (0.0%) |
Employment Status by Educational Attainment in Margaretville
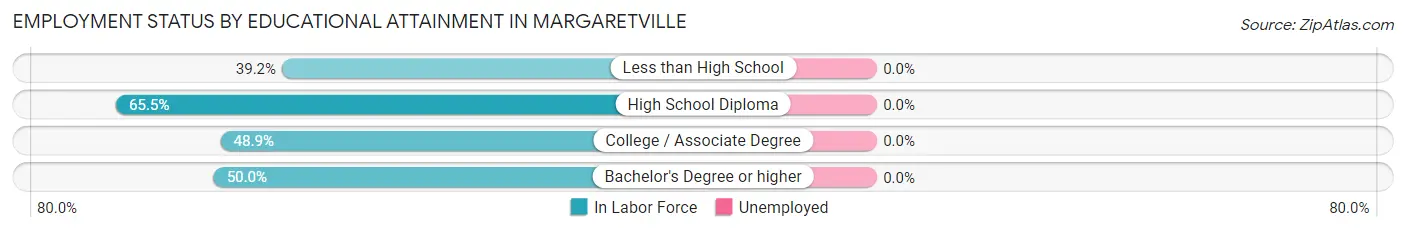
| Educational Attainment | In Labor Force | Unemployed |
| Less than High School | 31 (39.2%) | 0 (0.0%) |
| High School Diploma | 76 (65.5%) | 0 (0.0%) |
| College / Associate Degree | 46 (48.9%) | 0 (0.0%) |
| Bachelor's Degree or higher | 8 (50.0%) | 0 (0.0%) |
| Total | 161 (52.8%) | 0 (0.0%) |
Employment Occupations by Sex in Margaretville
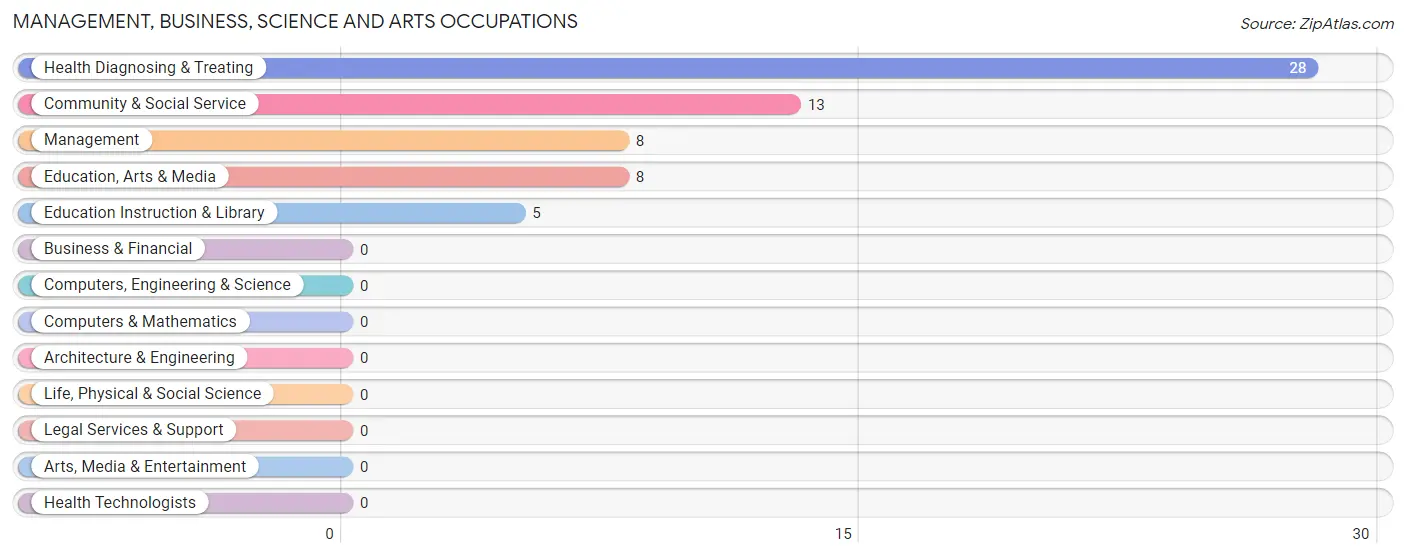
Management, Business, Science and Arts Occupations
The most common Management, Business, Science and Arts occupations in Margaretville are Health Diagnosing & Treating (28 | 15.3%), Community & Social Service (13 | 7.1%), Management (8 | 4.4%), Education, Arts & Media (8 | 4.4%), and Education Instruction & Library (5 | 2.7%).
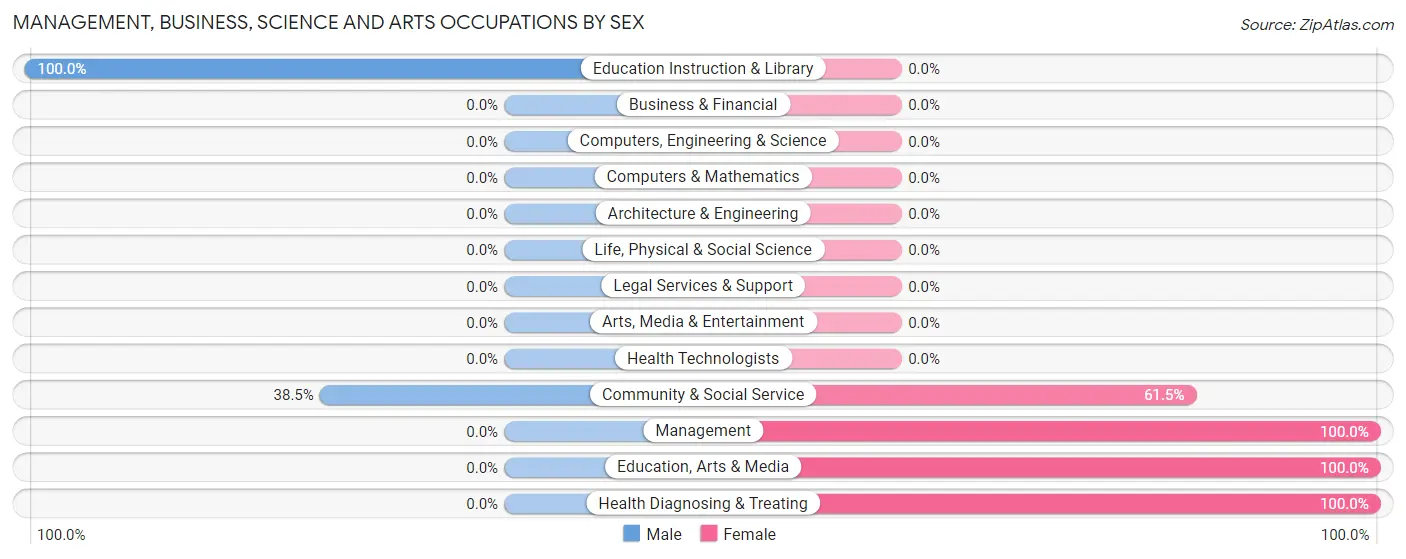
Management, Business, Science and Arts Occupations by Sex
Within the Management, Business, Science and Arts occupations in Margaretville, the most male-oriented occupations are Education Instruction & Library (100.0%), and Community & Social Service (38.5%), while the most female-oriented occupations are Management (100.0%), Education, Arts & Media (100.0%), and Health Diagnosing & Treating (100.0%).
| Occupation | Male | Female |
| Management | 0 (0.0%) | 8 (100.0%) |
| Business & Financial | 0 (0.0%) | 0 (0.0%) |
| Computers, Engineering & Science | 0 (0.0%) | 0 (0.0%) |
| Computers & Mathematics | 0 (0.0%) | 0 (0.0%) |
| Architecture & Engineering | 0 (0.0%) | 0 (0.0%) |
| Life, Physical & Social Science | 0 (0.0%) | 0 (0.0%) |
| Community & Social Service | 5 (38.5%) | 8 (61.5%) |
| Education, Arts & Media | 0 (0.0%) | 8 (100.0%) |
| Legal Services & Support | 0 (0.0%) | 0 (0.0%) |
| Education Instruction & Library | 5 (100.0%) | 0 (0.0%) |
| Arts, Media & Entertainment | 0 (0.0%) | 0 (0.0%) |
| Health Diagnosing & Treating | 0 (0.0%) | 28 (100.0%) |
| Health Technologists | 0 (0.0%) | 0 (0.0%) |
| Total (Category) | 5 (10.2%) | 44 (89.8%) |
| Total (Overall) | 110 (60.1%) | 73 (39.9%) |
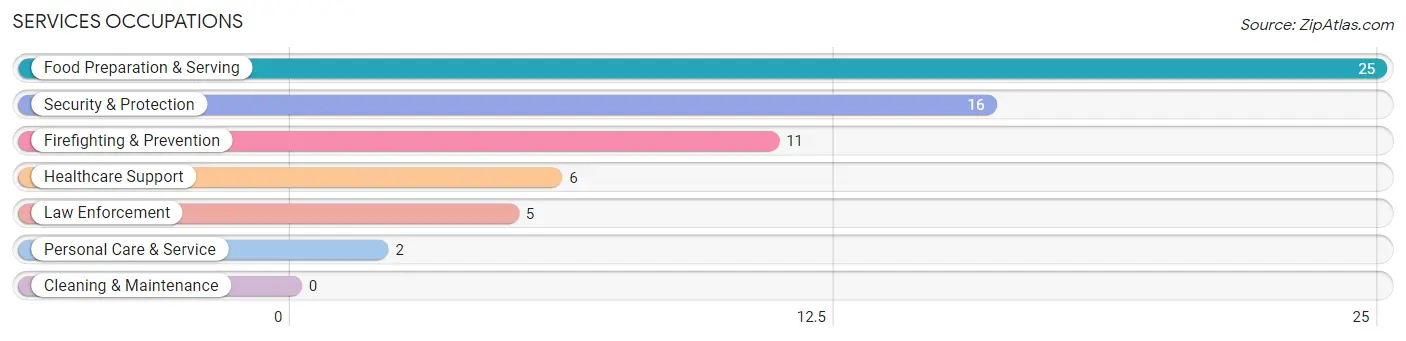
Services Occupations
The most common Services occupations in Margaretville are Food Preparation & Serving (25 | 13.7%), Security & Protection (16 | 8.7%), Firefighting & Prevention (11 | 6.0%), Healthcare Support (6 | 3.3%), and Law Enforcement (5 | 2.7%).
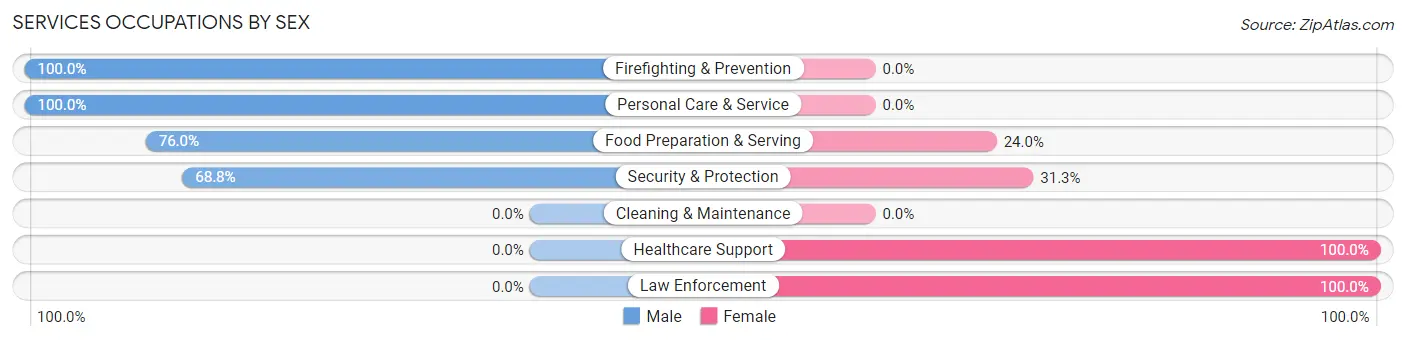
Services Occupations by Sex
Within the Services occupations in Margaretville, the most male-oriented occupations are Firefighting & Prevention (100.0%), Personal Care & Service (100.0%), and Food Preparation & Serving (76.0%), while the most female-oriented occupations are Healthcare Support (100.0%), Law Enforcement (100.0%), and Security & Protection (31.2%).
| Occupation | Male | Female |
| Healthcare Support | 0 (0.0%) | 6 (100.0%) |
| Security & Protection | 11 (68.8%) | 5 (31.2%) |
| Firefighting & Prevention | 11 (100.0%) | 0 (0.0%) |
| Law Enforcement | 0 (0.0%) | 5 (100.0%) |
| Food Preparation & Serving | 19 (76.0%) | 6 (24.0%) |
| Cleaning & Maintenance | 0 (0.0%) | 0 (0.0%) |
| Personal Care & Service | 2 (100.0%) | 0 (0.0%) |
| Total (Category) | 32 (65.3%) | 17 (34.7%) |
| Total (Overall) | 110 (60.1%) | 73 (39.9%) |
Sales and Office Occupations
The most common Sales and Office occupations in Margaretville are Office & Administration (23 | 12.6%), and Sales & Related (8 | 4.4%).
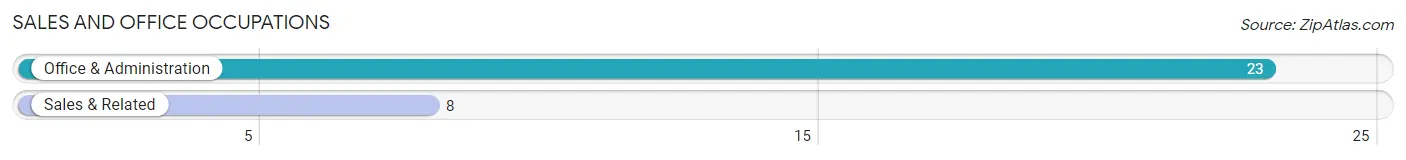
Sales and Office Occupations by Sex

| Occupation | Male | Female |
| Sales & Related | 0 (0.0%) | 8 (100.0%) |
| Office & Administration | 19 (82.6%) | 4 (17.4%) |
| Total (Category) | 19 (61.3%) | 12 (38.7%) |
| Total (Overall) | 110 (60.1%) | 73 (39.9%) |
Natural Resources, Construction and Maintenance Occupations
The most common Natural Resources, Construction and Maintenance occupations in Margaretville are Construction & Extraction (45 | 24.6%), and Installation, Maintenance & Repair (9 | 4.9%).
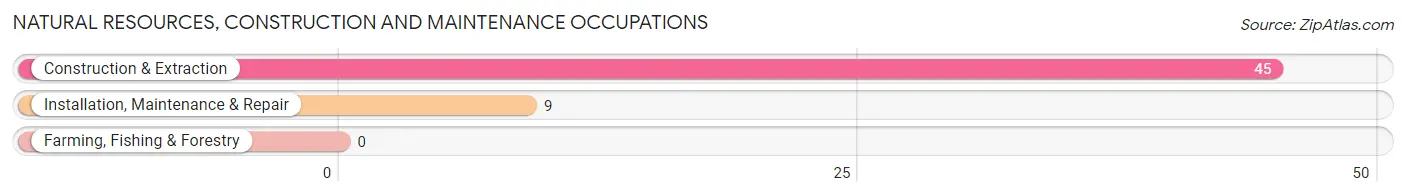
Natural Resources, Construction and Maintenance Occupations by Sex
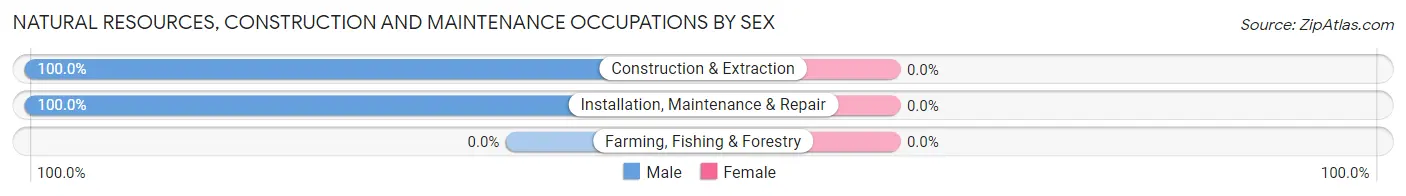
| Occupation | Male | Female |
| Farming, Fishing & Forestry | 0 (0.0%) | 0 (0.0%) |
| Construction & Extraction | 45 (100.0%) | 0 (0.0%) |
| Installation, Maintenance & Repair | 9 (100.0%) | 0 (0.0%) |
| Total (Category) | 54 (100.0%) | 0 (0.0%) |
| Total (Overall) | 110 (60.1%) | 73 (39.9%) |
Production, Transportation and Moving Occupations
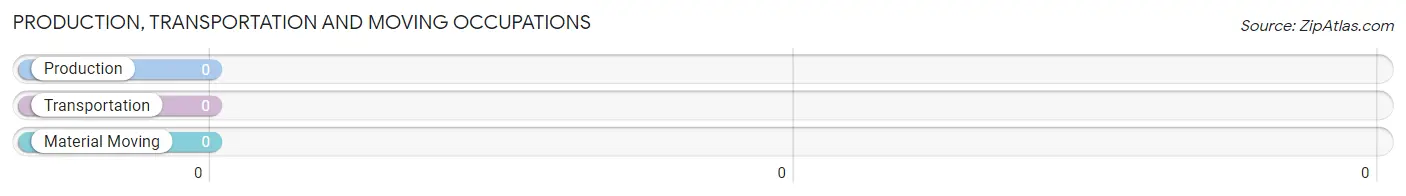
Production, Transportation and Moving Occupations by Sex
| Occupation | Male | Female |
| Production | 0 (0.0%) | 0 (0.0%) |
| Transportation | 0 (0.0%) | 0 (0.0%) |
| Material Moving | 0 (0.0%) | 0 (0.0%) |
| Total (Category) | 0 (0.0%) | 0 (0.0%) |
| Total (Overall) | 110 (60.1%) | 73 (39.9%) |
Employment Industries by Sex in Margaretville
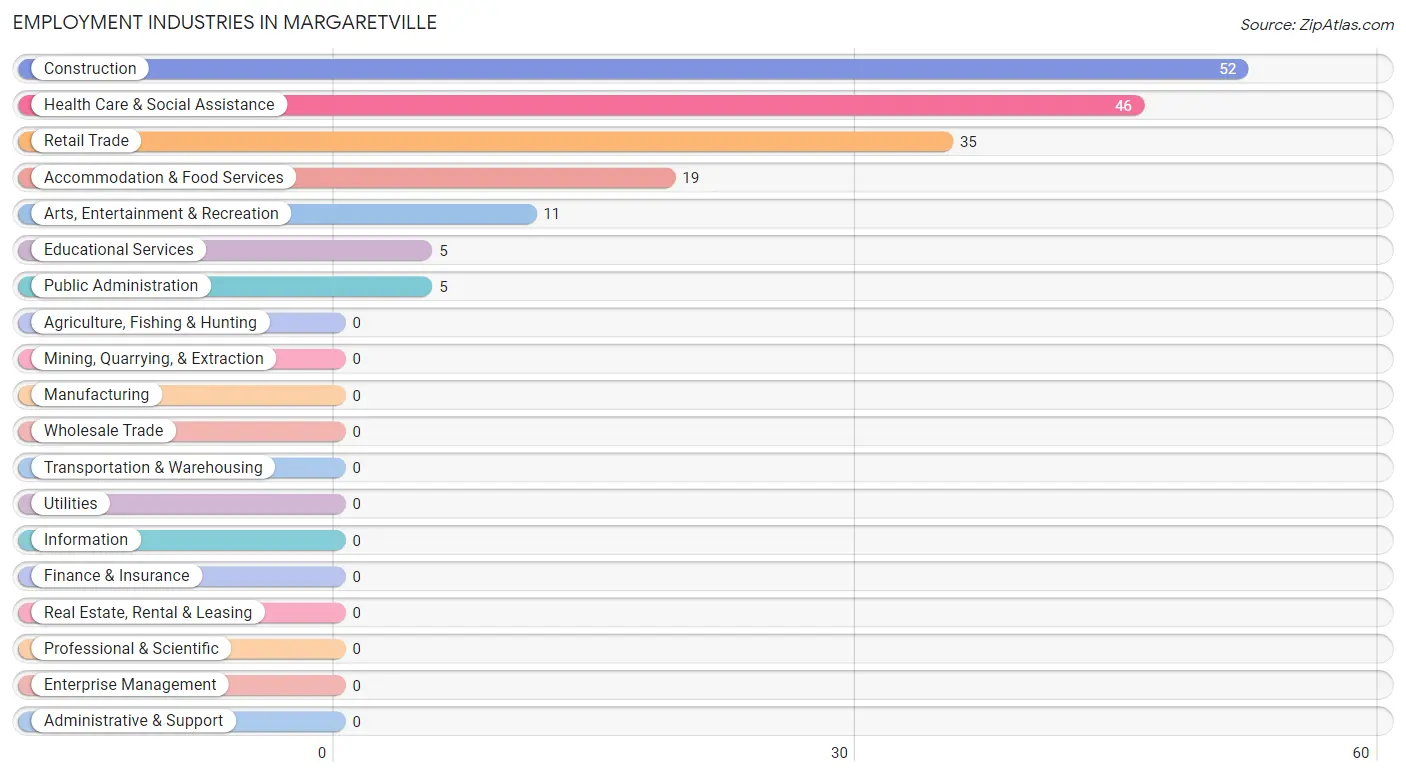
Employment Industries in Margaretville
The major employment industries in Margaretville include Construction (52 | 28.4%), Health Care & Social Assistance (46 | 25.1%), Retail Trade (35 | 19.1%), Accommodation & Food Services (19 | 10.4%), and Arts, Entertainment & Recreation (11 | 6.0%).
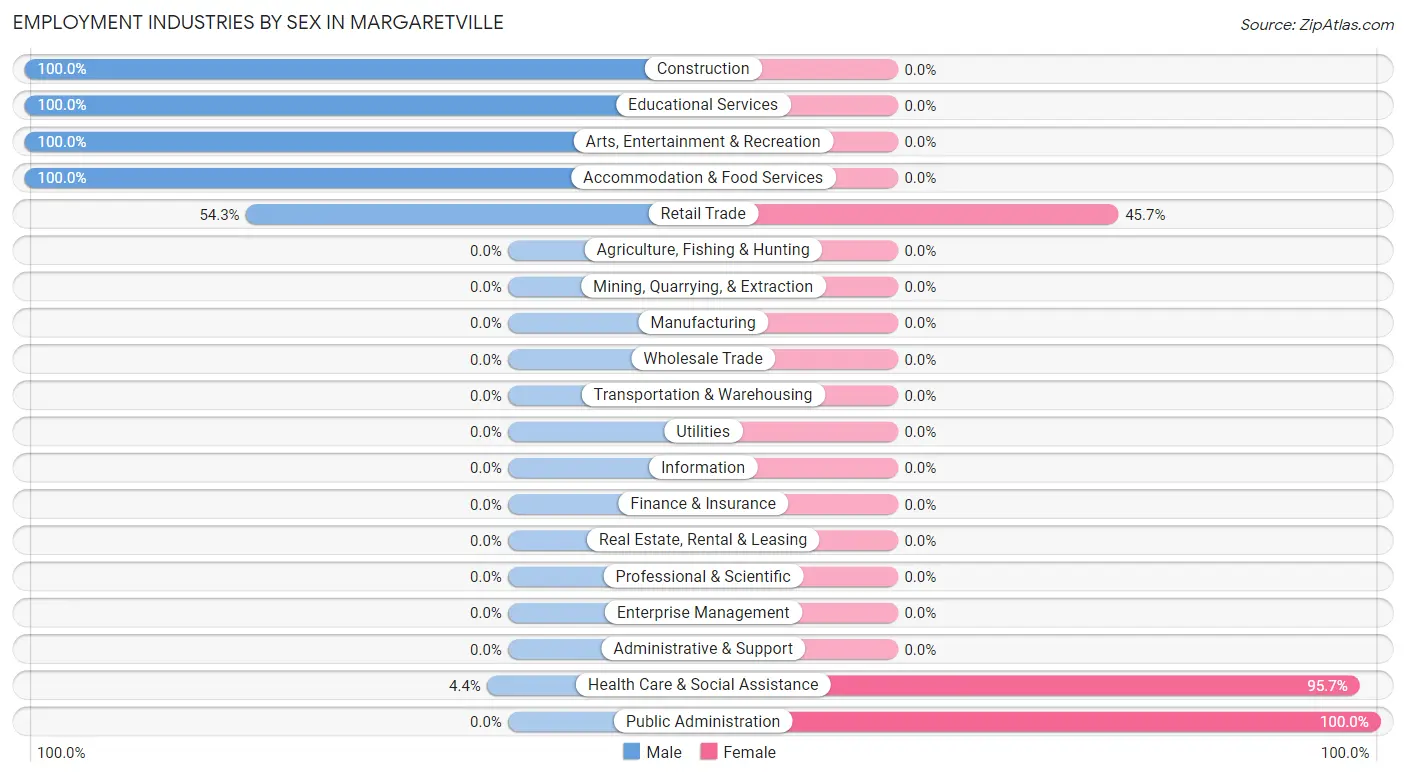
Employment Industries by Sex in Margaretville
The Margaretville industries that see more men than women are Construction (100.0%), Educational Services (100.0%), and Arts, Entertainment & Recreation (100.0%), whereas the industries that tend to have a higher number of women are Public Administration (100.0%), Health Care & Social Assistance (95.7%), and Retail Trade (45.7%).
| Industry | Male | Female |
| Agriculture, Fishing & Hunting | 0 (0.0%) | 0 (0.0%) |
| Mining, Quarrying, & Extraction | 0 (0.0%) | 0 (0.0%) |
| Construction | 52 (100.0%) | 0 (0.0%) |
| Manufacturing | 0 (0.0%) | 0 (0.0%) |
| Wholesale Trade | 0 (0.0%) | 0 (0.0%) |
| Retail Trade | 19 (54.3%) | 16 (45.7%) |
| Transportation & Warehousing | 0 (0.0%) | 0 (0.0%) |
| Utilities | 0 (0.0%) | 0 (0.0%) |
| Information | 0 (0.0%) | 0 (0.0%) |
| Finance & Insurance | 0 (0.0%) | 0 (0.0%) |
| Real Estate, Rental & Leasing | 0 (0.0%) | 0 (0.0%) |
| Professional & Scientific | 0 (0.0%) | 0 (0.0%) |
| Enterprise Management | 0 (0.0%) | 0 (0.0%) |
| Administrative & Support | 0 (0.0%) | 0 (0.0%) |
| Educational Services | 5 (100.0%) | 0 (0.0%) |
| Health Care & Social Assistance | 2 (4.3%) | 44 (95.7%) |
| Arts, Entertainment & Recreation | 11 (100.0%) | 0 (0.0%) |
| Accommodation & Food Services | 19 (100.0%) | 0 (0.0%) |
| Public Administration | 0 (0.0%) | 5 (100.0%) |
| Total | 110 (60.1%) | 73 (39.9%) |
Education in Margaretville
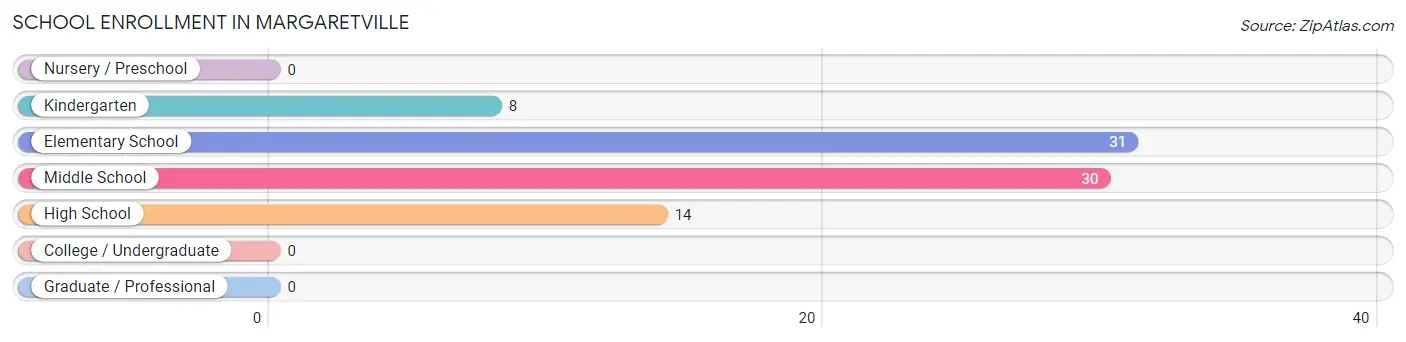
School Enrollment in Margaretville
The most common levels of schooling among the 83 students in Margaretville are elementary school (31 | 37.3%), middle school (30 | 36.1%), and high school (14 | 16.9%).
| School Level | # Students | % Students |
| Nursery / Preschool | 0 | 0.0% |
| Kindergarten | 8 | 9.6% |
| Elementary School | 31 | 37.3% |
| Middle School | 30 | 36.1% |
| High School | 14 | 16.9% |
| College / Undergraduate | 0 | 0.0% |
| Graduate / Professional | 0 | 0.0% |
| Total | 83 | 100.0% |
School Enrollment by Age by Funding Source in Margaretville
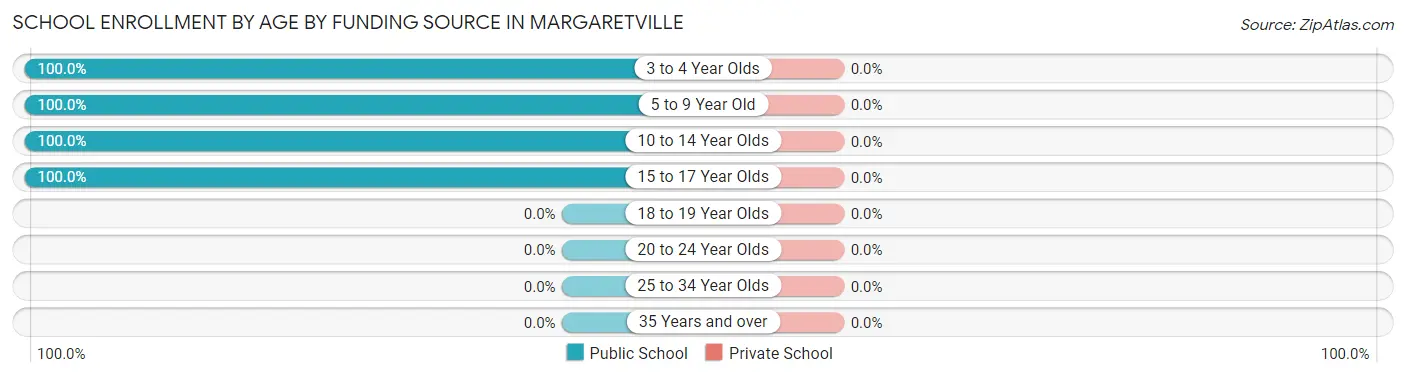
| Age Bracket | Public School | Private School |
| 3 to 4 Year Olds | 8 (100.0%) | 0 (0.0%) |
| 5 to 9 Year Old | 31 (100.0%) | 0 (0.0%) |
| 10 to 14 Year Olds | 36 (100.0%) | 0 (0.0%) |
| 15 to 17 Year Olds | 8 (100.0%) | 0 (0.0%) |
| 18 to 19 Year Olds | 0 (0.0%) | 0 (0.0%) |
| 20 to 24 Year Olds | 0 (0.0%) | 0 (0.0%) |
| 25 to 34 Year Olds | 0 (0.0%) | 0 (0.0%) |
| 35 Years and over | 0 (0.0%) | 0 (0.0%) |
| Total | 83 (100.0%) | 0 (0.0%) |
Educational Attainment by Field of Study in Margaretville
Engineering (14 | 25.0%), science & technology (14 | 25.0%), liberal arts & history (11 | 19.6%), physical & health sciences (6 | 10.7%), and business (6 | 10.7%) are the most common fields of study among 56 individuals in Margaretville who have obtained a bachelor's degree or higher.
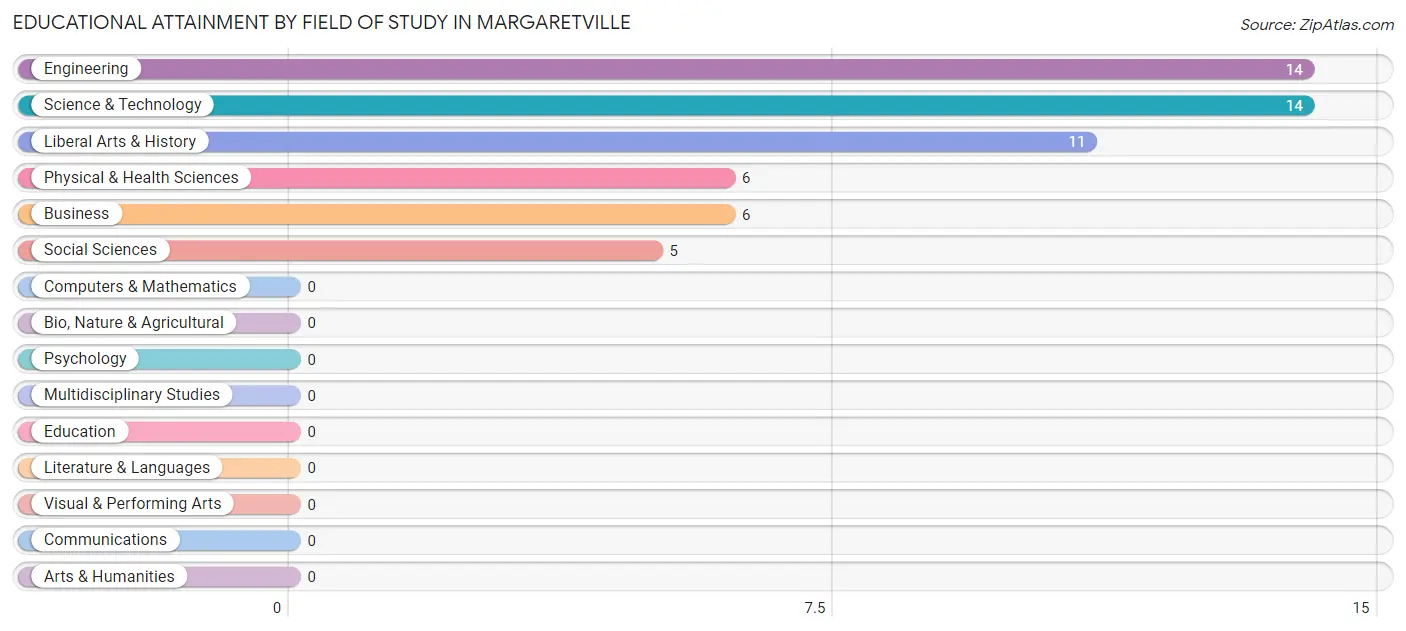
| Field of Study | # Graduates | % Graduates |
| Computers & Mathematics | 0 | 0.0% |
| Bio, Nature & Agricultural | 0 | 0.0% |
| Physical & Health Sciences | 6 | 10.7% |
| Psychology | 0 | 0.0% |
| Social Sciences | 5 | 8.9% |
| Engineering | 14 | 25.0% |
| Multidisciplinary Studies | 0 | 0.0% |
| Science & Technology | 14 | 25.0% |
| Business | 6 | 10.7% |
| Education | 0 | 0.0% |
| Literature & Languages | 0 | 0.0% |
| Liberal Arts & History | 11 | 19.6% |
| Visual & Performing Arts | 0 | 0.0% |
| Communications | 0 | 0.0% |
| Arts & Humanities | 0 | 0.0% |
| Total | 56 | 100.0% |
Transportation & Commute in Margaretville
Vehicle Availability by Sex in Margaretville
The most prevalent vehicle ownership categories in Margaretville are males with 2 vehicles (53, accounting for 50.5%) and females with 2 vehicles (15, making up 72.6%).
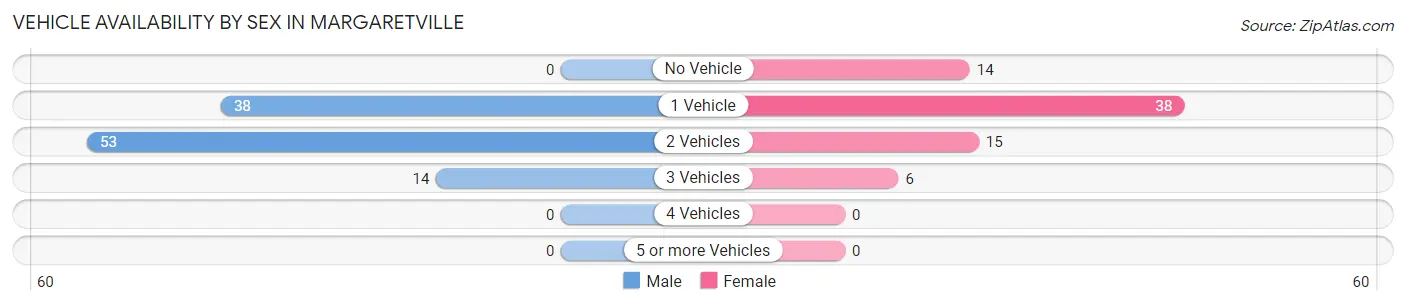
| Vehicles Available | Male | Female |
| No Vehicle | 0 (0.0%) | 14 (19.2%) |
| 1 Vehicle | 38 (36.2%) | 38 (52.0%) |
| 2 Vehicles | 53 (50.5%) | 15 (20.5%) |
| 3 Vehicles | 14 (13.3%) | 6 (8.2%) |
| 4 Vehicles | 0 (0.0%) | 0 (0.0%) |
| 5 or more Vehicles | 0 (0.0%) | 0 (0.0%) |
| Total | 105 (100.0%) | 73 (100.0%) |
Commute Time in Margaretville
The most frequently occuring commute durations in Margaretville are 10 to 14 minutes (42 commuters, 27.5%), 5 to 9 minutes (29 commuters, 19.0%), and less than 5 minutes (28 commuters, 18.3%).
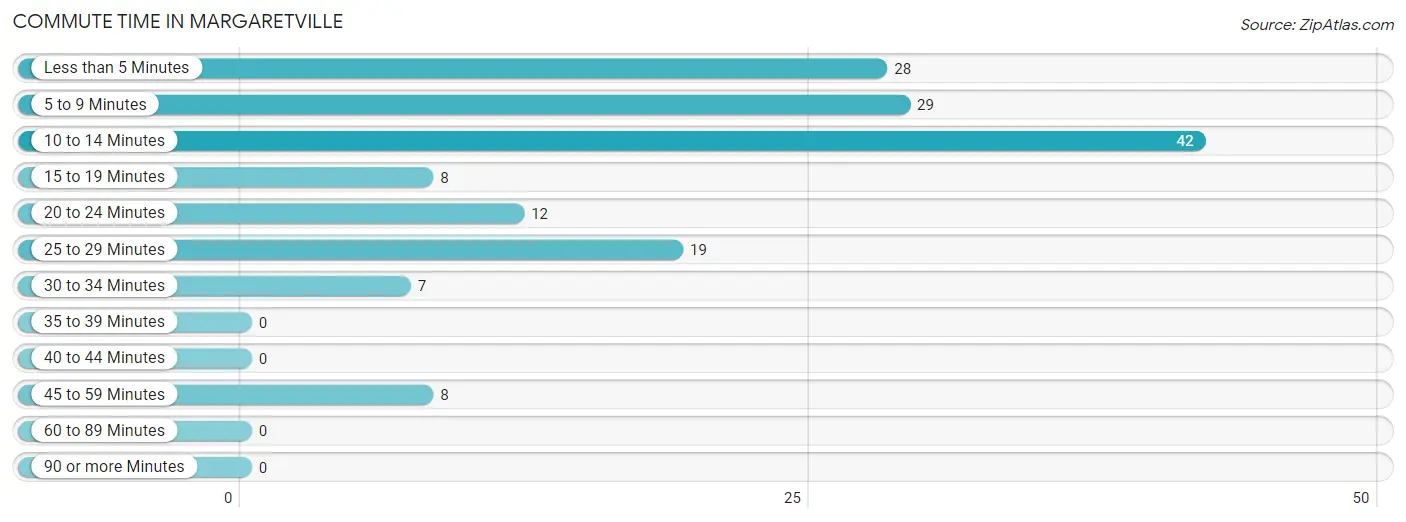
| Commute Time | # Commuters | % Commuters |
| Less than 5 Minutes | 28 | 18.3% |
| 5 to 9 Minutes | 29 | 19.0% |
| 10 to 14 Minutes | 42 | 27.5% |
| 15 to 19 Minutes | 8 | 5.2% |
| 20 to 24 Minutes | 12 | 7.8% |
| 25 to 29 Minutes | 19 | 12.4% |
| 30 to 34 Minutes | 7 | 4.6% |
| 35 to 39 Minutes | 0 | 0.0% |
| 40 to 44 Minutes | 0 | 0.0% |
| 45 to 59 Minutes | 8 | 5.2% |
| 60 to 89 Minutes | 0 | 0.0% |
| 90 or more Minutes | 0 | 0.0% |
Commute Time by Sex in Margaretville
The most common commute times in Margaretville are less than 5 minutes (26 commuters, 32.5%) for males and 10 to 14 minutes (42 commuters, 57.5%) for females.
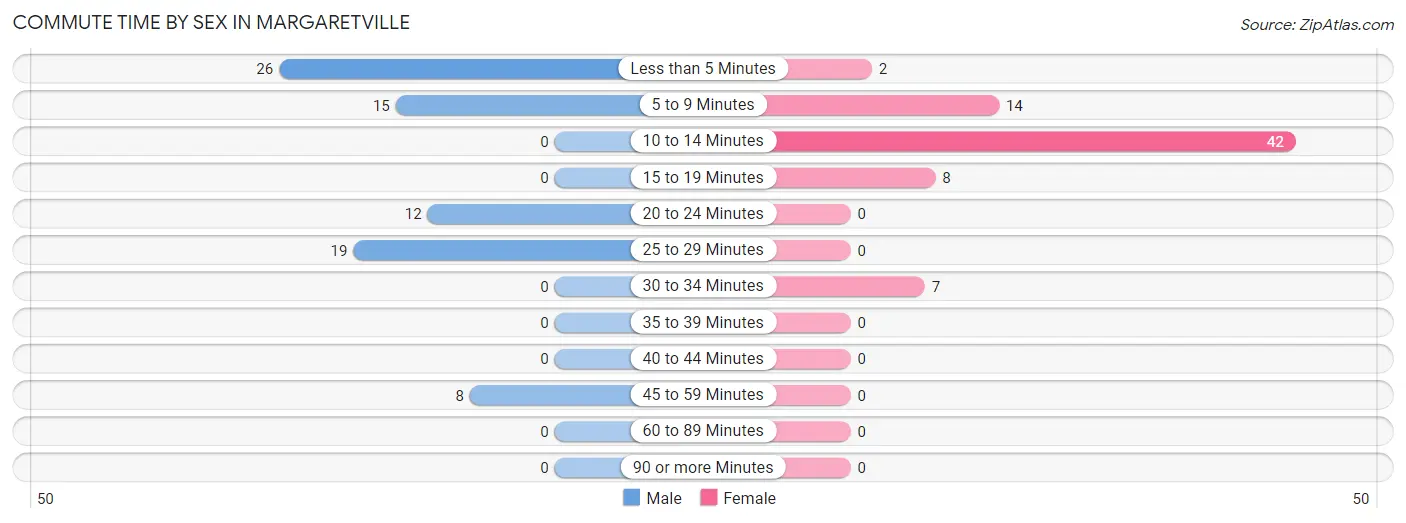
| Commute Time | Male | Female |
| Less than 5 Minutes | 26 (32.5%) | 2 (2.7%) |
| 5 to 9 Minutes | 15 (18.8%) | 14 (19.2%) |
| 10 to 14 Minutes | 0 (0.0%) | 42 (57.5%) |
| 15 to 19 Minutes | 0 (0.0%) | 8 (11.0%) |
| 20 to 24 Minutes | 12 (15.0%) | 0 (0.0%) |
| 25 to 29 Minutes | 19 (23.7%) | 0 (0.0%) |
| 30 to 34 Minutes | 0 (0.0%) | 7 (9.6%) |
| 35 to 39 Minutes | 0 (0.0%) | 0 (0.0%) |
| 40 to 44 Minutes | 0 (0.0%) | 0 (0.0%) |
| 45 to 59 Minutes | 8 (10.0%) | 0 (0.0%) |
| 60 to 89 Minutes | 0 (0.0%) | 0 (0.0%) |
| 90 or more Minutes | 0 (0.0%) | 0 (0.0%) |
Time of Departure to Work by Sex in Margaretville
The most frequent times of departure to work in Margaretville are 5:30 AM to 5:59 AM (31, 38.8%) for males and 7:30 AM to 7:59 AM (28, 38.4%) for females.
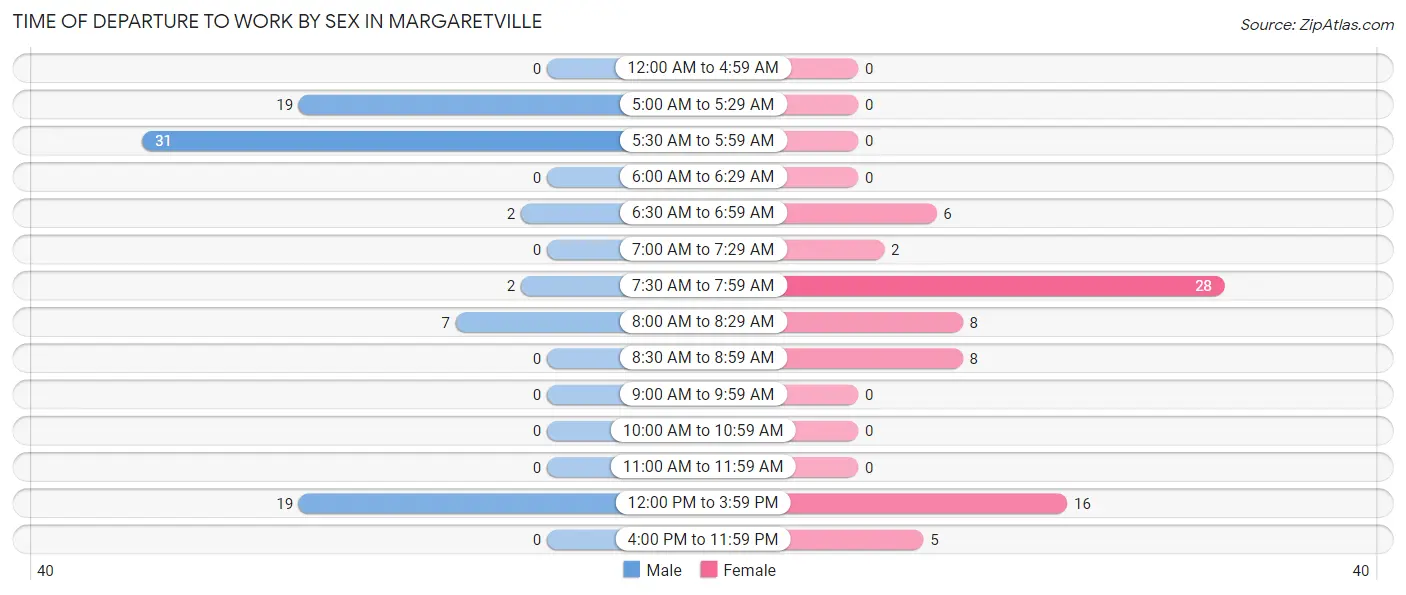
| Time of Departure | Male | Female |
| 12:00 AM to 4:59 AM | 0 (0.0%) | 0 (0.0%) |
| 5:00 AM to 5:29 AM | 19 (23.7%) | 0 (0.0%) |
| 5:30 AM to 5:59 AM | 31 (38.8%) | 0 (0.0%) |
| 6:00 AM to 6:29 AM | 0 (0.0%) | 0 (0.0%) |
| 6:30 AM to 6:59 AM | 2 (2.5%) | 6 (8.2%) |
| 7:00 AM to 7:29 AM | 0 (0.0%) | 2 (2.7%) |
| 7:30 AM to 7:59 AM | 2 (2.5%) | 28 (38.4%) |
| 8:00 AM to 8:29 AM | 7 (8.7%) | 8 (11.0%) |
| 8:30 AM to 8:59 AM | 0 (0.0%) | 8 (11.0%) |
| 9:00 AM to 9:59 AM | 0 (0.0%) | 0 (0.0%) |
| 10:00 AM to 10:59 AM | 0 (0.0%) | 0 (0.0%) |
| 11:00 AM to 11:59 AM | 0 (0.0%) | 0 (0.0%) |
| 12:00 PM to 3:59 PM | 19 (23.7%) | 16 (21.9%) |
| 4:00 PM to 11:59 PM | 0 (0.0%) | 5 (6.9%) |
| Total | 80 (100.0%) | 73 (100.0%) |
Housing Occupancy in Margaretville
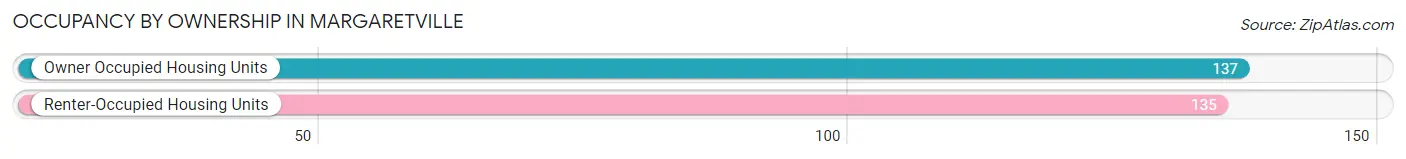
Occupancy by Ownership in Margaretville
Of the total 272 dwellings in Margaretville, owner-occupied units account for 137 (50.4%), while renter-occupied units make up 135 (49.6%).
| Occupancy | # Housing Units | % Housing Units |
| Owner Occupied Housing Units | 137 | 50.4% |
| Renter-Occupied Housing Units | 135 | 49.6% |
| Total Occupied Housing Units | 272 | 100.0% |
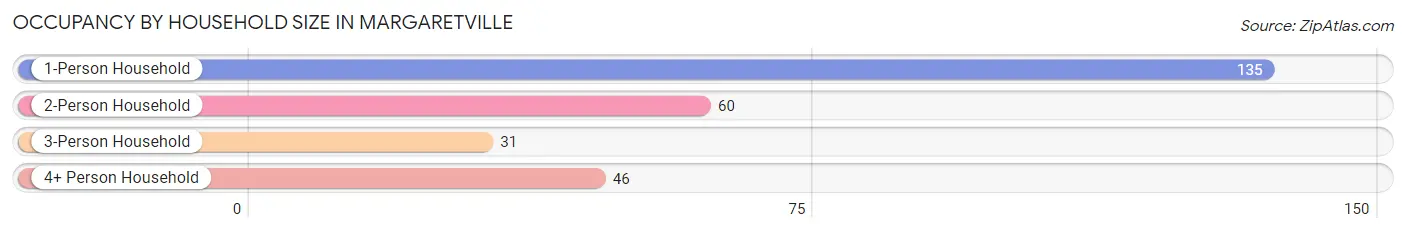
Occupancy by Household Size in Margaretville
| Household Size | # Housing Units | % Housing Units |
| 1-Person Household | 135 | 49.6% |
| 2-Person Household | 60 | 22.1% |
| 3-Person Household | 31 | 11.4% |
| 4+ Person Household | 46 | 16.9% |
| Total Housing Units | 272 | 100.0% |
Occupancy by Ownership by Household Size in Margaretville
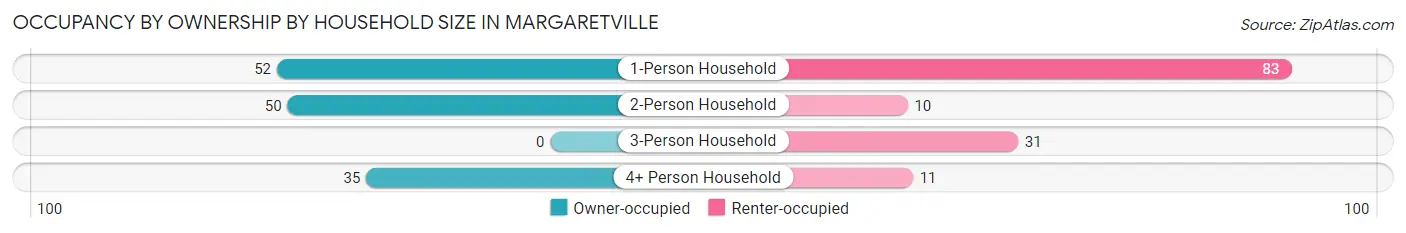
| Household Size | Owner-occupied | Renter-occupied |
| 1-Person Household | 52 (38.5%) | 83 (61.5%) |
| 2-Person Household | 50 (83.3%) | 10 (16.7%) |
| 3-Person Household | 0 (0.0%) | 31 (100.0%) |
| 4+ Person Household | 35 (76.1%) | 11 (23.9%) |
| Total Housing Units | 137 (50.4%) | 135 (49.6%) |
Occupancy by Educational Attainment in Margaretville
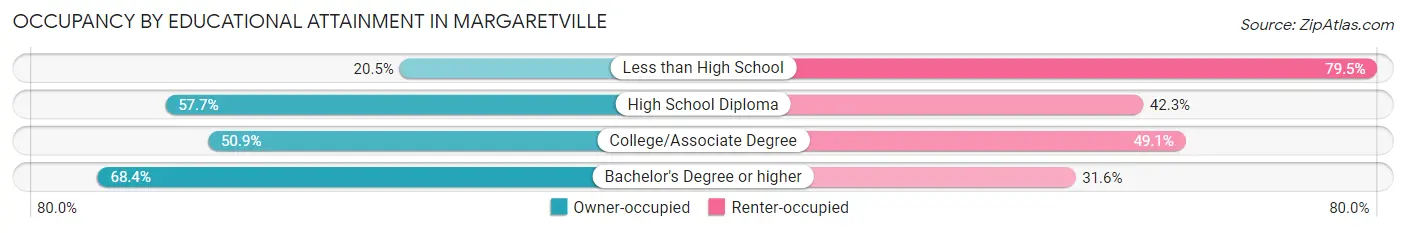
| Household Size | Owner-occupied | Renter-occupied |
| Less than High School | 8 (20.5%) | 31 (79.5%) |
| High School Diploma | 60 (57.7%) | 44 (42.3%) |
| College/Associate Degree | 56 (50.9%) | 54 (49.1%) |
| Bachelor's Degree or higher | 13 (68.4%) | 6 (31.6%) |
Occupancy by Age of Householder in Margaretville
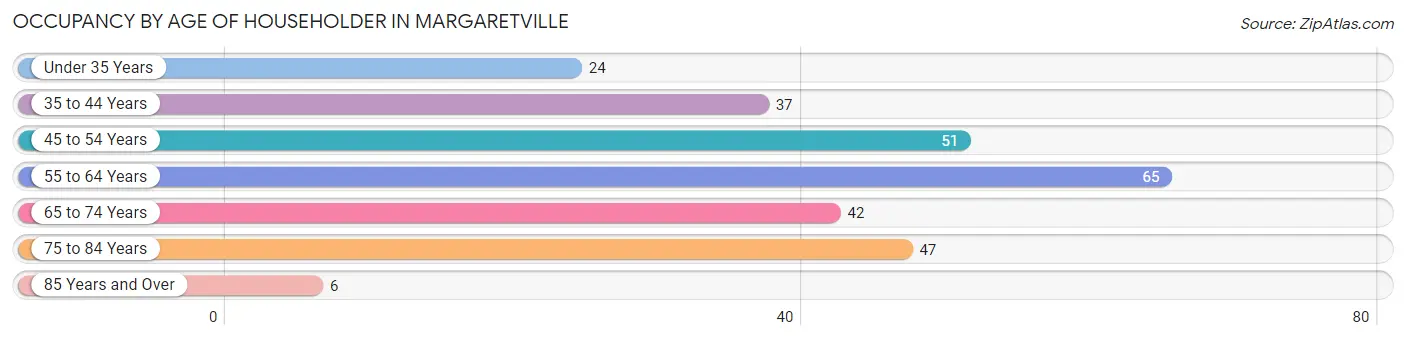
| Age Bracket | # Households | % Households |
| Under 35 Years | 24 | 8.8% |
| 35 to 44 Years | 37 | 13.6% |
| 45 to 54 Years | 51 | 18.8% |
| 55 to 64 Years | 65 | 23.9% |
| 65 to 74 Years | 42 | 15.4% |
| 75 to 84 Years | 47 | 17.3% |
| 85 Years and Over | 6 | 2.2% |
| Total | 272 | 100.0% |
Housing Finances in Margaretville
Median Income by Occupancy in Margaretville
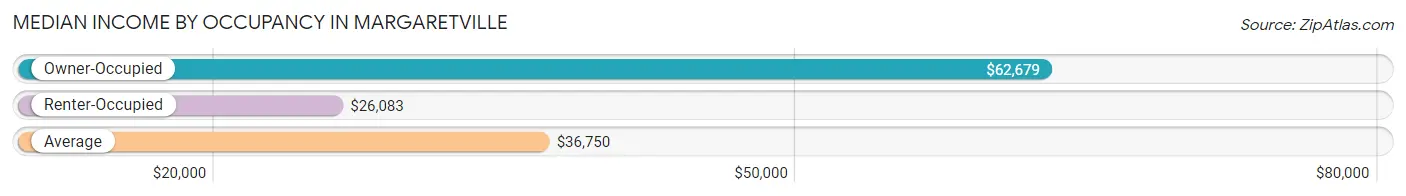
| Occupancy Type | # Households | Median Income |
| Owner-Occupied | 137 (50.4%) | $62,679 |
| Renter-Occupied | 135 (49.6%) | $26,083 |
| Average | 272 (100.0%) | $36,750 |
Occupancy by Householder Income Bracket in Margaretville
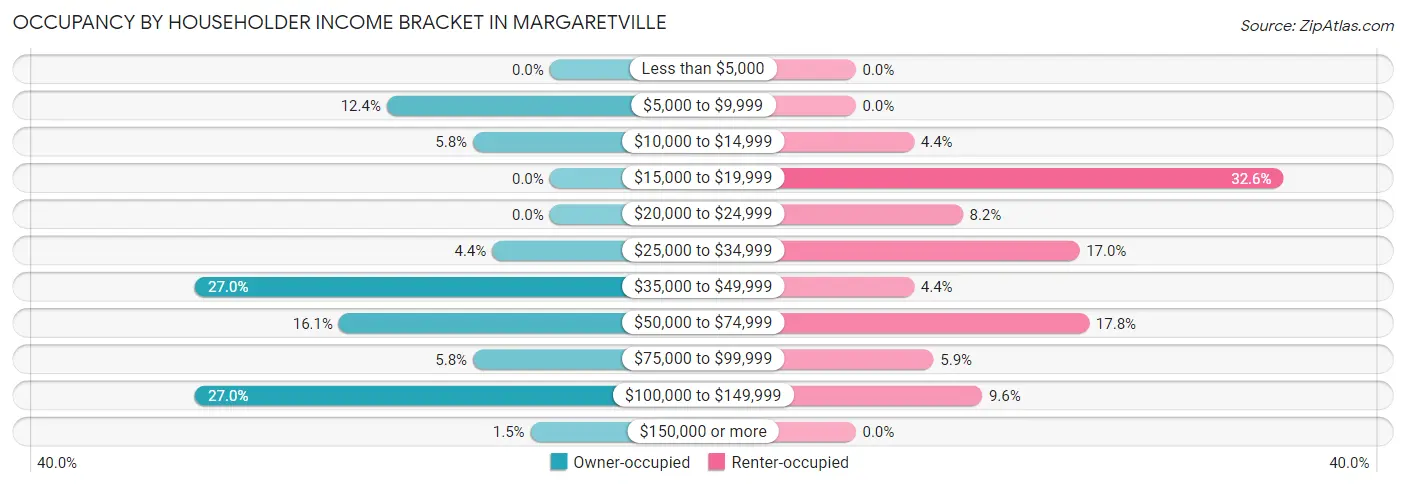
| Income Bracket | Owner-occupied | Renter-occupied |
| Less than $5,000 | 0 (0.0%) | 0 (0.0%) |
| $5,000 to $9,999 | 17 (12.4%) | 0 (0.0%) |
| $10,000 to $14,999 | 8 (5.8%) | 6 (4.4%) |
| $15,000 to $19,999 | 0 (0.0%) | 44 (32.6%) |
| $20,000 to $24,999 | 0 (0.0%) | 11 (8.2%) |
| $25,000 to $34,999 | 6 (4.4%) | 23 (17.0%) |
| $35,000 to $49,999 | 37 (27.0%) | 6 (4.4%) |
| $50,000 to $74,999 | 22 (16.1%) | 24 (17.8%) |
| $75,000 to $99,999 | 8 (5.8%) | 8 (5.9%) |
| $100,000 to $149,999 | 37 (27.0%) | 13 (9.6%) |
| $150,000 or more | 2 (1.5%) | 0 (0.0%) |
| Total | 137 (100.0%) | 135 (100.0%) |
Monthly Housing Cost Tiers in Margaretville

| Monthly Cost | Owner-occupied | Renter-occupied |
| Less than $300 | 8 (5.8%) | 6 (4.4%) |
| $300 to $499 | 20 (14.6%) | 0 (0.0%) |
| $500 to $799 | 22 (16.1%) | 60 (44.4%) |
| $800 to $999 | 15 (11.0%) | 23 (17.0%) |
| $1,000 to $1,499 | 32 (23.4%) | 6 (4.4%) |
| $1,500 to $1,999 | 8 (5.8%) | 10 (7.4%) |
| $2,000 to $2,499 | 32 (23.4%) | 25 (18.5%) |
| $2,500 to $2,999 | 0 (0.0%) | 0 (0.0%) |
| $3,000 or more | 0 (0.0%) | 0 (0.0%) |
| Total | 137 (100.0%) | 135 (100.0%) |
Physical Housing Characteristics in Margaretville
Housing Structures in Margaretville
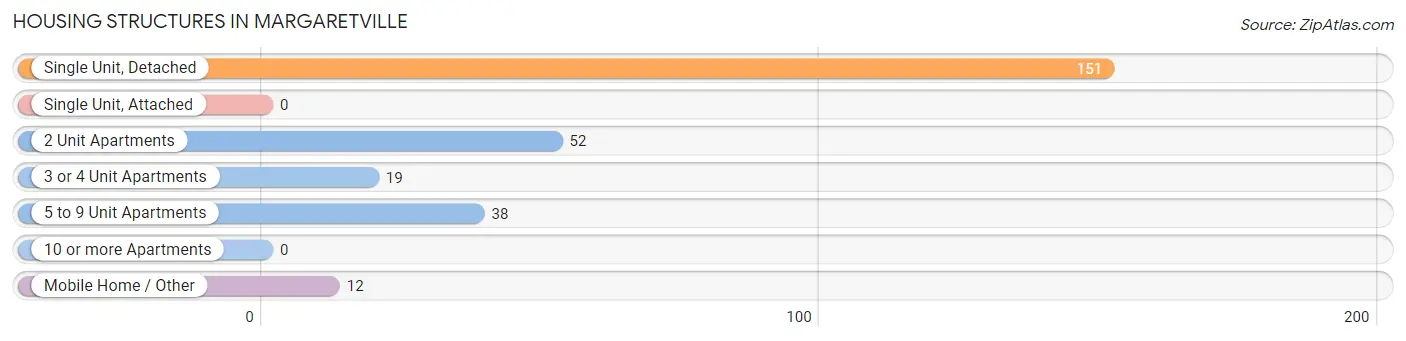
| Structure Type | # Housing Units | % Housing Units |
| Single Unit, Detached | 151 | 55.5% |
| Single Unit, Attached | 0 | 0.0% |
| 2 Unit Apartments | 52 | 19.1% |
| 3 or 4 Unit Apartments | 19 | 7.0% |
| 5 to 9 Unit Apartments | 38 | 14.0% |
| 10 or more Apartments | 0 | 0.0% |
| Mobile Home / Other | 12 | 4.4% |
| Total | 272 | 100.0% |
Housing Structures by Occupancy in Margaretville
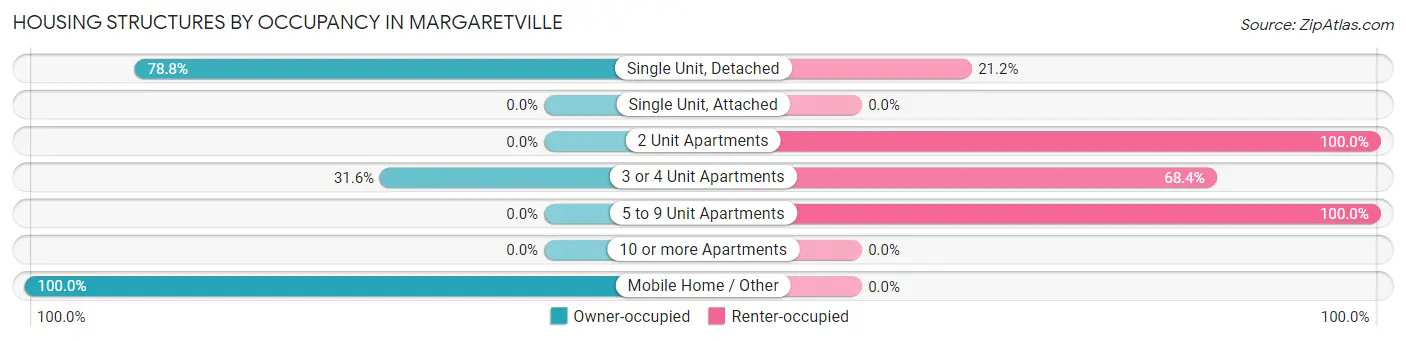
| Structure Type | Owner-occupied | Renter-occupied |
| Single Unit, Detached | 119 (78.8%) | 32 (21.2%) |
| Single Unit, Attached | 0 (0.0%) | 0 (0.0%) |
| 2 Unit Apartments | 0 (0.0%) | 52 (100.0%) |
| 3 or 4 Unit Apartments | 6 (31.6%) | 13 (68.4%) |
| 5 to 9 Unit Apartments | 0 (0.0%) | 38 (100.0%) |
| 10 or more Apartments | 0 (0.0%) | 0 (0.0%) |
| Mobile Home / Other | 12 (100.0%) | 0 (0.0%) |
| Total | 137 (50.4%) | 135 (49.6%) |
Housing Structures by Number of Rooms in Margaretville
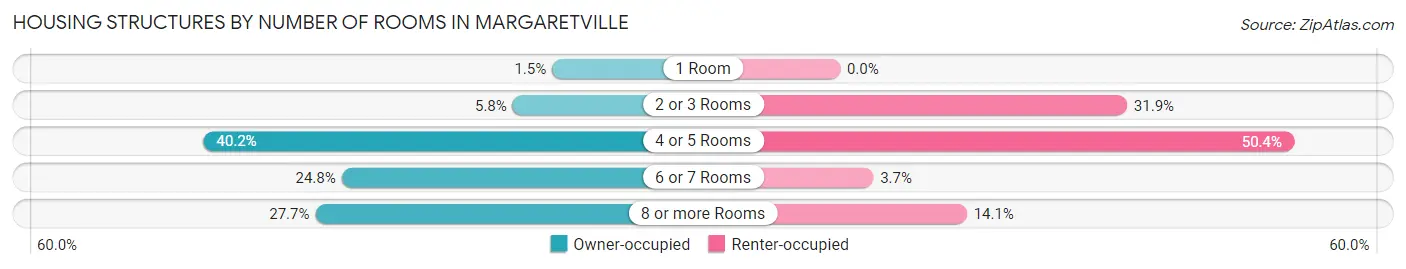
| Number of Rooms | Owner-occupied | Renter-occupied |
| 1 Room | 2 (1.5%) | 0 (0.0%) |
| 2 or 3 Rooms | 8 (5.8%) | 43 (31.9%) |
| 4 or 5 Rooms | 55 (40.2%) | 68 (50.4%) |
| 6 or 7 Rooms | 34 (24.8%) | 5 (3.7%) |
| 8 or more Rooms | 38 (27.7%) | 19 (14.1%) |
| Total | 137 (100.0%) | 135 (100.0%) |
Housing Structure by Heating Type in Margaretville
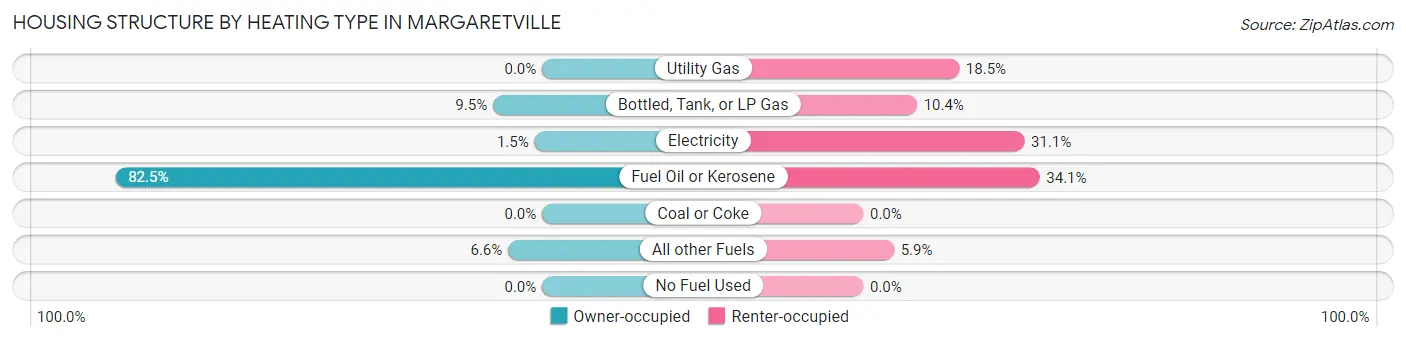
| Heating Type | Owner-occupied | Renter-occupied |
| Utility Gas | 0 (0.0%) | 25 (18.5%) |
| Bottled, Tank, or LP Gas | 13 (9.5%) | 14 (10.4%) |
| Electricity | 2 (1.5%) | 42 (31.1%) |
| Fuel Oil or Kerosene | 113 (82.5%) | 46 (34.1%) |
| Coal or Coke | 0 (0.0%) | 0 (0.0%) |
| All other Fuels | 9 (6.6%) | 8 (5.9%) |
| No Fuel Used | 0 (0.0%) | 0 (0.0%) |
| Total | 137 (100.0%) | 135 (100.0%) |
Household Vehicle Usage in Margaretville
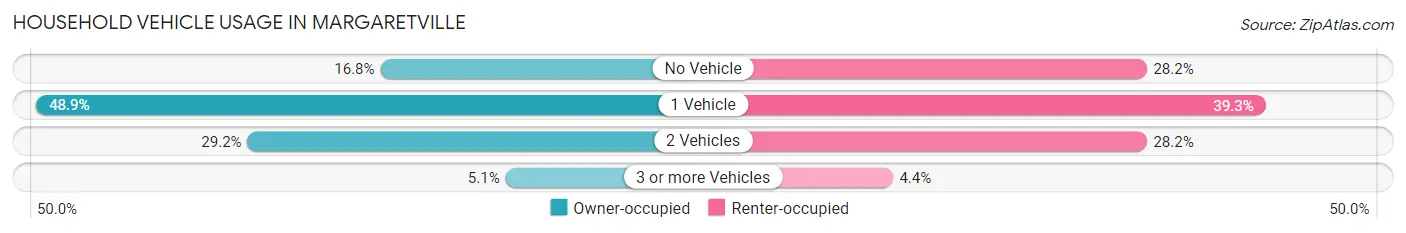
| Vehicles per Household | Owner-occupied | Renter-occupied |
| No Vehicle | 23 (16.8%) | 38 (28.1%) |
| 1 Vehicle | 67 (48.9%) | 53 (39.3%) |
| 2 Vehicles | 40 (29.2%) | 38 (28.1%) |
| 3 or more Vehicles | 7 (5.1%) | 6 (4.4%) |
| Total | 137 (100.0%) | 135 (100.0%) |
Real Estate & Mortgages in Margaretville
Real Estate and Mortgage Overview in Margaretville
| Characteristic | Without Mortgage | With Mortgage |
| Housing Units | 58 | 79 |
| Median Property Value | $169,600 | $176,300 |
| Median Household Income | - | - |
| Monthly Housing Costs | $507 | $0 |
| Real Estate Taxes | $3,182 | $0 |
Property Value by Mortgage Status in Margaretville
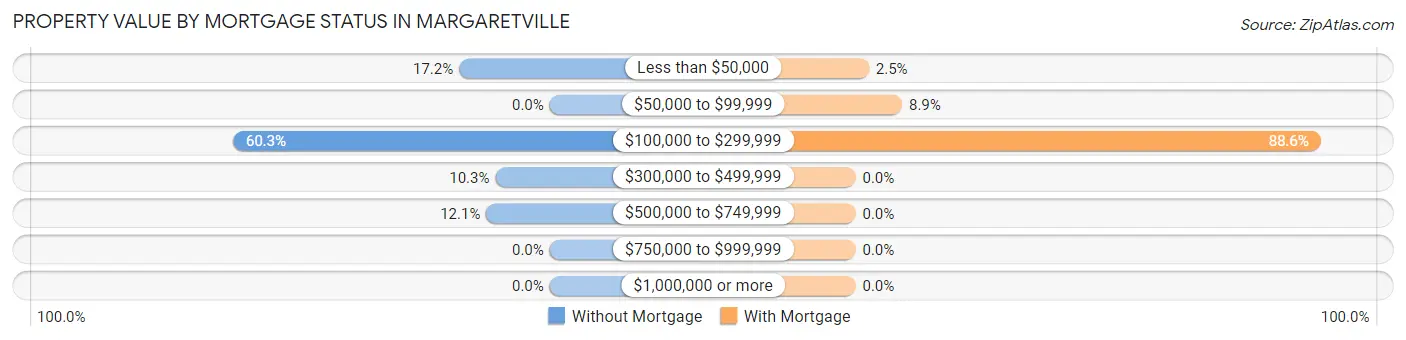
| Property Value | Without Mortgage | With Mortgage |
| Less than $50,000 | 10 (17.2%) | 2 (2.5%) |
| $50,000 to $99,999 | 0 (0.0%) | 7 (8.9%) |
| $100,000 to $299,999 | 35 (60.3%) | 70 (88.6%) |
| $300,000 to $499,999 | 6 (10.3%) | 0 (0.0%) |
| $500,000 to $749,999 | 7 (12.1%) | 0 (0.0%) |
| $750,000 to $999,999 | 0 (0.0%) | 0 (0.0%) |
| $1,000,000 or more | 0 (0.0%) | 0 (0.0%) |
| Total | 58 (100.0%) | 79 (100.0%) |
Household Income by Mortgage Status in Margaretville
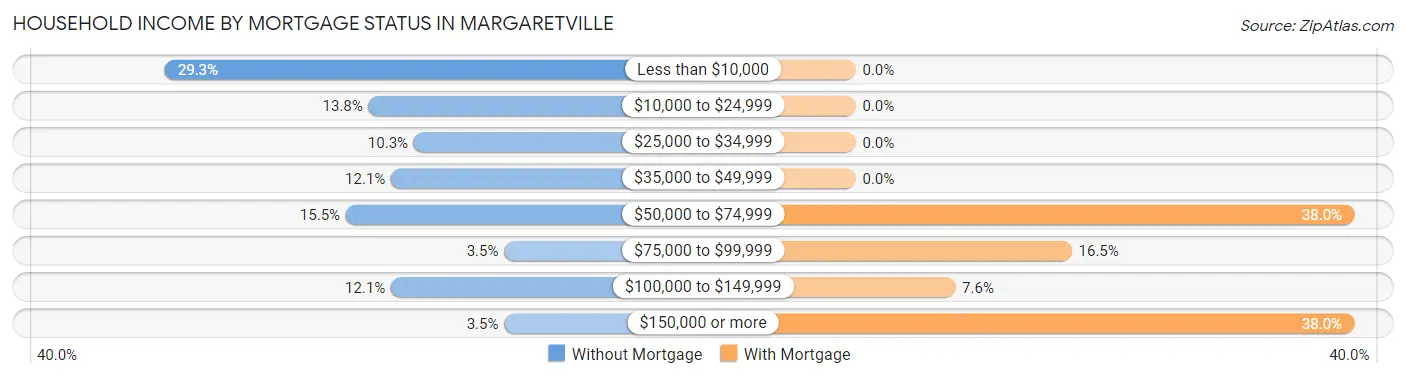
| Household Income | Without Mortgage | With Mortgage |
| Less than $10,000 | 17 (29.3%) | 0 (0.0%) |
| $10,000 to $24,999 | 8 (13.8%) | 0 (0.0%) |
| $25,000 to $34,999 | 6 (10.3%) | 0 (0.0%) |
| $35,000 to $49,999 | 7 (12.1%) | 0 (0.0%) |
| $50,000 to $74,999 | 9 (15.5%) | 30 (38.0%) |
| $75,000 to $99,999 | 2 (3.5%) | 13 (16.5%) |
| $100,000 to $149,999 | 7 (12.1%) | 6 (7.6%) |
| $150,000 or more | 2 (3.5%) | 30 (38.0%) |
| Total | 58 (100.0%) | 79 (100.0%) |
Property Value to Household Income Ratio in Margaretville
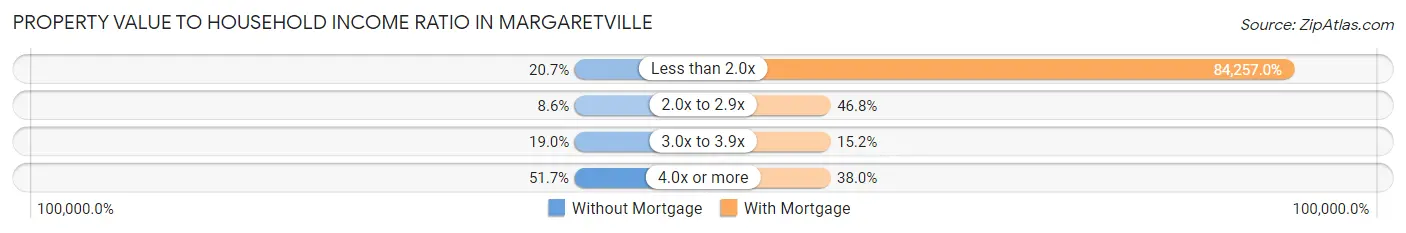
| Value-to-Income Ratio | Without Mortgage | With Mortgage |
| Less than 2.0x | 12 (20.7%) | 66,563 (84,257.0%) |
| 2.0x to 2.9x | 5 (8.6%) | 37 (46.8%) |
| 3.0x to 3.9x | 11 (19.0%) | 12 (15.2%) |
| 4.0x or more | 30 (51.7%) | 30 (38.0%) |
| Total | 58 (100.0%) | 79 (100.0%) |
Real Estate Taxes by Mortgage Status in Margaretville
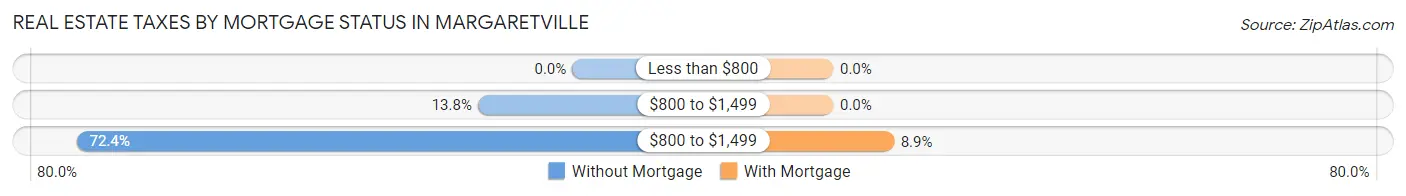
| Property Taxes | Without Mortgage | With Mortgage |
| Less than $800 | 0 (0.0%) | 0 (0.0%) |
| $800 to $1,499 | 8 (13.8%) | 0 (0.0%) |
| $800 to $1,499 | 42 (72.4%) | 7 (8.9%) |
| Total | 58 (100.0%) | 79 (100.0%) |
Health & Disability in Margaretville
Health Insurance Coverage by Age in Margaretville
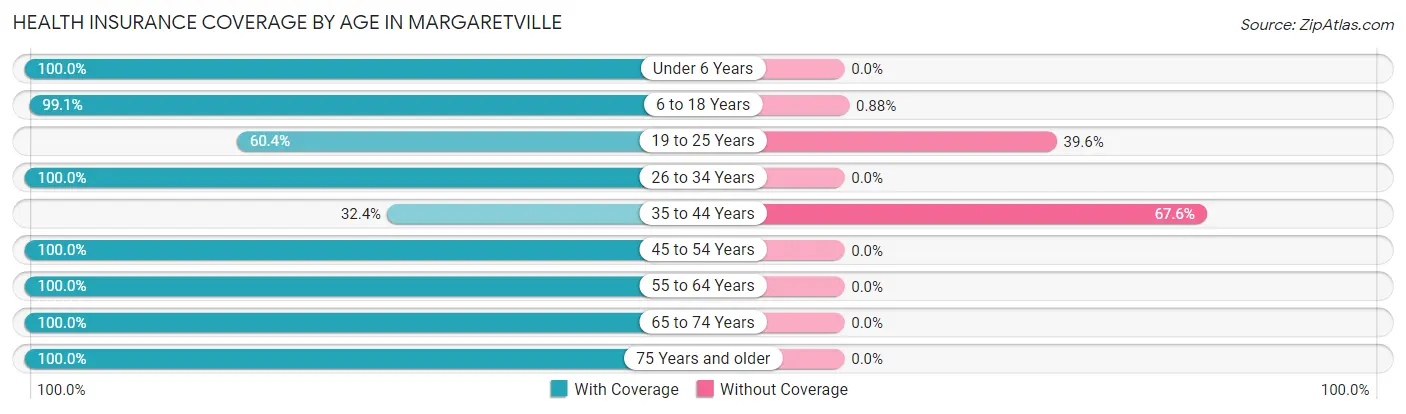
| Age Bracket | With Coverage | Without Coverage |
| Under 6 Years | 18 (100.0%) | 0 (0.0%) |
| 6 to 18 Years | 112 (99.1%) | 1 (0.9%) |
| 19 to 25 Years | 29 (60.4%) | 19 (39.6%) |
| 26 to 34 Years | 35 (100.0%) | 0 (0.0%) |
| 35 to 44 Years | 12 (32.4%) | 25 (67.6%) |
| 45 to 54 Years | 76 (100.0%) | 0 (0.0%) |
| 55 to 64 Years | 100 (100.0%) | 0 (0.0%) |
| 65 to 74 Years | 92 (100.0%) | 0 (0.0%) |
| 75 Years and older | 66 (100.0%) | 0 (0.0%) |
| Total | 540 (92.3%) | 45 (7.7%) |
Health Insurance Coverage by Citizenship Status in Margaretville
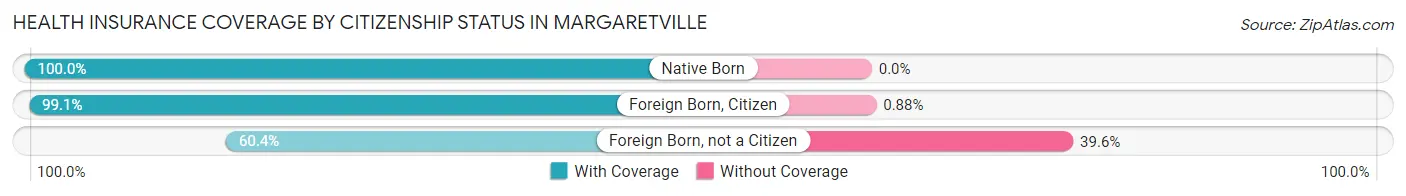
| Citizenship Status | With Coverage | Without Coverage |
| Native Born | 18 (100.0%) | 0 (0.0%) |
| Foreign Born, Citizen | 112 (99.1%) | 1 (0.9%) |
| Foreign Born, not a Citizen | 29 (60.4%) | 19 (39.6%) |
Health Insurance Coverage by Household Income in Margaretville
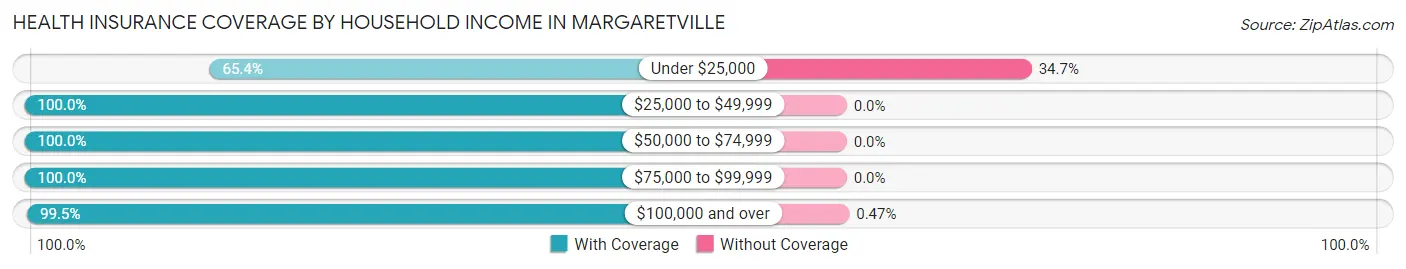
| Household Income | With Coverage | Without Coverage |
| Under $25,000 | 83 (65.3%) | 44 (34.6%) |
| $25,000 to $49,999 | 98 (100.0%) | 0 (0.0%) |
| $50,000 to $74,999 | 116 (100.0%) | 0 (0.0%) |
| $75,000 to $99,999 | 26 (100.0%) | 0 (0.0%) |
| $100,000 and over | 211 (99.5%) | 1 (0.5%) |
Public vs Private Health Insurance Coverage by Age in Margaretville
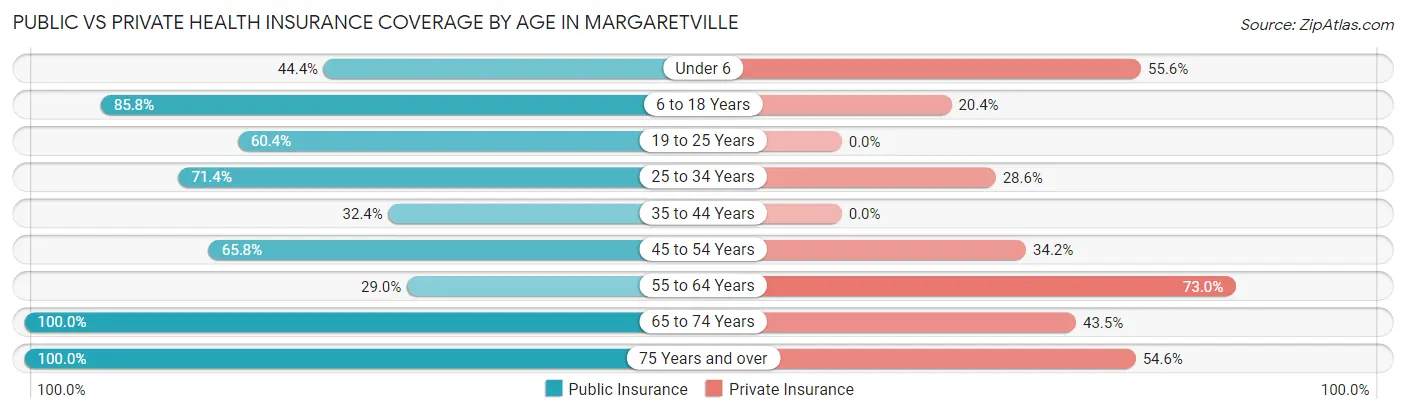
| Age Bracket | Public Insurance | Private Insurance |
| Under 6 | 8 (44.4%) | 10 (55.6%) |
| 6 to 18 Years | 97 (85.8%) | 23 (20.3%) |
| 19 to 25 Years | 29 (60.4%) | 0 (0.0%) |
| 25 to 34 Years | 25 (71.4%) | 10 (28.6%) |
| 35 to 44 Years | 12 (32.4%) | 0 (0.0%) |
| 45 to 54 Years | 50 (65.8%) | 26 (34.2%) |
| 55 to 64 Years | 29 (29.0%) | 73 (73.0%) |
| 65 to 74 Years | 92 (100.0%) | 40 (43.5%) |
| 75 Years and over | 66 (100.0%) | 36 (54.5%) |
| Total | 408 (69.7%) | 218 (37.3%) |
Disability Status by Sex by Age in Margaretville
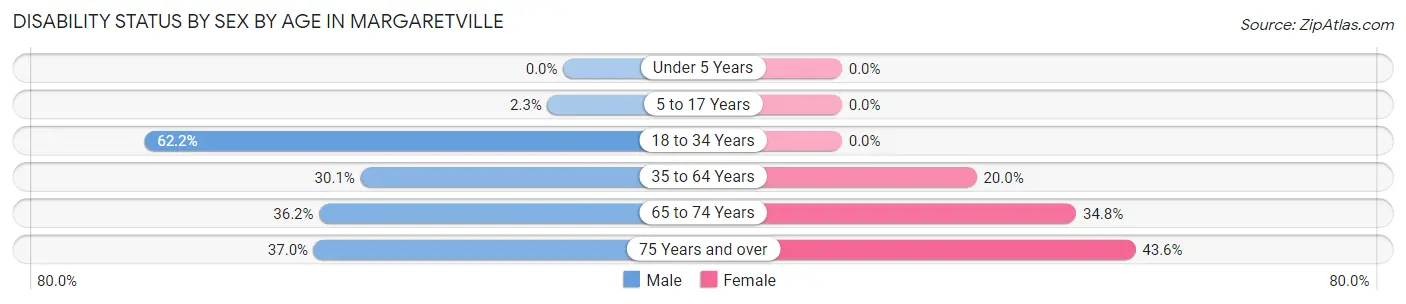
| Age Bracket | Male | Female |
| Under 5 Years | 0 (0.0%) | 0 (0.0%) |
| 5 to 17 Years | 1 (2.3%) | 0 (0.0%) |
| 18 to 34 Years | 56 (62.2%) | 0 (0.0%) |
| 35 to 64 Years | 31 (30.1%) | 22 (20.0%) |
| 65 to 74 Years | 25 (36.2%) | 8 (34.8%) |
| 75 Years and over | 10 (37.0%) | 17 (43.6%) |
Disability Class by Sex by Age in Margaretville
Disability Class: Hearing Difficulty
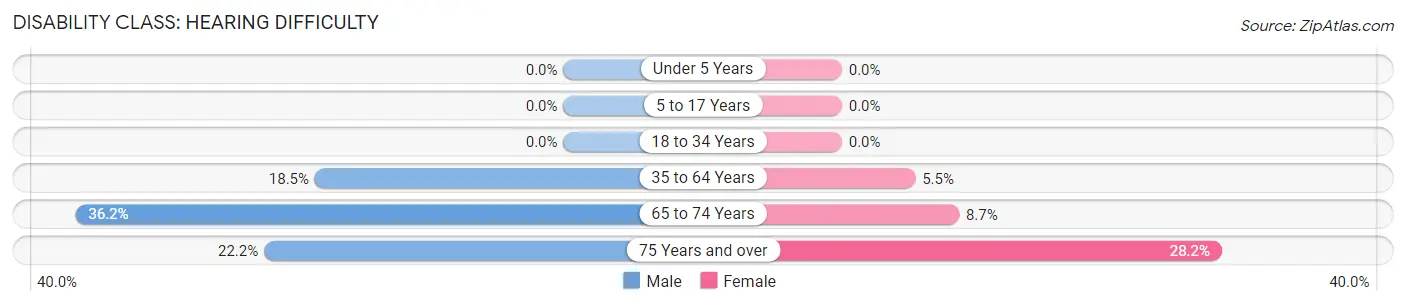
| Age Bracket | Male | Female |
| Under 5 Years | 0 (0.0%) | 0 (0.0%) |
| 5 to 17 Years | 0 (0.0%) | 0 (0.0%) |
| 18 to 34 Years | 0 (0.0%) | 0 (0.0%) |
| 35 to 64 Years | 19 (18.4%) | 6 (5.4%) |
| 65 to 74 Years | 25 (36.2%) | 2 (8.7%) |
| 75 Years and over | 6 (22.2%) | 11 (28.2%) |
Disability Class: Vision Difficulty
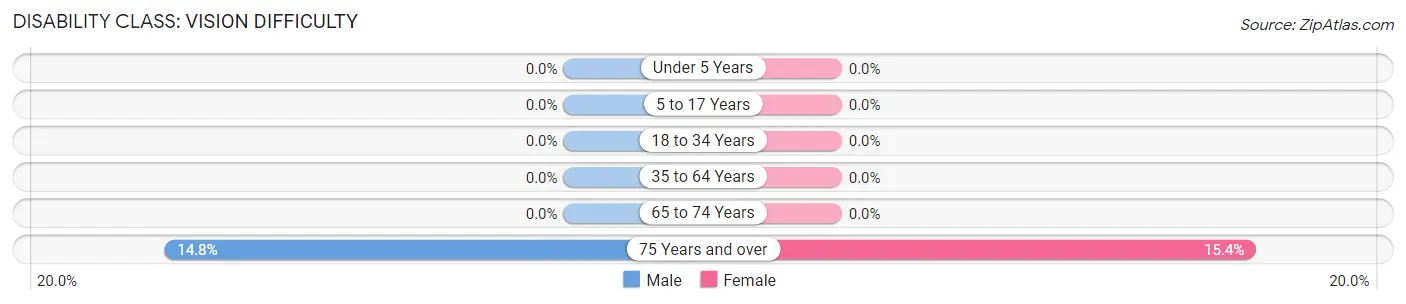
| Age Bracket | Male | Female |
| Under 5 Years | 0 (0.0%) | 0 (0.0%) |
| 5 to 17 Years | 0 (0.0%) | 0 (0.0%) |
| 18 to 34 Years | 0 (0.0%) | 0 (0.0%) |
| 35 to 64 Years | 0 (0.0%) | 0 (0.0%) |
| 65 to 74 Years | 0 (0.0%) | 0 (0.0%) |
| 75 Years and over | 4 (14.8%) | 6 (15.4%) |
Disability Class: Cognitive Difficulty
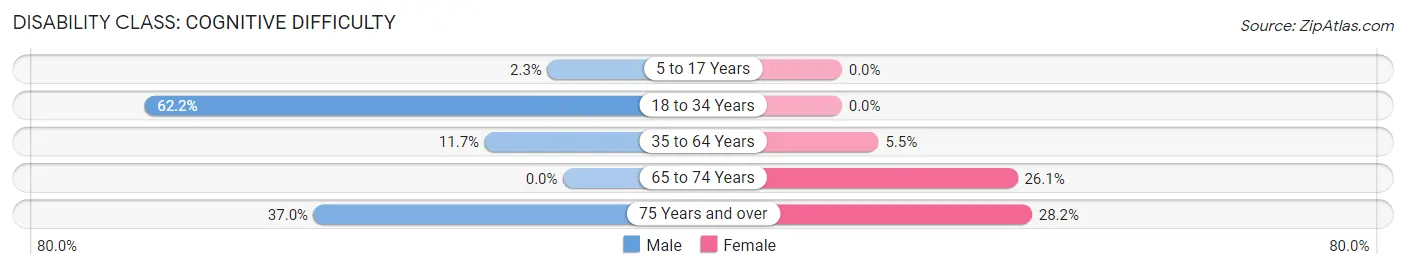
| Age Bracket | Male | Female |
| 5 to 17 Years | 1 (2.3%) | 0 (0.0%) |
| 18 to 34 Years | 56 (62.2%) | 0 (0.0%) |
| 35 to 64 Years | 12 (11.7%) | 6 (5.4%) |
| 65 to 74 Years | 0 (0.0%) | 6 (26.1%) |
| 75 Years and over | 10 (37.0%) | 11 (28.2%) |
Disability Class: Ambulatory Difficulty
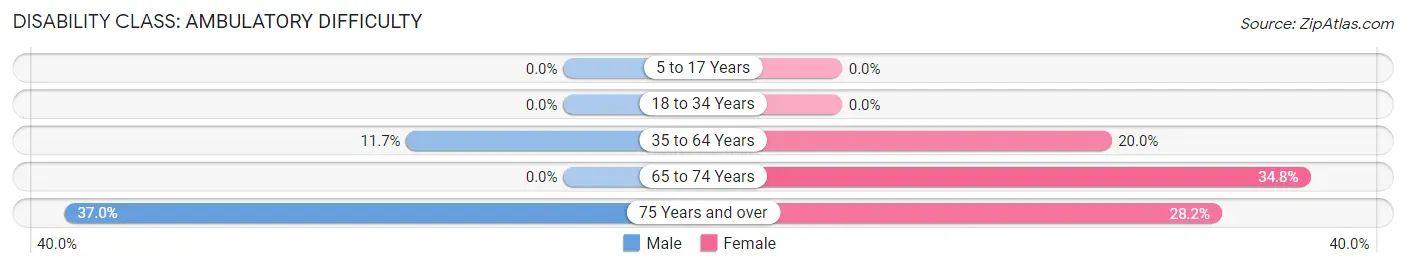
| Age Bracket | Male | Female |
| 5 to 17 Years | 0 (0.0%) | 0 (0.0%) |
| 18 to 34 Years | 0 (0.0%) | 0 (0.0%) |
| 35 to 64 Years | 12 (11.7%) | 22 (20.0%) |
| 65 to 74 Years | 0 (0.0%) | 8 (34.8%) |
| 75 Years and over | 10 (37.0%) | 11 (28.2%) |
Disability Class: Self-Care Difficulty
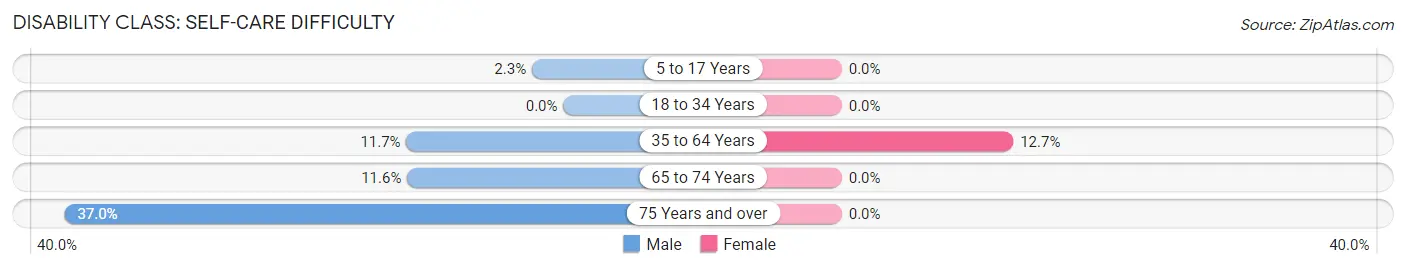
| Age Bracket | Male | Female |
| 5 to 17 Years | 1 (2.3%) | 0 (0.0%) |
| 18 to 34 Years | 0 (0.0%) | 0 (0.0%) |
| 35 to 64 Years | 12 (11.7%) | 14 (12.7%) |
| 65 to 74 Years | 8 (11.6%) | 0 (0.0%) |
| 75 Years and over | 10 (37.0%) | 0 (0.0%) |
Technology Access in Margaretville
Computing Device Access in Margaretville
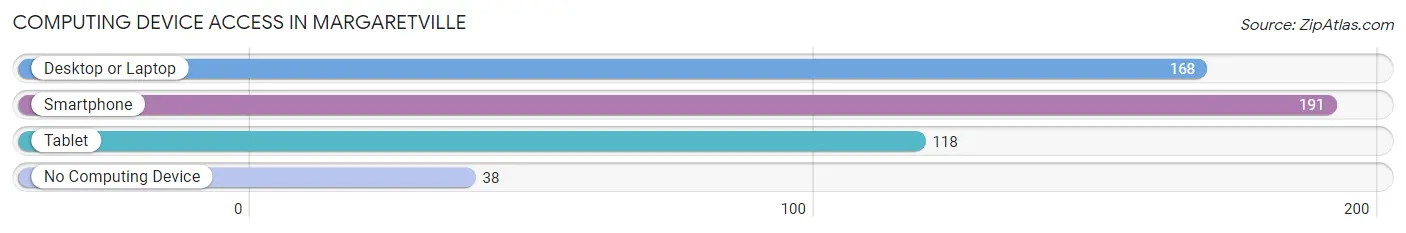
| Device Type | # Households | % Households |
| Desktop or Laptop | 168 | 61.8% |
| Smartphone | 191 | 70.2% |
| Tablet | 118 | 43.4% |
| No Computing Device | 38 | 14.0% |
| Total | 272 | 100.0% |
Internet Access in Margaretville
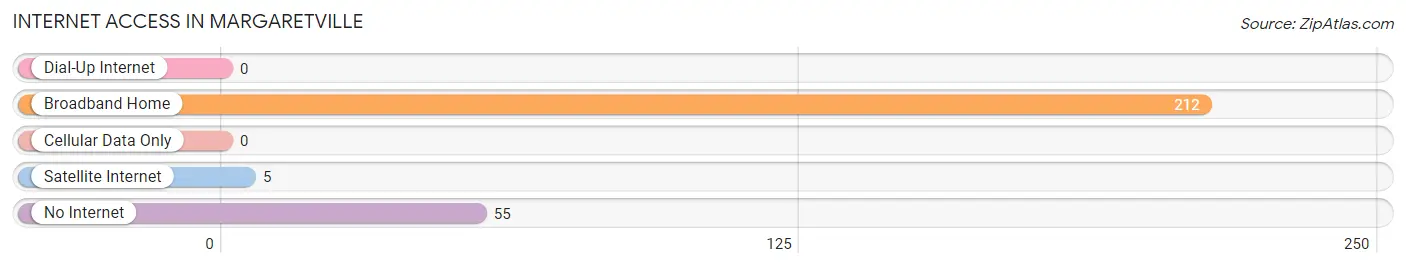
| Internet Type | # Households | % Households |
| Dial-Up Internet | 0 | 0.0% |
| Broadband Home | 212 | 77.9% |
| Cellular Data Only | 0 | 0.0% |
| Satellite Internet | 5 | 1.8% |
| No Internet | 55 | 20.2% |
| Total | 272 | 100.0% |
Margaretville Summary
Margaretville is a small village located in the Catskill Mountains of Delaware County, New York. It is situated in the Town of Middletown, and is part of the Catskill Park. The village is located on the banks of the East Branch of the Delaware River, and is surrounded by the Catskill Mountains. The population of Margaretville was 1,072 at the 2010 census.
History
The area that is now Margaretville was first settled in the late 1700s by a group of Dutch settlers. The village was originally known as “Middletown”, but was later renamed “Margaretville” in honor of Margaret, the daughter of one of the original settlers. The village was officially incorporated in 1848.
In the late 1800s, Margaretville was a popular destination for tourists, who came to enjoy the scenic beauty of the Catskill Mountains. The village was also home to several resorts, including the Grand Hotel, which was built in 1891.
In the early 1900s, Margaretville was a center for the lumber industry. The village was home to several sawmills, which supplied lumber to the surrounding area. The lumber industry declined in the mid-1900s, and the village began to focus more on tourism.
Geography
Margaretville is located at 42°14'N, 74°45'W (42.23, -74.75). The village is situated in the Town of Middletown, and is part of the Catskill Park. The village is located on the banks of the East Branch of the Delaware River, and is surrounded by the Catskill Mountains.
The village has a total area of 0.7 square miles, all of which is land. The village is located in a rural area, and is surrounded by forests and mountains.
Economy
The economy of Margaretville is largely based on tourism. The village is home to several resorts, including the Grand Hotel, which was built in 1891. The village is also home to several restaurants, shops, and other businesses that cater to tourists.
The village is also home to several small businesses, including a lumber mill, a sawmill, and a furniture factory. The village is also home to several farms, which produce dairy products, fruits, and vegetables.
Demographics
As of the 2010 census, the population of Margaretville was 1,072. The racial makeup of the village was 97.2% White, 0.7% African American, 0.3% Native American, 0.3% Asian, 0.1% Pacific Islander, 0.3% from other races, and 1.2% from two or more races. Hispanic or Latino of any race were 1.7% of the population.
The median income for a household in the village was $37,500, and the median income for a family was $45,000. The per capita income for the village was $20,845. About 10.2% of families and 13.2% of the population were below the poverty line, including 16.7% of those under age 18 and 8.3% of those age 65 or over.
Common Questions
What is Per Capita Income in Margaretville?
Per Capita income in Margaretville is $23,724.
What is the Median Family Income in Margaretville?
Median Family Income in Margaretville is $73,021.
What is the Median Household income in Margaretville?
Median Household Income in Margaretville is $36,750.
What is Income or Wage Gap in Margaretville?
Income or Wage Gap in Margaretville is 37.6%.
Women in Margaretville earn 62.4 cents for every dollar earned by a man.
What is Inequality or Gini Index in Margaretville?
Inequality or Gini Index in Margaretville is 0.41.
What is the Total Population of Margaretville?
Total Population of Margaretville is 656.
What is the Total Male Population of Margaretville?
Total Male Population of Margaretville is 347.
What is the Total Female Population of Margaretville?
Total Female Population of Margaretville is 309.
What is the Ratio of Males per 100 Females in Margaretville?
There are 112.30 Males per 100 Females in Margaretville.
What is the Ratio of Females per 100 Males in Margaretville?
There are 89.05 Females per 100 Males in Margaretville.
What is the Median Population Age in Margaretville?
Median Population Age in Margaretville is 56.1 Years.
What is the Average Family Size in Margaretville
Average Family Size in Margaretville is 3.1 People.
What is the Average Household Size in Margaretville
Average Household Size in Margaretville is 2.1 People.
How Large is the Labor Force in Margaretville?
There are 183 People in the Labor Forcein in Margaretville.
What is the Percentage of People in the Labor Force in Margaretville?
32.1% of People are in the Labor Force in Margaretville.