Lyons, CO
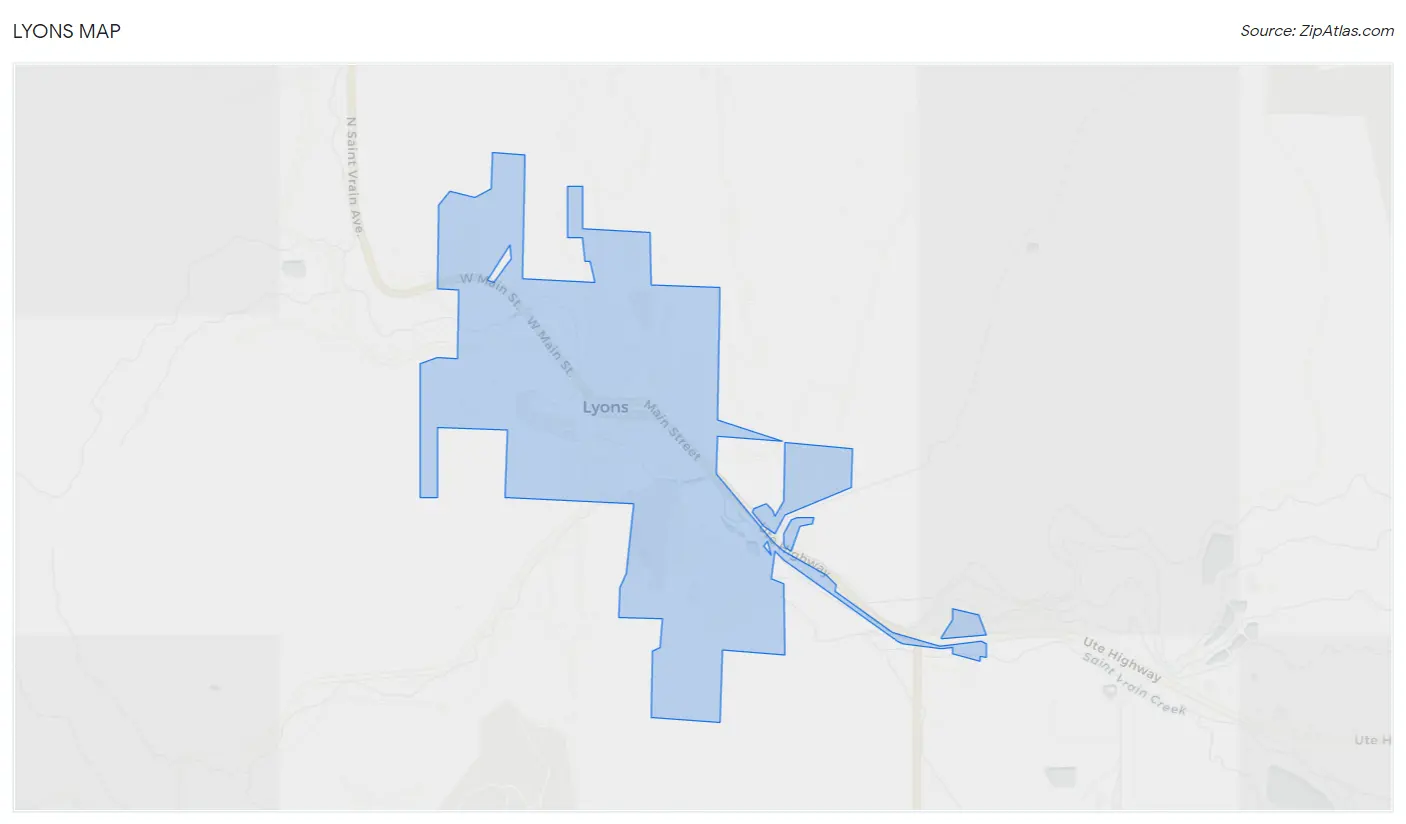
Lyons Map
Lyons Overview
1,936
TOTAL POPULATION
938
MALE POPULATION
998
FEMALE POPULATION
93.99
MALES / 100 FEMALES
106.40
FEMALES / 100 MALES
45.6
MEDIAN AGE
3.1
AVG FAMILY SIZE
2.5
AVG HOUSEHOLD SIZE
$58,992
PER CAPITA INCOME
$164,625
AVG FAMILY INCOME
$131,179
AVG HOUSEHOLD INCOME
24.4%
WAGE / INCOME GAP [ % ]
75.6¢/ $1
WAGE / INCOME GAP [ $ ]
0.40
INEQUALITY / GINI INDEX
947
LABOR FORCE [ PEOPLE ]
64.1%
PERCENT IN LABOR FORCE
3.4%
UNEMPLOYMENT RATE
Lyons Zip Codes
Race in Lyons
The most populous races in Lyons are White / Caucasian (1,774 | 91.6%), Two or more Races (96 | 5.0%), and Hispanic or Latino (76 | 3.9%).
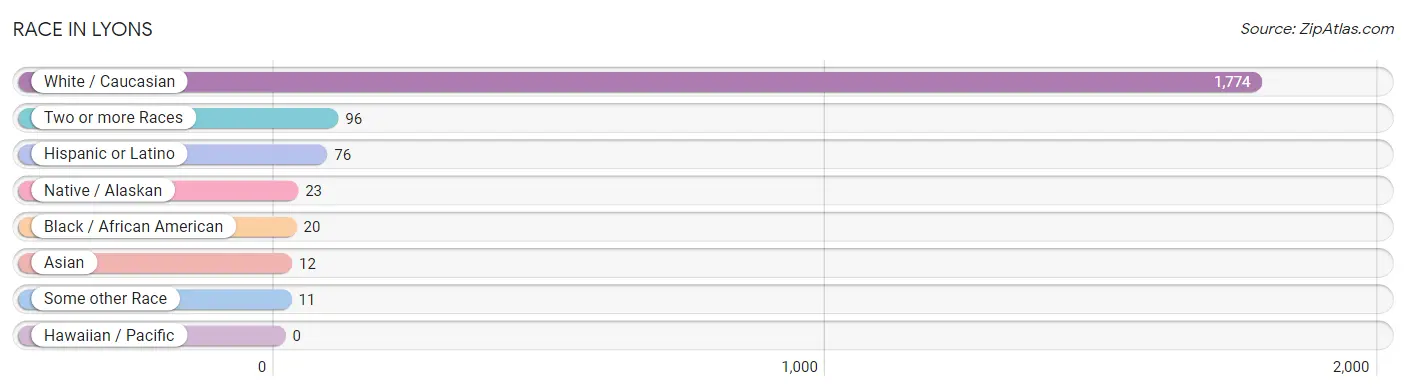
| Race | # Population | % Population |
| Asian | 12 | 0.6% |
| Black / African American | 20 | 1.0% |
| Hawaiian / Pacific | 0 | 0.0% |
| Hispanic or Latino | 76 | 3.9% |
| Native / Alaskan | 23 | 1.2% |
| White / Caucasian | 1,774 | 91.6% |
| Two or more Races | 96 | 5.0% |
| Some other Race | 11 | 0.6% |
| Total | 1,936 | 100.0% |
Ancestry in Lyons
The most populous ancestries reported in Lyons are German (553 | 28.6%), Irish (337 | 17.4%), English (193 | 10.0%), Norwegian (149 | 7.7%), and Swedish (131 | 6.8%), together accounting for 70.4% of all Lyons residents.
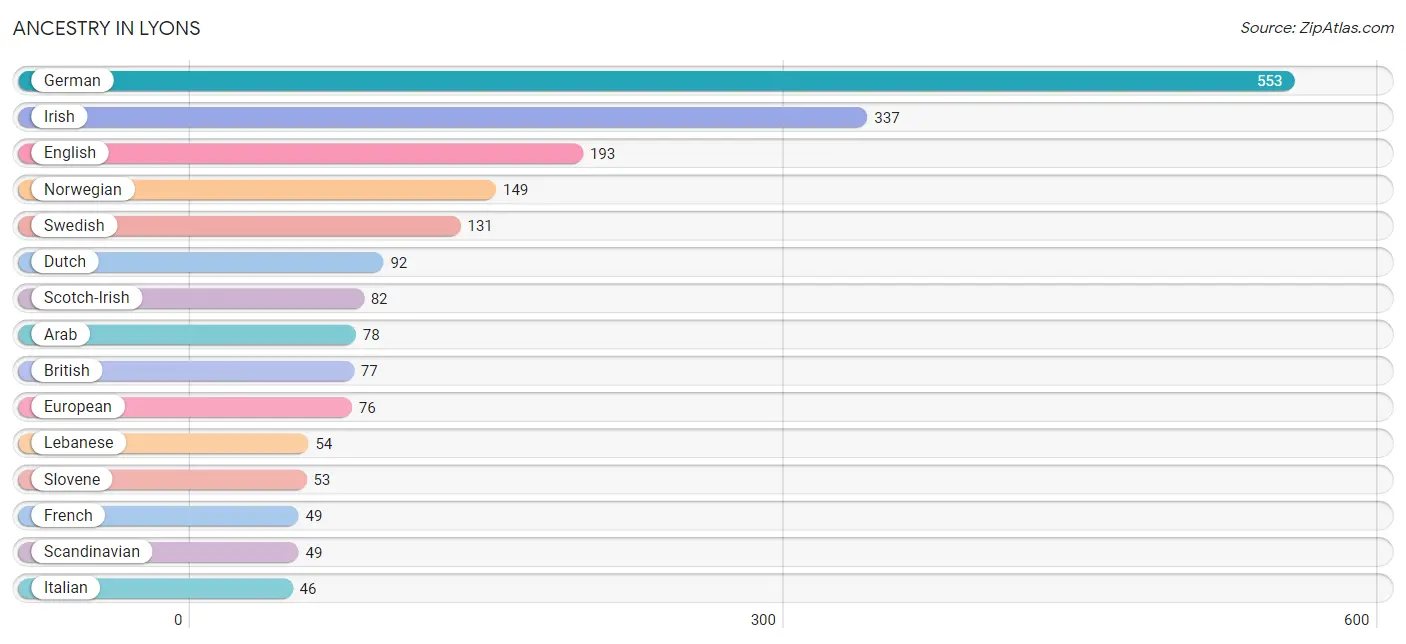
| Ancestry | # Population | % Population |
| American | 27 | 1.4% |
| Arab | 78 | 4.0% |
| Bhutanese | 6 | 0.3% |
| Blackfeet | 8 | 0.4% |
| British | 77 | 4.0% |
| Burmese | 4 | 0.2% |
| Canadian | 23 | 1.2% |
| Croatian | 37 | 1.9% |
| Czech | 24 | 1.2% |
| Danish | 16 | 0.8% |
| Dutch | 92 | 4.8% |
| English | 193 | 10.0% |
| European | 76 | 3.9% |
| Finnish | 4 | 0.2% |
| French | 49 | 2.5% |
| French Canadian | 37 | 1.9% |
| German | 553 | 28.6% |
| Greek | 23 | 1.2% |
| Hungarian | 38 | 2.0% |
| Indian (Asian) | 21 | 1.1% |
| Irish | 337 | 17.4% |
| Italian | 46 | 2.4% |
| Lebanese | 54 | 2.8% |
| Lithuanian | 7 | 0.4% |
| Mexican | 38 | 2.0% |
| Northern European | 8 | 0.4% |
| Norwegian | 149 | 7.7% |
| Polish | 21 | 1.1% |
| Puerto Rican | 11 | 0.6% |
| Russian | 22 | 1.1% |
| Scandinavian | 49 | 2.5% |
| Scotch-Irish | 82 | 4.2% |
| Scottish | 27 | 1.4% |
| Sioux | 23 | 1.2% |
| Slovene | 53 | 2.7% |
| Swedish | 131 | 6.8% |
| Ukrainian | 14 | 0.7% |
| Welsh | 6 | 0.3% | View All 38 Rows |
Immigrants in Lyons
The most numerous immigrant groups reported in Lyons came from Europe (123 | 6.4%), Western Europe (101 | 5.2%), France (47 | 2.4%), Netherlands (43 | 2.2%), and Canada (23 | 1.2%), together accounting for 17.4% of all Lyons residents.
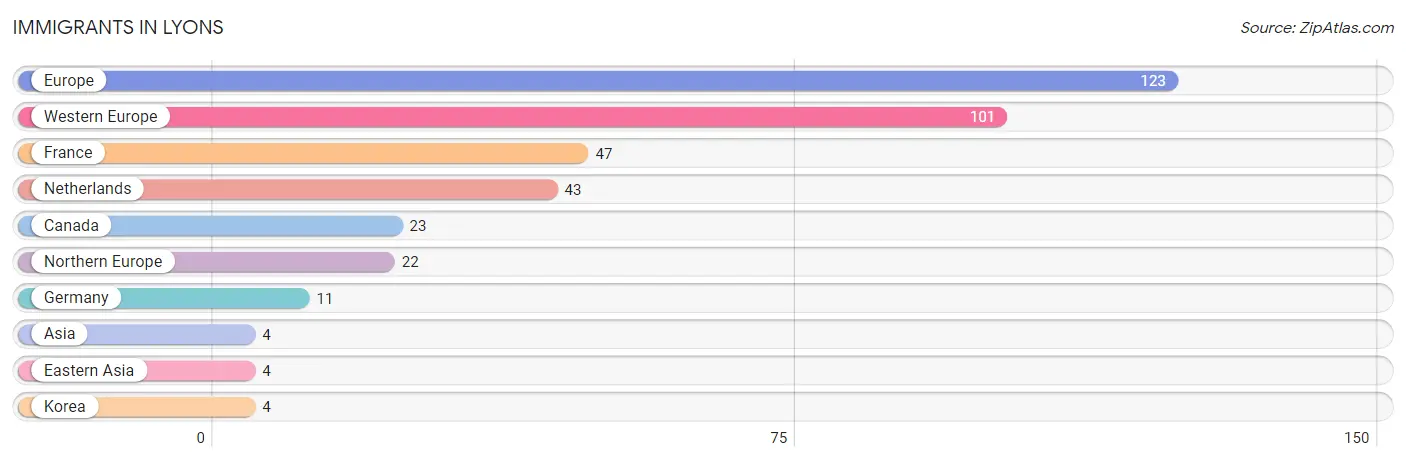
| Immigration Origin | # Population | % Population |
| Asia | 4 | 0.2% |
| Canada | 23 | 1.2% |
| Eastern Asia | 4 | 0.2% |
| Europe | 123 | 6.4% |
| France | 47 | 2.4% |
| Germany | 11 | 0.6% |
| Korea | 4 | 0.2% |
| Netherlands | 43 | 2.2% |
| Northern Europe | 22 | 1.1% |
| Western Europe | 101 | 5.2% | View All 10 Rows |
Sex and Age in Lyons
Sex and Age in Lyons
The most populous age groups in Lyons are 40 to 44 Years (156 | 16.6%) for men and 50 to 54 Years (133 | 13.3%) for women.
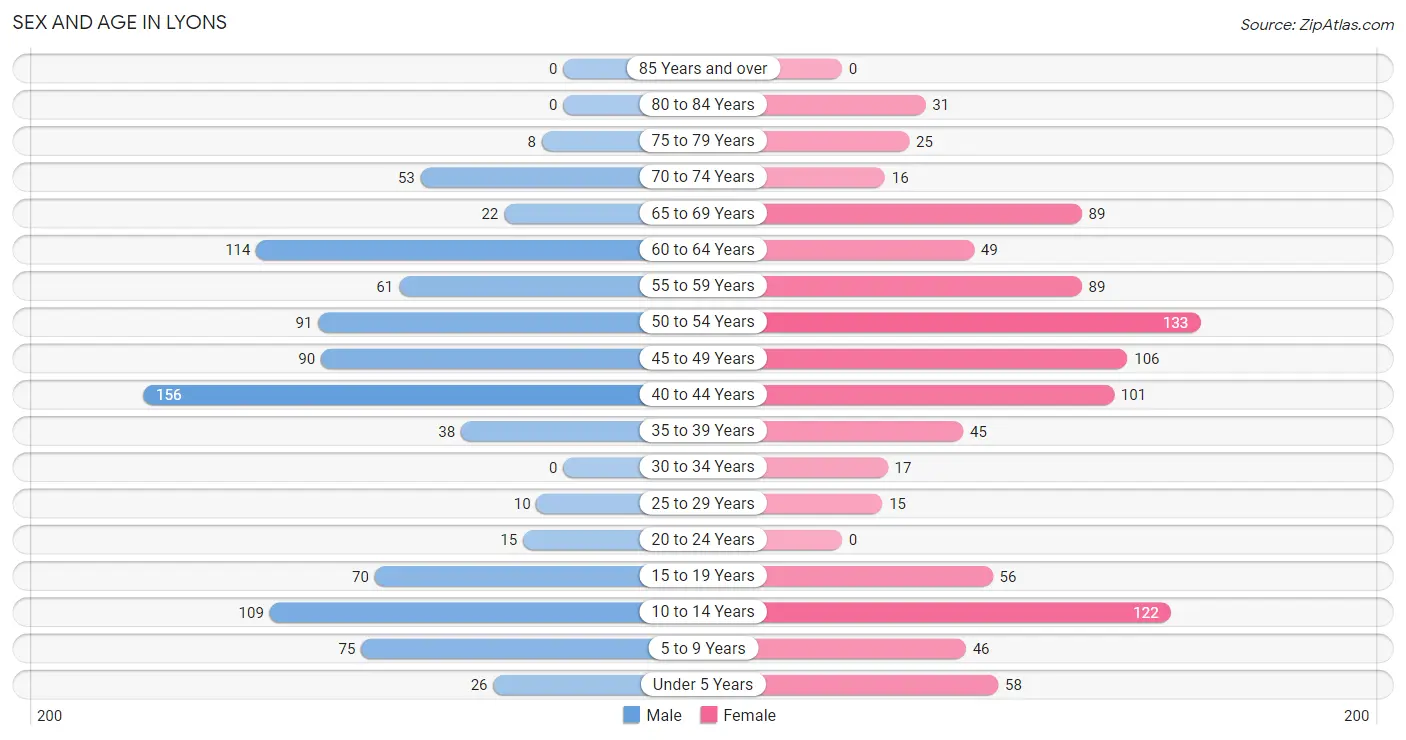
| Age Bracket | Male | Female |
| Under 5 Years | 26 (2.8%) | 58 (5.8%) |
| 5 to 9 Years | 75 (8.0%) | 46 (4.6%) |
| 10 to 14 Years | 109 (11.6%) | 122 (12.2%) |
| 15 to 19 Years | 70 (7.5%) | 56 (5.6%) |
| 20 to 24 Years | 15 (1.6%) | 0 (0.0%) |
| 25 to 29 Years | 10 (1.1%) | 15 (1.5%) |
| 30 to 34 Years | 0 (0.0%) | 17 (1.7%) |
| 35 to 39 Years | 38 (4.1%) | 45 (4.5%) |
| 40 to 44 Years | 156 (16.6%) | 101 (10.1%) |
| 45 to 49 Years | 90 (9.6%) | 106 (10.6%) |
| 50 to 54 Years | 91 (9.7%) | 133 (13.3%) |
| 55 to 59 Years | 61 (6.5%) | 89 (8.9%) |
| 60 to 64 Years | 114 (12.1%) | 49 (4.9%) |
| 65 to 69 Years | 22 (2.4%) | 89 (8.9%) |
| 70 to 74 Years | 53 (5.7%) | 16 (1.6%) |
| 75 to 79 Years | 8 (0.9%) | 25 (2.5%) |
| 80 to 84 Years | 0 (0.0%) | 31 (3.1%) |
| 85 Years and over | 0 (0.0%) | 0 (0.0%) |
| Total | 938 (100.0%) | 998 (100.0%) |
Families and Households in Lyons
Median Family Size in Lyons
The median family size in Lyons is 3.09 persons per family, with married-couple families (462 | 93.0%) accounting for the largest median family size of 3.14 persons per family. On the other hand, single female/mother families (22 | 4.4%) represent the smallest median family size with 2.18 persons per family.
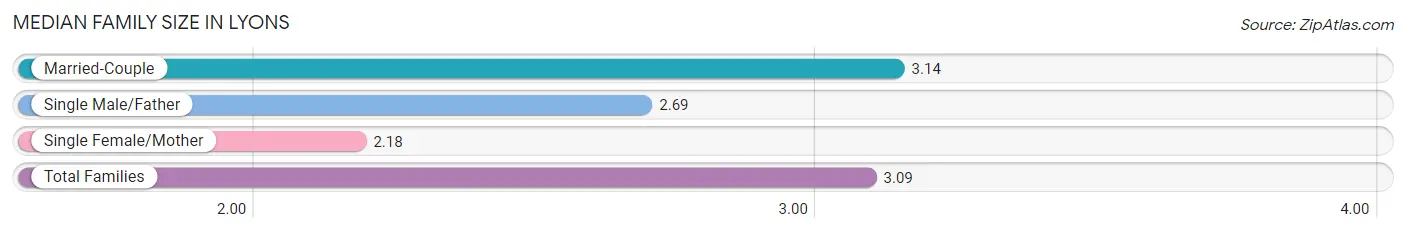
| Family Type | # Families | Family Size |
| Married-Couple | 462 (93.0%) | 3.14 |
| Single Male/Father | 13 (2.6%) | 2.69 |
| Single Female/Mother | 22 (4.4%) | 2.18 |
| Total Families | 497 (100.0%) | 3.09 |
Median Household Size in Lyons
The median household size in Lyons is 2.48 persons per household, with married-couple households (462 | 59.2%) accounting for the largest median household size of 3.14 persons per household. non-family households (284 | 36.4%) represent the smallest median household size with 1.42 persons per household.
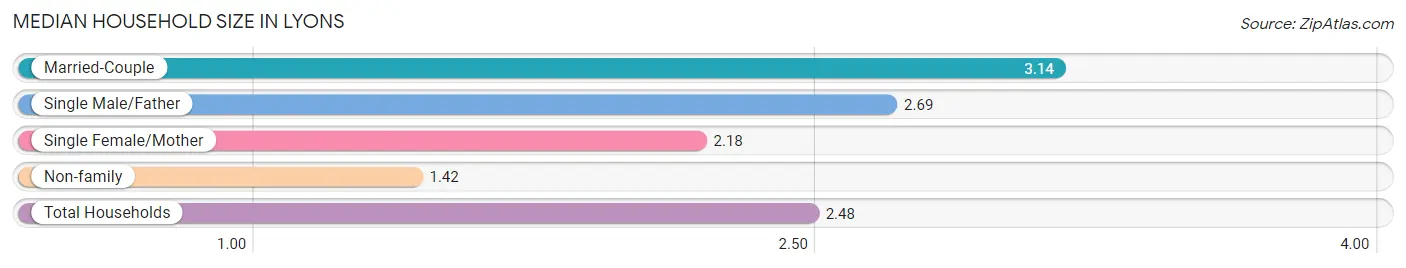
| Household Type | # Households | Household Size |
| Married-Couple | 462 (59.2%) | 3.14 |
| Single Male/Father | 13 (1.7%) | 2.69 |
| Single Female/Mother | 22 (2.8%) | 2.18 |
| Non-family | 284 (36.4%) | 1.42 |
| Total Households | 781 (100.0%) | 2.48 |
Household Size by Marriage Status in Lyons
Out of a total of 781 households in Lyons, 497 (63.6%) are family households, while 284 (36.4%) are nonfamily households. The most numerous type of family households are 2-person households, comprising 222, and the most common type of nonfamily households are 1-person households, comprising 191.
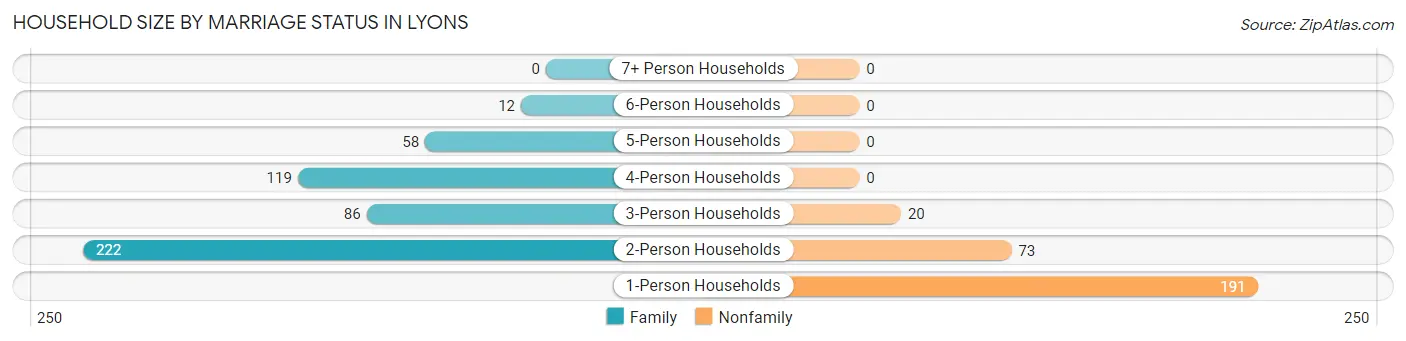
| Household Size | Family Households | Nonfamily Households |
| 1-Person Households | - | 191 (24.5%) |
| 2-Person Households | 222 (28.4%) | 73 (9.3%) |
| 3-Person Households | 86 (11.0%) | 20 (2.6%) |
| 4-Person Households | 119 (15.2%) | 0 (0.0%) |
| 5-Person Households | 58 (7.4%) | 0 (0.0%) |
| 6-Person Households | 12 (1.5%) | 0 (0.0%) |
| 7+ Person Households | 0 (0.0%) | 0 (0.0%) |
| Total | 497 (63.6%) | 284 (36.4%) |
Female Fertility in Lyons
Fertility by Age in Lyons
Average fertility rate in Lyons is 40.0 births per 1,000 women. Women in the age bracket of 20 to 34 years have the highest fertility rate with 156.0 births per 1,000 women. Women in the age bracket of 35 to 50 years acount for 64.3% of all women with births.
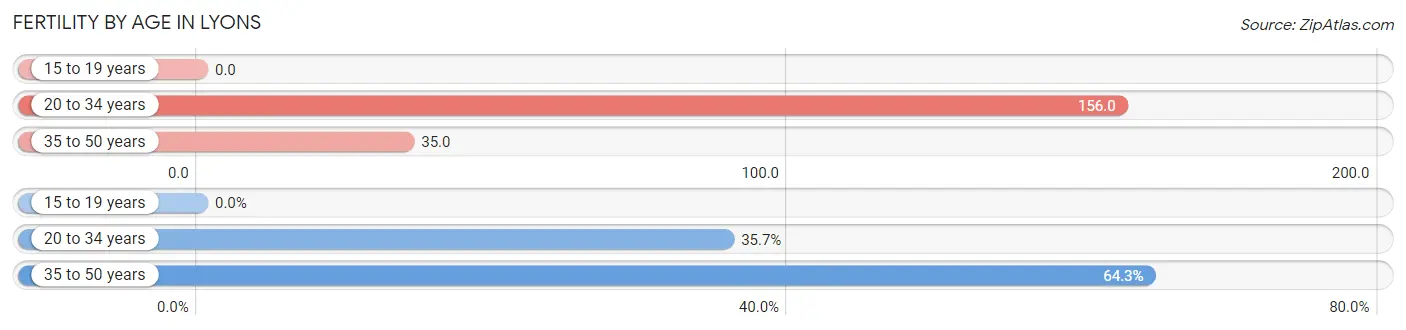
| Age Bracket | Women with Births | Births / 1,000 Women |
| 15 to 19 years | 0 (0.0%) | 0.0 |
| 20 to 34 years | 5 (35.7%) | 156.0 |
| 35 to 50 years | 9 (64.3%) | 35.0 |
| Total | 14 (100.0%) | 40.0 |
Fertility by Age by Marriage Status in Lyons
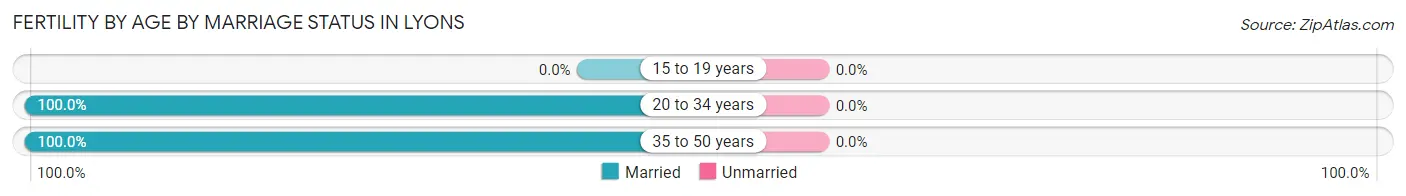
| Age Bracket | Married | Unmarried |
| 15 to 19 years | 0 (0.0%) | 0 (0.0%) |
| 20 to 34 years | 5 (100.0%) | 0 (0.0%) |
| 35 to 50 years | 9 (100.0%) | 0 (0.0%) |
| Total | 14 (100.0%) | 0 (0.0%) |
Fertility by Education in Lyons
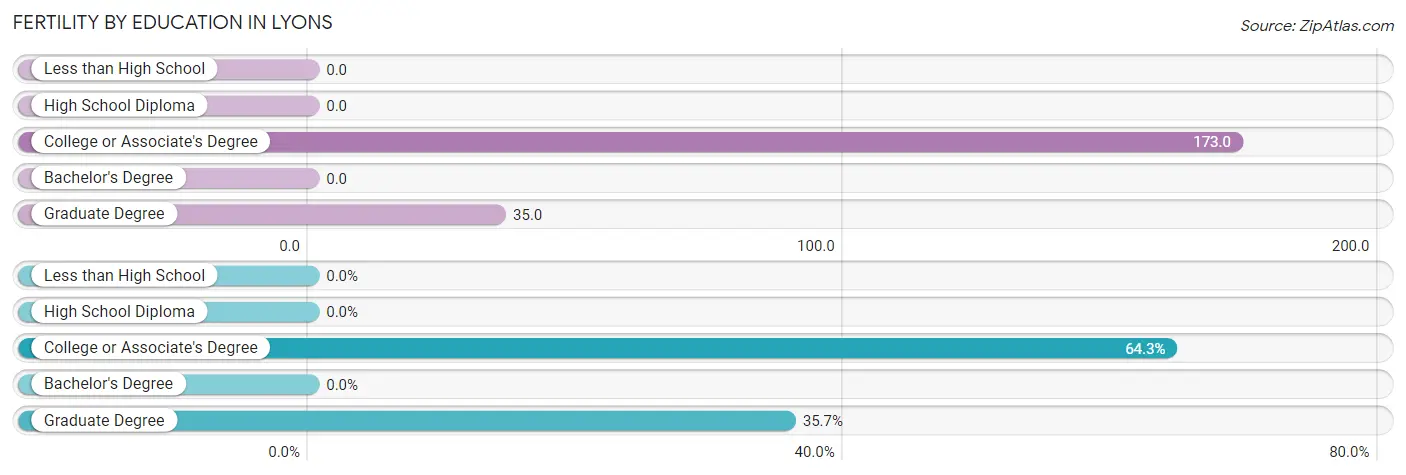
| Educational Attainment | Women with Births | Births / 1,000 Women |
| Less than High School | 0 (0.0%) | 0.0 |
| High School Diploma | 0 (0.0%) | 0.0 |
| College or Associate's Degree | 9 (64.3%) | 173.0 |
| Bachelor's Degree | 0 (0.0%) | 0.0 |
| Graduate Degree | 5 (35.7%) | 35.0 |
| Total | 14 (100.0%) | 40.0 |
Fertility by Education by Marriage Status in Lyons
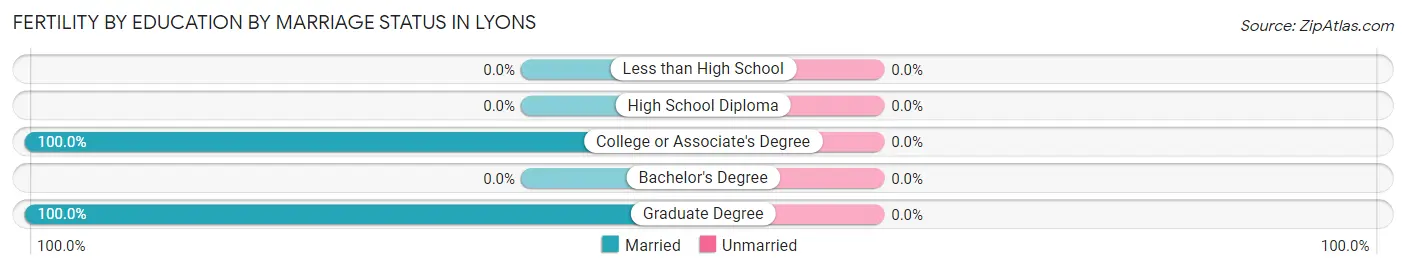
| Educational Attainment | Married | Unmarried |
| Less than High School | 0 (0.0%) | 0 (0.0%) |
| High School Diploma | 0 (0.0%) | 0 (0.0%) |
| College or Associate's Degree | 9 (100.0%) | 0 (0.0%) |
| Bachelor's Degree | 0 (0.0%) | 0 (0.0%) |
| Graduate Degree | 5 (100.0%) | 0 (0.0%) |
| Total | 14 (100.0%) | 0 (0.0%) |
Income in Lyons
Income Overview in Lyons
Per Capita Income in Lyons is $58,992, while median incomes of families and households are $164,625 and $131,179 respectively.
| Characteristic | Number | Measure |
| Per Capita Income | 1,936 | $58,992 |
| Median Family Income | 497 | $164,625 |
| Mean Family Income | 497 | $181,451 |
| Median Household Income | 781 | $131,179 |
| Mean Household Income | 781 | $146,857 |
| Income Deficit | 497 | $0 |
| Wage / Income Gap (%) | 1,936 | 24.42% |
| Wage / Income Gap ($) | 1,936 | 75.58¢ per $1 |
| Gini / Inequality Index | 1,936 | 0.40 |
Earnings by Sex in Lyons
Average Earnings in Lyons are $75,000, $88,438 for men and $66,838 for women, a difference of 24.4%.
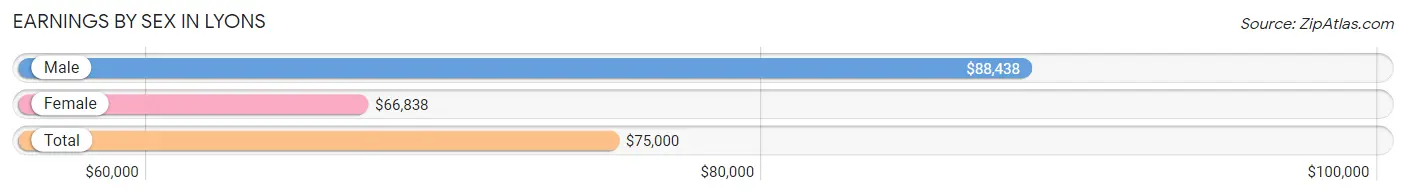
| Sex | Number | Average Earnings |
| Male | 563 (54.7%) | $88,438 |
| Female | 467 (45.3%) | $66,838 |
| Total | 1,030 (100.0%) | $75,000 |
Earnings by Sex by Income Bracket in Lyons
The most common earnings brackets in Lyons are $100,000+ for men (263 | 46.7%) and $100,000+ for women (114 | 24.4%).
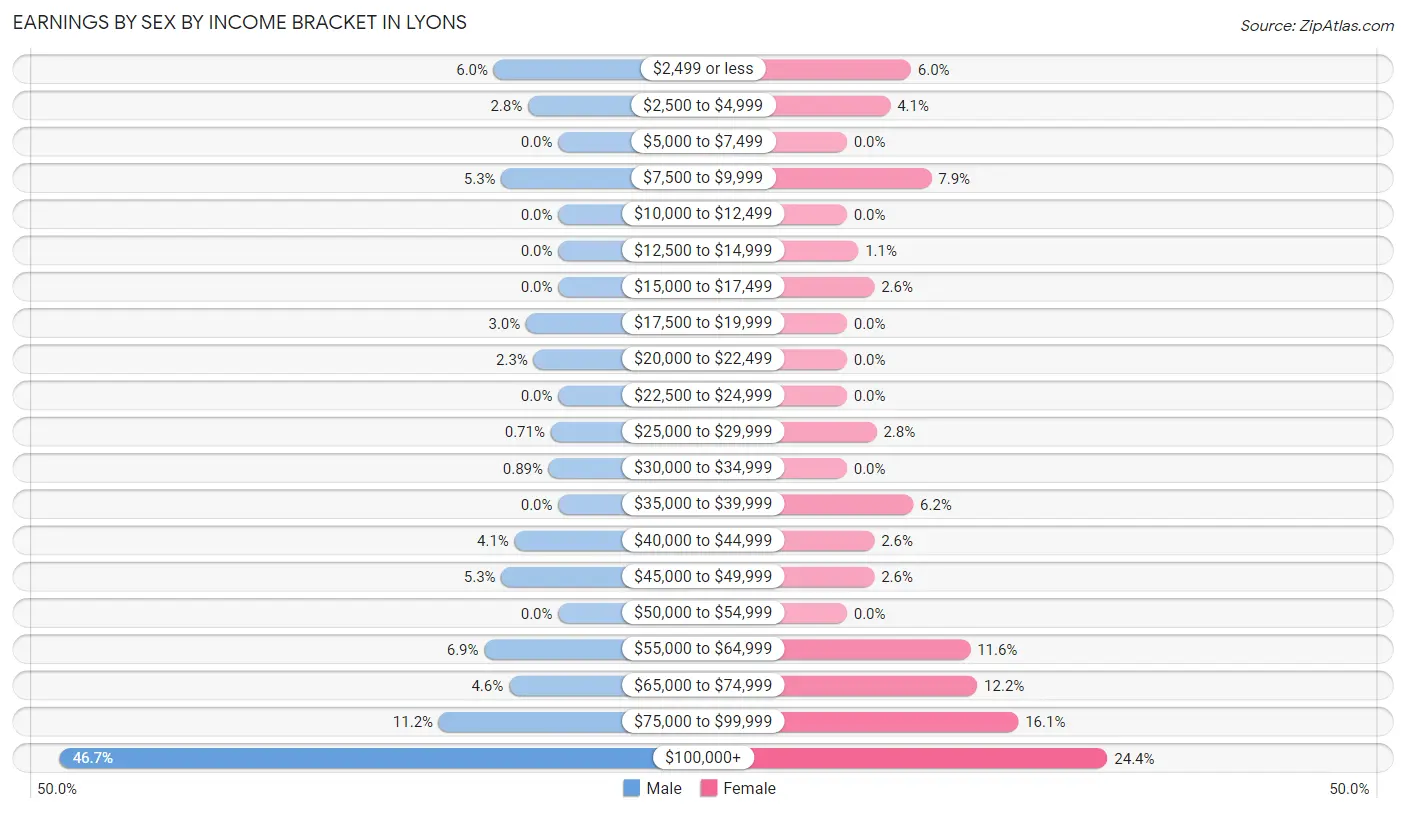
| Income | Male | Female |
| $2,499 or less | 34 (6.0%) | 28 (6.0%) |
| $2,500 to $4,999 | 16 (2.8%) | 19 (4.1%) |
| $5,000 to $7,499 | 0 (0.0%) | 0 (0.0%) |
| $7,500 to $9,999 | 30 (5.3%) | 37 (7.9%) |
| $10,000 to $12,499 | 0 (0.0%) | 0 (0.0%) |
| $12,500 to $14,999 | 0 (0.0%) | 5 (1.1%) |
| $15,000 to $17,499 | 0 (0.0%) | 12 (2.6%) |
| $17,500 to $19,999 | 17 (3.0%) | 0 (0.0%) |
| $20,000 to $22,499 | 13 (2.3%) | 0 (0.0%) |
| $22,500 to $24,999 | 0 (0.0%) | 0 (0.0%) |
| $25,000 to $29,999 | 4 (0.7%) | 13 (2.8%) |
| $30,000 to $34,999 | 5 (0.9%) | 0 (0.0%) |
| $35,000 to $39,999 | 0 (0.0%) | 29 (6.2%) |
| $40,000 to $44,999 | 23 (4.1%) | 12 (2.6%) |
| $45,000 to $49,999 | 30 (5.3%) | 12 (2.6%) |
| $50,000 to $54,999 | 0 (0.0%) | 0 (0.0%) |
| $55,000 to $64,999 | 39 (6.9%) | 54 (11.6%) |
| $65,000 to $74,999 | 26 (4.6%) | 57 (12.2%) |
| $75,000 to $99,999 | 63 (11.2%) | 75 (16.1%) |
| $100,000+ | 263 (46.7%) | 114 (24.4%) |
| Total | 563 (100.0%) | 467 (100.0%) |
Earnings by Sex by Educational Attainment in Lyons
Average earnings in Lyons are $105,694 for men and $68,333 for women, a difference of 35.3%. Men with an educational attainment of graduate degree enjoy the highest average annual earnings of $111,625, while those with bachelor's degree education earn the least with $107,500. Women with an educational attainment of bachelor's degree earn the most with the average annual earnings of $117,692, while those with college or associate's degree education have the smallest earnings of $43,438.
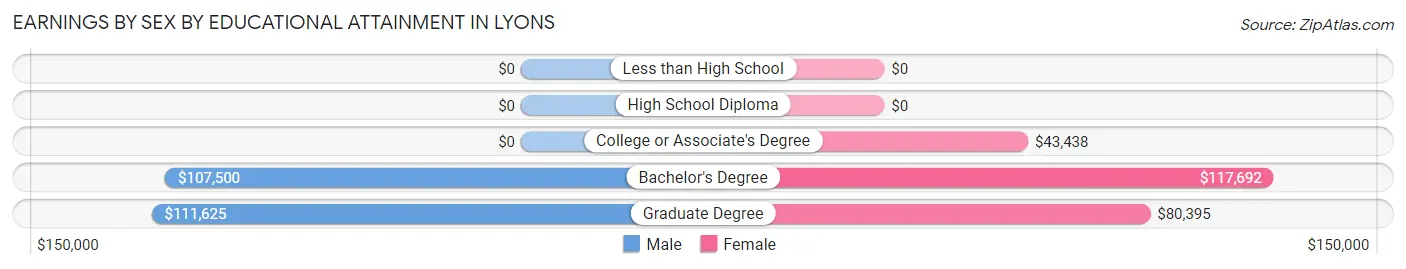
| Educational Attainment | Male Income | Female Income |
| Less than High School | - | - |
| High School Diploma | - | - |
| College or Associate's Degree | - | - |
| Bachelor's Degree | $107,500 | $117,692 |
| Graduate Degree | $111,625 | $80,395 |
| Total | $105,694 | $68,333 |
Family Income in Lyons
Family Income Brackets in Lyons
According to the Lyons family income data, there are 217 families falling into the $200,000+ income range, which is the most common income bracket and makes up 43.7% of all families.
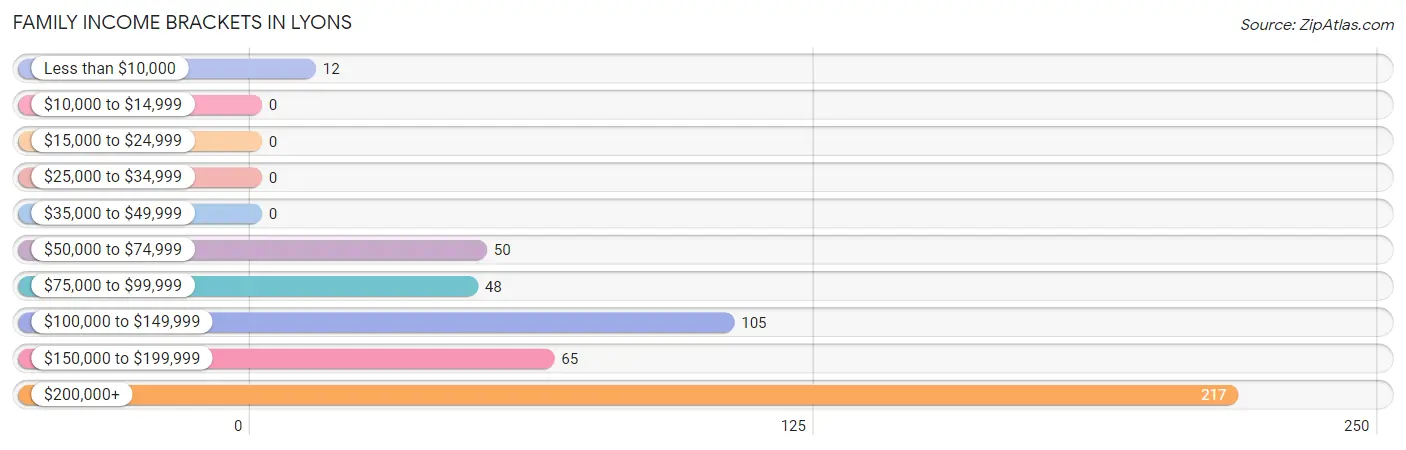
| Income Bracket | # Families | % Families |
| Less than $10,000 | 12 | 2.4% |
| $10,000 to $14,999 | 0 | 0.0% |
| $15,000 to $24,999 | 0 | 0.0% |
| $25,000 to $34,999 | 0 | 0.0% |
| $35,000 to $49,999 | 0 | 0.0% |
| $50,000 to $74,999 | 50 | 10.1% |
| $75,000 to $99,999 | 48 | 9.7% |
| $100,000 to $149,999 | 105 | 21.1% |
| $150,000 to $199,999 | 65 | 13.1% |
| $200,000+ | 217 | 43.7% |
Family Income by Famaliy Size in Lyons
4-person families (119 | 23.9%) account for the highest median family income in Lyons with $220,083 per family, while 3-person families (86 | 17.3%) have the highest median income of $70,125 per family member.
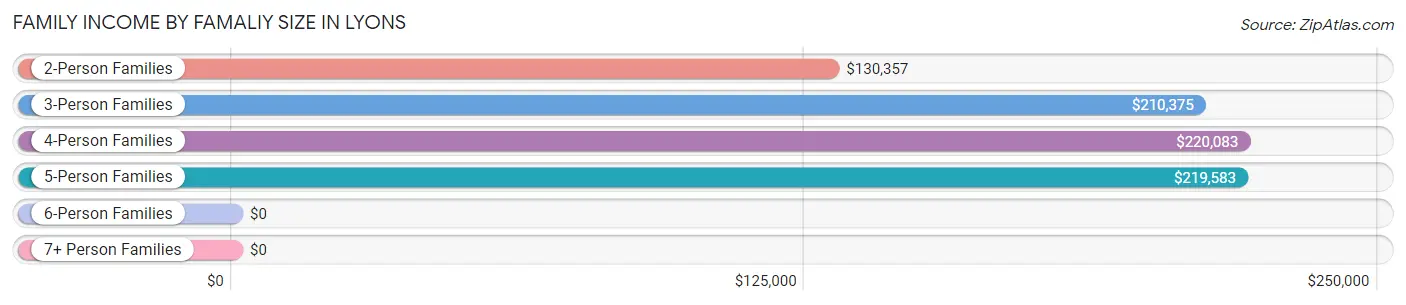
| Income Bracket | # Families | Median Income |
| 2-Person Families | 222 (44.7%) | $130,357 |
| 3-Person Families | 86 (17.3%) | $210,375 |
| 4-Person Families | 119 (23.9%) | $220,083 |
| 5-Person Families | 58 (11.7%) | $219,583 |
| 6-Person Families | 12 (2.4%) | $0 |
| 7+ Person Families | 0 (0.0%) | $0 |
| Total | 497 (100.0%) | $164,625 |
Family Income by Number of Earners in Lyons
The median family income in Lyons is $164,625, with families comprising 3+ earners (23) having the highest median family income of $250,001, while families with no earners (24) have the lowest median family income of $71,607, accounting for 4.6% and 4.8% of families, respectively.
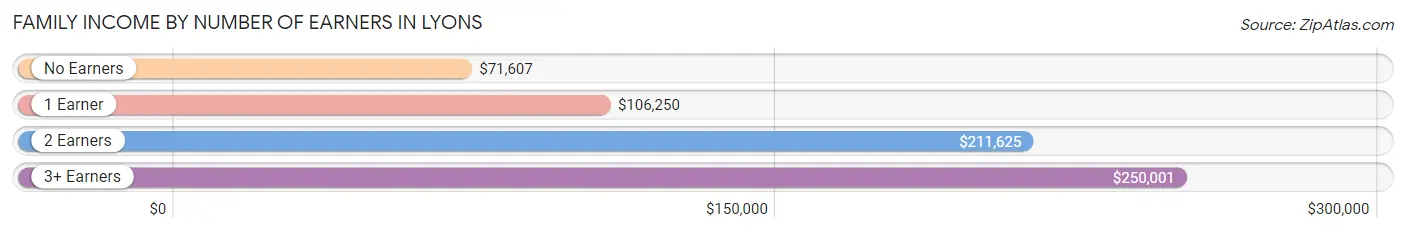
| Number of Earners | # Families | Median Income |
| No Earners | 24 (4.8%) | $71,607 |
| 1 Earner | 162 (32.6%) | $106,250 |
| 2 Earners | 288 (58.0%) | $211,625 |
| 3+ Earners | 23 (4.6%) | $250,001 |
| Total | 497 (100.0%) | $164,625 |
Household Income in Lyons
Household Income Brackets in Lyons
With 253 households falling in the category, the $200,000+ income range is the most frequent in Lyons, accounting for 32.4% of all households. In contrast, only 10 households (1.3%) fall into the $10,000 to $14,999 income bracket, making it the least populous group.
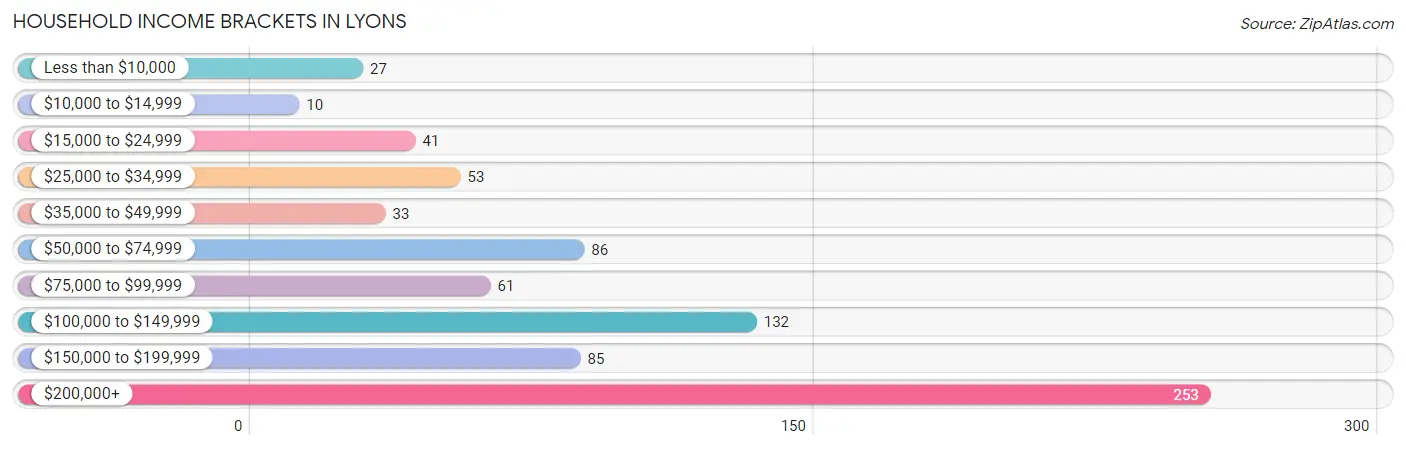
| Income Bracket | # Households | % Households |
| Less than $10,000 | 27 | 3.5% |
| $10,000 to $14,999 | 10 | 1.3% |
| $15,000 to $24,999 | 41 | 5.2% |
| $25,000 to $34,999 | 53 | 6.8% |
| $35,000 to $49,999 | 33 | 4.2% |
| $50,000 to $74,999 | 86 | 11.0% |
| $75,000 to $99,999 | 61 | 7.8% |
| $100,000 to $149,999 | 132 | 16.9% |
| $150,000 to $199,999 | 85 | 10.9% |
| $200,000+ | 253 | 32.4% |
Household Income by Householder Age in Lyons
The median household income in Lyons is $131,179, with the highest median household income of $157,411 found in the 45 to 64 years age bracket for the primary householder. A total of 409 households (52.4%) fall into this category. Meanwhile, the 15 to 24 years age bracket for the primary householder has the lowest median household income of $0, with 15 households (1.9%) in this group.
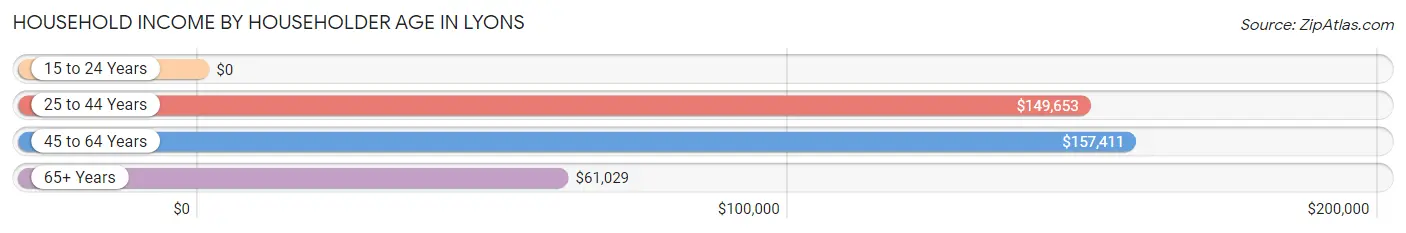
| Income Bracket | # Households | Median Income |
| 15 to 24 Years | 15 (1.9%) | $0 |
| 25 to 44 Years | 191 (24.5%) | $149,653 |
| 45 to 64 Years | 409 (52.4%) | $157,411 |
| 65+ Years | 166 (21.2%) | $61,029 |
| Total | 781 (100.0%) | $131,179 |
Poverty in Lyons
Income Below Poverty by Sex and Age in Lyons
With 7.3% poverty level for males and 2.7% for females among the residents of Lyons, 18 to 24 year old males and 75 year old and over females are the most vulnerable to poverty, with 15 males (31.9%) and 10 females (17.9%) in their respective age groups living below the poverty level.
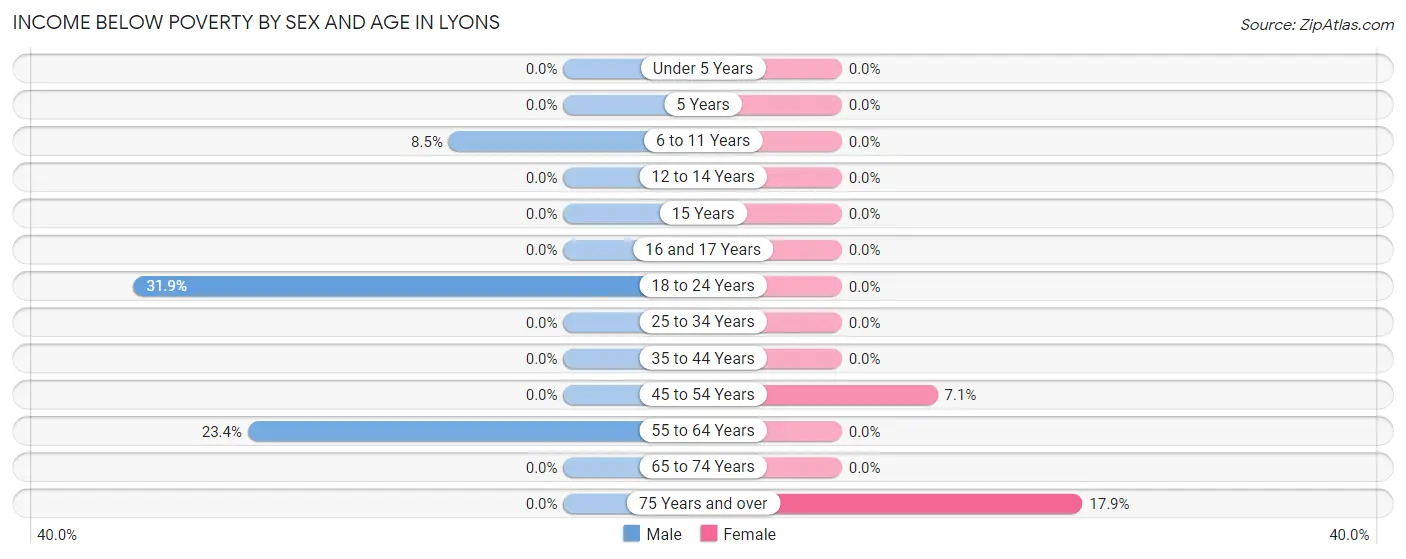
| Age Bracket | Male | Female |
| Under 5 Years | 0 (0.0%) | 0 (0.0%) |
| 5 Years | 0 (0.0%) | 0 (0.0%) |
| 6 to 11 Years | 12 (8.5%) | 0 (0.0%) |
| 12 to 14 Years | 0 (0.0%) | 0 (0.0%) |
| 15 Years | 0 (0.0%) | 0 (0.0%) |
| 16 and 17 Years | 0 (0.0%) | 0 (0.0%) |
| 18 to 24 Years | 15 (31.9%) | 0 (0.0%) |
| 25 to 34 Years | 0 (0.0%) | 0 (0.0%) |
| 35 to 44 Years | 0 (0.0%) | 0 (0.0%) |
| 45 to 54 Years | 0 (0.0%) | 17 (7.1%) |
| 55 to 64 Years | 41 (23.4%) | 0 (0.0%) |
| 65 to 74 Years | 0 (0.0%) | 0 (0.0%) |
| 75 Years and over | 0 (0.0%) | 10 (17.9%) |
| Total | 68 (7.3%) | 27 (2.7%) |
Income Above Poverty by Sex and Age in Lyons
According to the poverty statistics in Lyons, males aged under 5 years and females aged under 5 years are the age groups that are most secure financially, with 100.0% of males and 100.0% of females in these age groups living above the poverty line.
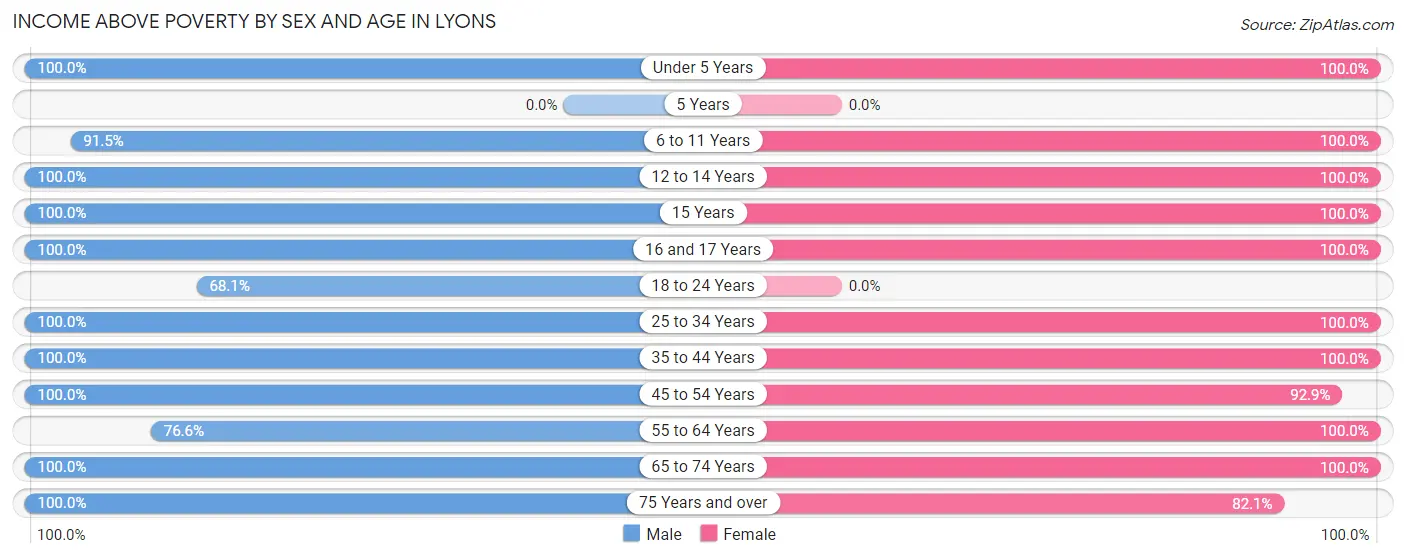
| Age Bracket | Male | Female |
| Under 5 Years | 26 (100.0%) | 58 (100.0%) |
| 5 Years | 0 (0.0%) | 0 (0.0%) |
| 6 to 11 Years | 129 (91.5%) | 125 (100.0%) |
| 12 to 14 Years | 31 (100.0%) | 43 (100.0%) |
| 15 Years | 4 (100.0%) | 18 (100.0%) |
| 16 and 17 Years | 34 (100.0%) | 38 (100.0%) |
| 18 to 24 Years | 32 (68.1%) | 0 (0.0%) |
| 25 to 34 Years | 10 (100.0%) | 32 (100.0%) |
| 35 to 44 Years | 194 (100.0%) | 146 (100.0%) |
| 45 to 54 Years | 181 (100.0%) | 222 (92.9%) |
| 55 to 64 Years | 134 (76.6%) | 138 (100.0%) |
| 65 to 74 Years | 75 (100.0%) | 105 (100.0%) |
| 75 Years and over | 8 (100.0%) | 46 (82.1%) |
| Total | 858 (92.7%) | 971 (97.3%) |
Income Below Poverty Among Married-Couple Families in Lyons
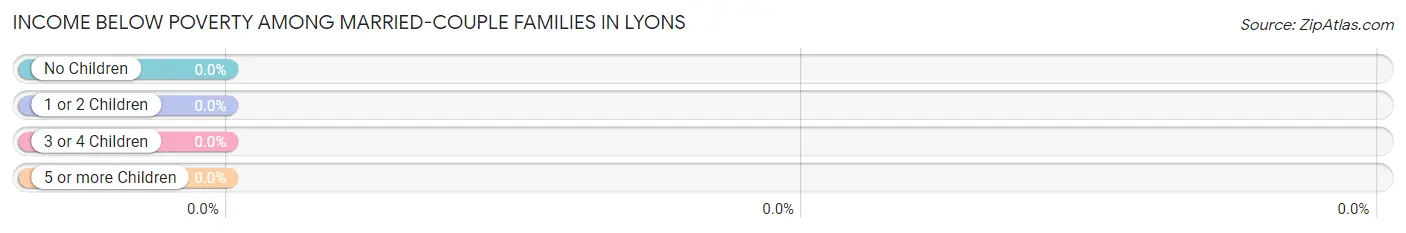
| Children | Above Poverty | Below Poverty |
| No Children | 196 (100.0%) | 0 (0.0%) |
| 1 or 2 Children | 208 (100.0%) | 0 (0.0%) |
| 3 or 4 Children | 58 (100.0%) | 0 (0.0%) |
| 5 or more Children | 0 (0.0%) | 0 (0.0%) |
| Total | 462 (100.0%) | 0 (0.0%) |
Income Below Poverty Among Single-Parent Households in Lyons
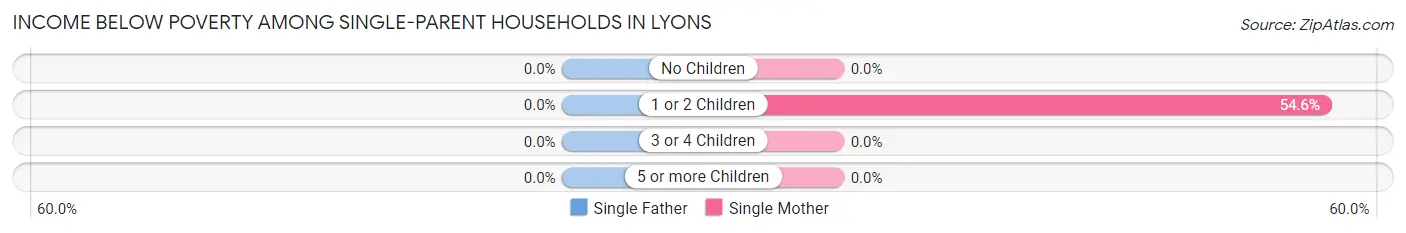
| Children | Single Father | Single Mother |
| No Children | 0 (0.0%) | 0 (0.0%) |
| 1 or 2 Children | 0 (0.0%) | 12 (54.5%) |
| 3 or 4 Children | 0 (0.0%) | 0 (0.0%) |
| 5 or more Children | 0 (0.0%) | 0 (0.0%) |
| Total | 0 (0.0%) | 12 (54.5%) |
Income Below Poverty Among Married-Couple vs Single-Parent Households in Lyons
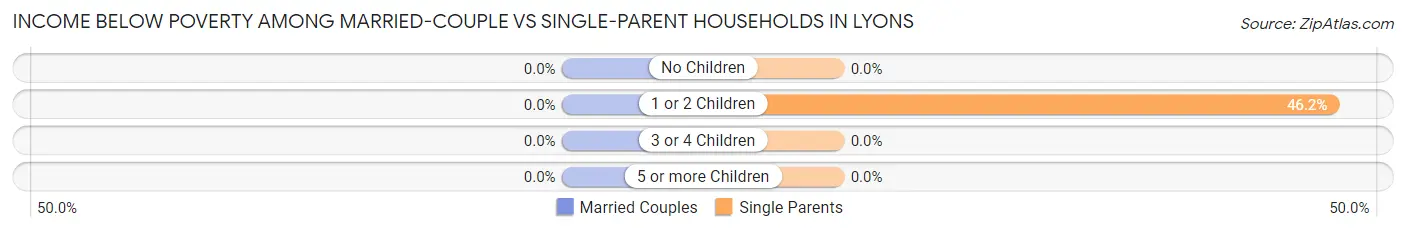
| Children | Married-Couple Families | Single-Parent Households |
| No Children | 0 (0.0%) | 0 (0.0%) |
| 1 or 2 Children | 0 (0.0%) | 12 (46.2%) |
| 3 or 4 Children | 0 (0.0%) | 0 (0.0%) |
| 5 or more Children | 0 (0.0%) | 0 (0.0%) |
| Total | 0 (0.0%) | 12 (34.3%) |
Employment Characteristics in Lyons
Employment by Class of Employer in Lyons
Among the 910 employed individuals in Lyons, private company employees (401 | 44.1%), not-for-profit organizations (208 | 22.9%), and self-employed (not incorporated) (114 | 12.5%) make up the most common classes of employment.
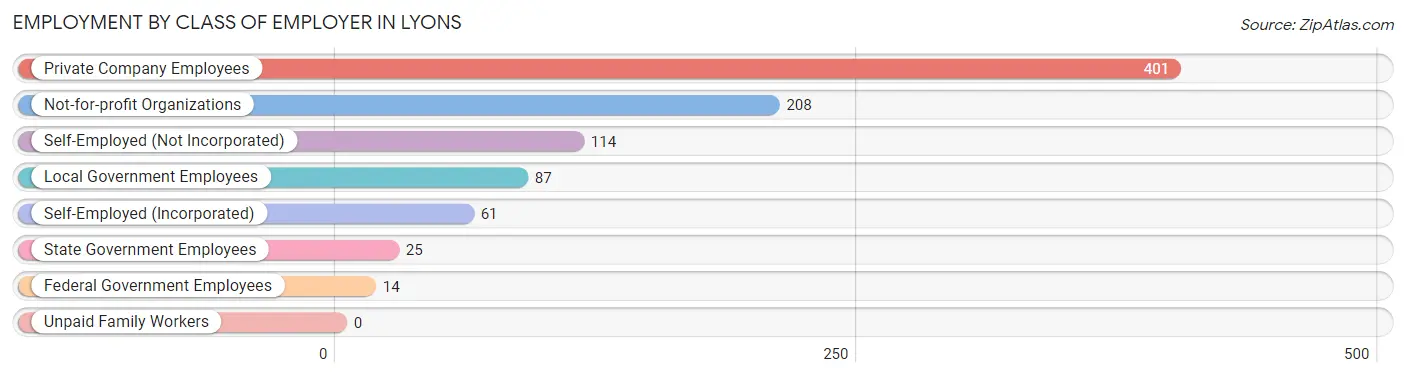
| Employer Class | # Employees | % Employees |
| Private Company Employees | 401 | 44.1% |
| Self-Employed (Incorporated) | 61 | 6.7% |
| Self-Employed (Not Incorporated) | 114 | 12.5% |
| Not-for-profit Organizations | 208 | 22.9% |
| Local Government Employees | 87 | 9.6% |
| State Government Employees | 25 | 2.8% |
| Federal Government Employees | 14 | 1.5% |
| Unpaid Family Workers | 0 | 0.0% |
| Total | 910 | 100.0% |
Employment Status by Age in Lyons
According to the labor force statistics for Lyons, out of the total population over 16 years of age (1,478), 64.1% or 947 individuals are in the labor force, with 3.4% or 32 of them unemployed. The age group with the highest labor force participation rate is 35 to 44 years, with 88.8% or 302 individuals in the labor force. Within the labor force, the 45 to 54 years age range has the highest percentage of unemployed individuals, with 8.7% or 32 of them being unemployed.
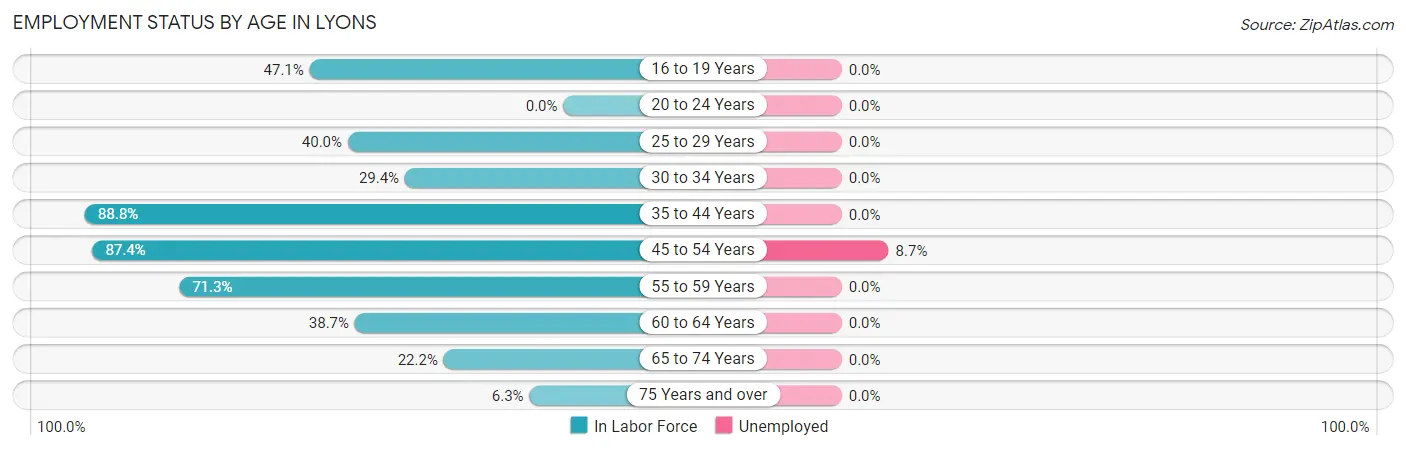
| Age Bracket | In Labor Force | Unemployed |
| 16 to 19 Years | 49 (47.1%) | 0 (0.0%) |
| 20 to 24 Years | 0 (0.0%) | 0 (0.0%) |
| 25 to 29 Years | 10 (40.0%) | 0 (0.0%) |
| 30 to 34 Years | 5 (29.4%) | 0 (0.0%) |
| 35 to 44 Years | 302 (88.8%) | 0 (0.0%) |
| 45 to 54 Years | 367 (87.4%) | 32 (8.7%) |
| 55 to 59 Years | 107 (71.3%) | 0 (0.0%) |
| 60 to 64 Years | 63 (38.7%) | 0 (0.0%) |
| 65 to 74 Years | 40 (22.2%) | 0 (0.0%) |
| 75 Years and over | 4 (6.3%) | 0 (0.0%) |
| Total | 947 (64.1%) | 32 (3.4%) |
Employment Status by Educational Attainment in Lyons
According to labor force statistics for Lyons, 76.6% of individuals (854) out of the total population between 25 and 64 years of age (1,115) are in the labor force, with 3.7% or 32 of them being unemployed. The group with the highest labor force participation rate are those with the educational attainment of less than high school, with 100.0% or 21 individuals in the labor force. Within the labor force, individuals with bachelor's degree or higher education have the highest percentage of unemployment, with 4.5% or 32 of them being unemployed.
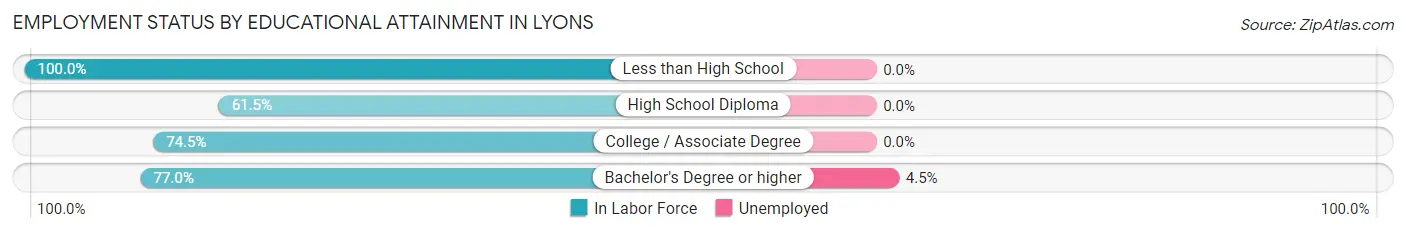
| Educational Attainment | In Labor Force | Unemployed |
| Less than High School | 21 (100.0%) | 0 (0.0%) |
| High School Diploma | 24 (61.5%) | 0 (0.0%) |
| College / Associate Degree | 105 (74.5%) | 0 (0.0%) |
| Bachelor's Degree or higher | 704 (77.0%) | 41 (4.5%) |
| Total | 854 (76.6%) | 41 (3.7%) |
Employment Occupations by Sex in Lyons
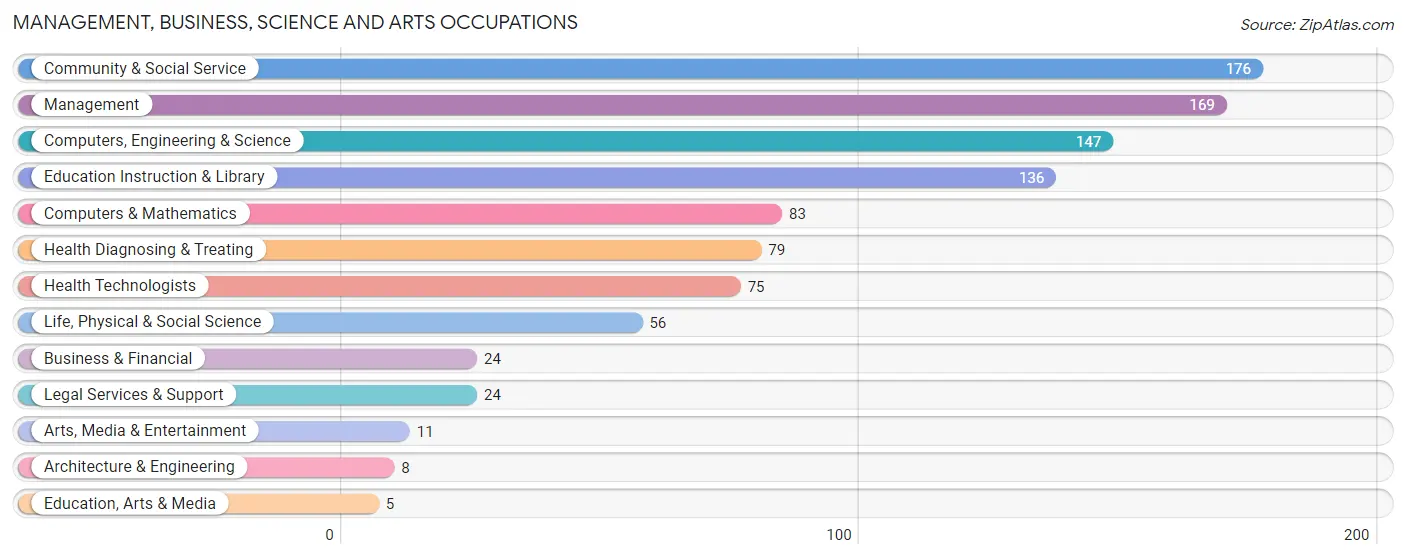
Management, Business, Science and Arts Occupations
The most common Management, Business, Science and Arts occupations in Lyons are Community & Social Service (176 | 19.2%), Management (169 | 18.5%), Computers, Engineering & Science (147 | 16.1%), Education Instruction & Library (136 | 14.9%), and Computers & Mathematics (83 | 9.1%).
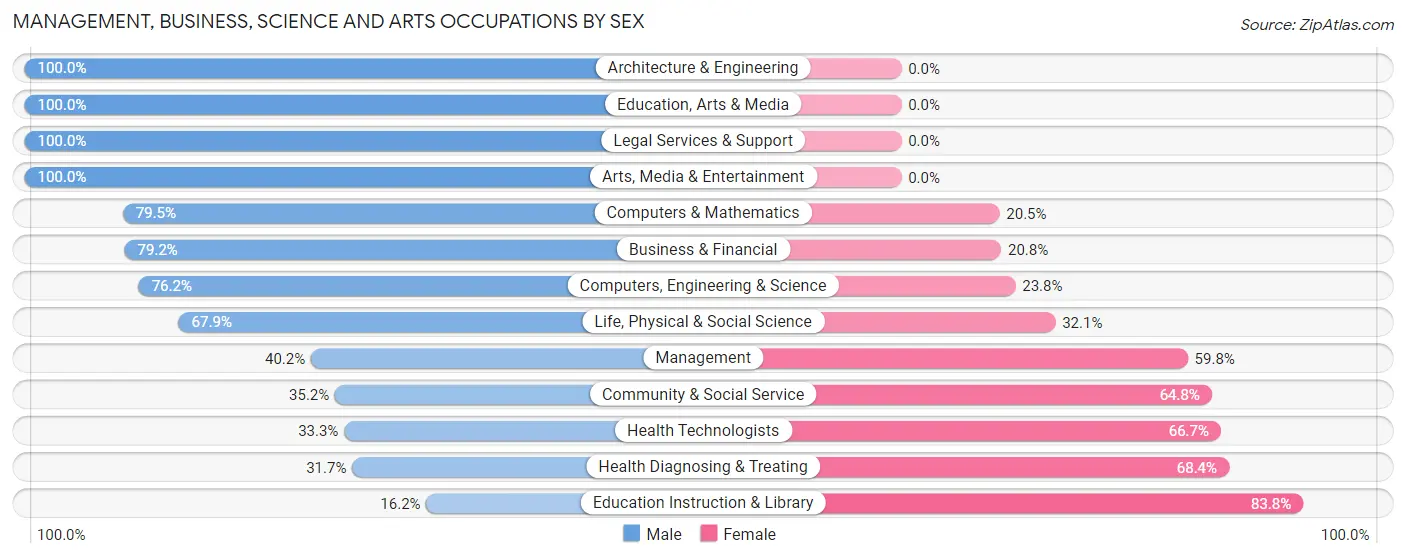
Management, Business, Science and Arts Occupations by Sex
Within the Management, Business, Science and Arts occupations in Lyons, the most male-oriented occupations are Architecture & Engineering (100.0%), Education, Arts & Media (100.0%), and Legal Services & Support (100.0%), while the most female-oriented occupations are Education Instruction & Library (83.8%), Health Diagnosing & Treating (68.3%), and Health Technologists (66.7%).
| Occupation | Male | Female |
| Management | 68 (40.2%) | 101 (59.8%) |
| Business & Financial | 19 (79.2%) | 5 (20.8%) |
| Computers, Engineering & Science | 112 (76.2%) | 35 (23.8%) |
| Computers & Mathematics | 66 (79.5%) | 17 (20.5%) |
| Architecture & Engineering | 8 (100.0%) | 0 (0.0%) |
| Life, Physical & Social Science | 38 (67.9%) | 18 (32.1%) |
| Community & Social Service | 62 (35.2%) | 114 (64.8%) |
| Education, Arts & Media | 5 (100.0%) | 0 (0.0%) |
| Legal Services & Support | 24 (100.0%) | 0 (0.0%) |
| Education Instruction & Library | 22 (16.2%) | 114 (83.8%) |
| Arts, Media & Entertainment | 11 (100.0%) | 0 (0.0%) |
| Health Diagnosing & Treating | 25 (31.7%) | 54 (68.3%) |
| Health Technologists | 25 (33.3%) | 50 (66.7%) |
| Total (Category) | 286 (48.1%) | 309 (51.9%) |
| Total (Overall) | 471 (51.5%) | 444 (48.5%) |
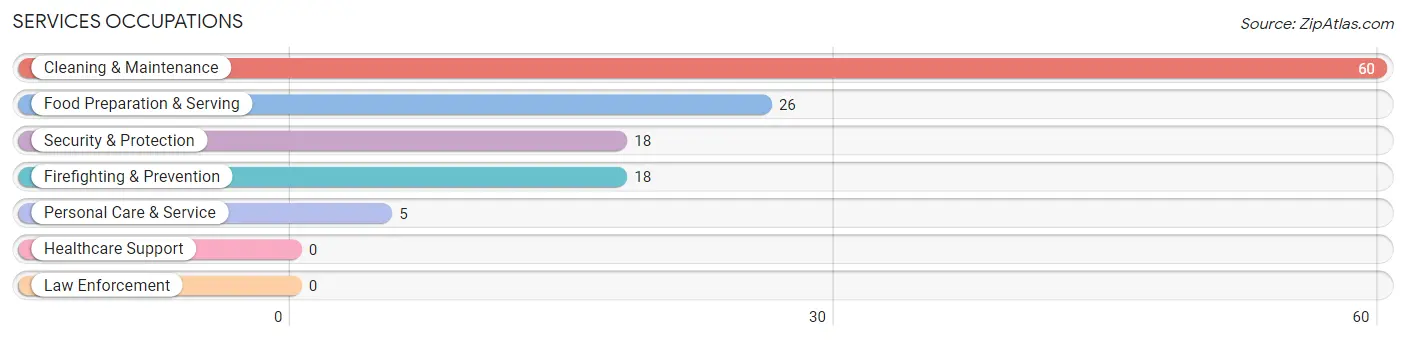
Services Occupations
The most common Services occupations in Lyons are Cleaning & Maintenance (60 | 6.6%), Food Preparation & Serving (26 | 2.8%), Security & Protection (18 | 2.0%), Firefighting & Prevention (18 | 2.0%), and Personal Care & Service (5 | 0.5%).
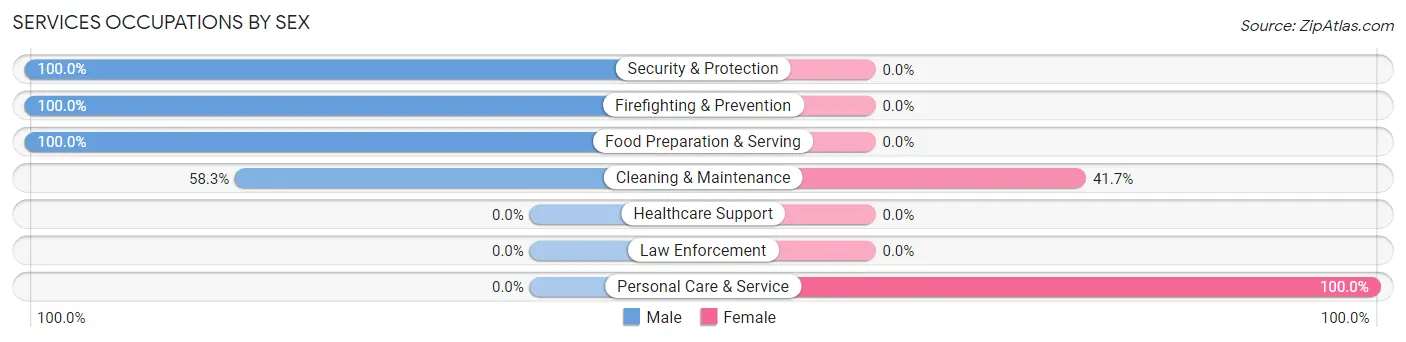
Services Occupations by Sex
Within the Services occupations in Lyons, the most male-oriented occupations are Security & Protection (100.0%), Firefighting & Prevention (100.0%), and Food Preparation & Serving (100.0%), while the most female-oriented occupations are Personal Care & Service (100.0%), and Cleaning & Maintenance (41.7%).
| Occupation | Male | Female |
| Healthcare Support | 0 (0.0%) | 0 (0.0%) |
| Security & Protection | 18 (100.0%) | 0 (0.0%) |
| Firefighting & Prevention | 18 (100.0%) | 0 (0.0%) |
| Law Enforcement | 0 (0.0%) | 0 (0.0%) |
| Food Preparation & Serving | 26 (100.0%) | 0 (0.0%) |
| Cleaning & Maintenance | 35 (58.3%) | 25 (41.7%) |
| Personal Care & Service | 0 (0.0%) | 5 (100.0%) |
| Total (Category) | 79 (72.5%) | 30 (27.5%) |
| Total (Overall) | 471 (51.5%) | 444 (48.5%) |
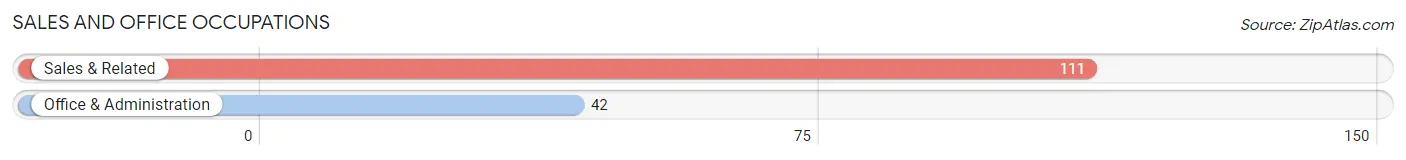
Sales and Office Occupations
The most common Sales and Office occupations in Lyons are Sales & Related (111 | 12.1%), and Office & Administration (42 | 4.6%).
Sales and Office Occupations by Sex
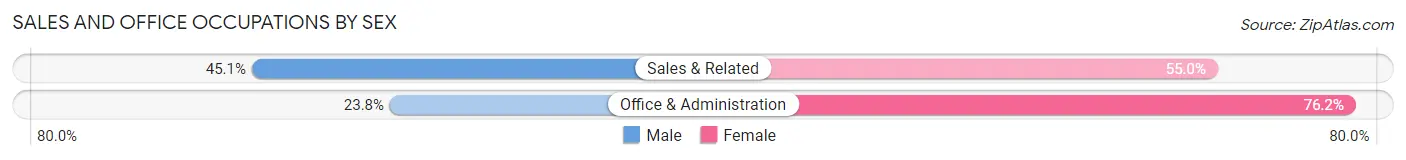
| Occupation | Male | Female |
| Sales & Related | 50 (45.1%) | 61 (54.9%) |
| Office & Administration | 10 (23.8%) | 32 (76.2%) |
| Total (Category) | 60 (39.2%) | 93 (60.8%) |
| Total (Overall) | 471 (51.5%) | 444 (48.5%) |
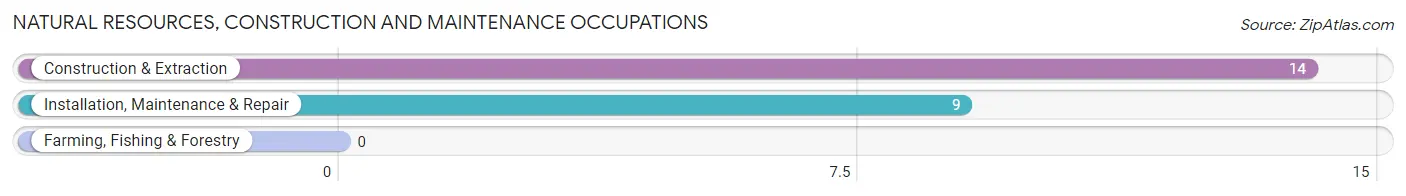
Natural Resources, Construction and Maintenance Occupations
The most common Natural Resources, Construction and Maintenance occupations in Lyons are Construction & Extraction (14 | 1.5%), and Installation, Maintenance & Repair (9 | 1.0%).
Natural Resources, Construction and Maintenance Occupations by Sex
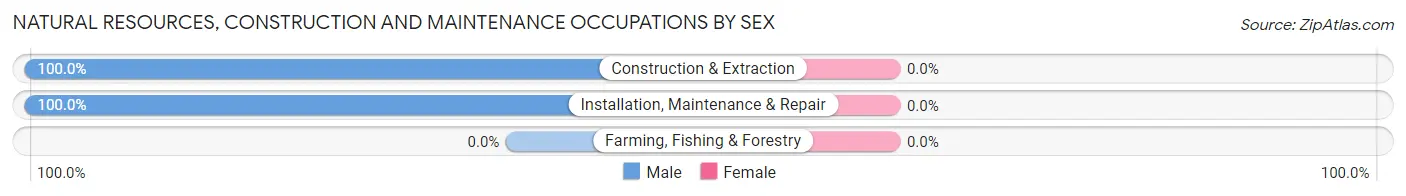
| Occupation | Male | Female |
| Farming, Fishing & Forestry | 0 (0.0%) | 0 (0.0%) |
| Construction & Extraction | 14 (100.0%) | 0 (0.0%) |
| Installation, Maintenance & Repair | 9 (100.0%) | 0 (0.0%) |
| Total (Category) | 23 (100.0%) | 0 (0.0%) |
| Total (Overall) | 471 (51.5%) | 444 (48.5%) |
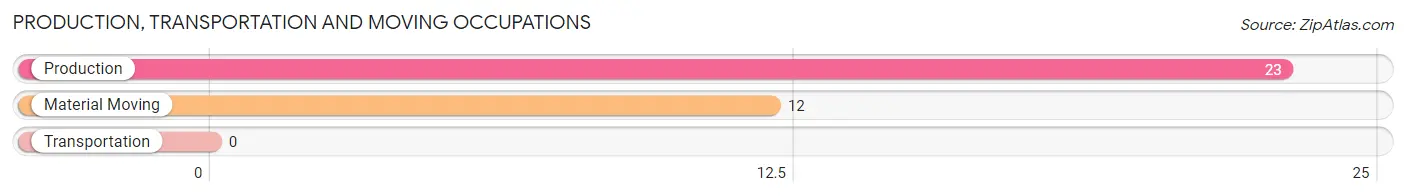
Production, Transportation and Moving Occupations
The most common Production, Transportation and Moving occupations in Lyons are Production (23 | 2.5%), and Material Moving (12 | 1.3%).
Production, Transportation and Moving Occupations by Sex
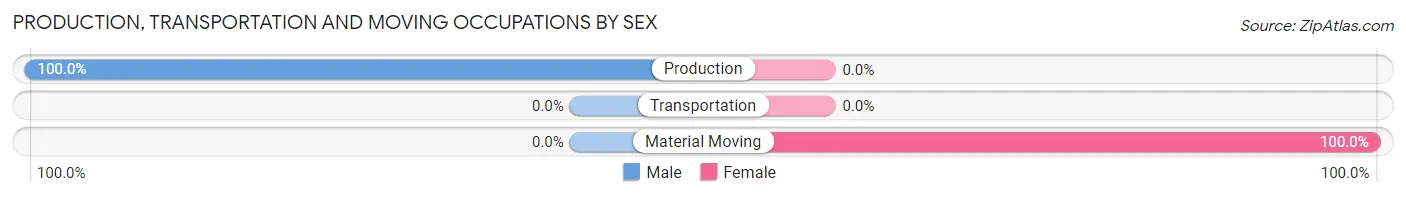
| Occupation | Male | Female |
| Production | 23 (100.0%) | 0 (0.0%) |
| Transportation | 0 (0.0%) | 0 (0.0%) |
| Material Moving | 0 (0.0%) | 12 (100.0%) |
| Total (Category) | 23 (65.7%) | 12 (34.3%) |
| Total (Overall) | 471 (51.5%) | 444 (48.5%) |
Employment Industries by Sex in Lyons
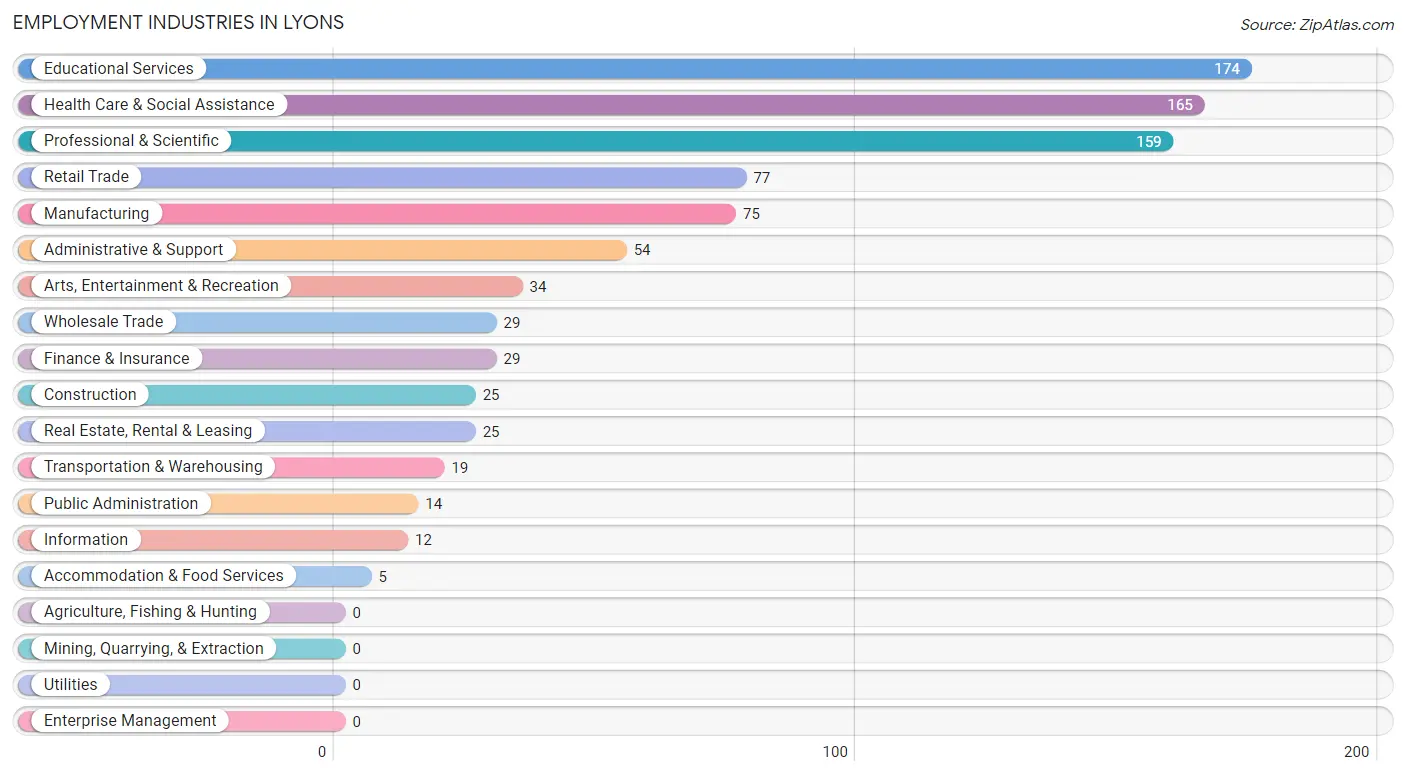
Employment Industries in Lyons
The major employment industries in Lyons include Educational Services (174 | 19.0%), Health Care & Social Assistance (165 | 18.0%), Professional & Scientific (159 | 17.4%), Retail Trade (77 | 8.4%), and Manufacturing (75 | 8.2%).
Employment Industries by Sex in Lyons
The Lyons industries that see more men than women are Information (100.0%), Real Estate, Rental & Leasing (100.0%), and Accommodation & Food Services (100.0%), whereas the industries that tend to have a higher number of women are Wholesale Trade (79.3%), Educational Services (68.4%), and Health Care & Social Assistance (62.4%).
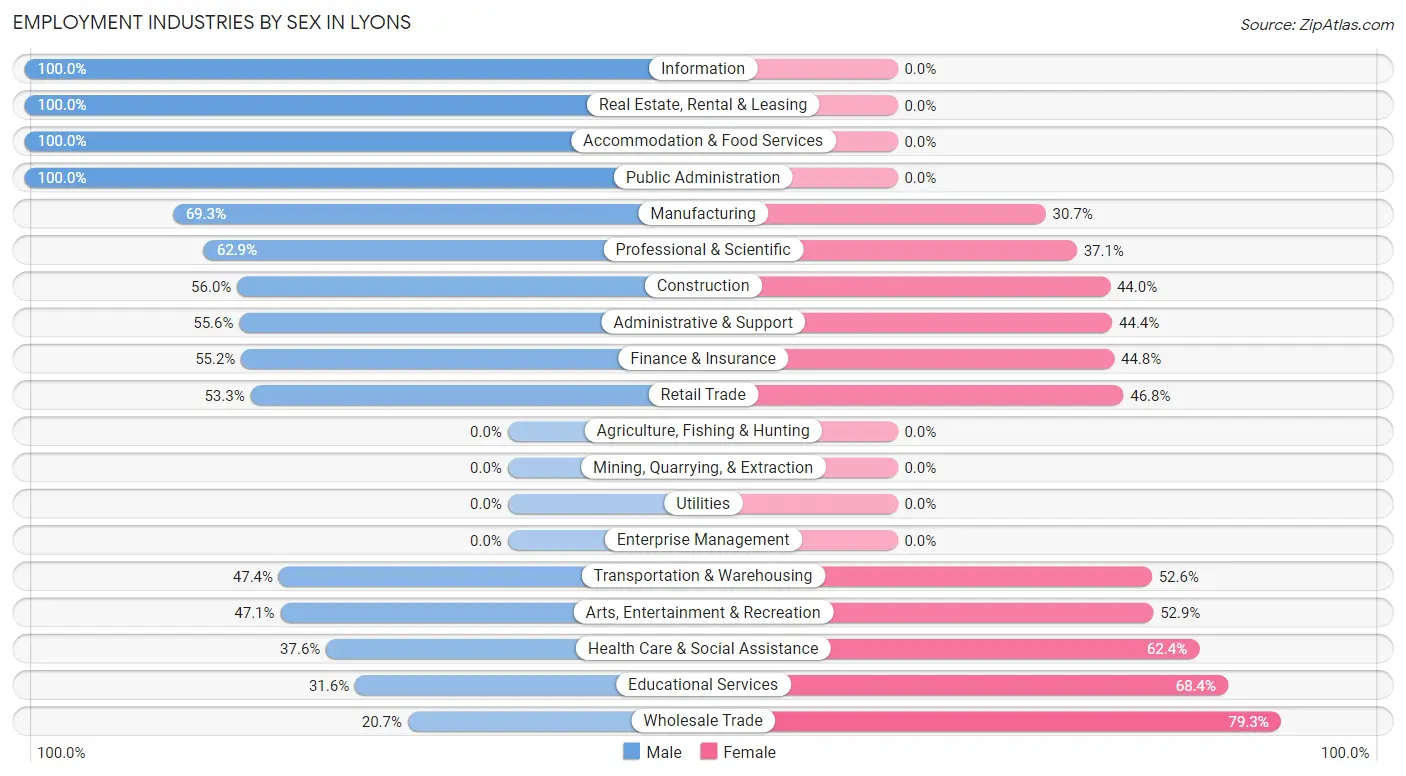
| Industry | Male | Female |
| Agriculture, Fishing & Hunting | 0 (0.0%) | 0 (0.0%) |
| Mining, Quarrying, & Extraction | 0 (0.0%) | 0 (0.0%) |
| Construction | 14 (56.0%) | 11 (44.0%) |
| Manufacturing | 52 (69.3%) | 23 (30.7%) |
| Wholesale Trade | 6 (20.7%) | 23 (79.3%) |
| Retail Trade | 41 (53.2%) | 36 (46.8%) |
| Transportation & Warehousing | 9 (47.4%) | 10 (52.6%) |
| Utilities | 0 (0.0%) | 0 (0.0%) |
| Information | 12 (100.0%) | 0 (0.0%) |
| Finance & Insurance | 16 (55.2%) | 13 (44.8%) |
| Real Estate, Rental & Leasing | 25 (100.0%) | 0 (0.0%) |
| Professional & Scientific | 100 (62.9%) | 59 (37.1%) |
| Enterprise Management | 0 (0.0%) | 0 (0.0%) |
| Administrative & Support | 30 (55.6%) | 24 (44.4%) |
| Educational Services | 55 (31.6%) | 119 (68.4%) |
| Health Care & Social Assistance | 62 (37.6%) | 103 (62.4%) |
| Arts, Entertainment & Recreation | 16 (47.1%) | 18 (52.9%) |
| Accommodation & Food Services | 5 (100.0%) | 0 (0.0%) |
| Public Administration | 14 (100.0%) | 0 (0.0%) |
| Total | 471 (51.5%) | 444 (48.5%) |
Education in Lyons
School Enrollment in Lyons
The most common levels of schooling among the 562 students in Lyons are middle school (195 | 34.7%), elementary school (133 | 23.7%), and high school (118 | 21.0%).
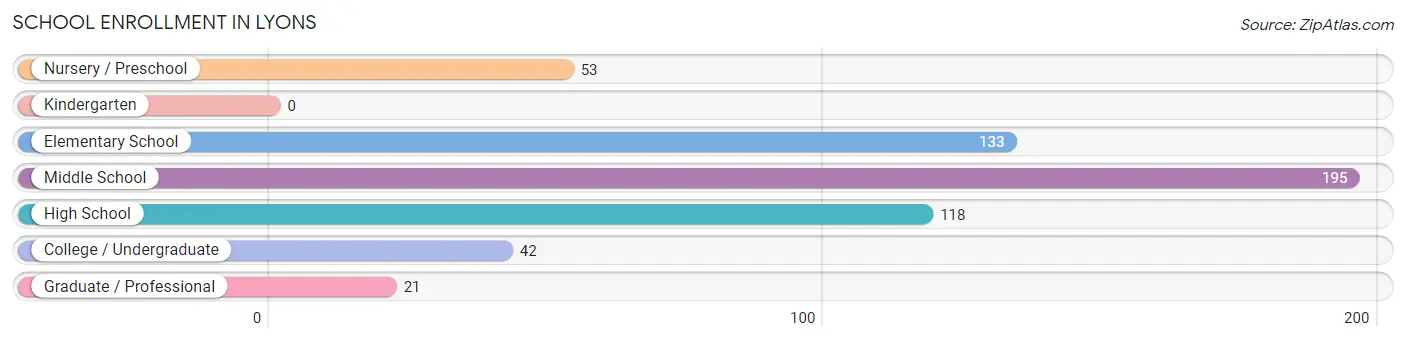
| School Level | # Students | % Students |
| Nursery / Preschool | 53 | 9.4% |
| Kindergarten | 0 | 0.0% |
| Elementary School | 133 | 23.7% |
| Middle School | 195 | 34.7% |
| High School | 118 | 21.0% |
| College / Undergraduate | 42 | 7.5% |
| Graduate / Professional | 21 | 3.7% |
| Total | 562 | 100.0% |
School Enrollment by Age by Funding Source in Lyons
Out of a total of 562 students who are enrolled in schools in Lyons, 127 (22.6%) attend a private institution, while the remaining 435 (77.4%) are enrolled in public schools. The age group of 3 to 4 year olds has the highest likelihood of being enrolled in private schools, with 45 (84.9% in the age bracket) enrolled. Conversely, the age group of 15 to 17 year olds has the lowest likelihood of being enrolled in a private school, with 94 (100.0% in the age bracket) attending a public institution.
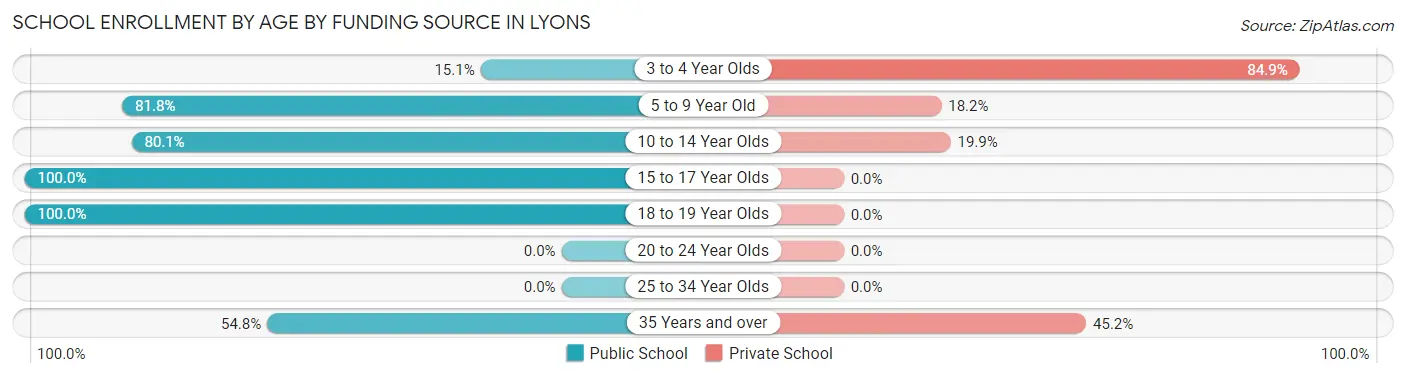
| Age Bracket | Public School | Private School |
| 3 to 4 Year Olds | 8 (15.1%) | 45 (84.9%) |
| 5 to 9 Year Old | 99 (81.8%) | 22 (18.2%) |
| 10 to 14 Year Olds | 185 (80.1%) | 46 (19.9%) |
| 15 to 17 Year Olds | 94 (100.0%) | 0 (0.0%) |
| 18 to 19 Year Olds | 32 (100.0%) | 0 (0.0%) |
| 20 to 24 Year Olds | 0 (0.0%) | 0 (0.0%) |
| 25 to 34 Year Olds | 0 (0.0%) | 0 (0.0%) |
| 35 Years and over | 17 (54.8%) | 14 (45.2%) |
| Total | 435 (77.4%) | 127 (22.6%) |
Educational Attainment by Field of Study in Lyons
Business (181 | 15.8%), education (163 | 14.3%), social sciences (117 | 10.2%), science & technology (97 | 8.5%), and communications (80 | 7.0%) are the most common fields of study among 1,143 individuals in Lyons who have obtained a bachelor's degree or higher.
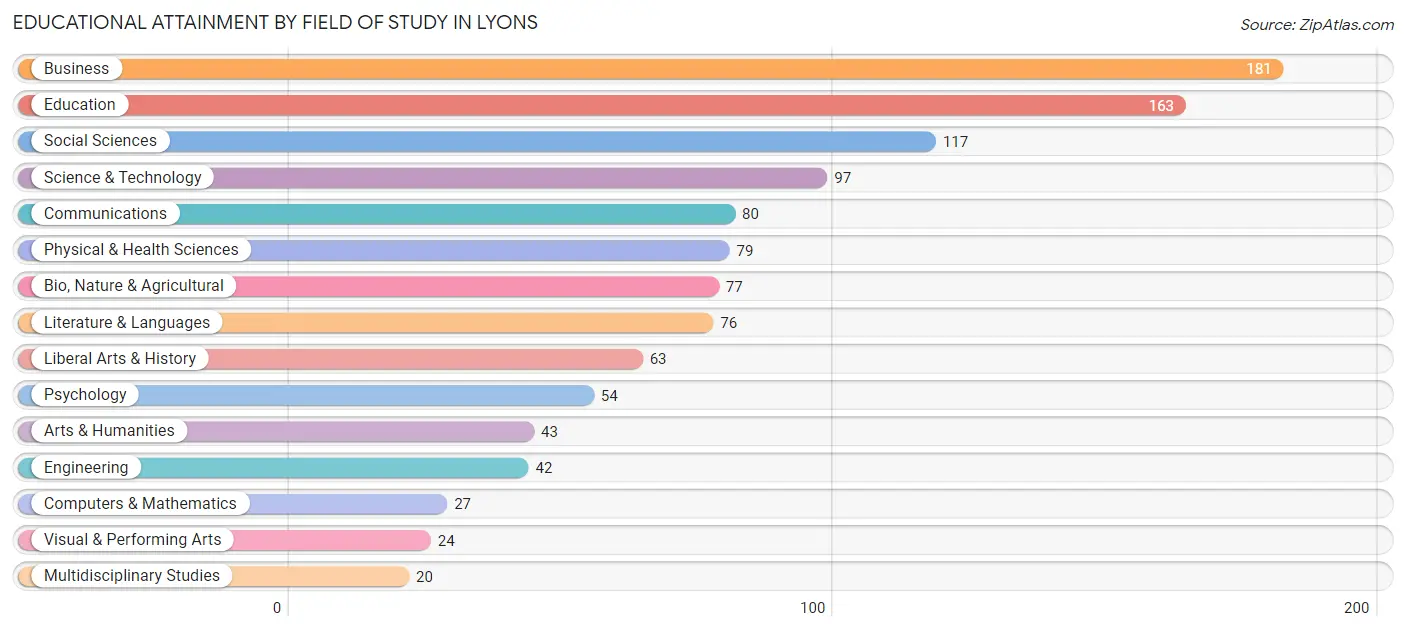
| Field of Study | # Graduates | % Graduates |
| Computers & Mathematics | 27 | 2.4% |
| Bio, Nature & Agricultural | 77 | 6.7% |
| Physical & Health Sciences | 79 | 6.9% |
| Psychology | 54 | 4.7% |
| Social Sciences | 117 | 10.2% |
| Engineering | 42 | 3.7% |
| Multidisciplinary Studies | 20 | 1.8% |
| Science & Technology | 97 | 8.5% |
| Business | 181 | 15.8% |
| Education | 163 | 14.3% |
| Literature & Languages | 76 | 6.7% |
| Liberal Arts & History | 63 | 5.5% |
| Visual & Performing Arts | 24 | 2.1% |
| Communications | 80 | 7.0% |
| Arts & Humanities | 43 | 3.8% |
| Total | 1,143 | 100.0% |
Transportation & Commute in Lyons
Vehicle Availability by Sex in Lyons
The most prevalent vehicle ownership categories in Lyons are males with 2 vehicles (248, accounting for 52.6%) and females with 2 vehicles (235, making up 56.5%).
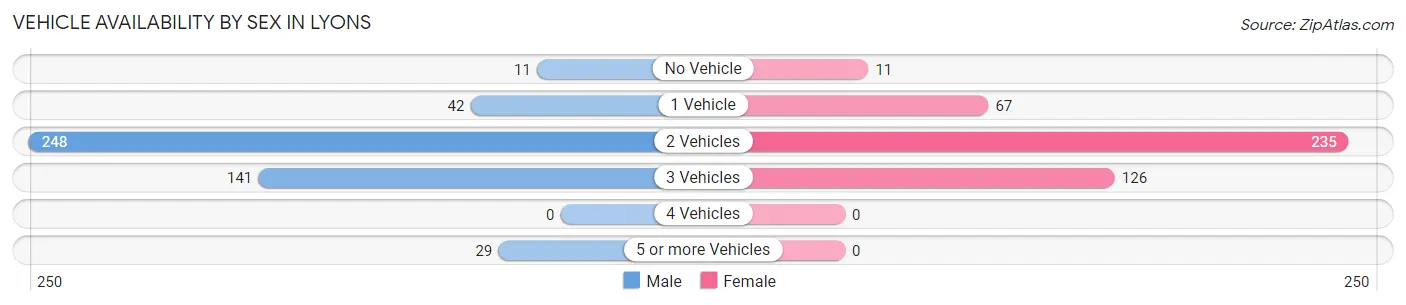
| Vehicles Available | Male | Female |
| No Vehicle | 11 (2.3%) | 11 (2.5%) |
| 1 Vehicle | 42 (8.9%) | 67 (15.3%) |
| 2 Vehicles | 248 (52.6%) | 235 (53.5%) |
| 3 Vehicles | 141 (29.9%) | 126 (28.7%) |
| 4 Vehicles | 0 (0.0%) | 0 (0.0%) |
| 5 or more Vehicles | 29 (6.2%) | 0 (0.0%) |
| Total | 471 (100.0%) | 439 (100.0%) |
Commute Time in Lyons
The most frequently occuring commute durations in Lyons are 30 to 34 minutes (167 commuters, 24.7%), 20 to 24 minutes (103 commuters, 15.3%), and 5 to 9 minutes (96 commuters, 14.2%).
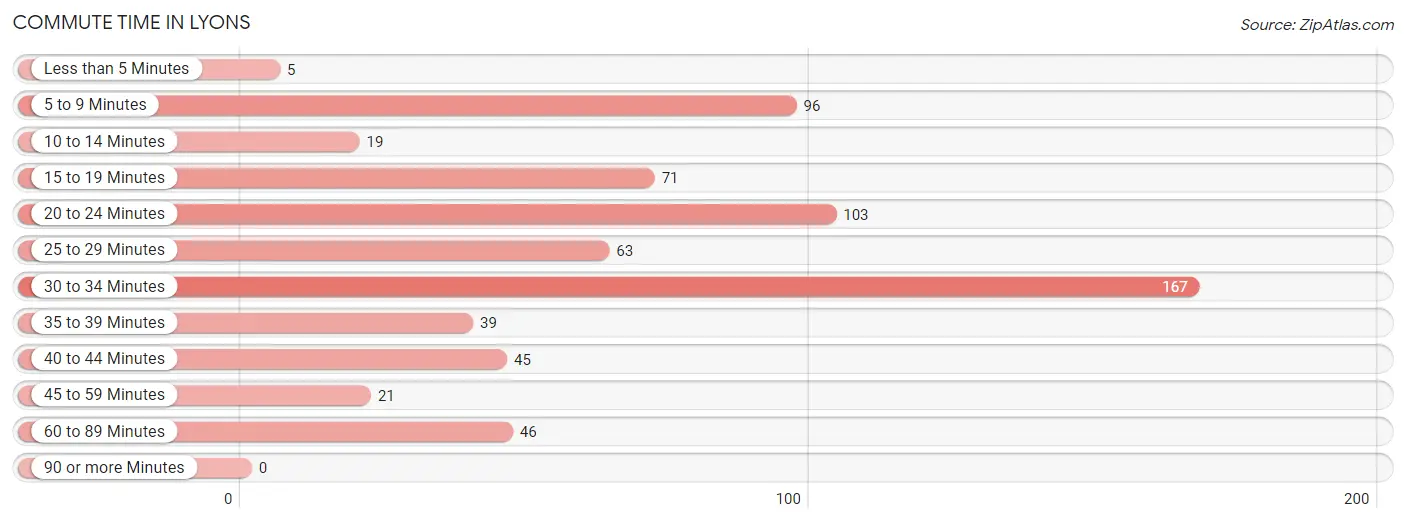
| Commute Time | # Commuters | % Commuters |
| Less than 5 Minutes | 5 | 0.7% |
| 5 to 9 Minutes | 96 | 14.2% |
| 10 to 14 Minutes | 19 | 2.8% |
| 15 to 19 Minutes | 71 | 10.5% |
| 20 to 24 Minutes | 103 | 15.3% |
| 25 to 29 Minutes | 63 | 9.3% |
| 30 to 34 Minutes | 167 | 24.7% |
| 35 to 39 Minutes | 39 | 5.8% |
| 40 to 44 Minutes | 45 | 6.7% |
| 45 to 59 Minutes | 21 | 3.1% |
| 60 to 89 Minutes | 46 | 6.8% |
| 90 or more Minutes | 0 | 0.0% |
Commute Time by Sex in Lyons
The most common commute times in Lyons are 30 to 34 minutes (116 commuters, 34.1%) for males and 20 to 24 minutes (82 commuters, 24.5%) for females.
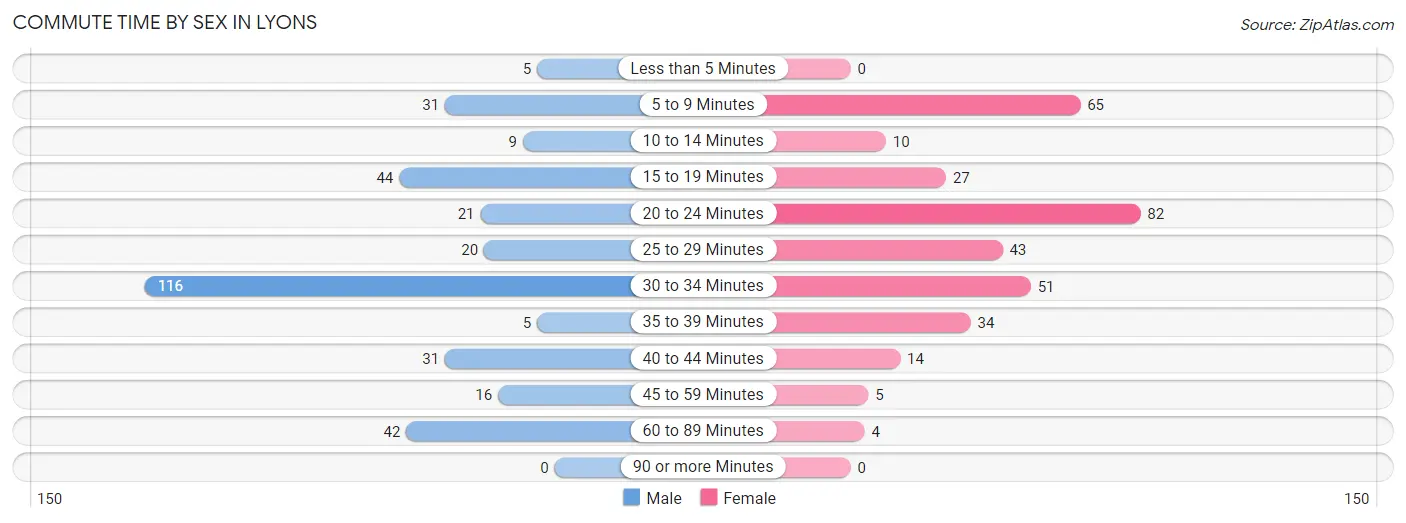
| Commute Time | Male | Female |
| Less than 5 Minutes | 5 (1.5%) | 0 (0.0%) |
| 5 to 9 Minutes | 31 (9.1%) | 65 (19.4%) |
| 10 to 14 Minutes | 9 (2.6%) | 10 (3.0%) |
| 15 to 19 Minutes | 44 (12.9%) | 27 (8.1%) |
| 20 to 24 Minutes | 21 (6.2%) | 82 (24.5%) |
| 25 to 29 Minutes | 20 (5.9%) | 43 (12.8%) |
| 30 to 34 Minutes | 116 (34.1%) | 51 (15.2%) |
| 35 to 39 Minutes | 5 (1.5%) | 34 (10.2%) |
| 40 to 44 Minutes | 31 (9.1%) | 14 (4.2%) |
| 45 to 59 Minutes | 16 (4.7%) | 5 (1.5%) |
| 60 to 89 Minutes | 42 (12.3%) | 4 (1.2%) |
| 90 or more Minutes | 0 (0.0%) | 0 (0.0%) |
Time of Departure to Work by Sex in Lyons
The most frequent times of departure to work in Lyons are 8:00 AM to 8:29 AM (117, 34.4%) for males and 7:30 AM to 7:59 AM (100, 29.8%) for females.
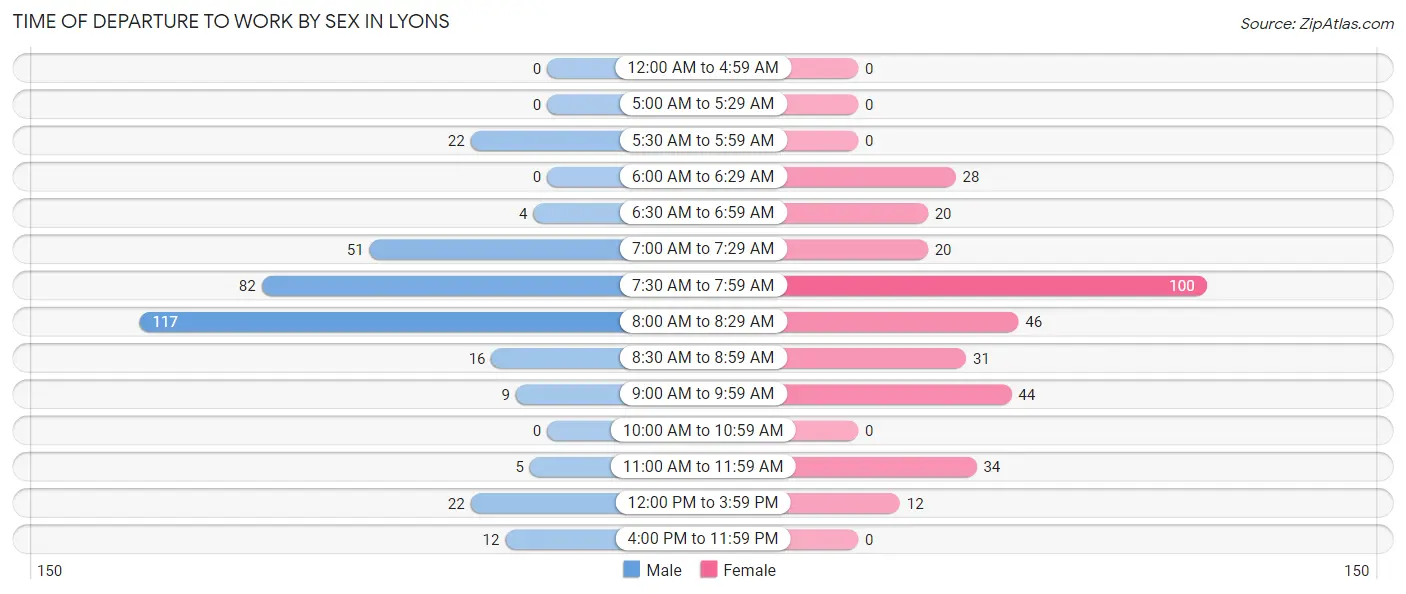
| Time of Departure | Male | Female |
| 12:00 AM to 4:59 AM | 0 (0.0%) | 0 (0.0%) |
| 5:00 AM to 5:29 AM | 0 (0.0%) | 0 (0.0%) |
| 5:30 AM to 5:59 AM | 22 (6.5%) | 0 (0.0%) |
| 6:00 AM to 6:29 AM | 0 (0.0%) | 28 (8.4%) |
| 6:30 AM to 6:59 AM | 4 (1.2%) | 20 (6.0%) |
| 7:00 AM to 7:29 AM | 51 (15.0%) | 20 (6.0%) |
| 7:30 AM to 7:59 AM | 82 (24.1%) | 100 (29.8%) |
| 8:00 AM to 8:29 AM | 117 (34.4%) | 46 (13.7%) |
| 8:30 AM to 8:59 AM | 16 (4.7%) | 31 (9.2%) |
| 9:00 AM to 9:59 AM | 9 (2.6%) | 44 (13.1%) |
| 10:00 AM to 10:59 AM | 0 (0.0%) | 0 (0.0%) |
| 11:00 AM to 11:59 AM | 5 (1.5%) | 34 (10.2%) |
| 12:00 PM to 3:59 PM | 22 (6.5%) | 12 (3.6%) |
| 4:00 PM to 11:59 PM | 12 (3.5%) | 0 (0.0%) |
| Total | 340 (100.0%) | 335 (100.0%) |
Housing Occupancy in Lyons
Occupancy by Ownership in Lyons
Of the total 781 dwellings in Lyons, owner-occupied units account for 591 (75.7%), while renter-occupied units make up 190 (24.3%).
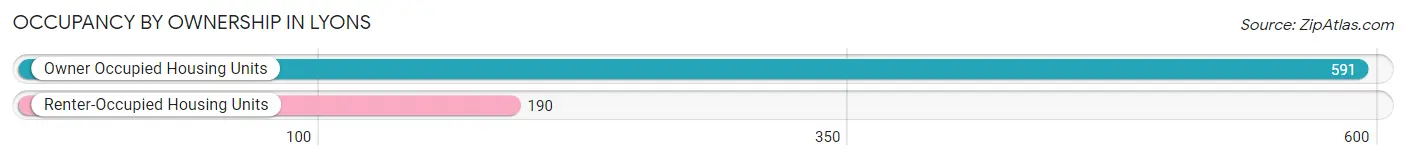
| Occupancy | # Housing Units | % Housing Units |
| Owner Occupied Housing Units | 591 | 75.7% |
| Renter-Occupied Housing Units | 190 | 24.3% |
| Total Occupied Housing Units | 781 | 100.0% |
Occupancy by Household Size in Lyons
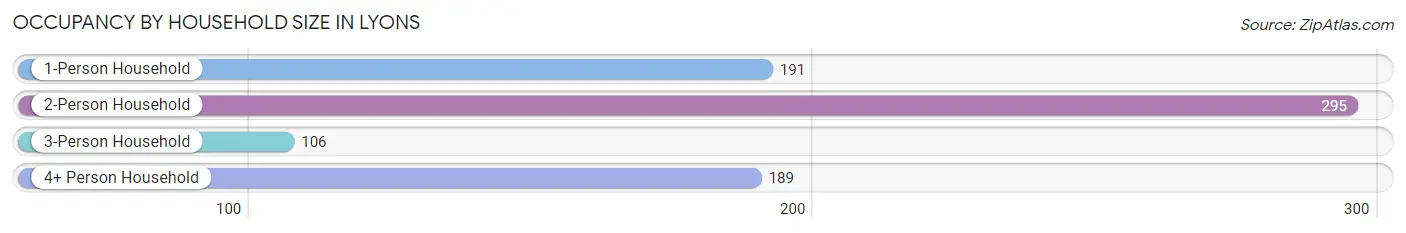
| Household Size | # Housing Units | % Housing Units |
| 1-Person Household | 191 | 24.5% |
| 2-Person Household | 295 | 37.8% |
| 3-Person Household | 106 | 13.6% |
| 4+ Person Household | 189 | 24.2% |
| Total Housing Units | 781 | 100.0% |
Occupancy by Ownership by Household Size in Lyons
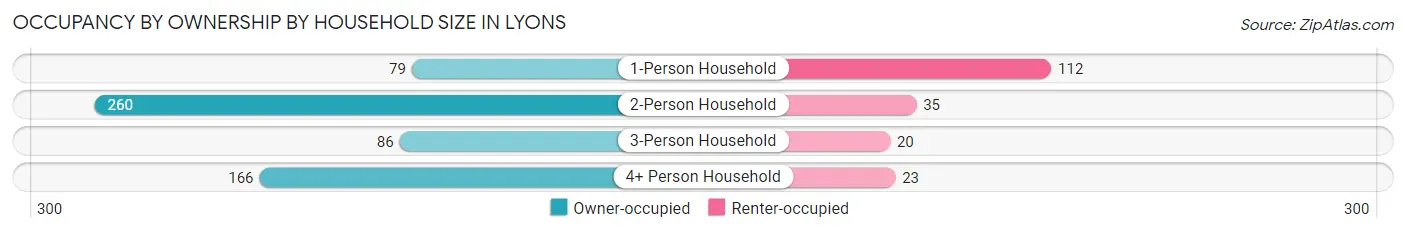
| Household Size | Owner-occupied | Renter-occupied |
| 1-Person Household | 79 (41.4%) | 112 (58.6%) |
| 2-Person Household | 260 (88.1%) | 35 (11.9%) |
| 3-Person Household | 86 (81.1%) | 20 (18.9%) |
| 4+ Person Household | 166 (87.8%) | 23 (12.2%) |
| Total Housing Units | 591 (75.7%) | 190 (24.3%) |
Occupancy by Educational Attainment in Lyons
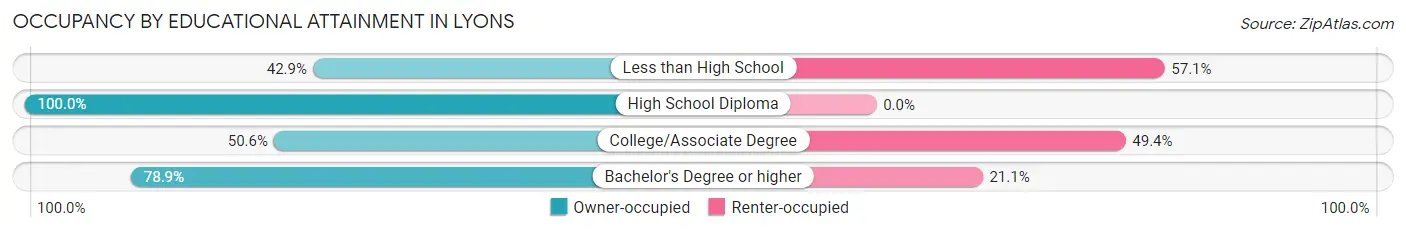
| Household Size | Owner-occupied | Renter-occupied |
| Less than High School | 9 (42.9%) | 12 (57.1%) |
| High School Diploma | 27 (100.0%) | 0 (0.0%) |
| College/Associate Degree | 42 (50.6%) | 41 (49.4%) |
| Bachelor's Degree or higher | 513 (78.9%) | 137 (21.1%) |
Occupancy by Age of Householder in Lyons
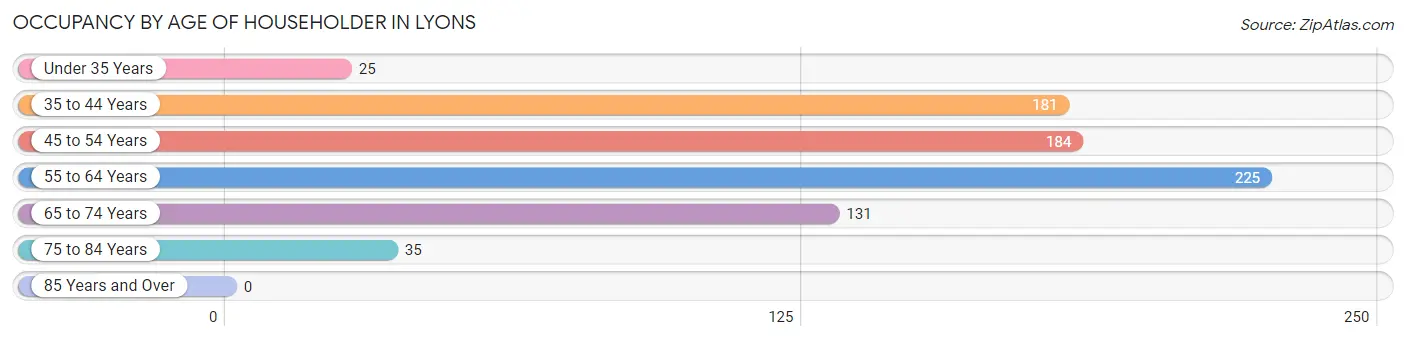
| Age Bracket | # Households | % Households |
| Under 35 Years | 25 | 3.2% |
| 35 to 44 Years | 181 | 23.2% |
| 45 to 54 Years | 184 | 23.6% |
| 55 to 64 Years | 225 | 28.8% |
| 65 to 74 Years | 131 | 16.8% |
| 75 to 84 Years | 35 | 4.5% |
| 85 Years and Over | 0 | 0.0% |
| Total | 781 | 100.0% |
Housing Finances in Lyons
Median Income by Occupancy in Lyons
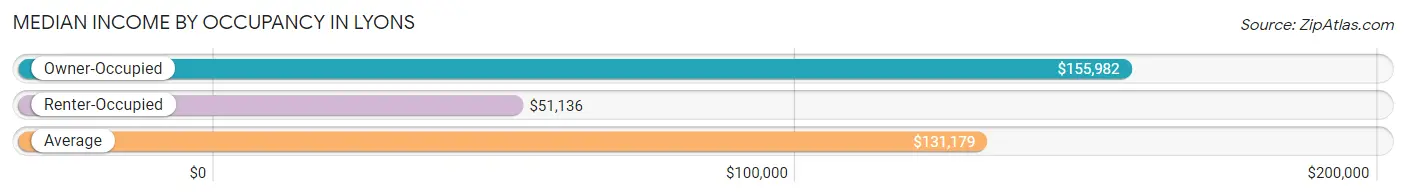
| Occupancy Type | # Households | Median Income |
| Owner-Occupied | 591 (75.7%) | $155,982 |
| Renter-Occupied | 190 (24.3%) | $51,136 |
| Average | 781 (100.0%) | $131,179 |
Occupancy by Householder Income Bracket in Lyons
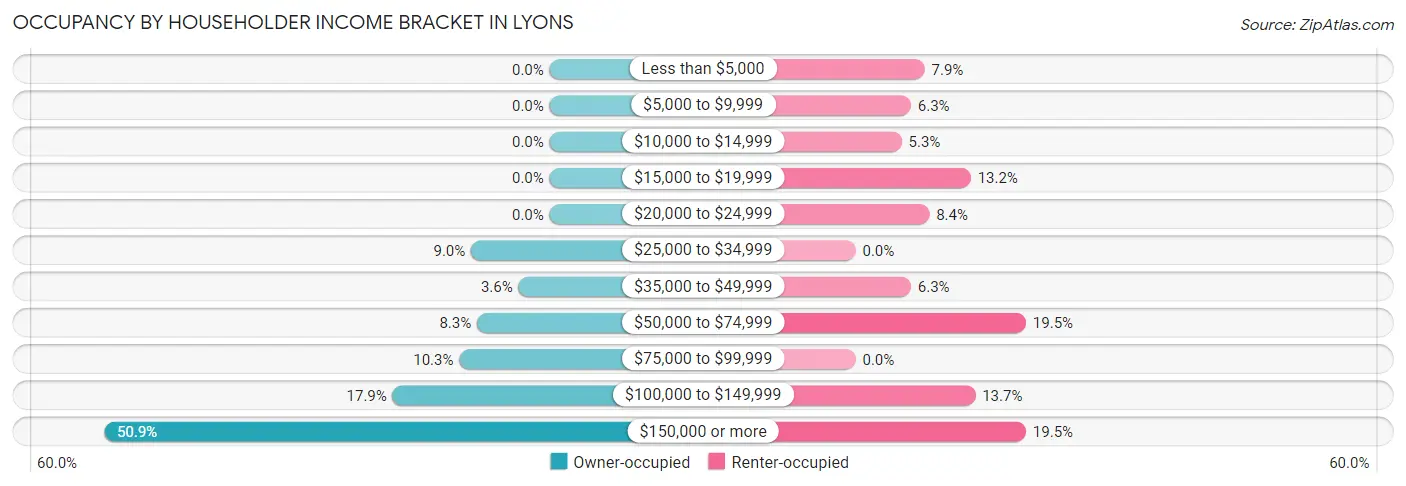
| Income Bracket | Owner-occupied | Renter-occupied |
| Less than $5,000 | 0 (0.0%) | 15 (7.9%) |
| $5,000 to $9,999 | 0 (0.0%) | 12 (6.3%) |
| $10,000 to $14,999 | 0 (0.0%) | 10 (5.3%) |
| $15,000 to $19,999 | 0 (0.0%) | 25 (13.2%) |
| $20,000 to $24,999 | 0 (0.0%) | 16 (8.4%) |
| $25,000 to $34,999 | 53 (9.0%) | 0 (0.0%) |
| $35,000 to $49,999 | 21 (3.5%) | 12 (6.3%) |
| $50,000 to $74,999 | 49 (8.3%) | 37 (19.5%) |
| $75,000 to $99,999 | 61 (10.3%) | 0 (0.0%) |
| $100,000 to $149,999 | 106 (17.9%) | 26 (13.7%) |
| $150,000 or more | 301 (50.9%) | 37 (19.5%) |
| Total | 591 (100.0%) | 190 (100.0%) |
Monthly Housing Cost Tiers in Lyons
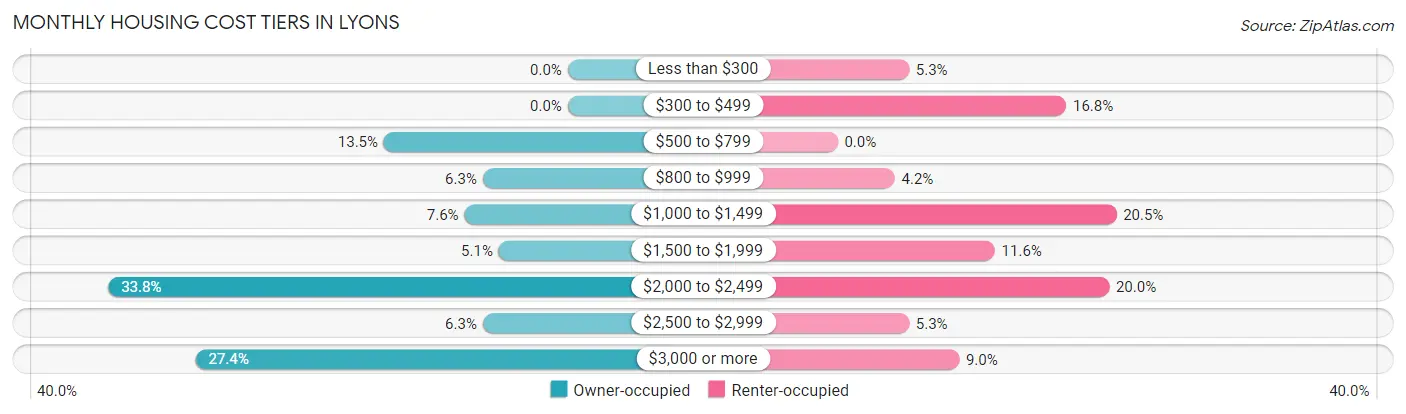
| Monthly Cost | Owner-occupied | Renter-occupied |
| Less than $300 | 0 (0.0%) | 10 (5.3%) |
| $300 to $499 | 0 (0.0%) | 32 (16.8%) |
| $500 to $799 | 80 (13.5%) | 0 (0.0%) |
| $800 to $999 | 37 (6.3%) | 8 (4.2%) |
| $1,000 to $1,499 | 45 (7.6%) | 39 (20.5%) |
| $1,500 to $1,999 | 30 (5.1%) | 22 (11.6%) |
| $2,000 to $2,499 | 200 (33.8%) | 38 (20.0%) |
| $2,500 to $2,999 | 37 (6.3%) | 10 (5.3%) |
| $3,000 or more | 162 (27.4%) | 17 (8.9%) |
| Total | 591 (100.0%) | 190 (100.0%) |
Physical Housing Characteristics in Lyons
Housing Structures in Lyons
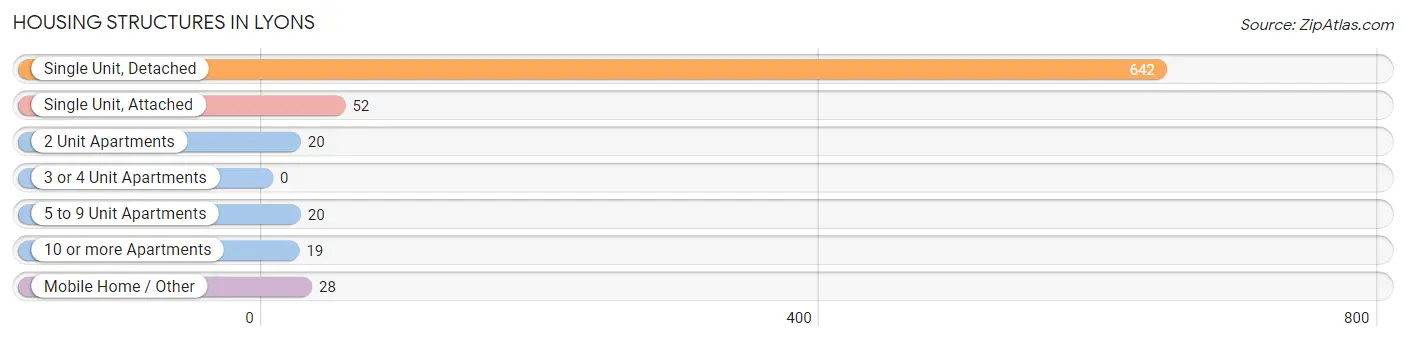
| Structure Type | # Housing Units | % Housing Units |
| Single Unit, Detached | 642 | 82.2% |
| Single Unit, Attached | 52 | 6.7% |
| 2 Unit Apartments | 20 | 2.6% |
| 3 or 4 Unit Apartments | 0 | 0.0% |
| 5 to 9 Unit Apartments | 20 | 2.6% |
| 10 or more Apartments | 19 | 2.4% |
| Mobile Home / Other | 28 | 3.6% |
| Total | 781 | 100.0% |
Housing Structures by Occupancy in Lyons
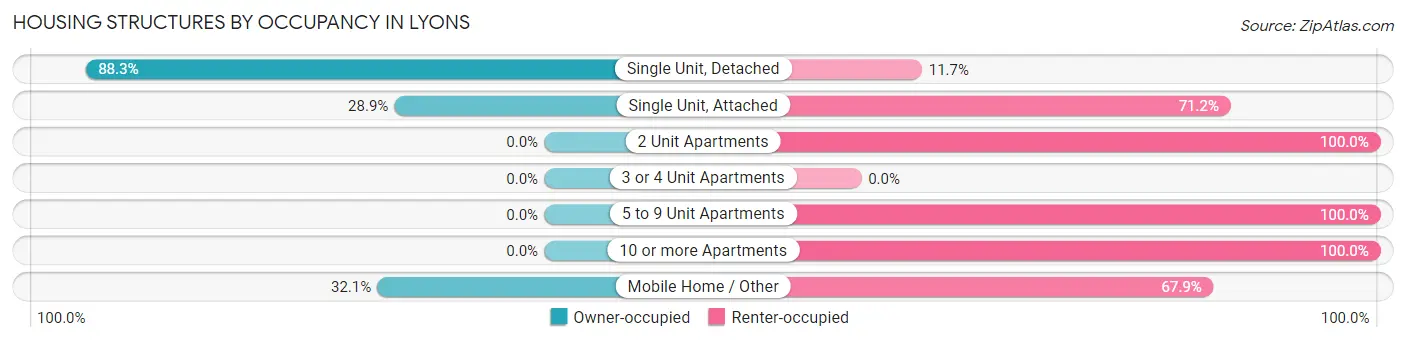
| Structure Type | Owner-occupied | Renter-occupied |
| Single Unit, Detached | 567 (88.3%) | 75 (11.7%) |
| Single Unit, Attached | 15 (28.8%) | 37 (71.2%) |
| 2 Unit Apartments | 0 (0.0%) | 20 (100.0%) |
| 3 or 4 Unit Apartments | 0 (0.0%) | 0 (0.0%) |
| 5 to 9 Unit Apartments | 0 (0.0%) | 20 (100.0%) |
| 10 or more Apartments | 0 (0.0%) | 19 (100.0%) |
| Mobile Home / Other | 9 (32.1%) | 19 (67.9%) |
| Total | 591 (75.7%) | 190 (24.3%) |
Housing Structures by Number of Rooms in Lyons
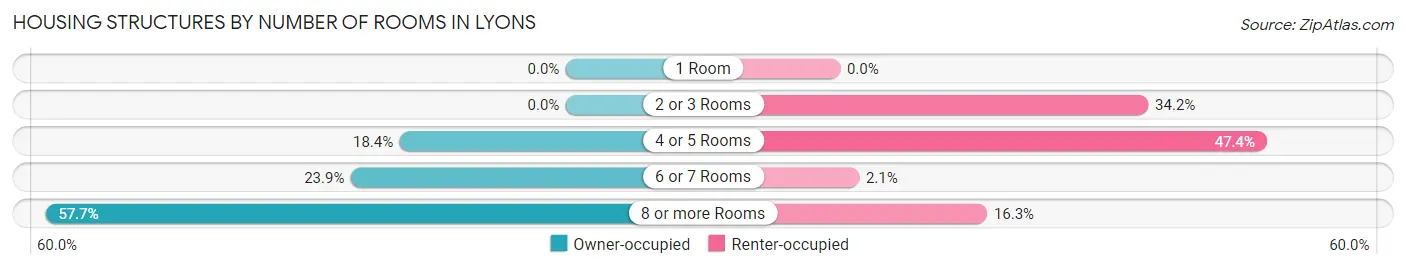
| Number of Rooms | Owner-occupied | Renter-occupied |
| 1 Room | 0 (0.0%) | 0 (0.0%) |
| 2 or 3 Rooms | 0 (0.0%) | 65 (34.2%) |
| 4 or 5 Rooms | 109 (18.4%) | 90 (47.4%) |
| 6 or 7 Rooms | 141 (23.9%) | 4 (2.1%) |
| 8 or more Rooms | 341 (57.7%) | 31 (16.3%) |
| Total | 591 (100.0%) | 190 (100.0%) |
Housing Structure by Heating Type in Lyons
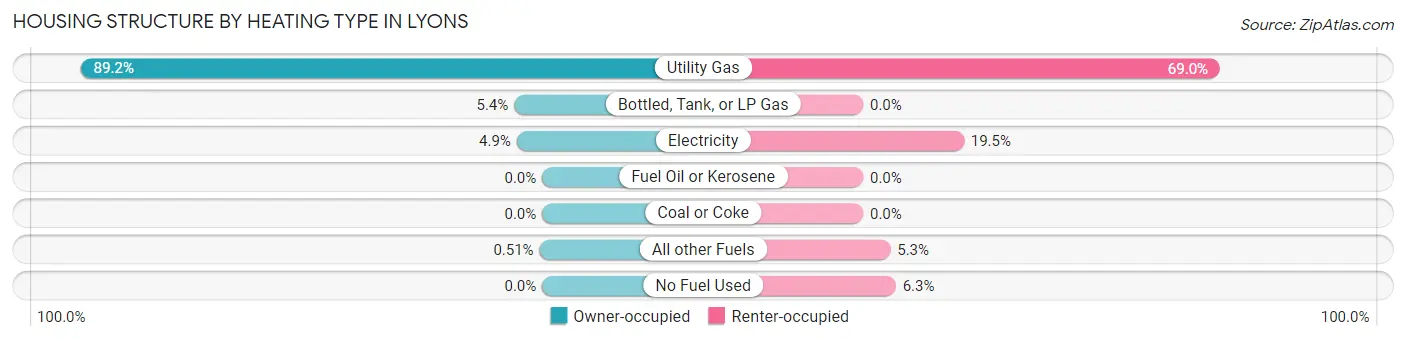
| Heating Type | Owner-occupied | Renter-occupied |
| Utility Gas | 527 (89.2%) | 131 (69.0%) |
| Bottled, Tank, or LP Gas | 32 (5.4%) | 0 (0.0%) |
| Electricity | 29 (4.9%) | 37 (19.5%) |
| Fuel Oil or Kerosene | 0 (0.0%) | 0 (0.0%) |
| Coal or Coke | 0 (0.0%) | 0 (0.0%) |
| All other Fuels | 3 (0.5%) | 10 (5.3%) |
| No Fuel Used | 0 (0.0%) | 12 (6.3%) |
| Total | 591 (100.0%) | 190 (100.0%) |
Household Vehicle Usage in Lyons
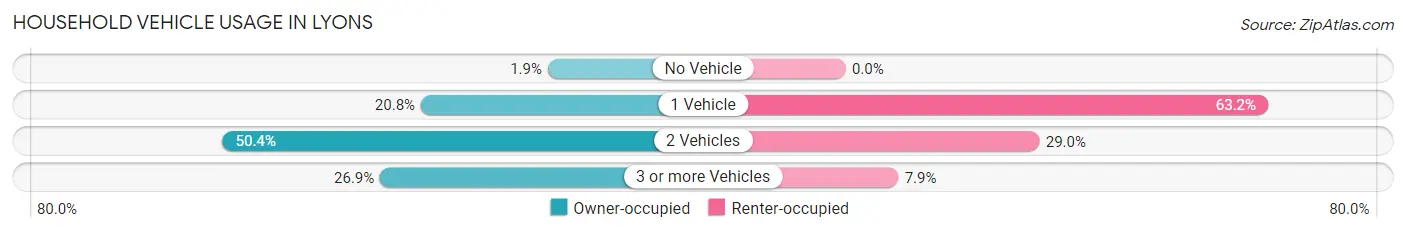
| Vehicles per Household | Owner-occupied | Renter-occupied |
| No Vehicle | 11 (1.9%) | 0 (0.0%) |
| 1 Vehicle | 123 (20.8%) | 120 (63.2%) |
| 2 Vehicles | 298 (50.4%) | 55 (28.9%) |
| 3 or more Vehicles | 159 (26.9%) | 15 (7.9%) |
| Total | 591 (100.0%) | 190 (100.0%) |
Real Estate & Mortgages in Lyons
Real Estate and Mortgage Overview in Lyons
| Characteristic | Without Mortgage | With Mortgage |
| Housing Units | 144 | 447 |
| Median Property Value | $620,700 | $844,300 |
| Median Household Income | $102,222 | $265 |
| Monthly Housing Costs | $836 | $162 |
| Real Estate Taxes | $4,333 | $0 |
Property Value by Mortgage Status in Lyons
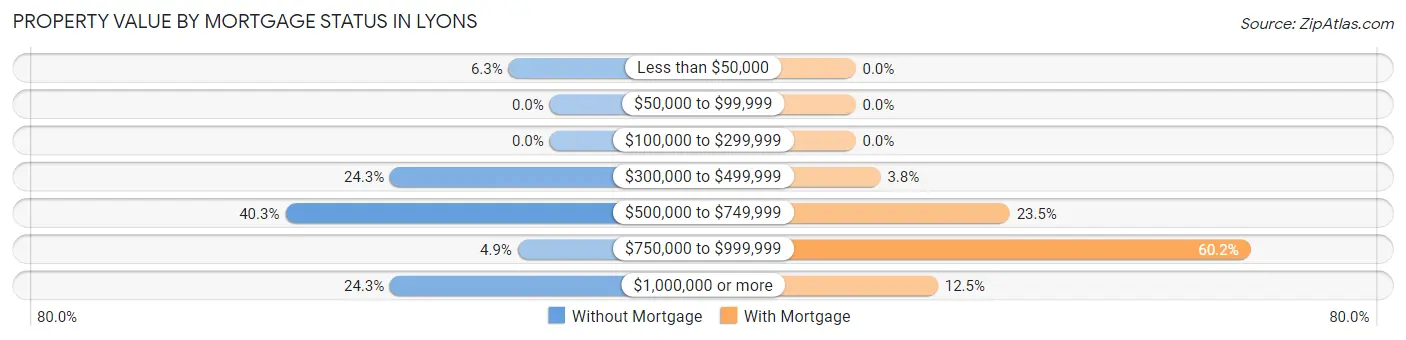
| Property Value | Without Mortgage | With Mortgage |
| Less than $50,000 | 9 (6.2%) | 0 (0.0%) |
| $50,000 to $99,999 | 0 (0.0%) | 0 (0.0%) |
| $100,000 to $299,999 | 0 (0.0%) | 0 (0.0%) |
| $300,000 to $499,999 | 35 (24.3%) | 17 (3.8%) |
| $500,000 to $749,999 | 58 (40.3%) | 105 (23.5%) |
| $750,000 to $999,999 | 7 (4.9%) | 269 (60.2%) |
| $1,000,000 or more | 35 (24.3%) | 56 (12.5%) |
| Total | 144 (100.0%) | 447 (100.0%) |
Household Income by Mortgage Status in Lyons
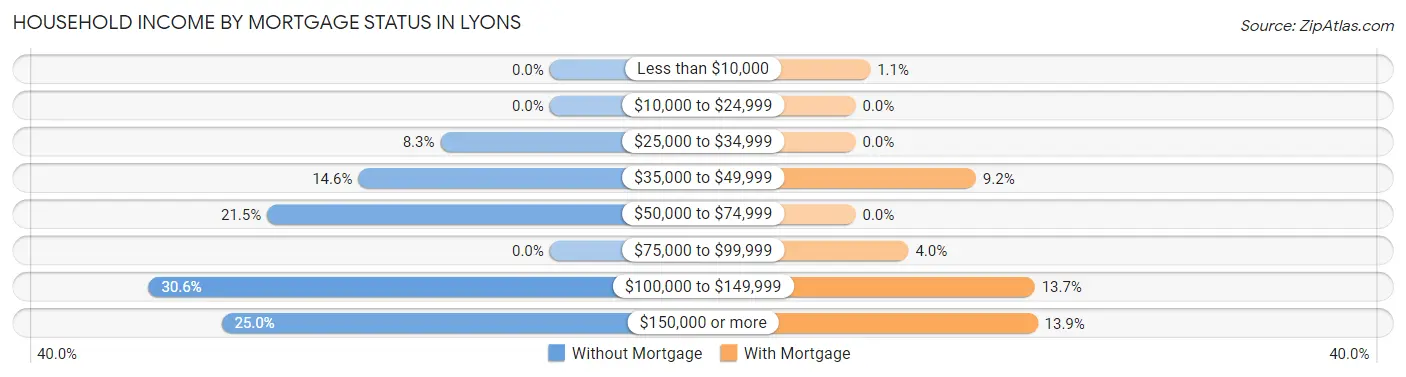
| Household Income | Without Mortgage | With Mortgage |
| Less than $10,000 | 0 (0.0%) | 5 (1.1%) |
| $10,000 to $24,999 | 0 (0.0%) | 0 (0.0%) |
| $25,000 to $34,999 | 12 (8.3%) | 0 (0.0%) |
| $35,000 to $49,999 | 21 (14.6%) | 41 (9.2%) |
| $50,000 to $74,999 | 31 (21.5%) | 0 (0.0%) |
| $75,000 to $99,999 | 0 (0.0%) | 18 (4.0%) |
| $100,000 to $149,999 | 44 (30.6%) | 61 (13.7%) |
| $150,000 or more | 36 (25.0%) | 62 (13.9%) |
| Total | 144 (100.0%) | 447 (100.0%) |
Property Value to Household Income Ratio in Lyons
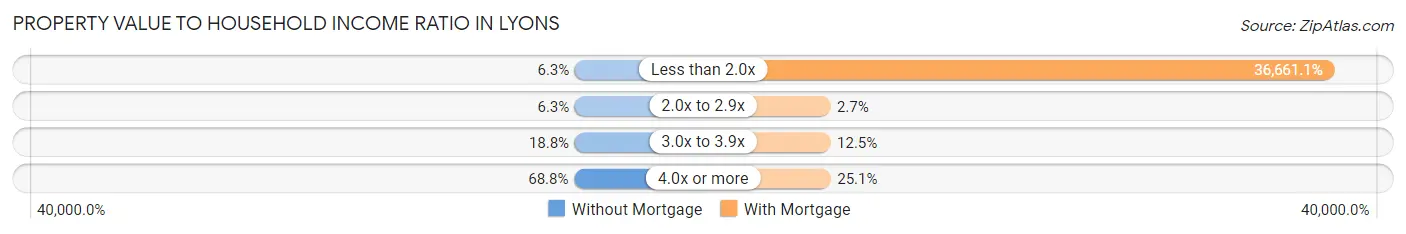
| Value-to-Income Ratio | Without Mortgage | With Mortgage |
| Less than 2.0x | 9 (6.2%) | 163,875 (36,661.1%) |
| 2.0x to 2.9x | 9 (6.2%) | 12 (2.7%) |
| 3.0x to 3.9x | 27 (18.8%) | 56 (12.5%) |
| 4.0x or more | 99 (68.8%) | 112 (25.1%) |
| Total | 144 (100.0%) | 447 (100.0%) |
Real Estate Taxes by Mortgage Status in Lyons
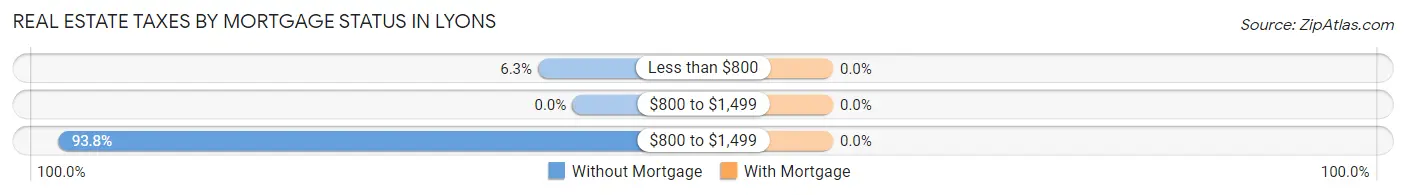
| Property Taxes | Without Mortgage | With Mortgage |
| Less than $800 | 9 (6.2%) | 0 (0.0%) |
| $800 to $1,499 | 0 (0.0%) | 0 (0.0%) |
| $800 to $1,499 | 135 (93.8%) | 0 (0.0%) |
| Total | 144 (100.0%) | 447 (100.0%) |
Health & Disability in Lyons
Health Insurance Coverage by Age in Lyons
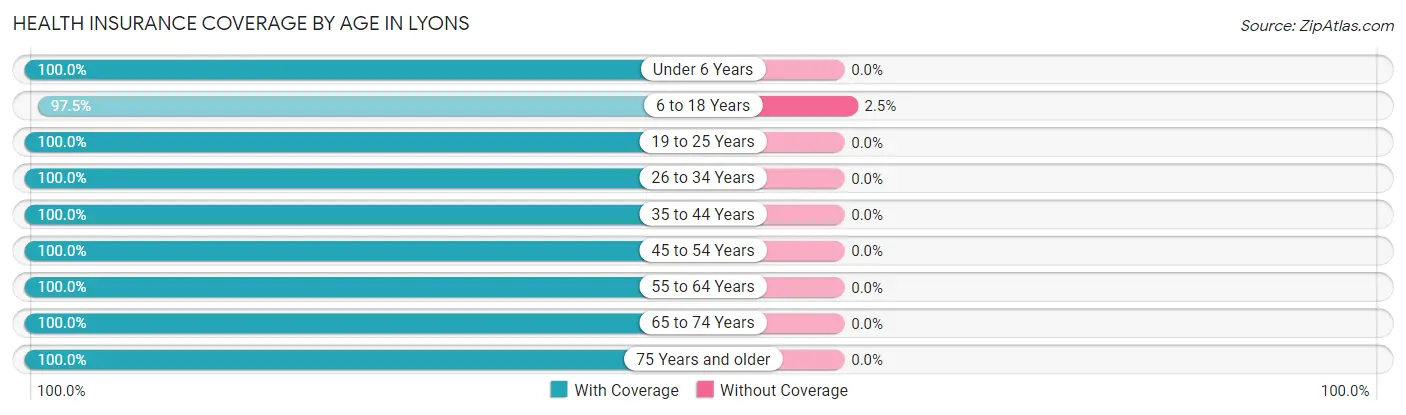
| Age Bracket | With Coverage | Without Coverage |
| Under 6 Years | 84 (100.0%) | 0 (0.0%) |
| 6 to 18 Years | 435 (97.5%) | 11 (2.5%) |
| 19 to 25 Years | 62 (100.0%) | 0 (0.0%) |
| 26 to 34 Years | 27 (100.0%) | 0 (0.0%) |
| 35 to 44 Years | 340 (100.0%) | 0 (0.0%) |
| 45 to 54 Years | 420 (100.0%) | 0 (0.0%) |
| 55 to 64 Years | 313 (100.0%) | 0 (0.0%) |
| 65 to 74 Years | 180 (100.0%) | 0 (0.0%) |
| 75 Years and older | 64 (100.0%) | 0 (0.0%) |
| Total | 1,925 (99.4%) | 11 (0.6%) |
Health Insurance Coverage by Citizenship Status in Lyons
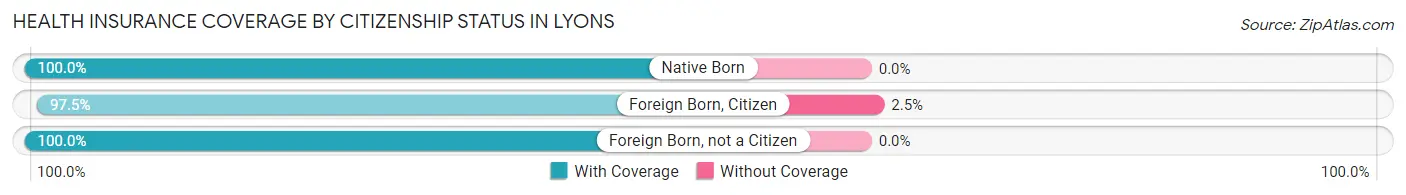
| Citizenship Status | With Coverage | Without Coverage |
| Native Born | 84 (100.0%) | 0 (0.0%) |
| Foreign Born, Citizen | 435 (97.5%) | 11 (2.5%) |
| Foreign Born, not a Citizen | 62 (100.0%) | 0 (0.0%) |
Health Insurance Coverage by Household Income in Lyons
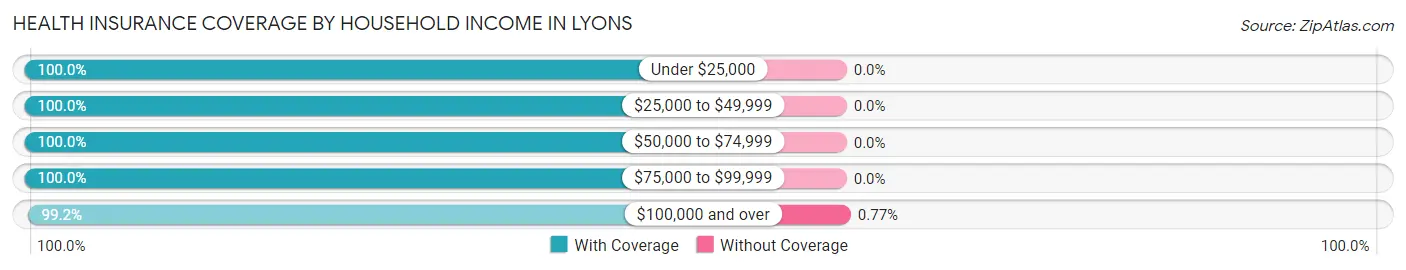
| Household Income | With Coverage | Without Coverage |
| Under $25,000 | 90 (100.0%) | 0 (0.0%) |
| $25,000 to $49,999 | 129 (100.0%) | 0 (0.0%) |
| $50,000 to $74,999 | 185 (100.0%) | 0 (0.0%) |
| $75,000 to $99,999 | 112 (100.0%) | 0 (0.0%) |
| $100,000 and over | 1,409 (99.2%) | 11 (0.8%) |
Public vs Private Health Insurance Coverage by Age in Lyons
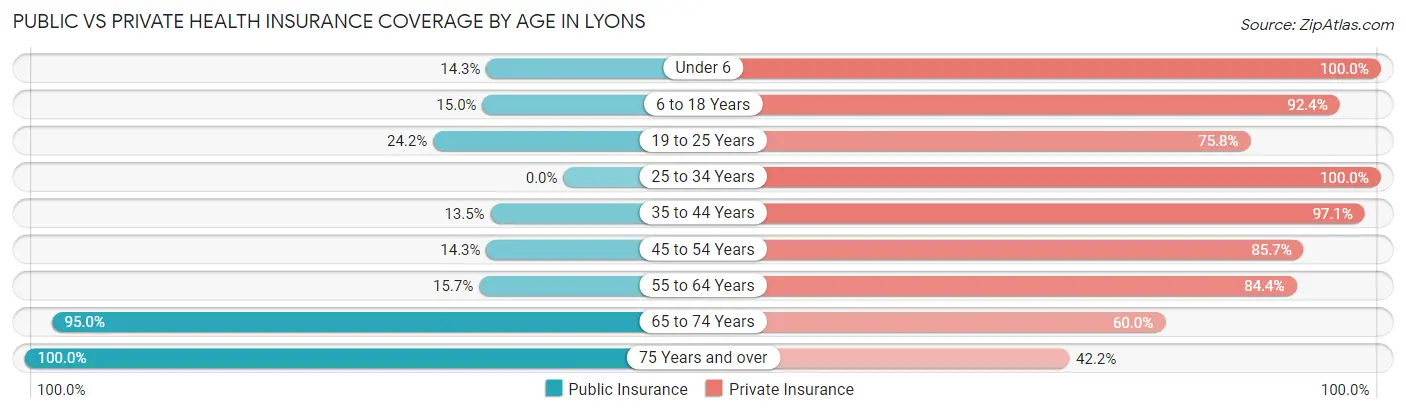
| Age Bracket | Public Insurance | Private Insurance |
| Under 6 | 12 (14.3%) | 84 (100.0%) |
| 6 to 18 Years | 67 (15.0%) | 412 (92.4%) |
| 19 to 25 Years | 15 (24.2%) | 47 (75.8%) |
| 25 to 34 Years | 0 (0.0%) | 27 (100.0%) |
| 35 to 44 Years | 46 (13.5%) | 330 (97.1%) |
| 45 to 54 Years | 60 (14.3%) | 360 (85.7%) |
| 55 to 64 Years | 49 (15.7%) | 264 (84.4%) |
| 65 to 74 Years | 171 (95.0%) | 108 (60.0%) |
| 75 Years and over | 64 (100.0%) | 27 (42.2%) |
| Total | 484 (25.0%) | 1,659 (85.7%) |
Disability Status by Sex by Age in Lyons
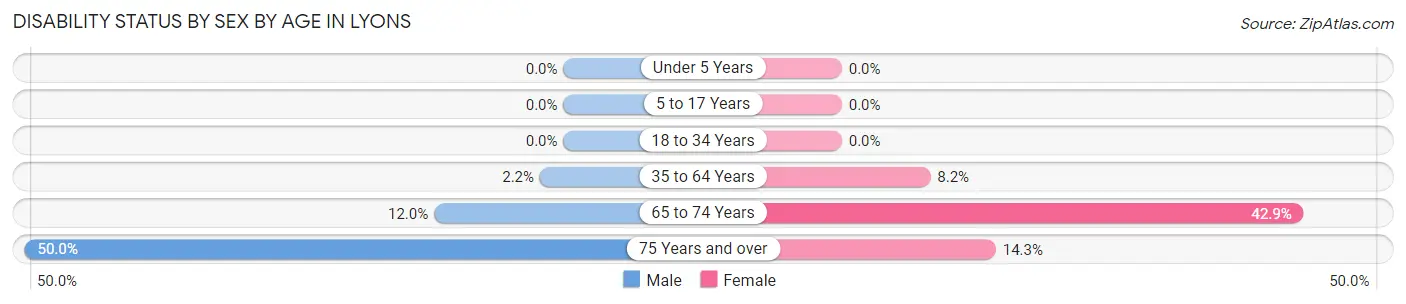
| Age Bracket | Male | Female |
| Under 5 Years | 0 (0.0%) | 0 (0.0%) |
| 5 to 17 Years | 0 (0.0%) | 0 (0.0%) |
| 18 to 34 Years | 0 (0.0%) | 0 (0.0%) |
| 35 to 64 Years | 12 (2.2%) | 43 (8.2%) |
| 65 to 74 Years | 9 (12.0%) | 45 (42.9%) |
| 75 Years and over | 4 (50.0%) | 8 (14.3%) |
Disability Class by Sex by Age in Lyons
Disability Class: Hearing Difficulty
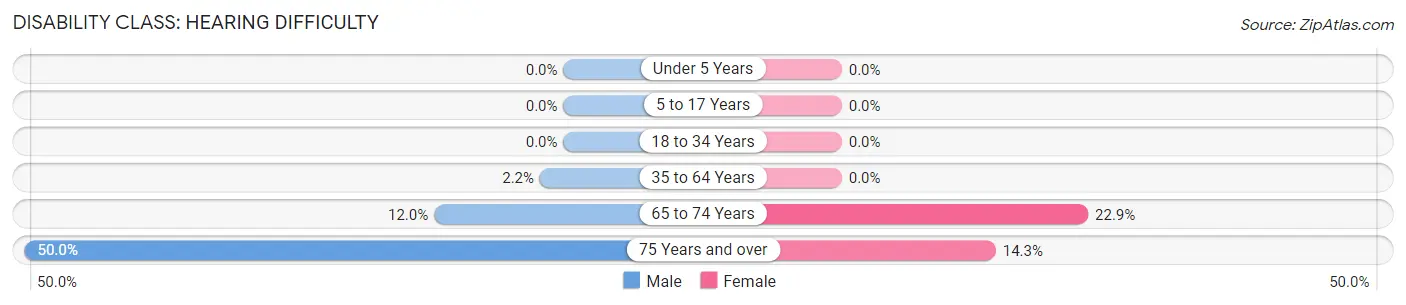
| Age Bracket | Male | Female |
| Under 5 Years | 0 (0.0%) | 0 (0.0%) |
| 5 to 17 Years | 0 (0.0%) | 0 (0.0%) |
| 18 to 34 Years | 0 (0.0%) | 0 (0.0%) |
| 35 to 64 Years | 12 (2.2%) | 0 (0.0%) |
| 65 to 74 Years | 9 (12.0%) | 24 (22.9%) |
| 75 Years and over | 4 (50.0%) | 8 (14.3%) |
Disability Class: Vision Difficulty
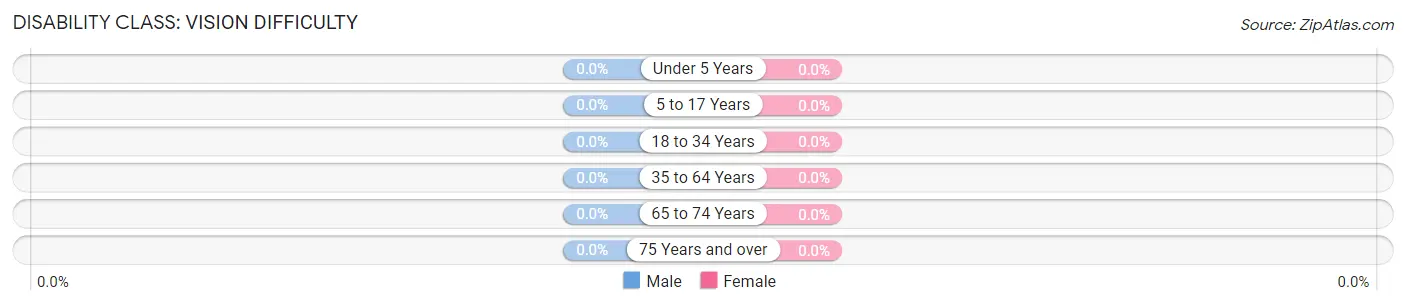
| Age Bracket | Male | Female |
| Under 5 Years | 0 (0.0%) | 0 (0.0%) |
| 5 to 17 Years | 0 (0.0%) | 0 (0.0%) |
| 18 to 34 Years | 0 (0.0%) | 0 (0.0%) |
| 35 to 64 Years | 0 (0.0%) | 0 (0.0%) |
| 65 to 74 Years | 0 (0.0%) | 0 (0.0%) |
| 75 Years and over | 0 (0.0%) | 0 (0.0%) |
Disability Class: Cognitive Difficulty
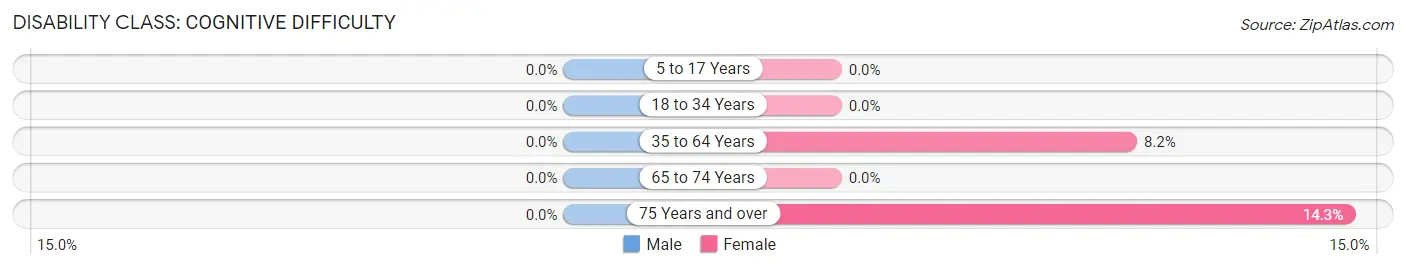
| Age Bracket | Male | Female |
| 5 to 17 Years | 0 (0.0%) | 0 (0.0%) |
| 18 to 34 Years | 0 (0.0%) | 0 (0.0%) |
| 35 to 64 Years | 0 (0.0%) | 43 (8.2%) |
| 65 to 74 Years | 0 (0.0%) | 0 (0.0%) |
| 75 Years and over | 0 (0.0%) | 8 (14.3%) |
Disability Class: Ambulatory Difficulty
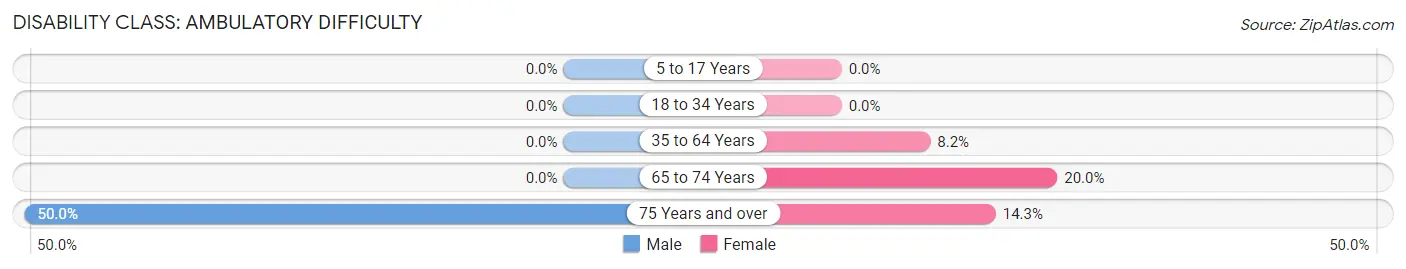
| Age Bracket | Male | Female |
| 5 to 17 Years | 0 (0.0%) | 0 (0.0%) |
| 18 to 34 Years | 0 (0.0%) | 0 (0.0%) |
| 35 to 64 Years | 0 (0.0%) | 43 (8.2%) |
| 65 to 74 Years | 0 (0.0%) | 21 (20.0%) |
| 75 Years and over | 4 (50.0%) | 8 (14.3%) |
Disability Class: Self-Care Difficulty
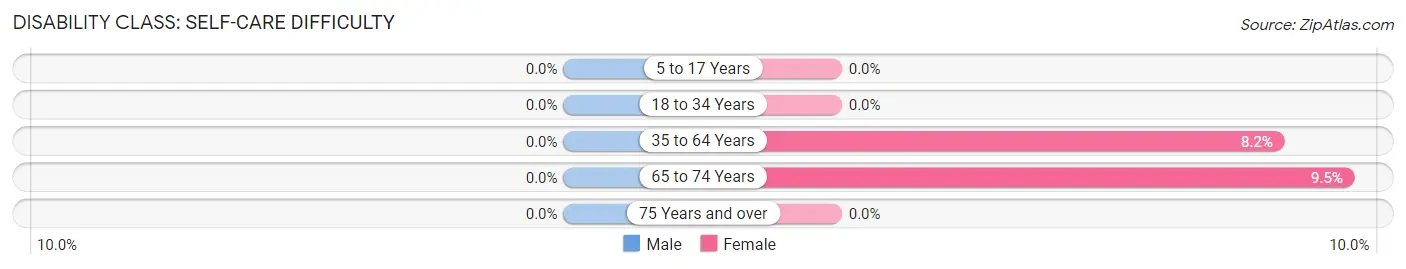
| Age Bracket | Male | Female |
| 5 to 17 Years | 0 (0.0%) | 0 (0.0%) |
| 18 to 34 Years | 0 (0.0%) | 0 (0.0%) |
| 35 to 64 Years | 0 (0.0%) | 43 (8.2%) |
| 65 to 74 Years | 0 (0.0%) | 10 (9.5%) |
| 75 Years and over | 0 (0.0%) | 0 (0.0%) |
Technology Access in Lyons
Computing Device Access in Lyons
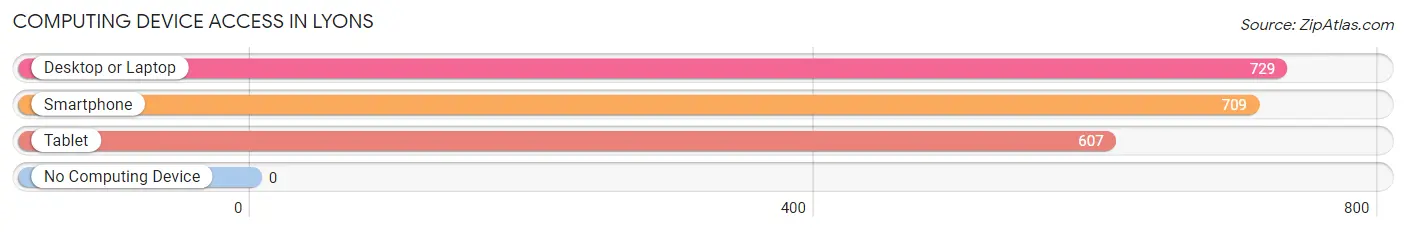
| Device Type | # Households | % Households |
| Desktop or Laptop | 729 | 93.3% |
| Smartphone | 709 | 90.8% |
| Tablet | 607 | 77.7% |
| No Computing Device | 0 | 0.0% |
| Total | 781 | 100.0% |
Internet Access in Lyons
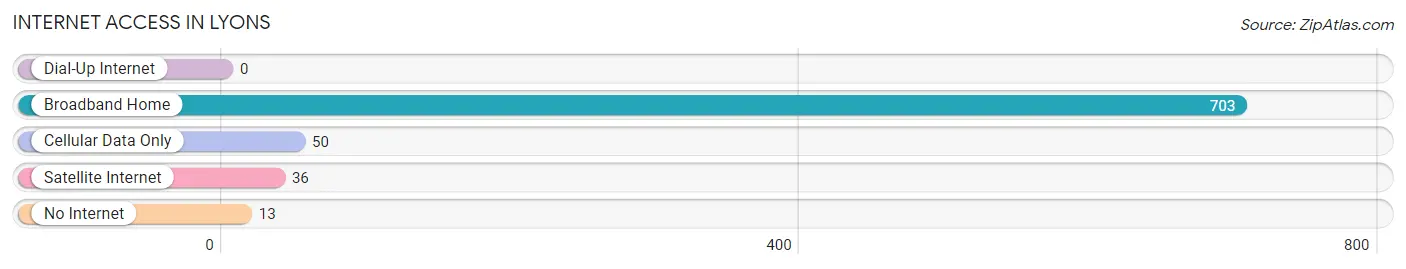
| Internet Type | # Households | % Households |
| Dial-Up Internet | 0 | 0.0% |
| Broadband Home | 703 | 90.0% |
| Cellular Data Only | 50 | 6.4% |
| Satellite Internet | 36 | 4.6% |
| No Internet | 13 | 1.7% |
| Total | 781 | 100.0% |
Lyons Summary
Lyons is a small town located in Boulder County, Colorado, United States. It is situated along the St. Vrain River, approximately 20 miles (32 km) northeast of Boulder and 40 miles (64 km) northwest of Denver. The town has a population of 2,521 as of the 2010 census.
History
The area that is now Lyons was first settled in the late 1860s by miners and ranchers. The town was officially founded in 1881 and named after Edward F. Lyons, a prominent local businessman. The town quickly grew and by the early 1900s, it had become a popular tourist destination.
In the 1920s, the town was home to a large number of coal mines, which provided employment for many of the town’s residents. The coal industry declined in the 1930s, and the town’s population began to decline as well.
In the 1960s, the town began to experience a resurgence as a result of the growth of the nearby cities of Boulder and Denver. The town’s population began to grow again, and it has continued to do so ever since.
Geography
Lyons is located in the foothills of the Rocky Mountains, at an elevation of 5,400 feet (1,646 m). The town is situated along the St. Vrain River, which flows through the town and provides a source of recreation for the town’s residents.
The town is surrounded by mountains, including Longs Peak to the north, Mount Meeker to the east, and the Indian Peaks to the south. The town is located in a semi-arid climate, with hot summers and cold winters.
Economy
The economy of Lyons is largely based on tourism and outdoor recreation. The town is home to several popular attractions, including the Rocky Mountain National Park, the St. Vrain River, and the Lyons Outdoor Games.
The town is also home to several businesses, including restaurants, retail stores, and art galleries. The town is also home to several wineries, breweries, and distilleries.
Demographics
As of the 2010 census, the population of Lyons was 2,521. The racial makeup of the town was 94.3% White, 0.7% African American, 0.7% Native American, 0.7% Asian, 0.2% Pacific Islander, 1.2% from other races, and 2.1% from two or more races. Hispanic or Latino of any race were 5.2% of the population.
The median income for a household in the town was $50,938, and the median income for a family was $60,938. The per capita income for the town was $25,938. About 8.2% of families and 10.2% of the population were below the poverty line, including 14.2% of those under age 18 and 5.2% of those age 65 or over.
Lyons is a small town with a rich history and a vibrant economy. The town is home to a variety of attractions and businesses, and its population is diverse and growing. The town is a great place to live, work, and play, and it is sure to continue to be a popular destination for years to come.
Common Questions
What is the Total Population of Lyons?
Total Population of Lyons is 1,936.
What is the Total Male Population of Lyons?
Total Male Population of Lyons is 938.
What is the Total Female Population of Lyons?
Total Female Population of Lyons is 998.
What is the Ratio of Males per 100 Females in Lyons?
There are 93.99 Males per 100 Females in Lyons.
What is the Ratio of Females per 100 Males in Lyons?
There are 106.40 Females per 100 Males in Lyons.
What is the Median Population Age in Lyons?
Median Population Age in Lyons is 45.6 Years.
What is the Average Family Size in Lyons
Average Family Size in Lyons is 3.1 People.
What is the Average Household Size in Lyons
Average Household Size in Lyons is 2.5 People.
What is Per Capita Income in Lyons?
Per Capita income in Lyons is $58,992.
What is the Median Family Income in Lyons?
Median Family Income in Lyons is $164,625.
What is the Median Household income in Lyons?
Median Household Income in Lyons is $131,179.
What is Income or Wage Gap in Lyons?
Income or Wage Gap in Lyons is 24.4%.
Women in Lyons earn 75.6 cents for every dollar earned by a man.
What is Inequality or Gini Index in Lyons?
Inequality or Gini Index in Lyons is 0.40.
How Large is the Labor Force in Lyons?
There are 947 People in the Labor Forcein in Lyons.
What is the Percentage of People in the Labor Force in Lyons?
64.1% of People are in the Labor Force in Lyons.
What is the Unemployment Rate in Lyons?
Unemployment Rate in Lyons is 3.4%.